the potential of passive stream restoration to improve stream habitat and minimize the impact of...
TRANSCRIPT
BioOne sees sustainable scholarly publishing as an inherently collaborative enterprise connecting authors, nonprofit publishers, academic institutions, researchlibraries, and research funders in the common goal of maximizing access to critical research.
The potential of passive stream restoration to improve stream habitat andminimize the impact of fish disease: a short-term assessmentAuthor(s): Eriek S. Hansen and Phaedra BudySource: Journal of the North American Benthological Society, 30(2):573-588. 2011.Published By: The Society for Freshwater ScienceDOI: http://dx.doi.org/10.1899/10-018.1URL: http://www.bioone.org/doi/full/10.1899/10-018.1
BioOne (www.bioone.org) is a nonprofit, online aggregation of core research in the biological, ecological, andenvironmental sciences. BioOne provides a sustainable online platform for over 170 journals and books publishedby nonprofit societies, associations, museums, institutions, and presses.
Your use of this PDF, the BioOne Web site, and all posted and associated content indicates your acceptance ofBioOne’s Terms of Use, available at www.bioone.org/page/terms_of_use.
Usage of BioOne content is strictly limited to personal, educational, and non-commercial use. Commercial inquiriesor rights and permissions requests should be directed to the individual publisher as copyright holder.

The potential of passive stream restoration to improve streamhabitat and minimize the impact of fish disease:
a short-term assessment
Eriek S. Hansen1AND Phaedra Budy2
Department of Watershed Sciences, Utah State University, 5210 Old Main Hill, Logan, Utah, 84322-5210USA and Intermountain Center for River Rehabilitation and Restoration, US Geological Survey, Utah
Cooperative Fish and Wildlife Research Unit, 5210 Old Main Hill, Utah State University, Logan,Utah 84322-5210 USA
Abstract. We evaluated the potential of habitat restoration to improve stream and riparian habitat and tominimize the prevalence of whirling disease in a population of native cutthroat trout in northern Utah. Wefenced 67 ha of riparian habitat to exclude livestock and measured key response variables at impact andcontrol sites before and after the completion of the exclosure. Total N concentrations decreased in responseto the exclusion. Over this short time period (1–2 y postrestoration), the combination of natural variabilityand exclusion of livestock grazing appeared to alter the vegetation and riparian conditions throughincreased bank stability and decreased % cover of exotic plant species. The effect of the exclosure onwhirling disease was confounded by climatic variation. However, restoration appeared to reduce theprevalence of whirling disease during a nondrought year, but not during a drought year. Therefore, in theshort term, these beneficial effects of restoration on trout appeared to hinge on favorable climaticconditions. We expect the longer-term restoration response to be affected less than the short-term responseby climatic conditions. The results of our study indicate that passive stream restoration is an effectivemanagement approach for restoring stream habitat and has the potential to minimize interactive effects ofdisease and habitat degradation, especially when other options for disease management are not possible orpractical.
Key words: stream restoration, passive, in-stream habitat, synergistic effects, disease management,livestock exclusion, riparian vegetation, native fishes.
Aquatic ecosystems are increasingly threatened bychanges in land use and associated habitat degrada-tion. Interest in their restoration has grown consider-ably in the recent past, in part because of importantecological functions and services aquatic ecosystemsprovide (NRC 1992, Vitousek et al. 1997, Wilcove et al.1998). Many streams retain the potential to improverapidly from a degraded condition after restorationactivities because aquatic and riparian habitats arenaturally dynamic and frequently experience large-scale natural disturbances (e.g., floods; Kauffman etal. 1995, Moerke et al. 2004). Stream restoration oftenincorporates the goal of improving ecosystem func-
tion. In many cases, passive restoration (i.e., removalof the source of degradation to allow naturalprocesses to restore the system; Kauffman et al.1997) may be preferred over active techniques andmay be all that is necessary to restore stream function(Kauffman et al. 1997, Roper et al. 1997, Tullos et al.2009).
In ecosystems where natural function is impaired,the combination of habitat degradation and thespread and effect of pathogens has potentiallyunpredictable or synergistic consequences becausethe effects of habitat alteration can influence hosts,pathogens, or both (Barbour and Fish 1993, Wilson2000, Vilchis et al. 2005). This potential interactionbetween habitat degradation and disease could affectthe abundance, composition, and persistence of nativespecies, such as trout (Daszak et al. 2000, Deem et al.2001, Patz et al. 2004). For example, evidence isincreasing that effects of habitat alteration influence
1 Present address: Department of Zoology and Physiology,University of Wyoming, 1000 East University Ave., Laramie,Wyoming 82071 USA. E-mail: [email protected]
2 To whom correspondence should be addressed. E-mail:[email protected]
J. N. Am. Benthol. Soc., 2011, 30(2):573–588’ 2011 by The North American Benthological SocietyDOI: 10.1899/10-018.1Published online: 5 April 2011
573

the Tubifex tubifex host of Myxobolus cerebralis, theparasite that causes whirling disease in salmonids(Zendt and Bergersen 2000). This interaction hasobvious and significant implications for streamrestoration and disease management.
The effects of M. cerebralis are variable acrossdifferent environments, in part, because of its com-plex life cycle, which includes multiples stages andhosts, each of which is influenced differentially bystream habitat characteristics (Hiner and Moffitt 2002,de la Hoz Franco and Budy 2004, Kaeser et al. 2006).Nevertheless, habitat conditions favorable for prolif-eration of M. cerebralis, T. tubifex, and infectionprevalence and severity in fish generally include highwater temperatures (Reynoldson 1987, Hiner andMoffitt 2002, de la Hoz Franco and Budy 2004),nutrient concentrations (Lestochova 1994), conductiv-ity (Sandell et al. 2001), and sedimentation rates(McMurtry et al. 1983, Lazim and Learner 1987,Krueger et al. 2006). These factors are broadlyassociated with stream degradation by land usesincluding livestock grazing (Fig. 1). This associationsuggests that M. cerebralis production and T. tubifexproliferation and infection are likely to be greater instream habitats degraded by livestock grazing orother land uses (Hansen 2007, but see Granath et al.2007) than in intact streams.
Livestock grazing is a common land use in thewestern USA that can alter stream ecosystems directlyand indirectly through interrelated effects on vegeta-tion, nutrient processing, soil, water, and streammorphology (Platts 1981, del Rosario et al. 2002,Sweeney et al. 2004). Livestock congregate around
water, so the direct effects of livestock grazing onstream ecosystems include nutrient inputs (e.g., viamanure), consumption and trampling of vegetation,soil compaction, and collapse or shear of stream banks(Fleischner 1994, Belsky et al. 1999, del Rosario et al.2002). Consequently, this land use has the potential toincrease upland erosion, stream power, channelerosion, entrenchment or width-to-depth ratios, tur-bidity, and nutrient concentrations and to decreasestream shading, sinuosity, and water-table levels(Knapp and Matthews 1996, Owens et al. 1996, Belskyet al. 1999). Livestock exclusion often is used toinitiate passive restoration of aquatic and riparianhabitats (Bernhardt et al. 2005). Exploration of thepotential of passive restoration to improve ecosystemhealth and minimize the effect of disease is a frontierin ecology (NRC 2001) and management of whirlingdisease.
Native trout populations in the Intermountain West(USA) have been negatively affected by land uses thatinclude livestock grazing. Bonneville cutthroat trout(Oncorhynchus clarkii utah), an endemic and protectedsubspecies of cutthroat trout have been reduced toonly a portion of their historic ranges because ofcombinations of habitat degradation, invasions andintroductions of exotic species, and spread of disease(Behnke 1992). One of the largest remaining meta-populations of genetically pure Bonneville cutthroattrout is in the Logan River, northern Utah (Lentsch etal. 1997, Budy et al. 2007), where M. cerebralis wasdetected in 1999. Myxobolus cerebralis prevalence is: 1)positively associated with temperature, 2) greater inwild fish than sentinel fish (i.e., noninfected fishexposed on-site), and 3) greater in the mainstem of theLogan River than in its tributaries (de la Hoz Francoand Budy 2004). These patterns suggest that thetributaries may serve as a refuge from infection forfish and that changes in stream temperature mayinfluence the prevalence and negative effects of theparasite.
We worked within the context of fish conservationand the science of river restoration to investigate theefficacy of passive stream restoration via livestockexclusion alone to: 1) restore stream and riparianhabitat to a more natural condition (Moerke et al.2004) and 2) reduce the prevalence of whirling diseasein an important population of native Bonnevillecutthroat trout. We excluded cattle to initiate passivestream restoration of Spawn Creek, an importantspawning and rearing tributary for cutthroat trout inthe Logan River (Bernard and Israelsen 1982). SpawnCreek has a long history of livestock grazing. Wehypothesized that passive restoration would reducenutrient inputs and sedimentation over the short term
FIG. 1. Conceptual diagram of the potential relationshipsamong the effects of cattle grazing on the environment andthe stages and hosts of the Myxobolus cerebralis parasite.TAM = triactinomyxon.
574 E. S. HANSEN AND P. BUDY [Volume 30

and decrease stream temperatures over the long termbecause of increased riparian shading (Table 1). Wealso hypothesized that these stream- and riparian-habitat changes would result in a decrease in theprevalence of M. cerebralis in native cutthroat trout(Fig. 1). We evaluated the short-term responses ofbiota, habitat, and fish disease in Spawn Creek topassive restoration techniques and measured keyresponse variables before and after exclosure atimpact and control sites.
Methods
Study area and approach
We studied Spawn Creek, a 2nd-order headwatertributary in the Logan River watershed in northernUtah, USA (more detailed study area information is
available in de la Hoz Franco and Budy 2005 andBudy et al. 2007). Grazing occurred primarily in thelower sections where the gradient is moderate (,5%
for the grazed section) and the vegetation is primarilyherbaceous with some willows (Salix spp.) present.We used a Before-After Control-Impact (BACI) designand collected repeated samples over time at oneimpact site (Spawn Creek) and multiple control sites(Temple Fork and part of the mainstem Logan River)to detect change. We selected multiple control sites tohelp distinguish between variability in responsescaused by natural variability and that caused byexclusion of livestock grazing. The watershed area ofthe impact site was smaller than that of the controlsites, and the impact site had a less variablehydrograph because of groundwater inputs (Hansen2007).
TABLE 1. The hypothesized (expected) and observed direction of change and probable processes driving short- (,5 y) andlong-term (.5 y) physical, in-stream, and riparian-habitat responses to passive restoration (livestock exclusion) at the SpawnCreek site. Response categories were: I = restoration effect, II = natural variation, III = combination of exclosure and naturalvariation, IV = indirect (alternative 1 = change in another variable, alternative 2 = opposing responses at control sites), and V =
no response (see text for additional explanation). Directions of change were: decrease (Q), increase (q), and no change (=).* indicates variable-specific response.
Variable
Short-term
Long-termexpected ProcessExpected Observed
Responsecategory
Physical response
Nutrients Q Q=* I, V* Q Decreased fecal inputs and surfacerunoff
Chlorophyll a q = V Q Decreased turbidity; decreased solarirradiation
Turbidity Q Q I Q Decreased sediment inputsConductivity Q Q I Q Decreased nutrients and surface runoffTemperature = Q II Q Increased stream shading; decreased
solar irradiationDischarge = = V Q Increased hyporheic capacity and
exchange; decreased surface runoffSubstrate size q = V q Decreased sediment inputsPool tail fines = = V Q Decreased sedimentationStable banks q q II q Increased vegetative cover
Riparian habitat
Exotic species cover Q QQ II, IIa Q Native species response to decreasedherbivory and trampling
Woody cover q = V q Decreased herbivory and vegetationtrampling
Effective ground cover q Q II q Decreased herbivory and trampling
Disease
Disease prevalence(wild and sentinelcutthroat trout)
=, = QQ IV (1), IV (1, 2) QQ Decreased triactinomyxonproduction and decreased diseaseprevalence in response todecreased temperatures, nutrientconcentrations, and fine sediments
a First response listed is from greenline measurements and 2nd response is from cross-section measurements
2011] PASSIVE STREAM RESTORATION AND FISH DISEASE 575

We excluded cattle from the impact site by fencingmost of the Spawn Creek riparian area. We construct-ed a fence along ridges parallel to each side of thestream (0.25 km mean width) for 3 km to form a 67-haexclosure (Fig. 2). Steep topography at the upper endof the stream and the U-shaped exclosure design alsoexcluded livestock grazing from the upper 2 km of thestream. Thus, we effectively eliminated grazing along
the entire stream with the exception of the bottom200 m near the confluence with Temple Fork.
We established 3 primary index reaches (each 200 mlong; upper, middle, lower) within the impact site tocapture the longitudinal heterogeneity of the streamin the area frequented by livestock (Fig. 2). Wedesignated the middle index reach as an intensivesampling reach in which we monitored a full suite of
FIG. 2. Map of the Spawn Creek impact site showing primary (PR) and secondary (SR) index reaches and exclosure fencing inreference to the stream. Inset shows locations of impact and control sites.
576 E. S. HANSEN AND P. BUDY [Volume 30

abiotic and biotic response variables. We measuredonly a subset of response variables (see Table 2) at theupper and lower index reaches for logistical (cost andeffort) reasons. We monitored riparian habitat vari-ables (physical and vegetation) at 3 secondary indexreaches (each 160 m) during the before and afterperiods (Table 2).
We selected control sites based on similarity ofhabitat characteristics and fish assemblages with theimpact site and on the availability of pre-existing datafrom a companion long-term study (Budy et al. 2007).Control sites were unfenced and experienced varyingeffects of grazing. These effects were lower thaneffects at the impact site before fencing. Two controlsites were 100-m reaches in which we monitored fishand water quality, but not riparian habitat. TempleFork (control site 1) was sampled at its confluencewith the Logan River. Franklin Basin (control site 2)was part of the mainstem Logan River near theheadwaters. We monitored only in-stream and ripar-ian habitat at 2 additional control sites (each 160 m).Control site 3 was on Spawn Creek below theexclosure at its confluence with Temple Fork. Controlsite 4 was on Temple Fork upstream of its confluencewith Spawn Creek and ,2 km upstream of controlsite 1.
Monitoring
We initiated pilot monitoring in 2004, conductedfull before monitoring in 2005 (the final year ofgrazing), and conducted after monitoring in 2006 (the1st year of exclusion). We sampled fish again in 2007for a 2nd after year. The Spawn Creek subwatershed isgrazed on a rotational system, and grazing occursprimarily in July. The duration of grazing at theimpact site was 3 to 4 wk. The time required to move
the livestock on and off the grazing allotment was 2 to3 d before and after the grazing period. We collectedsamples during 3 matching periods (early, late, andpostgrazing) before and after restoration at the impactsite and during the postgrazing period at the controlsites. The early grazing period included the first fewdays of grazing, the late grazing period was the finalweek of grazing, and the postgrazing period was,1 mo after grazing ceased. These periods refer to theperiod during which grazing occurred at the impactsite and do not necessarily correspond to grazingactivities at the control sites.
Response categories
We monitored a set of abiotic and biotic variablesthat were likely to respond to restoration andpotentially were related to the prevalence and effectof M. cerebralis. Observed responses at the site of arestoration project may be attributed to multipleprocesses, so we established 5 categories of responsetypes to help determine the underlying process. Weused potential changes from before to after and fromimpact to control to categorize responses as:
I. Restoration effect.—Change occurred in the hy-pothesized direction at the impact site, but did notoccur at the control sites.
II. Natural variation.—The pattern of change (i.e.,direction and magnitude) in the response variable atthe impact site was similar to the pattern at the controlsites.
III. Combination of restoration and natural variation.—The direction of change at the impact site was thesame as at the control sites, but the magnitude ofchange was greater at the impact site.
IV. Indirect response.—1) The source process was achange in another variable and the observed response
TABLE 2. Sampling schedule for response variables measured at the impact and control sites during the before (2004, 2005) andafter (2006, 2007) years. Sampling was scheduled during 3 grazing periods (early, late, and postgrazing) relative to the grazingrotation at the impact site. Water temperature measurements were made year-round with continuously recording temperatureloggers. U = upper, M = middle, L = lower primary index reaches, C = control sites (C1, C2, C3, C4).
Response variable Year Early grazing Late grazing Postgrazing
Water temperature, turbidity, nutrients,discharge, substrate, chlorophyll a
Before 2005 U M L M C1 C2 U M LAfter 2006 U M L C1 C2 M C1 C2 U M L C1 C2After 2007 U M L C1 C2 M C1 C2 U M L C1 C2
Stream riparian habitat Before 2004 – – U M La C3 C4b
After 2006 – – U M La C3 C4b
Disease prevalence (wild fish) Before 2001–2005 – M C1 C2 –After 2006–2007 – M C1 C2 –
Disease prevalence (sentinel fish) Before 2005 M C1 C2 –After 2006 M C1 C2 –
a In-stream and riparian-habitat characteristics also were sampled at secondary sampling reaches at the impact siteb Before sampling of riparian and stream habitat occurred in 2004
2011] PASSIVE STREAM RESTORATION AND FISH DISEASE 577

was a consequence of that change (e.g., decreasedsedimentation during naturally low, drought dis-charge), or 2) responses at the control sites occurredin opposing directions (e.g., an increase in a responsevariable at one control site and a decrease in theresponse variable at the other control site).
V. No response.—No change was detected in theresponse variable.
Physical and chemical response variables
At each primary index reach and control site (seeTable 2 for timing), we collected grab samples ofstream water for nutrient analyses. We used standardtechniques (APHA 1989) to analyze water samples forconcentrations of total Kjeldahl N (TKN), NH3, NO3 +NO2, total P (TP), soluble reactive P (SRP), anddissolved P (DP). We used chlorophyll a in periphy-ton on rocks as an index of algal abundance (APHA1989). We extracted and measured chlorophyll aconcentration (mg/cm2) with the Welschmeyer fluo-rometric method (Welschmeyer 1994). We measuredturbidity and specific conductance with handheldinstruments (LaMotte 2020; LaMotte, Chestertown,Maryland; YSI 556; Yellow Springs Instruments,Yellow Springs, Ohio).
We collected temperature readings recorded hourlywith temperature loggers (HOBO Pendant logger;Onset Corporation, Bourne, Massachusetts). Weplaced 5 loggers at the impact site, and 1 each atcontrol sites 1 and 2. We used 2 additional measuresof temperature as test variables. We used the 1st
method to account for the development of triactino-myxons (TAMs; M. cerebralis stage) after the initiationof passive restoration. TAMs require 1300+ degreedays to develop within the T. tubifex host (Kerans andZale 2002). Therefore, we calculated degree days asthe sum of the daily average temperature across the 5Spawn Creek temperature loggers during 2 timeperiods. The 1st period was 1 September 2005(postgrazing) to 30 March 2006 when maximumtemperatures began to exceed 10uC, and the 2nd was1 September 2005 to 31 May 2006, which was the timebetween peak surface-water runoff and peak ground-water discharge. We used a 2nd method to account foroptimum temperatures for the T. tubifex host andTAM production after the initiation of passiverestoration. This association is relevant becauseseverity of infection is related to the level of TAMexposure (Hedrick et al. 1999). Therefore, we used thenumber of days per year with temperatures withinthe range considered optimal for T. tubifex (10–13uC;Reynoldson 1987) and TAM production (10–15uC; El-Matbouli et al. 1999).
Stream and riparian habitat
We measured discharge (m3/s) by the mid-sectionmethod (Harrelson et al. 1994). We characterizedsubstrate composition from pebble counts from §100particles per reach and sampling event (Table 2). Wecollected particles along a series of equidistant transectsplaced perpendicular to flow, measured all particleswith a gravelometer (measurement template), anddetermined particle size .16% of the sampled particles(D16; equal to 1 standard deviation from the median;Bunte and Abt 2001). The US Forest Service (USFS), Fishand Aquatic Ecology Unit, Logan, Utah, monitored in-stream and riparian-habitat characteristics with aprotocol developed to evaluate land managementpractices and the effects of maintaining or restoringaquatic and riparian habitats (PACFISH/INFISH Bio-logical Opinion Effectiveness Monitoring Program[PIBO]; Kershner et al. 2004; protocols available from:www.fs.fed.us/biology/ fishecology/new.html#pibo_reports). USFS personnel conducted PIBO effectivenessmonitoring at the impact primary and secondary indexreaches and control site 4 (see Table 2 for timing). Theyalso measured pool tail fines (% substrate fines ,2 and,6 mm at the downstream end of pool), bank stability,exotic species cover (greenline [first perennial vegeta-tion near stream edge] and cross-section measure-ments), woody cover (greenline measurement), andeffective ground cover (cross-section measurement; livevegetation, litter, rock).
Whirling disease
We used backpack electrofishing at the impact middleindex reach and at control sites 1 and 2 to sample troutto assess the prevalence of whirling disease before(2001–2005) and after (2006–2007) restoration. We alsoexposed sentinel fish in situ to determine the prevalenceof M. cerebralis (i.e., % fish testing positive for M.cerebralis) at the impact middle index reach and atcontrol sites 1 and 2 in 2005 and 2006. Use of sentinel fishallowed us to measure the relationship betweenprevalence and in-stream habitat characteristics and tocontrol for movement of wild fish to and from theexposure sites. At each site, we deployed 3 replicatecages, each containing 30 age-0 Bonneville cutthroattrout (mean total length = 32.5 mm) certified to be M.cerebralis negative. We conducted sentinel fish expo-sures for a minimum of 21 d in the field and reared fishin aquaria after exposure for ,90 d to allow sporedevelopment prior to euthanizing the fish. We testedfish for whirling diseases with single-round polymerasechain reaction (PCR) techniques with the heat shockprotein (HSP) 70 gene segment (J. Wood, PiscesMolecular LLC, personal communication).
578 E. S. HANSEN AND P. BUDY [Volume 30
Data analysis
We used several different types of comparisons(Table 2) because of the variation in temporal andspatial scales of our measurements and the types ofresponse variables (i.e., continuous vs discrete). Wesampled physical response variables and periphyton3 times (early, late, and postgrazing) during beforeand after years. We made comparisons at control sitesfor the late grazing period only.
We assessed the effects of period and year on eachresponse variable with a randomized block, 2-wayfactorial analysis of variance, where blocks weredefined by location (impact upper, middle, lowerindex reaches). Location was a random-effects factor,whereas year (before, after), period (early, late,postgrazing), and their interactions were fixed-effectsfactors. We also used effect sizes calculated as
d=(before{after)=spooled
where
spooled=
ffiffiffiffiffiffiffiffiffiffiffiffiffiffiffiffiffiffiffiffiffiffiffiffiffiffiffiffiffiffiffiffiffiffiffiffiffiffiffiffiffiffiffi(½s2
beforezs2after�=2)
q
to assess responses to restoration (d increased whenresponse decreased from before to after; Cohen 1977).Effect-size values were variable-specific and weredescribed relative to the predicted response direction(Table 1). Effect sizes can be interpreted as small(d = 60.2), medium (d = 60.5), and large (d = 60.8),but these categories are somewhat subjective anddepend on the variable (Cohen 1977). We used pairedor 1-sample t-tests as appropriate to assess changebetween before and after of stream and riparian habitatvariables. In the 1-sample tests, we used the metric(after/before) and tested the hypothesis: Ho: m = 1.
We used tests of 2 binomial proportions andFisher’s exact test to quantify differences in preva-lence of M. cerebralis between before and after yearsfor sentinel and wild fish (MinitabH version 15.1; StateCollege, Pennsylvania). We used linear regression ofthe compilation of disease-prevalence data for wildcutthroat trout collected at all sites from 2001–2007(dependent variable; arcsine![x]-transformed) as afunction of the number of days that stream temper-atures at each site were within the optimal range forT. tubifex and TAM production (independent vari-ables). These prevalence data were collected as part ofour study (2005–2007) and as part of previous studiesand monitoring (2001–2004; de la Hoz Franco andBudy 2004, Budy et al. 2007).
Logistical limitations (e.g., equipment failure andfinancial constraints) limited sample size and design
symmetry. Therefore, we were limited to descriptivecomparisons for a few response variables and timeperiods at the control sites. Values of all responsevariables were measured and available at the controlsite for all years during the late grazing season, theseason most sensitive to cattle effects, and statisticalcomparisons were drawn accordingly. Unless other-wise noted, all statistical analyses were conducted inSAS (version 9.1; SAS Institute, Cary, North Carolina)and significance was evaluated at a = 0.05.
Results
Physical and chemical response variables
The responses of nutrient concentrations (mg/L) tolivestock exclusion were variable-specific. Only TKN,TP, and SRP differed significantly among years. TKNdecreased as predicted at the impact site (significantfor year and period; d = 1.360) but was similar amongyears at the control sites with an opposing effect-sizeresponse (d = 20.52; Table 3, Fig. 3A, B). TP de-creased as predicted at the impact site (significantfor year, period, and interaction; d = 1.67), but wassimilar among years at the control sites with anopposing effect-size response (d = 20.59; Table 3,Fig. 3A, B). SRP decreased as predicted at the impactsite (significant for year; d = 1.98), but was similaramong years at the control sites (d = 20.62; Table 3,Fig. 3A, B). In contrast, DP concentrations did notdiffer significantly among years at the impact site (d= 1.96), but had an opposite effect-size response at thecontrol sites (d = 20.64; Table 3, Fig. 3A, B). NH3 andNO3 + NO2 were similar among years at the impact(NH3: d = 21.33, NO3 + NO2: d = 21.64) and controlsites (NH3: d = 20.5, NO3 + NO2: d = 22.21; Table 3,Fig. 3A, B).
Other water-quality response variables (excludingnutrients and temperature) generally were similaramong impact and control sites within years butvaried among years. Chlorophyll a concentrationswere highly variable within sampling reaches at eachsite and effect sizes at the impact and control siteswere in opposing directions (d = 21.5 and 0.65,respectively). This high natural variability maskedany potential response to restoration (Table 3, Fig. 3A,B). Turbidity decreased at the impact site from thebefore early grazing period to the late and postgraz-ing periods and the after year (significant period andinteraction effects; d = 0.09). Turbidity was similar atthe control sites among years (d = 21.32; Table 3,Fig. 3A, B). Specific conductance decreased as pre-dicted across years at the impact site (significant foryear, period, and interaction; d = 2.15), but wassimilar among years at control sites, although effect
2011] PASSIVE STREAM RESTORATION AND FISH DISEASE 579
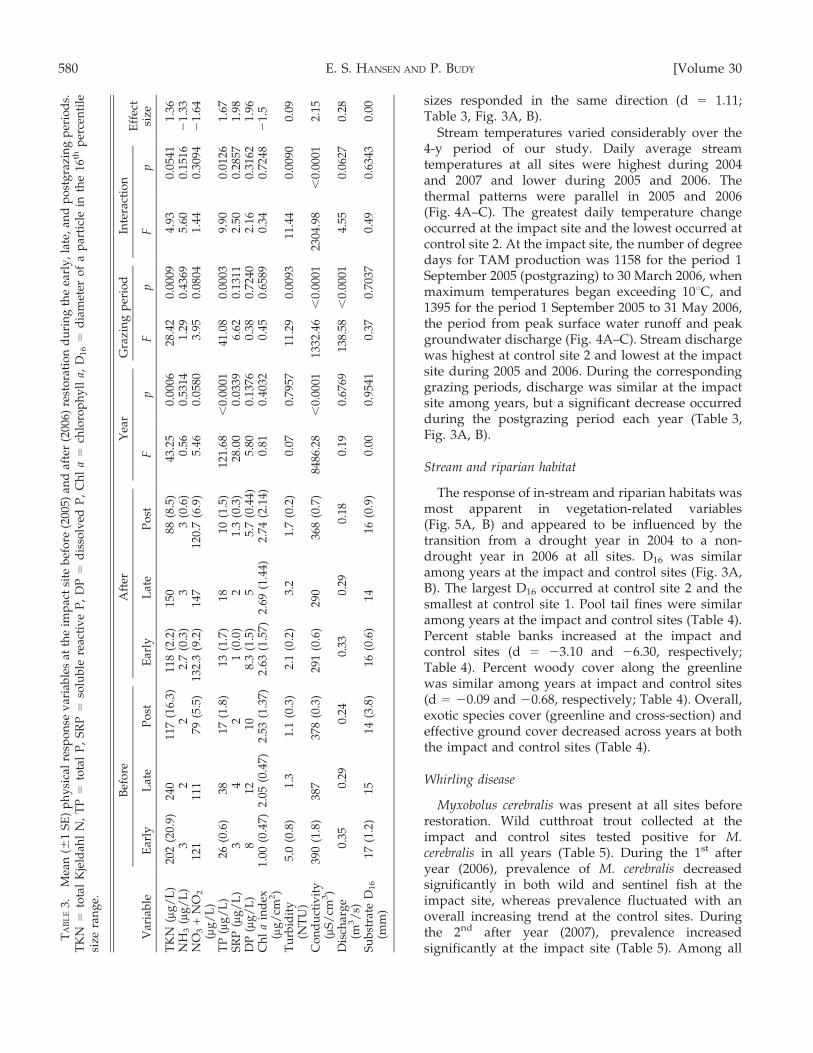
sizes responded in the same direction (d = 1.11;Table 3, Fig. 3A, B).
Stream temperatures varied considerably over the4-y period of our study. Daily average streamtemperatures at all sites were highest during 2004and 2007 and lower during 2005 and 2006. Thethermal patterns were parallel in 2005 and 2006(Fig. 4A–C). The greatest daily temperature changeoccurred at the impact site and the lowest occurred atcontrol site 2. At the impact site, the number of degreedays for TAM production was 1158 for the period 1September 2005 (postgrazing) to 30 March 2006, whenmaximum temperatures began exceeding 10uC, and1395 for the period 1 September 2005 to 31 May 2006,the period from peak surface water runoff and peakgroundwater discharge (Fig. 4A–C). Stream dischargewas highest at control site 2 and lowest at the impactsite during 2005 and 2006. During the correspondinggrazing periods, discharge was similar at the impactsite among years, but a significant decrease occurredduring the postgrazing period each year (Table 3,Fig. 3A, B).
Stream and riparian habitat
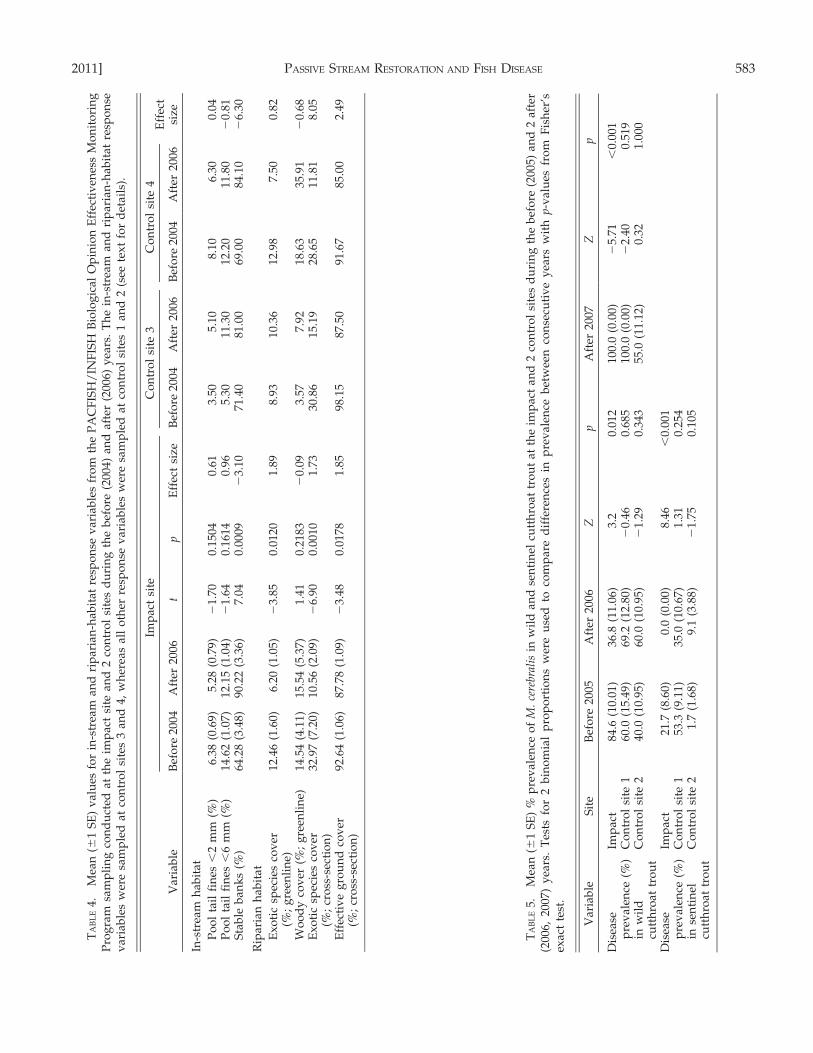
The response of in-stream and riparian habitats wasmost apparent in vegetation-related variables(Fig. 5A, B) and appeared to be influenced by thetransition from a drought year in 2004 to a non-drought year in 2006 at all sites. D16 was similaramong years at the impact and control sites (Fig. 3A,B). The largest D16 occurred at control site 2 and thesmallest at control site 1. Pool tail fines were similaramong years at the impact and control sites (Table 4).Percent stable banks increased at the impact andcontrol sites (d = 23.10 and 26.30, respectively;Table 4). Percent woody cover along the greenlinewas similar among years at impact and control sites(d = 20.09 and 20.68, respectively; Table 4). Overall,exotic species cover (greenline and cross-section) andeffective ground cover decreased across years at boththe impact and control sites (Table 4).
Whirling disease
Myxobolus cerebralis was present at all sites beforerestoration. Wild cutthroat trout collected at theimpact and control sites tested positive for M.cerebralis in all years (Table 5). During the 1st afteryear (2006), prevalence of M. cerebralis decreasedsignificantly in both wild and sentinel fish at theimpact site, whereas prevalence fluctuated with anoverall increasing trend at the control sites. Duringthe 2nd after year (2007), prevalence increasedsignificantly at the impact site (Table 5). Among all
TA
BL
E3.
Mea
n(6
1S
E)
ph
ysi
cal
resp
on
sev
aria
ble
sat
the
imp
act
site
bef
ore
(200
5)an
daf
ter
(200
6)re
sto
rati
on
du
rin
gth
eea
rly
,la
te,
and
po
stg
razi
ng
per
iod
s.T
KN
=to
tal
Kje
ldah
lN
,T
P=
tota
lP
,S
RP
=so
lub
lere
acti
ve
P,
DP
=d
isso
lved
P,
Ch
la
=ch
loro
ph
yll
a,D
16
=d
iam
eter
of
ap
arti
cle
inth
e16
thp
erce
nti
lesi
zera
ng
e.
Var
iab
le
Bef
ore
Aft
erY
ear
Gra
zin
gp
erio
dIn
tera
ctio
nE
ffec
tsi
zeE
arly
Lat
eP
ost
Ear
lyL
ate
Po
stF
pF
pF
p
TK
N(m
g/
L)
202
(20.
9)24
011
7(1
6.3)
118
(2.2
)15
088
(8.5
)43
.25
0.00
0628
.42
0.00
094.
930.
0541
1.36
NH
3(m
g/
L)
32
22.
7(0
.3)
33
(0.6
)0.
560.
5314
1.29
0.43
695.
600.
1516
21.
33N
O3
+N
O2
(mg
/L
)12
111
179
(5.5
)13
2.3
(9.2
)14
712
0.7
(6.9
)5.
460.
0580
3.95
0.08
041.
440.
3094
21.
64
TP
(mg
/L
)26
(0.6
)38
17(1
.8)
13(1
.7)
1810
(1.5
)12
1.68
,0.
0001
41.0
80.
0003
9.90
0.01
261.
67S
RP
( mg
/L
)3
42
1(0
.0)
21.
3(0
.3)
28.0
00.
0339
6.62
0.13
112.
500.
2857
1.98
DP
(mg
/L
)8
1210
8.3
(1.5
)5
5.7
(0.4
4)5.
800.
1376
0.38
0.72
402.
160.
3162
1.96
Ch
la
ind
ex( m
g/
cm2)
1.00
(0.4
7)2.
05(0
.47)
2.53
(1.3
7)2.
63(1
.57)
2.69
(1.4
4)2.
74(2
.14)
0.81
0.40
320.
450.
6589
0.34
0.72
482
1.5
Tu
rbid
ity
(NT
U)
5.0
(0.8
)1.
31.
1(0
.3)
2.1
(0.2
)3.
21.
7(0
.2)
0.07
0.79
5711
.29
0.00
9311
.44
0.00
900.
09
Co
nd
uct
ivit
y(m
S/
cm3)
390
(1.8
)38
737
8(0
.3)
291
(0.6
)29
036
8(0
.7)
8486
.28
,0.
0001
1332
.46
,0.
0001
2304
.98
,0.
0001
2.15
Dis
char
ge
(m3/
s)0.
350.
290.
240.
330.
290.
180.
190.
6769
138.
58,
0.00
014.
550.
0627
0.28
Su
bst
rate
D1
6
(mm
)17
(1.2
)15
14(3
.8)
16(0
.6)
1416
(0.9
)0.
000.
9541
0.37
0.70
370.
490.
6343
0.00
580 E. S. HANSEN AND P. BUDY [Volume 30

years and sites, a significant, positive relationshipexisted between the number of days that streamtemperatures were within the range consideredoptimal for both T. tubifex and TAM production(same number of days for both variables) and theprevalence of M. cerebralis in wild cutthroat trout (n =
21, p = 0.012, adj. R2= 0.29; Fig. 6).
Discussion
We evaluated the short-term potential of a passivestream restoration project to improve in-stream andriparian habitat and to minimize the potentiallysynergistic effects of habitat alteration and whirlingdisease on native trout. Some frequent issues continueto limit the science and practice of restoration(Bernhardt et al. 2005, 2007, Miller et al. 2010), sowe: 1) specified our overall restoration goal a prioriand hypothesized the expected direction of change fora suite of biological, chemical, and physical responsevariables, 2) used multiple control sites to evaluate theeffectiveness of restoration and compared patterns ofresponse variables temporally (before vs after) and
spatially (impact vs control), and 3) classified thetypes of responses observed into 5 categories. Thisapproach allowed us to address some sources ofinherent uncertainty and to determine whether aresponse was a product of the restoration, naturalvariation, a combination of both, or an indirectresponse to a change in another variable (Wheatonet al. 2008).
Over the short term (1–2 y postrestoration), weobserved responses that could be attributed to each ofthese causes. We attributed decreases in TN, TP, andSRP to the exclosure and removal of livestock andgrazing impacts. We attributed most of the decreasein average stream temperatures and specific conduc-tance to natural climatic variation. Last, we attributedcontrasting changes in cover of exotic plant species atthe impact site and control sites to combinedrestoration/natural variability in climate effects (non-drought conditions). The variability in types ofresponses demonstrates the potential difficulty ofdrawing strong conclusions about restoration re-sponses, even when the study design is fairly robust(Moerke et al. 2004, Miller et al. 2010). We identified
FIG. 3. Box plots (lines are medians, ends of boxes are 25th and 75th percentiles) for nutrient concentrations, chlorophyll a, andphysical response variables during the early, late, and postgrazing periods at the impact (A) and control (B) sites, data combined.Values were divided by 10 (*), 100 (**), and 1000 (***) to improve graphical representation. TKN = total Kjeldahl N, TP = total P,SRP = soluble reactive P, DP = dissolved P, D16 = diameter of particles in the 16th percentile.
2011] PASSIVE STREAM RESTORATION AND FISH DISEASE 581

statistically significant differences in some responsevariables (nutrients and conductivity), but continuedmonitoring will be necessary to determine whetherthese changes will be biologically significant over thelong term. We also observed statistically significantincreases in bank stability, decreases in exotic speciescover, and increases in effective ground cover. Theseriparian changes are biologically important becausethey reduce surface runoff and buffer sediment andnutrient inputs into the stream (Osborne and Kovacic1993, Owens et al. 1996, Belsky et al. 1999).
Several factors can contribute to an observed lack ofresponse to restoration. For example, the variablesmeasured simply might not be influenced by restora-
tion-related processes. Factors related to several of ourvariables could include, but are not limited to: 1)extremely high natural variability in the responsevariable, 2) sensitivity of the response variable tomethod of measurement, and 3) the short responsetime. For example, substrate composition has highwithin-reach variability that can dominate othersources of variation and could mask other responsesto stream restoration (Olsen et al. 2005). We detectedno significant change in substrate composition inresponse to restoration. In contrast, we detected asignificant increase in bank stability even though bankcharacteristics are sensitive to the measurementapproach used, and often, sample size is insufficientto detect a change (Roper et al. 2002).
Time since restoration also is an important factorwhen assessing the effectiveness of any restorationproject. Many variables require several years or even
FIG. 4. Mean (avg), maximum (max), and minimum(min) daily stream temperatures (uC) measured at theimpact (A) and control sites 1 (B) and 2 (C) from 2004 to2007. Shaded areas indicate the optimal range of tempera-tures for development stages of the Myxobolus cerebralis lifecycle and Tubifex tubifex host. The vertical dashed lineindicates when the exclosure was erected. The meantemperatures at the impact site during the summer 2005and 2006 were below the optimal development range forstages of the Myxobolus cerebralis life cycle and Tubifex tubifexhost (shaded area).
FIG. 5. Vegetation response to livestock exclusion at theimpact site lower index reach during the postgrazing periodfrom before (A) and after (B) restoration. The responsedepicted in the 2 photographs is representative of thechange in herbaceous vegetation. No woody riparianspecies were present. Photographs provided by PAC-FISH/INFISH Biological Opinion Effectiveness MonitoringProgram (United States Forest Service, Fish and AquaticEcology Unit, Logan, Utah).
582 E. S. HANSEN AND P. BUDY [Volume 30
TA
BL
E4.
Mea
n(6
1S
E)
val
ues
for
in-s
trea
man
dri
par
ian
-hab
itat
resp
on
sev
aria
ble
sfr
om
the
PA
CF
ISH
/IN
FIS
HB
iolo
gic
alO
pin
ion
Eff
ecti
ven
ess
Mo
nit
ori
ng
Pro
gra
msa
mp
lin
gco
nd
uct
edat
the
imp
act
site
and
2co
ntr
ol
site
sd
uri
ng
the
bef
ore
(200
4)an
daf
ter
(200
6)y
ears
.T
he
in-s
trea
man
dri
par
ian
-hab
itat
resp
on
sev
aria
ble
sw
ere
sam
ple
dat
con
tro
lsi
tes
3an
d4,
wh
erea
sal
lo
ther
resp
on
sev
aria
ble
sw
ere
sam
ple
dat
con
tro
lsi
tes
1an
d2
(see
tex
tfo
rd
etai
ls).
Var
iab
le
Imp
act
site
Co
ntr
ol
site
3C
on
tro
lsi
te4
Eff
ect
size
Bef
ore
2004
Aft
er20
06t
pE
ffec
tsi
zeB
efo
re20
04A
fter
2006
Bef
ore
2004
Aft
er20
06
In-s
trea
mh
abit
at
Po
ol
tail
fin
es,
2m
m(%
)6.
38(0
.69)
5.28
(0.7
9)2
1.70
0.15
040.
613.
505.
108.
106.
300.
04P
oo
lta
ilfi
nes
,6
mm
(%)
14.6
2(1
.07)
12.1
5(1
.04)
21.
640.
1614
0.96
5.30
11.3
012
.20
11.8
02
0.81
Sta
ble
ban
ks
(%)
64.2
8(3
.48)
90.2
2(3
.36)
7.04
0.00
092
3.10
71.4
081
.00
69.0
084
.10
26.
30
Rip
aria
nh
abit
at
Ex
oti
csp
ecie
sco
ver
(%;
gre
enli
ne)
12.4
6(1
.60)
6.20
(1.0
5)2
3.85
0.01
201.
898.
9310
.36
12.9
87.
500.
82
Wo
od
yco
ver
(%;
gre
enli
ne)
14.5
4(4
.11)
15.5
4(5
.37)
1.41
0.21
832
0.09
3.57
7.92
18.6
335
.91
20.
68E
xo
tic
spec
ies
cov
er(%
;cr
oss
-sec
tio
n)
32.9
7(7
.20)
10.5
6(2
.09)
26.
900.
0010
1.73
30.8
615
.19
28.6
511
.81
8.05
Eff
ecti
ve
gro
un
dco
ver
(%;
cro
ss-s
ecti
on
)92
.64
(1.0
6)87
.78
(1.0
9)2
3.48
0.01
781.
8598
.15
87.5
091
.67
85.0
02.
49
TA
BL
E5.
Mea
n(6
1S
E)
%p
rev
alen
ceo
fM
.ce
rebr
alis
inw
ild
and
sen
tin
elcu
tth
roat
tro
ut
atth
eim
pac
tan
d2
con
tro
lsi
tes
du
rin
gth
eb
efo
re(2
005)
and
2af
ter
(200
6,20
07)
yea
rs.
Tes
tsfo
r2
bin
om
ial
pro
po
rtio
ns
wer
eu
sed
toco
mp
are
dif
fere
nce
sin
pre
val
ence
bet
wee
nco
nse
cuti
ve
yea
rsw
ith
p-v
alu
esfr
om
Fis
her
’sex
act
test
.
Var
iab
leS
ite
Bef
ore
2005
Aft
er20
06Z
pA
fter
2007
Zp
Dis
ease
pre
val
ence
(%)
inw
ild
cutt
hro
attr
ou
t
Imp
act
84.6
(10.
01)
36.8
(11.
06)
3.2
0.01
210
0.0
(0.0
0)2
5.71
,0.
001
Co
ntr
ol
site
160
.0(1
5.49
)69
.2(1
2.80
)2
0.46
0.68
510
0.0
(0.0
0)2
2.40
0.51
9C
on
tro
lsi
te2
40.0
(10.
95)
60.0
(10.
95)
21.
290.
343
55.0
(11.
12)
0.32
1.00
0
Dis
ease
pre
val
ence
(%)
inse
nti
nel
cutt
hro
attr
ou
t
Imp
act
21.7
(8.6
0)0.
0(0
.00)
8.46
,0.
001
Co
ntr
ol
site
153
.3(9
.11)
35.0
(10.
67)
1.31
0.25
4C
on
tro
lsi
te2
1.7
(1.6
8)9.
1(3
.88)
21.
750.
105
2011] PASSIVE STREAM RESTORATION AND FISH DISEASE 583

decades to respond (Kondolf 1993, Magilligan andMcDowell 1997). We measured the response topassive restoration over a relatively short period of3 y (including only 1 after year). After more timepasses, we expect to see responses in more variablesand stronger responses in some variables that havealready changed (e.g., continued decrease in exoticplant species cover). Comparison of the responsesmeasured over the short term relative to thoseexpected over the long term (i.e., direction of responsebased on our a priori hypotheses) should further ourunderstanding of recovery trajectory after restoration(Moerke et al. 2004, Tullos et al. 2009). In addition, bynecessity, both control sites were 3rd-order streams,whereas the impact site was a smaller, 2nd-orderstream. Comparisons between before and after yearsshould account for some of the spatial differencesamong control and impact sites, but importance ofsome stream processes (e.g., primary production) mayvary with watershed size.
For all restoration projects, the scale of therestoration effort relative to the scale of the problem(e.g., level and source of degradation) can limit ourability to meet restoration goals (Moerke et al. 2004,Booth 2005, Miller et al. 2010). Especially for exclosureprojects, the size and location of the restoration in thewatershed can determine potential for success (Sarr2002, Bayley and Li 2008). We attribute the short-term
success of our project to the large size of the exclosure(67 ha), effective exclusion of livestock grazing fromthe entire stream length (except the bottom 200 m),and the relatively wide riparian buffer (nearly ridge toridge).
One of the greatest influences on the success ofriparian restoration projects is the level of degradationbefore the restoration relative to the natural resilienceof riparian areas (Ebersole et al. 1997, Kauffman et al.1997). Spawn Creek was an ideal candidate forpassive stream restoration because the level ofdegradation was not severe (e.g., little or no channelincision), and the seed bank of the native vegetationwas still present and viable. Thus, active restorationwas not necessary, and initiation of an apparenttrajectory of change was immediate and positive.
One of our goals was to assess the potential forstream restoration to minimize effects of fish disease.We observed some intriguing, albeit inconclusive,responses in the prevalence of M. cerebralis in bothwild and sentinel fishes. We attribute the initialdecline in M. cerebralis prevalence in both wild andsentinel fish at the impact site primarily to decreasesin stream temperature (Baldwin et al. 2000, Hiner andMoffitt 2002, de la Hoz Franco and Budy 2004).However, both climatic and exclosure effects probablycontributed to changes in stream temperature. Thestudy period included hot, dry drought years (2004
FIG. 6. The relationship between disease prevalence (Myxobolus cerebralis) in wild cutthroat trout collected at all sites from 2001to 2007 as a function of the number of days that stream temperatures at each site were within the optimal range for both Tubifextubifex and triactinomyxon (TAM) production. n = 21, p = 0.012, adjusted R2 = 0.29.
584 E. S. HANSEN AND P. BUDY [Volume 30

and 2007) and cooler, wet years (2005 and 2006).Average stream temperatures differed .2uC betweenthe 2 climatic regimes. This type of natural climateand geomorphic variability can mask or alter theresponse of water-quality variables to stream restora-tion (Booth 2005, Wheaton et al. 2008), but in thisecosystem, a decline in stream temperature of even2uC can produce a temperature regime that is belowthe optimal range for the M. cerebralis and T. tubifex.Across all years and sites (where data were available),prevalence of M. cerebralis was positively associatedwith the number of degree days in the optimal rangefor both T. tubifex and TAM production. Thecomplexity (and length) of the M. cerebralis life cycleand the influence of multiple habitat variables makespecific or independent processes controlling theprevalence of the parasite difficult to identify withcertainty, but this positive relationship is notable.Potential exists for stream temperatures to continue todecrease over the longer term if riparian vegetationgrows enough to shade the stream (Van Velson 1979,Li et al. 1994, Sweeney et al. 2004). Maximum streamtemperatures were 2 to 3uC lower at a restored reachof a nearby watershed than at an adjacent reachdownstream of the exclosure 5 to 6 y after restoration(Duff 1977).
Many responses to restoration occur over the longterm, but the immediate decrease in the prevalence ofM. cerebralis at the restoration site during coldernondrought years is important. Relatively smalldecreases in temperature may be even more impor-tant if the climate warms. In addition, the immediatedecrease in stream enrichment (N, P, and sediment)may result in habitat less suitable to enrichment-loving invertebrates (e.g., chironomids; del Rosario etal. 2002) including the T. tubifex host (Lestochova1994). Thus, given the relationship between theprevalence of the parasite and these stream-habitatcharacteristics with potential for change, streamrestoration appears to have potential to minimizethe prevalence and impact of disease.
Acknowledgements
Our research was funded primarily by Utah Divisionof Wildlife Resources (UDWR), Project XV, SportFisheries Research, Grant Number F-47-R, Amend-ment 20, and by the Utah Division of Water Quality,Environmental Protection Agency Clean Water ActSection 319. Additional contributions were made byUtah State University, US Geological Survey UtahCooperative Fish and Wildlife Research Unit, CacheAnglers Chapter of Trout Unlimited (TU), LoganRanger District Cache National Forest US Forest
Service, UDWR Dedicated Hunter Program, Fish andAquatic Ecology Unit USFS, TU Embrace-a-StreamProgram, UDWR Blue Ribbon Fisheries Program, JohnCarter and Western Watersheds, Bonneville Chapter ofthe American Fisheries Society, Utah Council of TU,Weber Basin Anglers Chapter of TU, The StoneflySociety, Bridgerland Audubon Society, BridgerlandOutdoor Coalition, and Sportsmen for Fish andWildlife. Specifically, we offer sincere gratitude to PaulChase (USFS), Chris Thomas (Cache Anglers), andChris Wilson (UDWR, FES) for spearheading theexclosure project and evaluation, raising .200,000USD, and enduring endless and painful negotiationswith all the political entities involved. We also thankGary Thiede, Charles (Chuck) Hawkins, John (Jack) C.Schmidt, and numerous UDWR Fisheries ExperimentStation (FES) staff and other volunteers and techniciansfor scientific and logistical contributions and generalsupport. Brett Roper, Ronald Ryel, Scott Miller, GaryThiede, and anonymous referees reviewed previousdrafts of this manuscript and provided constructivecriticism and insight.
Literature Cited
APHA (AMERICAN PUBLIC HEALTH ASSOCIATION). 1989. Stan-dard methods for the examination of water and wastewater. 17th edition. American Public Health Association,American Waterworks Association, and Water Environ-ment Federation, Washington, DC.
BALDWIN, T. J., E. R. VINCENT, R. M. SILFLOW, AND D. STANEK.2000. Myxobolus cerebralis infection in rainbow trout(Oncorhynchus mykiss) and brown trout (Salmo trutta)exposed under natural stream conditions. Journal ofVeterinary Diagnostic Investigation 12:312–321.
BARBOUR, A. G., AND D. FISH. 1993. The biological and socialphenomenon of Lyme disease. Science 260:1610–1616.
BAYLEY, P. B., AND H. W. LI. 2008. Stream fish responses tograzing exclosures. North American Journal of FisheriesManagement 28:135–147.
BEHNKE, R. J. 1992. Native trout of western North America.American Fisheries Society, Bethesda, Maryland.
BELSKY, A. J., A. MATZKE, AND S. USELMAN. 1999. Survey oflivestock influences on stream and riparian ecosystemsin the western United States. Journal of Soil and WaterConservation 54:419–431.
BERNARD, D. R., AND E. K. ISRAELSEN. 1982. Inter- andintrastream migration of cutthroat trout (Salmo clarki)in Spawn Creek, a tributary of the Logan River, Utah.Northwest Science 56:148–158.
BERNHARDT, E. S., M. A. PALMER, J. D. ALLAN, G. ALEXANDER, K.BARNAS, S. BROOKS, J. CARR, S. CLAYTON, C. DAHM, J.FOLLSTAD-SHAH, D. GALAT, S. GLOSS, P. GOODWIN, D. HART,B. HASSET, R. JENKINSON, S. KATZ, G. M. KONDOLF, P. S.LAKE, R. LAVE, J. L. MEYER, T. K. O’DONNELL, L. PAGANO, B.POWELL, AND E. SUDDUTH. 2005. Synthesizing U.S. riverrestoration efforts. Science 308:636–637.
2011] PASSIVE STREAM RESTORATION AND FISH DISEASE 585

BERNHARDT, E. S., E. B. SUDDUTH, M. A. PALMER, J. D. ALLAN, J.L. MEYER, G. ALEXANDER, J. FOLLSTAD-SHAH, B. HASSET, R.JENKINSON, R. LAVE, J. RUMPS, AND L. PAGANO. 2007.Restoring rivers one reach at a time: results from asurvey of U.S. river restoration practitioners. Restora-tion Ecology 15:482–493.
BOOTH, D. B. 2005. Challenges and prospects for restoringurban streams: a perspective from the Pacific Northwestof North America. Journal of the North AmericanBenthological Society 24:724–737.
BUDY, P., G. P. THIEDE, AND P. MCHUGH. 2007. Quantificationof the vital rates, abundance and status of a critical,endemic population of Bonneville cutthroat trout. NorthAmerican Journal of Fisheries Management 27:593–604.
BUNTE, K., AND S. R. ABT. 2001. Sampling surface andsubsurface particle-size distributions in wadeable grav-el- and cobble-bed streams for analyses in sedimenttransport, hydraulics, and streambed monitoring. Gen-eral Technical Report RMRS-GTR-74. US Department ofAgriculture, Forest Service, Rocky Mountain ResearchStation, Fort Collins, Colorado.
COHEN, J. 1977. Statistical power analysis for the behavioralsciences. Revised edition. Academic Press, New York.
DASZAK, P., A. A. CUNNINGHAM, AND A. D. HYATT. 2000.Emerging infectious diseases of wildlife – threats tobiodiversity and human health. Science 287:443–449.
DEEM, S. L., W. B. KARESH, AND W. WEISMAN. 2001. Puttingtheory into practice: wildlife health in conservation.Conservation Biology 15:1224–1233.
DE LA HOZ FRANCO, E., AND P. BUDY. 2004. Linking environ-mental heterogeneity to the distribution and prevalenceof Myxobolus cerebralis: a comparison across sites in anorthern Utah watershed. Transactions of the AmericanFisheries Society 133:1176–1189.
DE LA HOZ FRANCO, E. A., AND P. BUDY. 2005. Effects of bioticand abiotic factors on the distribution of trout andsalmon along a longitudinal stream gradient. Environ-mental Biology of Fishes 72:379–391.
DEL ROSARIO, R. B., E. A. BETTS, AND V. H. RESH. 2002. Cowmanure in headwater streams: tracing aquatic insectresponses to organic enrichment. Journal of the NorthAmerican Benthological Society 21:278–289.
DUFF, D. A. 1977. Livestock grazing impacts on aquatichabitat in Big Creek, Utah. Pages 129–142 in O. B. Cope(editor). Proceedings of the Workshop on Livestock andWildlife-Fisheries Relationships in the Great Basin.Agricultural Science Department, University of Califor-nia Berkeley, Sparks, Nevada.
EBERSOLE, J. L., W. J. LISS, AND C. A. FRISSELL. 1997. Restorationof stream habitats in the western United States:restoration as reexpression of habitat capacity. Environ-mental Management 21:1–14.
EL-MATBOULI, M., T. S. MCDOWELL, D. B. ANTONIO, K. B.ANDREE, AND R. P. HEDRICK. 1999. Effect of watertemperature on the development, release and survivalof the triactinomyxon stage of Myxobolus cerebralis in itsoligochaete host. International Journal for Parasitology29:627–641.
FLEISCHNER, T. L. 1994. Ecological costs of livestock grazing inwestern North America. Conservation Biology 8:629–644.
GRANATH, W. O., M. A. GILBERT, E. J. WYATT-PESCADOR, AND
E. R. VINCENT. 2007. Epizootiology of Myxobolus cerebralis,the causative agent of salmonid whirling disease in theRock Creek drainage of west-central Montana. Journal ofParasitology 93:104–119.
HANSEN, E. S. 2007. Evaluating the effectiveness of passivestream restoration for improving native fish health andminimizing the impacts of disease. MS Thesis, UtahState University, Logan, Utah.
HARRELSON, C. C., C. L. RAWLINS, AND J. P. POTYONDY. 1994.Stream channel reference sites: an illustrated guide tofield technique. General Technical Report RM-245. USDepartment of Agriculture Forest Service, Rocky Moun-tain Research Station, Fort Collins, Colorado.
HEDRICK, R. P., T. S. MCDOWELL, M. GAY, G. D. MARTY, M. P.GEORGIADIS, AND E. MACCONNELL. 1999. Comparativesusceptibility of rainbow trout Oncorhynchus mykissand brown trout Salmo trutta to Myxobolus cerebralis,the cause of salmonid whirling disease. Diseases ofAquatic Organisms 37:173–183.
HINER, M., AND C. M. MOFFITT. 2002. Modeling Myxoboluscerebralis infections in trout: associations with habitatvariables. Pages 167–180 in J. L. Bartholomew and J. C.Wilson (editors). Whirling disease: reviews and currenttopics. American Fisheries Society, Bethesda, Maryland.
KAESER, A. J., C. RASMUSSEN, AND W. E. SHARPE. 2006. Anexamination of environmental factors associated withMyxobolus cerebralis infection of wild trout in Pennsyl-vania. Journal of Aquatic Animal Health 18:90–100.
KAUFFMAN, J. B., R. L. BESCHTA, N. OTTING, AND D. LYTJEN.1997. An ecological perspective of riparian and streamrestoration in the western United States. Fisheries22(5):12–24.
KAUFFMAN, J. B., R. L. CASE, D. LYTJEN, N. OTTING, AND D. L.CUMMINGS. 1995. Ecological approaches to riparianrestoration in Northeast Oregon. Restoration andManagement Notes 13:12–15.
KERANS, B. L., AND A. V. ZALE. 2002. The ecology of Myxoboluscerebralis. Pages 145–166 in J. L. Bartholomew and J. C.Wilson (editors). Whirling disease: reviews and currenttopics. American Fisheries Society, Bethesda, Maryland.
KERSHNER, J. L., E. K. ARCHER, M. COLES-RITCHIE, E. R. COWLEY,R. C. HENDERSON, K. KRATZ, C. M. QUIMBY, D. L. TURNER,L. C. ULMER, AND M. R. VINSON. 2004. Guide to effectivemonitoring of aquatic and riparian resources. RMRS-GTR-121. US Department of Agriculture, Forest Service,Rocky Mountain Research Station, Fort Collins, Colorado.
KNAPP, R. A., AND K. R. MATTHEWS. 1996. Impacts of livestockgrazing on streams and resident golden trout popula-tions in the Golden Trout Wilderness, California. NorthAmerican Journal of Fisheries Management 16:805–820.
KONDOLF, G. M. 1993. Lag in stream channel adjustment tolivestock exclosure, White Mountains, California. Res-toration Ecology 1:226–230.
KRUEGER, R. C., B. L. KERANS, E. R. VINCENT, AND C. RASMUSSEN.2006. Risk of Myxobolus cerebralis infection to rainbow
586 E. S. HANSEN AND P. BUDY [Volume 30

trout in the Madison River, Montana, USA. EcologicalApplications 16:770–783.
LAZIM, M. N., AND M. A. LEARNER. 1987. The influence ofsediment composition and leaf litter on the distributionof tubificid worms (Oligochaeta). A field and laboratorystudy. Oecologia (Berlin) 72:131–136.
LENTSCH, L., Y. CONVERSE, AND J. PERKINS. 1997. Conservationagreement and strategy for Bonneville cutthroat trout(Oncorhynchus clarki utah) in the state of Utah. Publica-tion Number 97-19. Utah Division of Wildlife Resources,Salt Lake City, Utah.
LESTOCHOVA, E. I. 1994. Influence of small river conditions onthe abundance of Tubificidae. Hydrobiologia 278:129–131.
LI, H. W., G. A. LAMBERTI, T. N. PEARSONS, C. K. TAIT, J. L. LI,AND J. C. BUCKHOUSE. 1994. Cumulative effects of ripariandisturbances along high desert trout streams of the JohnDay Basin, Oregon. Transactions of the AmericanFisheries Society 123:627–640.
MAGILLIGAN, F. J., AND P. F. MCDOWELL. 1997. Stream channeladjustments following elimination of cattle grazing.Journal of the American Water Resources Association33:867–878.
MCMURTRY, M. J., D. J. RAPPORT, AND K. E. CHUA. 1983.Substrate selection by tubificid oligochaetes. CanadianJournal of Fisheries and Aquatic Sciences 40:1639–1646.
MILLER, S. W., P. BUDY, AND J. C. SCHMIDT. 2010. Quantifyingmacroinvertebrate response to in-stream habitat resto-ration: applications of meta-analysis to river restoration.Restoration Ecology 18:8–19.
MOERKE, A. H., K. J. GERARD, J. A. LATIMORE, R. A. HELLENTHAL,AND G. A. LAMBERTI. 2004. Restoration of an Indiana,USA, stream: bridging the gap between basic andapplied lotic ecology. Journal of the North AmericanBenthological Society 23:647–660.
NRC (NATIONAL RESEARCH COUNCIL). 1992. Restoration ofaquatic ecosystems. National Academy Press, Washing-ton, DC.
NRC (NATIONAL RESEARCH COUNCIL). 2001. Grand challengesin environmental sciences. National Academy Press,Washington, DC. (Available from: http://www.nap.edu/books/0309072549/html/i)
OLSEN, D. S., B. B. ROPER, J. L. KERSHNER, R. HENDERSON, AND E.ARCHER. 2005. Sources of variability in conductingpebble counts: their potential influence on the resultsof stream monitoring programs. Journal of the Ameri-can Water Resources Association 41:1225–1236.
OSBORNE, L. L., AND D. A. KOVACIC. 1993. Riparian vegetatedbuffer strips in water-quality restoration and streammanagement. Freshwater Biology 29:243–258.
OWENS, L. B., W. M. EDWARDS, AND R. W. VAN KEUREN. 1996.Sediment losses from a pastured watershed before andafter stream fencing. Journal of Soil and WaterConservation 51:90–94.
PATZ, J. A., P. DASZAK, G. M. TABOR, A. A. AGUIRRE, M. PEARL,J. EPSTEIN, N. D. WOLFE, A. M. KILPATRICK, J. FOUFOPOULOS,D. MOLYNEUX, AND D. J. BRADLEY. 2004. Unhealthylandscapes: policy recommendations on land use
change and infectious disease emergence. Environmen-tal Health Perspectives 112:1092–1098.
PLATTS, W. S. 1981. Influence of forest and rangelandmanagement on anadromous fish habitat in westernNorth America. Effects of livestock grazing. GeneralTechnical Report PNW-124. US Department of Agricul-ture, Forest Service, Pacific Northwest Forest and RangeExperiment Station, Portland, Oregon.
REYNOLDSON, T. B. 1987. The role of environmental factors inthe ecology of tubificid oligochaetes: an experimentalstudy. Holarctic Ecology 10:241–248.
ROPER, B. B., J. J.DOSE, AND J. E.WILLIAMS. 1997.Stream restoration:is fisheries biology enough? Fisheries 22(5):6–11.
ROPER, B. B., J. L. KERSHNER, E. ARCHER, R. HENDERSON, AND N.BOUWES. 2002. An evaluation of physical stream habitatattributes used to monitor streams. Journal of theAmerican Water Resources Association 38:1637–1646.
SANDELL, T. A., H. V. LORZ, D. G. STEVENS, AND J. L.BARTHOLOMEW. 2001. Dynamics of Myxobolus cerebralisin the Lostine River, Oregon: implications for residentand anadromous salmonids. Journal of Aquatic AnimalHealth 13:142–150.
SARR, D. A. 2002. Riparian livestock exclosure research in thewestern United States: a critique and some recommen-dations. Environmental Management 30:516–526.
SWEENEY, B. W., T. L. BOTT, J. K. JACKSON, L. A. KAPLAN, J. D.NEWBOLD, L. J. STANDLEY, W. C. HESSION, AND R. J.HORWITZ. 2004. Riparian deforestation, stream narrow-ing, and loss of stream ecosystem services. Proceedingsof the National Academy of Science of the United Statesof America 101:14132–14137.
TULLOS, D. D., D. L. PENROSE, G. D. JENNINGS, AND W. G. COPE.2009. Analysis of functional traits in reconfiguredchannels: implications for the bioassessment and dis-turbance of river restoration. Journal of the NorthAmerican Benthological Society 28:80–92.
VAN VELSON, R. 1979. Effects of livestock grazing on rainbowtrout in Otter Creek, Nebraska. Pages 53–56 in Proceed-ings: Forum – Grazing and Riparian/Stream Ecosys-tems. Trout Unlimited, Denver, Colorado.
VILCHIS, L. I., M. J. TEGNER, J. D. MOORE, C. S. FRIEDMAN, K. L.RISER, T. T. ROBBINS, AND P. K. DAYTON. 2005. Oceanwarming effects on growth, reproduction, and survi-vorship of southern California abalone. EcologicalApplications 15:469–480.
VITOUSEK, P. M., H. A. MOONEY, J. LUBCHENCO, AND J. M.MELILLO. 1997. Human domination of Earth’s ecosys-tems. Science 277:494–499.
WELSCHMEYER, N. A. 1994. Fluorometric analysis of chloro-phyll a in the presence of chlorophyll b and phaeopig-ments. Limnology and Oceanography 39:1985–1992.
WHEATON, J. M., S. E. DARBY, AND D. A. SEAR. 2008. The scopeof uncertainties in river restoration. Pages 21–39 in S. E.Darby and D. A. Sear (editors). River restoration:managing the uncertainty in restoring physical habitat.John Wiley and Sons, Hoboken, New Jersey.
WILCOVE, D. S., D. ROTHSTEIN, J. DUBOW, A. PHILLIPS, AND E.LOSOS. 1998. Quantifying threats to imperiled species inthe United States. BioScience 48:607–615.
2011] PASSIVE STREAM RESTORATION AND FISH DISEASE 587

WILSON, M. E. 2000. Environmental change and infectiousdisease. Ecosystem Health 6:7–12.
ZENDT, J. S., AND E. P. BERGERSEN. 2000. Distribution andabundance of the aquatic oligochaete host Tubifex tubifexfor the salmonid whirling disease parasite Myxobolus
cerebralis in the upper Colorado River basin. NorthAmerican Journal of Fisheries Management 20:502–512.
Received: 10 February 2010Accepted: 11 February 2011
588 E. S. HANSEN AND P. BUDY [Volume 30