the potential impact of ocean thermal energy conversion (otec) on fisheries · 2012-03-16 · ocean...
TRANSCRIPT

NOAA Technical Report NMFS 40
The Potential Impact ofOcean Thermal EnergyConversion (OTEC)on Fisheries
Edward P. MyersDonald E. HossWalter M. MatsumotoDavid S. PetersMichael P. SekiRichard N. UchidaJohn D. DitmarsRobert A. Paddock
June 1986
U.S. DEPARTMENT OF COMMERCENational Oceanic and Atmospheric AdministrationNational Marine Fisheries Service

NOAA TECHNICAL REPORT NMFS
The major responsibilities of the National Marine Fisheries Service (NMFS) are to monitor and assess the abundance and geographic distribution of fishery resources, tounderstand and predict fluctuations in the quantity and distribution of these resources, and to establish levels for their optimum use. NMFS is also charged with the developmentand implementation of policies for managing national fishing grounds, development and enforcemeJlt of domestic fisheries regulations, surveillance of foreign fishing off United
States coastal waters, and the development and enforcement of international fishery agreements and policies. NMFS also assists the fishing industry through marketing serviceand economic analysis programs, and mortgage insurance and vessel cunstruction subsidies. It collects, analyzes, and publishes statistics on various phases of the industry.
The NOAA Technical Report NMFS series was established in 1983 to replace two subcategories of the Technical Reports series: "Special Scientific Report-Fisheries" and"Circular." The series contains the following types of reports: Scientific investigations that document long-term continuing programs of NMFS; intensive scientific reports onstudies of restricted scope; papers on applied fishery problems; technical reports of general interest intended to aid conservation and management: reports that review ill cun·slderable detail and at a high technical level certain broad areas of research; and technical papers originating in economics studies and from management investigations Sincethis is a formal series, all submitted papers receive peer review and those accepted receive professional editing before publication.
Copies of NOAA Technical Reports NMFS are av.ilable free in limited numbers to governmental agencies, both Federal and State. They are also available in exchange forother scientific and technical publications in the marine sciences. Individual copies may be obtained from: U.S. Department of Commerce, National Technical Information Service,5285 Port Royal Road, Springfield, VA 22161. Although the contents have not been copyrighted and may be reprinted entirely, reference to source is appreciated.
1. Synopsis of biological data on the Blue Crab, Callinecles sapidus Rathbun, byMark R. Millikin and Austin B. Williams. March 1984, 39 p.
2. Development of hexagrammids (Pisces: Scorpaeniformes) in the NortheasternPacific Ocean, by Arthur W. Kendall, Jr., and Beverly Vinter. March 1984,44 p.
3. Configurations and relative efficiencies of shrimp trawls employed in southeasternUnited States waters, by John W. Watson, Jr., Ian K. Workman, Charles W. Taylor,
and Anthony F. Serra. March 1984, 12 p.
4. Management of northern fur seals on the Pribilof Islands, Alaska, 1786-1981, byAlton Y. Roppel. April 1984, 26 p.
5. Net phytoplankton and zooplankton in the New York Bight, January 1976 toFebruary 1978, with comments on the effects of wind, Gulf Stream eddies, and slopewater intrusions, by Daniel E. Smith and Jack W. Jossi. May 1984, 41 p.
6. lchthyoplankton survey of the estuarine and inshore waters of the Florida Everglades, May 1971 to February 1972, by L. Alan Collins, and John H. Finucane. July1984, 75 p.
7. The feeding ecology of some zooplankters that are important prey items of larvalfish, by Jefferson T. Turner. July 1984, 28 p.
8. Proceedings of the International Workshop on Age Determination of OceanicPelagic Fishes: Tunas, BUtfishes, and Sharks, by Eric D. Prince (convener and editor),and Lynn M. Pulos (editor). December 1983, 211 p.
9. Sampling statistics in the Atlantic menhaden fishery, by Alexander 1. Chester.August 1984, 16 p.
10. Proceedings of the Seventh U.S.-Japan Meeting on Aquaculture, Marine FinfishCulture, Tokyo, Japan, October 3-4, 1978, by Carl 1. Sindermann (editor). August 1984,31 p.
II. Taxonomy of North American fish Eimeriidae, by Steve.! Upton, DlVid W.Reduker, William L. Current, and Donald W. Duszynski. August 1984, 18 p.
12. Soviet-American Cooperative Research on Marine Mammals. Volume I--Pinnipeds, by Francis H. Fay, and Gennadii A. Fedoseev (editors). September 1984, 104 p.
13. Guidelines for reducing porpoise mortality in tuna purse seining, by James M.Coe, David B. Holts, and Richard W. Butler. September 1984, 16 p.
14. Synopsis of biological data on shortnose sturgeon, A1:ipenser breviroslrnm leSueur1818, by Michael 1. Dadswell, Bruce D. Taubert, Thomas S. Squiers, Donald Marchette, and Jack Buckley. October 1984, 45 p.
15. Chaetognatha of the Caribbean sea and adjacent areas, by Harding B. Michel.
October 1984, 33 p.
16. Proceedings of the Ninth and Tenth U.S.-Japan Meetings on Aquaculture, by Carl
1. Sindermann (editor). November 1984, 92 p.
17. Identification and estimation of size from the beaks of 18 species of cephalopodsfrom the Pacific Ocean, by Gary A. Wolff. November 1984, 50 p.
18. A temporal and spatial study of invertebrate communities associated with hard-
bottom habitats in the South Atlantic Bight, by E. L. Wenner, P. Hinde, D. M. Knott,and R. F. Van Dolah. November 1984, 104 p.
19. Synopsis of biological data on spottail finfish, Dip/odu; ho/brooki (Pisces'Sparidae), by George H. Darcy. January 1985, II p.
20. lchthyoplankton of the Continental Shelf near Kodiak Island, Alaska, by ArthurW. Kendall, Jr., and Jean R. Dunn. January 1985, 89 p.
21. Annotated bibliography on hypoxia and its effects on marine life, with empha""on the Gulf of Mexico, by Maurice L. Renaud. February 1985, 9 p.
22. Congrid eels of the eastern Pacific and key to their Leptocephali, by SolomonN. Raju. February 1985, 19 p.
23. Synopsis of biological data on the pinfish, Lagodoll r/IO/Ilboides (Pisccs:Sparidae).by George H. Darcy. February 1985, 32 p.
24. Temperature conditions in the cold pool 1977-81: A comparison between southernNew England and New York transects, by Steven K. Cook. February 1985, 22 p.
25. Parasitology and pathology of marine organisms of the world ocean, by Wilham1. Hargis, Jr. (editor). March 1985, 135 p.
26. Synopsis of biological data on the sand perch, Dip/eclrum formosum (Pisces:Serranidae), by George H. Darcy. March 1985, 21 p.
27. Proceedings of the Eleventh U.S.-Japan Meeting on Aquaculture, Salmon Enhance..ment, Tokyo, Japan, October 19-20, 1982, by Carl J. Sindermann (editor). March 1985,102 p.
28. Review of geographical stocks of tropical dolphins (Slenella spp. and De/phinusde/phis) in the eastern Pacific, by William F. Perrin, Michael D. Scott, G. Jay Walker,and Virginia L. Casso March 1985, 28 p.
29. Prevalence, intensity, longevity, and persistence of Anisakis sp. larvae and Lacisrorhynchus tenuis metacestodes in San Francisco striped bass, by Mike Moser, JudyA. Sakanari, Carol A. Reilly, ar.d Jeannette Whipple. April 1985, 4 p.
30. Synopsis of biological {ata on the pmk shrimp, Panda/us borealis Kr6yer, 1838,by Sandra E. Shumway, Herbert C. Perkins, Daniel F. Schick, and Alden P. Stickney.May 1985, 57 p.
31. Shark catches from selected fisheries off the U.S. east coast, by Emory D. Anderson, John G. Casey, John J. Hoey, and W. N. Witzell. July 1985, 22 p.
32. Nutrient Distributions for Georges Bank and adjacent waters in 1979, by A. F.1. DraxJer, A. Matte, R. Waldhauer, and 1. E. O'Reilly. July 1985, 34 p.
33. Marine flora and fauna of the Northeastern United States. Echinodermata:Echinoidea, by D. Keith Serafy and F. Julian Fell. September 1985, 27 p.
34. Additions to a revision of the shark genus Carcharhinus: Synonymy of Apriono
don and Hypoprion, and description of a new species of Carcharhinus (Carcharhinidae),by 1. A. F. Garrick. November 1985, 26 p.
15. Synoptic review of the literature on the Southern oyster drill Thais haemnstoma
jlvridana, by Philip A. Butler. November 1985, 9 p.

NOAA Technical Report NMFS 40
The Potential Impact ofOcean Thermal EnergyConversion (OTEC)on Fisheries
Edward P. MyersDonald E. HossWalter M. MatsumotoDavid S. PetersMichael P. SekiRichard N. UchidaJohn D. DitmarsRobert A. Paddock
June 1986
u.s. DEPARTMENT OF COMMERCEMalcolm Baldrige, Secretary
National Oceanic and Atmospheric AdministrationAnthony J. Calio, Administrator
National Marine Fisheries ServiceWilliam G. Gordon, Assistant Administrator for Fisheries

The National Marine Fisheries Service (NMFS) does not approve, recommendor endorse any proprietary product or proprietary material mentioned in thispublication. No reference shall be made to NMFS, or to this publication furnished by NMFS, in any advertising or sales promotion which would indicateor imply that NMFS approves, recommends or endorses any proprietaryproduct or proprietary material mentioned herein, or which has as its purposean intent to cause directly or indirectly the advertised product to be used orpurchased because of this NMFS publication.
ii

Contents
Introduction 1
Background 2The OfEC Principle 2Application 3U.S. Legislation 3
Estimated Operating Conditionsfor Initial U.S. OfEC Deployments 4
General Site Characteristics 4Temperature, Salinity and Density Profiles 4Currents 4
General Plant Characteristics 4Type of Plant 4Plant Capacity 4Plant Dimensions 4
Power SystemWorking Fluids 4Heat Exchangers 4Biofouling Control 7Operating Efficiencies 7
Seawater SystemsWarm Water Intake 7Cold Water Intake 7Discharge 7
Physical Interaction with the Environment 8Cold Water Intake 8Warm Water Intake 8Effluent Discharge 8Regional Influence 11
Biological Interaction with the Environment 12Biological Characteristics of the Environment 12
Location 12Phytoplankton 12Zooplankton 13Fisheries 14Eggs and Larvae of Important Species 15Other Important Biological Components 15
Factors that may Affect Fish 16Attraction/Avoidance 16Impingement 17Primary Entrainment 18Temperature 18Pressure 19Chemical Additions 19Secondary Entrainment 20Ocean Water Mixing 20
1Il
The Potential Range of Ecological EffectsResulting from OfEC Operations 21
Impingement 21Primary Entrainment of Plankton 21Secondary Entrainment 22Impacts on Fishery Food Chains 23
Potential Impact on Fisheries 23
Measures to Reduce Potential Effects toFisheries 24
Cold Water Intake 25Warm Water Intake 25Discharge Location and
Configuration 26Chemical Additions 'lJ
Research Priorities 'lJInvestigations on Fish Distribution 'lJStudies on the Effects of Entrainment 'lJBiostimulation/Inhibition 'lJEarly Life History Studies 'lJDynamics of Fishery Populations 28Ciguatera 28Construction Effects 28
Conclusions 28
References 29


The Potential Impact ofOcean Thermal EnergyConversion (OTEC)on Fisheries
EDWARD P. MYERSOcean Minerals and Energy Division,Office of Ocean and Coastal Resource Management,National Ocean Service, NOAA,Page 1 Building, Room 105,2001 Wisconsin Avenue NW,Washington, D. C. 20235
DONALD E. HOSSDAVID S. PETERSSoutheast Fisheries Center,Beaufort Laboratory,National Marine Fisheries Service, NOAA,Beaufort, NC 28516-9722
WALTER M. MATSUMOTOMICHAEL P. SEKIRICHARD N. UCHIDASouthwest Fisheries Center,Honolulu Laboratory,National Marine Fisheries Service, NOAA,2570 Dole Street,Honolulu, HI 96822-2396
JOHN D. DITMARSROBERI' A. PADDOCKEnergy and Environmental Systems DivisionArgonne National LaboratoryArgonne, lL 60439
ABSTRACf
The commercial development of ocean thermal energy conversion (IDEC)operations will involve some environmental perturbations for which there is noprecedent experience. The pumping of very large volumes of warm surface waterand cold deep water and its subsequent discharge will result in the impingement,entrainment, and recmtribution of biota. Additional stresses to biota will be causedby biocide usage and temperature depressions. However, the artificial upwellingof nutrients associated with the pumping of cold deep water, and the artificialreef created by an 0fEC plant may have positive effects on the local environment.
Although more detailed information is needed to assess the net effect of an0fEC operation on fISheries, certain assumptions and calculations are made supporting the conclusion that the potential risk to fisheries is not significant enoughto deter the early development of IDEe. It will be necessary to monitor a commercial-scale plant in order to remove many of the remaining uncertainties.
INTRODUCTION _
Under the Ocean Thermal Energy Conversion (OfEC) Act of 1980,the National Oceanic and Atmospheric Administration (NOAA) wasgiven responsibility for licensing U. S. commercial OfEC operations and determining the potential environmental effects associatedwith this development and operation. NOAA (1982), in an environmental research plan required by the Act, identified two high-priorityresearch areas that could be addressed with the available resources:
1. Determining the region of influence of an OfEC operationon mixing and redistribution of water masses, and
2. predicting the potential effects on fisheries.Research in the first area has resulted in development of a modelto predict the spatial scale and degree of perturbation to ocean waters(Wang 1984). This development responds to a direct licensing requirement of the Act and, in addition, has resulted in informationuseful in the determination of biological effects.
The second area, prediction of potential fishery effects, was considered a high priority because of the commercial and recreationalvalue of fisheries and because of NOAA's responsibilities forfisheries through the National Marine Fisheries Service (NMFS).In fact, in its environmental research plan for OfEC, NOAA (1982)noted that the "Achilles heel, " if any, to OfEC siting and operation could well be the effect on fisheries or other biologically important resources such as corals.
The concern over fisheries is primarily related to the entrainmentand impingement that would result with the pumping of largevolumes of seawater through an OfEC plant, the secondary entrainment caused by the discharge of OfEC waters, the use ofbiocides, and the redistribution of ocean properties (e.g., nutrients,trace metals, heat). The very presence of an OfEC structure mightadd to these factors due to the attraction or avoidance of fish andother biota to OfEC structures. There are other potential problems(NOAA 1981a), e.g., the leakage or spilling of working fluids tothe environment, that are not discussed in any detail in this report.The report has focused on those problems associated with the normal everyday operating conditions of an OfEC plant.
NOAA believed that there was much information available thatwould be useful in making preliminary estimates of OfEC effectson fisheries. This includes information on the oceanographiccharacteristics of marine waters near potential OTEC sites, on thefates and effects of substances such as biocides, trace metals, andnutrients, and on other problem areas such as entrainment and impingement. Some of this available information is rather general,some site-specific, and some related to experiences from the operation of conventional and nuclear power plants.
A synthesis of pertinent information to assess the potential effects on fisheries was initiated in FY 1982 and culminated in thisreport. The effort focuses on the Caribbean and the North Pacific,since these are regions where U.S. OfEC interests have the greatestpotential for development. It also emphasizes the nearshore application of OfEC more than the open-ocean case. The rationale forthis emphasis is that at the present time there appears to be moreinterest in the nearshore application of OfEC, and there is definitelymore reason for concern over the coastal areas as compared to theopen ocean, at least during the early development of OfEC.

BACKGROUND _
The OTEC Principle
Ocean thermal energy conversion (arEC) is a renewable energytechnology which produces power using a heat engine driven bythe temperature difference between warm surface ocean waters andcold deep ocean waters (Gritton et al. 1980). The heat engine cantake the form of a closed-cycle process (Fig. I) which employs aworking fluid (e.g., ammonia or Freon™) which is evaporated bywarm seawater. The expanding gas drives a gas turbine, is thenrecondensed by cold seawater, and the process is repeated. Theopen-cycle process is quite similar to the closed-cycle process, withthe exception that the warm seawater, acting as the working fluid,is flash-evaporated and the resulting vapor passed through a turbine. A big advantage of the open-cycle process is that the condensate can be used as a freshwater source.
There are several possible locations and construction strategiesproposed for arEC plants. The plants could be land-based, bemounted or moored on the continental shelf, or be open-ocean plantships (NOAA 198Ia). A land-based plant would be constructedonshore with the needed warm-water, cold-water, and dischargepipes extending offshore to reach the desired intake and dischargeconditions. A plant mounted on the continental shelf might be similarto an offshore oil rig. A moored plant would be a floating plantthat is moored (anchored) to the seafloor. All of the above designscould be used to supply baseload electricity to existing electricalgrids. A plantship, on the other hand, would be a ship equippedwith an arEC plant and could utilize suitable thermal resourceswherever they existed. The power produced by a plantship couldbe used to produce energy-intensive products such as hydrogen,ammonia, and methanol (Francis and Dugger 1980; NOAA 1981a;Dugger et al. 1982; Avery et al. 1985).
ElectriC PowerOutput
~
Low PressureNH3 Liquid
Low PressureNH3 Vapor
20°CTurbine
Generator
LiquidPressurizer
High PressureNH3 Liquid
............................. .............. .. . . . . . . . . . . . . .......................... .
.+.
WARM WATER INTAKE
Depth: 20 mFlow Rate: 4 m3 /s per MWeFlow Velocities:
Outside intake, 0.25·0.30 m/sIn pipe, 1.5-2.5 m/s
Water Temperature: 25°C
High Pressure
NH3Vapor
MIXED DISCHARGE
Depth: >30 mFlow Rate: 8 m3/s per MWeFlow Velocity 1.5-2.5 m/s
Water Temperature: 15°C
COLD WATER INTAKE
Depth: 750-1000 m
Flow Rate: 4 m3 /s per MWeFlow Velocity: 1.5-2.5 m/s
Water Temperature: 5°C
Figure I.-Schematic diagram of a c1osed-cycle OTEC system. (adapted from U.S. Department of Energy 1979). (Note: Newer designs can achievesomewhat higher temperature changes across the heat exchangers with slightly less flows; Avery 1984).
2

Application
A temperature difference of approximately 20°C is needed to makethe OfEC process sufficiently efficient to be cost-effective (Myersand Ditmars 1985). Such temperature differences exist between theocean surface and depths of about 1000 m in most coastal and openocean areas within about ±20° of the Equator, and in some areasoutside of this band (United Nations 1981). These areas includeapproximately 70 developing nations with an adequate thermalresource (Table 1). Although temperature differences represent onlyone of the various forms of renewable ocean energies (e.g., biomass,waves, tides, currents, salinity gradients), it has been concludedthat this form of ocean energy potential offers much promise bythe year 2000 (United Nations 1981).
Countries that presently have an interest in developing OfECtechnology include the United States, France, Japan, Sweden, andthe Netherlands. The U.S. Department of Energy has supporteddesign studies for a 40 megawatt-electric (MWe) pilot plant thatwould be located at Kahe Point, Oahu, Hawaii. During the conceptual design phase of this work, two closed-cycle designs wereunder development: An artificial island design by Ocean ThermalCorporation (OTC) (1983) that would be located about 550 m offshore, and a tower-mounted concept by General Electric (1983)to be located about 2200 m offshore. The OTC plant was chosenover that of General Electric for the second phase of the projectpreliminary design. The OTC plant would utilize the thermaldischarge from the Hawaiian Electric Company's (HECO) conventional power plant at Kahe Point to supplement the thermal resourceof the ambient seawater. The intake of ambient warm water would
be near the surface at the plant with the intake of cold water further offshore at a depth of about 700 m. Both warm and cold waters,once used, would be discharged as a mixture at a depth of about100 m.
The French government has been performing preliminary studiesrelated to a 5-MWe prototype open-cycle plant in Tahiti. Japanesecompanies have designed, built, and operated a land-based closedcycle 100-kWe plant for the island of Nauru in the North Pacific.Although this demonstration plant has been shut down, there areplans for a 2.5-MWe plant at the same site. Sweden's interest hasprincipally been in building plants or components of plants and selling to developing countries. For instance, they have had discussions with Jamaica for a plant. Certain Dutch companies have similarinterests.
U.S. Legislation
Two legislative acts were passed by Congress in 1980 to facilitatethe commercial development of OfEC: The Ocean ThermalEnergy Conversion Research, Development, and DemonstrationAct; and the Ocean Thermal Energy Conversion Act of 1980. Thepurpose of the OfEC Research, Development, and DemonstrationAct (P.L. 96-310) is to accelerate OfEC technology development;the designated lead agency is the U. S. Department of Energy. Thepurpose of the OfEC Act of 1980 (P.L. 96-320) was to create alegal regime that would facilitate the commercialization of OfECin a manner compatible with the protection of the marine environment and other marine resources; the lead agency is the NationalOceanic and Atmospheric Administration.
Table I. Some developing nations with adequate ocean thermal resources (after United Nations 1981)
Distance from Distance fromAT (0C) resource to AT (OC) resource to
Region/nation Lat. Long. 0-1000 m shore (km) Region/nation Lat. Long. 0-1000 m shore (km)
Africa Latin AmericaAngola 60 S -ISoS II °E -14°E IS-22 65 Bahamas 25°N 77°W-79°W 20-22 15Benin 6°N 3°E -4°E 22-24 50 Barbados 13°N 5soW-600W 22 1-10Congo 4°S _5 0 S 22°E -12°E 20-22 50 Belize 16°N-17°N S7°W-SSoW 22 50Gabon ZON-4°S 9°E -2ZOE 20-22 50 Brazil 4°N-32°S 35°W-55°W 20-24 75Ghana 5°N-6°N 3°W_I oE 22-24 50 Colombia 2°N-12°N 63°W-79°W 20-22 50Guinea 9°N_Il oN 24°W-15°W 20-22 SO Costa Rica SON-12°N S3°W-S5°W 21-22 50Guinea-Bissau II 0N-13°N 15°W-lrW IS-19 60 Cuba 200N-23°N 75°W-S5°W 22-24 IIvory Coast 5°N 3°W-SoW 22-24 30 Dominica 15°N-16°N 61°W-62°W 22 1-10Kenya 2°S -5 0 S 34°E -41 °E 20-21 25 Dominican Republic IsoN-200N 6soW-72°W 21-24 ILiberia 5°N-17°N SOW-23°W 22-24 65 Ecuador 2°N-4°S 79°W-SloW IS-20 50Madagascar 100S -25°S 45°E -500E IS-21 65 EI Salvador 13°N-14°N SrW-90oW 22 65Mozambique 20 0 S -25°S 35°E -400E IS-21 25 French Guiana 4°N-5°N 500W-52°W 22-24 130Nigeria 4°N-6°N 4°E _9°E 22-24 30 Grenada 13°N 61 0W-62°W 27 1-10Rio Muni 2°N-3°N 100E 20-22 30 Guatemala 14°N-17°N SsoW-94°W 22 65Sao Tome and 00N-2°N 7°E _9°E 22 1-10 Guyana 5°N-soN 5SoW-600W 22-24 130
Principe Haiti IsoN-200N 72°W-75°W 21-24 ISenegal 13°N-17°N 16°W-17°W IS 50 Honduras 14°N-16°N S3°W-SSoW 22 65Sierra Leone rN-9°N 12°W-14°W 20-22 100 Jamaica IsoN-19°N 76°W-78°W 22 1-10Somalia lOoN-2°S 41 °E -500E 18-20 25 Lesser Antilles 12°N-18°N 61°W-65°W 22-24 ITogo 6°N 2°E _3°E 22-24 50 Mexico 17°N-22°N 104°W-I08°W 20-22 32United Republic 3°N-4°N 9°E _lO oE 22-24 65 Nicaragua I ION-14°N 84°W-86°W 22 65
of Cameroon Panama SON-9°N 76°W-S3°W 21-22 50United Republic 50 S _lOoS 35°E -400E 20-22 25 St. Lucia 13°N-14°N 61 0W-62°W 22 1-10
of Tanzania St. Vincent and 13°N-14°N 61°W-62°W 22 1-10Zaire 50 S -6 0 S 12°E 20-22 50 the Grenadines
Suriname 4°N-5°N 52°W-58°W 22-24 130Trinidad and lioN 61°W 22-24 10
TobagoVenezuela 8°N-lZOW 600W-73°W 22-24 50U.S. Virgin Islands 18°N 65°W 21-24 I
3

Under its responsibilities of the arEC Act of 1980, NOAA hasissued regulations for licensing commercial arEC plants (NOAA1981 b), an environmental impact statement on the licensing of commercial plants (NOAA 1981a), a technical guidance document onthe environmental requirements of the regulations (NOAA 198Ic),and a research plan for assessing environmental effects that mayaccompany the commercialization of arEC (NOAA 1982).
ESTIMATED OPERATINGCONDITIONS FOR INITIALU.S. OfEC DEPWYMENTS _
This chapter presents preliminary estimates of site characteristicsand operating conditions for early arEC developments. Two areasare so characterized because of the interest for arEC in these areas:The western coast of Oahu, Hawaii, in the vicinity of Kahe Point(Fig. 2); and the southeastern coast of Puerto Rico in the vicinityof Punta Tuna (Fig. 3). Both near/onshore and open-ocean sitesnear Oahu and Puerto Rico are considered in the following description which is primarily based on an evaluation of informationpresented by Bathen (1975, 1977, 1978), EG&G (1980), Miller(1977), Noda et al. (1980), Ocean Data Systems, Inc. (l977a,b),and Wolff (1978).
General Site Characteristics
Temperature, Salinity, and Density Profiles-In the vicinity ofKahe Point, Oahu, Hawaii, the probable surface temperature variesfrom 24.1 °C in late winter to 26.9°C in midsummer. The likelyrange of surface temperatures is generally within 1.2°C of theseprobable values. At a depth of 700 m the probable temperature variesfrom 5.2 to 5.5°C. At a depth of 1000 m the temperature is about4.2°C with very little variation. The thickness of the mixed layertypically varies from as little as 10 m to as much as 180 m; however,the probable thickness of the surface mixed layer varies from 40to 100 m, being deepest during the winter and shallowest in thesummer. The average nearsurface salinity is about 34.8 ppt andincreases to about 35.1 ppt at the bottom of the surface waters (adepth of 100-125 m), and then decreases again to about 34.1 pptat a depth of about 450 m. The density profile is dominated bytemperature, but salinity variation has some effect due to the salinitymaximum occurring near the thermocline (just below the bottomof the surface mixed layer).
In the vicinity of southeastern Puerto Rico the probable surfacetemperature varies from 26.ZOC in winter to 29.ZOC late summerand early fall. The likely range of surface temperatures is generally within ±2.3°C during spring and fall. At a depth of 700 m theprobable temperature is 7.9-8.2°C. At a depth of 1000 m thetemperature is about 5.3 °C with very little variation. The thicknessof the mixed layer typically varies from as little as 10 m to as muchas 140 m; however, the probable thickness of the surface mixedlayer varies from 40 to 100 m, being deeper during the winter andshallower in the summer. The nearsurface salinity is about 35-36ppt and increases to a maximum of about 36.7 ppt at a depth of100-125 m. The salinity minimum is about 35 ppt at a depth of700-900 m.
Currents-The ocean currents near Kahe Point, Oahu, Hawaii, arefairly complex, being a combination of tidal (i .e., depth-averaged,shelf) currents, geostrophic (i.e., upper water column of deep water)
4
flow. and wind-driven (i.e.. surface) currents. The tidal currenthas both a semidiurnal and a diurnal component. The flood-tideis basically parallel to the shore, flowing in the south-southeast direction. The maximum semidiurnal component of the current is about20-30 cm/s while the diurnal component is 10-20 cm/s. Thegeostrophic flow is highly variable and can exceed 60 cm/s in largereddies, although near Kahe Point currents on the order of 15-25cm/s are more typical. The magnitude of wind-driven currents (i.e.,surface) depends on the wind strength, but values of 9-10 cm/s aretypical. Wind-driven currents tend to be shore-parallel near KahePoint.
The currents discussed above are highly variable in magnitudeand direction. The mean flow near Kahe Point is difficult to determine but is estimated to be on the order of or less than 10 cm/s.In shallower areas nearshore, this flow tends to be more shoreparallel. The net flow of the surface waters in the vicinity of Hawaiitends to be westward, being part of the North Pacific EquatorialCurrent.
Ocean currents in the vicinity of southeastern Puerto Rico aregenerally westward flowing due to the South Atlantic Drift, whichis driven by the North Atlantic Trades. The currents tend to followthe bathymetric contours (and thus tend to be shore-parallel) butare highly variable. The mean current is typically 10-40 cm/s inthe deep offshore waters « 1000 m deep) and slightly higher (60cm/s) nearshore.
General Plant Characteristics
Type of Plant-The first arEC plants are expected to be of theclosed-cycle type using ammonia as the working fluid. Smallerplants (of the pilot-plant scale) will probably be located on or nearshore or on bottom-mounted towers in about 100m of water. Largerplants (of commercial scale) will likely be either on bottom-mountedtowers or offshore in the form of moored floating plants or freefloating plantships.
Plant Capacity-arEC plants are expected to be made up of multiple units which can operate independently. A typical pilot plantmight be made up of four to six IO-MWe units, while eventuallyten to twenty 25-MWe units might be typical for commercial plants(W. H. Avery, Director, Ocean Energy Programs, Johns HopkinsUiliv. App!. Physics Lab., Laurel, MD, pers. commun. 1984).
Plant Dimensions-Pilot plants located on or nearshore where spaceis not particularly limited will have horizontal dimensions on theorder of 100 m. Bottom-mounted plants (on towers) will make useof the space along the vertical extent of the tower and thus willhave horizontal dimensions on the order of 50 m. Larger plants(commercial scale) in the open ocean are expected to be 100-150m in diameter for cylindrically symmetric designs and 50-75 m widex 150-200 m long for ship or barge type designs.
Power System
Working Fluids-Most designs for first-generation arEC plantsspecify ammonia as the working fluid. Other fluids that have beenconsidered are noted in Table 2.
Heat Exchangers-Initially heat exchangers will be of aluminumor titanium but eventually other materials may be used. Designs

Kaena .- ----J>f'.Pt.
KilometersL-Jo 5
Figure 2.-The Kahe Point area, Oahu, Hawaii.
1
........-------------------------------------,19°00'N
67°00'
San Juan
PUERTO RICO
PuntaTuna
Figure 3.-The Punta Tuna area, Puerto Rico.
5
Kilometers~
o 10 20
VIEQUESISLAND
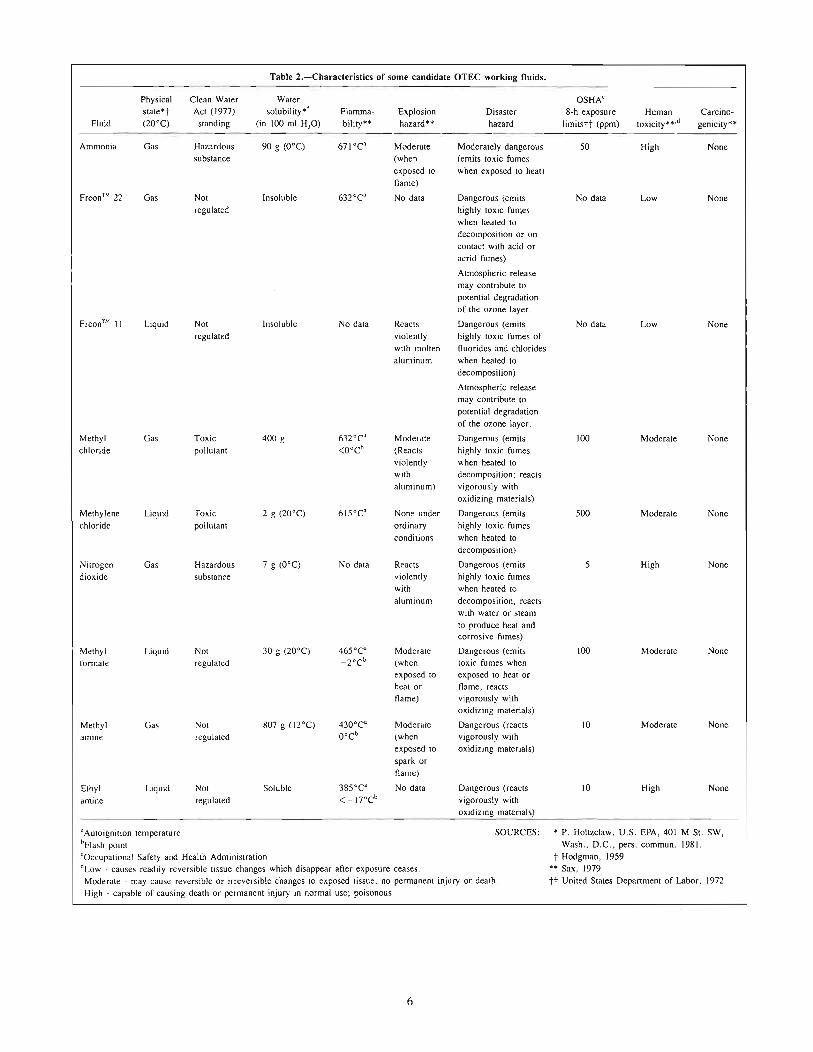
Table 2.-Characleristics of some candidate OTEC working fluids.
Physical Clean Water Water OSHA'state*t Act (1977) solubility*! Flamma- Explosion Disaster 8-h exposure Human Carcino-
Fluid (20°C) standing (in 100 ml HzO) bility** hazard*' hazard limitstt (ppm) toxicity**·d genicity**
Ammonia Gas Hazardous 90 g (O°C) 671°C' Moderate Moderately dangerous 50 High Nonesubstance (when (emits toxic fumes
exposed to when exposed to heat)flame)
Freon™ 22 Gas Not Insoluble 63rC' No data Dangerous (emits No data Low Noneregulated highly toxic fumes
when heated todecomposition or oncontact with acid oracrid fumes)
Atmospheric releasemay contribute topotential degradationof the ozone layer.
Freon™ II Liquid Not InSOluble No data Reacts Dangerous (emits No data Low Noneregulated violently highly toxic fumes of
with molten fluorides and chloridesaluminum when heated to
decomposition)
Atmospheric releasemay contribute topotential degradationof the ozone layer.
Methyl Gas Toxic 400 g 63rC' Mode,ate Dangerous (emits 100 Moderate Nonechloride pollutant <O°Cb (Reacts highly toxic fumes
violently when heated towith decomposition; reactsaluminum) vigorously with
oxidizing materials)
Methylene Liquid Toxic 2 g (20°C) 615°C' None under Dangerous (emits 500 Moderate Nonechloride pollutant ordinary highly toxic fumes
conditions when heated todecomposition)
Nitrogen Gas Hazardous 7 g (O°C) No data Reacts Dangerous (emits 5 High Nonedioxide substance violently highly toxic fumes
with when heated toaluminum decomposition. reacts
with water or steamto produce heat andcorrosive fumes)
Methyl Liquid Not 30 g (20°C) 465°C' Moderate Dangerous (emits 100 Moderate Noneformate regulated -rcb (when toxic fumes when
exposed 10 exposed to heat orheat or name~ reactsflame) vigorously with
oxidizing materials)
Methyl Gas Not 807 g (12°C) 430°C' Moderate Dangerous (reacts 10 Moderate Noneamine regulated O°C' (when vigorously with
exposed to oxidizing materials)spark orflame)
Ethyl Liquid Not Soluble 385°C' No data Dangerous (reacts 10 High Noneamine regulated < _17°C' vigorously with
oxidizing materials)
aAutoignition temperature SOURCES; * P. Holtzclaw. U.S. EPA. 401 M St. SW,'Flash point Wash., D.C .• pers. commun. 1981.'Occupational Safety and Health Administration t Hodgman, 1959dLow - causes readily reversible tissue changes which disappear after exposure ceases. ** Sax, 1979Moderate - may cause reversible or irreversible changes to exposed tissue, no permanent injury or death. tt United States Department of Labor, 1972High - capable of causing death or permanent injury in normal use; poisonous
6

suitable for afEC applications involving tube-in-shell, plate types,and folded tube heat exchangers have been successfully tested atsmall scale under afEC conditions (Avery, pers. comrnun. 1984).
Biofouling Control-Most designs will use periodic (daily) chlorination for biofouling control. Some designs also plan to use mechanical cleaning methods, such as AmertapTM balls or M.A.N.™brushes, in conjunction with chlorination. The dose of chlorineneeded to prevent biofouling will be somewhat dependent on sitespecific characteristics; however, recent studies suggest doses onthe order of 0.07 mglL (70 ppb) injected I hourlday may be sufficient (Larsen-Basse and Daniel 1983).
Operating Efficiencies-Overall thermal operating efficiencies formost afEC plants are expected to be in the 2-3% range. However,certain pilot-plant designs use larger than normal warm-water flowrates to take advantage of less expensive heat exchangers. Suchdesigns will have efficiencies in the 1.0-1.5 % range.
The thermal efficiency is the fraction (usually expressed as a percent) of the heat energy extracted from the warm water that is converted into net electrical energy. For normal afEC operatingtemperatures, this efficiency is limited to 6.0-7.5% by the basiclaws ofthermodynamics. Therefore, a more useful quantity mightbe the "effectiveness" of the plant which is the ratio of the netelectrical power available for external use to the gross power produced by the turbo-generator system. This ratio is 65 to 75 % fortypical designs (increases rapidly with delta-T) and may fall to 35 %for shore-based sites where the needed cold-water pipe lengths require higher pumping power (Avery, pers. commun. 1984).
Seawater Systems
Warm Water Intake
Depth and location-The warm-water intake will be located in theupper part of the surface mixed layer of the ocean to take advantage of the warmest water available. Intakes for pilot plants willbe about 10 m deep, while intakes for larger commercial plantswill have to be about 20 m deep due to the larger intake flow-raterequirements.
Shape and orientation-The intake structure will generally be constructed to produce horizontal flows external to the structure becauseit appears that fish can sense and avoid horizontal flows better thanvertical flows (see Impingement section). The structure will alsobe much larger in the horizontal direction than in the vertical direction to keep intake velocities low and yet keep the structure nearsurface where the warmest water is located.
Flow rates and intake velocities-Typical warm-water flow ratesfor OTEC designs are in the range of 3-5 m3 ·s-I.MWe- l .
However, flow rates as high as 8.5 m3 ·s- l • MWe- 1 are proposedfor plants intending to trade larger flow rates for less expensiveheat exchangers. Flow velocities in the warm-water pipes and conduits will generally be in the 1.5-2.5 mls range, but intakes areexpected to be designed to reduce the velocity to 0.25-0.30 mlsoutside the intake structure. The low intake velocities can lead torather large intake area requirements for large (loo-MWe) plants.
7
Cold Water Intake
Depth and location-The cold-water intake for most afEC designswill be at the end of a long pipe extending to a depth of 750-1000m. The selection of the depth at which the cold water will bewithdrawn is the result of a trade-off between the efficiency gainedby colder temperatures and the added expense of constructing andoperating a longer cold-water pipe.
Shape and orientation-Because the cold-water intake will belocated in an area of low biological activity, little effort has goneinto design of the intake structure; most likely, it will be an openended pipe with bar screens placed to keep out relatively largeobjects.
Row rates and intake velocity-Typical afEC designs call for coldwater flow rates comparable to the warm-water flow rate, in therange of 3-5 m3 ·s-I.MWe- 1• However, some designs try toreduce the cold-water requirements because of the expense of obtaining water from such depths. Flow velocities in the cold-waterpipe will generally be in the 1.5-2.5 mls range. Intake velocitiesmay be of this same order because it is generally thought that thereis no need to reduce the intake velocity at the great depths involved.However, lower intake velocities can be achieved, if needed, byuse of a flared pipe section. Ocean Thermal Corporation will usesuch a section to reduce the cold-water intake speed to 0.3 mls forthe Kahe Point design.
Discharge
Depth and location-Most afEC designs will try to locate thedischarge so as to reduce the potential for recirculation of effluentinto the warm-water intake. Although this may be accomplishedthrough either separate or mixed effluent discharges, most designsdepend on the density of the effluent being greater than the densitywithin the mixed layer so that the effluent will come to equilibriumnear the bottom of the mixed layer, out of the influence of the intake. For nearshore plants this may involve the use of a dischargepipe leading offshore. In deeper waters it is anticipated that thedischarge will generally be located at a depth of 30 m or greaterto avoid recirculation.
It is expected that the temperature of the warm water and coldwater will decrease about 2-3°C during passage through the heatexchangers. For representative warm and cold waters of 25°C and5°C, respectively, temperatures of separate warm and colddischarges would then be about 22-23°C and 7-8°C, respectively.For this situation, a mixed discharge would have a temperature near15°C.
Shape and orientation-Most proposed designs do not involve theuse of any special discharge structures such as multiport diffusers(see Effluent Discharge section). Thus, the discharges will be fromopen-ended round pipes directed either downward or horizontally(often with a downward component).
Row rates and discharge velocity-Discharge flow rates must equalintake flow rates due to continuity. Typically, discharge velocitieswill be in the 1.5-2.5 mls range.
PHYSICAL INTERACTIONWITH THE ENVIRONMENT _
The presence of an OfEC plant will cause a physical interactionwith the marine environment. However, with the exception of somesmall modification of water movement in the immediate vicinityof a plant, the principal physical interaction will be due to the intake and discharge of the relatively large volumes of water neededfor an OfEC operation. These topics are discussed in this sectionsince they are so important to the definition of biological interactiontaken up in the later section on Biological Interaction.
Cold Water Intake
The cold water intake provides the cold water needed for the condensing part of the OfEC cycle. Given a certain surface temperature, a cold water pipe (CWP) will have to be extended deep enoughto obtain cold water at a temperature low enough to assure atemperature difference (liT) of about 20°C. Certain engineeringconstraints will be present, however, in obtaining the cold water,e.g., the large pipe diameters and depths required for bottornmounted pipe installations both exceed the demonstrated capability of the offshore pipe laying industry (Brewer 1979). However,it is believed that these problems may be overcome with a minimumextension of present technology. The CWP may either be
1. emplaced on a shelf, extending to the needed depth for a landbased OfEC plant;
2. placed vertically within the structure of a shelf-sitting towerto the needed depth, or to the seabed and then extended on the shelfto the needed depth; or
3. placed vertically to the required depth beneath an open oceanplantship.
To obtain a liT of about 20°C, the CWP intake will need to belocated at a depth of about 800-1000 m in most locations. At thisdepth the induced flow will not interact with other intake anddischarge flow fields, and the interaction with the environment willdepend primarily on the volumetric flow rate (Paddock and Ditmars 1983). Therefore, the intake depth, volumetric withdrawalrate, and velocity are the three principal variables that will definethe interaction.
Warm Water Intake
Like the need for cold water, a relatively large volumetric rate ofwarm water is needed for the evaporation part of the OfEC cycle(see section on Flow Rates and Intake Velocities).
In general, the warm water intake will draw water from a rangeof depths, dependent upon the ambient density stratification in thevicinity of the intake, the flow rate at which water is withdrawn,and the size and shape of the intake structure (Paddock and Ditmars1983). The volumetric flow rate at which water will be withdrawnwill depend, among other factors, on thermodynamic needs of thepower cycle and the efficiencies of the heat exchangers. Once thevolumetric flow rate is established, however, a trade-off is involvedbetween the intake dimension and the velocity of the flow-the lessthe intake dimensions, the greater the intake velocity and vice versa.For example, consider the intake of 140 m3/s of warm water fora 40-MWe OfEC plant (i.e., 3.5 m3 . S-I. MWe- I). Using an intake pipe of 34 m diameter would result in an intake velocity of15 cm/s, whereas an intake pipe of 17 m would impart an intake
8
velocity of 62 cm/s. Using an intake pipe of 10 m diameter wouldresult in an intake velocity of 178 cm/s for which the power lossdue to friction would be small, whereas an intake diameter of 5m would entail a velocity of 713 cm/s which would cause an unacceptable friction loss (Avery, pers. commun. 1984).
The effect of the warm water intake on the flow field in the vicinityof the intake structure will also be dependent upon a number offactors. To provide an idea of the possibilities, three induced flowpatterns are indicated in Figure 4 for three simplified hypotheticalintake situations:
1. Intake flow field in the presence of an ambient current foran intake distributed uniformly over the mixed layer where the density is constant above and below a strong thermocline (Fig. 4a);
2. intake flow field in the presence of an ambient current fora point intake within the mixed layer, again where the density isconstant above and below the thermocline (Fig. 4b); and
3. intake flow field for a point intake in a stagnant, linearlystratified environment (Fig. 4c).These hypothetical scenarios provide an indication of the varietyof cases that will determine where seawater and organisms arewithdrawn. The quantification of the pertinent variables for suchcases has been discussed by Paddock and Ditmars (1983).
Most ocean environments exhibit some variations of seawater density vvith depth (i.e., density stratification) such as shown in Figures5 and 6 for Kahe Point and Punla Tuna, respectively. In the caseof intake withdrawal from a density-stratified environment, selective withdrawal occurs. Selective withdrawal involves the flow ofwater from discrete layers centered about the elevation of the intake as shown in Figure 4c. The thickness of the layer withdrawn(0) is inversely proportional to the degree of stratification, so thatthinner layers will be withdrawn when strong stratification ispresent.
Effluent Discharge
The discharge of used warm and cold OfEC waters may be eitherseparate or mixed. Additionally, a discharge could be through asingle discharge pipe, through a number of discharge pipes if thedimensions of a single discharge structure became unrealistic, orthrough a multiple port diffuser. Multiple port diffusers are commonly used for the discharge of municipal waste to ocean waters(Koh 1983) and have been considered in hydraulic studies of OfECdischarges. Although multiple port diffusers could ensure a greaterdegree of dilution of an OfEC effluent, it is not obvious that thisis the desired objective, as discussed below. Furthermore, problemswith construction, head losses, and additional pump requirementsmight outweigh possible advantages of a multiple port diffuser, tosay nothing of additional biological concerns over the greater volumeof dilution water needed.
A separate discharge scheme would involve separate dischargesfor both the warm and cold waters, whereas a mixed dischargescheme would utilize the same discharge structure for both watertypes. Although the initial physical fates of the discharged waterwould vary according to the scheme employed, the physics thatdefine these fates are the same for both cases and relate to thebehavior of buoyant discharges.
The behavior of positively or negatively buoyant discharges hasbeen studied analytically as well as through the use of physicalmodels. Initially these studies were conducted to evaluate thebehavior of cooling water discharges from conventional power plantsand of effluents from sewage outfalls; recently such studies have

T. "C (e)
0 5 10 15 20 25 30.__~--,------..J
0T (0)
22 23 24 25 26 27 280 22.72
- 22.97100
200
300
::'j; 400:if-a..
500LU0
600
700
800
900 -27.43II
1000 I
'-{-L~ --___
a
d-,;:-------__-
p
Figure S.-One temperature and density profile offshore Kahe Point, Oahu,Hawaii (from Noda et aI. 1981a; site 1, cast 1, 6 November 1980).
T. "C (e)
0 5 10 15 20 25 30L--I
0T (0)
22 23 24 25 26 27 280 23.17-
100
200
300
400::'j;
I-f- 500a..LU0
600
700
800
900
1000 -27.77
b
c
Figure 4.-a. Schematic of the intake flow field in the presence of an ambientcurrent for an intake distributed uniformly over the mixed layer (from Paddockand Ditmars 1983). b. Schematic of the intake flow field in the presence of anambient current for a point intake within the mixed layer (from Paddock andDitmars 1983). c. Schematic of the intake flow field for a point intake in a stagnant, linearly-stratified environment (from Paddock and Ditmars 1983).
Figure 6.-0ne temperature and density profile offshore Punta Tuna, Puerto Rico (from Vargo et a!. 1981; daycast, PROTEC-13).
9

been applied to arEC discharges (Allender et al. 1978; Ditmars1979; Ditmars and Paddock 1979). Although details of suchassessments may be quite complex and dependent upon site-specificfactors, generalities can be made for certain simplified situations(Paddock and Ditmars 1983). As discussed by Paddock and Ditmars, different phenomena govern the different regions of the flowthat develop, termed the near-field, intermediate-field, and far-field(Figs. 7, 8). Momentum and buoyancy dominate in the near-field,gravity and interfacial shear in the intermediate field, and advective and dispersive mechanisms in the far field.
The important parameters about the near-field region are primarilythe depth where the discharge plume reaches neutral buoyancy(equilibrium depth), the average dilution achieved by the dischargeplume upon reaching the equilibrium depth (initial dilution), andthe trajectory from the point of discharge to the equilibrium depth.Paddock and Ditmars (1983) present methods for quickly estimatingthese parameters for simplified situations. As an example, considerthe discharge from 40-MWe hypothetical arEC plants located offshore of (1) Kahe Point, Oahu, Hawaii, and (2) Punta Tuna, PuertoRico. The plants pump 140 m3/s of both cold and warm water fora total flow and discharge of 280 m3/s. Four cases are consideredto give an indication of the range of behavior that might be expected:
I. Separate horizontal round discharges to nearsurface waters(20 m);
2. separate horizontal round discharges at depth (100 m);3. mixed horizontal round discharge to nearsurface waters (20
m); and4. mixed horizontal round discharge at depth (100 m).
For all four cases, it is assumed that stagnant conditions prevail,the density profiles of Figures 5 and 6 apply, and the intake watersare from 20 m and 1000 m with the following ambient properties:
SalinityTemp. (0C) (ppt) 0,
Kahe PointWarm Water 26.6 34.9 22.8Cold Water 3.8 34.5 27.4
Punta TunaWarm water 27.7 36.0 23.3Cold Water 5.4 35.2 27.8
It is also assumed that the warm water will undergo a temperaturedrop of 2°C and that the cold water will undergo a temperatureincrease of 2°C. Based on tables of seawater density in Fischeret al. (1979), these temperature changes would produce sigma-t's(a,) of approximately 23.4 for the warm water side and 27.2 forthe cold water side at Kahe Point, and 23.9 for the warm waterside and 27.5 for the cold water side at Punta Tuna. All dischargesare made through lO-m diameter pipes, whether separate or mixed.For the case of mixed discharges, the discharge velocity is keptconstant at 1.8 m/s by using two IO-m diameter pipes. It is assumedthat the discharges do not interfere with each other. Using the approximation methods of Paddock and Ditmars (1983) leads to thefollowing results.
I------++Intermediate Field-+- Far Field -----
J- Cold-Water Intake
Figure 7.-Typical discharge flow field for an OTEC plant located in deep water (from Paddock andDitmars 1983).
10
Figure 8.-Typical discharge flow field for an OTECplant located in shallow water showing flow along thebottom (from Paddock and Ditmars 1983).

Regional Influence
Warm 30 4Cold 55 5.5
Warm 75 5Cold 160 7
Mixed 45 4.5
Mixed 115
Level of neutralDischarge buoyancy, m Dilution
Warm 50 6.5Cold 80 7
Warm 95 4
Cold 145 6
Mixed 75 6.5
Mixed 120 4.5
Kahe PointSeparate to nearsurface
(20 m)
Separate to depth(l00 m)
Mixed to nearsurface(20 m)
Mixed at depth(l00 m)
Punta Tuna:Separate to nearsurface
(20 m)
Separate to depth(100 m)
Mixed to nearsurface(20 m)
Mixed at depth(l00 m)
Although the above results are only rough approximations, theyprovide insights that are useful for defining physical interaction withthe environment. In general, it can be seen that initial dilution forafEC discharges will be in the range of about 1 to 10. The strongeffect of density stratification is also apparent and suggests thatwherever an afEC discharge plume encounters a strong densitygradient, its further vertical motion will be limited. Not only dostrong density gradients arrest a plume's trajectory, they also limitthe amount of dilution that can be achieved. The presence of currents would act to lengthen the trajectory of the discharge plumeand increase the dilution achieved; accordingly, the depth of neutralbuoyancy of an effluent plume might be somewhat less for anegatively buoyant discharge.
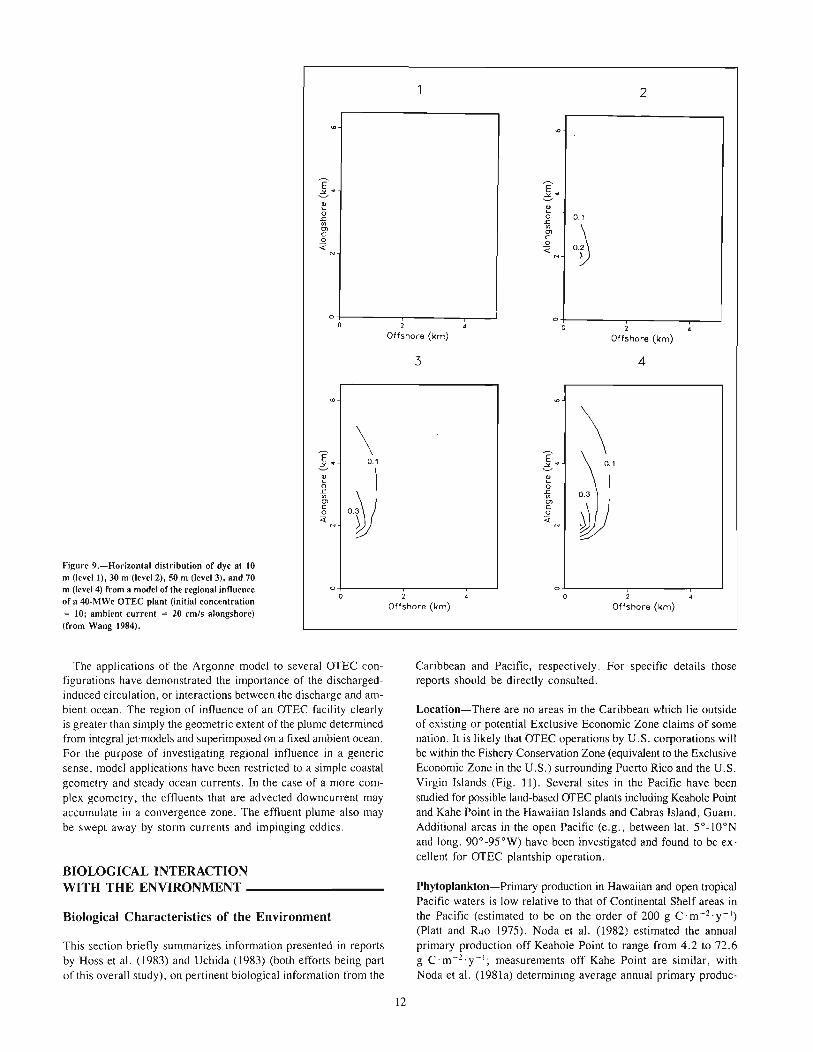
Using approximation methods discussed by Paddock and Ditmars(1983), it can be shown that the above initial dilutions and levelsof neutral buoyancy will occur in a time frame on the order of aminute. Referring back to Figures 7 and 8, it can then be inferredthat the intermediate and far field processes will have a greater influence on regional environmental impacts. Examining a hypothetical40-MWe afEC plant in typical tropical ocean conditions, Jirkaet al. (1980) analyzed the spreading of a mixed discharge plumein a density stratified environment. The results indicated the effluent plume to be about 10 m thick and 5 km wide. This size iscomparable with island shelf areas and warrants an analysis of theregional environmental influence of even a small afEC plant.
Aware that the regional influence of an afEC operation couldbe considerable, NOAA initiated a research effort in 1982 withArgonne National Laboratory to develop a model that could definethis influence. To come to an understanding of the influence, adescription was needed of the physical processes associated withthe discharge of large volumes of water into the upper ocean byafEC plant operations. The approach taken departed from previousmathematical modeling investigations of afEC plant interactionswith the ocean environment. In previous modeling, effluent plumesand intake flows have been superimposed on fixed ambient oceanwaters; that is, no attempt was made to model changes in the oceanresulting from their presence. The Argonne model simulates the
II
interaction of an afEC discharge with the ocean, thereby permitting discharge-induced modifications to the ambient ocean to bedetermined. Changes in ambient circulation, temperature structure,and concentration of effluent and water column constituents aremodeled. The general approach was to modify an existing threedimensional model for limited-area coastal regions (Wang 1982)by incorporating simulations of the effluent flows due to an OTECoperation. The effect of the intake flow was found to be minimaland thus is not included in the model.
The Argonne model was applied to a base case of a 280 m3/smixed discharge from a 40-MWe afEC plant into coastal watersfor various ambient ocean conditions, and then was used to examinethe effect of two nearby 40-MWe plants and that of an 80-MWeplant. Applied to the case of a mixed discharge from a 40-MWeafEC plant located in deep water on a coastal margin, the Argonnemodel indicated the effluent plume will be confined mostly to thetop of the thermocline. In the case of an ambient alongshore current of 20 cm/s, the addition of a conservative dye to the dischargeindicated the effluent plume to be about 20 m thick, 2 km wide,and 4 km long (Fig. 9), and diluted by a factor of20-100. Becausethe plume is mainly driven by the buoyant discharge, the regionalinfluence does not depend on the details of the mode of discharge(e.g., single or multiple outlet discharge). Temperature perturbations are caused by the dilution of the effluent and by the redistribution of ambient temperature structure. For a 40-MWe afEC plantdischarge, temperature perturbations are less than 0.2 °C and aredistributed almost uniformly between the bottom of the mixed layerand the top of the thermocline.
The circulation induced by interaction of the buoyant dischargeand the ocean not only influences plume dilution and temperaturestructure but also contributes to the redistribution of other oceanconstituents. A computation of a nitrate profile subjected to onlythe physical (conservative) aspects of afEC operation indicatedthat the nitrate flux into the upper ocean is derived both from themixed-discharge effluent (i.e., cold water influence) and fromdischarge-induced deep upwelling. For a base condition where thenitrate level is very little in the upper 90 m and increases to somehigher level in the depth interval of 90-130 m, the two processescontribute about equal amounts of the afEC-induced nitrate fluxinto the upper ocean.
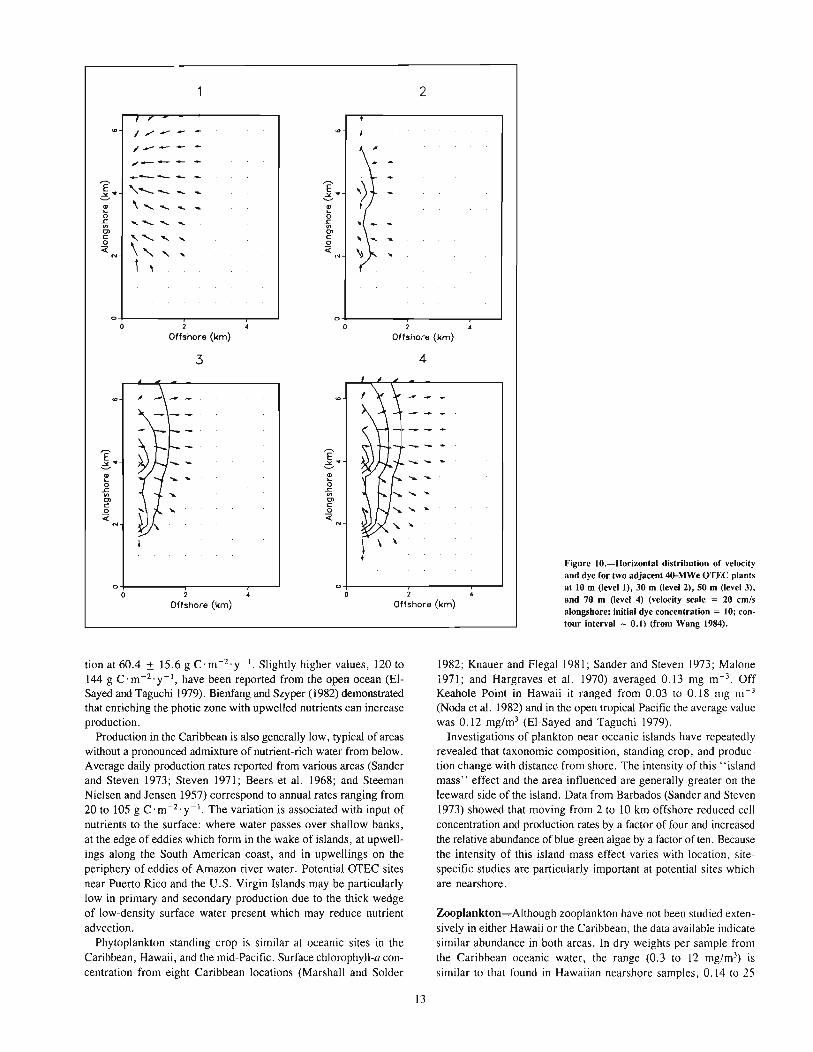
Using the Argonne model to examine the effects of dischargesof two adjacent afEC plants showed that the regional influencemay be computed as a superposition of two individual plumes, givenreasonable separation between plants. When two 40-MWe afECplants are separated by 2 km alongshore, the effluent concentration near the up-current plant is about the same as the effluent concentration of a 40-MWe afEC single plant, where the effluent concentration near the down-current plant is increased by about 25 %(Fig. 10). When two plants are separated by only a few hundredmeters, which is equivalent to the case of a single 80-MWe afECplant, significant interaction occurs and the effluent concentrationis increased by about 100% from that of a single 40-MWe afECplant.
The regional influence is not very sensitive to the effects of thecoastal boundary. On the other hand. the dilution of the effluentplume is greatly reduced for effluents discharged in shallow wateror along the bottom. For a 40-MWe afEC plant with bottomdischarge, the maximum effluent concentration will be about 10%of the initial concentration, which is about twice the maximum concentration of the effluent plume from the nearsurface discharge.The plume also penetrates deeper into the thermocline than in thecase of nearsurface discharge.
E E0" 0"~ ~0
.<: 0 0.1Vl .<:0> Vl
o~C 0>
0 C
« 0«
2
E0"~o
.<:Vl0>Co«
\\
0.1
o~
02 0 2
Offshore (km) Offshore (km)
3 4
E \0" 0.1
~
W0
.<:Vl0>C0«
Figure 9.-Horizontal distribution of dye at 10m (level 1),30 m (level 2), SO m (level 3), and 70m (level 4) from a model of the regional innuenceof a 4O-MWe OTEC plant (initial concentration= 10; ambient current = 20 cm/s alongshore)(from Wang 1984).
2
Offshore (km)o 2
Offshore (km)
The applications of the Argonne model to several OTEC configurations have demonstrated the importance of the dischargedinduced circulation, or interactions between the discharge and ambient ocean. The region of influence of an OfEC facility clearlyis greater than simply the geometric extent of the plume detenninedfrom integral jet models and superimposed on a fixed ambient ocean.For the purpose of investigating regional influence in a genericsense, model applications have been restricted to a simple coastalgeometry and steady ocean currents. In the case of a more complex geometry, the effluents that are advected downcurrent mayaccumulate in a convergence zone. The effluent plume also maybe swept away by storm currents and impinging eddies.
BIOLOGICAL INTERACTIONWITH THE ENVIRONMENT _
Biological Characteristics of the Environment
This section briefly summarizes information presented in reportsby Hoss et al. (1983) and Uchida (1983) (both efforts being partof this overall study), on pertinent biological information from the
Caribbean and Pacific, respectively. For specific details thosereports should be directly consulted.
Location-There are no areas in the Caribbean which lie outsideof existing or potential Exclusive Economic Zone claims of somenation. It is likely that OfEC operations by U.S. corporations willbe within the Fishery Conservation Zone (equivalent to the ExclusiveEconomic Zone in the U.S.) surrounding Puerto Rico and the U.S.Virgin Islands (Fig. 11). Several sites in the Pacific have beenstudied for possible land-based OfEC plants including Keahole Pointand Kahe Point in the Hawaiian Islands and Cabras Island, Guam.Additional areas in the open Pacific (e.g., between lat. 5 0 _W O Nand long. 90 0 -95°W) have been investigated and found to be excellent for OfEC plantship operation.
Phytoplankton-Primary production in Hawaiian and open tropicalPacific waters is low relative to that of Continental Shelf areas inthe Pacific (estimated to be on the order of 200 g C·m-2 .y-')(Platt and Rao 1975). Noda et al. (1982) estimated the annualprimary production off Keahole Point to range from 4.2 to 72.6g C·m-2 .y-'; measurements off Kahe Point are similar, withNoda et al. (1981 a) determining average annual primary produc-
12
2
, ,I" .-
; ---""-----E ,-- E
e-'" , ............. e-'".,~....
0 0.c ......... ...... .cIII III0> 0>l: " "- ... l:0 \, 0<{ , .. <{ ..
1 ,
Ee-'"~o.cIII0>l:o<{
o
o
2 4
Offshore (km)
3
2Offshore (km)
I~~o.cIII0>l:o<{
o 2
Offshore (km)
4
2 4
Offshore (km)
Figure to.-Horizontal distribution of velocityand dye for two adjacent 4O-MWe OTEC plantsat 10 m (level 1), 30 m (level 2), SO m (level 3),and 70 m (level 4) (velocity scale = 20 cm/salongshore; initial dye concentration = 10; contour interval = 0.1) (from Wang 1984).
tion at 60.4 ± 15.6 g C' m-2. y-I. Slightly higher values, 120 to144 g C'm-2 'y-l, have been reported from the open ocean (EISayed and Taguchi 1979). Bienfang and Szyper (1982) demonstratedthat enriching the photic zone with upwelled nutrients can increaseproduction.
Production in the Caribbean is also generally low, typical of areaswithout a pronounced admixture of nutrient-rich water from below.Average daily production rates reported from various areas (Sanderand Steven 1973; Steven 1971; Beers et al. 1968; and SteemanNielsen and Jensen 1957) correspond to annual rates ranging from20 to 105 g C' m-2 . r I. The variation is associated with input ofnutrients to the surface: where water passes over shallow banks,at the edge of eddies which form in the wake of islands, at upwellings along the South American coast, and in upwellings on theperiphery of eddies of Amazon river water. Potential OfEC sitesnear Puerto Rico and the U.S. Virgin Islands may be particularlylow in primary and secondary production due to the thick wedgeof low-density surface water present which may reduce nutrientadvection.
Phytoplankton standing crop is similar at oceanic sites in theCaribbean, Hawaii, and the mid-Pacific. Surface chlorophyll-a concentration from eight Caribbean locations (Marshall and Solder
13
1982; Knauer and Flegal 1981; Sander and Steven 1973; Malone1971; and Hargraves et al. 1970) averaged 0.13 mg m- 3. OffKeahole Point in Hawaii it ranged from 0.03 to 0.18 mg m- 3
(Noda et al. 1982) and in the open tropical Pacific the average valuewas 0.12 mg/m3 (EI-Sayed and Taguchi 1979).
Investigations of plankton near oceanic islands have repeatedlyrevealed that taxonomic composition, standing crop, and production change with distance from shore. The intensity of this "islandmass" effect and the area influenced are generally greater on theleeward side of the island. Data from Barbados (Sander and Steven1973) showed that moving from 2 to 10 km offshore reduced cellconcentration and production rates by a factor of four and increasedthe relative abundance of blue-green algae by a factor often. Becausethe intensity of this island mass effect varies with location, sitespecific studies are particularly important at potential sites whichare nearshore.
Zooplankton~Althoughzooplankton have not been studied extensively in either Hawaii or the Caribbean, the data available indicatesimilar abundance in both areas. In dry weights per sample fromthe Caribbean oceanic water, the range (0.3 to 12 mg/m3) issimilar to that found in Hawaiian nearshore samples, 0.14 to 25

PUERTO RICOand the
U.S VIRGIN ISLANDSMARITIME REGia
22"N
20"
18"
- 16"
Q
54"W66"68 •
Cl>C,.. .-
~-JCl> _
~ c"' Cl>u: E.Cl>
"? ~::>2
cUJ
Figure H.-The Fishery Conservation Zone surroundingPuerto Rico and the U.S. Virgin Islands (U.S. Departmentof State 1982).
mg/m) (Noda et al. 198Ia). The average displacement volume,0.20 to 0.30 ml/m3, and average dry weight, 2.4-3.3 mg/m3 , arevery similar among oceanic studies from the Caribbean (Moore andSander 1977; Deevey 1971; Margalef 1971; and Moore 1967). Theimportance of an island effect on zooplankton abundance is evident from studies near Jamaica and Barbados where respective dryweights inshore were 1.7 and 2.5 times those found offshore (Sanderand Steven 1973; Moore 1967).
Abundance of zooplankton decreases considerably with depth.Off Bermuda, total abundance in the upper 500 m was 8, 19, and39 times that found at respective depths of 500-1000 m, 1000-1500m, and 1500-2000 m (Deevey and Brooks 1971). In the mid-Pacific,Hirota (1977) showed the highest concentration in the upper 150m and moderately high concentration between 200 and 900 m. Standing stocks in the upper 200 m varied about 50-90% of that in theupper 1000 m. Off of Kahe Point in Hawaii, Noda et al. (198Ia)observed an approximate tenfold difference between surface samplesand those from 600-1000 m.
Although diel migration of zooplankton has been observed butnot extensively documented in Hawaii and the Caribbean, thephenomenon is general and fairly well known. "Diel verticalmovements occur in all planktonic phyla and in most of the smallertaxonomic groups" (Longhurst 1976). In general this consists ofa migration from deep water toward nearsurface layers. whereplankton spend the night and then descend again at dawn. Theplankters do not necessarily rise all the way to the surface; aggregations tend to occur at the level of the deep chlorophyll maximum,and abundance in the surface water may even decrease during thenight as a result of downward migration of surface zooplanktersto the chlorophyll maximum layer.
Fisheries-The major thrust of the commercial fishery in Hawaiiis in the open ocean beyond 200 m in depth, where pole-and-linesampans catch skipjack tuna; and longline, handline, and charterboats harvest yellowfin and bigeye tuna, albacore, striped blue andblack marlin, swordfish, spearfish, sailfish, wahoo, and mahimahi.Nearshore fisheries include a variety of commercial handline, net,trap, and recreational boats which catch a wide variety of demersal and bathypelagic species including pink, red, and grey snappers. goatfishes, seabass, and bigeye and mackeral scad. The scadlandings are of considerable importance, being second only to tunaand billfishes.
The area near Kahe Point sustains a varied and valuable fishery.In the years from 1976 to 1980. 101 different species were identified in the harvest from the area. Hawaii Division of AquaticResources records show that the average annual catch was about219 metric tons with an annual yield to commercial fishermen of$350,000.
The commercial fishery in the oceanic waters of the Caribbeanis basically a long-line fishery for tunas. The fishery is dominatedby large modem vessels from Japan, Korea, Taiwan, and Venezuela.
The commercial fishery in nearshore waters can be described interms of several main components which overlap slightly. The mostimportant of these, both in weight and value, is the demersal fishescomponent, in which fish pots and hand lines are used to catchshallow reef species and deep-water snappers and groupers. Thiscomponent of the fishery accounts for about 70% of the catch inPuerto Rico and 53% of its value. The second component of thefishery is for coastal pelagic fishes, using troll lines, beach seines,and gill nets; this component accounts for about 21 % of the totalcatch and 16% of its value in Puerto Rico. Shellfish, the third com-
14

ponent, accounts for only about 15 % of the Puerto Rico catch butabout 30% of its value. Spiny lobster landings are over 50% ofthe shellfish catch, yet 70% of its value; the other major shellfishspecies is the queen conch.
Although the economic importance of the recreational fishery hasnot been evaluated, it is of considerable importance to the tourismindustry and the local residents. Its importance in Puerto Rico isreflected in a catch of 1,361 blue and white marlin and sailfish fromMay 1977 to April 1978, about half of which were caught by vesselsfrom outside the area. Other species for which the area is knownare yellowfin tuna, wahoo, bonefish, some of the larger reef species,and billfishes. Billfishes are already overexploited in the Atlantic,so the future of that recreational fishery is uncertain.
Eggs and Larvae of Important Species-Data on abundance anddistribution of the early life stages of important species is ratherscant; thus, it is difficult to make a general comparison of larvaefrom Hawaii and the Caribbean. Based on reproductive stages ofadult fish in the Caribbean (Munro et al. 1973), it appears that reeffish eggs and larvae will be most abundant during February throughApril. However, the eggs and larvae of tuna and billfishes will bemost abundant during the summer, with some species present atlower numbers in spring and fall (Matsumoto et al. 1984; Uchida1981 ; Yoshida 1979; Shomura and Williams 1975; Miller et al.1979; Idyll and deSylva 1963).
Spatial distribution of larvae is quite complicated depending onboth the reproductive habits of the fish and water movement in andnear the spawning area. Most of the important reef species havepelagic eggs and appear to be spawned at times and locations wherethe eggs will be quickly moved offshore to areas where predatorsmay be less abundant. This pattern has been substantiated in Hawaiiby Leis (1982) who found reef fish eggs were more abundant 3.0Ian from shore than 0.2 Ian out, and Miller (1974) who reportedlarvae of some fish were more abundant 50 Ian off Oahu than 5Ian out. Dekhnik et al. (1973) found the same larval pattern offCuba and several studies have shown the same pattern with fisheggs at other Caribbean sites (Moore 1967; Sander and Steven 1973;Moore and Sander 1976). Larval distribution of pelagic species maybe much different. Miller et al. (1979) reported tuna larvae weremuch more abundant nearshore and on the leeward rather than windward coast. It appears likely that high surface densities of larvaeare produced by wind-driven upwelling of layers of water containing fairly dense larval concentrations.
Comparing absolute abundance of larvae between areas is particularly difficult because various investigators use different techniques, including sampling at different depths, and because thesamples display considerable variability. The larval abundance ofoceanic species in the Caribbean (Richards 1981), however, appears similar to that in the eastern tropical Pacific (Ahlstrom 1971,1972). The Caribbean may have a more diverse assemblage with15 families accounting for about 70% of the larvae (Richards 1984)in comparison to the Pacific, where 10 families constituted 90%of the larvae. It is likely that in both regions the larvae are mostabundant nearsurface. In the mid-Pacific, Hirota (1977) found:
1) that the larvae of commercially important tuna occur moreabundantly in the neuston layer than from 1-200 m,
2) the species in the 1-200 m layer are primarily midwater forms,and
3) very few larval fish occur between 200-1000 m.Off Puerto Rico the vertical trend is similar with few fish below200 m and the highest number between 0 and 25 m (Vargo et al.1981).
15
Other Important Biological Components-Other biological components such as coral reefs, mangroves, and sea grass beds are allvery important habitat types for numerous fishery resources, at leastduring some portion of the individual species' life cycle. Impactson such fishery habitats may be of greater importance than directimpact on the species themselves (eggs, larvae, adults), particularly for near/onshore OTEC sites (1. Naughton, Southw. RegionWest. Pacific Program Staff, Natl. Mar. Fish. Serv., NOAA,Honolulu, HI, pers. commun. 1984). In addition, the destructionof coral reefs can sometimes lead to an increase in the incidenceof ciguatera poisoning, caused by the ingestion of fish contaminatedwith a paralytic neurotoxin of natural origin (see Research Prioritiessection). It is important that all efforts be made·to minimize theimpact of OTEC operations on such biological resources.
In a strict interpretation, protected species such as marine mammals may not be "fisheries" resources. However, they are important components of the biota at the potential OTEC sites and impactson them will have to be evaluated on a thorough basis. As notedin Table 3, a number of species are listed as threatened or endangered in Hawaiian and Caribbean waters. The humpback whale,
Table 3.-Threatened (T) and endangered (E) marinespecies (Source: 50 eFR 17.11-12).
Hawaii Virgin Islands
Marine mammalsRight whale Balaena glacialis* E
Sei whaleBalaenoptera borealis E
Blue whaleBalaenoptera musculus E
Finback whaleBalaenoptera physalus E
Humpback whalcMegaptera novaeangliae E
Hawaiian monk sealMonachus schauinslandi E
Spenn whale Physeter calOdoll E
Caribbean monk sealMonachus tropicalis E
West Indian manatee (Florida)Trichechus manatus E
Sea TurtlesLoggerhead sea turtleCaretta caretta T T
Green sea turtleChelonia mydas E T
Leatherback sea turtleDermochelys coriacea E E
Hawksbill sea rurtleEretmochelys imbricata E E (=carey)
Kemp's Ridley sea turtle(=Atlantic)Lepidochelys kempii E E
Olive Ridley sea turtle (Pacific)Lepidochelys olivacea T
BirdsNewel's shearwaterPuffillus auricularis newelli T
Hawaiian dark-romped petrelPetrodroma phaeopygiasandwichensis E
'Not considered part of the normal cetacean fauna inHawaiian waters.

Megaptera novaeangliae, one of the most abundant cetaceans inHawaii, is an endangered species which migrates into Hawaiianwaters in winter to breed. A second endangered species, theHawaiian monk seal, Monachus schauinslandi, is present; however,the population resides in the Northwestern Hawiian Islands and awayfrom potential OTEC sites. Of the five sea turtles that have beenreported off Hawaii, the green sea turtle (Chelonia mydas) is themost abundant. A single green sea turtle has been observed repeatedlyon the reef directly off the Kahe Point power station.
A number of marine species listed as threatened or endangered.including several turtles, are found in the waters off Puerto Ricoand the Virgin Islands. Of particular importance are the leatherback and hawksbill turtles which nest in potential OTEC areas, andhumpback whales which calve and mate in the region from Januarythrough April.
Factors That May Affect Fish
Organisms entrained by the intakes of an OTEC plant will eitherbe impinged on screens placed to prevent larger objects from entering and clogging critical parts of the plant, or entrained andtransported through the plant and then discharged. In passagethrough the plant, entrained organisms will be subject to a numberof stresses such as temperature and pressure changes, and chemicaladditions. Upon discharge to the environment, entrained organismswill be redistributed in the water column along with additionalorganisms entrained into the discharge plume. The artificial upwelling of nutrients and other constituents contained in the deeper, colderwaters and their subsequent redistribution may also effect somebiological changes.
AttractionlAvoidance-The attraction or avoidance of fish towardsobjects, light and noise is a known phenomena that is expected tooccur with OTEC operations, whether they be open-ocean plantships, stationary towers, moored platforms, or land-based plants.For the purpose of this study, Seki (1984) has summarized availableinformation on this topic and related it to OTEC development; thefollowing is a brief synopsis of his findings.
The attraction of fish to free-floating and anchored objects orstructures has been studied throughout the world's tropical and subtropical waters. The objects with which fish have been observedto associate include drifting seaweed (Senta 1966), driftwood (Yabeand Mori 1950; Inoue et al. 1963; Hunter and Mitchell 1967; Inoueet al. 1968), manmade rafts (Kojima 1960; Gooding and Magnuson1967), and artificial surface or rnidwater structures, including commercial fish aggregating devices (FAD's) (Hunter and Mitchell 1968;Klima and Wickham 1971; Wickham et al. 1973; Wickham andRussell 1974; Matsumoto et al. 1981). Tunas dominate the catchof the pole-and-line, trolling, handline, and purse seine boats fishingaround FAD's, as evidenced by some catch data obtained fromKiribati, Western Samoa, Fiji, and Hawaii (Shomura and Matsumoto 1982). The experimental study by Matsumoto et al. (1981)provided the most detailed records of catches around FAD's in thePacific. Matsumoto reported that skipjack tuna, Katsuwonuspelamis, represented nearly 90% of the catch by the pole-and-lineboats. These fish ranged from 0.9 to 5.4 kg and sometimes over9.1 kg. Unlike pole-and-line boats, trolling boats hac a much morediversified catch. Tunas (mostly yellowfin tuna, 1hunnus albacares,and skipjack tuna, Katsuwonus pelamis) still dominated the catch,although mahimahi, Coryphaena hippurus, constituted the largestpercentage of single species caught.
16
Another tuna fishery which utilizes FAD's (in conjunction withan artificial light source) in Hawaii is the ika-shibi or the nighthandline fishery for tuna. Although this rapidly growing fisheryutilizes extremely simple gear (a single hook and a line) as comparedwith the longliners and large purse seiners, it is an extremely effective method as indicated by the mean catch rate of approximatelytwo fish per hook per night (Yuen 1979).
In comparison to floating OTEC structures, the tower and manmade island designs of OTEC plants are expected to function asartificial reefs, duplicating those conditions that cause concentrations of fishes and invertebrates on natural reefs and rough bottomareas. The effect of tower designs would be similar to that of offshore oil platforms, which have resulted in an increase in offshoresport fishing in the immediate area.
Numerous studies have described the variety of fish which havebeen attracted to artificial reefs at various sites. In all studies, themany different species found generally represent similar basic broadbehavioral classes, such as the Turner et aI. (1969) reef or nonreefassociates (the former further split into resident or semiresident).Four reefs were established at various sites in Hawaii between 1960and 1973, using primarily car bodies, damaged concrete pipes, andold car tires filled with mortar. The southern boundary of a reefcreated on one of these sites (Waianae) on the western coast of theIsland of Oahu is at lat. 21 °25. I'N, long. 158° 1l.6'W (Kanayamaand Onizuka 1973) only 3 miles from the present OTEC benchmarksurvey site at lat. 21 0 19.5'N, long. 158 0 12.5'W offshore of KahePoint. Sampling along a fish transect established before the reefconstruction indicated the presence of 32 different species and astanding crop density of 103 pounds of fish per acre. The reef wasconstructed in two sections, one composed of car bodies and theother of damaged concrete pipes. Thirty species of fishes (standingcrop estimated at 1,271 pounds/acre) were present at the car bodysection. This was a tenfold increase over the pre-reef count. Theconcrete pipe section showed a fivefold increase of 45 fish speciesand a standing crop estimated at 496 poun.ds/acre.
Although attraction of fish to man-made structures is welldocumented, questions still arise regarding the relationship betweenartificial structures and fish production. Mallory (1965) believedthat a structure concentrated the fish which constantly migrated inand out, thus serving as an orientation point. This was true for anumber of species (primarily the game fishes) associated with flotsam. Stroud (1965) felt that since the artificial habitat provides foodand shelter, reproduction will be enhanced resulting in an increasein production and yield of fish. A third hypothesis discussed byCarlisle et al. (1964), Turner et aI. (1969), and Dugas et aI. (1979),combines both viewpoints; fish are concentrated by recruitment,and, as the colonization progresses on the structures, a reproducingresident fish community may evolve. Although this may hold truefor many of the reef fishes, this hypothesis falls short of accounting for overall fish attraction as evidenced primarily for such speciesas the deeper water pelagic scombrids and billfishes.
The attraction of various marine organisms to light is a phenomenon that has been used in the harvesting of fish for many years.Mackerel scad, Decapterus macarellus, and bigeye scad, Selarcrumenophthalmus (Yamaguchi 1953; Powell 1968), various speciesof tuna (Yuen 1979), and squid (Ogura and Nasumi 1976), arecaught by the use of night lights. How much of an effect the lightsfrom an OTEC facility will have on the tuna is not presently known.As indicated by Laevastu and Hayes (1981), every species has aparticular optimum light intensity in which its activity is at a maximum. It is probable that the intensity of the artificial light wouldfall within the thresholds of some species.

Regarding avoidance traits of marine biota to structures and operations in the ocean, published information is virtually nonexistent.Yuen (1981) indicated that the endangered and threatened specieswould probably avoid the area due to human presence and to thenoise emitted from the plant. Among the few studies that addressavoidance was one on the negative phototactic behavior of fish.Dragesund (1958) found that herring would sometimes display ashock response That is, when the light was turned on, the fish wouldmake a sudden upward movement towards the light only to laterdisperse or school and descend. Studies on other aspects ofavoidance, such as of the physical structures, are nonexistent inpublished literature. Future studies should be directed in this area.
Impingement-·lmpingement at coastal power plants has been anecological problem (loss of a large number of organisms), an operational problem (reduction in cooling water flow), and a cost problem (removal and disposal of organisms). Impingement occurs whenorganisms too large to pass through the intake screen, are pulledagainst it, and are unable to escape due to the current velocity.Schooling fishes are especially susceptible, and impingement mortalities may involve millions of individuals. In one incident, 2 millionmenhaden at the Millstone Plant in Connecticut were impinged andcaused a shutdown of the plant by reducing the cooling water flow.These mortalities are believed by some ecologists to be reachingproportions which may cause population damage (Van Winkle
1977). As a result, data on impingement of fish have been collectedfrom many operating plants (Adams 1969: Marcy 1971; Jensen1974; Uzie! 1980).
Variation in impingement on intake screens is related, amongother things. to season, swimming speeds, intake location, andoperating schedules of the power plant. Screen catches at mostcoastal power plants studied in temperate waters fluctuate markedly with season, due to migrations into and out of intake areas andto changes in water temperature that affect the fishes' ability to swimsuccessfully against intake currents. In tropical areas, where OfECplants will be located, impingement may be less variable becausethere is generally less migrational movement of populations andthe water temperature is essentially the same the entire year.
The swimming speed of an organism determines whether or notit will escape impingement or entrainment once in the vicinity ofan intake. Eggs and larvae of marine fish drift passively in the oceanwithin the zooplankton community. Early larval stages utilize swimming only to capture prey, escape predation, or migrate vertically.In general, sustained swimming speeds of fish larvae fall into a rangeof 2-4 body lengths/second for larvae in advanced development orfor juveniles (Blaxter 1969; Bainbridge 1960). Table 4 lists representative species, including a few freshwater species, for individualsup to 6 cm in length. For most fishes, relative speeds decrease assize increases above that shown in Table 4, and absolute speed increases as size increases.
Table 4.-Sustained swimming speeds of some larval and juvenile fish species (adapted from Marcy et al. 1980).
Length Speed Temp Time Body lengthsSpecies (mm) (mm/s) (0C) maintained per second Author
European plaice 7.5 12 6.5-7.5 A few s Ryland (1963)9.5 27 6.5-7.5 A few s
Whitefish 10-12 16 4 ? 1.6 Braum (1964)29 16 2.4
Common roach 35-45 138 I min 3.1-3.9 Aslanova quoted by Radakov(1964)
Common bream 45-55 126 I min 2.3-2.8Carp 50-60 129 I min 2.1-2.6Horse mackerel 30-40 136 I min 3.4-4.5Mullet 35-45 128 I min 2.8-3.6Mullet 45-55 156 I min 2.8-3.5White bream 18-26 330 ? 12.7-18.3 Radakov (1964)Atlantic herring 6.5-8 5.8 ?(14) 45 min 0.7-0.9 Bishai (1960)Atlantic herring 12-14 10 9-10 60 min 0.7-0.8 Blaxter (1966)Sole 4 6-9 15 Long periods 1.5-2.2 Rosenthal (1966)
intermittentswimming
Bleak 0.26 g (wet wt) 29.8 20 Ivlev (1960)Smallmouth bass 22 146-312 20-35 3 min 6.6-14.2 Larimore and Duever (1968)Yellow perch 6.5 5.5 13 60 min 0.8 Houde (1969)
7.5 14.0 13 60 min 1.98.5 24.0 13 60 min 2.89.5 27.5 13 60 min 2.9
10.5 32.0 13 60 min 3.013.5 46.0 13 60 min 3.4
Walleye 7.5 5.0 13 60 min 0.7 Houde (1969)8.5 13.0 13 60 min 1.59.5 29.0 13 60 min 3.0
10.5 32.0 13 60 min 3.011.5 37.5 13 60 min 3.313.5 42.0 13 60 min 3.114.5 46.0 13 60 min 3.2
Lake whitefish 15.2 35 7.5 I min 2.4 Hoagman (1974)15.8 58 11.5 I min 3.719.7 71 11.5 1 min 3.621.3 76 14.5 I min 3.528.8 115 14.5 I min 4.0
17

Among the fastest burst swimmers are yellowfin tuna, which asadults can swim 27 body lengthsls for 5 seconds (Walters andFierstine 1964). Although larvae do not have strong sustained swimming ability, they possess impressive darting or burst speeds relativeto their size. Blaxter (1969) suggests bursts of lO body lengthsiswhich, for most larvae (up to 25 mm), would limit their speed toless than the 0.25-0.30 mls suggested as typical of OfEC plantwarm-water intake velocity (see Seawater Systems section). Scombrid larvae have not been measured for burst swimming performance, but Pacific mackerel up to 3.6 cm in length swam up to26 cmls, counting time spent in rest and feeding (Hunter 1980).
Swimming ability is a function of morphological shape, stage ofdevelopment, length, ambient temperature and light, and the duration required for the performance (Tsukamoto et al. 1975; Hartwell and Otto 1978; Rulifson 1977; Pavlov et al. 1968; Larimoreand Duever 1968; Hunter and Kimbrell 1980). Knowledge of thesefactors and the types of species likely to be near the OfEC plantsite is necessary to predict the potential of larvae and juveniles toescape intake currents.
Morphologically, the fastest species have a high aspect ratio ofthe caudal fin (ratio of the square of the caudual fin depth to thesurface area) (Lighthill 1970). Species with high aspect ratios arethose with the carangiform (e.g., Carangidae, Clupeidae, Pomatomidae) and thunniform (e.g., Scombridae, Istophoridae, Xiphiidae, Stromateidae) swimming motion. Anguilliform swimmers(e.g., Anguillidae, Pleuronectiformes), subcarangiform swimmers(e.g., Gadiformes, Salmonidae), or ostraciiform swimmers (e.g.,Ostraciidae, Tetraodontidae, Lophiiformes) have a low caudual fillaspect ratio and are relatively slow.
The effects of temperature on swimming speeds are probablyunimportant in predicting susceptibility of small fish to entrainmentin an OfEC plant. While Hettler (1979) found that a lOoC increasein temperature caused the swimming speed for two carangiformjuveniles to increase by a factor of 1.6, the relatively consistenttemperature in the tropics is unlikely to cause large seasonal changesin susceptibility to entrainment.
The design of the water intake structure will greatly affect current velocity. It has been shown that fish are better able to orientto a horizontal flow than a vertical flow. Intake structures placedor capped so that intake flows are in the horizontal plane enablefish to orient to the flow and more effectively avoid the intake(Langford 1983).
Because of the large volume of water required by OfEC plantsand the relatively high flow rate at the screens, impingement oforganisms on the warm-water intake screens will assuredly be avisible effect and may, in some cases, be ecologically important.Impingement rates will depend on intake location and velocity, timeof day, behavior characteristics of the populations of organismsassociated with the plant site and, to some extent, season of theyear, although this will be a relatively minor factor in tropicalwaters. Another important factor is that the plant may serve as afish-attracting device and concentrate large numbers of organismswhere they are in danger of being impinged or entrained (Seki 1984).
Impinged organisms generally fall into the micronekton sizecategory (2-20 cm) and include fishes, macroplanktonic crustaceans,cephalopods, and gelatinous organisms such as coelenterates, salps,and ctenophores. Micronekton are an important intermediate stepin the food chain between the zooplankton and commercially important fishes. The significance of large-scale mortalities due to impingement at coastal power plants in temperate waters has not beenquantified from field data and there is presently no conclusiveevidence of actual population declines in any species due to imp-
18
ingement losses.Attempts have been made to model the effects on populations
(see section on Potential Range of Ecological Effects) but there is,in general, a lack of needed data on natural mortality rates. Ingeneral, the data base for tropical-subtropical waters is even moredeficient than for temperate waters. Very few quantitative studieshave been made in tropical-subtropical waters to systematically collect samples of micronekton. Therefore, it is very difficult toestimate the impingement rate. Sullivan and Sands (1980), usingdata from water off Oahu, Hawaii, estimated a daily impingementof 420 kg for the warm-water screen of a 400-MWe OfEC plant,and concluded that this loss is probably insignificant when thereplacement ability of the micronekton population in the surrounding region is considered.
Primary Entrainment-Any organism small enough to passthrough the intake screens (approximately 1.3 em; Sands 1980) willbe entrained in the seawater flowing through the heat exchangers(primary entrainment). During this period, organisms are subjectedto thermal and mechanical stresses as a result of changes in pressureand temperature, shear and acceleration forces, abrasion, and collision with structures. In addition, organisms will be subjected tobiocides used to clean the surfaces of the heat exchangers, anticorrosion agents, and corrosion products. Effects on organisms willbe due to a combination of these factors.
The effects of primary entrainment at conventional power plantshave been extensively studied and a number of reviews have beenreported (e.g., Schubel and Marcy 1978). There is general agreement that while a great many species of organisms cannot survivepassage through the cooling water system, there is a wide rangeof tolerance among species, and plant design and operatingcharacteristics are critical factors. Mechanical damage is probablythe major single factor contributing to primary entrainment mortality. The importance of thermal and chemical stress will varydepending on thermal exposure, biocide treatments, and corrosionrates.
Entrainment effects associated with OfEC will no doubt be oneof the most important factors to consider with respect to fisheries.Because of the low thermal efficiency of OfEC plants the amountof water needed is extremely large; generally between 6 and 10m3 . S-I. MWe- ' for the total combined warm and cold water flow(see Seawater Systems section), as compared to an average of 0.05m3 . s- I . MWe -1 for condensing water for a nuclear plant. Becauseof this large water requirement, the number of organisms subjectto entrainment will be large.
Temperature-Organisms entrained in conventional power plantsare subjected to rapid increases in temperature as they pass throughpower plant condensers. The near instantaneous temperature changes(~T) may range from less than 6°C to more than 19°C (Schubeland Marcy 1978), and the exposure time to these elevated temperatures may range from several minutes to an hour (including timein the discharge canal) depending on the plant design. Laboratoryresearch on the larvae of four species of temperate subtropicalmarine fish (Atlantic menhaden, Brevoortia tyrannus; spot,Leiostomus xanthurus; pinfish, Lagodon rhomboides; and flounder,Paralichthys sp.) has shown that their survival following entrainment in a once-through cooling water system will depend on theincrease in condenser water temperature over ambient watertemperature and the length of exposure (Hoss et al. 1971,1974).
Studies designed to evaluate a hypothetical offshore conventionalpower plant with a ~T of lO-12°C and an ambient temperature of

l5-l6°C indicate that spot, Leiostomus xanthurus, eggs may be moreaffected by heat shock during their first day of life than at laterstages as embryos (Hettler and Coston-Clements 1978). Eggs ofblack sea bass, Centropristis striatus, did not show this same effect, so it appears that stage of development at time of shock maybe important, but must be determined on an individual species basis.Spot eggs that were slowly returned to ambient temperatures hada much better survival than those subjected to a rapid return. Thelarvae of spot (1-21 days old) showed no apparent relationshipbetween age and survival following thermal shock (Hettler andCoston-Clements 1978).
Unlike conventional power plants where organisms experienceonly an increase in temperature as they pass through the condensers,organisms entrained in arEC plants will experience both increasesand decreases in temperature. Organisms entrained in the warmwater will pass through the evaporator, where the temperature willbe decreased by 2-3°C, while organisms entrained in the cold waterwill pass through the condenser, where temperature will be increased2-3°C (U.S. Dept. of Energy 1978). Additionally, organisms willbe subject to larger temperature changes upon mixing of the twoeffluents (if practiced) and/or discharge to the environment. Forinstance, a mixed discharge would effect a temperature drop of aboutlOoC for the warm-water organisms and a lOoC increase for anycold-water organisms. Entrained organisms will also experience aredistribution in the water column when discharged with effluentwaters. This redistribution could also expose organisms to a different temperature regime.
No literature was found on cold shock in fish for the temperaturerange and aT expected for the arEC discharge. Cold shock literature is limited to describing effects of rapidly reduced temperaturesduring the cooler months to new temperatures at or near the lowlethal temperatures, which produce death by the formation of icein the tissues or induce primary (respiratory) or secondary (nerveblockage) chill comas. All reported fish kills or experimental coldshocks involved species in temperate climates. Chittenden (1972)found that young Alosa sapidissima exposed to abrupt temperaturedecreases from 24°C to 12°C were not affected, but below 12°Ceven gradual decreases caused sublethal behavioral problems. Terpinet al. (1977) showed that Anchoa mitchilli died at lOoC when acclimated to 22°C and subjected to a 12°C decrease in 29 hours.However, no mortality occurred at decreases of 4°C and rc.Becker et al. (1977), although not working with marine species,showed that differences in response to abrupt temperature changeswere found between species, inferring that a general prediction ofthe effect of cold shock cannot be made to a number of species.Further, knowledge of thermal requirements of the adults of aspecies may not be sufficient to predict those of egg and larval forms.
• In Brett's (1956) review, he states that" ... the thermal requirementsin the very early stages are more exacting than in the adult." Foreggs and larvae of stenothermal species, reduced temperatures,although not actually "cold," will retard development and maycause abnormalities. Harada et al. (1978) found that no yellowfintuna larvae developed normally in temperatures below 20°C.
Pressure-Rapid change in hydrostatic pressure is one of the stressesto which organisms are subjected during entrainment. Thesepressure changes may be either negative (vacuums within the pump)or positive, and the magnitude of the change is dependent on designof the plant.
It has been suggested that rapid changes in pressure that occurin power plant cooling water pumps may be potentially damagingto entrained fish (Marcy et al. 1980). Although much research has
19
been conducted on the effect of pressure change on fish, very littleof it has any direct relevance to the relatively small pressure changes(1-5 atmospheres; 1 atmosphere change equivalent to a lO-m depthchange) to which fish are subjected in power plant cooling systems.
Much less entrainment of organisms is expected in the cold waterintake of an arEC plant, but any entrained organisms will be exposed to a pressure change of 70-100 atmospheres depending ondepth of the intake pipe. Entrained fish larvae possessing a swimbladder would be very vulnerable to rapid changes in pressure ofthis magnitude (Hoss and Blaxter 1979; Blaxter and Hoss 1979).
Chemical Additions-Due to the low thermodynamic efficienciesavailable through the arEC system (Myers and Ditmars 1985), theheat transfer rate at the heat exchanger surfaces will be critical.The inhibition of biofouling due to microorganisms must thus bean integral aspect of arEC operations. As in coastal power plants,current thought here supports the need for intermittent chlorination to keep biofouling to a sufficiently low level. As noted by Hossand Peters (1983), there is concern over the use of chlorine becauseof its toxicity. It has been shown that added chlorine can seriouslyaffect the growth and survival of entrained organisms (Schubel andMarcy 1978), although there are species-to-species variations andcertain synergistic effects with temperature and trace metals (Hosset al. 1975, 1977).
The biocide concern is amplified in an arEC operation becauseof the large volumes of water involved, i.e., the achievement ofa certain concentration for biocidal effectiveness will require theapplication of large quantities of biocide. Although the requireddose of chlorine will be somewhat site-specific, recent studies indicate that concentrations of total residual chlorine of about 0.07mg/L may achieve the desired results (Larsen-Basse and Daniel1983). This is well below the new source performance standards(NSPS) requirement for chlorine discharges from steam electricgenerating stations, the standards which would most likely applyto arEC discharges (Myers and Ditmars 1985). For plants witha steam electric generation capacity of 25-MWe or more, the NSPSspecify the total residual chlorine (TRC) in the cooling waterdischarge from any single generating unit shall not exceed 0.20mg/L, and that the duration of chlorine discharge shall not exceed2 hours/day.
Although chlorine bioassay studies by Venkataramiah et al.(l98Ib) suggest that levels less than or equal to 0.5 mg/L may begenerally safe, there are still concerns regarding cumulative effectsof continuous discharges that must be further addressed (Venkataramiah et al. 1981a; U.S. Department of Energy 1981). Thereis also a potential for synergistic reactions of chlorine with tracemetals and ammonia leaks. Recent studies (Venkataramiah et al .1981a,b) on marine fishes and zooplankton have shown that thetoxicity of ammonia and chlorine varies with habitat of the speciesand with duration of exposure. Within the same species (gray mullet,MugU cephalus), smaller fish were more sensitive than larger fish.This work confirms past research on other species and providesfurther evidence that exposure to chlorine in marine waters, whilenot well understood, may present a serious problem and shouldreceive additional study.
Because of the large surface areas required for arEC heat exchangers [about 9.3 m2/kWe for closed cycle (NOAA 198Ia»),heat exchangers are considered one of the principal sources of tracemetal release. Myers and Ditmars (1985) have used the results ofDOE-supported corrosion tests (Tipton 1980) to make worst-caseestimates of trace metal concentrations in OTEC discharges (Table5). In general, the concentrations of trace metals in an arEC

Table S.-Estimates of OTEC effiuenl. trace metals concentrations due to heat exchanger corrosion and erosion.
Trace constituent concentrationsin arEC discharge effluentd
(ng/g)Cleaning
environmentbMaterial'
Material loss/unit area3-mo exposure"
(mg/cm2)
------------Alclad 30035052 AICA 706 Cu-NiAI-6X Steel
Ti
Brush + chlorineBrush + chlorineBrushBrush
Brush
34.310.187.50.02
<0.01
AI, 66; Zn, IAI, 19; Mg, 0.49; Cr, 0.05Cu, 151; Ni, 17; Fe, 2.4Fe, 0.02; Ni, 0.01; Cr, 0.01;Mo,O.OO2Ti, <0.02
'Material composition: Alclad 3003 is 99% AI, 1% Zn; 5052 AI is 97.5% AI, 2.5% Mg, 0.25%Cr; CA 706 Cu-Ni is 88.6% Cu, 10.0% Ni, 1.4% Fe; AI-6X Steel is 50% Fe, 24% Ni, 20% Cr,6% Mo; and titanium is commercially pure.
bCleaning environment is either M.A.N.<Il (American M.A.N. Corp., N.Y.), brushing with 3 roundtrips/day or brushing plus continuous chlorination at 0.1 mg/L concentrations.
cFrom Tipton (1980); largest alloy losses from 3-mo exposure reported here.dCalculated assuming alloy loss (from Tipton 1980), heat exchanger surface areas of 9.3 m2/kWe
(NOAA 198Ia), and OTEC seawater flows of 6 m3s- IMWe- l•
discharge are estimated to be on the order of 100 ng/g (100 J.lg/L)or smaller. With the possible exception of copper, these estimatessuggest that the release of trace metals from heat exchanger surfaces would not pose significant concern. Worst-case estimates ofthe release of copper from a Cu-Ni alloy (i.e., CA 706) indicateconcentrations above 100 ng/g, in the acute toxicity range of copper in seawater based on a number of observations of copper toxicity (Klapow and Lewis 1979).
With the exception of catastrophic accidents, any leaks of working fluids will be diluted by the large volumetric flow of seawaterthrough the plant, to the point that problems should not arise. Forinstance, with the Ocean Thermal Corporation OTEC design forKahe Point, it is predicted that normal leaking of ammonia couldresult in an increase of 2.4 J.lg/L above the ambient level of 10.7J.lg/L in the mixed discharge (Ocean Thermal Corporation 1983).Upon reaction with the seawater, only about 5% of this increasewould remain as un-ionized ammonia, the principal toxic form. Theconcentration of un-ionized ammonia in the discharge would thenbe about 0.66 J.lg/L, well below a reported minimum-risk level of10 J.lg/L (U. S. Environmental Protection Agency 1973) and only0.12 J.lg/L greater than the ambient concentration of un-ionizedammonia.
Secondary Entrainment-Secondary entrainment refers to the capture of organisms in discharge waters (effluent plume) as a resultof turbulent mixing or behavioral responses. The rate at whichorganisms are entrained in this manner will depend on the dischargeflow rate, the near-field dilution, and the average population densityalong the near-field trajectory of the plume (Paddock and Ditmars1983).
Most of the same stresses encountered in primary entrainmentwill also be encountered in secondary entrainment, the differencebeing that the magnitude of the stress will, in general, be muchless. Determining the effects on fisheries organisms of secondaryentrainment will be even more difficult than for primary entrainment, and results from previous power plant studies are limited intheir usefulness.
Ehrlich (1977) reported that the hatching success of Californiagrunion (Leuresthes tenuis) was significantly reduced by a nonthermal but unknown component of the effluent from a Californiapower plant. Large variation in hatching success suggested that theunknown hatching inhibitor in the water fluctuated during plant
operation. It is possible that trace metals in the effluent caused thevariation, since previous work by Rosenthal and Alderdice (1976)showed reduced hatching in herring eggs exposed to trace metals.The effects of small changes in water temperature have been shownby Peters and Angelovic (1973) to be an important factor in controlling fish feeding and growth. Small changes in temperature(either increases or decreases) in the discharge plume may,therefore, have an effect on larval fish growth, but this will be verydependent on the depth at which the discharge occurs and the totalarea that is impacted.
Ocean Water Mixing-An OTEC plant's displacement of largequantities of deep ocean water can cause an upwelling effect thatmay disturb the natural temperature structure, salinity gradient andlevels of dissolved oxygen, nutrients, and trace metals in the surface waters. Artificial upwelling is not a characteristic of conventional power plants; therefore, there is little direct analogy to theOTEC situation. However, some studies that have been made onnutrient distribution and changes in trace metal levels may be ofsome use in predicting upwelling effects.
In general, it is thought that the pumping of large amounts ofdeep nutrient-rich ocean water to the surface layer may have positiveeffects if the same type of biostimulation occurs near OTEC plantsas occurs near areas of natural upwelling. However, whether upwelling will be harmful or beneficial to local ecosystems will dependon many factors, as discussed in the section Impacts on FisheryFood Chains.
The concentration of trace metals in surface water may increase·due to upwelling of metal-rich deep water or the formation of corrosion products. The impact of these increases will depend in largepart on the amount and chemical form of the metals involved. Thefree ion activity, not the total metal concentration, determinesbiological availability and effect. Increases in the bioavailabilityof micronutrients, e.g., iron, manganese, and copper, could increaseproduction of the algae community. Similarly, toxicity could resultfrom high availability of metals, such as copper, zinc, or cadmium,which could be detrimental to biological production. If the tracemetal complement of the effluent water is harmful, the potentialbiostimulatory effect of upwelled nutrients may either not occuror be unnoticeable. The trace metal complement will change withtime through a variety of processes, and a bloom may be merelydelayed. With current information it is not possible to predict what
20
effect the altered trace metal regime will have on the utilizationof upwelled macronutrients, nor is it clear whether the effects willdiffer with location.
The Potential Range of Ecological EffectsResulting From OTEC Operations
Marine ecosystem impacts which may result from OfEC operations can be described only in very general terms. This section attempts to estimate the upper and lower bounds of these effects fora 40-MWe shorebased plant with the effluent plume coming toequilibrium near the bottom of the mixed layer (see EffluentDischarge section). Impacts which we consider include impingement, primary and secondary entrainment, and nutrient enrichment.This or any estimate of impacts is limited by the environmental dataavailable and by an incomplete understanding of the amounts andtypes of ecological compensation which may occur. Also, evaluatingthe importance of projected effects will be particularly difficult anddependent upon resource and system boundaries.
Impingement-Impingement rates will depend on volume and speedof the intake waters and the abundance of animals larger than themesh size of the intake screen and their ability to avoid the intake.An animal's ability to avoid the intake depends on (I) rheotacticbehavior, (2) visual perception in low light environments, and (3)swimming speed. Swimming speed depends on (a) species limitations (form or hydrodynamics), (b) temperature, and (c) physicalcondition. Physical condition depends on (i) nutritional state, and(ii) presence of disease or injury. While neither abundance oravoidance capability is well documented, reasonable estimates arepossible. Fish, in general, can swim about 3-6 body lengths persecond and will avoid intakes which are visible and in a horizontalflow field (Hocutt and Edinger 1980). With estimated intakevelocities of 0.25 to 0.30 m/s (see Seawater Systems section), itis unlikely that fish over 10 cm in length will be impinged, andmany smaller ones could probably avoid the screens. The minimumlength of fish impinged will be several times the screen mesh size.Thus, most impinged animals will be in a size range probably narrower than from 3 to 10 cm.
While there are no measurements of the absolute abundance ofanimals susceptible to impingement by an OfEC plant, trawl surveysconducted near Hawaii (Maynard et al. 1975) and Puerto Rico(Vargo et al. 1981) may be used to provide estimates of impingement rate. While catch efficiencies of the trawls are not known,we assume the fishes' susceptibility to capture by net is about thesame as by impingement. Although the nets were pulled severaltimes faster than plant intake velocities, most animals caught wereof the same small size «10 cm) which is most susceptible to entrainment or impingement. By adjusting the reported trawl catchesfor items identified as undersized or soft-bodied (entrainable ratherthan impingeable) and oversized (those which can probably avoidan intake), we can estimate expected impingement.
In both areas surveyed, fishes were the most abundant group,with crustaceans and cephalapods also present. In Hawaii surfacewaters, a combined catch of all three groups was 0.2 mg/m3 during the day and 5.4 mg/m3 at night. Micronekton sampling nearPuerto Rico revealed an average biomass of 2.7 mg/m3• Adjustingthe Caribbean catch for the 60% "residue" of entrainable sizeorganisms, which those samples contained, results in estimates of1.1 and 2.5 mg/m3 for day and night, respectively, or an average1.8 mg/m3 of animals large enough to get caught on surface intake screens. In these samples, there appeared to be few animals
21
which were large enough to escape intake velocities. In Hawaii thenet was pulled faster than in Puerto Rico (1.7 vs 1.0 rnIs) and largeranimals were collected. Adjusting the nocturnal catch in Hawaiifor those fish weighing more than 10 g (those most likely to beable to avoid impingement) results in estimates of the biomass ofanimals which will be impinged at night (4.6 mg/m3). The averageimpingeable biomass over a 24-hour period is 2.4 mg/m3. Similarcalculations with data from deeper water result in an estimate ofimpingeable biomass at the cold water intake of 3.4 mg/m3 in theCaribbean and 4.2 mg/m3 in Hawaii.
Multiplying the average concentrations of impingeable biomassfrom the two studies (2.1 mg/m3 at the surface and 3.8 mg/m3 indeep water) times estimated flow rates results in an estimate of impingement rates. A 4O-MWe plant with surface and deep intake ratesof 120-200 m3/s (i.e., 3-5 m3 ·s-I.MWe- 1 for each intake; seeSeawater Systems section) would probably impinge 20-35 kg liveweight daily from the surface water and another 40-65 kg at thecold water intake, roughly in accord (being an order of magnitudeless) with the impingement estimated by Sullivan and Sands (1980)for a 4oo-MWe OfEC plant in similar waters (see Impingementsection). These estimates of impingeable biomass are based on theassumption that larger organisms can detect and avoid the intakescreens. We are unaware of any measures of the concentration oflarger organisms which could be used to estimate impingement rateson a screen which they could not detect; thus, our estimates canserve only as a lower bound. Higher rates are possible, but we haveno means of estimating them.
Primary Entrainment of Plankton-Plankton entrainment ratesare a function of plankton density and the rate of water intake. Whilethe intake rate can be predicted and information on average densityof various planktonic groups is available, their vertical stratification is, in many cases, not clearly documented. Those motileorganisms which aggregate at particular depths may be entrainedat rates vastly different than predicted from their average densityin the mixed layer.
Phytoplankton biomass is approximately the same in Hawaii andthe Caribbean. In the mixed layer at the Hawaiian Kahe Point OfECsite the median value was 0.10 mg chlorophyll-a1m3 (Uchida1983). The average of eight published values reported from theCaribbean surface waters (Hoss et al. 1983) is 0.13 mg/m3• Judging from chlorophyll-a concentration at discrete depths, there isno consistent pattern in the vertical distribution of phytoplanktonin the upper 50 m near Hawaii and Puerto Rico (Sands 1980). Thus,average concentrations can be used to estimate phytoplankton entrainment. However, it should be recognized that while mean abundances in Hawaii and the Caribbean are similar, individualmeasurements showed considerable variation, so the rate of entrainment of phytoplankton may also vary widely over time. To be conservative in estimating the range, extreme lower and upper boundsare assumed to be 0.05 mg/m3 and 0.25 mg/m3•
'Daily phytoplankton entrainment by a 40-MWe plant, again withsurface and deep-water intake rates each in the range of 120-200m3/s, will probably be between 0.5 kg chlorophyll-a (0.05 mgchlorophyll-a m3 and 120 m3/s) and 4.3 kg (0.25 mg chloropyll-am3 and 200 m3/s). Assuming a factor of 100 for relatingchlorophyll-a to organic carbon (Holm-Hansen 1969), we estimatethat the organic carbon of phytoplankton entrained will be in therange 50 to 430 kg C/d. If the chJorophyll-a concentration is 0.1mg/m3
, a figure frequently used to describe subtropical oceanicwater, then phytoplankton entrainment will be in the range 100 to170 kg C/d.

The zooplankton biomass which is subject to entrainment by anOfEC plant consists oftwo major fractions: macroplankton caughtin conventional nets (200 lim or larger mesh) and microplanktonsmall enough to pass through such nets. The larger animals in surface waters have been studied enough that their density is fairlywell known. In Hawaiian water the mean dry weight biomass inthe upper 200 m was 4.9 mg/m3 and 3.3 mg/m3 in two differentsets of cruises (Noda et al. 1981b, from Uchida 1983). The averageof four published studies from the Caribbean is 2.6 mg/m3 (standard error = 0.24). Converting these dry weights to nearsurfacezooplankton carbon (Wiebe et al. 1975) yields estimates of 1.3 mgC/m3 in Hawaii and 0.8 mg C/m3 in the Caribbean. Macrozooplankton abundance at cold-water intake depths has not been studiedas thoroughly as at the surface. The concentration clearly decreaseswith depth and will probably be less than 0.24 mg C/m3 (Table6). The 0.24 mg C/m3 average estimated from four studies (Table6) is probably inflated because many of the samples were takenduring the day when plankton abundance is greater than the 24-houraverage and because we chose the highest of the conversion factors reported for estimating dry weight.
The smaller zooplankton, i.e., microzooplankton, have receivedlittle study so estimates of their density are not very precise. Whilemicrozooplankton density appears to vary with depth, we averagedmeasurements from the top 100m of the photic zone as an indicatorof entrainable biomass. A study in Hawaii (Gundersen et al. 1976)showed an average biomass of 0.7 mg C/m3• Holm-Hansen (1969)reported values off southern California of 0.9 mg C/m3 . Using0.08 as a factor to convert displacement volume to carbon (HolmHansen 1969) and the volumes given by Beers and Stewart (1969,1971), we calculate the microzooplankton biomass averaged 2.3mg C/m3 in the eastern tropical Pacific and 1.2 mg C/m3 in theCalifornia current. From these estimates it appears that microzooplankton abundance is approximately the same as the average macrozooplankton density in Hawaii and the Caribbean (about 1 mgC/m3). This similarity in biomass of these vastly different sizedanimals has also been noted by Sheldon et al. (1977). With littleinformation indicating the factors responsible for differences indensity of microplankton, a more precise estimate of abundancein surface water is not possible.
With micro- and macrozooplankton densities in the mixed layereach averaging about I mg C/m3, the warm water intake of a40-MWe plant will entrain between 10 and 17 kg C/d in each ofthe zooplankton size categories. For the lack of evidence thatmicroplankton are abundant at such depths, we assumed that entrainment at the cold water pipe will be limited to macroplankton.If deeper water macroplankton are present at a density of 0.2 mgC/m3 (Table 6), then entrainment will probably range from 2 to4 kg C/d.
Secondary Entrainment-Turbulent mixing will result in a rapiddilution of the effluent water through the entrainment of ambientwater (see Effluent Discharge section). As a result, there is a potential for impact on the plankton present in the ambient water as theybecome entrained into the discharge plume. While it is difficult topredict the scale of impact from this secondary entrainment, thepotential effect is considerable. This impact will depend on the abundance of organisms in the dilution water, their sensitivity to thealtered water quality, and the amount of water involved.
Secondary entrainment will occur over a narrow depth range.Because of the desire to avoid recirculation of effluent back intothe warm-water intake, the discharge location may be below 30m. Based on the density of the effluent, relative to the density and
22
Table 6.-Estimated macrozooplankton carbon density at cold water intakedepth.
------_.Depth ofsamples Calculated
Area Source (m) Data provided (mg C/m3)
Hawaii Uchida1983 200·1000 0.80 mg dry wt/m3 0.26
Pacific (19°C) Vinogradov 700 0.004 m1/m3 0.17and Sargasso 1968Sea
Puerto Rico Vargo et al. 600-1000 0.0035 ml/m3 0.151981
Sargasso Sea Deevey and 500·1000 0.0108 m1/m3 0.45Brooks 1971
1000-1500 0.0046 m1/m3 0.19
Calculations used the following conversions: wet weight = 72 % of displacementvolume; dry weight = 13 % of displacement volume; carbon weight = 32 % ofdry weight (Wiebe et al. 1975)
density gradient of ambient waters near the discharge, the plumewill come to equilibrium near the bottom of the mixed layer. Thus,it appears that the dilution water and therefore secondary entrainment of organisms will generally be from depths between 30 and80 m. However, some recent modeling investigations (Wang 1984)indicate that there may also be an induced upwelling from beneaththe plume which would entrain some water from below the mixedlayer (see Regional Influence section).
Several characteristics of the effluent (e.g., reduced watertemperatures, the presence of a biocide, and a supersaturation ofnitrogen gas) may adversely affect secondarily entrained organisms.Assuming a mixed discharge, we estimate that the temperature ofthe effluent at the point of discharge could be as low as 15°C. Whilemany of the organisms which could be secondarily entrained engagein vertical migrations which expose them to a wide range oftemperatures, others, including some of the ichthyoplankton, arenot accustomed to such low temperatures. Even thermally tolerant,temperate organisms may be immobilized or killed by sudden exposure to cold temperature (Hoss et al. 1974; Bradley 1978; Stauffer 1980). The probability of mortality is greatest when the animalsare living near their lower lethal limit. While most of the important tropical organisms have not been studied for thermal effects,it seems likely that many of those found in surface waters arestenothermal (e.g., tuna larvae) and may be impacted by temperaturechanges during secondary entrainment.
While biocides will probably be introduced only intermittentlyand at low concentrations, it is reasonable to assume that if thebiocide is concentrated enough to kill fouling organisms it may alsoaffect the more sensitive animals which are secondarily entrained.Prediction of biocide impacts from current information is difficultbecause most research has involved temperate organisms. Conducting additional research on biocide effects will be difficult becauselikely effluent concentrations are near the limit of detectability.Whatever biocide effects occur will be greatest in the zone of initial dilution where their concentration is greatest and thermal impacts are largest. Furthermore, previous research has shown thatthermal and chlorine effects are synergistic (Hoss et al. 1977). Thereis also a possibility that temperature or chlorine effects may interactwith effects from gas supersaturation. When saturated cold wateris brought to the surface and warmed, it will be supersaturated withnitrogen, a condition which has caused fish mortality at other typesof power plants.
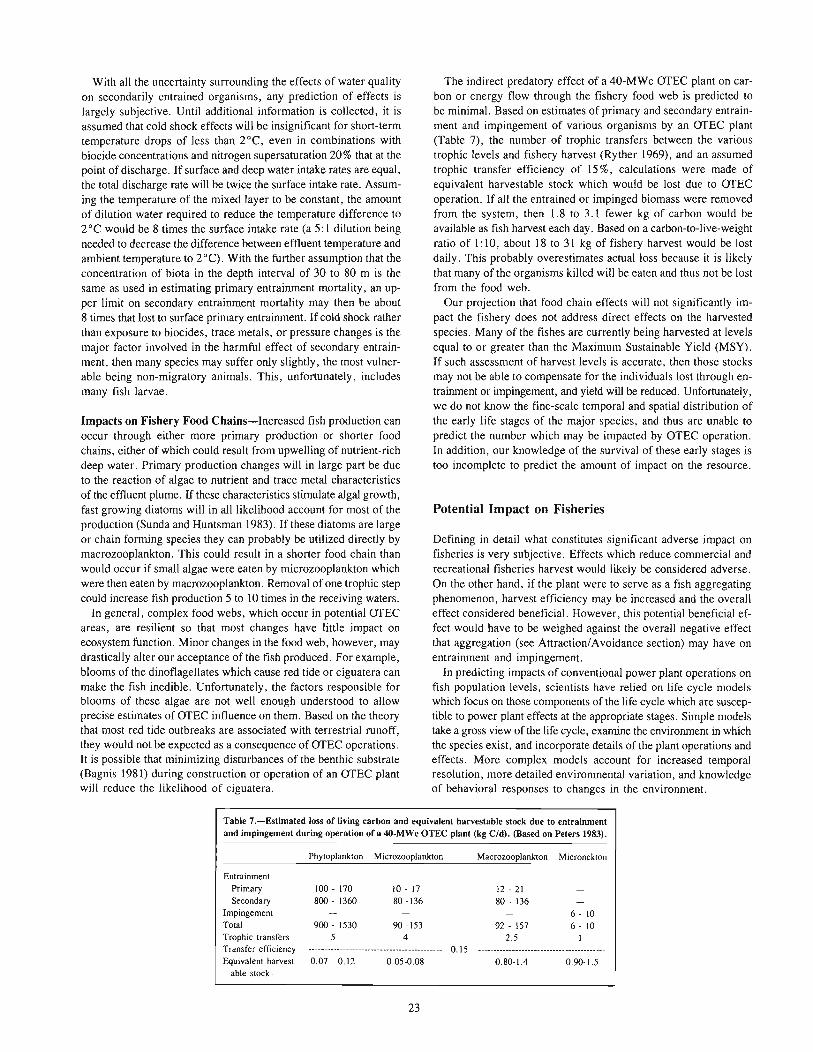
With all the uncertainty surrounding the effects of water qualityon secondarily entrained organisms, any prediction of effects islargely subjective. Until additional information is collected, it isassumed that cold shock effects will be insignificant for short-termtemperature drops of less than 2°C, even in combinations withbiocide concentrations and nitrogen supersaturation 20% that at thepoint of discharge. If surface and deep water intake rates are equal,the total discharge rate will be twice the surface intake rate. Assuming the temperature of the mixed layer to be constant, the amountof dilution water required to reduce the temperature difference to2°C would be 8 times the surface intake rate (a 5:1 dilution beingneeded to decrease the difference between effluent temperature andambient temperature to 2°C). With the further assumption that theconcentration of biota in the depth interval of 30 to 80 m is thesame as used in estimating primary entrainment mortality, an upper limit on secondary entrainment mortality may then be about8 times that lost to surface primary entrainment. If cold shock ratherthan exposure to biocides, trace metals, or pressure changes is themajor factor involved in the harmful effect of secondary entrainment, then many species may suffer only slightly, the most vulnerable being non-migratory animals. This, unfortunately, includesmany fish larvae.
Impacts on Fishery Food Chains-Increased fish production canoccur through either more primary production or shorter foodchains, either of which could result from upwelling of nutrient-richdeep water. Primary production changes will in large part be dueto the reaction of algae to nutrient and trace metal characteristicsof the effluent plume. If these characteristics stimulate algal growth,fast growing diatoms will in all likelihood account for most of theproduction (Sunda and Huntsman 1983). If these diatoms are largeor chain forming species they can probably be utilized directly bymacrozooplankton. This could result in a shorter food chain thanwould occur if small algae were eaten by microzooplankton whichwere then eaten by macrozooplankton. Removal of one trophic stepcould increase fish production 5 to 10 times in the receiving waters.
In general, complex food webs, which occur in potential OfECareas, are resilient so that most changes have little impact onecosystem function. Minor changes in the food web, however, maydrastically alter our acceptance of the fish produced. For example,blooms of the dinoflagellates which cause red tide or ciguatera canmake the fish inedible. Unfortunately, the factors responsible forblooms of these algae are not well enough understood to allowprecise estimates ofOfEC influence on them. Based on the theorythat most red tide outbreaks are associated with terrestrial runoff,they would not be expected as a consequence of OfEC operations.It is possible that minimizing disturbances of the benthic substrate(Bagnis 1981) during construction or operation of an OfEC plantwill reduce the likelihood of ciguatera.
The indirect predatory effect of a 40-MWe OfEC plant on carbon or energy flow through the fishery food web is predicted tobe minimal. Based on estimates of primary and secondary entrainment and impingement of various organisms by an OfEC plant(Table 7), the number of trophic transfers between the varioustrophic levels and fishery harvest (Ryther 1969), and an assumedtrophic transfer efficiency of 15 %, calculations were made ofequivalent harvestable stock which would be lost due to OfECoperation. If all the entrained or impinged biomass were removedfrom the system, then 1.8 to 3.1 fewer kg of carbon would beavailable as fish harvest each day. Based on a carbon-to-live-weightratio of 1: 10, about 18 to 31 kg of fishery harvest would be lostdaily. This probably overestimates actual loss because it is likelythat many of the organisms killed will be eaten and thus not be lostfrom the food web.
Our projection that food chain effects will not significantly impact the fishery does not address direct effects on the harvestedspecies. Many of the fishes are currently being harvested at levelsequal to or greater than the Maximum Sustainable Yield (MSY).If such assessment of harvest levels is accurate, then those stocksmay not be able to compensate for the individuals lost through entrainment or impingement, and yield will be reduced. Unfortunately,we do not know the fine-scale temporal and spatial distribution ofthe early life stages of the major species, and thus are unable topredict the number which may be impacted by OTEC operation.In addition, our knowledge of the survival of these early stages istoo incomplete to predict the amount of impact on the resource.
Potential Impact on Fisheries
Defining in detail what constitutes significant adverse impact onfisheries is very subjective. Effects which reduce commercial andrecreational fisheries harvest would likely be considered adverse.On the other hand, if the plant were to serve as a fish aggregatingphenomenon, harvest efficiency may be increased and the overalleffect considered beneficial. However, this potential beneficial effect would have to be weighed against the overall negative effectthat aggregation (see Attraction/Avoidance section) may have onentrainment and impingement.
In predicting impacts of conventional power plant operations onfish population levels, scientists have relied on life cycle modelswhich focus on those components of the life cycle which are susceptible to power plant effects at the appropriate stages. Simple modelstake a gross view of the life cycle, examine the environment in whichthe species exist, and incorporate details of the plant operations andeffects. More complex models account for increased temporalresolution, more detailed environmental variation, and knowledgeof behavioral responses to changes in the environment.
Table 7.-Estimated loss of living carbon and equivalent harvestable stock due to entrainmentand impingement during operation of a 4O-MWe OTEC plant (kg C/d). (Based on Peters 1983).
Phytoplankton Microzooplankton Macrozooplankton Micronekton
EntrainmentPrimarySecondary
ImpingementTotalTrophic transfersTransfer efficiencyEquivalent harvest-
able stock·0.07 - 0.12 0.05-0.08
23
0.150.80-1.4 0.90-1.5

With OfEC, adverse impacts cannot be examined with any degreeof confidence because what information is available on fish eggsand larvae at potential sites is not sufficiently precise. Furthermore,effects from operations of conventional power plants can hardlybe extrapolated to that of an OfEC plant because of the unprecedented volume of water the latter is expected to pump andthe redistribution of water properties that will occur. However, inthe absence of data which can be used as input into a life cyclemodel, a crude evaluation of OfEC-related impacts on fisherieshas been made by Matsumoto (1984) for the purpose of this study.
Based on a review of the combined effects of impingement, directentrainment, and biocide usage to fish, Matsumoto (1984) concludedthat an assumption of total mortality of all fish eggs, larvae andjuveniles, directly entrained is not unreasonable. Because the eggsand larvae of most fishes caught commercially off Kahe Point arebuoyant and tend to reside near or at the surface, the degree of secondary entrainment of fish eggs and larvae will be very dependenton the discharge depth of the effluent. Little is known regardingthe effects of secondary entrainment; however, Matsumoto (1984)believes the effects would be minimal for deep (e.g., 100 m)discharges. More information is needed, however, on the microdistribution of fish eggs and larvae to judge whether such a conclusion would be justified for shallow discharges where the degreeof secondary entrainment may be 10 to 20 times (worst case) thatof direct entrainment on the warm water side. If 100% mortalityis assumed for both direct and secondary entrainment, one mustthen ask what effect this will have on fisheries.
Off Kahe Point, the principal fisheries that would be affected byOfEC operations include six pelagic and two demersal fish groupsrepresenting 98 % by weight of the area's total annual production.The pelagic forms include tunas (mainly skipjack and yellowfintuna), billfishes (Pacific blue and striped marlin), mahimahi, wahoo,bonefish, and jacks (principally scads), where the demersal formsinclude goatfishes (six species) and snappers (eight species).
Based on density values of tuna and billfish larvae at depths nearthe warm water intake and discharge points, and warm and coldwater intake rates of 160 m3/s (i.e., 4 m3 ·s-I.MWe- I), Matsumoto (1984) has estimated the extent of damage from the plannedOcean Thermal Corporation plant at Kahe Point. Assuming totalmortality during entrainment, it was estimated 13.7 million skipjack and 5.5 million yellowfin larvae will be killed each spawningseason. To be more realistic, these mortality figures must be adjusted for natural mortality which is estimated at 93 % for skipjackand 91 % for yellowfin. This would result in estimates of OfECinduced mortality of 1.0 million and 0.5 million, respectively. Anyeffects of secondary entrainment would add to these figures;however, Matsumoto suspects that the effects of secondary entrainment would be minimal.
The OfEC plant is also expected to function as a fish aggregatingdevice and attract fish from adjacent areas. Any increase of largeaggregations of fishes, such as tunas, mahimahi, mackerels, andcarangids, will eventually result in concentrated spawnings aroundthe plant, subjecting more than the usual amounts of eggs and larvae to entrainment effects.
The impact on fisheries will be largely through the recruitmentprocess. Through recruitment, the impact on pelagic species, particularly tunas, is not expected to be noticeable because most ofthem are migrants from the eastern Pacific fishery, the northwesternPacific, and from equatorial waters. The effects of recruitment onbottom and reef-associated fishes would most likely be felt in areasfurther downstream from the plant site. If the prevailing currentscarry the eggs and larvae along the coast and out into open ocean,
14
the full impact of the damages caused by the plant may not be apparent at the plant site.
Direct effects could occur, however, in the demersal fishery. Forthe Ocean Thermal Corporation OfEC design for Kahe Point, Oahu(see Application section), warm effluent from the Hawaiian Electric conventional powerplant at Kahe Point is used as a supplementary heat source, and sand particles which are contained in this effluent (McCain 1977; Coles 1980) will eventually be dischargedover the escarpment and build up over a period of time, blanketingthe rocky bottom near the discharge point. The effect would be toforce fishes such as snappers to relocate to other areas. The neteffect to the fishery should be negligible, however, since demersalspecies comprise only a small portion (1. 3%) of the total fish production off Kahe Point.
Turning to Puerto Rico, we find that the principal fisheries offPunta Tuna include four demersal and one pelagic fish groupsrepresenting 72 % of the fish taken along the eastern coastline. Thedemersal group includes groupers (14 species), grunts (II species),snappers (14 species), and porgies (3 species); the pelagic groupis comprised of mackerels (2 species). Other pelagic fishes, suchas tunas, marlins, dolphins, and jacks, comprise 1.8% of the totalfish production and are caught in small numbers.
The potential effects of OfEC plant operations on pelagic fishesoff Punta Tuna are also believed by Matsumoto (1984) to be insignificant. The effects there on demersal and reef fishes, however,cannot be estimated in the absence of appropriate data and biologicalinformation.
MEASURES TO REDUCEPOTENTIAL EFFECTSTO FISHERIES _
From the previous chapter and background reports, one can conclude that there will remain some level of uncertainty regardingthe potential risk to fisheries due to construction and operation ofan OfEC plant until a full-scale OfEC operation can be monitoredfor some period of time. However, certain aspects of an OfECoperation warrant enough concern to examine measures that wouldminimize the risk to fisheries of early plant operations.
First, from the viewpoint of general environmental risk, propersiting is the single most effective means to minimize the potentialfor environmental damage. The avoidance of areas of high biologicalproductivity and others of special biological importance (e.g.,critical habitats, spawning grounds, coral reefs) is desirable.However, the flexibility in choice of location may be limited in manyof the islands that have a suitable thermal resource. For instance,as noted by Uchida (1983), there are a number of sites in Hawaiianwaters that satisfy criteria for both nearshore floating and shorebased OfEC power plants. However, on the island of Oahu, onlythe area along the Waianae coast from Barbers Point to Kaena Pointwas concluded to meet certain criteria for OfEC siting (Shupe1982). Along or offshore of this part of the Oahu coast are majorcoral formations and important commercial and recreationalfisheries.
Once the location has been tentatively chosen, preliminaryoceanographic information will have to be collected to identify initial engineering flexibility. This will include information on thethermal resource. waves and tides, currents, and extreme oceanographic events.
The power produced, and thus the cost-effectiveness of a plant,is highly dependent upon the thermal resource (aT). For an islandplant, the site selected will therefore have to offer a suitable thermal

resource within a reasonable distance of shore. One of the majortrade-offs for the conceptual design by Ocean Thermal Corporation for Kahe Point, Oahu, Hawaii (Ocean Thermal Corporation1983), was the distance offshore for placement of their "artificialisland" system. The artificial island would require greater structural and construction costs in deeper waters; however, greaterdistances offshore also reduce the cost of the cold water pipe (i.e.,less length) required to achieve a certain aT. Greater distances offshore also reduce the cost of effluent pipes. The study conductedby OTC indicated that a plant in about 15 m of water was optimalfor their design.
Assuming normal operation of an OTEC plant at a suitable location, the most important design features for which there is someflexibility to reduce the potential threat to fisheries are the cold waterintake, warm water intake, discharge, and chemical additions. Thesetopics are discussed in the following sections.
Cold Water Intake
Generally, reviews by Hoss and Peters (1983) and Uchida (1983)reveal that the direct environmental implications of the deep waterintake of cold water are small. The depths involved are below theeuphotic zone, estimated to be in the range of 100-150 m in subtropical waters of the Caribbean and the Pacific. As a consequence,the entrainment of phytoplankton by the cold water pipe (CWP)is not a concern.
The information on zooplankton distributions indicated that theCWP will entrain certain zooplankton. It is also apparent that thedeeper the placement of the CWP intake, the fewer the number ofzooplankton that will be entrained. If the CWP intake could be placedbeneath the zone within which certain zooplankton undergo dielmigrations (see Zooplankton section), this would also help tominimize entrainment. However, the extension of the CWP to depthsdeeper than necessary to achieve the needed aT would be very expensive, since this is one area where present technology is beingadvanced. This could also totally upset the financial aspects of aplant since the CWP construction and deployment costs will comprise a major percentage of the total construction and deploymentcosts.
It might be argued that the cost of extending the CWP to deeperdepths to achieve less entrainment of zooplankton would be offsetby a decrease in seawater volume requirements, and thus pumpingrequirements, if a sufficiently greater aT was obtained. Althoughsuch trade-offs will have to be examined on a site-specific basis,such factors tend to balance out when consideration is given to otherfactors such as the increase in pipe frictional losses. Any extensionof the CWP is going to be expensive. Furthermore, although deepzooplankton playa role in the food web and thus fisheries, it isnot a well defined role as yet. Therefore, the true benefit of tryingto avoid deep zooplankton entrainment cannot be quantified withthe present state of knowledge.
As noted by Hoss et al. (1983) and in the section on Eggs andLarvae of Important Species, little information is available on thevertical distribution of fish eggs and larvae in the Caribbean andPacific. However, it appears that they are most abundant in the upper25 m, particularly at night. Although Miller (1979) suggests theremay be a deep source of certain larvae in waters nearshore KahePoint, few larvae are found below 200 m. The relative lack of information on fish larvae suggests that additional information shouldbe gathered at specific OTEC sites when a design is contemplated.
The most significant environmental implication of the CWP in-
25
take would appear to be related to the intake in these deep watersof nutrients and other natural chemical constituents, which aregenerally present in greater concentrations here than in surfacewaters (NOAA 1981a). Since the potential environmental impactdoes not relate to the intake as much as to the discharge of theseconstituents back to the ocean near the surface, this topic is takenup under discharges (see Discharge Location and Configuration).
To conclude this section, it is suggested that for most situationsthe placement and configuration of the CWP will be driven byeconomic considerations. However, the lack of flexibility in designdoes not seem to imply any significant disadvantage in terms ofpotential environmental impact and risk to fisheries.
Warm Water Intake
As discussed under Biological Interaction with the Environment,the warm water intake will have significant interaction with thebiological environment, entraining or impinging phytoplankton,zooplankton, ichthyoplankton, and fish.
Generally (see Phytoplankton), the concentration of phytoplanktonincreases near tropical and subtropical islands due both to the upwelling of nutrients from depths as well as a greater input of nutrientsfrom the land mass. Also, in both the Caribbean and Pacific areasunder discussion, the levels of maximum phytoplankton biomasstend to be near the l00-m level, near the bottom of the mixed layer.For instance, for waters off Keahole Point, Hawaii, Noda et al.(1980) reported that the subsurface chlorophyll maximum occurredbetween 64 and 94 m. Chlorophyll-a levels tended to be relativelyconstant in the top 40 m or so of the water column. In general,they increase below this level to the levels found at the chlorophyllmaximum and then quickly decrease to very low values, with thelowest values occurring beneath the euphotic zone. As noted byUchida (1983) for six cruises in the Kahe Point environment, Nodaet al. (1981a) observed that the chlorophyll maximum remainedrelatively constant in its vertical position at 86 m as well as in itsconcentration. Furthermore, this layer accounted for 77% of thechorophyll biomass in the photic zone.
The discussion in the section Impacts on Fishery Food Chainssuggests that the predatory effect on harvestable fish stock causedby any food chain effect of the entrainment of phytoplankton is nota concern. However, where the design flexibility exists, it is probably prudent to avoid the direct entrainment of phytoplankton tothe extent practicable. In light ofthe information on phytoplanktondistributions, this would suggest that the warm water intake of anOTEC plant should probably be located in shallow water (i.e., 0-40m). The secondary entrainment of phytoplankton is a separate issueand is discussed under the next section.
As discussed in the Zooplankton section, the abundance ofzooplankton tends to be greatest near the level of the chlorophyllmaximum, particularly at night when many zooplankters migratefrom both deeper and shallower waters to this level. Thus, theavoidance of zooplankton to the extent practicable also suggestsrelatively shallow warm-water intake depths. However, as in thecase of phytoplankton, the effect on fish stocks due to the predation of zooplankton by an OTEC plant of 40-MWe capacity is notexpected to be significant (see Impacts on Fishery Food Chains).
Like phytoplankton, zooplankton also exhibit an island mass effect with concentrations higher at nearshore locations (seeZooplankton section). However, as evident in Table 8 for Caribbean waters, the gradient in surface zooplankton concentration isnot great enough to warrant the extension, for a land-based plant,

Table 8.-Mean displacement volume, dry weight, and abundance of surface zooplankton at islandsites in the Caribbean. All samples were taken with 203 I'It1 or 239 I'It1 mesh nets (from Dosset al. 1983).
Distance Water Displacementoffshore depth volume Dry weight Abundance
Location (kIn) (m) (rnJ/m3) (mg/m3) (no./m3) Source
Puerto Rico 0.5-1.0 10 0.086 818 Youngbluth 1979Barbados <1 10 0.049 4.00 Sander and Steven 1973Barbados 2 25 0.041 3.05 345 Moore and Sander 1976Barbados 10 460 0.Q28 2.40 368 Sander and Steven 1973
Moore and Sander 1977Jamaica I 35 0.043 8.28 1600 Moore 1967Jamaica 8 900 0.021 3.30 823 Moore 1967
of a warm water intake to waters, say, 10 krn offshore. For instance, the data suggest that the entrainment of zooplankton mightbe halved for an extension of the intake from less than 1 krn to,say, 10 krn. However, the suggestion of an insignificant effect ofzooplankton entrainment on fisheries would not justify the benefitof this entrainment reduction, if indeed it was to be realized. Onthe other hand, if there was some flexibility over the location ofthe plant, e.g., whether it could be land-based or a shelf-sitter, theshelf-sitter with its location and intake being further offshore mightimply a lower environmental risk on qualitative grounds, other factors being equal.
The only conclusion which can be drawn from observations oflarval fish (see Eggs and Larvae section) is that the actual distributions may be quite complex. The implication is that the spatial/temporal and species distribution of larval fish should be determinedbefore engineering flexibility in the location of the warm water intake is considered.
From the standpoint of impingement and entrainment of adultfish, the warm-water intake velocity is a critical factor with lowervelocities being more desirable (see Impingement section). Thegeneral guideline regarding velocities for conventional power plantintakes is to keep the velocity below 15 cm/s so as to allow fishto escape the screen wells (U .S. Environmental Protection Agency 1973). Although the effectiveness of velocity caps (covers usedto create horizontal velocity fields for a vertical intake) to reducefish entrainment is not universally accepted, EPA recommends theiruse for offshore, submerged intakes; the principle is that fish tendto avoid horizontal velocity fields more so than vertical ones (seeImpingement section).
Discharge Location and Configuration
The discharge of effluent waters from an OTEC operation has important implications for both the operation of the plant and its environmental effect. It is of great importance that discharge watersnot recirculate to the warm water intake and thereby reduce theeffective thermal resource of the plant. However, for most situations the negative buoyancy of the discharge plume and the initialdilutions achieved (see Effluent Discharge section) should assurethat recirculation is not a problem. It is also of great importancethat a discharge scheme be chosen so as to minimize the potentialeffects to fisheries and other biological resources. As discussed,the initial and, to a certain extent, subsequent fates of the effluentplume will be very dependent upon the density of the discharge,the configuration of the discharge outlet, the vertical ambient density distribution, and the presence of currents.
Several discharge situations were examined in the Effluent Dis-
26
charge section: separate and mixed discharges from a 40-MWeOTEC plant to two water types that are representative of situationsfound offshore of Kahe Point, Oahu, and Punta Tuna, Puerto Rico.Discharges at depths of 20 m and 100 m were considered for bothsituations.
For the Kahe Point case considered, the upper 50 m were fairlymixed so that there was little stratification in density. The calculations showed that there would be little impedance to the sinkingof effluent plumes, whether mixed or separate, until a depth of50-100 m was reached. Discharges at 100 m did not stray too farfrom that depth because of the stronger stratification there.Calculated dilutions were in the range of 4-7.
The Punta Tuna case was somewhat different because of thestronger density stratification present. A separate warm waterdischarge at 20 m fell to 30 m, achieving a dilution of about 4;whereas a separate cold water discharge fell further, to 55 m witha dilution of 5.5. A separate warm water discharge at 100 m rose,because of its positive buoyancy at that depth, to 75 m with a dilution of 5; the separate cold water discharge at 100 m fell to 160m with a dilution of 7. A mixed discharge at the 20-m depth fell25 m to a depth of45 m with a dilution of4.5, and a mixed dischargeat 100 m fell 15 m to 115 m with a dilution of 5.
Although the examples offered are limited, they do provide anindication as to how the level of neutral buoyancy (where the densityof the plume equals that of the ambient waters) and dilutions areaffected by the type of discharge. For a given situation, larger differences in density between the discharge and receiving waters willinvolve longer trajectories and higher dilutions before a neutralbuoyancy is achieved. This may be desirable if dilution and removalof certain constituents (e.g., chlorine) from the immediate environment is desired. However, it might be undesirable if the redistribution of organisms is a concern, or if the utilization of nutrients fromthe cold water is possible and desired. Long trajectories and highdilutions also result in larger secondary entrainment of the organismswhich could have an effect many times that of primary entrainment.
This brief treatment of discharge schemes provides only a glimpseof the discharge possibilities and how they might be used to advantage. The presence of currents, occurrence of coastal upwelling,and placement of the plant will greatly influence the final schemeschosen. Also if the plant is land-based, an artificial island, or a shelfsitter, the presence of the seabed may influence the selection. Forexample, a mixed effluent discharged to shallow waters will probably hit the seabed before it reaches its level of neutral buoyancy.This would affect the rate of subsequent dilution and also causeimpact to benthic biological resources in the area, such as corals.It is obvious that the discharge scheme, more so than either of theintakes, will have to be fine-tuned to the environmental conditionsat a site.

Chemical Additions
Chemicals will be added to the seawater pumped through an OfECplant by the corrosion/erosion of heat exchanger surfaces, the addition of biocides to control the biofouling of heat exchanger surfaces, and the leaking of working fluids. The release rates will bedetermined by both the engineering design and the biologicalchemical characteristics of the local ambient waters. For the mostpart, the normal release of working fluids and metals from heatexchanger and other surfaces is not expected to be a problem (seeChemical Additions section).
Given that a biocide such as cWorine may be a necessary evilfor an OTEC operation, a certain amount of engineering flexibility can still be utilized to reduce the degree or scale of potentialeffects. All of the previously discussed options are definite candidates (i.e., plant location and intake/discharge schemes). For instance, achieving a high dilution and a level of neutral buoyancybelow the euphotic zone may be very desirable to limit the exposureof biota to the biocide. This would require the identification of acertain optimal discharge scheme. In addition, certain dosingschemes can be used.
Flexibility in biocide dosing might involve applying the biocideto different power modules at different times and mixing the dosedmodule effluent with other module effluents to create some degreeof pre-dilution. For instance, if a 40-MWe OfEC plant was composed of four lO-MWe modules and the condenser and evaporatorcould be dosed separately, a certain dose to one of the evaporatorunits and subsequent mixing with the total warm and cold waterdischarge would produce a dilution of 8 to I prior to discharge.In other words, a free residual cWorine level of 0.05 JAg/g in theeffluent of the evaporator or unit in question would be diluted to0.006 JAg/g before discharge to the environment. Initial dilutionsof 5 to 10 could further reduce these concentrations to 0.0012 and0.0006 JAg/g, respectively.
RESEARCH PRIORITIES _
The preceding sections have presented information and inferencesregarding the potential effects of OfEC operations on fisheries. Thediscussions have primarily relied upon information on power planteffects in temperate waters and the limited biological informationavailable for tropical waters. Although such an assessment providesvaluable insights regarding the effects of early small-scale OfECdevelopment, a more thorough assessment will eventually be needed.To do so will require much additional research of both generic andsite-specific types as defined below. However, although furtherresearch is needed, the preceding sections also allude to areas whereadditional information is either not needed or deemed to be unimportant. Specifically, the assessments in the Biological Interactionssection of the predatory effect of an OfEC plant on phytoplanktonand zooplankton (with the exception of ichthyoplankton) would suggest that the effect is so minimal as to not warrant further investigation of this topic. As emphasized below, additional information onthe eggs and larvae of fish is direly needed.
Investigations of Fish Distribution
There is almost no quantitative information available on the distribution of the early life stages (eggs to juveniles) of fish in tropicalwaters. Both spatial and temporal information of this type is needed
27
and should be given high priority, in order to determine the potential numbers of fish that will be subjected to impingement andprimary and secondary entrainment. An understanding of thedistribution of fish in the water column may allow plant modifications to be made that will help decrease the environmental impactof OfEC operations.
Studies on the Effects of Entrainment
Primary and secondary entrainment effects associated with OfECare potentially important because of the extremely large volumesof water involved. Unlike conventional power plants whereorganisms experience an increase in temperature as they passthrough the condensers, larval fish entrained in an OfEC plant willbe subjected to a decrease in temperature of about 2°C upon passagethrough the evaporators. Additionally, in the case of a mixeddischarge, organisms entrained in the warm water intake will befurther subjected to a decrease in temperature of about 10°C whenthe warm and cold waters are mixed. Depending on where thisdischarge is made, secondary entrainment may expose additionalorganisms to some temperature decreases.
Since we found no reported work on the effects of cold shockon the young of tropical fish, research on this subject was initiatedby the National Marine Fisheries Service. This research is examiningthe effects of cold shock (using realistic decreases in temperature)that could occur as a result of entrainment. In the future, factorssuch as the addition of biocides and increased levels of trace metalsin the water should be examined in conjunction with the temperaturestudies.
Biostimulation/Inhibition
The OfEC plants are unique in their utilization of cold water fromthe deep ocean. This use of large amounts of deep ocean watercreates a potential for changes in the upper part of the water columnsimilar to those caused by natural upwelling. The increased nutrientload of cold, deep ocean waters may have stimulating, inhibiting,or no effects on the productivity of marine fisheries.
Although some experiments have described the effect of mixingdeep water with surface waters at potential OfEC sites (e.g.,Quinby-Hunt 1979; Szyper et al. 1984), further work is needed.This research should look at nutrient and trace metal distributionsof waters from different depths and test their ability to affect primaryproduction and species composition. This type of research can becompleted in a relatively short time, and the results must then becombined with the effects of natural nutrient fluxes to determinethe ecological significance of potential changes in primary production.
Early Life History Studies
It appears that the major direct impacts of OfEC operations on fishwill be on the early stages in their life history. In order to evaluateOfEC impacts on these stages, we need more information on theirabundance, distribution, migration, and growth and mortality rates.Generic information on tropical species is lacking and general principles may be applicable to many species. Such information shouldbe collected, starting with some of the major recreational and commercial species. The duration for this type of research is in years,but specific parts can be completed in less time.

Dynamics of Fishery Populations
The research priorities outlined above are directed at establishingthe effects of afEC operations on the biological community whichsupports and includes harvested fishery populations. Such researchshould indicate whether effects may be positive or negative andsupply information needed to predict the number and life stage offish directly impacted. In order to evaluate any such effects as theyrelate to commercial or recreational fisheries, additional information is needed. For example, while some information is availableon many of the fisheries, much more is needed, including:
1) Stock structure (i.e., the number and geographic distributionof the stocks);
2) stock assessment over time, which depends upon age distribution of the stocks, size at age, and age-specific fecundity,
3) accurate catch and effort statistics, and4) increased information about the factors affecting recruitment,
including development of models to predict compensation for mortality at various early life stages.Although parts of this research area can be performed over shorttime scales, the topic as a whole will require years to addressadequately.
Ciguatera
Independent of other impacts, fisheries could be severely impactedif the fish present were inedible due to ciguatera fish poisoning,which occurs in many tropical waters. Current information is inadequate to predict or prevent such an occurrence, and additionalinformation is needed, including a description of the environmental factors responsible for blooms of the toxin-producing algae,methods of easily detecting contaminated fish, and methods ofmitigation.
Construction Effects
Further research is also needed to properly assess the effects fromdisturbances to the environment (including the fisheries) by actualconstruction of the afEC facility. Any dredging in open seas willgenerate turbidity and sedimentation, not only in the immediate areaof construction but also in adjacent areas. Sediment in the dredging plume will settle out ofthe water column, covering and perhapskilling some benthic life, including, possibly, coral communities.Dredging has also been found to be correlated with outbreaks ofciguatera poisoning. Thus, in addition to the information neededon ciguatera, there is a need to gather data on effects of sedimentson coral reef ecosystems as well as on the downstream extent ofthe dredging plume.
CONCLUSIONS _
This report examines the potential impact to fisheries due to theoperation of ocean thermal energy conversion (afEC) plants. Theeffort is primarily a synthesis of existing information that has pertinence to the topic, and an extrapolation to conditions brought aboutby afEC operations. The intent was to gain a perspective of thepotential risk to fisheries, to identify practicable measures that wouldreduce the potential for problems, and to suggest research areaswhere significant uncertainties exist, uncertainties that under certain conditions might impede the commercial development of afEC.
28
The report focused on two regions where U.S. afEC interestsmight lie: the Caribbean and the Pacific. It also focused on nearshore operation of afEC as compared to open ocean application;the rationale here is that the nearshore area is considered to be themore ecologically sensitive as well as more likely to see afECdevelopment in the near term. Additionally, the report has containeditself primarily to those factors of concern that would be associatedwith the normal operating conditions of an afEC plant: the impingement and direct entrainment of biota, the secondary entrainmentof biota, the redistribution of ocean water properties, and the addition of biocides and other chemical constituents. These concernsare highlighted by the relatively large volume of water that willbe pumped through afEC plants.
Fish impingement rates caused by these flows will depend on theabundance of fish which are larger than the mesh size of an afECintake screen and on the ability of the fish to avoid the intake.Although this avoidance ability will also depend on a number offactors, it can be increased through the use or creation of horizontal intake flow fields. It can also be increased by keeping the flowspeeds as low as practicable. It is estimated that a 4O-MWe Hawaiianor Puerto Rican afEC plant would impinge about 20-35 kg oforganisms daily, due to the warm water intake, and another 40-65kg at the cold water intake. It is estimated that the effect on a fisheryof such impingement rates will be negligible compared to otherpressures on a fishery; however, the use of the above mitigatingmeasures and attempts to locate intakes away from areas of highbiological activity are recommended.
Organisms, including fish eggs and larvae, that are caught upin the intake flows and not impinged, will be entrained, travelthrough the plant, and then be discharged. Although the combinedeffect of the various stresses that these entrained organisms wouldundergo is difficult to quantify with accuracy, it is considered prudent to assume 100% mortality until better knowledge is available.Additionally, entrainment mortality will be added to by the secondary entrainment of organisms. This entrainment is due to adischarge plume that, in falling or rising to find its level of neutral I
buoyancy, entrains surrounding water and biota as it is diluted. Withtypical dilution ratios expected to be in the range of 5: 1 to 10: 1,the level of secondary entrainment may be quite high. However,until further information is gathered, assessments of the associatedmortality are very subjective. It is concluded that cold shock to biotamay be the main concern with· secondary entrainment and thatorganisms may only suffer slightly. However, the most vulnerableof the organisms will be the non-migratory species; and these, unfortunately, include many larvae.
afEC plants have the potential of influencing the food chainsleading to fish in several ways. Increased fish production can occur through either more primary production or shorter food chains,either of which could result from the "pumped upwelling" ofnutrient-rich deep water. On the other hand, minor changes in foodwebs may drastically alter our acceptance of the fish produced. Forexample, blooms of the dinoflagellates which cause red tides orciguatera can make the fish inedible. Although more informationis needed on such processes, red tide outbreaks are not expectedand the minimization of benthic disturbances during afEC construction and operation will reduce the likelihood of ciguateraoutbreaks.
In trying to examine impacts to fisheries due to mortalitiesassociated with OTEC operations, one key problem is the lack ofdetailed information on the spatial and temporal distribution of fisheggs and larvae, the natural mortality of most fish, and the rangeof natural variability associated with the various life stages of fish.

This results in a low degree of confidence in anything beyond rathersubjective conclusions. However, even these conclusions arevaluable until further information is gained.
Design measures that might be taken to reduce the potential riskto fisheries relate to the location of the plant, location and configuration of the intakes and discharges, and the mode of introducingbiocides to the system. From the viewpoint of general environmentalrisk, proper siting is the single most effective means to minimizethe potential for environmental damage. Here, the avoidance of areasof high biological productivity and of others of special importance(e.g., critical habitats, spawning grounds, coral reefs) is desirable.
For most situations the placement and configuration of the coldwater pipe will be constrained purely by economic considerations.However, the perceived lack of flexibility does not seem to implyany significant disadvantage in terms of potential environmentalimpact and risk to fisheries. Regarding the warm water intake, itis felt that more information is needed on the microscale distribution of fish eggs and larvae. However, in general, it is believedthat warm water intakes placed below the surface, where many fisheggs tend to concentrate, and above the chlorophyll maximum maybe most desirable. This suggests a placement between about 10 and40 m. Additionally, if there was some flexibility over the locationof the plant, particularly its warm water intake, a plant located further offshore might imply a lower environmental and fishery riskon qualitative grounds, other factors being equal.
The placement and configuration of discharges will be a very sitespecific consideration. Mixed vs. separate, and deep vs. shallow,discharges can achieve different dilutions and levels of neutralbuoyancy. Different permutations have implications regarding theutilization of cold water nutrients, the potential for recirculationinto the warm water intake, the degree of secondary entrainment,the amount of cold shock, and the concentration of biocides. Brieftreatment of the possibilities suggests that in deeper waters thedischarge of a mixed effluent near the surface would offer a numberof advantages. First, the cost of the discharge structure is minimized.Second, the plume, because of the density addition provided by themixed cold water, would probably sink deep enough to avoid problems of recirculation into the warm water intake. Third, sufficientdilution would be imparted to minimize potential problems withbiocides and other trace constituents. Also, the mixed dischargewould minimize the degree of cold shock to organisms secondarilyentrained. However, with the discharge near the surface, there maybe some impact associated with the entrainment of ambient waterand organisms into the discharge plume.
The presence of currents, occurrences of coastal upwelling, andplacement of the plant will also influence the final discharge schemechosen for a particular plant. For instance, for a land-based or verynearshore plant, the effluent from a nearsurface discharge will probably hit the seabed and roll down it before the level of neutralbuoyancy is reached. Depending upon a number of factors, e.g.,benthic resources, this might necessitate a deep discharge.
In general, it is not believed that the effect of the corrosionproducts of metals will be a problem with OfEC. However, theaddition of chlorine as an antifoulant over long time periods doescreate some concern. Although more information is needed on thechemistry and long-term effects of chlorine, this concern is lessenedthrough the achievement of high dilutions of the biocide and/or alevel of neutral buoyancy near the bottom of the euphotic zone.Certain dosing schemes can be utilized to achieve predilutions that,combined with the initial dilution process would result in much lowerlevels of biocides in the environment.
29
In conclusion, the potential risk to fisheries of OfEC operationsis not judged to be so great as to not proceed with the early development of OfEC. Due to the lack of a suitable precedent, however,there will remain some level of uncertainty regarding these initialconclusions until a pilot plant operation can be monitored for someperiod of time. In the meantime, further research on fisheries shouldbe undertaken to assure an acceptable level of risk regarding thelarger commercial OfEC deployments.
REFERENCES _
ADAMS, J. R.1969. Ecological investigations around some thermal power stations in Califor
nia tidal waters. Chesapeake Sci. 10: 145-154.AHLSTROM, E. H.
1971 . Kinds and abundance of fish larvae in the eastern tropical Pacific, basedon collections made on EASTROPAC I. Fish. Bull., U.S. 70:3-77.
1972. Kinds and abundance of fish larvae in the eastern tropical Pacific on thesecond multivessel EASTROPAC survey, and observations on the annual cycleof abundance. Fish. Bull., U.S. 70: 1153-1242.
ALLENDER, J. H., J. D. DITMARS, R. A. PADDOCK, and K. D. SAUNDERS.1978. OfEC physical and climatic environmental impacts: an overview of model
ing efforts and needs. In Proceedings, 5th Ocean thermal energy conversionconference, pp. III-165 - III-I 85. Conf-780236, U.S. Department of Energy,Wash., D.C.
AVERY, W. H., D. RJCHARDS, and G. L. DUGGER.1985. Hydrogen generation by electrolysis, and economical energy transfer to
world markets via ammonia and methanol. IntI. J. Hydro. Energy 10(11):727-736.
BAGNIS, R.1981. L'ichtyosarcotoxisme de type ciguateria: Phenomene complexe de biologie
marine et humaine. Oceanol. Acta 4(3):375-387.BAINBRIDGE, R.
1960. Speed and stamina in three fish. J. Exp. BioI. 37: 129-153.BATHEN, K. H.
1975. Oceanographic and socio-economic aspects of an ocean thermal energyconversion pilot plant in subtropical Hawaiian water. Proceedings, Thirdworkshop on ocean thermal energy conversion (OfEC). Report APLlJHU SR75-2, The Johns Hopkins University, Applied Physics Laboratory, Laurel, MD.,232 p.
1977. The Behavior of nearsurface ocean currents, plankton biology, benthiccurrents and ocean temperatures to depths of 2200 feet at a potential OfECsite off Keahole Point, Hawaii. A report submitted to State of Hawaii, Department of Planning and Economic Development, by Department of OceanEngineering, College of Engineering, University of Hawaii, Honolulu, 92 p.
1978. Circulation atlas for Oahu, Hawaii. University of Hawaii Sea Grant College Program, UNIHI-SEAGRANT-MR-78-05, Honolulu.
BECKER, C. D., R. G. GENOWAY, and M. J. SCHNEIDER.1977. Comparative cold resistance of three Columbia River organisms. Trans.
Am. Fish. Soc. 106: 178-184.BEERS, 1. R., D. M. STEVEN, and J. B. LEWIS.
1968. Primary productivity in the Caribbean Sea off Jamaica and the tropicalNorth Atlantic off Barbados. Bull. Mar. Sci. 18:86-104.
BEERS, J. R., and G. L. STEWART.1969. Micro-zooplankton and its abundance relative to the larger zooplankton
and other seston components. Mar. BioI. 4: 182-189.1971. Microzooplankton in the plankton communities of the upper waters of
the eastern tropical Pacific. Deep-Sea Res. 18:861-883.BIENFANG, P. K., and J. P. SZYPER.
1982. Photosynthetic response of subtropical phytoplankton populations to deepwater nutrient enrichment. Report LBID-467, Lawrence Berkeley Lab., Univ.Calif., Berkeley, 24 p.
BISHAI, H. M.
1960. The effect of water currents on the survival and distribution of fish larvae. J. Cons. Perm. int. Explor. Mer. 25: 134-146.
BLAXTER, J. H. S.
1966. The effect of light intensity on the feeding ecology of herring. Brit. Ecol.Soc. Symp. 6:393-409.
1969. Development: eggs and larvae. In W. S. Hoar and D. J. Randall (eds.),Fish physiology, Vol. 13, Reproduction and growth, bioluminescence pigmentsand poisons, p. 177-252. Academic Press, New York.

BLAXTER, J. H. S., and D. E. HOSS.1979. The effect of rapid changes of hydrostatic pressure on the Atlantic herr
ing Clupea harengus L. II. The response of the auditory bulla system in larvaeand juveniles. J. Exp. Mar. BioI. Ecol. 41:87-100.
BRADLEY, B. P.1978. Genetic and physiological flexibility of a calanoid copepod in thermal
stress. In J. H. Thorp and J. W. Gibbons (eds.), Energy and environmentalstress in aquatic systems, p. 452-469. U.S. Department of Energy, Wash., D.C.
(Available from NTIS: CONF-77 I 114.)BRAUM, E.
1964. ExperimenteUe untersuchungen zur ersten nahrungsaufnahme und biologieund jungfischen von blaufelchen (Coregonus wartmani Bloch), Werssfelchen(Coregonus fera jurine) and Hechten (Esox lucius L.). Arch. Hydrobiol
28(2/3): 183-244.
BRETT, J. R.1956. Some principles of the thermal requirement of fishes. Q Rev. Bill!.
31:75-87.BREWER, J. H.
1979. Land-based arEC plants - Cold water pipe concepts. In G. L. Dugger(ed.), Ocean thermal energy for the 80's. Proceedings, 6th arEC conference,
p. 5.10-1 to 5.10-6. U.S. Department of Energy, Wash., D.C.CARLISLE, 1. G., C. H. TURNER, and E. E. EBERT.
1964. Artificial habitat in the marine environment. Calif. Dep. Fish and Game,Fish Bull. 124, 113 p.
CHITTENDEN, M. E.1972. Responses of young American shad, Alosa sapidissima, to low tempera
tures. Trans. Am. Fish. Soc. 4:680-685.
COLES, S. L.1980. Annual report - Kahe generating station NPDES monitoring program,
Vols. I-II. Hawaiian Electric Company, Inc., Honolulu, unpaged.DEEVEY, G. B.
1971. The annual cycle in quantity and composition of the zooplankton of theSargasso Sea off Bermuda. I. The upper 600 m. Limnol. Oceanogr. 16(2):219-240.
DEEVEY, G. B., and A. L. BROOKS.1971 . The annual cycle in quantity and composition of the zooplankton of the
Sargasso Sea off Bermuda. II. The surface to 2000 m. Limnol. Oceanogr.16(6):927-943.
DEKHNIK, T. V., M. HUARES, and D. SALABARJYA.1973. Distribution of pelagic eggs and larvae of fishes in the coastal waters of
Cuba. In Investigations of the Central American seas, p. 189-241. [Translatedfrom Russian.) Published for Smithsonian Institution and National Science Foundation, Wash., D.C., by Indian National Scientific Documentation Centre, NewDelhi, India (Available from NTIS:TT70-57762).
DITMARS, J. D.1979. Assessment and control ofarEC physical environmental impacts. In Pro
ceedings, Environmental control symposium, p. 142-151. Report DOEIEV-0046, Vol. 3, U.S. Department of Energy, Wash., D.C.
DITMARS, J. D., and R. A. PADDOCK.1979. arEC physical and climatic environmental impacts. In Proceedings, 6th
OTECconference, p. 13.11-1 to 13.11-8. U.S. Department of Energy, Wash ..D.C.
DRAGESUND, O.1958. Reactions to artificial light, with special reference to large herring and
spring herring in Norway. J. Cons. Int. Explor. Mer 23:213-227.DUGAS, R., V. GUILLORY, and M. FISCHER.
1979. Oil rigs and offshore sport fishing in Louisiana. Fisheries 4(6):2-10.DUGGER, G. L., D. RICHARDS, E. J. FRANCIS, L. L. PERINI, W. H. AVERY,
and P. J. RJTZCOVAN.1982. arEC energy products and GEarEC plants. ASME Solar energy technical
conference, April 1982. American Society of Mechanical Engineers, IIp.EG&G, ENVIRONMENTAL CONSULTANTS.
1980. Current observations offshore Keahole Point, Hawaii, 24 July to 19September 1980. Preliminary data report prepared for Lawrence BerkeleyLaboratory by EG&G, Waltham, MA, 34 p.
EL-SAYED, S. J., and S. TAGUCHI.1979. Phytoplankton standing crop and primary productivity in the tropical
Pacific. In J. L. Bischoff and D. Z. Piper (eds.), Marine geology and
oceanography of the Pacific manganese nodule province, p. 241-286. PlenumPress, N.Y.
EHRLICH, K. F.1977. Inhibited hatching success of marine fish eggs by power plant effluent.
Mar. Pollut. Bull. 8:228-229.
30
FISCHER, H. B., J. IMBERGER, E. J. LIST, R. C. Y. KOH, and N. H. BROOKS.1979. Mixing in inland and coastal waters. Academic Press, New York, 483 p.
FRANCIS, E. J., and G. L. DUGGER.1980. Promising applications ofarEC. In Proceedings, 7th Energy technology
conference. U.S. Department of Energy, Wash., D.C.GENERAL ELECTRJC.
1983. Ocean thermal energy conversion pilot plant program - Draft final conceptual design report. Prepared for U.S. Department of Energy under Contract DE-ACOI-82CSSOOOO. General Electric Company, Advanced Energy Programs Department, Schenectady, New York. Unpaged.
GOODING, R. M., and J. J. MAGNUSON.1967. Ecological significance of a drifting object to pelagic fishes. Pac. Sci:
21 :486-497.GRITION, E. c., R. Y. PEl, J. AROESTY, M. M. BALABAN, C. GAZLEY, R. W.
HESS, and H. KRASE.
1980. A quantitative evaluation .of closed-cycle ocean thermal energy conversion (arEC) technology in central station applications. Report R-2595-DOEprepared for the U.S. Department of Energy by the Rand Corporation, SantaMonica, CA, 126 p.
GUNDERSEN, K. R., J. S. CORBIN, C. L. HANSON, M. L. HANSON, R. B.HANSON, D. J. RUSSELL, A. STOLLER, and O. YAMADA.
1976. Structure and biological dynamics of the oligotrophic ocean photic zoneoff the Hawaiian Islands. Pac. Sci. 30:45-68.
HARADA, T., S MIYASHITA, and H. YONESHIMA.1978. Effect of water temperature on yellowfin tuna hatching. [In Japanese,
English synopsis]. Mem. Fac. Agric. Kinki Univ. 13:29-32.HARGRAVES, P. E., R. W. BRODY, and P. R. BURKHOLDER.
1970. A study of phytoplankton in the Lesser Antilles region. Bull. Mar. Sci.20(2):331-349.
HARTWELL, S. I., and R. C. OTTO.1978. Swimming performance of juvenile menhaden (Brevoortia tyrannus).
Trans. Am. Fish. Soc. 107:793-798.HETTLER, W. F.
1979. Swimming speeds of juvenile estuarine fish in a circular flume. Proc.Annu. Conf. Southeast. Assoc. Fish. Wildl. Agencies 31 :392-398.
HETTLER, W. F., and L. COSTON-CLEMENTS.1978. Effects of acute thermal stress on marine fish embryos and larvae. In L.
D. Jensen (ed.), Fourth national workshop on entrainment and impingement,p. J71-19O. E.A. Communications, Melville, N.Y.
HIRarA, J.1977. DOMES zooplankton. Final Report, Hawaii Inst. Mar. BioI. and Dep.
Oceanogr., Univ. Hawaii, Honolulu, 247 p.HOAGMAN, W. J.
1974. Vital activity parameters as related to the early life history of larvae andpost larvae lake whitefish (Coregonus clupeaformis). In J. H. S. Blaxter (ed.),The early life history of fish. p. 473-558. Springer Verlag, New York.
HOCUTT, C. H., and J. E. EDINGER.1980. Fish behavior in flow fields. In C. H. Hocutt, J. R. Stauffer, Jr., J. E.
Edinger, L. W. Hall, Jr., and R. P. Morgan II (eds.), Power plants: Effectson fIsh and shellfish behavior, p. 143-181. Academic Press, New York.
HODGMAN, C. D. (ed.).1959. Handbook of chemistry and physics, 40th ed. Chemical Rubber Publishing
Co., Cleveland, Ohio.HOLM-HANSEN, O.
1969. Determination of microbial biomass in ocean profIles. Limnol. Oceanogr.14(5):740-747.
HOSS, D. E., and J. H. S. BLAXTER.1979. The effect of rapid changes of hydrostatic pressure on the Atlantic herr
ing, Clupea harengus L.-I. Larval survival and behavior. J. Exp. Mar. BioI.Ecol. 41:75-85.
HOSS, D. E., L. C. COSTON, J. P. BAPTIST, and D. W. ENGEL.1975. Effects of temperature, copper and chlorine on fish during simulated en
trainment in power-plant condenser cooling systems. In Environmental effectsof cooling systems at nuclear power plants, Proceedings of a symposium, p.519-527. International Atomic Energy Agency, Vienna.
HOSS, D. E., L. COSTON-CLEMENTS, and D. R. COLBY.1977. Synergistic effects of exposure to temperature and chlorine on survival
of young-of-the-year estuarine fishes. In F. J. Vemberg, A. Calabrese, F. P.Thurberg, and W. B. Vemberg (eds.), Physiological response of marine biotato pollutants, p. 345-355. Academic Press, New York.
HOSS, D. E., L. C. COSTON, and W. F. HETTLER, Jr.1971. Effects of increased temperature on postlarval and juvenile estuarine fish.
Proc. Annu. Conf. Southeast. Assoc. Game Fish. Comm. 25:635-642.HOSS, D. E., W. F. HETTLER, Jr., and L. C. COSTON.
1974. Effects of thermal shock on larval fish - Ecological implications with

respect to entrainment in power plant cooling systems. In J. H. S. Blaxter (ed.),The early life history of fish, p. 357-371. Springer-Verlag, New York.
HOSS, D. E., and D. S. PETERS.1983. Synthesis of pertinent information on the potential effects of estuarine and
coastal power plants on fisheries with comments on how this information mightapply to ocean thermal energy conversion (aTEC) operations. SoutheastFisheries Center Beaufort Laboratory, National Marine Fisheries Service,NOAA, Beaufort, NC, 52 p.
HOSS, D. E., D. S. PETERS, and R. E. ROSE.1983. Study of the potential impact to fisheries ofaTEC operations. Summary
report of pertinent biological information from the Caribbean. Southeast Fisheries Center Beaufort Laboratory, National Marine Fisheries Service, NOAA,Beaufort, NC, III p.
HOUDE, E. D.1969. Sustained swimming ability of larvae of walleye (Stizostedion vitreum)
and yellow perch (Percaflavescens). J. Fish. Res. Board Can. 26: 1647-1659.HUNTER, J. R.
1980. Feeding ecology and predation of marine fish larvae. In R. Lasker (ed.),Marine fish larvae, p. 33-77. Washington Sea Grant Program, Seattle.
HUNTER, J. R., and C. A. KIMBRELL.1980. Early life history of Pacific mackerel, Scomber japonicus. Fish. Bull.,
U.S. 78:89-101.HUNTER, J. R., and C. T. MITCHELL.
1967. Association of fishes with flotsam in the offshore waters of CentralAmerica. U.S. Fish Wild!. Serv., Fish. Bull. 66: 13-29.
1968. Field experiments on the attraction of pelagic fish to floating objects. J.Cons. Perm. Int. Explor. Mer 31 :427-434.
IDYLL, C. P., and D. de SYLVA.1963. Synopsis of biological data on yellowfin tuna 77tunnus albacares (Bonna
terre) 1788 (Western Atlantic). FAO Fish. Rep. 6, vo!. 2:771-777.INOUE, M., R. AMANO, and Y. IWASAKI.
1963. Studies on environments alluring skipjack and other tunas-I. On theoceanographical condition of Japan adjacent waters and the drifting substancesaccompanied by skipjack and other tunas. [In Jpn., Eng!. summ.] Rep. Fish.Res. Lab., Tokai Univ. 1:12-23.
INOUE, M., R. AMANO, Y. IWASAKI, and N. YAMAUTI.1968. Studies on environments alluring skipjack and other tunas-D. On the drift
woods accompanied by skipjack and tunas. Bull. Jpn. Soc. Sci. Fish.34:283-287.
IVLEV, V. S.1960. On the utilization of food by planktonophage fishes. Bull. Math Biophys.
22:371-389.JENSEN, L. D., (ed.).
1974. Entrairunent and intake screening: Proceedings, Second workshop on entrainment and intake screening. EPRI Pub!. 74-049-00-5. Electric PowerResearch Institute, Palo Alto, CA, 347 p.
JIRKA, G. H., J. M. JONES, and F. E. SARGENT.1980. Theoretical and experimental study of the intermediate field dynamics of
ocean thermal energy conversion plants. Environmental Engineering Department, Cornell University, Ithaca, New York, 150 p.
KANAYAMA, R. K., and E. W. ONIZUKA.1973. Artificial reefs in Hawaii. Hawaii Fish Game Rep. 73-01,23 p.
KLAPOW, L. A., and R. H. LEWIS.1979. Analysis of toxicity data for California marine eater quality standards.
J. Water Pollut. Control Fed. 51 :2054-2070.KLIMA, E. F., and D. A. WICKHAM.
1971. Attraction of coastal pelagic fishes with artificial structures. Trans. Am.Fish. Soc. 100:86-99.
KNAUER, G. A., and A. R. FLEGAL.1981. Ocean thermal energy conversion (aTEC) particulate program 1980, St.
Croix (VaTEC). Report LBL-14115. Lawrence Berkeley Laboratory, Univ.Calif., Berkeley. (Available from NTIS) 43 p.
KOH, R. C. Y.1983. Delivery systems and initial dilution. In E. P. Myers (ed.), Ocean disposal
of municipal wastewater: Impacts on the coastal environment, p. 129-175. SeaGrant College Program, Massachusetts Institute of Technology, Cambridge,MA, 1115 p.
KOJIMA, S.1960. Fishing for dolphins in the western part of the Japan Sea-V. Species
of fishes attracted to bamboo rafts. [In Jpn., Eng!. summ.] Bull. Jpn. Soc. Sci.Fish. 26:379-382. (Eng!. trans!. by W. G. Van Campen, 1962,4 p.; SouthwestFish. Cent., Natl. Mar. Fish. Serv., NOAA, Honolulu, HI 96812).
LAEVASTU, T., and M. L. HAYES.1981. Fisheries oceanography and ecology. Page Bros. (Norwich) Ltd., Nor
wich, 199 p.
31
LANGFORD, T. E.1983. Electricity generation and the ecology of natural waters. Liverpool Univer
sity Press, Liverpool, 342 p.LARIMORE, R. W., and M. J. DUEVER.
1968. Effects of temperature acclimation on the swimming ability of small mouthbass fry. Trans. Am. Fish. Soc. 97: 175-184.
LARSON-BASSE, J., and T. H. DANIEL.1983. aTEC heat transfer experiments at Keahole Point, Hawaii, 1982-1983.
In Proceedings, Oceans '83 conference, Paper F2-4. Marine Technology Society, Wash., D.C.
LEIS, J. M.1982. Nearshore distributional gradients of larval fish (15 taxa) and planktonic
crustaceans (6 taxa) in Hawaii. Mar. Bio!. 72:89-97.LIGHTHILL, M. J.
1970. How do fishes swim? Endeavor 29:77-83.LONGHURST, A. R.
1976. Vertical migration. In D. H. Cushing and J. J. Walsh (eds.), The ecologyof the seas, p. 116-137. W. B. Saunders Co., Toronto.
MALLORY, J. D.1965. Artificial reefs in shallow waters. Proc. inti. Game Fish Comm. 10:29-37.
MALONE, T. C.1971. The relative importance of nannoplankton and netplankton as primary pro
ducers in tropical oceanic and neritic phytoplankton. Limno!. Oceanogr.16(4):633-639.
MARCY, B. C., Jr.1971. Survival of young fish in the discharge canal of a nuclear power plant.
J. Fish. Res. Board Can. 28:1057-1060.MARCY, B. c., Jr., V. R. KRANZ, and R. P. BARR.
1980. Ecological and behavioral characteristics of fish eggs and young influencing their entrainment. In C. H. Hocutt, J. R. Stauffer, Jr., J. E. Edinger,L. W. Hall, Jr., and R. P. Morgan II (eds.), Power plants, p. 29-74. AcademicPress, New York.
MARGALEF, R.1971. The pelagic ecosystem of the Caribbean Sea. In Symposium on investiga
tions and resources of the Caribbean Sea and adjacent regions, Willemstad,Curacao, 1968, p. 483-498. UNESCO.
MARSHALL, H. G., and J. A. SOLDER.1982. Pelagic phytoplankton in the Caribbean Sea. Bull. Mar. Sci. 32(1):
354-365.MATSUMaTO, W. M.
1984. Potential impact of ocean thermal energy conversion (aTEC) operationon fisheries. Admin. Rep. H-84-4, Southwest Fisheries Center HonoluluLaboratory, National Marine Fisheries Service, NOAA, Honolulu, 29 p.
MATSUMaTO, W. M., T. K. KAZAMA, and D. C. AASTED.1981. Anchored fish aggregating devices in Hawaiian waters. Mar. Fish. Rev.
43(9):1-13.MATSUMaTO, W. M., R. A. SKILLMAN, and A. E. DIZON.
1984. Synopsis of biological data on skipjack tuna, Katsuwonus pelamis. NOAATech. Rep. NMFSCirc. 451, U.S. Department of Commerce, Wash., D.C.,92 p.
MAYNARD, S. D., F. V. RIGGS, and J. F. WALKERS.J975. Mesopelagic micronekton in Hawaiian waters: Faunal composition, stand
ing stock, and diet vertical migration. Fish. Bull., U.S. 74:726-736.McCAIN, J.C.
1977. Final report - Kahe generating station NPDES monitoring program, Vo!.I-II. Hawaiian Electric Company, Inc., Honolulu.
MILLER, A. R.1977. Ranges and extremes of the natural environment related to design criteria
for ocean thermal energy conversion plants. Report prepared for EnergyResearch and Development Administration, Division of Solar Energy, by WoodsHole Oceanographic Institution, Woods Hole, MA, 73 p.
MILLER, J. M.1974. Nearshore distribution of Hawaiian marine fish larvae: effects of water
quality, turbidity and currents. In J. H. S. Blaxter (ed.), The early life historyof fish, p. 217-231. Springer-Verlag, New York.
1979. Nearshore abundance of tuna (Pisces: Scombridae) larvae in the HawaiianIslands. Bull. Mar. Sci. 19(1):19-26.
MILLER, J. M., W. WATSON, and J. M. LEIS.1979. An atlas of common nearshore marine fish larvae of the Hawaiian Islands.
Sea Grant Misc. Rep. UNIHI-SEAGRANT-MR-80-02. University of Hawaii,Honolulu, 179 p.
MOORE, E.1967. A study of the surface zooplankton in the Caribbean Sea off Jamaica. Ph.D.
thesis, McGill University, Montreal, Quebec, 138 p.
MOORE, E., and F. SANDER.1976. Quantitative and qualitative aspects of the zooplankton and breeding pat
terns of copepods at two Caribbean coral reef stations. Estuar. Coastal Mar.Sci. 4:589-607.
1977. A study of the offshore zooplankton of the tropical western Atlantic nearBarbados. Ophelia 16(1):77-96.
MUNRO, J. L., V. C. GAUT, R. THOMPSON, and P. H. REESON.1973. The spawning seasons of Caribbean reef fishes. J. Fish BioI. 5:69-84.
MYERS, E. P., and J. D. DITMARS.1985. Ocean thermal energy conversion (OTEC): Effects on marine environ
ment. Vol. 4, Energy wastes in the ocean. In W. Duedall, D. R. Kester, P.K. Park, and B. K. Ketchum (eds.), Wastes in the ocean, p. 163-192. WileyInterscience, New York.
NODA, E. K., P. K. BIENFANG, and D. A. ZIEMAN.1980. OTEC environmental benchmark survey off Keahole Point, Hawaii.
J.K.K. Look Lab. Oceanogr. Eng. Report, University of Hawaii, Honolulu,unpaged.
1982. OTEC environmental benchmark survey off Keahole Pt., Hawaii. ReportDOElNBM-2016054 (DE82016054), U.S. Department of Energy, Wash., D.C.
Unpaged.NODA, E. K., P. K. BIENFANG, W. J. KIMMERER, and T. W. WALSH.
1981a. OTEC environmental benchmark survey, Kabe Point, Oahu. Final Reportfor the Period May 1980-May 1981. Report DOE/NBM-2016055(DE82016055), U.S. Department of Energy, Wash., D.C. Unpaged.
1981b. Plume survey, OTEC-I mixed water discharge, Apr. 11-12, 1981. ReportLBL-12951, Lawrence Berkeley Lab., Univ. Calif., Berkeley, 116 p.
NOAA.1981a. Final environmental impact statement for commercial ocean thermal
energy conversion (OTEC) licensing. Office of Ocean Minerals and Energy,National Oceanic and Atmospheric Administration, Wash., D.C: 246 p.
1981b. Licensing of ocean thermal energy conversion facilities and plantships(as amended by 46 FR 61643 et seq., Dec. 18, 1981), 15 CFR Part 981. Federal
Register 46(147):39388-39420.1981c. Technical guidance document for environmental requirements of com
mercial OTEC licensing regulations. Office of Ocean Minerals and Energy,National Oceanic and Atmospheric Administration, Wash., D.C. 105 p.
1982. Ocean thermal energy conversion: Environmental effects assessment program plan, 1981-85. Office of Ocean Minerals and Energy, National Oceanicand Atmospheric Administration, Wash., D.C. 54 p.
OCEAN DATA SYSTEMS, INC.19/7a. Ocean thermal resource report for Hawaii. Prepared for U.S. Energy
Research and Development Admin., Division of Solar Energy, Wash., D.C. byOcean Data Systems, Inc., Monterey, CA.
Ig/Th. OTEC thermal resource report for Puerto Rico. Prepared for U.S. EnergyResearch and Development Admin., Division of Solar Energy, Wash., D.C.by Ocean Data Systems, Inc., Monterey, CA.
OCEAN THERMAL CORPORATION.1983. Ocean thermal energy conversion (OTEC) pilot plant conceptual design
study - Conceptual design report (final report). Prepared for U.S. Department of Energy under contract DE-ACOI-82CE30716. Ocean Thermal Corp.,New York, 285 p.
OGURA, M., and T. NASUMI.1976. Fishing lamps and light attraction for squid jigging. In Contributed papers
submitted to the expert consultation on fishing for squid and other cephalopods,Suppl. I, p. 93-96. FAO Fish. Rep. 170.
PADDOCK, R. A., and J. D. DITMARS.1983. Initial screening of license applications for ocean thermal energy conver
sion (OTEC) plants with regard to their interaction with the environment. ReportANLIOTEC-EV-2. Argonne National Laboratory, Argonne, IL, 126 p.
PAVLOV, D. S., Yu. N. SBIKJN, and A. D. MOCHEK.1968. The effect of illumination in running water on the speed of fishes in rela
tion to features of their orientation. Probl. Ichthyol. [Engl. lang. ed. ofVoprosy
Ikhtiologii) 8:250-255.PETERS, D. S.
1983. The potential range of ecological effects resulting from OTEC operations.Southeast Fisheries Center Beaufort Laboratory, National Marine Fisheries Service, NOAA, Beaufort, NC, 17 p.
PETERS, D. S., and J. W. ANGELOVIC.1973. Effect of temperature, salinity, and food availability on growth and energy
utilization of juvenile summer flounder Paralichthys denlatus. In D.J. Nelson(ed.), Proceedings, Third national symposium on radioecology, p. 545-554.
U.S. Atomic Energy Comm., Wash., D.C. (NTIS:CONF-710501-PI).
PLATT, T., and D. V. SUBBA ROA.1975. Photosynthesis and productivity in different environments. Intl. BioI. Pro
gram 3:249. Cambridge University Press.
32
POWELL, R.
1968. "Akule" night fishing gear. South Pac. Comm., Noumea, New Caledonia,13 p.
QUINBY-HUNT, M. S.
1979. Comparison of nutrient data from four potential OTEC sites. ReportLBL-9052, Lawrence Berkeley Lab., Univ. Calif., Berkeley, 6 p.
RADAKOV, D. V.
1964. Velocities of fish swimming. In "Nauka," p. 4-28. Pamphlet from A.N. Severtsov Institute of Animal Morphology, Moscow [in Russian).
RICHARDS, W. J.
1981. Kinds and abundances of fish larvae in the Caribbean Sea. Rapp. P.-v.Reun. Cons. int. Explor. Mer 178:240-241.
1984. Kinds and abundances of fish larvae in the Caribbean Sea and adjacentareas. NOAA Tech. Rep. NMFS-776. U.S. Department of Commerce, Wash.,D.C., 54 p.
ROSENTHAL, H.
1966. Beobachtungen uber die entwicklung des schwarmverhaltens bei den larvender herings Clupea harengus. Mar. BioI. 2:73-76.
ROSENTHAL, H., and D. F. ALDERDICE.
1976. Sublethal effects of environmental stressors, natural and pollutional, onmarine fish eggs and larvae. J. Fish. Res. Board Can. 33:2047-2065.
RULlFSON, R. A.
1977. Temperature and water velocity effects on the swimming performancesof young-of-the-year mullet (MugU cephalus) , spot (Leiosromus xanlhurus) , andpinfish (Lagodon rhomboides). J. Fish. Res. Board Can. 34:2316-2322.
RYLAND, J. S.
1963. The swimming speeds of plaice larvae. J. Exp. BioI. 40:285-299.RYTHER, J. H.
1969. Photosynthesis and fish production in the sea. Science 166:72-76.SANDER, F., and D. M. STEVEN.
1973. Organic production of inshore and offshore waters of Barbados: A studyof the island mass effect. Bull. Mar. Sci. 23:771-793.
SANDS, M. D.1980. Ocean thermal energy conversion (OTEC) programmatic environmental
analysis, vol. I. Report LBL-105I1, Lawrence Berkeley Lab., Univ. Calif.,Berkeley, 213 p. (Available from NTIS: DE8 I 030222).
SAX, N. I.1979. Dangerous properties of industrial materials, 5th ed. Van Nostrand
Reinhold Coo, New York, 1018 p.SCHUBEL, J. R., and B. C. MARCY, Jr., (eds.).
1978. Power plant entrainment. Academic Press, New York. 271 p.SEKI, M. P.
1984. Summary of pertinent information on the attraction effects of artificialstructures placed in tropical and subtropical waters. Admin. Rep. H-83-12,
Southwest Fisheries Center Honolulu Laboratory, National Marine FisheriesService, NOAA, Honolulu, 49 p.
SENTA, T.1966. Experimental studies on the significance of drifting seaweeds for juvenile
fishes-I. Experiments with artificial drifting seaweeds. Bull. Jpn. Soc. Sci.Fish 32:639-642.
SHELDON, R. W., W. H. SUTCLIFFE, Jr., and M. A. PARANJAPE.1977. Structure of pelagic food chain and relationship between plankton and
fish production. J. Fish. Res. Board Can. 34:2344-2353.SHOMURA, R. S., and W. M. MATSUMOTO.
1982. Structured flotsam as fish aggregating devices. NOAA-TM-NMFSSWFC-22, Southwest Fish. Cent., National Marine Fisheries Service, NOAA,La Jolla, CA, 9 p.
SHOMURA, R. S., and F. WILLIAMS (eds).
1975. Proceedings, International billfish symposium, August 1972. Part 3.Species synopses. NOAA Tech. Rep. NMFS SSRF-675. U.S. Department ofCommerce, Wash., D.C., 159 p.
SHUPE, J. W.1982. Energy self-sufficiency for Hawaii. Science 216: 1193-1199.
STAUFFER, J. R., Jr.1980. Influence of temperature on fish behavior. In C. H. Hocutt, J. R. Stauf
fer, Jr., J. E. Edinger, L. W. Hall, Jr., and R. P. Morgan II (eds.), Powerplants: Effects on fish and shellfish behavior, p. 103-141. Academic Press, NewYork.
STEEMAN NIELSEN, E., and E. A. JENSEN.1957. Primary oceanic production: The autotrophic production of organic mat
ter in the oceans. Galathea Rep. 1:49-136.STEVEN, D. M.
1971. Primary productivity of the tropical western Atlantic Ocean near Barbados.Mar. BioI. 10:261-264.
STROUD, R. H.1965. Artificial reefs as tools of sport fishery management in coastal marine
waters. Proc. Inti. Game Fish Comm. 10:2-12.SULLIVAN, S. M. and M. D. SANDS.
1980. A preliminary evaluation of impingement and entrainment by ocean thermal energy conversion (OTEC) plants. Report LBL-13915. Lawrence BerkeleyLaboratory, Univ. Calif., Berkeley, 14 p.
SUNDA, W. G., and S. A. HUNTSMAN.1983. Effect of competitive interactions between manganese and copper on
cellular manganese and growth in estuarine and oceanic species of the diatomThalassiosira. Limnol. Oceangr. 28 (5):924-934.
SZYPER, J. P., P. K. BIENFANG, L. D. CONQUEST, K. KLEIN, and D. A.ZIEMANN.
1984. Distribution of oceanographic parameters and phytoplankton response todeep-water enrichment off Kahe Point, Oahu. A report on the survey cruisesof 16-18 August 1983 and 10-12 January 1984. Prepared for TRW EnergyDevelopment Group, Redondo Beach, CA., by OJ Consultants, Inc.,Waimanalo, Hawaii.
TERPIN, K. M., M. C. WILLIE, and E. R. HOLMSTROM.1977. Temperature preference, avoidance, shock, and swim speed studies with
marine and estuarine organisms from New Jersey. Bull. 17, IchthyologicalAssociates, Ithaca, New York, 86 p.
TIPTON, D. G.1980. Effect of mechanical cleaning on seawater corrosion of candidate OTEC
heat exchanger materials. In Proceedings, Seventh ocean energy conference,p. 5.2-1 to 5.2-20. Conf. 800633, U.S. Department of Energy, Wash., D.C.
TSUKAMOTO, K., T. KAJIHARA, and M. NISHIWAKI.1975. Swimming ability of fish. Bull. Japan Soc. Sci. Fish. 41:167-174.
TURNER, C. J., E. E. EBERT, and R. R. GIVEN.1969. Man-made reef ecology. Calif. Dep. Fish Game, Fish. Bull. 147,221 p.
UCHIDA, R. N.1981. Synopsis of biological data on frigate tuna, Auxis thazard and bullet tuna,
A. rochei. NOAA Tech. Rep. NMFS Circ. 436. U.S. Department of Commerce, Wash., D.C., 63 p.
1983. Summary of pertinent biological characteristics of potential ocean thermal energy conversion (OTEC) sites in the Pacific Ocean. Admin. Rep.H-83-13, Southwest Fisheries Center Honolulu Laboratory, National MarineFisheries Service, NOAA, Honolulu, 91 p.
UNITED NATIONS.1981. Substantive preparation for the conference: Report of technical panel on
ocean energy on its second session. U.N. Conference on new and renewablesources of energy, September 1980, Geneva, Switzerland, 45 p.
U.S. DEPARTMENT OF ENERGY.1978. Environmental development plan (EDP) - Ocean thermal energy conver
sion. Rep. DOE/EDP-0006. U.S. Dept. of Energy, Wash., D.C., 43 p.1979. Environmental development plan - Ocean thermal energy conversion.
Assistant Secretary for Energy Technology, Assistant Secretary for Environment, Wash., D.C., 48 p.
1981. The potential environmental consequences of ocean thermal energy conversion (OTEC) plants - A Workshop. Conf. 810622, U.S. Department ofEnergy, Wash., D.C., 106 p.
U.S. DEPARTMENT OF LABOR.1972. Occupational safety and health standards, air contaminants. Occupational
Safety and Health Admin. 37 Federal Register 22139-22144, October 18, 1972.'U.S. DEPARTMENT OF STATE.
1982. Puerto Rico and the U.S. Virgin Islands Region. Map 4357 2-82 State(GE). Office of Geographer, U.S. Department of State, Wash., D.C. Unpaged.
U.S. ENVIRONMENTAL PROTECTION AGENCY.1973. Reviewing environmental impact statements - Power plant cooling systems,
engineering aspects. Pacific Northwest Environmental Research Lab., U.S.EPA, Corvallis, OR, 93 p.
UZIEL, M. S.1980. Entrainment and impingement at cooling-water intakes. J. Water Pollut.
Control Fed. 52: 1616-1630.
33
VAN WINKLE, W. (ed.).1977. Proceedings, Conference on assessing the effects of power-plant-induced
mortality on fish populations. Pergamon Press, New York, 380 p.VARGO, S., K. FANNING, T. HOPKINS, H. MICHELE, G. VARGO, E.
HARTWIG, and A. JONES.1981. Physical, chemical and biological measurements off Puerto Rico. Report
DOE/NBM-I043, Lawrence Berkeley Lab., Univ. Calif., Berkeley. 2 vols.(Available from NTIS: DE82021294 and DE82021295), 663 p.
VENKATARAMIAH, A., G. J. LAKSHMI, C. BEST, G. GUNTER, E. HARTWIG,and P. WILDE.
1981a. Studies on toxicity ofOTEC plant components on marine animals fromthe Gulf of Mexico. Rep. LBL-13915, Lawrence Berkeley Lab., Univ. Calif.,Berkeley, 114 p.
1981b. Studies on toxicity of OTEC plant components on Eucalanus sp. fromthe Gulf of Mexico. Rep. LBL 13916, Lawrence Berkeley Lab., Univ. Calif.,Berkeley, 53 p.
VINOGRADOV, M. E.1968. Vertical distribution of the oceanic zooplankton. Moscow, Acad Nauk
SSSR, Inst. Okeanol. [Transl. from Russian by Israel Program Sci. Transl.1970, 339 pp.] (Available IT 69-59015 from NTIS, Springfield, VA.)
WALTERS, V., and H. L. FIERSTINE.1964. Measurements of swimming speeds of yellow fin tuna and wahoo. Nature
202:203-209.WANG, D.-P.
1982. Development of a three-dimensional limited-area (island) shelf circulation model. J. Phys. Oceanogr. 12:605-617.
1984. A far-field model of the regional influence of effluent plumes from oceanthermal energy conversion (OTEC) plants. Draft Final Report to the NationalOceanic and Atmospheric Administration by Energy and Environmental SystemsDivision, Argonne National Laboratory, Argonne, IL, 46 p.
WICKHAM, D. A., and G. M. RUSSELL.1974. An evaluation of midwater artificial structures for attracting coastal pelagic
fishes. Fish. Bull., U.S. 72:181-191.WICKHAM, D. A., J. W. WATSON, Jr., and L. H. OGREN.
1973. The efficacy of midwater artificial structures for attracting pelagic sportfish. Trans. Am. Fish. Soc. 102:563-572.
WIEBE, P. H., S. BOYD, and J. L. COX.1975. Relationships between zooplankton displacement volume, wet weight, dry
weight, and carbon. Fish. Bull., U.S. 73:777-786.WOLFF, P. M.
1978. Temperature variability at three OTEC sites. Report prepared for U.S.Department of Energy, Wash., D.C. by Ocean Data Systems, Monterey, CA.
YABE, H., and T. MORI.1950. An observation on the habit of bonito, Katsuwonus vagans, and yellowfin,
Neothunnus macropterus, schools under the drifting timber on the surface ofocean. [In Jpn., Engl. abstr.] Bull. Jpn. Soc. Sci. Fish. 16:35-39. (Engl. transl.by W. G. Van Campen, 1954, 12 p.; Southwest Fish. Cent., Natl. Mar. Fish.Serv., NOAA, Honolulu, HI 96812)
YAMAGUCHI, Y.1953. The fishery and the biology of the Hawaiian opelu, Decapterus pinnulatus
(Eydoux and Souleyet). M.S. Thesis, Univ. Hawaii, Honolulu, 125 p.YOSHIDA, H. O.
1979. Synopsis of biological data on tunas dthe genus Euthynnus. NOAA Tech.Rep. NMFS Circ. 429. U.S. Department of Commerce, Wash., D.C., 57 p.
YOUNGBLUTH, M. J.1979. The variety of abundance of zooplankton in the coastal waters of Puerto
Rico. Northeast Gulf Sci. 3(1): 15-26.YUEN, H. S. H.
1979. A night handline fishery for tunas in Hawaii. Mar. Fish. Rev. 41 (8):7-14.YUEN, P. C.
1981. Ocean thermal energy conversion: A Review. Report HNEI-81-03, HawaiiNatural Energy Institute, University of Hawaii at Manoa, Honolulu, 173 p.