ocean thermal energy conversion (otec) · 2009-03-02 · chapter14 ocean thermal energy conversion...
TRANSCRIPT
Chapter 14
Ocean thermal energyconversion (OTEC)
14.1 Introduction
The ocean is the world’s largest solar collector. In tropical seas, temperaturedifferences of about 20−25 �Cmay occur between the warm, solar-absorbingnear-surface water and the cooler 500–1000m depth ‘deep’ water at andbelow the thermocline. Subject to the laws and practicalities of thermody-namics, heat engines can operate from this temperature difference acrossthis huge heat store. The term ocean thermal energy conversion (OTEC)refers to the conversion of some of this thermal energy into useful workfor electricity generation. Given sufficient scale of efficient equipment, elec-tricity power generation could be sustained day and night at 200kWe fromaccess to about 1km
2of tropical sea, equivalent to 0.07% of the solar input.
Pumping rates are about 6m3 s−1 of water per MWe electricity production.The technology for energy extraction is similar to that used for energy effi-ciency improvement in industry with large flows of heated discharge, buton a much larger scale.The attractiveness of OTEC is the seemingly limitless energy of the hotter
surface water in relation to the colder deep water and its potential forconstant, base load, extraction. However, the temperature difference is verysmall and so the efficiency of any device for transforming this thermalenergy to mechanical power will also be very small. Even for heating, warmseawater cannot be spilt on land due to its high salt content. Moreover,large volumes of seawater need to be pumped, so reducing the net energygenerated and requiring large pipes and heat exchangers.There have been hundreds of paper studies, and a few experimental
demonstration plants, with the first as far back as 1930. These were mostlyresourced from France (pre-1970s) and then the USA, Japan and Taiwanin the 1980s, but less activity since then; see Avery and Wu (1994) for adetailed history. This experience confirmed that the cost per unit of poweroutput would be large, except perhaps on a very large scale, and led toother justifications for pumping up the cold, deeper waters, which containnutrients and therefore increase surface photosynthesis of phytoplanktonand hence fish population. It now appears that OTEC could be at best a

454 Ocean thermal energy conversion (OTEC)
secondary aspect of systems for deep-water nutrient enrichment for marinefisheries, for cooling buildings or for desalination (see Section 14.5). Suchintegrated technology is called Deep Ocean Water Application (DOWA).
14.2 Principles
Figure 14.1 outlines a system for OTEC. In essence it is a heat engine witha low boiling point ‘working fluid’, e.g. ammonia, operating between the‘cold’ temperature Tc of the water pumped up from substantial depth andthe ‘hot’ temperature, Th = Tc +�T , of the surface water. The workingfluid circulates in a closed cycle, accepting heat from the warm water anddischarging it to the cold water through heat exchangers. As the fluidexpands, it drives a turbine, which in turn drives an electricity generator.The working fluid is cooled by the cold water, and the cycle continues.Alternative ‘open cycle’ systems have seawater as the working fluid, butthis is not recycled but condensed, perhaps for distilled ‘fresh’ water; thethermodynamic principles of the open cycle are similar to the closed cycle.In an idealised system with perfect heat exchangers, volume flow Q of
warm water passes into the system at temperature Th and leaves at Tc (thecold water temperature of lower depths). The power given up from thewarm water in such an ideal system is
P0 = �cQ�T (14.1)
Figure 14.1 Schematic diagram of an OTEC system. A heat engine operates betweenthe warm water from the ocean surface and the cold water from theocean depths.
14.2 Principles 455
where
�T = Th−Tc
The second law of thermodynamics dictates that the maximum output ofwork energy E1 obtainable from the heat input E0 is
E1 = �CarnotE0 (14.2)
Naively forgetting time dependence and the practicalities of heat exchang-ers, this is usually also given as
P1 = �CarnotP0 (14.3)
where
�Carnot = �T/Th (14.4)
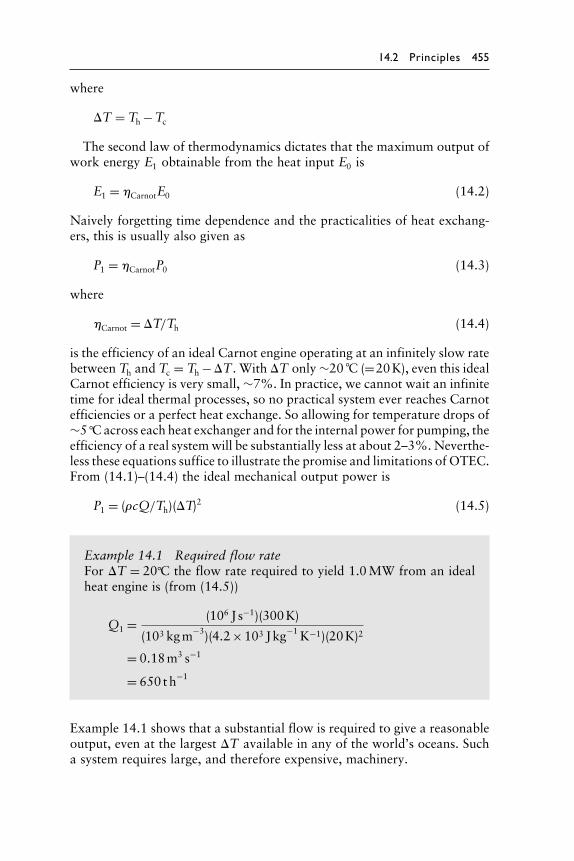
is the efficiency of an ideal Carnot engine operating at an infinitely slow ratebetween Th and Tc = Th−�T . With �T only∼20 �C �=20K�, even this idealCarnot efficiency is very small, ∼7%. In practice, we cannot wait an infinitetime for ideal thermal processes, so no practical system ever reaches Carnotefficiencies or a perfect heat exchange. So allowing for temperature drops of∼5 �Cacross each heat exchanger and for the internal power for pumping, theefficiency of a real systemwill be substantially less at about 2–3%.Neverthe-less these equations suffice to illustrate the promise and limitations of OTEC.From (14.1)–(14.4) the ideal mechanical output power is
P1 = ��cQ/Th���T�2 (14.5)
Example 14.1 Required flow rateFor �T = 20�C the flow rate required to yield 1.0MW from an idealheat engine is (from (14.5))
Q1 =�106 J s−1��300K�
�103 kgm−3��4�2×10³ Jkg
−1K−1��20K�2
= 0�18m3 s−1
= 650 th−1
Example 14.1 shows that a substantial flow is required to give a reasonableoutput, even at the largest �T available in any of the world’s oceans. Sucha system requires large, and therefore expensive, machinery.
456 Ocean thermal energy conversion (OTEC)
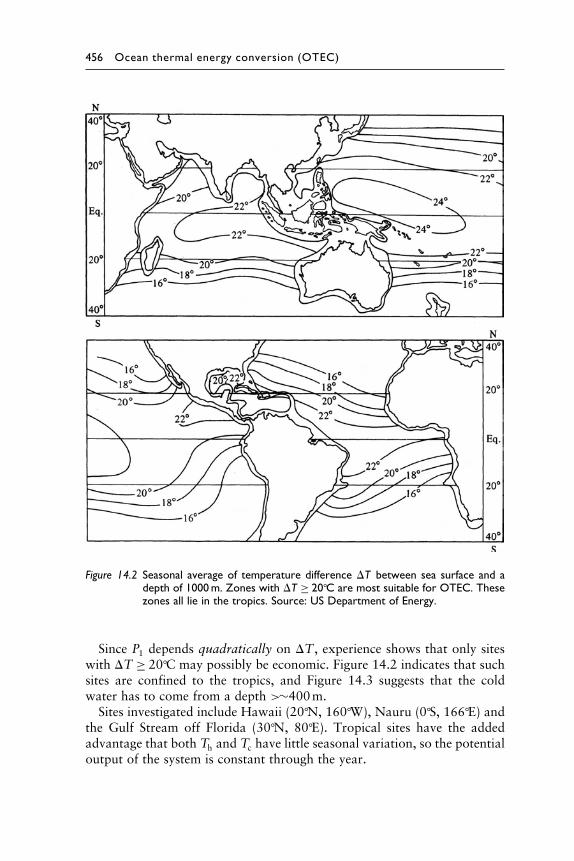
Figure 14.2 Seasonal average of temperature difference �T between sea surface and adepth of 1000m. Zones with �T ≥ 20�C are most suitable for OTEC. Thesezones all lie in the tropics. Source: US Department of Energy.
Since P1 depends quadratically on �T , experience shows that only siteswith �T ≥ 20�C may possibly be economic. Figure 14.2 indicates that suchsites are confined to the tropics, and Figure 14.3 suggests that the coldwater has to come from a depth >∼400m.Sites investigated include Hawaii (20�N, 160�W), Nauru (0�S, 166�E) and
the Gulf Stream off Florida (30�N, 80�E). Tropical sites have the addedadvantage that both Th and Tc have little seasonal variation, so the potentialoutput of the system is constant through the year.

14.2 Principles 457
Figure 14.3 Ocean conditions offshore from the island of Nauru, in the Central PacificOcean (0�S, 166 �E). (a) Water temperature. (b) Cross-section of sea bottom.The water temperatures are typical of those at good OTEC sites, and thesteeply sloping sea floor allows a land-based system. Data from Tokyo ElectricPower Services Co. Ltd.
Indeed steadiness and independence of the vagaries of weather are majoradvantages of OTEC as a renewable source of energy. Its other majoradvantages as a possible technology are:
1 At a suitable site, the resource is essentially limited only by the size ofthe machinery.
2 The machinery to exploit it economically requires only marginalimprovements in such well-tried engineering devices as heat exchangersand turbines. No dramatically new or physically impossible devices arerequired.
The major disadvantages are cost and scale. Even if the ideal powerP1 of (14.5) was obtainable, the costs per unit output would be large,but resistances to the flow of heat and to fluid motion reduce the usefuloutput considerably and therefore increase unit costs. Sections 14.3 and 14.4estimate the energy losses due to imperfect heat exchangers and pipe friction.The installed costs of the best experimental OTEC plants (1980s to 1990s)were as large as $40000perkWe of electricity capacity, in comparison withabout $1000perkWe for conventional generating capacity in remote areas.However, the theory of Sections 14.2 to 14.4 suggests that even largersystems would be more economical, which maintains interest in OTEC.However, a large scale-up in a single step from small demonstration plantsis imprudent engineering and therefore difficult to finance.Factors increasing the cost of offshore OTEC are maintenance at sea and
submarine cabling, as discussed further in Section 14.5. However, there area few especially favourable coastal sites where the sea bed slopes down sosteeply that all the machinery can be placed on dry land. The island of

458 Ocean thermal energy conversion (OTEC)
Figure 14.4 Experimental land–based OTEC plant on Nauru, built by Tokyo ElectricPower Services Company in 1981 for research. It was a ‘closed cycle’ system,rated at 100kWe output. On the photograph the vertical framework tothe rear contains the condenser, the nearer large horizontal cylinder is theevaporator, the turbine house is at the left, the cold water pipe runs outto sea (in the background), and cylinders in the foreground contain spareworking fluid.
Nauru in the South Pacific has such topography. Figure 14.3 shows a sectionof the sea bottom there, and Figure 14.4 is a photograph of an experimen-tal OTEC installation on the shore. Experience showed (i) the beach andsubmarine pipes must be buried or fixed extremely well to survive wavecurrent forces, (ii) biofouling could be mitigated by 24-hourly pulses ofchlorination, and (iii) in the pipes, both thermal losses and friction decreasedefficiency significantly.
14.3 Heat exchangers
These need to be relatively large to provide sufficient area for heat transferat low temperature difference, and are therefore expensive (perhaps 50% oftotal costs). In calculating the ideal output power P1 as calculated in (14.5),we have assumed perfect heat transfer between the ocean waters and theworking fluid. In practice, there is significant thermal resistance, even withthe best available heat exchangers and with chemical ‘cleaning’ to lesseninternal biofouling.
14.3 Heat exchangers 459
14.3.1 General analysis
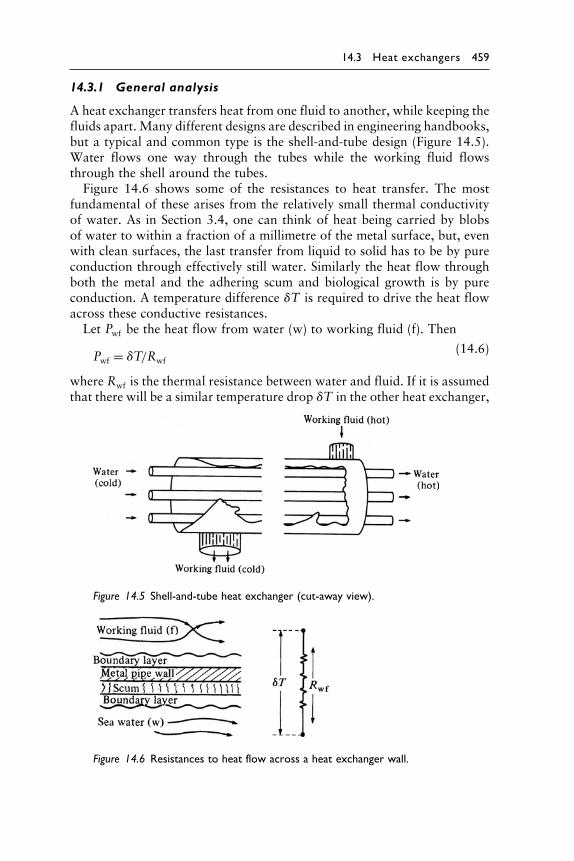
A heat exchanger transfers heat from one fluid to another, while keeping thefluids apart. Many different designs are described in engineering handbooks,but a typical and common type is the shell-and-tube design (Figure 14.5).Water flows one way through the tubes while the working fluid flowsthrough the shell around the tubes.Figure 14.6 shows some of the resistances to heat transfer. The most
fundamental of these arises from the relatively small thermal conductivityof water. As in Section 3.4, one can think of heat being carried by blobsof water to within a fraction of a millimetre of the metal surface, but, evenwith clean surfaces, the last transfer from liquid to solid has to be by pureconduction through effectively still water. Similarly the heat flow throughboth the metal and the adhering scum and biological growth is by pureconduction. A temperature difference �T is required to drive the heat flowacross these conductive resistances.Let Pwf be the heat flow from water (w) to working fluid (f). Then
Pwf = �T/Rwf
(14.6)
where Rwf is the thermal resistance between water and fluid. If it is assumedthat there will be a similar temperature drop �T in the other heat exchanger,
Figure 14.5 Shell-and-tube heat exchanger (cut-away view).
Figure 14.6 Resistances to heat flow across a heat exchanger wall.
460 Ocean thermal energy conversion (OTEC)
the temperature difference actually available to drive the heat engine is not�T but
�2T = �T −2�T (14.7)
With an idealised Carnot engine the mechanical power output would be
P2 =(�T −2�T
Th
)�T
Rwf
(14.8)
Equation (14.8) implies that �T/Rwf should be large to increase outputpower. Yet �T must be small to obtain maximum engine efficiency, so it iscrucial to minimise the transfer resistance Rwf bymaking the heat exchangeras efficient as possible. Therefore the tubes must be made of metal (goodconductor) and there must be many of them, perhaps hundreds, to providea large total surface area. Other refinements may include fins or poroussurfaces on the tubes, and baffles within the flow. With such an elaborateconstruction, it is not surprising that the heat exchangers constitute one ofthe major expenses of an OTEC system. This is the more so since the tubematerial has to be resistant to corrosion by seawater and the working fluid,all joints must be leakproof and all pipes capable of internal cleaning.The overall thermal resistance can be analysed in terms of the thermal
resistivity of unit area rwf and the total wall area Awf, as in Section 3.6:
Rwf = rwf/Awf (14.9)
Much of the development work in OTEC concerns improvements in thedesign of existing heat exchangers. The aim is to decrease rwf, and therebydecrease the area Awf. Having smaller heat exchangers with less metal canlead to substantial cost reductions. Values for rwf of 3× 10⁻⁴ m2 KW−1 (i.e.h= 1/r = 3000Wm−2 K−1) canbeobtainedbythebestofexistingtechnology.The flow rate required through the heat exchanger is determined by
the power Pwf removed from the water, and by the heat transfers andtemperatures involved. These are indicated in Figure 14.7, which shows acounterflow heat exchanger on each side of the working fluid circuit. At eachpoint along the heat exchanger, the temperature difference between thework-ing fluid and the water is �T . Thus the hottest point in the working fluid is at
Thf = T�in�
hw −)Tand the coldest is at
Tcf = T �in�cw +)T
Therefore the power given up by the hot water is
Pwf = �cQ(T�in�
hw −T �out�
hw
)(14.10)

14.3 Heat exchangers 461
Figure 14.7 Temperatures and heat flows in the OTEC system of Example 14.2. Theother quantities are calculated from T�in
cw , T�in hw , �T , P2.
with the temperature drop
T�in�
hw −T �out�
hw = �T −2)T (14.11)
14.3.2 Size
Example 14.2 Heat exchanger dimensionsFind a set of working dimensions for a shell-and-tube heat exchangersuitable for an OTEC system set to produce 1MW. Assume a Carnotcycle for the working fluid, but allow for temperature reductions innon-perfect heat exchangers.Assume rwf = 3×10⁻⁴ m2 KW−1, �T = 20 �C, �T = 4 �C, etc. as in
Figure 14.7.
Solution
1 Surface areaFrom (14.9),
Awf = rwf/Rwf
From (14.8),
1/Rwf =P2Th
��T −2)T �)T

462 Ocean thermal energy conversion (OTEC)
so
Awf =�1×10⁶W��300K��3×10⁻⁴ m2 K W−1�
�20−8�K�4K�
= 1�9×10³m2
This is a very large area of transfer surface.2 Flow rate
For the parameters of Figure 14.7,
�carnot =�21−9��C�273+21�K
= 12
294
Pwf = P2/�carnot = �1MW��294/12�= 25MW
Therefore, from (14.10), and (14.11), the flow rate is
Q= �25×106W�
�103 kgm−3��4�2×10³ JK−1 kg
−1��12K�
= 0�50m3 s−1
3 Thermal resistance of the boundary layersWesupposethateachfluidboundary layerofFigure14.6contributesabout half of rwf. In particular, assume that the thermal resistivityof the boundary layer (of water) on the inside of the pipe is given by
rv = 1�5×10⁻⁴ m2 K W−1
Let d be the diameter of each tube in the heat exchanger. Theconvective heat transfer to the inside wall of a smooth tube isgiven by (C.14), see Section 3.4:
� = 0�027�0�8�0�33
By definition of the Nusselt number, � = d/�rvk�. Thus theReynolds number in each tube is
�= �d/�0�027rvk�0�33�1�25
= ��0�027��0�6Wm−1 K−1��7�0�0�33−1�25�d/rv�1�25
= ad1�25
where a= 4�67×106m−1�25 and the properties of water are fromAppendix B.
14.3 Heat exchangers 463
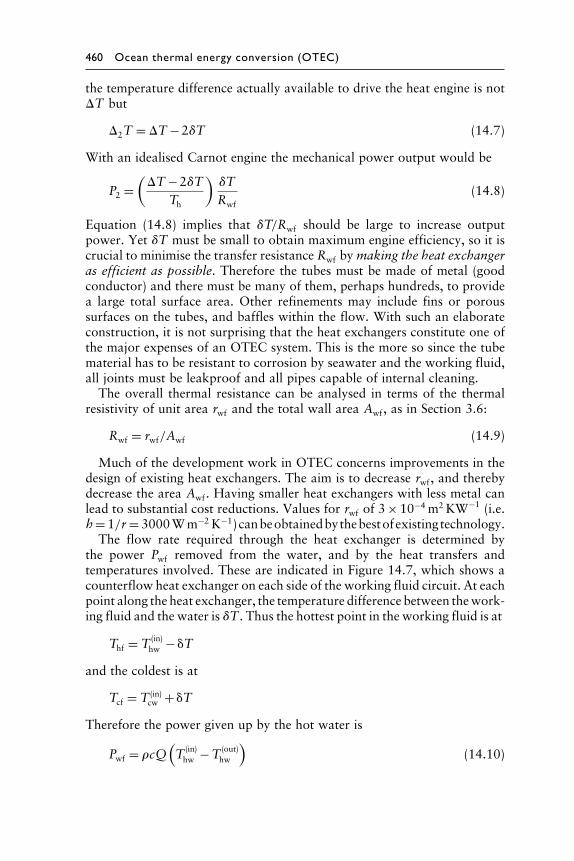
4 Diameter of tubeAs an initial estimate, suppose d = 0�02m. Then � = 3�5×10⁴.Hence, flow speed in each tube is
u=�
d
= �3�5×10⁴��1�0×10−6 m2 s−1�
�0�02m�= 1�7ms−1
Since the total flow through n tubes is Q= nu�d2/4 the numberof tubes required is
n= �0�50m3 s−1��4�
�1�7ms−1��3�14��0�01m�2
= 3600
5 Length of tubesTo make up the required transfer area A= n�dl, each tube musthave length
l= �1�9×10³m2�
�3600���0�02m�= 32m
This example makes it clear that large heat exchangers, with substantialconstruction costs, are required for OTEC systems. Indeed the exampleunderestimates the size involved because it does not allow for imperfectionsin the heat engines etc., which increase the required Q to achieve thesame power output. Also the example assumes that the pipe is clean andsmooth.
14.3.3 Biofouling
The insideof thepipe isvulnerable toencrustationbymarineorganisms,whichwill increase the resistance to heat flow (Figure 14.6), and thereby reduce theperformance. Such biofouling is one of the major problems in OTEC design,since increasing the surface area available for heat transfer also increases theopportunity for organisms to attach themselves. Among the methods tried tokeep this fouling under control are mechanical cleaning by continual circula-tion of close fitting balls and chemical cleaning by additives to the water.The effect of all these complications is that the need for cost saving
encourages the use of components working at less than optimal perfor-mance, e.g. undersized heat exchangers.
464 Ocean thermal energy conversion (OTEC)
14.4 Pumping requirements
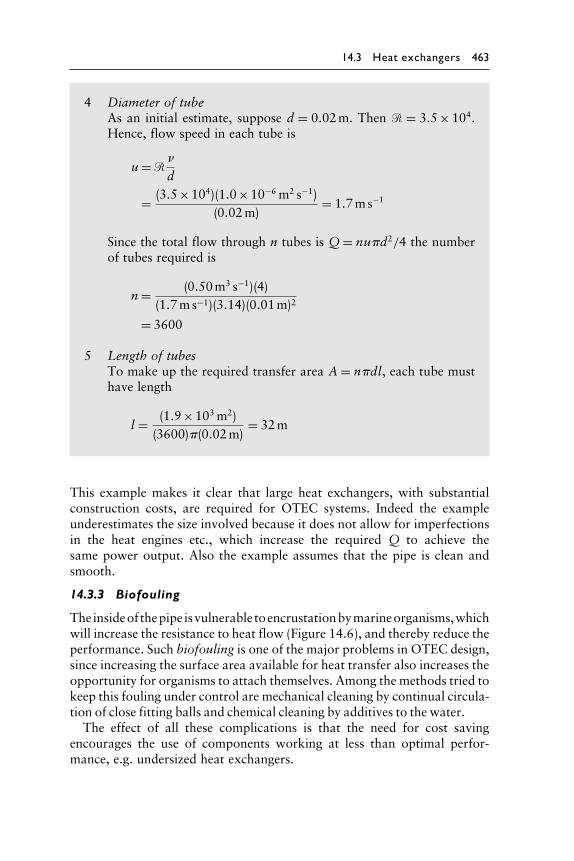
Work is required to move large quantities of hot water, cold water andworking fluid around the system against friction. This will have to be sup-plied from the gross power output of the OTEC system, i.e. it constitutes yetanother loss of energy from the ambient flow P0. Example 14.3 shows howthe work may be estimated numerically using the methods of Section 2.6,although analytic calculations are difficult. The effect of cooling the waterin the hydrostatic ‘circuit’ is small, but does encourage circulation.
Example 14.3 Friction in the cold water pipeThe OTEC system of Example 14.2 (Figure 14.7) with P2 =1MW��T = 20 �C has a cold water pipe with L = 1000m, diameterD = 1m. Calculate the power required to pump water up the pipe.
SolutionThe mean speed is
u=Q/A
= �0�50m3 s−1�
��0�5m�2= 6�3ms−1
Therefore the Reynolds number is
R= uD
v
= �0�63ms−1��1m�
�1�0×10−6 m2 s−1�= 6�3×10⁵
In practice, many varieties of marine organisms brought up from thedepths will adhere to the pipe, giving an equivalent roughness height� ∼ 20mm, i.e. �/D = 0�02. Thus, from Figure 2.6, the pipe frictioncoefficient is f = 0�012From (2.14), the head loss is
Hf = 2fLu2/Dg = 1�0m
To overcome this requires the same power as to lift a mass �Q persecond through a height Hf , i.e.
Pf = �QgHf = 4�7kW
14.5 Other practical considerations 465
From Example 14.3, we see that the cold water pipe can be built largeenough to avoid major friction problems. However, because the head lossvaries as �diameter�−5 (See problem 2.6), friction loss can become apprecia-ble in the smaller piping between the cold water pipe and the heat exchanger,and in the heat exchanger itself. Indeed, because the same turbulence carriesboth heat and momentum from the heat exchanger surfaces, all attemptsto increase heat transfer by increasing the surface area necessarily increasefluid friction in the heat exchangers.In addition, the flow rate required in practice to yield a given output
power is greater than that calculated in Example 14.2, because a real heatengine is less efficient than a Carnot engine in converting the input heatinto work. This increases the power lost to fluid friction. Fouling of theheat exchanger tubes makes the situation worse, both by further raisingthe Q required to yield a certain power output, and by decreasing the tubediameter. As a result, in some systems over 50% of the input power may belost to fluid friction. Power used by the pumps themselves is another ‘loss’from the output power.
14.5 Other practical considerations
The calculations of the previous sections confirm that there are no fun-damental thermodynamic difficulties that prevent an OTEC system fromworking successfully. Although there remain a number of practical, engi-neering and environmental difficulties, we shall see that none of theseappears insuperable from a technical point of view.
14.5.1 The platform
American designers drew up conceptual plans for large systems, generatingelectricity at about 400MWe, based on a large floating offshore platform,similar to those used in oil drilling. Since such a platform would be heavyand unwieldy, there would be a major problem in connecting it to the coldwater pipe (CWP), because of the stresses from surface waves and currents.One response to this problem is to make the platform neutrally buoyant
and moor it underwater (Figure 14.8) thereby avoiding the major stressesat the surface.
14.5.2 Construction of the cold water pipe
The pipe is subject to many forces in addition to the stresses at the con-nection. These include drag by currents, oscillating forces due to vortexshedding, forces due to harmonic motion of the platform, forces due todrift of the platform and the dead weight of the pipe itself. It is debat-able whether a rigid, e.g. steel, or flexible material, e.g. polythene, would

466 Ocean thermal energy conversion (OTEC)
Figure 14.8 Underwater platform for 400MWe systems; proposed by Lockheed forthe US Department of Energy. The platform can be moored in positionin any depth of water.
withstand these forces better. In addition, there are substantial difficultiesinvolved in assembling and positioning the pipe. Some engineers favourbringing out a prefabricated pipe and slowly sinking it into place; however,transporting an object several meters in diameter and perhaps a kilometrelong is difficult. Premature failure of the CWP, e.g. from storm damage,caused the failure of several demonstration projects.
14.5.3 Link to the shore
High voltage, large power, submarine cables are standard components ofelectrical power transmission systems. They are expensive, as with all marineengineering, but a cable about 50 km long is quite practicable, with powerloss about 0.05% per km for AC and 0.01% per km for DC. There is nowconsiderable experience with such cables for offshore wind power and forunderwater connections in power-grid networks.Alternatively it has been suggested that large OTEC plants, which might
be hundreds of kilometres away from energy demand, could use the electric-ity on board to produce a chemical store of energy, e.g. H2, Section 16.3.
Land-based systems, like that of Figure 14.4, are possible at certainfavourable locations, where the sea bed slopes sharply downward. Theirmain advantage is reduced cost, since the link to shore, assembly and main-tenance are much simplified. The CWP is also not so subject to stress, sinceit rests on the sea bottom; however, it is still vulnerable to storm damagefrom wave motion to a depth of about 20m.

14.5 Other practical considerations 467
14.5.4 The turbine
Even though the turbine has to be large, standard designs can be used. Forexample, engines for working across relatively small temperature differenceshave been developed and used in Israel in connection with solar ponds,Section 6.7. As with all practical heat engines, the efficiency will not begreater than 50% of an ideal Carnot engine with the same heat input to theworking fluid.
14.5.5 Choice of working fluid
There are many common fluids having an appropriate boiling point, e.g.ammonia, freon or water, but many of these are environmentally unaccept-able, since leaks increase greenhouse or ozone-depleting gases. By applyinga partial vacuum, i.e. reducing the pressure, the boiling point of water canbe reduced to the temperature of the warm water intake. This is the basisof the open cycle system, in which the warm seawater itself is used as theworking fluid. Such a system provides not only power but also substantialquantities of distilled water.
14.5.6 Related technologies
OTEC is one of several possible deep ocean water applications (DOWA)associated with pumping seawater from depths of at least 100m. Others arelisted below. All have dimensional scaling factors encouraging large equip-ment, unlike the modular operation and smaller scale of most renewableenergy options.
a Marine farming. Seawater from the depths below about 500m is rich innutrients, and these may be pumped to the surface, as from an OTECplant. This encourages the growth of algae (phytoplankton), which feedother marine creatures higher up the food chain and so provides a basisfor commercial fish farming.
b Cooling. Deep, cool water pumped to the surface may be used to coolbuildings, tropical horticultural ‘greenhouses’ or engineering plants asin chemical refineries.
c Fresh water. Flash evaporation of upper surface sea water onto con-densers cooled by deep water produces ‘distilled’ ‘fresh’ water fordrinking, horticulture, etc. This process may be integrated with solardistillation.
d CO2 injection. The aim is to absorb CO2 emitted from large-scale fossilfuel combustion by absorption into surface sea water and pumping todepth. This is almost the reverse of the technology for the OTEC CWP,and would be on a very large scale. Environmental impact on the biotaat depth is an issue, as are cost and sustainability.
468 Ocean thermal energy conversion (OTEC)
e Floating industrial complexes. Concepts exist to match the large scale ofOTEC and DOWA with industry on very large, km scale, floating rafts,e.g. for ammonia and hydrogen production for shipping to land-basedmarkets. Talk is cheap!
If OTEC, or similar technologies, are ever to become accepted commercially,it seems inevitable that an integrated set of operations will be used for acombination of several benefits.
14.6 Environmental impact
The main environmental impacts of OTEC-like technologies relate to:
• small thermodynamic efficiencies of engineering plant which in turnrelate to the relatively small temperature differences of about 25�Cbetween surface and deep water;
• leakage, and likely pollution, from engineering plant, especially of theworking fluids and antifouling chemicals;
• consequent large volumes of pumped marine water;• forced mixing of deep nutrient-rich (nitrate, phosphate and silicate)
water with upper, solar irradiated, water;• location of engineering plant.
Local pollution must always be avoided. Otherwise none of these impactsappear to be particularly grave on a global scale unless very large numbers ofOTEC systems are deployed. The hypothetical location of very many OTECplants, say 1000 stations of 200MWe each in the Gulf of Mexico, has beencalculated to reduce surface sea temperature by 0�3�C. Such a reduction,even at such an unlikely scale, is not considered physically significant.Of more significance locally would be impacts from onshore OTEC orDOWA engineering plant with local waters, including local circulation andcurrents.The total biological effects of releasing large quantities of cool, nutrient-
rich water into the warmer surface environment are not fully known. Theeffects may or may not be desirable, and have to be estimated from small-scale trials and computer modelling. Large deployment of OTEC plant, say100 stations at 10 km separation, would cause the upwelling of nitrate toa concentration found naturally off Peru, where fish populations are muchincreased. Consequently immediate impacts need not all be negative tomankind, and certainly the prospect of enriching fisheries with deep waternutrients is considered as potentially positive. As cold, deep water reachesthe ocean surface, a proportion of dissolved CO2 passes into the atmosphere.If 50% of the excess CO2 is emitted, the rate would be about 0�1kgkW
−1e ,
Bibliography 469
as compared with about 0�8kgkW−1e from electricity generation by fossil
fuel. Only if the OTEC energy produced is used to abate the use of fossilfuels are global emissions of CO2 reduced.The social impacts of OTEC would be similar to those of running an
offshore oil rig or an onshore power station, i.e. minimal.
Problems
14.1 Calculate the dimensions of a shell-and-tube heat exchanger to pro-duce an output power P2 = 10MW. Assume rv = 3×10⁻⁴ m2 KW−1,�T = 4 �C. and tube diameter D = 5cm.Hint: Follow Example 14.2.
14.2 Calculate the power lost to fluid friction in the heat exchanger ofExample 14.2.
14.3 Heat engine for maximum power. As shown in textbooks of thermo-dynamics, no heat engine could be more efficient than the ideal con-cept of the Carnot engine. Working between temperatures Th and Tc,its efficiency is
�Carnot��T�= �Th−Tc�/Th
However, the power output from a Carnot engine is zero. Why?Use (14.8) to show that the engine which produces the greatest
power, for constant thermal resistance of pipe, has �T = 1/4�T , i.e.it ‘throws away’ half the input temperature difference. What is theefficiency of this engine as an energy converter compared with anideal Carnot engine?
14.4 If P∝��T2/Th (14.4), calculate the rate of change of efficiency with
respect to temperature difference �T . What is the percentage improve-ment in power production if �T increases from 20 to 21�C?
Bibliography
Monographs
Avery, W.H. and Wu, C. (1994) Renewable Energy from the Ocean – A Guide toOTEC, Oxford University Press (John Hopkins University series). �A substantial
and authoritative study of the science, engineering and history of OTEC.�Ramesh, R., Udayakumar, K. and Anandakrishnan, M. (1997) Renewable Energy
Technologies: Ocean Thermal Energy and Other Sustainable Energy Options,Narosa Publishing, London and Delhi. �Collection of optimistic papers from a
conference on OTEC in Tamil Naidu, India.�
470 Ocean thermal energy conversion (OTEC)
Articles
d’Arsonval, Jacques (1881) Revue Scientifique, 17, pp. 370–372. �Perhaps the ear-
liest published reference to the potential of OTEC.�Gauthier, M., Golman, L. and Lennard, D. (2000) Ocean Thermal Energy Con-
version (OTEC) and Deep Water Applications (DOWA) – market opportunities
for European Industry, in Proc. Euro. Conf. New and Renewable Technologiesfor Sustainable Development, Madeira, June 2000. �Excellent review of working
plant since the 1930’s to 2000, with future industrial market potential.�Johnson, F.A. (1992) Closed cycle thermal energy conversion, in Seymour, R.J.
(ed.), Ocean Energy Recovery: The State of the Art, American Society of
Civil Engineers (1992). �Useful summary of thermodynamics, economics and
history.�Masutani, S.M. and Takahashi, P.K. (1999) Ocean Thermal Energy Conversion, in
J.G. Webster (ed.) Encyclopaedia of Electrical and Electronics Engineering, 18,pp. 93–103, Wiley. �Authoritative summary.�
McGowan, J.G. (1976) Ocean thermal energy conversion – a significant solar
resources, Solar Energy, 18, pp. 81–92. �Reviewed US design philosophy at a
historically important time.�Ravidran, M. (1999) Indian 1 MW Floating Plant: An overview, in Proc. IOA ‘99
Conf., IMARI, Japan.
UN (1984)A guide to Ocean Thermal Energy Conversion for Developing Countries,United Nations Publications, New York.
Wick, G.I. and Schmidt, W.R. (1981) (eds) Harvesting Ocean Energy, United
Nations, Paris.
Zener, C. (1974) Solar sea power, in Physics and the Energy Problem – 1974,American Institute of Physics Conference Proceedings no. 19, pp. 412–419.
�Useful for heat exchanger thermodynamics. Whole volume makes interesting
reading.�
Thermodynamics of real engines
Curzon, F.L. and Ahlborn, B. (1975) Efficiency of a Carnot engine at maximum
power output, Amer. J. Phys., 43, pp. 22–24.
Chapter 15
Geothermal energy
15.1 Introduction
The inner core of the earth reaches a maximum temperature of about
4000 �C. Heat passes out through the solid submarine and land surface
mostly by conduction – geothermal heat – and occasionally by active con-
vective currents of molten magma or heated water. The average geothermal
heat flow at the Earth’s surface is only 0�06Wm−2, with a temperature gra-
dient of <30 �Ckm−1. This continuous heat current is trivial compared with
other renewable supplies in the above surface environment that in total aver-
age about 500Wm−2; see Figure 1.2. However, at certain specific locations,
increased temperature gradients occur, indicating significant geothermal
resources. These may be harnessed over areas of the order of square kilome-
tres and depths of ∼5km at fluxes of 10–20Wm−2 to produce ∼100MW
�thermal�km−2
in commercial supplies for at least 20 years of operation.
Geothermal heat is generally of low quality, and is best used directly
for building or process heat at about 50–70 �C, or for preheating of con-
ventional high temperature energy supplies. Such supplies are established
in several parts of the world and many more projects are planned. Occa-
sionally geothermal heat is available at temperatures above about 150 �C,so electrical power production from turbines can be contemplated. Sev-
eral important geothermal electric power complexes are fully established,
especially in Italy, New Zealand and the USA.
It is common to use heat from the near-surface ground or from lakes, etc.
as input to a heat pump. Although this may be interpreted as a ‘geothermal’
source, we do not include such systems as geothermal supplies for the
purposes of this chapter. It is probably more meaningful to consider such
sources as stored heat from sunshine, since replenishment will be more from
the environment above than below.
In Chapter 1 renewable energy was defined as currents of energy occur-
ring naturally in the environment. By this definition some sources of geother-
mal energy can be classed as renewable, because the energy would otherwise

472 Geothermal energy
be dissipated in the environment, e.g. from hot springs or geysers. In othergeothermal sites, however, the current of heat is increased artificially, e.g.by fracturing and actively cooling hot rocks, or by drilling into hot aquifers,and so the supply is not renewable at the extraction rate on a long timescale. Such finite supplies are included in this text only because they areusually included with other ‘alternative’ supplies.
15.2 Geophysics
A section through the earth is shown in Figure 15.1. Heat transfer from thesemi- fluid mantle maintains a temperature difference across the relativelythin crust of 1000 �C, and a mean temperature gradient of ∼30 �Ckm
−1.
The crust solid material has a mean density ∼2700kgm−3, specific heat
capacity ∼1000Jkg−1
K−1 and thermal conductivity ∼2Wm−1 K−1. There-fore the average geothermal flux is∼0�06Wm−2, with the heat stored in thecrust at temperatures greater than surface temperature being ∼1020 Jkm
−2.
If just 0.1% of this heat was removed in 30 years, the heat power avail-able would be 100MWkm
−2. Such heat extraction would be replenished in
time from the mantle below. These calculations give the order of magnitudeof the quantities involved and show that geothermal sources are a largepotential energy supply.Heat passes from the crust by (1) natural cooling and friction from
the core, (2) radioactive decay of elements such as uranium and thorium,and (3) chemical reactions. The time constants of such processes over thewhole Earth are so long that it is not possible to know whether the Earth’stemperature is presently increasing or decreasing. The radioactive elementsare concentrated in the crust by fractional recrystallisation from molten
Figure 15.1 Section through the Earth, showing average lower depths of namedlayers. The crust has significant variation in composition and thicknessover a local scale of several kilometres.
15.2 Geophysics 473
material, and are particularly pronounced in granite. However, the produc-tion of heat by radioactivity or chemical action is only significant over manymillions of years, see Problem 15.2; consequently geothermal heat extrac-tion relies on removing stored heat in the thermal capacity of solid materialand water in the crust, rather than on replenishment. If conduction throughuniform material was the only geothermal heat transfer mechanism, thetemperature gradient in the crust would be constant. However, if convec-tion occurs ‘locally’, as from water movement, or if local radioactive orexothermic chemical heat sources occur, there are anomalous temperaturegradients.On a global perspective, the Earth’s crust consists of large plates,
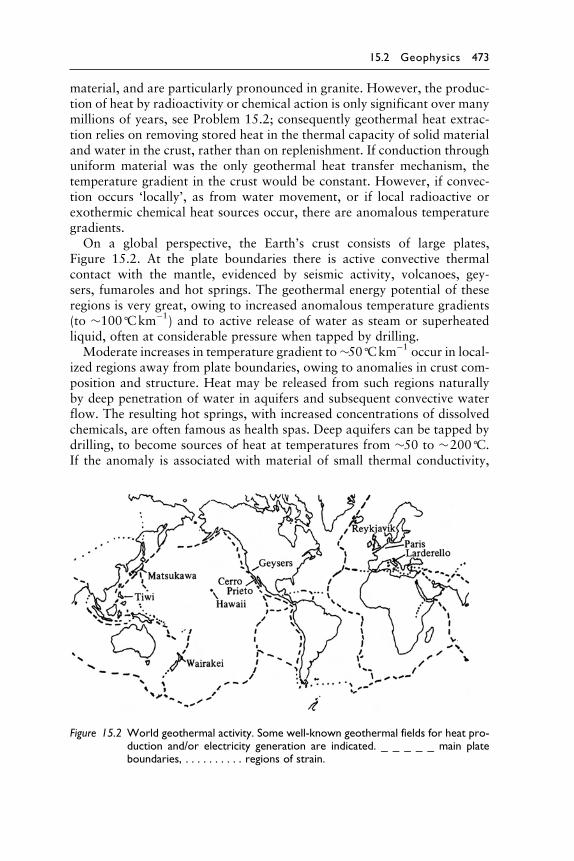
Figure 15.2. At the plate boundaries there is active convective thermalcontact with the mantle, evidenced by seismic activity, volcanoes, gey-sers, fumaroles and hot springs. The geothermal energy potential of theseregions is very great, owing to increased anomalous temperature gradients(to ∼100 �Ckm
−1) and to active release of water as steam or superheated
liquid, often at considerable pressure when tapped by drilling.Moderate increases in temperature gradient to∼50 �Ckm
−1occur in local-
ized regions away from plate boundaries, owing to anomalies in crust com-position and structure. Heat may be released from such regions naturallyby deep penetration of water in aquifers and subsequent convective waterflow. The resulting hot springs, with increased concentrations of dissolvedchemicals, are often famous as health spas. Deep aquifers can be tapped bydrilling, to become sources of heat at temperatures from ∼50 to ∼200 �C.If the anomaly is associated with material of small thermal conductivity,
Figure 15.2 World geothermal activity. Some well-known geothermal fields for heat pro-duction and/or electricity generation are indicated. _ _ _ _ _ main plateboundaries, � � � � � � � � � � regions of strain.
474 Geothermal energy
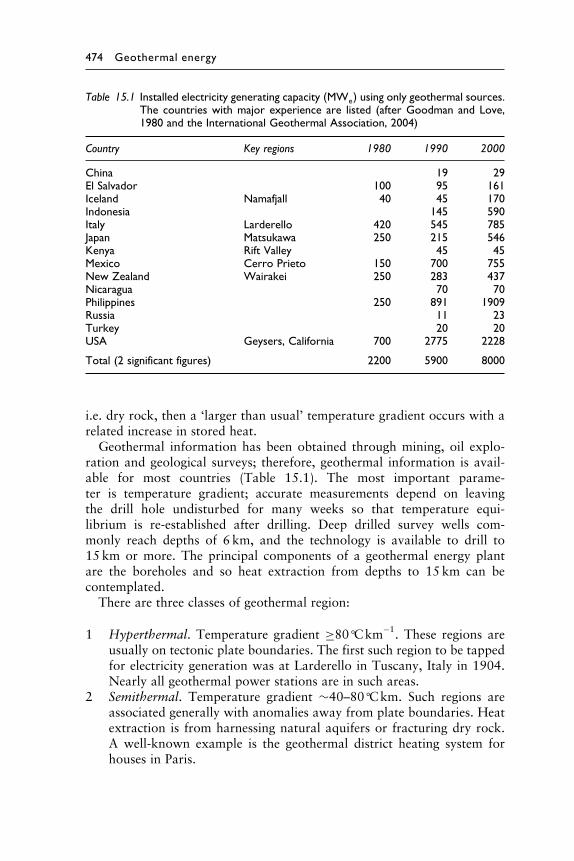
Table 15.1 Installed electricity generating capacity �MWe using only geothermal sources.The countries with major experience are listed (after Goodman and Love,1980 and the International Geothermal Association, 2004)
Country Key regions 1980 1990 2000
China 19 29El Salvador 100 95 161Iceland Namafjall 40 45 170Indonesia 145 590Italy Larderello 420 545 785Japan Matsukawa 250 215 546Kenya Rift Valley 45 45Mexico Cerro Prieto 150 700 755New Zealand Wairakei 250 283 437Nicaragua 70 70Philippines 250 891 1909Russia 11 23Turkey 20 20USA Geysers, California 700 2775 2228
Total (2 significant figures) 2200 5900 8000
i.e. dry rock, then a ‘larger than usual’ temperature gradient occurs with arelated increase in stored heat.Geothermal information has been obtained through mining, oil explo-
ration and geological surveys; therefore, geothermal information is avail-able for most countries (Table 15.1). The most important parame-ter is temperature gradient; accurate measurements depend on leavingthe drill hole undisturbed for many weeks so that temperature equi-librium is re-established after drilling. Deep drilled survey wells com-monly reach depths of 6 km, and the technology is available to drill to15 km or more. The principal components of a geothermal energy plantare the boreholes and so heat extraction from depths to 15 km can becontemplated.There are three classes of geothermal region:
1 Hyperthermal. Temperature gradient ≥80 �Ckm−1. These regions are
usually on tectonic plate boundaries. The first such region to be tappedfor electricity generation was at Larderello in Tuscany, Italy in 1904.Nearly all geothermal power stations are in such areas.
2 Semithermal. Temperature gradient ∼40–80 �Ckm. Such regions areassociated generally with anomalies away from plate boundaries. Heatextraction is from harnessing natural aquifers or fracturing dry rock.A well-known example is the geothermal district heating system forhouses in Paris.
15.3 Dry rock and hot aquifer analysis 475
3 Normal. Temperature gradient <40 �Ckm. These remaining regionsare associated with average geothermal conductive heat flow at∼0�06Wm−2. It is unlikely that these areas can ever supply geothermalheat at prices competitive to present (finite) or future (renewable) energysupplies.
In each class it is, in principle, possible for heat to be obtained by:
1 Natural hydrothermal circulation. In this, water percolates to deepaquifers to be heated to dry steam, vapour/liquid mixtures or hot water.Emissions of each type can be observed in nature. If pressure increasesby steam formation at deep levels, spectacular geysers may occur, asat the Geysers near Sacramento in California and in the Wairakei areanear Rotorua in New Zealand. Note, however, that liquid water isejected, and not steam.
2 Hot igneous systems. These are associated with heat from semi-moltenmagma that solidifies to lava. The first power plant using this sourcewas the 3MWe station in Hawaii, completed in 1982.
3 Dry rock fracturing. Poorly conducting dry rock, e.g. granite, storesheat over millions of years with a subsequent increase in tempera-ture. Artificial fracturing from boreholes enables water to be pumpedthrough the rock to extract the heat.
In practice, geothermal energy plants in hyperthermal regions are associatedwith natural hydrothermal systems; in semithermal regions both hydrother-mal and hot rock extraction is developed; and normal areas have too smalla temperature gradient for commercial interest.
15.3 Dry rock and hot aquifer analysis
15.3.1 Dry rock
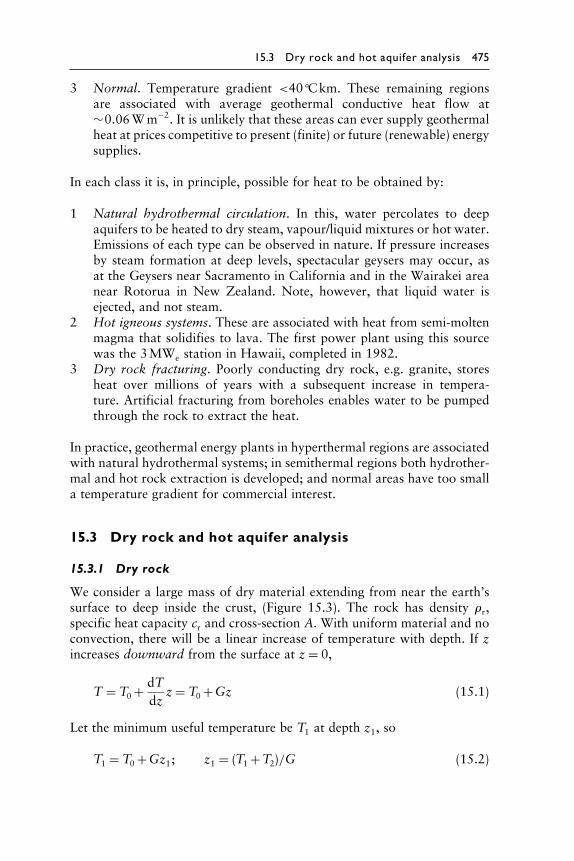
We consider a large mass of dry material extending from near the earth’ssurface to deep inside the crust, (Figure 15.3). The rock has density �r,specific heat capacity cr and cross-section A. With uniform material and noconvection, there will be a linear increase of temperature with depth. If zincreases downward from the surface at z= 0,
T = T0+dT
dzz= T0+Gz (15.1)
Let the minimum useful temperature be T1 at depth z1, so
T1 = T0+Gz1� z1 = �T1+T2�/G (15.2)
476 Geothermal energy
Figure 15.3 Profile of hot dry rock system for calculating the heat content. Density�, specific heat capacity c, temperature gradient dT/dz = G.
The useful heat content )E, at temperature T �>T1�, in an element of thick-ness �z at depth z is
)E = ��rA�z�cr�T −T1�= ��rA�z�crG�z−z1� (15.3)
The total useful heat content of the rock to depth z2 becomes
E0 =∫ z2
z=z1�rAcrG�z−z1�dz
= �rAcrG�z2−z1�2/2(15.4)
Alternatively, let the average available temperature greater than T1 be �:
� = �T2−T1�/2=G�z2−z1�/2 (15.5)
then E0 = Cr�, where Cr is the thermal capacity of the rock between z1and z2,
Cr = �rAcr�z2−z1� (15.6)
so as with (15.4),
E0 = �rAcrG�z2−z1�2/2 (15.7)
Assume heat is extracted from the rock uniformly in proportion to thetemperature excess over T1 by a flow of water with volume flow rate V̇ ,density �w and specific heat capacity cw. The water will be heated througha temperature difference of � in the near perfect heat exchange process.