the potential for reducing the number of killed or
TRANSCRIPT
TØI report 1764/2020
Rune Elvik
Alena Katharina Høye
The Potential for Reducing the Number of Killed or Seriously Injured Road Users in Norway in the Period 2018-2030


TØI Report
1764/2020
The Potential for Reducing the Number of Killed or Seriously Injured Road Users in Norway in the Period 2018-2030
Rune Elvik Alena Katharina Høye
Front-page photography/illustration: Shutterstock
ISSN 2535-5104 Electronic
ISBN 978-82-480-1572-7 Electronic Oslo, May 2020
Copyright © Institute of Transport Economics, 2020 This publication is protected in accordance with Åndsverkloven of 2018
When reproducing material from this publication, a complete source must be provided.
Tittel: Potensialet for å redusere antall drepte og hardt skadde i trafikken i perioden 2018-2030
Title: The Potential for Reducing the Number of Killed or Seriously Injured Road Users in Norway in the Period 2018-2030
Forfattere: Rune Elvik Alena Katharina Høye
Authors: Rune Elvik Alena Katharina Høye
Dato: 05.2020 Date: 05.2020 TØI-rapport: 1764/2020 TØI Report: 1764/2020 Sider: 67 Pages: 67 ISSN elektronisk: 2535-5104 ISSN Electronic: 2535-5104 ISBN elektronisk: 978-82-480-1572-7 ISBN Electronic: 978-82-480-1572-7 Finansieringskilde: Transport for New South
Wales, Australia Financed by: Transport for New South
Wales, Australia
Prosjekt: 4784 – Australian Potentials Project: 4784 – Australian Potentials Prosjektleder: Rune Elvik Project Manager: Rune Elvik Kvalitetsansvarlig: Trine M. Dale Quality Manager: Trine M. Dale Fagfelt: Trafikksikkerhet på vei Research Area: Road Safety Emneord: Trafikksikkerhetstiltak
Maksimal bruk Drepte Hardt skadde Potensialanalyse
Keywords: Road safety measure Maximum use Fatalities Serious injuries Safety potentials
Sammendrag:
Summary:
Mulighetene for å redusere antall drepte og hardt skadde i trafikken ved maksimal bruk av 33 trafikksikkerhetstiltak er undersøkt. Det er mulig å redusere antall drepte i 2024 og 2030 til 40-60 og antall hardt skadde i 2024 og 2030 til 300-390. Et mål om høyst 500 drepte og hardt skadde i 2024 kan nås ved maksimal innsats for alle tiltak. Målet om høyst 350 drepte og hardt skadde i 2030 synes vanskeligere å nå. Fallskader blant fotgjengere kan reduseres med 15-23% ved bedre vinterdrift.
The number of killed or seriously injured road users can be significantly reduced by using 33 road safety measures to the maximum extent. The number of fatalities (106 in 2017) can be reduced to 40-60 in 2024 and 2030. The number of seriously injured road users (665 in 2017) can be reduced to 300-390 in 2024 and 2030. A target of not more than 500 killed or seriously injured road users in 2024 seems attainable. A target of not more than 350 killed or seriously injured road users in 2030 seems to be difficult to reach. Falls among pedestrians can be reduced by 15-23 % by improving winter maintenance of roads.
Language of report: English
Transportøkonomisk Institutt Gaustadalléen 21, 0349 Oslo Telefon 22 57 38 00 - www.toi.no
Institute of Transport Economics Gaustadalléen 21, N-0349 Oslo, Norway Telephone +47 22 57 38 00 - www.toi.no

The Potential for Reducing the Number of Killed or Seriously Injured Road Users in Norway in the Period 2018-2030
Copyright © Institute of Transport Economics, 2020 o
Preface This report is a translated version of report 1645/2018, describing the potential for reducing the number of killed or seriously injured road users in Norway during the period from 2018 to 2030. That report was written as part of the BEST research program funded by the Norwegian Public Roads Administration. In 2019, Transport for New South Wales, Australia, contacted the Institute of Transport Economics and asked if the report could be translated to English. A project funding the translation was set up. Contact persons on behalf of Transport for New South Wales have been Antonietta Cavallo and Ralston Fernandes. Project manager at the Institute of Transport Economics has been senior political scientist Rune Elvik. Together with chief research officer Alena Katharina Høye, he wrote report 1645/2018. He also translated the report to English. We thank Antonietta Cavallo and Ralston Fernandes for giving us this project and for careful review of the translated report. Secretary Trude Kvalsvik edited the report and prepared it for electronic publishing. Research Director Trine Dale performed the quality checking of the report. Oslo, May 2020 Institute of Transport Economics Gunnar Lindberg Trine M. Dale Managing Director Research Director


The Potential for Reducing the Number of Killed or Seriously Injured Road Users in Norway in the Period 2018-2030
Copyright © Institute of Transport Economics, 2019 o
Contents Summary 1 Background and research problem ...................................................................... 1
1.1 Background ...................................................................................................................... 1 1.2 Research problems .......................................................................................................... 1
2 Baseline scenario .................................................................................................. 3 2.1 Trends for 2000-2017 and projection of them to 2030 ............................................. 3 2.2 Political objectives for reducing the number of killed or seriously injured road
users .................................................................................................................................. 4 3 An outline of road safety measures ...................................................................... 6
3.1 Potentially effective road safety measures ................................................................... 6 3.2 Road-related measures .................................................................................................... 6 3.3 Vehicle-related measures .............................................................................................. 10 3.4 Enforcement and safety management ........................................................................ 27 3.5 Maximum conceivable use of the measures .............................................................. 30
4 Models for estimating the impacts of the measures .......................................... 34 4.1 Measures for which the total impact increases as the measure is used more
extensively ...................................................................................................................... 34 4.2 Measures that have full impact at once ...................................................................... 35 4.3 Measures where effects vary according to the level of use...................................... 36 4.4 A comprehensive and unified framework for analysing the effects on traffic
injury of measures influencing speed ......................................................................... 38 4.5 Correlations between risk factors and the combined effects of measures ............ 41
5 Effects of road safety measures ......................................................................... 43 5.1 Estimated reduction of the number of killed or seriously injured road users in
2024 and 2030 ............................................................................................................... 43 5.2 Can the targets for 2024 and 2030 be realised? ......................................................... 50 5.3 The potential for reducing injuries among pedestrians and cyclists ...................... 51
6 Discussion of the results .................................................................................... 59 7 Conclusions ........................................................................................................ 62 8 References .......................................................................................................... 63


Telephone: +47 22 57 38 00 E-mail: [email protected] i This report can be downloaded from www.toi.no
Summary
The Potential for Reducing the Number of Killed or Seriously Injured Road Users in Norway in the Period 2018-2030
TØI Report 1764/2020 Authors: Rune Elvik and Alena Katharina Høye
Oslo 2020 67 pages English language
The number of killed or seriously injured road users in Norway can be reduced substantially. This is the main finding of an analysis of the potential for improving road safety by implementing 33 road safety measures. It is, in principle, possible to realise the target of a maximum of 500 killed or seriously injured road users in 2024, by implementing all measures consistently. This means, for example, building motorways, installing road lighting, doubling police enforcement and stimulating a faster renewal of the car fleet. A target of not more than 350 killed or seriously injured road users in 2030 appears to be more difficult to reach by means of the road safety measures included in the analysis. Based on injury data collected by the emergency medical clinic in Oslo (Oslo skadelegevakt), the potential for reducing injuries to pedestrians and cyclists by means of improved road maintenance, in particular winter maintenance, has been estimated. It was estimated that pedestrian injuries can be reduced by 15-23% and cyclist injuries can be reduced by 5-10%.
Road safety in Norway can be improved
Norway has a high level of road safety compared to other countries with the same level of motorisation. There were 106 road accident fatalities in 2017; the lowest number since 1947. The number of fatalities has declined sharply after the year 2000. It is a political objective to continue improving road safety in Norway. Targets have been set for a maximum of 500 killed or seriously injured road users in 2024 (the number was 771 in 2017) and a maximum of 350 killed or seriously injured road users in 2030. Can these targets be realised? To what extent can road safety measures contribute to a further reduction of the number of killed or seriously injured road users in Norway? To answer these questions, the potential for improving road safety by means of 33 road safety measures has been analysed. Table S.1 lists these road safety measures. There are seven infrastructure measures, 17 vehicle-related measures and nine enforcement measures.
Maximum use of road safety measures
For each road safety measure, the maximum conceivable use of the measure has been defined. Maximum use is intended to represent a level of implementation that can be attained, and is thus not entirely hypothetical or unrealistic. For motorways and median guard rails, a list of projects that will be implemented before 2024 has been provided and it has been assumed that all projects will be implemented.
The Potential for Reducing the Number of Killed or Seriously Injured Road Users in Norway in the Period 2018-2030
ii Copyright © Institute of Transport Economics, 2019
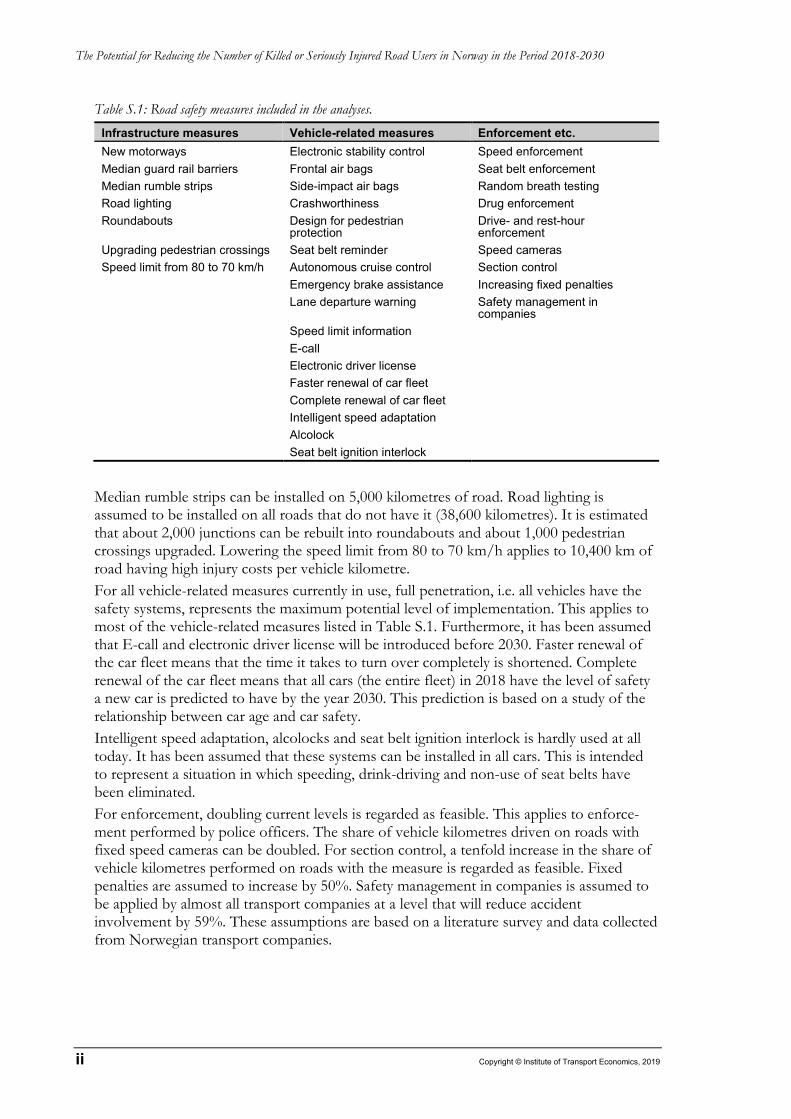
Table S.1: Road safety measures included in the analyses.
Infrastructure measures Vehicle-related measures Enforcement etc. New motorways Electronic stability control Speed enforcement Median guard rail barriers Frontal air bags Seat belt enforcement Median rumble strips Side-impact air bags Random breath testing Road lighting Crashworthiness Drug enforcement Roundabouts Design for pedestrian
protection Drive- and rest-hour enforcement
Upgrading pedestrian crossings Seat belt reminder Speed cameras Speed limit from 80 to 70 km/h Autonomous cruise control Section control Emergency brake assistance Increasing fixed penalties Lane departure warning Safety management in
companies Speed limit information E-call Electronic driver license Faster renewal of car fleet Complete renewal of car fleet Intelligent speed adaptation Alcolock Seat belt ignition interlock
Median rumble strips can be installed on 5,000 kilometres of road. Road lighting is assumed to be installed on all roads that do not have it (38,600 kilometres). It is estimated that about 2,000 junctions can be rebuilt into roundabouts and about 1,000 pedestrian crossings upgraded. Lowering the speed limit from 80 to 70 km/h applies to 10,400 km of road having high injury costs per vehicle kilometre. For all vehicle-related measures currently in use, full penetration, i.e. all vehicles have the safety systems, represents the maximum potential level of implementation. This applies to most of the vehicle-related measures listed in Table S.1. Furthermore, it has been assumed that E-call and electronic driver license will be introduced before 2030. Faster renewal of the car fleet means that the time it takes to turn over completely is shortened. Complete renewal of the car fleet means that all cars (the entire fleet) in 2018 have the level of safety a new car is predicted to have by the year 2030. This prediction is based on a study of the relationship between car age and car safety. Intelligent speed adaptation, alcolocks and seat belt ignition interlock is hardly used at all today. It has been assumed that these systems can be installed in all cars. This is intended to represent a situation in which speeding, drink-driving and non-use of seat belts have been eliminated. For enforcement, doubling current levels is regarded as feasible. This applies to enforce-ment performed by police officers. The share of vehicle kilometres driven on roads with fixed speed cameras can be doubled. For section control, a tenfold increase in the share of vehicle kilometres performed on roads with the measure is regarded as feasible. Fixed penalties are assumed to increase by 50%. Safety management in companies is assumed to be applied by almost all transport companies at a level that will reduce accident involvement by 59%. These assumptions are based on a literature survey and data collected from Norwegian transport companies.
The Potential for Reducing the Number of Killed or Seriously Injured Road Users in Norway in the Period 2018-2030
Copyright © Institute of Transport Economics, 2019 iii
Baseline predictions
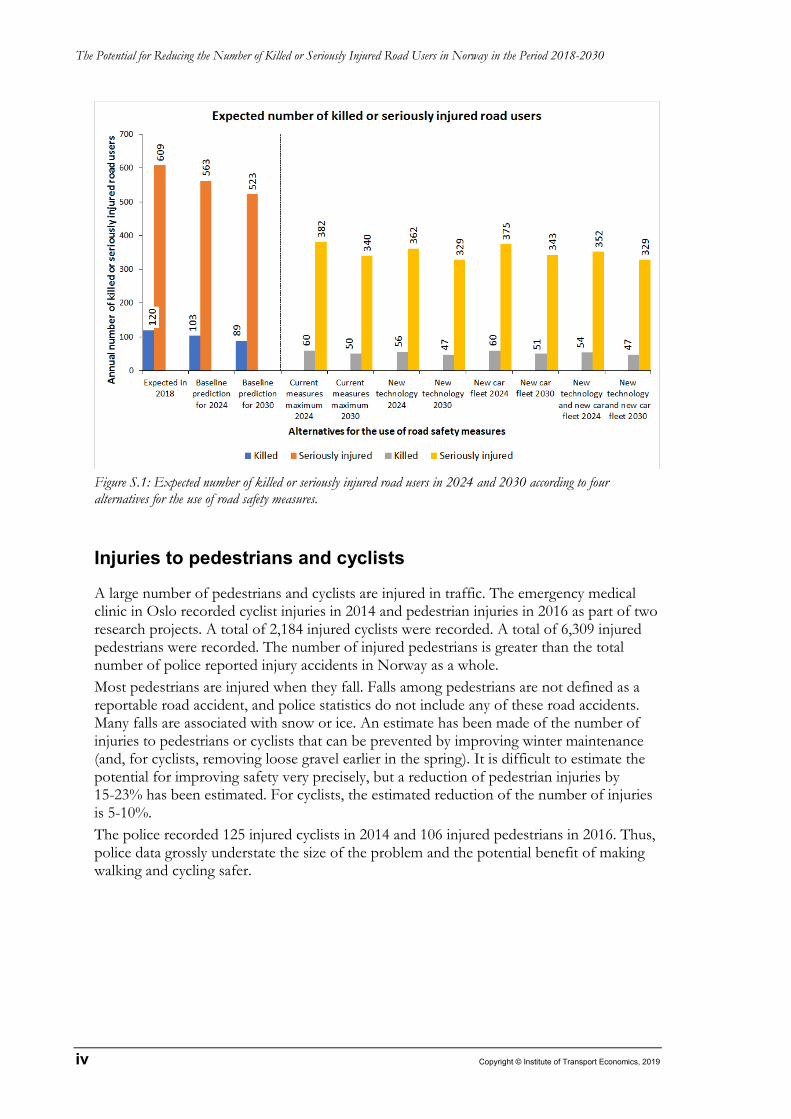
A forecast of the number of traffic fatalities and seriously injured road users in 2024 and 2030, assuming that no new safety measures are introduced has been made. This is referred to as a baseline forecast. The baseline forecast does not include the effects of road safety measures that contributed to the past decline in the number of killed or seriously injured road users. It therefore predicts that the number of killed or seriously injured road users will decline at a slower annual rate than observed after the year 2000. The baseline forecast does, however, include the expected renewal of the car fleet and the increasing penetration of safety systems associated with this renewal. The reason for including this in the baseline forecast is that the effect of vehicle safety measures is estimated as the extra gain obtained by reaching 100% penetration, compared to actual penetration in a given year. Actual penetration must then be part of the baseline to correctly estimate the attainable gain by 100% penetration. The baseline predicted number of fatalities is 120 in 2018, 103 in 2024 and 89 in 2030. The baseline predicted number of seriously injured road users is 609 in 2018, 563 in 2024 and 523 in 2030.
Four alternatives for the use of the measures
Four alternatives for use of the road safety measures have been developed: 1. Maximum use of current measures: All currently used measures are
implemented at the maximum level. Complete renewal of the car fleet, intelligent speed adaptation, alcolocks and seat belt ignition interlocks are not included.
2. New technology: Intelligent speed adaptation, alcolocks and seat belt ignition interlocks are applied at the maximum level. These measures replace traditional enforcement. All other measures are used as in alternative 1.
3. New car fleet: The vehicle-related measures are replaced by a single measure: Complete renewal of the car fleet. All other measures are used as in alternative 1.
4. New car fleet and new technology: Complete renewal of the car fleet and intelligent speed adaptation, alcolocks and seat belt ignition interlocks are introduced to the maximum extent. Infrastructure measure are retained as in alternative 1.
Figure S.1 shows the estimated number of killed or injured road users associated with these alternatives. The number of fatalities is clearly below 100 in all alternatives. The number of seriously injured road users is 329-382. The highest number of killed or seriously injured road users in 2024 is 442. This is below the target of 500, suggesting that the target can be attained if all road safety measures are implemented at the maximum level. The lowest number of killed or seriously injured road users in 2030 is 376, which is above the target of 350. However, the estimated number of killed or seriously injured road users resulting from use of the road safety measures (376) has a 95% confidence interval from 338 to 414. Thus, it cannot be ruled out that even the target for 2030 can be realised.
The Potential for Reducing the Number of Killed or Seriously Injured Road Users in Norway in the Period 2018-2030
iv Copyright © Institute of Transport Economics, 2019
Figure S.1: Expected number of killed or seriously injured road users in 2024 and 2030 according to four alternatives for the use of road safety measures.
Injuries to pedestrians and cyclists
A large number of pedestrians and cyclists are injured in traffic. The emergency medical clinic in Oslo recorded cyclist injuries in 2014 and pedestrian injuries in 2016 as part of two research projects. A total of 2,184 injured cyclists were recorded. A total of 6,309 injured pedestrians were recorded. The number of injured pedestrians is greater than the total number of police reported injury accidents in Norway as a whole. Most pedestrians are injured when they fall. Falls among pedestrians are not defined as a reportable road accident, and police statistics do not include any of these road accidents. Many falls are associated with snow or ice. An estimate has been made of the number of injuries to pedestrians or cyclists that can be prevented by improving winter maintenance (and, for cyclists, removing loose gravel earlier in the spring). It is difficult to estimate the potential for improving safety very precisely, but a reduction of pedestrian injuries by 15-23% has been estimated. For cyclists, the estimated reduction of the number of injuries is 5-10%. The police recorded 125 injured cyclists in 2014 and 106 injured pedestrians in 2016. Thus, police data grossly understate the size of the problem and the potential benefit of making walking and cycling safer.
The Potential for Reducing the Number of Killed or Seriously Injured Road Users in Norway in the Period 2018-2030
Copyright © Institute of Transport Economics, 2020 1
1 Background and research problem
1.1 Background
In 2015, the Institute of Transport Economics published the report: “The potential for reducing the number of killed or seriously injured road users” (Elvik and Høye 2015). The report had a subtitle: “Preliminary estimates”, suggesting that a more extensive study would be performed later. This report presents an updated and extended analysis of the potential for reducing the number of killed or seriously injured road users in Norway. Although only three years have passed since publication of the first analysis, there is a need for updating and extending it. First, the number of road accident fatalities continues to decline. There were 106 fatalities in 2017. The analysis in 2015 relied on a baseline number of 157, which today is far too high. Second, knowledge has been updated regarding the effects of a number of road safety measures. This applies to motorways (Elvik et al. 2017), speed limits (Elvik 2017A), speed enforcement (Elvik 2015A, 2015B), fixed penalties (Elvik 2016A), and the enforcement of service and rest hour regulations (Høye 2016A). Third, some new road safety measures have become relevant. One is an electronic driving licence (Sagberg 2017, 2018), the other is systems for safety management in transport companies (Nævestad et al. 2018). The objective of this report is to update the analysis of the potential for reducing the number of killed or seriously injured road users by implementing road safety measures that are known to be effective or potentially effective.
1.2 Research problems
The main question this report tries to answer is: • How large is the reduction in the number of killed or seriously injured road users
that can be attained by 2024 and 2030 by implementing all effective road safety measures to the maximum conceivable extent?
To answer this question, it is necessary to answer three other questions: • What is meant by the concept of “effective road safety measures” and which of
these can still contribute to reducing the number of killed or seriously injured road users in Norway?
• How can the contribution of road safety measures to reducing the number of killed or seriously injured road users be separated from the contribution of all other factors influencing the number of killed or seriously injured road users?
• What is meant by the concept of “maximum conceivable” use of a road safety measure?
The first of these questions is the central one for the analyses presented in the report. However, an answer to the second question is needed in order to develop a baseline

The potential for reducing the number of killed or seriously injured road users in Norway in the period 2018-2030
2 Copyright © Institute of Transport Economics, 2020
scenario. The baseline scenario shows how the number of killed or seriously injured road users can be expected to develop from now to 2030 if no road safety measures are introduced, but all other factors continue to exert their influence as indicated by recent trends. The baseline scenario has been developed by analysing trends in the number of killed or seriously injured road users in the period after 2000 and correcting these trends by removing the contributions road safety measures or other known factors have made to them. The corrected trends have then been adjusted to account for expected traffic growth and expected effects of car fleet renewal. The resulting trends represent the best estimate of how the number of killed or seriously injured road users is expected to develop if no road safety measures are introduced. The baseline scenarios are presented in Chapter 2. Chapter 3 outlines road safety measures and defines for each of them the maximum conceivable degree of implementation. Jointly, chapters 2 and 3 provide the basis for the analyses presented in subsequent chapters.
The Potential for Reducing the Number of Killed or Seriously Injured Road Users in Norway in the Period 2018-2030
Copyright © Institute of Transport Economics, 2020 3
2 Baseline scenario
2.1 Trends for 2000-2017 and projection of them to 2030
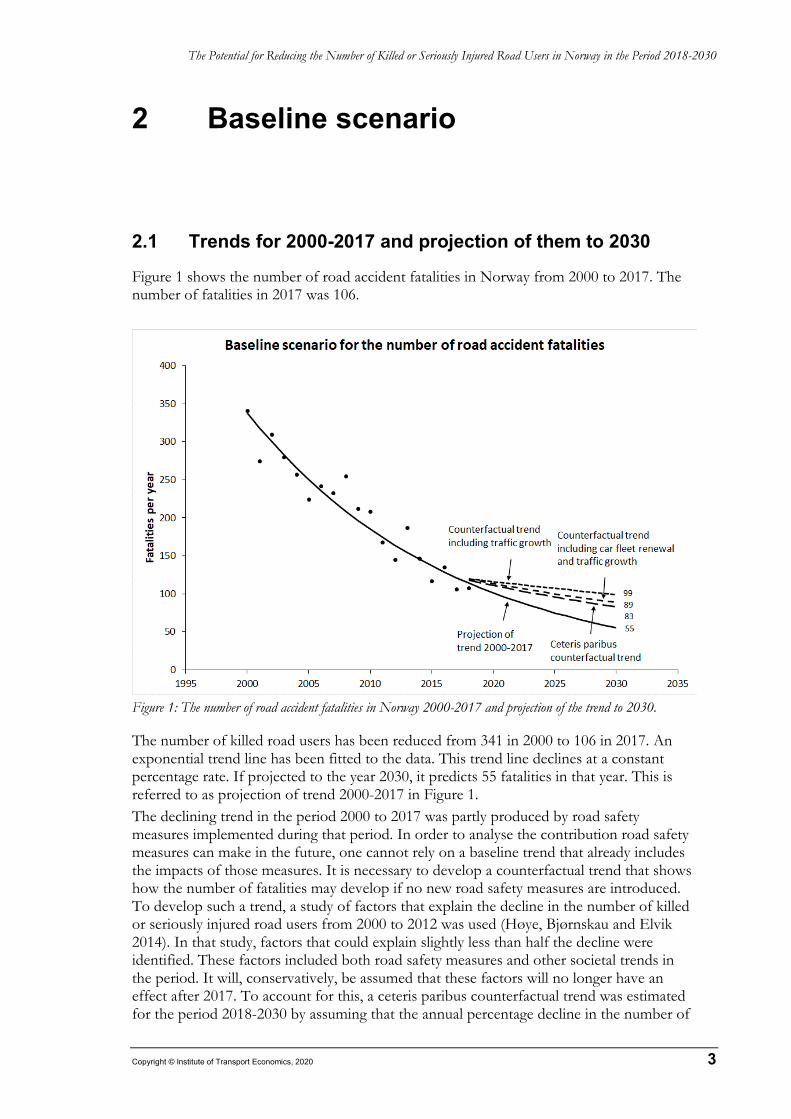
Figure 1 shows the number of road accident fatalities in Norway from 2000 to 2017. The number of fatalities in 2017 was 106.
Figure 1: The number of road accident fatalities in Norway 2000-2017 and projection of the trend to 2030.
The number of killed road users has been reduced from 341 in 2000 to 106 in 2017. An exponential trend line has been fitted to the data. This trend line declines at a constant percentage rate. If projected to the year 2030, it predicts 55 fatalities in that year. This is referred to as projection of trend 2000-2017 in Figure 1. The declining trend in the period 2000 to 2017 was partly produced by road safety measures implemented during that period. In order to analyse the contribution road safety measures can make in the future, one cannot rely on a baseline trend that already includes the impacts of those measures. It is necessary to develop a counterfactual trend that shows how the number of fatalities may develop if no new road safety measures are introduced. To develop such a trend, a study of factors that explain the decline in the number of killed or seriously injured road users from 2000 to 2012 was used (Høye, Bjørnskau and Elvik 2014). In that study, factors that could explain slightly less than half the decline were identified. These factors included both road safety measures and other societal trends in the period. It will, conservatively, be assumed that these factors will no longer have an effect after 2017. To account for this, a ceteris paribus counterfactual trend was estimated for the period 2018-2030 by assuming that the annual percentage decline in the number of
The potential for reducing the number of killed or seriously injured road users in Norway in the period 2018-2030
4 Copyright © Institute of Transport Economics, 2020
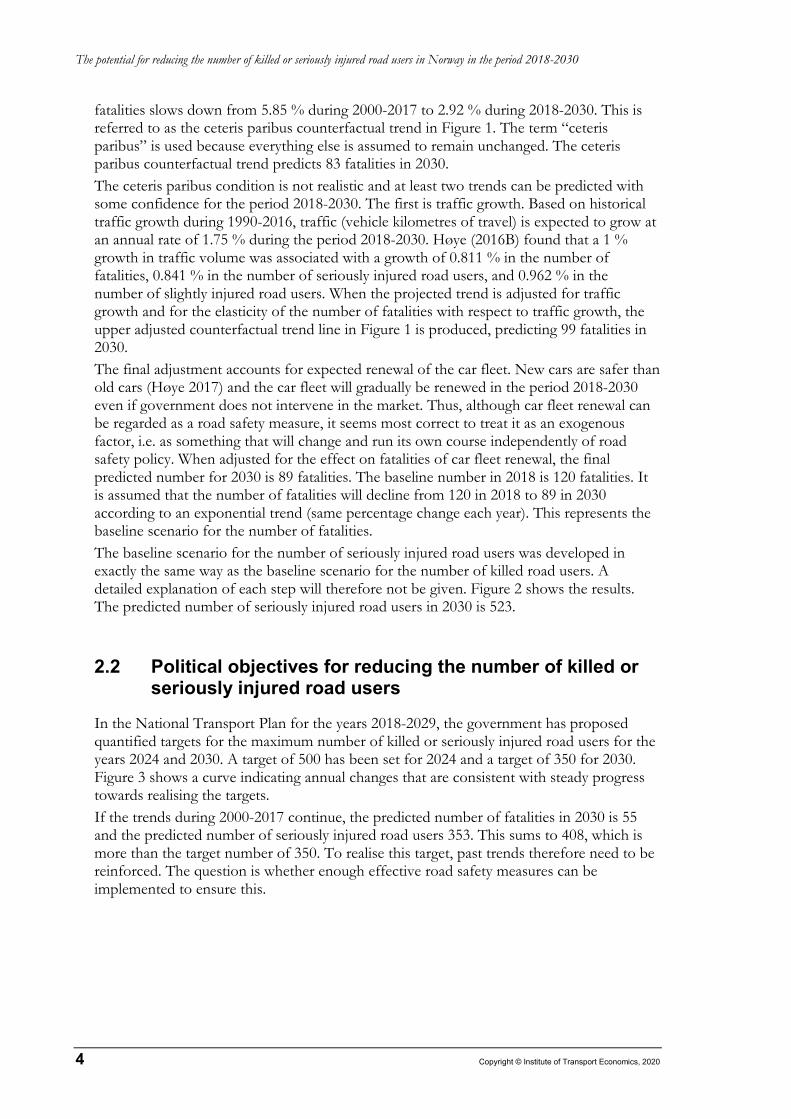
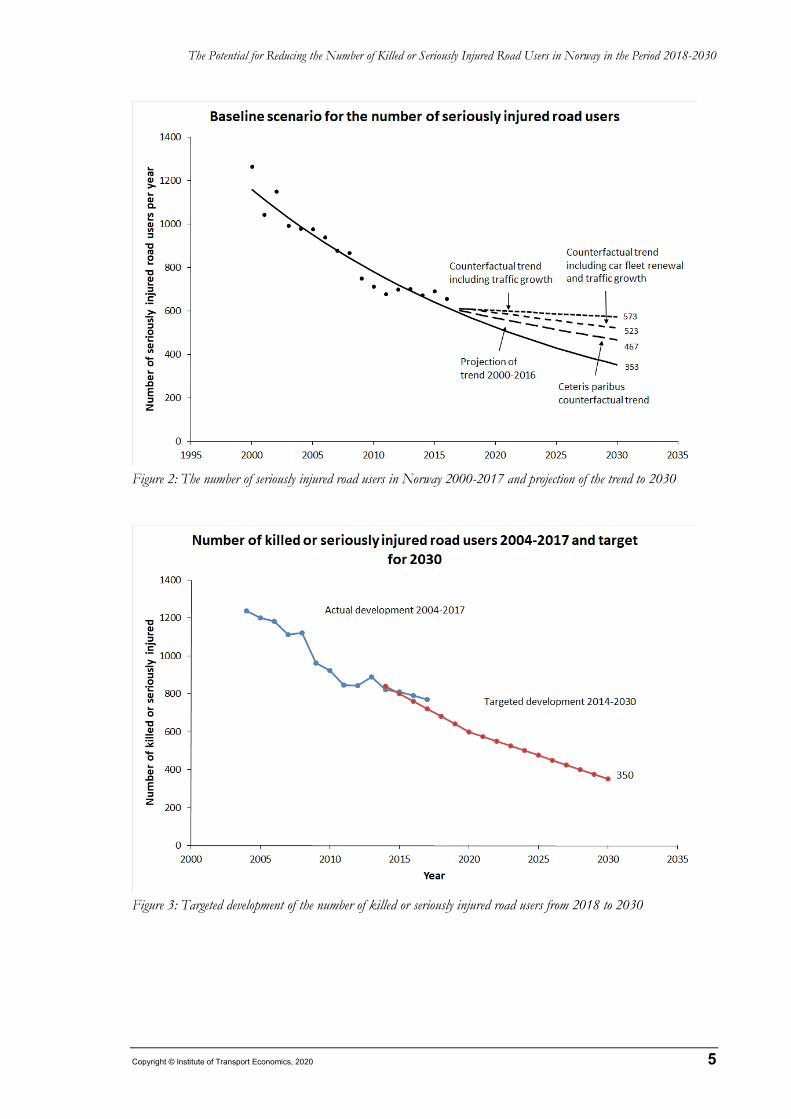
fatalities slows down from 5.85 % during 2000-2017 to 2.92 % during 2018-2030. This is referred to as the ceteris paribus counterfactual trend in Figure 1. The term “ceteris paribus” is used because everything else is assumed to remain unchanged. The ceteris paribus counterfactual trend predicts 83 fatalities in 2030. The ceteris paribus condition is not realistic and at least two trends can be predicted with some confidence for the period 2018-2030. The first is traffic growth. Based on historical traffic growth during 1990-2016, traffic (vehicle kilometres of travel) is expected to grow at an annual rate of 1.75 % during the period 2018-2030. Høye (2016B) found that a 1 % growth in traffic volume was associated with a growth of 0.811 % in the number of fatalities, 0.841 % in the number of seriously injured road users, and 0.962 % in the number of slightly injured road users. When the projected trend is adjusted for traffic growth and for the elasticity of the number of fatalities with respect to traffic growth, the upper adjusted counterfactual trend line in Figure 1 is produced, predicting 99 fatalities in 2030. The final adjustment accounts for expected renewal of the car fleet. New cars are safer than old cars (Høye 2017) and the car fleet will gradually be renewed in the period 2018-2030 even if government does not intervene in the market. Thus, although car fleet renewal can be regarded as a road safety measure, it seems most correct to treat it as an exogenous factor, i.e. as something that will change and run its own course independently of road safety policy. When adjusted for the effect on fatalities of car fleet renewal, the final predicted number for 2030 is 89 fatalities. The baseline number in 2018 is 120 fatalities. It is assumed that the number of fatalities will decline from 120 in 2018 to 89 in 2030 according to an exponential trend (same percentage change each year). This represents the baseline scenario for the number of fatalities. The baseline scenario for the number of seriously injured road users was developed in exactly the same way as the baseline scenario for the number of killed road users. A detailed explanation of each step will therefore not be given. Figure 2 shows the results. The predicted number of seriously injured road users in 2030 is 523.
2.2 Political objectives for reducing the number of killed or seriously injured road users
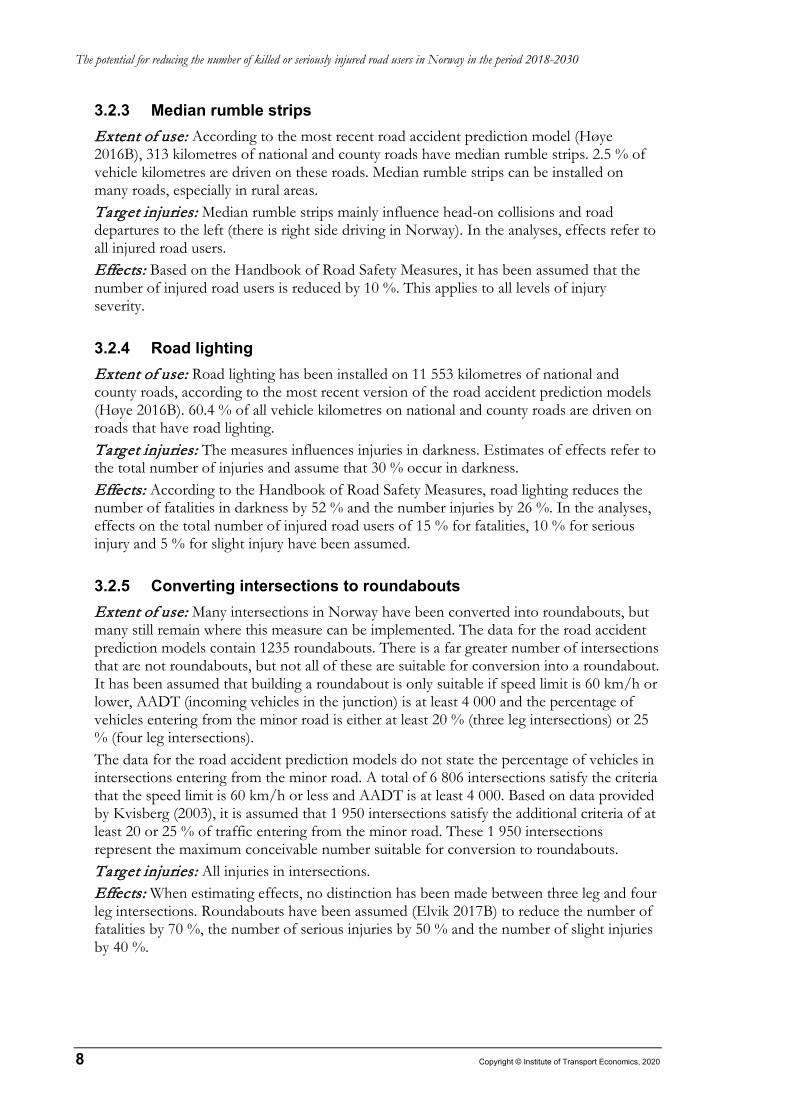
In the National Transport Plan for the years 2018-2029, the government has proposed quantified targets for the maximum number of killed or seriously injured road users for the years 2024 and 2030. A target of 500 has been set for 2024 and a target of 350 for 2030. Figure 3 shows a curve indicating annual changes that are consistent with steady progress towards realising the targets. If the trends during 2000-2017 continue, the predicted number of fatalities in 2030 is 55 and the predicted number of seriously injured road users 353. This sums to 408, which is more than the target number of 350. To realise this target, past trends therefore need to be reinforced. The question is whether enough effective road safety measures can be implemented to ensure this.
The Potential for Reducing the Number of Killed or Seriously Injured Road Users in Norway in the Period 2018-2030
Copyright © Institute of Transport Economics, 2020 5
Figure 2: The number of seriously injured road users in Norway 2000-2017 and projection of the trend to 2030
Figure 3: Targeted development of the number of killed or seriously injured road users from 2018 to 2030

The potential for reducing the number of killed or seriously injured road users in Norway in the period 2018-2030
6 Copyright © Institute of Transport Economics, 2020
3 An outline of road safety measures
3.1 Potentially effective road safety measures
A potentially effective road safety measure has a documented effect on the number of road accidents, injured road users or injury severity, or on risk factors that are known to be related to road accidents or injuries. Thus, speed limits is an effective measure. Intelligent Speed Adaptation (ISA) on cars is a potentially effective road safety measure, since it is known to influence speed, which in turn is related to the number and severity of road accidents. Road safety measures are candidates for inclusion in a formal analysis of their potential for improving road safety if they are potentially effective and have still not been fully implemented in Norway. Many road safety measures have been fully implemented in Norway (Elvik, Assum and Olsen 2017). Thus, e.g. laws mandating seat belt wearing were passed many years ago. While seat belt wearing still falls a little short of 100 % (it has passed 97 %), the relevant measure to further increase it is enforcement. In general, enforcement is a measure that can almost always be stepped up, and for which it is difficult to say when it has been fully implemented. There are many road safety measures. Good data about how well they have been implemented do not always exist. Is, for example, guardrails fully implemented in Norway? We think it is as far as guardrails along the edge of the road is concerned. The use of guardrails is regulated by detailed warrants. If a warrant is satisfied, a guardrail is presumably always installed. Median guard rails, on the other hand, separating opposite traffic directions, have still not been fully implemented. Some road safety measures can be stepped up, but their effects are not sufficiently known to include them in a formal analysis. This does not necessarily mean that these road safety measures are ineffective; rather, they are what we can label “analytically intractable”, i.e. it is impossible to quantify their potential contribution to improving road safety. In this chapter, road safety measures that are potentially effective and have not been fully implemented in Norway are listed. The maximum conceivable use of the measures is also defined.
3.2 Road-related measures
The following measures taken on roads are regarded as effective and not fully implemented:
1. Building motorways 2. Installing median guard rail barriers (2+1 roads) 3. Median rumble strips 4. Road lighting 5. Converting intersections to roundabouts 6. Upgrading pedestrian crossings 7. Lowering the speed limit from 80 to 70 km/h on high-risk roads 8. Improving winter maintenance of walking areas

The Potential for Reducing the Number of Killed or Seriously Injured Road Users in Norway in the Period 2018-2030
Copyright © Institute of Transport Economics, 2020 7
A short description of each of these measures follows:
3.2.1 Motorways Extent of use: The length of motorways in Norway is about 400 kilometres (Opplysningsrådet for veitrafikken 2016). It has been decided to build a further 194 kilometres by 2022. Extending the motorway network by a further 350 kilometres after 2022 is viewed as desirable (Statens vegvesen et al. 2018). Estimates of the potential contribution of motorways to reducing the number of killed or injured road users have been made, based on detailed data for the roads that will be built before 2022. For these roads, data are available on traffic volume and road accident history. Target injuries: Motorways influence all injuries on the roads affected by their construction. Effect: A before-and-after evaluation of a motorway in the county of Østfold, using the empirical Bayes method (Elvik et al. 2017) found that the number of killed or seriously injured road users was reduced by 75 %. The motorway was a four-lane divided freeway with a median barrier. In the analyses presented in this report, detailed data for the sections that will be built before 2022 have been used. For each of these roads, the most recently developed road accident prediction model (Høye 2016B) has been applied to develop an empirical Bayes estimate of the current expected number of injured road users, by severity, on these roads. The assumption has then been made that the roads have identical characteristics to current motorways, and the expected number of injured road users re-estimated under that assumption. By comparing the estimates, it is found that the number of killed or seriously injured road users is expected to be reduced by 65 %. This reduction is a little less than the 75 % found in the before-and-after evaluation. This reflects differing levels of risk during the before-period.
3.2.2 Median guard rail barriers Extent of use: The road safety action plan (Statens vegvesen et al. 2018) states that median guard rail barriers have been installed on 305 kilometres of road and that the remaining need is 1245 kilometres of road. The analyses in this report are based on detailed data for sections of 50 kilometres where median guard rail barriers will be installed in the near future. Target injuries: Median guard rail barriers primarily influence head-on collisions and road departures to the left (there is right side driving in Norway). In the analyses, effects have been stated as percentage changes of the total number of injured road users. Effects: The chapter dealing with 2+1 roads in the Handbook of Road Safety Measures, updated in 2011, states that the number of road road accident fatalities is reduced by 76-77 % and the number of seriously injured road users reduced by 51-63 %, depending on speed limit. The most recent version of the road accident prediction models (Høye 2016B) shows a 40 % reduction of slight injuries, a 67 % reduction of serious injuries and a 100 % reduction of fatalities. The latter reduction is probably not sustainable in the long term. In this report, effects have been estimated by applying the same method as for motorways (see above). Median guard rail barriers are expected to reduce the total number of killed or seriously injured road users by 71 %.The fact that this reduction is slightly larger than the one estimated for motorways (65 %) reflects differences in current risk on the roads.
The potential for reducing the number of killed or seriously injured road users in Norway in the period 2018-2030
8 Copyright © Institute of Transport Economics, 2020
3.2.3 Median rumble strips Extent of use: According to the most recent road accident prediction model (Høye 2016B), 313 kilometres of national and county roads have median rumble strips. 2.5 % of vehicle kilometres are driven on these roads. Median rumble strips can be installed on many roads, especially in rural areas. Target injuries: Median rumble strips mainly influence head-on collisions and road departures to the left (there is right side driving in Norway). In the analyses, effects refer to all injured road users. Effects: Based on the Handbook of Road Safety Measures, it has been assumed that the number of injured road users is reduced by 10 %. This applies to all levels of injury severity.
3.2.4 Road lighting Extent of use: Road lighting has been installed on 11 553 kilometres of national and county roads, according to the most recent version of the road accident prediction models (Høye 2016B). 60.4 % of all vehicle kilometres on national and county roads are driven on roads that have road lighting. Target injuries: The measures influences injuries in darkness. Estimates of effects refer to the total number of injuries and assume that 30 % occur in darkness. Effects: According to the Handbook of Road Safety Measures, road lighting reduces the number of fatalities in darkness by 52 % and the number injuries by 26 %. In the analyses, effects on the total number of injured road users of 15 % for fatalities, 10 % for serious injury and 5 % for slight injury have been assumed.
3.2.5 Converting intersections to roundabouts Extent of use: Many intersections in Norway have been converted into roundabouts, but many still remain where this measure can be implemented. The data for the road accident prediction models contain 1235 roundabouts. There is a far greater number of intersections that are not roundabouts, but not all of these are suitable for conversion into a roundabout. It has been assumed that building a roundabout is only suitable if speed limit is 60 km/h or lower, AADT (incoming vehicles in the junction) is at least 4 000 and the percentage of vehicles entering from the minor road is either at least 20 % (three leg intersections) or 25 % (four leg intersections). The data for the road accident prediction models do not state the percentage of vehicles in intersections entering from the minor road. A total of 6 806 intersections satisfy the criteria that the speed limit is 60 km/h or less and AADT is at least 4 000. Based on data provided by Kvisberg (2003), it is assumed that 1 950 intersections satisfy the additional criteria of at least 20 or 25 % of traffic entering from the minor road. These 1 950 intersections represent the maximum conceivable number suitable for conversion to roundabouts. Target injuries: All injuries in intersections. Effects: When estimating effects, no distinction has been made between three leg and four leg intersections. Roundabouts have been assumed (Elvik 2017B) to reduce the number of fatalities by 70 %, the number of serious injuries by 50 % and the number of slight injuries by 40 %.
The Potential for Reducing the Number of Killed or Seriously Injured Road Users in Norway in the Period 2018-2030
Copyright © Institute of Transport Economics, 2020 9
3.2.6 Upgrading pedestrian crossings Extent of use: An analysis of 239 pedestrian crossings in Oslo and surrounding suburbs (Elvik 2016B) has been used as basis for identifying pedestrian crossings that might benefit from upgrading. There are many ways of upgrading a pedestrian crossing, but it has been assumed that it will be rebuilt as a raised pedestrian crossing. The 239 pedestrian crossings were divided into 13 groups based on the empirical Bayes estimate of their expected number of injuries. Trend factors developed in the road accident prediction models (Høye 2016B) were applied to estimate the current expected number of injuries. It was assumed that a total of 1 000 pedestrian crossings would be suitable for upgrading and that 17 % of all pedestrian road accidents in pedestrian crossings occur in these crossings. Target injuries: Injuries to pedestrians crossing the road in formal pedestrian crossings. Effects: The principal mechanism producing the effect is a speed reduction. A reduction of 5 km/h has been assumed. This translates (Elvik 2013) into expected reductions of 28 % for fatalities, 26 % for serious injuries and 13 % for slight injuries.
3.2.7 Lowering speed limits Extent of use: The most common speed limit in Norway is 80 km/h. In a project studying speed limit policy (Elvik 2017A), high-risk roads with a speed limit of 80 km/h were identified. These roads have a total length of 10399 kilometres, or 29.7 % of the total length of roads with a speed limit of 80 km/h. The roads carry 24.6 % of vehicle kilometres of travel on roads with a speed limit of 80 km/h. Target injuries: The high-risk roads had 51.6 % of all fatalities on 80 km/h roads, 58.1 % of all seriously injured road users and 40.6 % of all slightly injured road users. Mean road accident rate was 0.174 injury road accidents per million vehicle kilometres, versus 0.099 injury road accidents per million vehicle kilometres for all 80 km/h roads. It was assumed that speed limit would be reduced from 80 to 70 km/h. Effects: It was assumed that speed enforcement would be intensified to ensure compliance with the lowered speed limits. The mean speed of traffic was assumed to be reduced from 76.1 to 69.1 km/h. This results (Elvik 2013) in a 37 % reduction of fatalities, a 35 % reduction of serious injuries and an 18 % reduction of slight injuries. By comparison, lowering of speed limits from 80 to 70 km/h in 2001 reduced fatalities by 29 %, serious injuries by 28 % and slight injuries by 11 % (Ragnøy 2004).
3.2.8 Improving winter maintenance of pedestrian areas As part of a research project, the emergency medical clinic of Oslo university hospital recorded pedestrian injuries during 2016 (Melhuus et al. 2017). A total of 6 309 injured pedestrians were recorded. The huge majority of the injuries occurred in falls where no other road user was involved. Many of the falls took place in winter. There is therefore a potential for reducing pedestrian injury by improving winter maintenance of pedestrian areas. However, as none of these injuries are recorded in official road accident statistics, the results of analysis will be presented separately.
The potential for reducing the number of killed or seriously injured road users in Norway in the period 2018-2030
10 Copyright © Institute of Transport Economics, 2020
3.3 Vehicle-related measures
The following road safety measures related to vehicles have been included: 1. Electronic stability control 2. Frontal impact air bags 3. Side impact air bags 4. Vehicle crashworthiness (as scored by Euro NCAP) 5. Pedestrian impact protection 6. Seat belt reminder 7. Autonomous cruise control including collision warning and emergency braking 8. Emergency brake assistant 9. Lane departure warning 10. Speed limit information and alert 11. E-call: automated road accident notification 12. Electronic driving licence 13. Faster renewal of the car fleet 14. Total renewal of the car fleet 15. Mandatory intelligent speed adaptation (ISA) 16. Alcohol ignition interlock 17. Seat belt ignition interlock
For all these measures, the potential reduction of the number of killed or seriously injured road users if all vehicles and all kilometres driven have these systems has been estimated and compared to the reduction expected to occur as the various safety systems increase their market penetration as a result of normal car fleet renewal. In other words, the estimated impacts on safety show the difference between 100 % market penetration and the market penetration expected to be reached by 2024 or 2030 if no action is taken to speed up the renewal of the car fleet. Measures 1-10 already exist and some of these measures have reached a high level of market penetration. The growth in market penetration in the period 2018-2030 has been estimated. Some systems will reach close to 100 % market penetration by 2030; for other systems there will still be a potential gain in safety by shortening the time taken to reach 100 % market penetration. Systems 11 and 12 are new, but it has been assumed that they will be introduced to the market in 2020 and then gradually increase their rate of market penetration until 2030. Measures 13-17 are either new safety features that currently have 0 % market penetration, or, for measures 13 and 14, policy interventions that do not introduce new safety systems, but speed up the renewal of the car fleet. It is not realistic that ISA, alcolocks or seat belt locks can be implemented for 100 % of vehicles by 2030. The estimates referring to these systems rather show how safety can be improved by eliminating speeding, drinking and driving and non-use of seat belts.
3.3.1 Target injuries The target group for most of the measures are occupants of passenger cars. Car occupants represent 56 % of all road road accident fatalities, 49 % of those who are seriously injured and 69 % of those who are slightly injured. Other target groups include: Pedestrians will benefit from better protection. Pedestrians involved in collisions with passenger cars represent 3.8 % of all fatalities, 9.7 % of seriously injured road users and 6.1 % of slightly injured road users.
The Potential for Reducing the Number of Killed or Seriously Injured Road Users in Norway in the Period 2018-2030
Copyright © Institute of Transport Economics, 2020 11
Seat belt reminders are assumed to benefit drivers and front seat occupants in passenger cars ( 52 % of all fatalities, 44 % of all seriously injured and 62 % of all slightly injured). Intelligent speed adaptation is assumed to influence all road accidents and all road users.
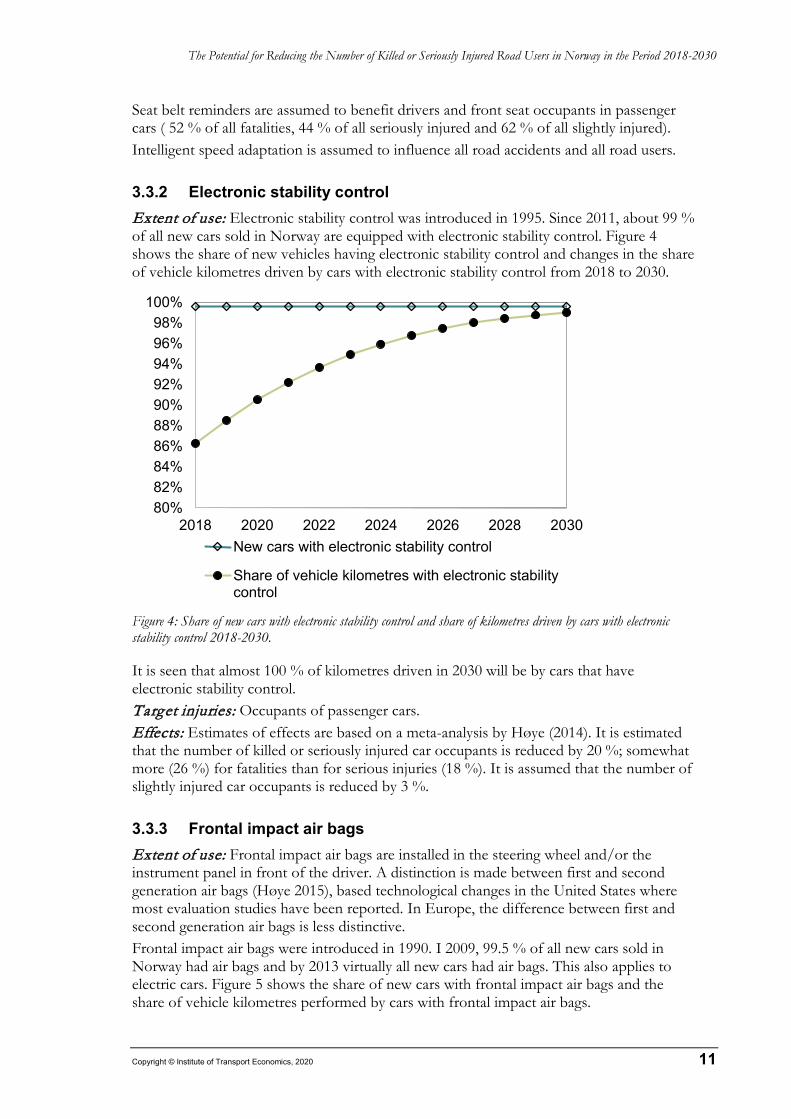
3.3.2 Electronic stability control Extent of use: Electronic stability control was introduced in 1995. Since 2011, about 99 % of all new cars sold in Norway are equipped with electronic stability control. Figure 4 shows the share of new vehicles having electronic stability control and changes in the share of vehicle kilometres driven by cars with electronic stability control from 2018 to 2030.
Figure 4: Share of new cars with electronic stability control and share of kilometres driven by cars with electronic stability control 2018-2030.
It is seen that almost 100 % of kilometres driven in 2030 will be by cars that have electronic stability control. Target injuries: Occupants of passenger cars. Effects: Estimates of effects are based on a meta-analysis by Høye (2014). It is estimated that the number of killed or seriously injured car occupants is reduced by 20 %; somewhat more (26 %) for fatalities than for serious injuries (18 %). It is assumed that the number of slightly injured car occupants is reduced by 3 %.
3.3.3 Frontal impact air bags Extent of use: Frontal impact air bags are installed in the steering wheel and/or the instrument panel in front of the driver. A distinction is made between first and second generation air bags (Høye 2015), based technological changes in the United States where most evaluation studies have been reported. In Europe, the difference between first and second generation air bags is less distinctive. Frontal impact air bags were introduced in 1990. I 2009, 99.5 % of all new cars sold in Norway had air bags and by 2013 virtually all new cars had air bags. This also applies to electric cars. Figure 5 shows the share of new cars with frontal impact air bags and the share of vehicle kilometres performed by cars with frontal impact air bags.
80%82%84%86%88%90%92%94%96%98%
100%
2018 2020 2022 2024 2026 2028 2030New cars with electronic stability control
Share of vehicle kilometres with electronic stabilitycontrol

The potential for reducing the number of killed or seriously injured road users in Norway in the period 2018-2030
12 Copyright © Institute of Transport Economics, 2020
Target injuries: Injuries to front seat occupants of passenger cars. Effects depend on whether the car has first or second generation air bags and on whether occupants wear seat belts or not.
Figure 5: Share of new cars with frontal impact air bags and share of kilometres driven by cars with frontal impact air bags 2018-2030.
Effects: Effects of frontal impact air bags are quite complicated. To account for this, effects have been estimated year-by-year for the period covered by the analysis (2018-2030) in the following steps:
1. According to Høye (2015) and Elvik and Høye (2015) the effects of first and second generation air bags on killed or seriously injured road users have been estimated, respectively to be -12 % and -18 % if seat belts are worn and +1 % and -5 % if seat belts are not worn. This is based on the following assumptions: (a) Effects on fatalities have been summarised by means of meta-analysis of several studies (Høye 2015); (b) Effects on serious injuries are assumed to be 2/3 of effects on fatalities; (c) The shares of car occupants who are killed or seriously injured is based on Norwegian statistics for 2009-2013; (d) There is no effect on slight injuries.
2. The share of vehicle kilometres performed by cars with first or second generation air bags are as indicated in Figure 5.
3. Seat belt wearing has been estimated by relying on roadside surveys performed by the National Public Roads Administration, see Høye (2015).
3.3.4 Side impact air bags Extent of use: Side impact air bags are installed in the doors or seat backs. Most cars also have head impact air bags mounted in the roof. Side impact air bags were introduced in 1995. From 2013, 100 % of new cars have side air bags. Figure 6 shows the share of new cars having side impact air bags and the share of vehicle kilometres performed by cars with side impact air bags from 2018 to 2030.
80%
85%
90%
95%
100%
2018 2020 2022 2024 2026 2028 2030
New cars with frontal impact air bags
New cars with second generation frontal impact air bags
Share of vehicle kilometres with frontal air bags
The Potential for Reducing the Number of Killed or Seriously Injured Road Users in Norway in the Period 2018-2030
Copyright © Institute of Transport Economics, 2020 13
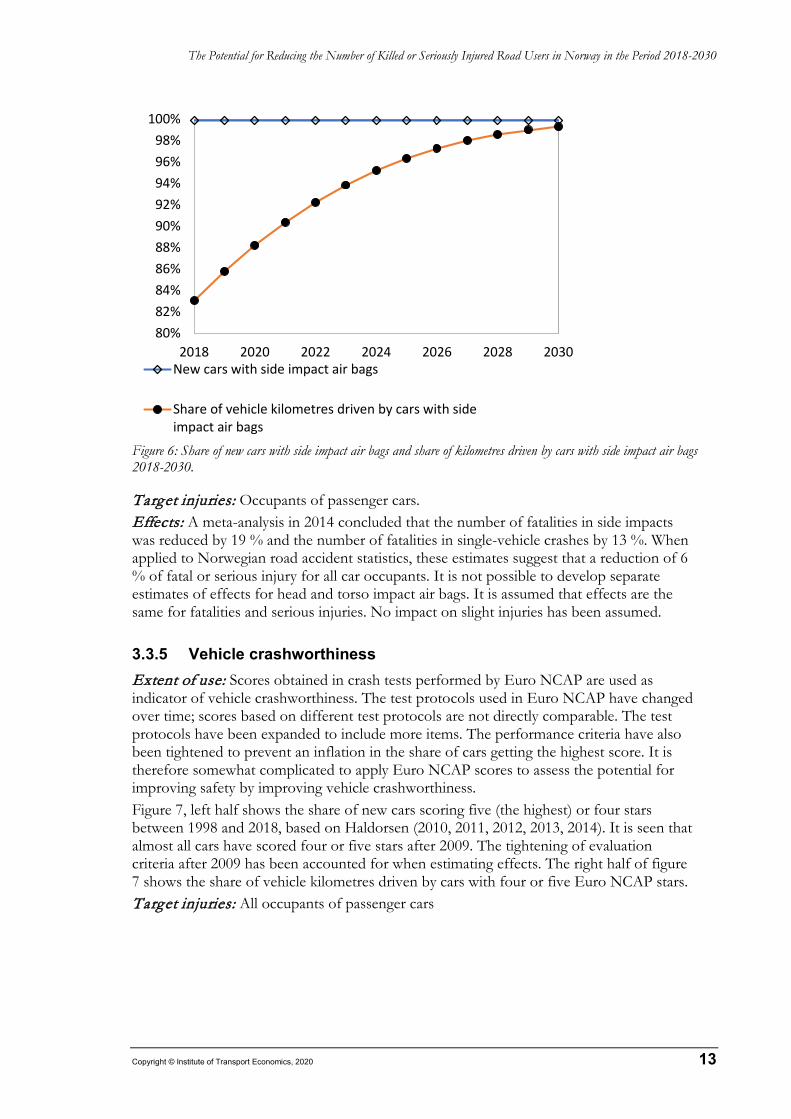
Figure 6: Share of new cars with side impact air bags and share of kilometres driven by cars with side impact air bags 2018-2030.
Target injuries: Occupants of passenger cars. Effects: A meta-analysis in 2014 concluded that the number of fatalities in side impacts was reduced by 19 % and the number of fatalities in single-vehicle crashes by 13 %. When applied to Norwegian road accident statistics, these estimates suggest that a reduction of 6 % of fatal or serious injury for all car occupants. It is not possible to develop separate estimates of effects for head and torso impact air bags. It is assumed that effects are the same for fatalities and serious injuries. No impact on slight injuries has been assumed.
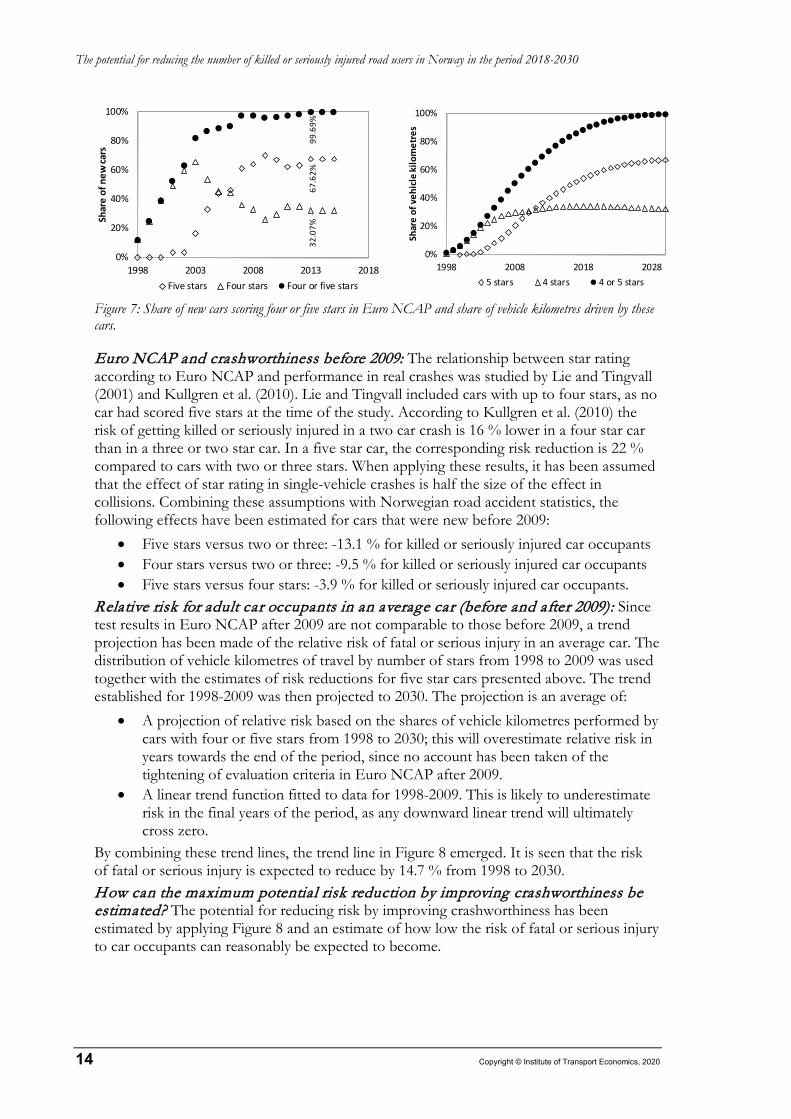
3.3.5 Vehicle crashworthiness Extent of use: Scores obtained in crash tests performed by Euro NCAP are used as indicator of vehicle crashworthiness. The test protocols used in Euro NCAP have changed over time; scores based on different test protocols are not directly comparable. The test protocols have been expanded to include more items. The performance criteria have also been tightened to prevent an inflation in the share of cars getting the highest score. It is therefore somewhat complicated to apply Euro NCAP scores to assess the potential for improving safety by improving vehicle crashworthiness. Figure 7, left half shows the share of new cars scoring five (the highest) or four stars between 1998 and 2018, based on Haldorsen (2010, 2011, 2012, 2013, 2014). It is seen that almost all cars have scored four or five stars after 2009. The tightening of evaluation criteria after 2009 has been accounted for when estimating effects. The right half of figure 7 shows the share of vehicle kilometres driven by cars with four or five Euro NCAP stars. Target injuries: All occupants of passenger cars
80%82%84%86%88%90%92%94%96%98%
100%
2018 2020 2022 2024 2026 2028 2030New cars with side impact air bags
Share of vehicle kilometres driven by cars with sideimpact air bags
The potential for reducing the number of killed or seriously injured road users in Norway in the period 2018-2030
14 Copyright © Institute of Transport Economics, 2020
Figure 7: Share of new cars scoring four or five stars in Euro NCAP and share of vehicle kilometres driven by these cars.
Euro NCAP and crashworthiness before 2009: The relationship between star rating according to Euro NCAP and performance in real crashes was studied by Lie and Tingvall (2001) and Kullgren et al. (2010). Lie and Tingvall included cars with up to four stars, as no car had scored five stars at the time of the study. According to Kullgren et al. (2010) the risk of getting killed or seriously injured in a two car crash is 16 % lower in a four star car than in a three or two star car. In a five star car, the corresponding risk reduction is 22 % compared to cars with two or three stars. When applying these results, it has been assumed that the effect of star rating in single-vehicle crashes is half the size of the effect in collisions. Combining these assumptions with Norwegian road accident statistics, the following effects have been estimated for cars that were new before 2009:
• Five stars versus two or three: -13.1 % for killed or seriously injured car occupants • Four stars versus two or three: -9.5 % for killed or seriously injured car occupants • Five stars versus four stars: -3.9 % for killed or seriously injured car occupants.
Relative risk for adult car occupants in an average car (before and after 2009): Since test results in Euro NCAP after 2009 are not comparable to those before 2009, a trend projection has been made of the relative risk of fatal or serious injury in an average car. The distribution of vehicle kilometres of travel by number of stars from 1998 to 2009 was used together with the estimates of risk reductions for five star cars presented above. The trend established for 1998-2009 was then projected to 2030. The projection is an average of:
• A projection of relative risk based on the shares of vehicle kilometres performed by cars with four or five stars from 1998 to 2030; this will overestimate relative risk in years towards the end of the period, since no account has been taken of the tightening of evaluation criteria in Euro NCAP after 2009.
• A linear trend function fitted to data for 1998-2009. This is likely to underestimate risk in the final years of the period, as any downward linear trend will ultimately cross zero.
By combining these trend lines, the trend line in Figure 8 emerged. It is seen that the risk of fatal or serious injury is expected to reduce by 14.7 % from 1998 to 2030. How can the maximum potential risk reduction by improving crashworthiness be estimated? The potential for reducing risk by improving crashworthiness has been estimated by applying Figure 8 and an estimate of how low the risk of fatal or serious injury to car occupants can reasonably be expected to become.
67.6
2%32
.07%
99.6
9%
0%
20%
40%
60%
80%
100%
1998 2003 2008 2013 2018
Shar
e of
new
cars
Five stars Four stars Four or five stars
0%
20%
40%
60%
80%
100%
1998 2008 2018 2028
Shar
e of
veh
icle
kilo
met
res
5 stars 4 stars 4 or 5 stars
The Potential for Reducing the Number of Killed or Seriously Injured Road Users in Norway in the Period 2018-2030
Copyright © Institute of Transport Economics, 2020 15
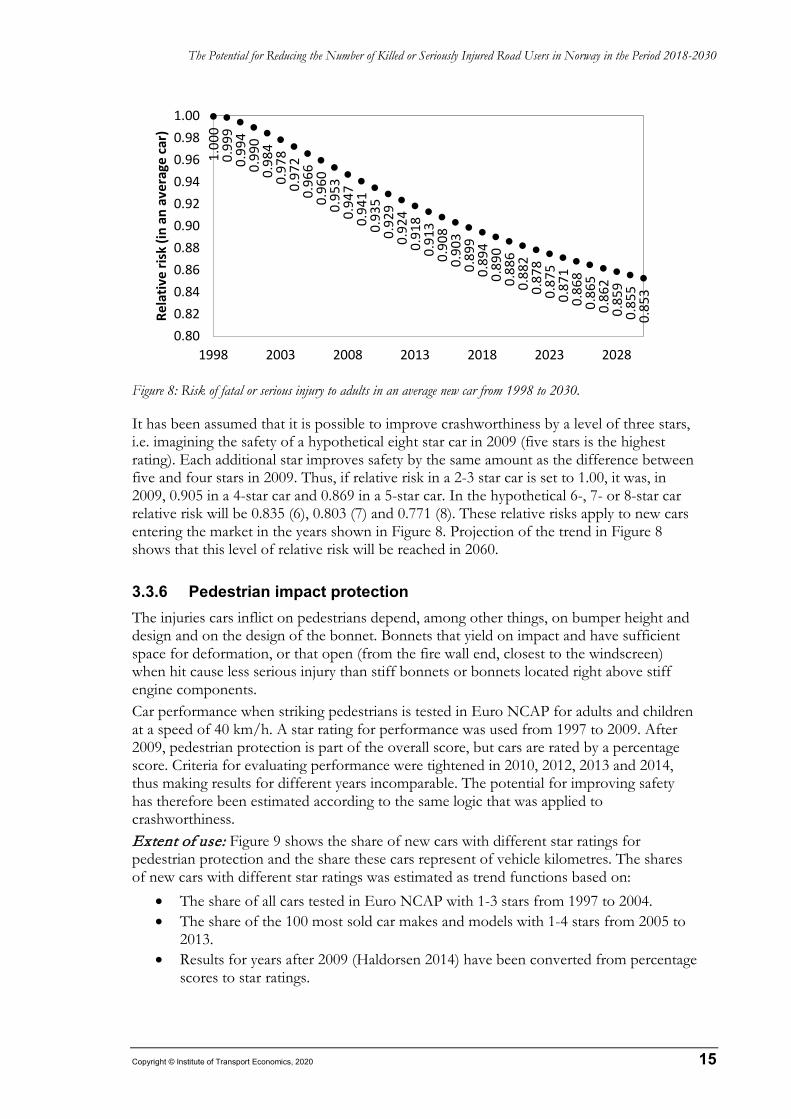
Figure 8: Risk of fatal or serious injury to adults in an average new car from 1998 to 2030.
It has been assumed that it is possible to improve crashworthiness by a level of three stars, i.e. imagining the safety of a hypothetical eight star car in 2009 (five stars is the highest rating). Each additional star improves safety by the same amount as the difference between five and four stars in 2009. Thus, if relative risk in a 2-3 star car is set to 1.00, it was, in 2009, 0.905 in a 4-star car and 0.869 in a 5-star car. In the hypothetical 6-, 7- or 8-star car relative risk will be 0.835 (6), 0.803 (7) and 0.771 (8). These relative risks apply to new cars entering the market in the years shown in Figure 8. Projection of the trend in Figure 8 shows that this level of relative risk will be reached in 2060.
3.3.6 Pedestrian impact protection The injuries cars inflict on pedestrians depend, among other things, on bumper height and design and on the design of the bonnet. Bonnets that yield on impact and have sufficient space for deformation, or that open (from the fire wall end, closest to the windscreen) when hit cause less serious injury than stiff bonnets or bonnets located right above stiff engine components. Car performance when striking pedestrians is tested in Euro NCAP for adults and children at a speed of 40 km/h. A star rating for performance was used from 1997 to 2009. After 2009, pedestrian protection is part of the overall score, but cars are rated by a percentage score. Criteria for evaluating performance were tightened in 2010, 2012, 2013 and 2014, thus making results for different years incomparable. The potential for improving safety has therefore been estimated according to the same logic that was applied to crashworthiness. Extent of use: Figure 9 shows the share of new cars with different star ratings for pedestrian protection and the share these cars represent of vehicle kilometres. The shares of new cars with different star ratings was estimated as trend functions based on:
• The share of all cars tested in Euro NCAP with 1-3 stars from 1997 to 2004. • The share of the 100 most sold car makes and models with 1-4 stars from 2005 to
2013. • Results for years after 2009 (Haldorsen 2014) have been converted from percentage
scores to star ratings.
1.00
00.
999
0.99
40.
990
0.98
40.
978
0.97
20.
966
0.96
00.
953
0.94
70.
941
0.93
50.
929
0.92
40.
918
0.91
30.
908
0.90
30.
899
0.89
40.
890
0.88
60.
882
0.87
80.
875
0.87
10.
868
0.86
50.
862
0.85
90.
855
0.85
3
0.800.820.840.860.880.900.920.940.960.981.00
1998 2003 2008 2013 2018 2023 2028
Rela
tive
risk
(in a
n av
erag
e ca
r)

The potential for reducing the number of killed or seriously injured road users in Norway in the period 2018-2030
16 Copyright © Institute of Transport Economics, 2020
Figure 9: Estimated shares of new cars (left) and vehicle kilometres (right) by star rating for pedestrian protection (four stars is the highest score),
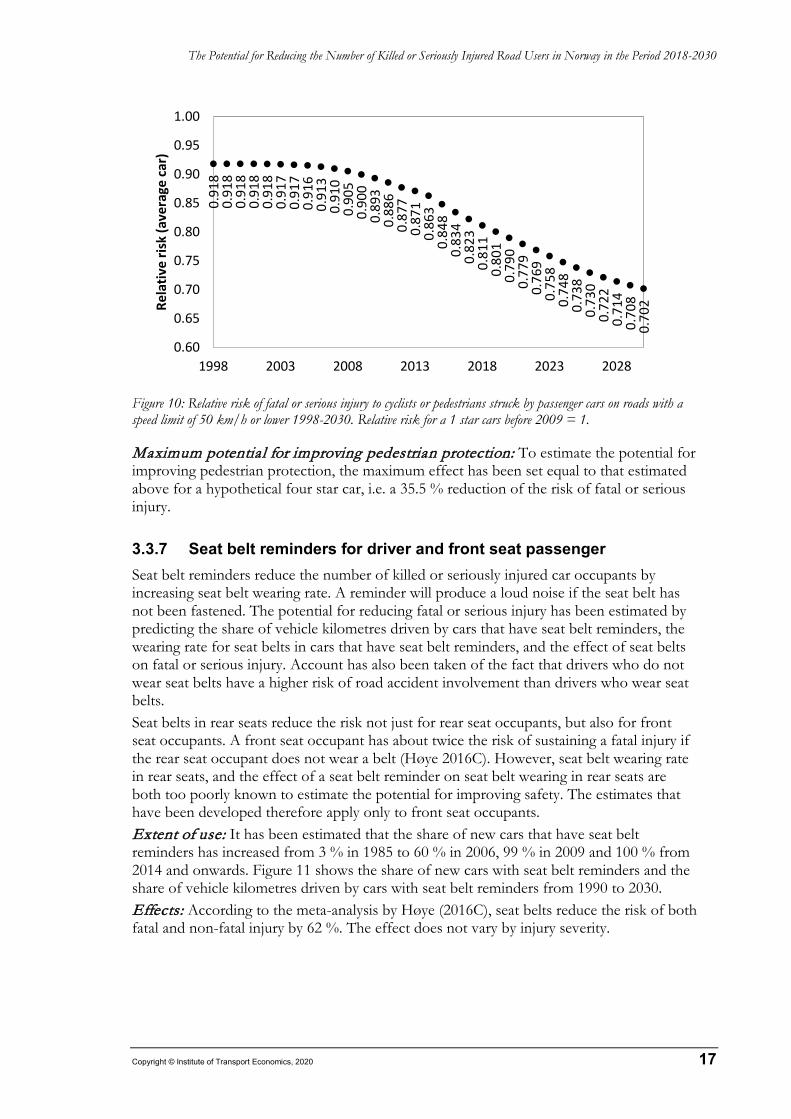
Target injuries: Injuries that will be influenced are injuries to pedestrians struck by passenger cars on roads with a speed limit of 50 km/h or lower. Effects: According to Strandroth et al. (2011), a pedestrian struck by a two star car will have a 17 % lower risk of AIS2+ injuries and a 28 % lower risk of AIS3+ injuries than a pedestrian struck by a one star car (AIS = Abbreviated Injury Scale, ranging from 0 (no injury) to 6 (fatal injury)). The risk of permanent impairment is also lower for a two star car than for a one star car. The results apply to roads with a speed limit of 50 km/h or lower. For higher speed limits, no effect was found. It will be assumed that effects for cyclists are half the value of those for pedestrians (i.e. 8.5 % and 14 % rather than 17 % and 28 %). Cyclists account for 40 % of all pedestrians or cyclists who are fatally or seriously injured when struck by passenger cars on roads with a speed limit of 50 km/h or lower. The overall effect of two stars compared to one can then be estimated to a reduction of fatal and serious injury by 13.6 % in crashes involving cyclists or pedestrians and passenger cars on roads with a speed limit of 50 km/h or lower. No results have been found for cars with three or four stars. It has been assumed that each additional star reduces the risk of fatal or serious injury on roads with a speed limit of 50 km/h or lower by the same amount (13.6 %) as two stars versus one. That means that the risk of fatal or serious injury is 25.4 % lower if the car has three stars rather than one and 35.5 % lower for four stars rather than one. Cyclists or pedestrians who were fatally or seriously injured by passenger cars on roads with a speed limit of 50 km/h or lower constitute 36 % of all killed or seriously injured cyclists and pedestrians during 2012-2018. The effects on all cyclists and pedestrians then becomes -4.8 % for two stars, -9.0 % for three stars and -12.7 % for four stars, all compared to one star. These estimates have been applied to estimate the potential for improving safety by improving pedestrian impact protection. Relative risk to cyclists and pedestrians in crashes with an average car: Pedestrian protection comes in degrees, both because it has four levels (from one to four stars) and because the mix of cars with different star ratings in traffic will change over time. This will lead to changes in the risk of sustaining fatal or serious injury. By combining the shares of vehicle kilometres driven by cars with different star ratings (Figure 9, right half) and the relative risk of fatal or serious injury associated with different number of stars, the expected changes in the risk of fatal or serious injury to cyclists and pedestrians from 1998 to 2030 can be estimated. Figure 10 shows the results.
0%10%20%30%40%50%60%70%80%90%
100%
1998 2008 2018 2028
Shar
e of
new
cars
Trend* Trend** Trend*** Trend****
0%10%20%30%40%50%60%70%80%90%
100%
1998 2008 2018 2028
Shar
e of
veh
icle
kilo
met
res
* ** *** ****
The Potential for Reducing the Number of Killed or Seriously Injured Road Users in Norway in the Period 2018-2030
Copyright © Institute of Transport Economics, 2020 17
Figure 10: Relative risk of fatal or serious injury to cyclists or pedestrians struck by passenger cars on roads with a speed limit of 50 km/h or lower 1998-2030. Relative risk for a 1 star cars before 2009 = 1.
Maximum potential for improving pedestrian protection: To estimate the potential for improving pedestrian protection, the maximum effect has been set equal to that estimated above for a hypothetical four star car, i.e. a 35.5 % reduction of the risk of fatal or serious injury.
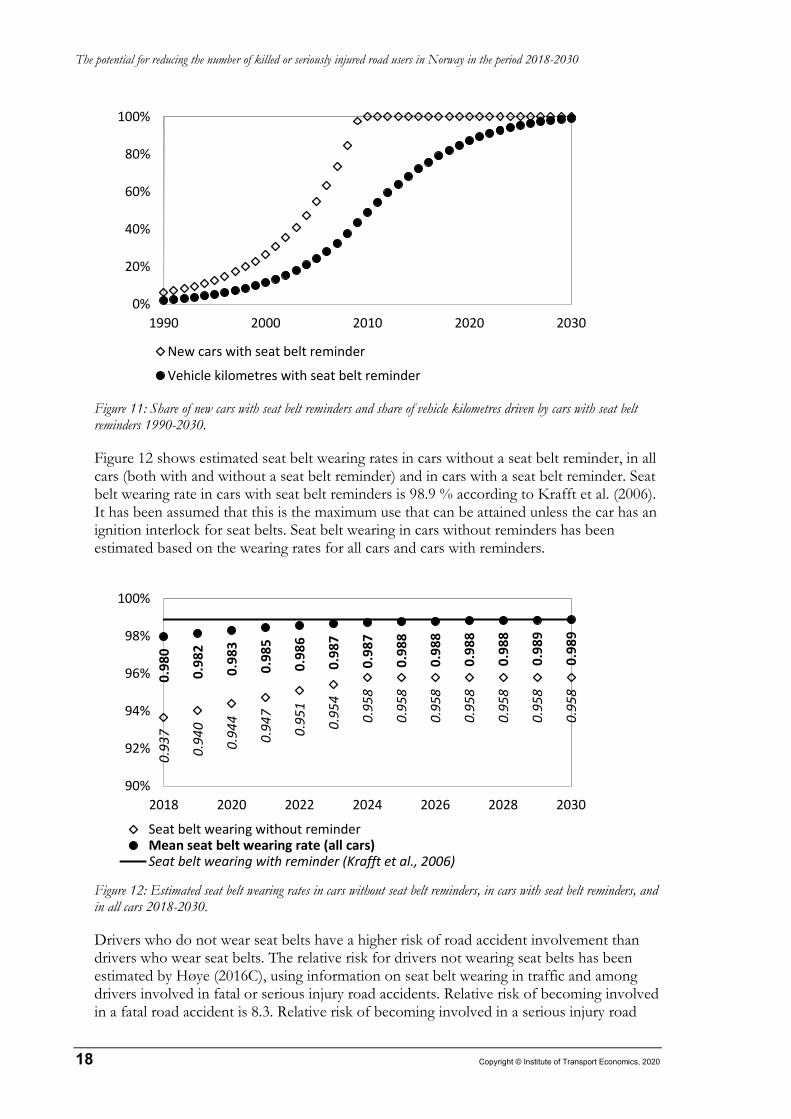
3.3.7 Seat belt reminders for driver and front seat passenger Seat belt reminders reduce the number of killed or seriously injured car occupants by increasing seat belt wearing rate. A reminder will produce a loud noise if the seat belt has not been fastened. The potential for reducing fatal or serious injury has been estimated by predicting the share of vehicle kilometres driven by cars that have seat belt reminders, the wearing rate for seat belts in cars that have seat belt reminders, and the effect of seat belts on fatal or serious injury. Account has also been taken of the fact that drivers who do not wear seat belts have a higher risk of road accident involvement than drivers who wear seat belts. Seat belts in rear seats reduce the risk not just for rear seat occupants, but also for front seat occupants. A front seat occupant has about twice the risk of sustaining a fatal injury if the rear seat occupant does not wear a belt (Høye 2016C). However, seat belt wearing rate in rear seats, and the effect of a seat belt reminder on seat belt wearing in rear seats are both too poorly known to estimate the potential for improving safety. The estimates that have been developed therefore apply only to front seat occupants. Extent of use: It has been estimated that the share of new cars that have seat belt reminders has increased from 3 % in 1985 to 60 % in 2006, 99 % in 2009 and 100 % from 2014 and onwards. Figure 11 shows the share of new cars with seat belt reminders and the share of vehicle kilometres driven by cars with seat belt reminders from 1990 to 2030. Effects: According to the meta-analysis by Høye (2016C), seat belts reduce the risk of both fatal and non-fatal injury by 62 %. The effect does not vary by injury severity.
0.91
8 0.
918
0.91
8 0.
918
0.91
8 0.
917
0.91
7 0.
916
0.91
3 0.
910
0.90
5 0.
900
0.89
3 0.
886
0.87
7 0.
871
0.86
3 0.
848
0.83
4 0.
823
0.81
1 0.
801
0.79
0 0.
779
0.76
9 0.
758
0.74
8 0.
738
0.73
0 0.
722
0.71
4 0.
708
0.70
2
0.60
0.65
0.70
0.75
0.80
0.85
0.90
0.95
1.00
1998 2003 2008 2013 2018 2023 2028
Rela
tive
risk
(ave
rage
car
)
The potential for reducing the number of killed or seriously injured road users in Norway in the period 2018-2030
18 Copyright © Institute of Transport Economics, 2020
Figure 11: Share of new cars with seat belt reminders and share of vehicle kilometres driven by cars with seat belt reminders 1990-2030.
Figure 12 shows estimated seat belt wearing rates in cars without a seat belt reminder, in all cars (both with and without a seat belt reminder) and in cars with a seat belt reminder. Seat belt wearing rate in cars with seat belt reminders is 98.9 % according to Krafft et al. (2006). It has been assumed that this is the maximum use that can be attained unless the car has an ignition interlock for seat belts. Seat belt wearing in cars without reminders has been estimated based on the wearing rates for all cars and cars with reminders.
Figure 12: Estimated seat belt wearing rates in cars without seat belt reminders, in cars with seat belt reminders, and in all cars 2018-2030.
Drivers who do not wear seat belts have a higher risk of road accident involvement than drivers who wear seat belts. The relative risk for drivers not wearing seat belts has been estimated by Høye (2016C), using information on seat belt wearing in traffic and among drivers involved in fatal or serious injury road accidents. Relative risk of becoming involved in a fatal road accident is 8.3. Relative risk of becoming involved in a serious injury road
0%
20%
40%
60%
80%
100%
1990 2000 2010 2020 2030
New cars with seat belt reminder
Vehicle kilometres with seat belt reminder
0.93
7
0.94
0
0.94
4
0.94
7
0.95
1
0.95
4
0.95
8
0.95
8
0.95
8
0.95
8
0.95
8
0.95
8
0.95
8
0.98
0
0.98
2
0.98
3
0.98
5
0.98
6
0.98
7
0.98
7
0.98
8
0.98
8
0.98
8
0.98
8
0.98
9
0.98
9
90%
92%
94%
96%
98%
100%
2018 2020 2022 2024 2026 2028 2030
Seat belt wearing without reminderMean seat belt wearing rate (all cars)Seat belt wearing with reminder (Krafft et al., 2006)

The Potential for Reducing the Number of Killed or Seriously Injured Road Users in Norway in the Period 2018-2030
Copyright © Institute of Transport Economics, 2020 19
accident is 5.2. These estimates apply to Norwegian drivers in 2015, but it has been assumed that the relative risks remain constant over time. Strictly speaking, this is probably incorrect, as the group of non-users is likely to become more and more extreme the smaller it gets and be associated with an increasing risk of road accident involvement. To estimate the potential for reducing fatal and serious injury, relative risks have been estimated by dividing drivers and front seat passengers into three groups as shown in Table 1.
Table 1: Relative risk of road accident and injury for three groups with respect to seat belt wearing.
Definition
Relative road accident risk
Relative injury risk
Voluntary wearers Those who use seat belts at any rate
1 0.6 (effect of seat belt)
Those who are influenced by reminders
Those who wear bets when reminded to do so
8.3 for fatal crashes; 5.2 for serious injury crashes
0.6 (effect of seat belt)
Non-wearers Those who never wear seat belts
8.3 for fatal crashes; 5.2 for serious injury crashes
1 (without seat belt)
For simplicity, it has been assumed that none of those not wearing seat belts have a seat belt reminder. This is not strictly correct, but has a minor impact on the results. Seat belt wearing rates, both voluntary and those attributable to seat belt reminders, are shown in Figure 13. Seat belt wearing up to 2013 is based on the roadside surveys reported by the National Public Roads Administration. For later years, seat belt wearing has been estimated by relying on the share of vehicle kilometres performed by cars with seat belt reminders, the wearing rate in cars with seat belt reminders and trend projection of the seat belt wearing rate in cars without reminders.
Figure 13: Seat belt wearing – voluntary, induced by reminders, and non-wearing 1990-2030.
80%82%84%86%88%90%92%94%96%98%
100%
1990
1992
1994
1996
1998
2000
2002
2004
2006
2008
2010
2012
2014
2016
2018
2020
2022
2024
2026
2028
2030
Shar
e of
fron
t sea
t occ
upan
ts
Voluntary use Reminder-induced use Non-use
The potential for reducing the number of killed or seriously injured road users in Norway in the period 2018-2030
20 Copyright © Institute of Transport Economics, 2020
3.3.8 Autonomous cruise control with collision warning and emergency braking
The three systems of automatic cruise control (ACC), forward collision warning (FCW) and automatic emergency braking (AEB), integrated into a single advanced driver support system can regulate speed and distance to vehicles in front, warn the driver and brake if a collision is imminent. The system relies on sensors detecting distance and speed and changes in these parameters. Various systems differ with respect to how hard emergency braking is, if the car automatically accelerates after braking, how distance to the vehicle in front is regulated and in what situations the driver gets a warning. In this study, all systems that have at least the following capabilities have been included:
• The car can regulate the distance to the car in front to maintain a minimum headway.
• The car can detect an increased risk of collision and warn the driver of the risk. • Emergency braking is activated if the distance to the car in front gets too short; the
car brakes to a full stop. • The system operates for a wide range of speeds, not just the low speeds
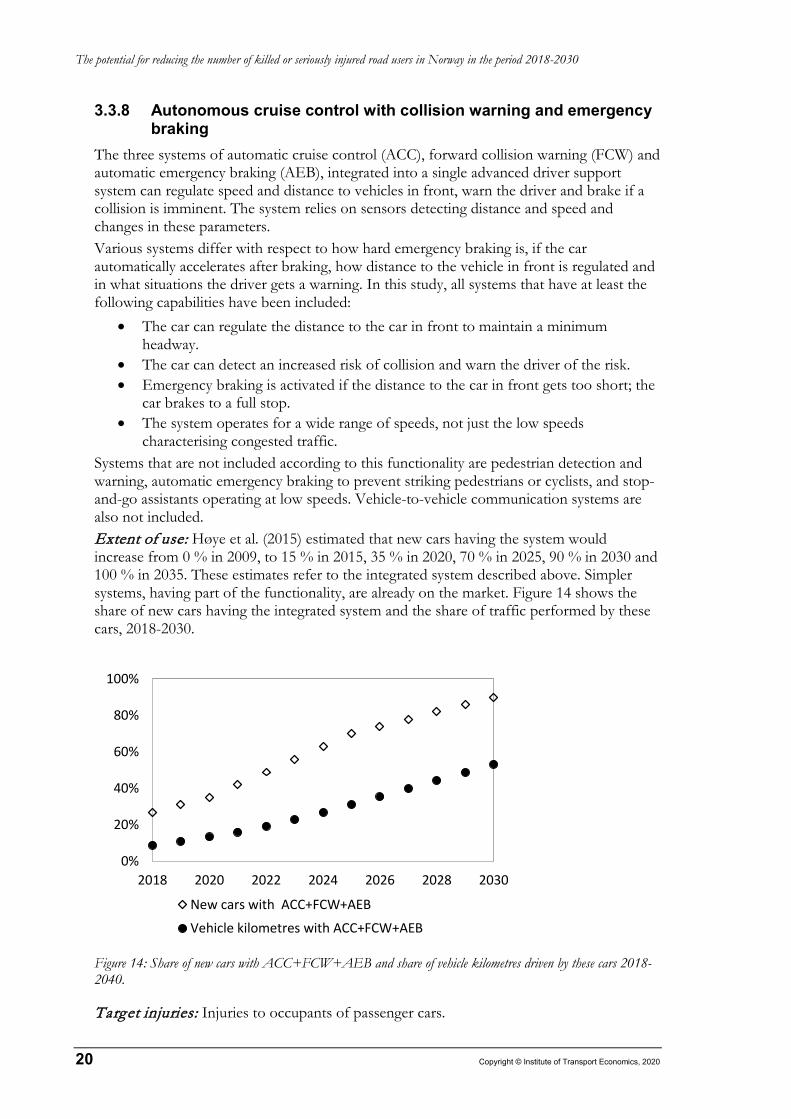
characterising congested traffic. Systems that are not included according to this functionality are pedestrian detection and warning, automatic emergency braking to prevent striking pedestrians or cyclists, and stop-and-go assistants operating at low speeds. Vehicle-to-vehicle communication systems are also not included. Extent of use: Høye et al. (2015) estimated that new cars having the system would increase from 0 % in 2009, to 15 % in 2015, 35 % in 2020, 70 % in 2025, 90 % in 2030 and 100 % in 2035. These estimates refer to the integrated system described above. Simpler systems, having part of the functionality, are already on the market. Figure 14 shows the share of new cars having the integrated system and the share of traffic performed by these cars, 2018-2030.
Figure 14: Share of new cars with ACC+FCW+AEB and share of vehicle kilometres driven by these cars 2018-2040.
Target injuries: Injuries to occupants of passenger cars.
0%
20%
40%
60%
80%
100%
2018 2020 2022 2024 2026 2028 2030
New cars with ACC+FCW+AEB
Vehicle kilometres with ACC+FCW+AEB
The Potential for Reducing the Number of Killed or Seriously Injured Road Users in Norway in the Period 2018-2030
Copyright © Institute of Transport Economics, 2020 21
Effects: Høye et al. (2015) estimated the effects of ACC+FCW+AEB on all killed or seriously injured occupants of passenger cars to a reduction of 5.3 %. This is mainly based on a study of orders for spare parts (Schittenhelm 2013) and three studies of compensation paid by insurance companies (HLDI 2001A, B, C, 2012A, B). It has been assumed that the effect does not vary by injury severity. The estimate is highly uncertain because the results of different studies are inconsistent and because different studies have made different assumptions about the types of crashes that are influenced by the system.
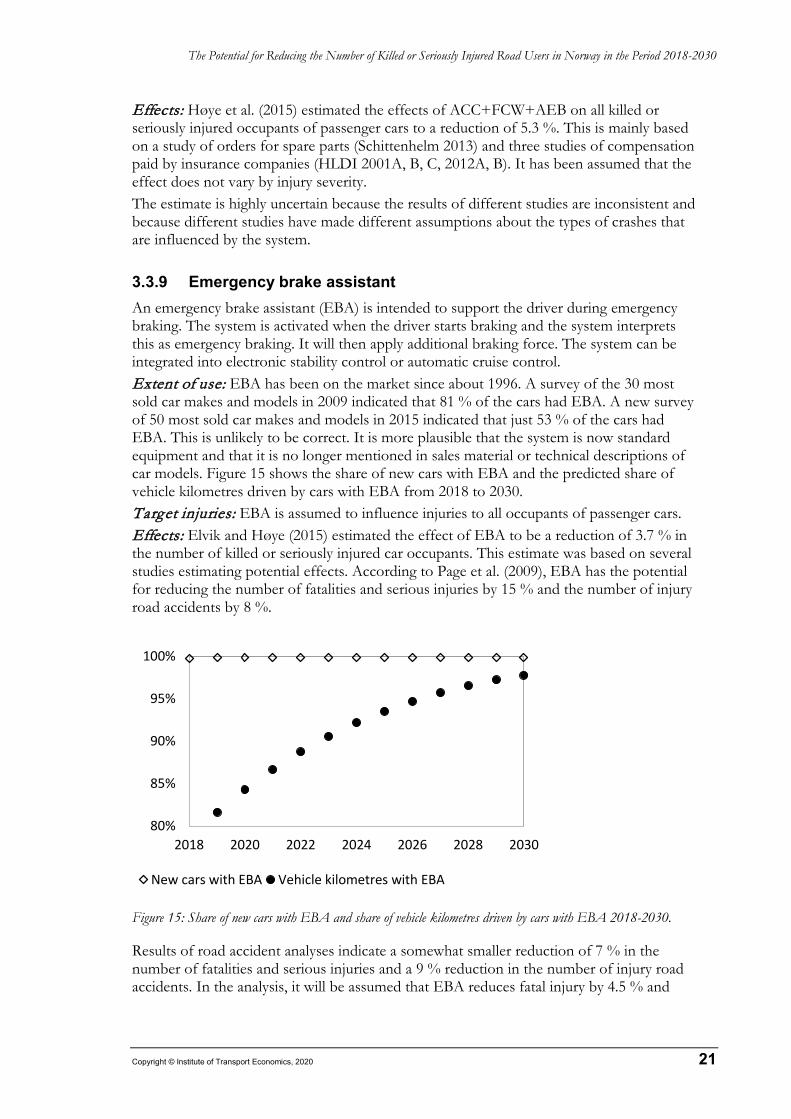
3.3.9 Emergency brake assistant An emergency brake assistant (EBA) is intended to support the driver during emergency braking. The system is activated when the driver starts braking and the system interprets this as emergency braking. It will then apply additional braking force. The system can be integrated into electronic stability control or automatic cruise control. Extent of use: EBA has been on the market since about 1996. A survey of the 30 most sold car makes and models in 2009 indicated that 81 % of the cars had EBA. A new survey of 50 most sold car makes and models in 2015 indicated that just 53 % of the cars had EBA. This is unlikely to be correct. It is more plausible that the system is now standard equipment and that it is no longer mentioned in sales material or technical descriptions of car models. Figure 15 shows the share of new cars with EBA and the predicted share of vehicle kilometres driven by cars with EBA from 2018 to 2030. Target injuries: EBA is assumed to influence injuries to all occupants of passenger cars. Effects: Elvik and Høye (2015) estimated the effect of EBA to be a reduction of 3.7 % in the number of killed or seriously injured car occupants. This estimate was based on several studies estimating potential effects. According to Page et al. (2009), EBA has the potential for reducing the number of fatalities and serious injuries by 15 % and the number of injury road accidents by 8 %.
Figure 15: Share of new cars with EBA and share of vehicle kilometres driven by cars with EBA 2018-2030.
Results of road accident analyses indicate a somewhat smaller reduction of 7 % in the number of fatalities and serious injuries and a 9 % reduction in the number of injury road accidents. In the analysis, it will be assumed that EBA reduces fatal injury by 4.5 % and
80%
85%
90%
95%
100%
2018 2020 2022 2024 2026 2028 2030
New cars with EBA Vehicle kilometres with EBA
The potential for reducing the number of killed or seriously injured road users in Norway in the period 2018-2030
22 Copyright © Institute of Transport Economics, 2020
serious injury by 3.5 %. It has further been assumed that the system has no effect on slight injury.
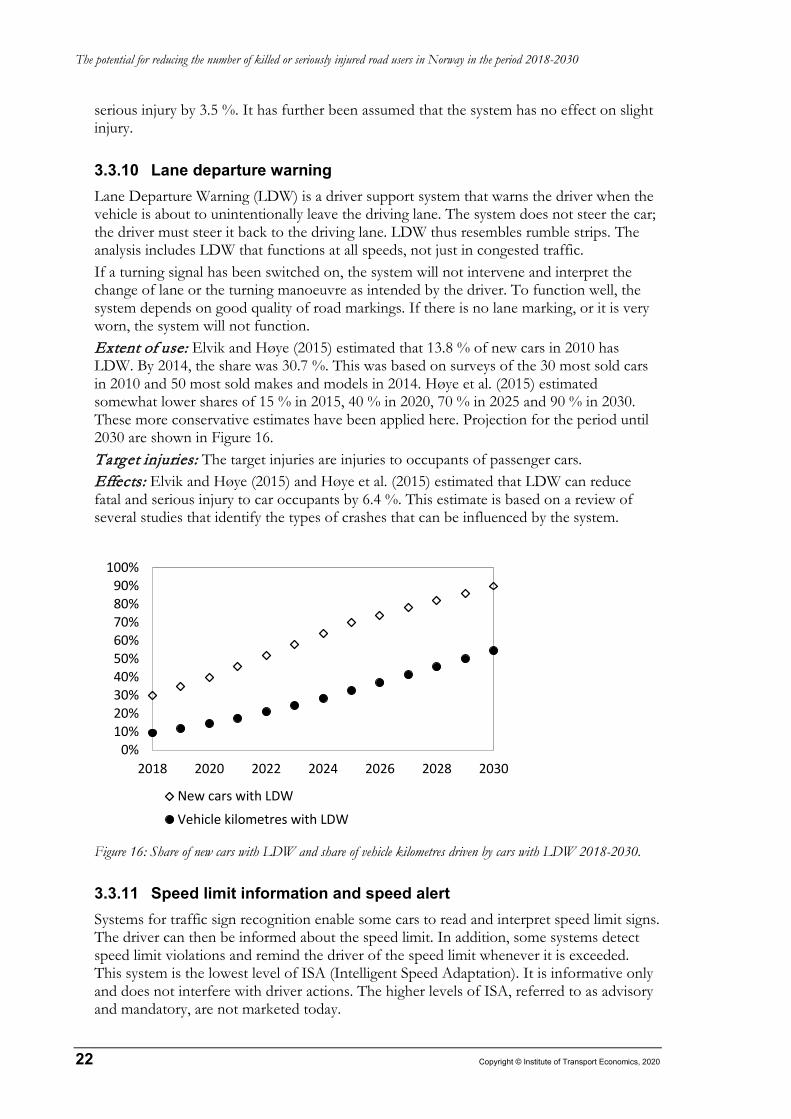
3.3.10 Lane departure warning Lane Departure Warning (LDW) is a driver support system that warns the driver when the vehicle is about to unintentionally leave the driving lane. The system does not steer the car; the driver must steer it back to the driving lane. LDW thus resembles rumble strips. The analysis includes LDW that functions at all speeds, not just in congested traffic. If a turning signal has been switched on, the system will not intervene and interpret the change of lane or the turning manoeuvre as intended by the driver. To function well, the system depends on good quality of road markings. If there is no lane marking, or it is very worn, the system will not function. Extent of use: Elvik and Høye (2015) estimated that 13.8 % of new cars in 2010 has LDW. By 2014, the share was 30.7 %. This was based on surveys of the 30 most sold cars in 2010 and 50 most sold makes and models in 2014. Høye et al. (2015) estimated somewhat lower shares of 15 % in 2015, 40 % in 2020, 70 % in 2025 and 90 % in 2030. These more conservative estimates have been applied here. Projection for the period until 2030 are shown in Figure 16. Target injuries: The target injuries are injuries to occupants of passenger cars. Effects: Elvik and Høye (2015) and Høye et al. (2015) estimated that LDW can reduce fatal and serious injury to car occupants by 6.4 %. This estimate is based on a review of several studies that identify the types of crashes that can be influenced by the system.
Figure 16: Share of new cars with LDW and share of vehicle kilometres driven by cars with LDW 2018-2030.
3.3.11 Speed limit information and speed alert Systems for traffic sign recognition enable some cars to read and interpret speed limit signs. The driver can then be informed about the speed limit. In addition, some systems detect speed limit violations and remind the driver of the speed limit whenever it is exceeded. This system is the lowest level of ISA (Intelligent Speed Adaptation). It is informative only and does not interfere with driver actions. The higher levels of ISA, referred to as advisory and mandatory, are not marketed today.
0%10%20%30%40%50%60%70%80%90%
100%
2018 2020 2022 2024 2026 2028 2030
New cars with LDW
Vehicle kilometres with LDW
The Potential for Reducing the Number of Killed or Seriously Injured Road Users in Norway in the Period 2018-2030
Copyright © Institute of Transport Economics, 2020 23
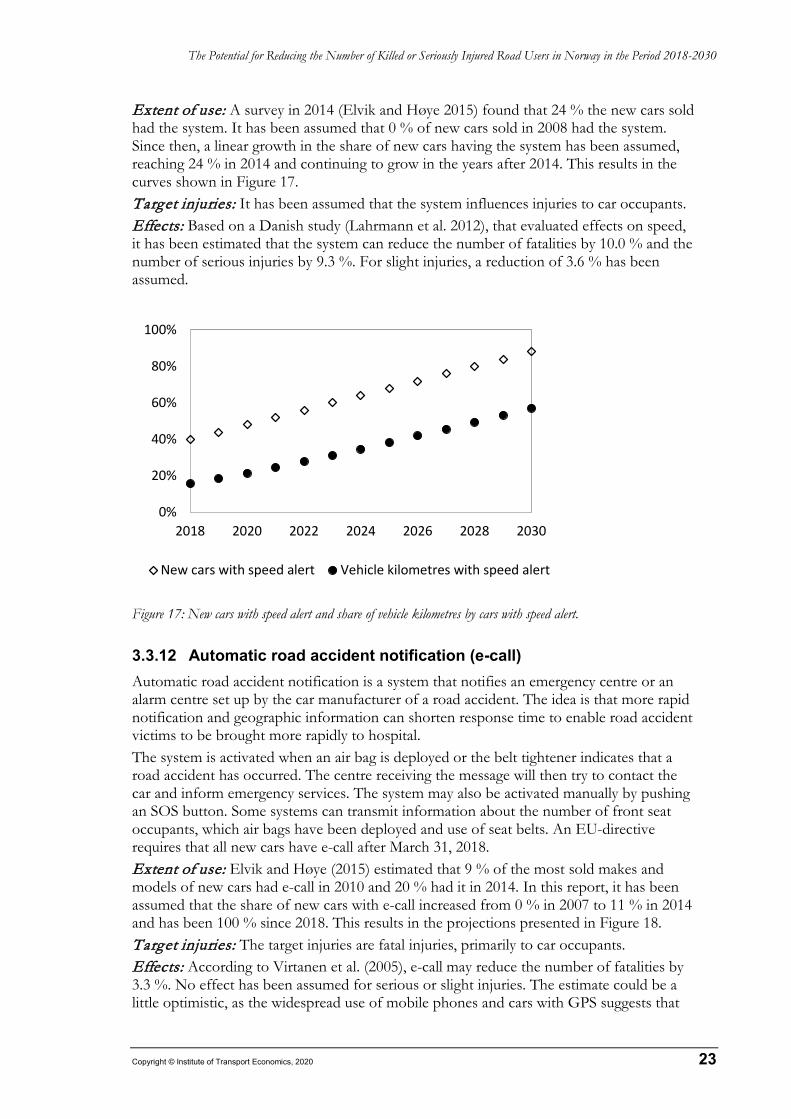
Extent of use: A survey in 2014 (Elvik and Høye 2015) found that 24 % the new cars sold had the system. It has been assumed that 0 % of new cars sold in 2008 had the system. Since then, a linear growth in the share of new cars having the system has been assumed, reaching 24 % in 2014 and continuing to grow in the years after 2014. This results in the curves shown in Figure 17. Target injuries: It has been assumed that the system influences injuries to car occupants. Effects: Based on a Danish study (Lahrmann et al. 2012), that evaluated effects on speed, it has been estimated that the system can reduce the number of fatalities by 10.0 % and the number of serious injuries by 9.3 %. For slight injuries, a reduction of 3.6 % has been assumed.
Figure 17: New cars with speed alert and share of vehicle kilometres by cars with speed alert.
3.3.12 Automatic road accident notification (e-call) Automatic road accident notification is a system that notifies an emergency centre or an alarm centre set up by the car manufacturer of a road accident. The idea is that more rapid notification and geographic information can shorten response time to enable road accident victims to be brought more rapidly to hospital. The system is activated when an air bag is deployed or the belt tightener indicates that a road accident has occurred. The centre receiving the message will then try to contact the car and inform emergency services. The system may also be activated manually by pushing an SOS button. Some systems can transmit information about the number of front seat occupants, which air bags have been deployed and use of seat belts. An EU-directive requires that all new cars have e-call after March 31, 2018. Extent of use: Elvik and Høye (2015) estimated that 9 % of the most sold makes and models of new cars had e-call in 2010 and 20 % had it in 2014. In this report, it has been assumed that the share of new cars with e-call increased from 0 % in 2007 to 11 % in 2014 and has been 100 % since 2018. This results in the projections presented in Figure 18. Target injuries: The target injuries are fatal injuries, primarily to car occupants. Effects: According to Virtanen et al. (2005), e-call may reduce the number of fatalities by 3.3 %. No effect has been assumed for serious or slight injuries. The estimate could be a little optimistic, as the widespread use of mobile phones and cars with GPS suggests that
0%
20%
40%
60%
80%
100%
2018 2020 2022 2024 2026 2028 2030
New cars with speed alert Vehicle kilometres with speed alert
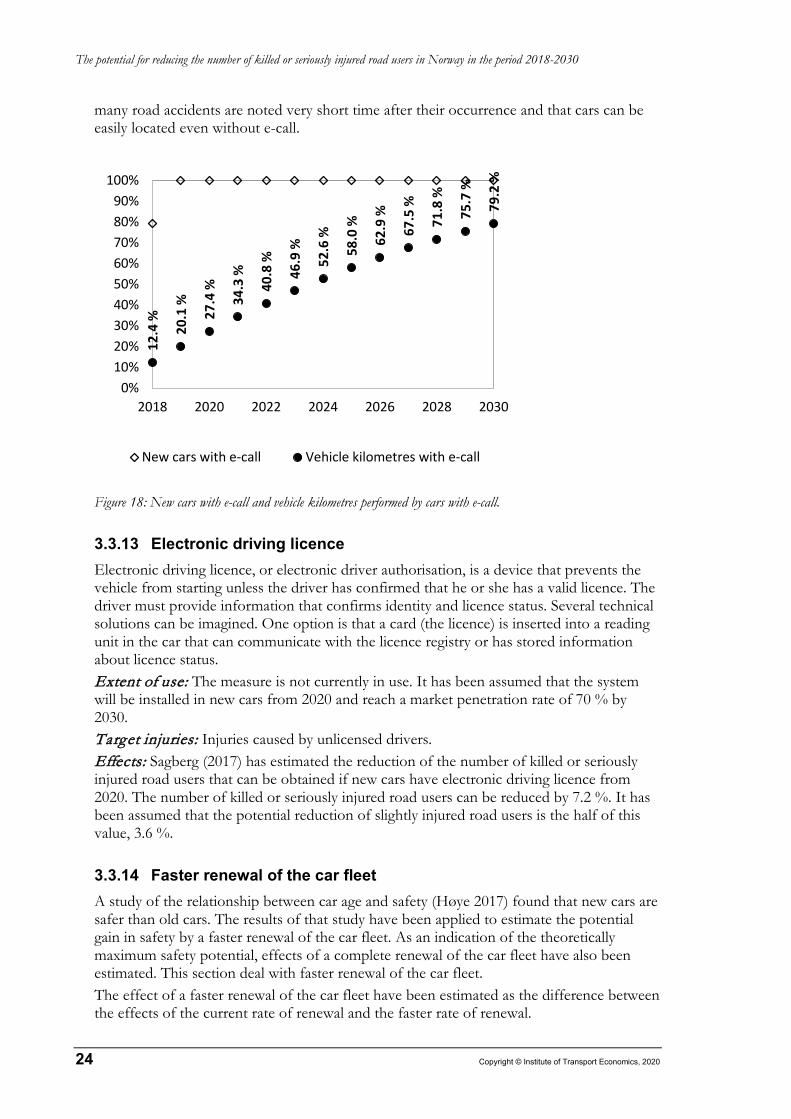
The potential for reducing the number of killed or seriously injured road users in Norway in the period 2018-2030
24 Copyright © Institute of Transport Economics, 2020
many road accidents are noted very short time after their occurrence and that cars can be easily located even without e-call.
Figure 18: New cars with e-call and vehicle kilometres performed by cars with e-call.
3.3.13 Electronic driving licence Electronic driving licence, or electronic driver authorisation, is a device that prevents the vehicle from starting unless the driver has confirmed that he or she has a valid licence. The driver must provide information that confirms identity and licence status. Several technical solutions can be imagined. One option is that a card (the licence) is inserted into a reading unit in the car that can communicate with the licence registry or has stored information about licence status. Extent of use: The measure is not currently in use. It has been assumed that the system will be installed in new cars from 2020 and reach a market penetration rate of 70 % by 2030. Target injuries: Injuries caused by unlicensed drivers. Effects: Sagberg (2017) has estimated the reduction of the number of killed or seriously injured road users that can be obtained if new cars have electronic driving licence from 2020. The number of killed or seriously injured road users can be reduced by 7.2 %. It has been assumed that the potential reduction of slightly injured road users is the half of this value, 3.6 %.
3.3.14 Faster renewal of the car fleet A study of the relationship between car age and safety (Høye 2017) found that new cars are safer than old cars. The results of that study have been applied to estimate the potential gain in safety by a faster renewal of the car fleet. As an indication of the theoretically maximum safety potential, effects of a complete renewal of the car fleet have also been estimated. This section deal with faster renewal of the car fleet. The effect of a faster renewal of the car fleet have been estimated as the difference between the effects of the current rate of renewal and the faster rate of renewal.
12.4
%
20.1
%
27.4
%
34.3
%
40.8
%
46.9
%
52.6
%
58.0
%
62.9
%
67.5
%
71.8
%
75.7
%
79.2
%
0%10%20%30%40%50%60%70%80%90%
100%
2018 2020 2022 2024 2026 2028 2030
New cars with e-call Vehicle kilometres with e-call
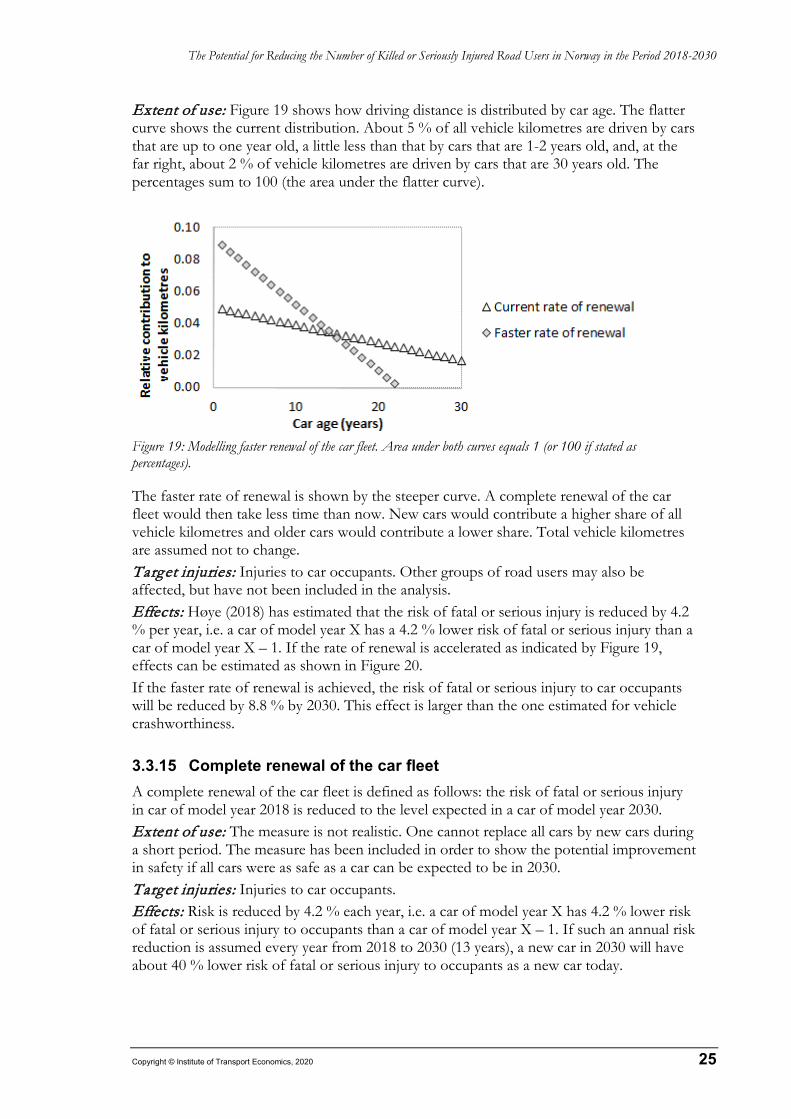
The Potential for Reducing the Number of Killed or Seriously Injured Road Users in Norway in the Period 2018-2030
Copyright © Institute of Transport Economics, 2020 25
Extent of use: Figure 19 shows how driving distance is distributed by car age. The flatter curve shows the current distribution. About 5 % of all vehicle kilometres are driven by cars that are up to one year old, a little less than that by cars that are 1-2 years old, and, at the far right, about 2 % of vehicle kilometres are driven by cars that are 30 years old. The percentages sum to 100 (the area under the flatter curve).
Figure 19: Modelling faster renewal of the car fleet. Area under both curves equals 1 (or 100 if stated as percentages).
The faster rate of renewal is shown by the steeper curve. A complete renewal of the car fleet would then take less time than now. New cars would contribute a higher share of all vehicle kilometres and older cars would contribute a lower share. Total vehicle kilometres are assumed not to change. Target injuries: Injuries to car occupants. Other groups of road users may also be affected, but have not been included in the analysis. Effects: Høye (2018) has estimated that the risk of fatal or serious injury is reduced by 4.2 % per year, i.e. a car of model year X has a 4.2 % lower risk of fatal or serious injury than a car of model year X – 1. If the rate of renewal is accelerated as indicated by Figure 19, effects can be estimated as shown in Figure 20. If the faster rate of renewal is achieved, the risk of fatal or serious injury to car occupants will be reduced by 8.8 % by 2030. This effect is larger than the one estimated for vehicle crashworthiness.
3.3.15 Complete renewal of the car fleet A complete renewal of the car fleet is defined as follows: the risk of fatal or serious injury in car of model year 2018 is reduced to the level expected in a car of model year 2030. Extent of use: The measure is not realistic. One cannot replace all cars by new cars during a short period. The measure has been included in order to show the potential improvement in safety if all cars were as safe as a car can be expected to be in 2030. Target injuries: Injuries to car occupants. Effects: Risk is reduced by 4.2 % each year, i.e. a car of model year X has 4.2 % lower risk of fatal or serious injury to occupants than a car of model year X – 1. If such an annual risk reduction is assumed every year from 2018 to 2030 (13 years), a new car in 2030 will have about 40 % lower risk of fatal or serious injury to occupants as a new car today.
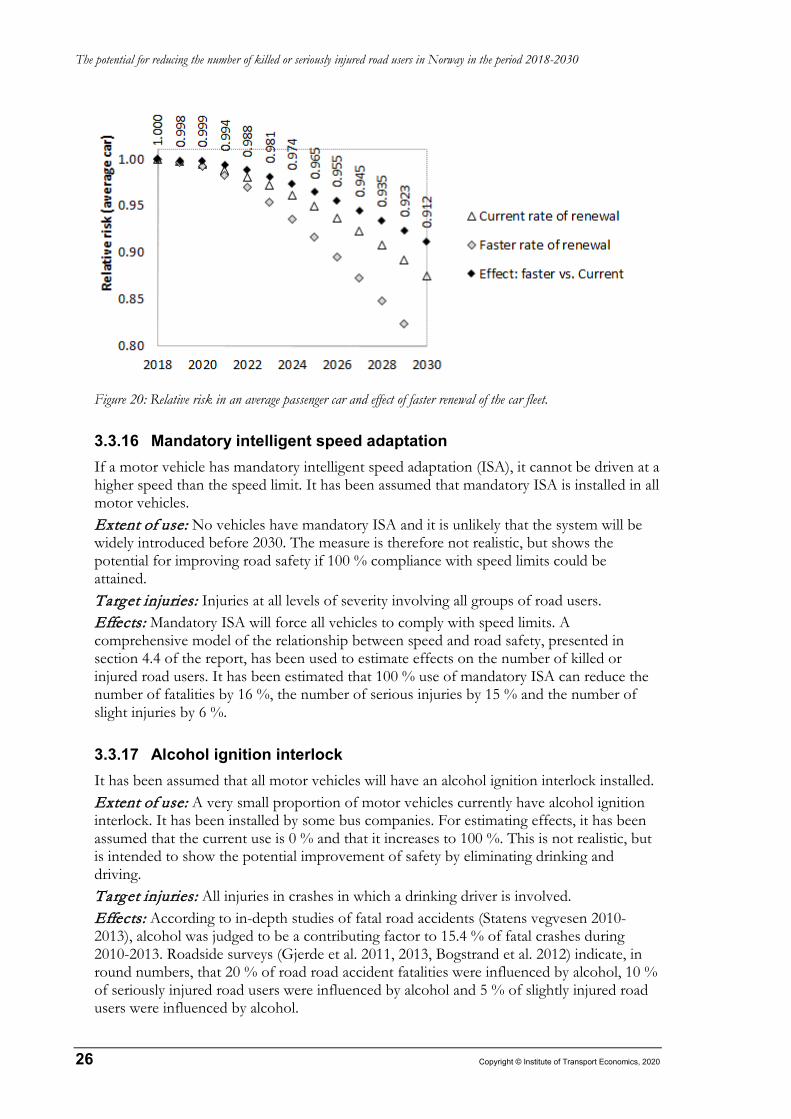
The potential for reducing the number of killed or seriously injured road users in Norway in the period 2018-2030
26 Copyright © Institute of Transport Economics, 2020
Figure 20: Relative risk in an average passenger car and effect of faster renewal of the car fleet.
3.3.16 Mandatory intelligent speed adaptation If a motor vehicle has mandatory intelligent speed adaptation (ISA), it cannot be driven at a higher speed than the speed limit. It has been assumed that mandatory ISA is installed in all motor vehicles. Extent of use: No vehicles have mandatory ISA and it is unlikely that the system will be widely introduced before 2030. The measure is therefore not realistic, but shows the potential for improving road safety if 100 % compliance with speed limits could be attained. Target injuries: Injuries at all levels of severity involving all groups of road users. Effects: Mandatory ISA will force all vehicles to comply with speed limits. A comprehensive model of the relationship between speed and road safety, presented in section 4.4 of the report, has been used to estimate effects on the number of killed or injured road users. It has been estimated that 100 % use of mandatory ISA can reduce the number of fatalities by 16 %, the number of serious injuries by 15 % and the number of slight injuries by 6 %.
3.3.17 Alcohol ignition interlock It has been assumed that all motor vehicles will have an alcohol ignition interlock installed. Extent of use: A very small proportion of motor vehicles currently have alcohol ignition interlock. It has been installed by some bus companies. For estimating effects, it has been assumed that the current use is 0 % and that it increases to 100 %. This is not realistic, but is intended to show the potential improvement of safety by eliminating drinking and driving. Target injuries: All injuries in crashes in which a drinking driver is involved. Effects: According to in-depth studies of fatal road accidents (Statens vegvesen 2010-2013), alcohol was judged to be a contributing factor to 15.4 % of fatal crashes during 2010-2013. Roadside surveys (Gjerde et al. 2011, 2013, Bogstrand et al. 2012) indicate, in round numbers, that 20 % of road road accident fatalities were influenced by alcohol, 10 % of seriously injured road users were influenced by alcohol and 5 % of slightly injured road users were influenced by alcohol.
The Potential for Reducing the Number of Killed or Seriously Injured Road Users in Norway in the Period 2018-2030
Copyright © Institute of Transport Economics, 2020 27
The effects on road accidents or injuries of an alcohol ignition interlock are not well known. Based on a literature survey (Elder et al. 2011), it has been assumed that the effects is proportional to the recidivism rate of drivers who have had alcolock installed as part of treatment for dependency. This suggests a road accident reduction of about 50 %. The effect is assumed to be the same at all levels of injury severity.
3.3.18 Seat belt ignition interlock If a car has a seat belt ignition interlock, it cannot be started unless seat belts are fastened. Such a system does not exist today, but was a vehicle safety standard in the United States in 1974. It has been assumed that the interlock can be wired so that it senses if there is a passenger in all seats in the car; in other words, the car will not start unless everybody has put on their seat belt. Extent of use: Seat belt ignition interlocks as described above are not in use today. It has been assumed that 100 % of cars will have the system. This is not realistic. It is intended to show the potential for improving safety by ensuring 100 % wearing of seat belts. Target injuries: The beneficiaries will be those who currently do not wear seat belts. The current rate of non-use of seat belts among car occupants involved in injury road accidents has been estimated to 29.5 % for fatal injury, 15 % for serious injury and 8 % for slight injury. Effects: Seat belts reduce injuries at all levels of severity by 62 %.
3.4 Enforcement and safety management
The following measures related to enforcement and safety management systems have been included:
1. Speed enforcement (by police officers) 2. Seat belt enforcement 3. Random breath testing (alcohol) 4. Drugged-driving enforcement 5. Enforcement of service and rest hours 6. Speed cameras 7. Section control 8. Increasing fixed penalties 9. Safety management systems in transport companies
The last two measures were not included in the preliminary study in 2015. Two recent studies (Elvik 2015B, 2016A) show that increasing fixed penalties may have an effect on road user behaviour and on road accidents, provided the increases are moderate. In another study (Nævestad et al. 2018) effects of safety management systems in transport companies were studied. A model called the “safety ladder” was introduced.
3.4.1 Speed enforcement Extent of use: Three levels of increase in speed enforcement have been considered: 25 %, 50 % and 100 %. An increase of 100 % is regarded as the maximum conceivable level. Target injuries: Increased speed enforcement can influence all road accidents and all road user groups.
The potential for reducing the number of killed or seriously injured road users in Norway in the period 2018-2030
28 Copyright © Institute of Transport Economics, 2020
Effects: A model described in section 4.4 has been used to estimate effects. A 100 % increase in speed enforcement will be associated with a 6.5 % reduction of the (total) number of fatalities, a 6.3 % reduction of the number of seriously injured road users, and a 4.7 % reduction of the number of slightly injured road users.
3.4.2 Seat belt enforcement Extent of use: Seat belt wearing in traffic is 97.2 %. Among road accident victims, 29.5 % of fatally injured car occupants did not wear seat belts, 15 % of seriously injured and 8 % of slightly injured car occupants did not wear seat belts. Target injuries: Injuries to car occupants. Effects: A model used to estimate effects is explained in section 4.3. A 100 % increase in seat belt enforcement will increase use from 97.2 to 98.2 %.
3.4.3 Random breath testing Extent of use: A 100 % increase in random breath testing is regarded as the maximum conceivable use of the measure. Target injuries: Crashes involving drinking drivers. Effects: A model used to estimate effects is explained in section 4.3. By increasing random breath testing by 100 %, it is estimated that crashes involving drunk drivers can be reduced by 8.5 %.
3.4.4 Drugged driving enforcement Extent of use: A 100 % increase in enforcement is regarded as the maximum conceivable use of the measure. Target injuries: Crashes involving drivers influenced by illicit or prescription drugs. Effects: A model described in section 4.3 was applied to estimate effects. A 100 % increase in enforcement will be associated with an 8.8 % reduction of crashes involving drivers influenced by drugs.
3.4.5 Enforcing service and rest hours Extent of use: A 100 % increase in enforcement is regarded as the maximum conceivable use of the measure. Target injuries: All road accidents involving drivers who are subject to regulation of their hours of service and rest. Effects: Estimates of effects have been developed by relying on data presented in the Handbook of Road Safety Measures. In the book, it is estimated that 100 % compliance with restrictions on the daily number of hours of driving can reduce crashes by 21 %. Full compliance with daily resting hours can reduce crashes by 5 %. These number cannot be added. Based on a model of how changes in enforcement are associated with changes in compliance, it is estimated that a 100 % increase in enforcement produces a 21.5 % increase in compliance (reduction of violations). If it is assumed that the risks attributable to violations (21 % and 5 %) are proportional to the amount of violations, a 21.5 % increase in compliance will give an road accident reduction of 6.2 %.

The Potential for Reducing the Number of Killed or Seriously Injured Road Users in Norway in the Period 2018-2030
Copyright © Institute of Transport Economics, 2020 29
3.4.6 Speed cameras Extent of use: Speed cameras currently in use are assumed to influence 7.3 % of vehicle kilometres on national and county roads. It will be assumed that this can be increased to 14 % of vehicle kilometres. Target injuries: Injuries on roads that have a speeding problem and/or a high share of fatal and serious injuries. Formal warrants for use of speed cameras have been developed. Effects: Based on Høye (2014A), it is assumed that speed cameras reduce fatal and serious injuries by 49 % and slight injuries by 32 %.
3.4.7 Section control Extent of use: Section control is the coordinated use of several speed cameras to measure speed on a section of road. A section can be several kilometres long. Currently, 0.9 % of vehicle kilometres on national and county roads are influenced by section control. It has been assumed that the use of section control can increase by a factor of 10, meaning that it will influence 9 % of traffic. Target injuries: Injuries on roads that have a speeding problem and/or a high share of fatal and serious injuries. Formal warrants for the use of section control have been developed. Effects: Based on Høye (2014B), it is assumed that section control reduces the number of fatalities and serious injuries by 49 % and the number of slight injuries by 12 %.
3.4.8 Increasing fixed penalties Extent of use: A fixed penalty is a fine given according to a standard (fixed) rate. If the drivers pleads guilty, he can pay the fine on the spot. A meta-analysis (Elvik 2016A) indicates that moderate increases in fixed penalties improve safety. An increase of 50 % has been assumed. Target injuries: All road accidents and all groups of road users; traditionally most citations are for speeding. Effects: A model based on Norwegian data (Elvik 2015B) shows that a 50 % increase in fixed penalties can be expected to reduce fatalities by 1.4 %, serious injuries by 1.3 % and slight injuries by 1.1 %.
3.4.9 Safety management systems in transport companies Extent of use: The management of safety in transport companies can be more or less formalised and ambitious. The “safety ladder” has four levels, starting with a simple and informal system and ending with a highly formalised and ambitious system, like ISO standard 39001. It is not clear how formalised safety management is in transport companies today. Estimates of effect have therefore been developed under two different sets of assumptions. The pessimistic assumption is that 50 % of companies already have a well-developed safety management system, and that those who do not can attain a 20 % road accident reduction by introducing a safety management system. In other words: 50 % of transport companies can reduce their road accident rate by 20 %. The optimistic assumption is that only 8 % of transport companies have any functioning safety management system, and that by introducing one, they can reduce their road accident rate by 59 %. In other words: 92 % of transport companies can reduce their road accident rate by 59 %. Target injuries: Road accidents involving transport companies.
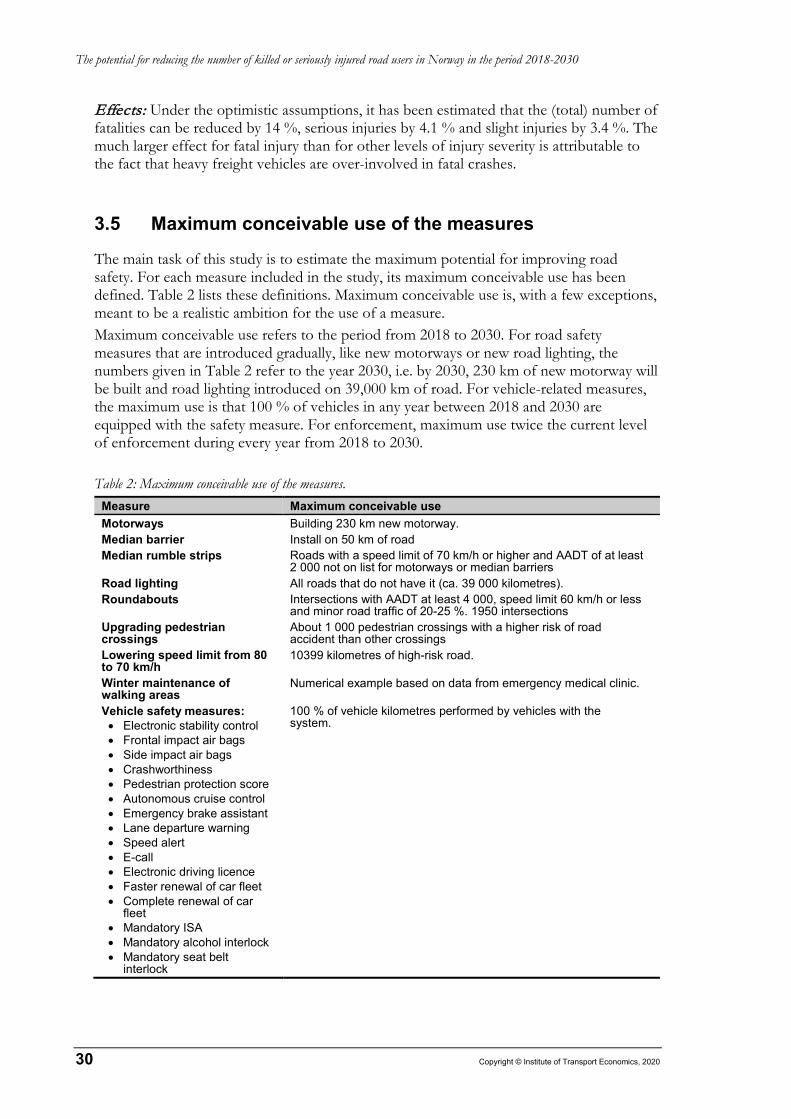
The potential for reducing the number of killed or seriously injured road users in Norway in the period 2018-2030
30 Copyright © Institute of Transport Economics, 2020
Effects: Under the optimistic assumptions, it has been estimated that the (total) number of fatalities can be reduced by 14 %, serious injuries by 4.1 % and slight injuries by 3.4 %. The much larger effect for fatal injury than for other levels of injury severity is attributable to the fact that heavy freight vehicles are over-involved in fatal crashes.
3.5 Maximum conceivable use of the measures
The main task of this study is to estimate the maximum potential for improving road safety. For each measure included in the study, its maximum conceivable use has been defined. Table 2 lists these definitions. Maximum conceivable use is, with a few exceptions, meant to be a realistic ambition for the use of a measure. Maximum conceivable use refers to the period from 2018 to 2030. For road safety measures that are introduced gradually, like new motorways or new road lighting, the numbers given in Table 2 refer to the year 2030, i.e. by 2030, 230 km of new motorway will be built and road lighting introduced on 39,000 km of road. For vehicle-related measures, the maximum use is that 100 % of vehicles in any year between 2018 and 2030 are equipped with the safety measure. For enforcement, maximum use twice the current level of enforcement during every year from 2018 to 2030.
Table 2: Maximum conceivable use of the measures. Measure Maximum conceivable use Motorways Building 230 km new motorway. Median barrier Install on 50 km of road Median rumble strips Roads with a speed limit of 70 km/h or higher and AADT of at least
2 000 not on list for motorways or median barriers Road lighting All roads that do not have it (ca. 39 000 kilometres). Roundabouts Intersections with AADT at least 4 000, speed limit 60 km/h or less
and minor road traffic of 20-25 %. 1950 intersections Upgrading pedestrian crossings
About 1 000 pedestrian crossings with a higher risk of road accident than other crossings
Lowering speed limit from 80 to 70 km/h
10399 kilometres of high-risk road.
Winter maintenance of walking areas
Numerical example based on data from emergency medical clinic.
Vehicle safety measures: • Electronic stability control • Frontal impact air bags • Side impact air bags • Crashworthiness • Pedestrian protection score • Autonomous cruise control • Emergency brake assistant • Lane departure warning • Speed alert • E-call • Electronic driving licence • Faster renewal of car fleet • Complete renewal of car
fleet • Mandatory ISA • Mandatory alcohol interlock • Mandatory seat belt
interlock
100 % of vehicle kilometres performed by vehicles with the system.

The Potential for Reducing the Number of Killed or Seriously Injured Road Users in Norway in the Period 2018-2030
Copyright © Institute of Transport Economics, 2020 31
Measure Maximum conceivable use Enforcement: • Speed enforcement • Seat belt enforcement • Random breath testing • Drugs enforcement • Service and rest hours
Twice the current level.
• Speed cameras Affected vehicle kilometres doubled • Section control Affected vehicle kilometres increased tenfold • Increased fixed penalties 50% increase • Safety management Highest level in 92 % of transport companies
Motorways and median barriers: The National Public Roads Administration has identified 500 km of road suitable for building motorway and 1245 km of road suitable for median barriers. The estimates comprise much shorter distances of 230 and 50 km, respectively. The reason for this is that we wanted the projects to be geocoded, that is we wanted to identify the roads where these measures are going to be implemented. This choice was made in order to make estimates of effects more precise. Median rumble strips: This measure was judged as suitable on roads with a speed limit of at least 70 km/h and an AADT of at least 2000. At lower speed limits and lower traffic volume, median rumble strips are less useful because there are fewer head-on collisions of lower severity. Road lighting: In principle, all roads that do not have road lighting could have it. On national and county roads, this amounts to 39 000 km or road. Roundabouts: Roundabouts were judged as suitable when: (1) AADT is at least 4000, (2) Speed limits is 60 km/h or lower, and (3) Entering volume from the minor road is at least 20 %. Close to 2000 intersections fulfilled these criteria. The huge majority of rural intersections have a very small volume entering from the minor road and AADT less than 4000. These intersections operate well as channelized or non-channelized intersections with yield signs on the side road. Upgrading pedestrian crossings: Based on a study in Oslo and its suburbs (Elvik 2016B), it was estimated that nationwide about 1000 pedestrian crossings are suitable for upgrading as a result of having a higher road accident rate than the rest of pedestrian crossings. The number of crossings was estimated by scaling up the number of crossings in Oslo and suburbs, using the size of the population as scaling parameter. Lowering speed limit: The roads suitable for lowering speed limits were identified in a previous project (Elvik 2017A). Although located all over the country, each road has a length of several kilometres, thus avoiding lowering the speed limit on a very short section of road. Winter maintenance of walking areas: The estimates made are numerical examples for Oslo. Too little is known about how things are in the rest of the country to generalise the results. Vehicle safety measures: It is easy to define maximum use of these. Maximum use is when all cars have a safety system (100 % market penetration) so that all vehicle kilometres are affected by the system. Enforcement measures: In a previous analysis in 2015, the maximum level of enforcement was defined as ten times the current level. We now regard it as unrealistic that enforcement can be increased by a factor of 10. We have defined the maximum level of enforcement as twice the current level. This is based on an examination of how enforcement has varied in the past.
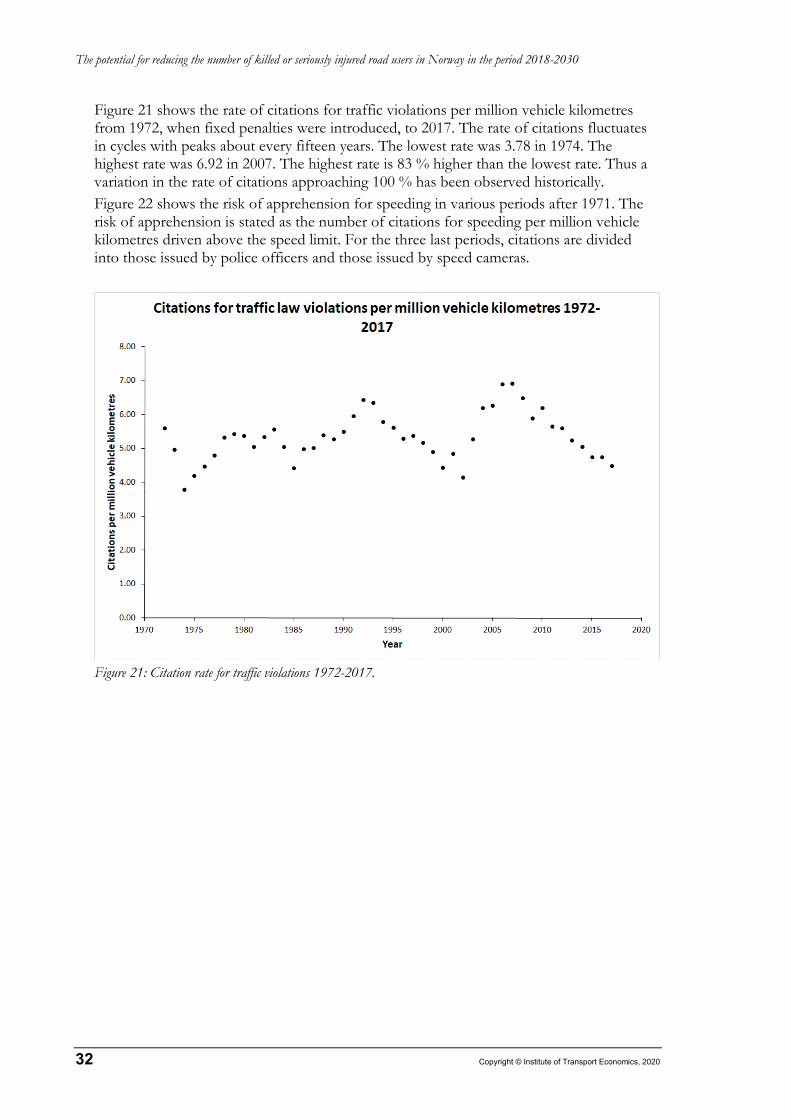
The potential for reducing the number of killed or seriously injured road users in Norway in the period 2018-2030
32 Copyright © Institute of Transport Economics, 2020
Figure 21 shows the rate of citations for traffic violations per million vehicle kilometres from 1972, when fixed penalties were introduced, to 2017. The rate of citations fluctuates in cycles with peaks about every fifteen years. The lowest rate was 3.78 in 1974. The highest rate was 6.92 in 2007. The highest rate is 83 % higher than the lowest rate. Thus a variation in the rate of citations approaching 100 % has been observed historically. Figure 22 shows the risk of apprehension for speeding in various periods after 1971. The risk of apprehension is stated as the number of citations for speeding per million vehicle kilometres driven above the speed limit. For the three last periods, citations are divided into those issued by police officers and those issued by speed cameras.
Figure 21: Citation rate for traffic violations 1972-2017.
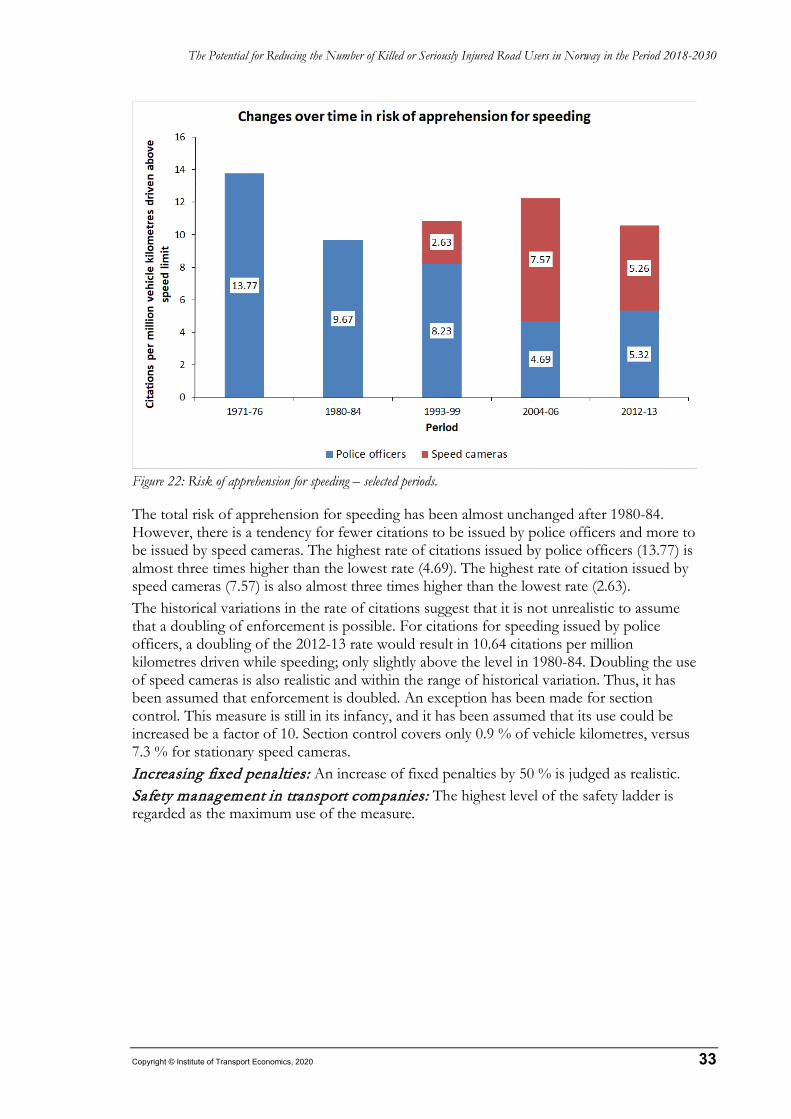
The Potential for Reducing the Number of Killed or Seriously Injured Road Users in Norway in the Period 2018-2030
Copyright © Institute of Transport Economics, 2020 33
Figure 22: Risk of apprehension for speeding – selected periods.
The total risk of apprehension for speeding has been almost unchanged after 1980-84. However, there is a tendency for fewer citations to be issued by police officers and more to be issued by speed cameras. The highest rate of citations issued by police officers (13.77) is almost three times higher than the lowest rate (4.69). The highest rate of citation issued by speed cameras (7.57) is also almost three times higher than the lowest rate (2.63). The historical variations in the rate of citations suggest that it is not unrealistic to assume that a doubling of enforcement is possible. For citations for speeding issued by police officers, a doubling of the 2012-13 rate would result in 10.64 citations per million kilometres driven while speeding; only slightly above the level in 1980-84. Doubling the use of speed cameras is also realistic and within the range of historical variation. Thus, it has been assumed that enforcement is doubled. An exception has been made for section control. This measure is still in its infancy, and it has been assumed that its use could be increased be a factor of 10. Section control covers only 0.9 % of vehicle kilometres, versus 7.3 % for stationary speed cameras. Increasing fixed penalties: An increase of fixed penalties by 50 % is judged as realistic. Safety management in transport companies: The highest level of the safety ladder is regarded as the maximum use of the measure.
The potential for reducing the number of killed or seriously injured road users in Norway in the period 2018-2030
34 Copyright © Institute of Transport Economics, 2020
4 Models for estimating the impacts of the measures
Different approaches have been applied for estimating the impacts of different types of road safety measures. The choice of approach depends mainly on whether the effects of a measure is best represented as a point estimate or as a function of the level of use of the measure. A distinction has been made between three cases:
1. Measures for which the effect is stated as a percentage change in the number of fatalities or injuries and for which the total effect (the share of target injuries influenced by the measure) increases as the measure is implemented at a growing number of locations or penetrates the market.
2. Measures for which the effect is stated as a percentage change in the number of fatalities or injuries in its target group and this impact remains constant over time.
3. Measures for which the effect is a function of the extent of use of the measure, i.e. the effect can be modelled as a dose-response curve, with the dose being the extent of use of the measure and the response being the size of the effect.
The method used to estimate impacts in each of these cases is explained below.
4.1 Measures for which the total impact increases as the measure is used more extensively
This group includes most road-related measures and all vehicle-related measures. Upgrading pedestrian crossings can be used as an example. In each crossing that is upgraded, it is assumed that the expected number of fatalities is reduced by 28 %, the expected number of serious injuries reduced by 26 % and the expected number of slight injuries reduced by 14 %. These estimates have been developed by assuming that the mean speed of traffic is reduced by 5 km/h. The total number of fatalities or injuries prevented as more crossings are upgraded will then follow the curve presented in Figure 23. The curve has been developed by assuming that upgrading starts in the pedestrian crossings that have the highest expected number of injuries and proceeds to pedestrian crossings with a lower expected number of injuries. The curve will then be steepest at the beginning and flatten out as the increase in the number of injuries prevented for each additional crossing that is upgraded gets smaller and smaller. Curves of a similar shape apply to all road-related measures except for lowering speed limits. The total impacts of vehicle-related measures accumulate in a similar fashion. New cars are driven longer annual distances than old cars. Thus, market penetration of a new safety feature grows fastest in the beginning and slows down as it approaches 100 % market penetration. Complete renewal of the car fleet in Norway takes 27 years, but 90 % renewal takes 18 years. For road-related and vehicle-related measures, alternative levels for the use of the measures have not been defined (e.g. 100 roundabouts built, 200 roundabouts built, etc. as specific levels of implementation). Road-related measures have been assumed to be implemented to
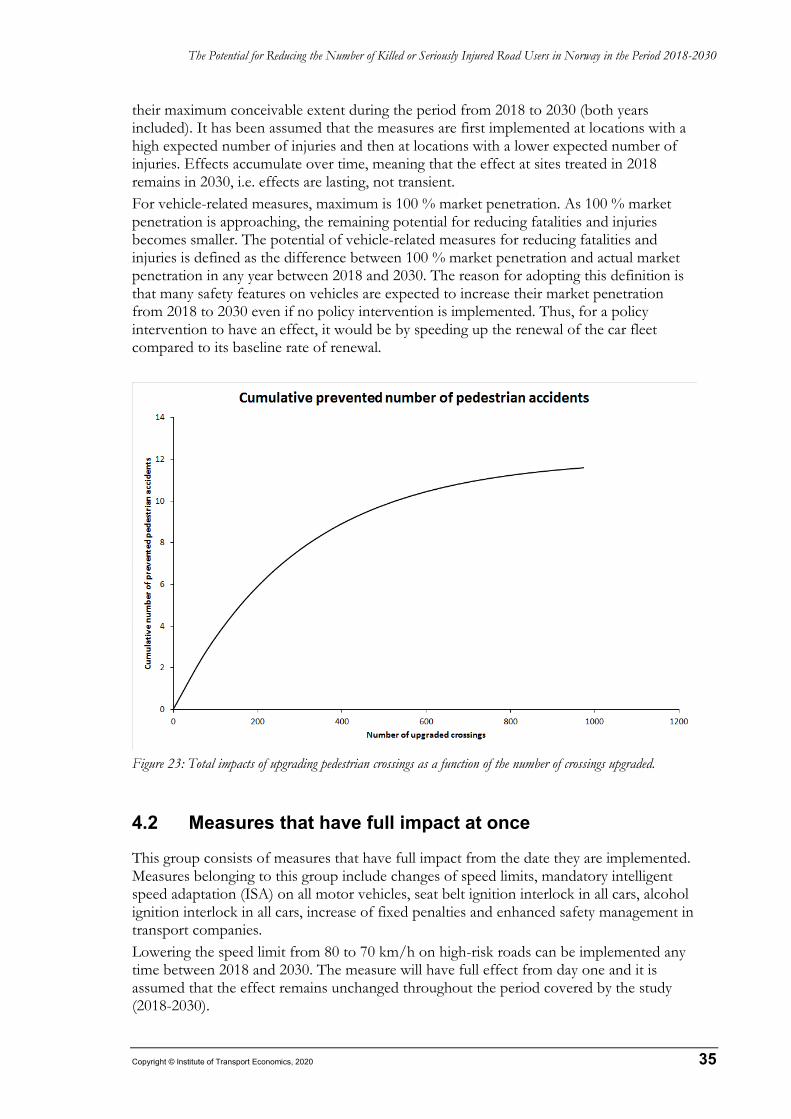
The Potential for Reducing the Number of Killed or Seriously Injured Road Users in Norway in the Period 2018-2030
Copyright © Institute of Transport Economics, 2020 35
their maximum conceivable extent during the period from 2018 to 2030 (both years included). It has been assumed that the measures are first implemented at locations with a high expected number of injuries and then at locations with a lower expected number of injuries. Effects accumulate over time, meaning that the effect at sites treated in 2018 remains in 2030, i.e. effects are lasting, not transient. For vehicle-related measures, maximum is 100 % market penetration. As 100 % market penetration is approaching, the remaining potential for reducing fatalities and injuries becomes smaller. The potential of vehicle-related measures for reducing fatalities and injuries is defined as the difference between 100 % market penetration and actual market penetration in any year between 2018 and 2030. The reason for adopting this definition is that many safety features on vehicles are expected to increase their market penetration from 2018 to 2030 even if no policy intervention is implemented. Thus, for a policy intervention to have an effect, it would be by speeding up the renewal of the car fleet compared to its baseline rate of renewal.
Figure 23: Total impacts of upgrading pedestrian crossings as a function of the number of crossings upgraded.
4.2 Measures that have full impact at once
This group consists of measures that have full impact from the date they are implemented. Measures belonging to this group include changes of speed limits, mandatory intelligent speed adaptation (ISA) on all motor vehicles, seat belt ignition interlock in all cars, alcohol ignition interlock in all cars, increase of fixed penalties and enhanced safety management in transport companies. Lowering the speed limit from 80 to 70 km/h on high-risk roads can be implemented any time between 2018 and 2030. The measure will have full effect from day one and it is assumed that the effect remains unchanged throughout the period covered by the study (2018-2030).
The potential for reducing the number of killed or seriously injured road users in Norway in the period 2018-2030
36 Copyright © Institute of Transport Economics, 2020
It has been assumed that all motor vehicles have ISA, alcolock and seat belt lock. No gradual introduction of the measures is assumed. The estimated impacts indicate what can be accomplished by eliminating speeding, drinking-and-driving and non-use of seat belts. An increase of fixed penalties takes effect in the whole country from a certain date. The measure is assumed to have full effect from the first day. The effect is assumed to remain constant throughout the period covered by the study. The safety ladder model of road safety management (Nævestad et al. 2018) is likely to be introduced gradually. Some companies may start introducing the system, others will then follow. We do not know the distribution of road accidents between transport companies. It is therefore not possible to model a gradual introduction of the safety management system. It is reasonable to assume that the largest transport companies will have the most sophisticated safety management systems, and that smaller companies will adopt simpler systems. It is, however, not obvious that the first companies to introduce systematic safety management will be those that have the worst road accident record. One can easily imagine the opposite: companies with a good safety record want to preserve and improve it and will therefore find a formalised safety management system useful. The objective is to estimate the potential gain in road safety if transport companies introduce more systematic safety management. To get an idea of the potential, two sets of assumptions have been developed, indicating minimum and maximum potentials. The minimum assumes that the lowest level of the safety ladder is introduced by 50 % of transport companies. These companies reduce their road accident rate by 20 %. The maximum assumes that 92 % of transport companies introduce the highest level of the safety ladder. These companies reduce their road accident rate by 59 %.
4.3 Measures where effects vary according to the level of use
It has been assumed that the effects of enforcement measures vary according to the level of enforcement. This assumption is based on a number of studies showing the relationship between relative changes in the amount of enforcement and relative changes in safety outcomes. The results of some of these studies are presented in table 3. All results presented in Table 3 are road accident modification factors. These show the relative change in the number of road accidents. A factor of, for example, 1.10 indicates a 10 % increase in the number of road accidents. Hössinger and Berger (2012) made a stated-preference study of how different levels of enforcement influence the use of seat belts and compliance with speed limits in Austria. They found that an increase in enforcement would lead to increased seat belt wearing. Increased seat belt wearing may in turn reduce the number of fatalities and injuries. Hössinger and Berger used 80 % seat belt wearing as reference. Their findings suggest that seat belt wearing would increase to 82.3 % if enforcement increased by 25 %, 84.1 % if enforcement increased by 50 % and 87.0 % if enforcement increased by 100 %.

The Potential for Reducing the Number of Killed or Seriously Injured Road Users in Norway in the Period 2018-2030
Copyright © Institute of Transport Economics, 2020 37
Tabell 3: Relationship between changes in enforcement and changes in road safety.
Relative level of enforcement (1.00 = current) Study
Target for enforcement
Dependent variable
0.25
0.50
1.00
1.25
1.50
2.00
Hössinger & Berger 2012
Seat belts Seatbelt use 0.915 0.965 1.000 1.029 1.051 1.088
Ferris et al. 2013
Alcohol Road accidents 1.169 1.085 1.000 0.973 0.951 0.915
Elvik 2015A Speed Road accidents 1.053 1.034 1.000 0.984 0.963 0.938 Elvik 2015B Speed Violations 1.622 1.274 1.000 0.925 0.868 0.785 Cameron et al. 2016
Speed Road accidents 1.066 1.032 1.000 0.990 0.981 0.965
Cameron et al. 2016
Alcohol Road accidents 1.019 1.009 1.000 0.997 0.994 0.991
Cameron et al. 2016
Alcohol Fatal accs. 1.173 1.083 1.000 0.975 0.954 0.923
Cameron et al. 2016
Drugs Fatal accs. 1.202 1.096 1.000 0.971 0.948 0.912
Current use of seat belts in Norway is much higher than the levels studied by Hössinger and Berger; 97.2 % according to a roadside survey made by the Public Roads Administration (Statens vegvesen et al. 2018). Among those involved in road accidents, seat belt wearing is much lower. Based on data provided by Høye (2016C) and Ringen (2017), it is estimated that 29.5 % of fatally injured car occupants did not wear a seat belt, 15 % of seriously injured car occupants did not wear a seat belt, and 8 % of slightly injured car occupants did not wear a seat belt. These rates are all considerably higher than the non-wearing rate in traffic (2.8 %). As seat belt wearing has increased, the group not wearing seat belts has gradually become more extreme and atypical. Those who do not wear seat belts have a higher risk of involvement in road accidents, in particular fatal road accidents, than those who wear seat belts. According to a model developed by Høye (2016C), the risk of road accident involvement for those not wearing seat belts becomes higher the smaller the group of non-wearers becomes. In other words, the groups gets ever more extreme the smaller it gets. By using the coefficients estimated by Hössinger and Berger (2012), it can be estimated that doubling seat belt enforcement will increase seat belt wearing in Norway from 97.2 to 98.2 %. Combining this with the risk model developed by Høye (2016C), and assuming that seat belts reduce the risk of injury by 60 % at all levels of injury severity, injury modification factors associated with a 25 %, 50 % and 100 % increase in seat belt enforcement can be estimated. The injury modification factors associated with these levels of enforcement are, respectively, 0.959, 0.922 and 0.850. Thus, increasing seat belt wearing from 97.2 to 98.2 % is estimated to reduce the annual number of fatalities by 3.2. If seat belt wearing becomes 100 %, 12.8 fatalities can be prevented. The increase in seat belt wearing from 97.2 to 98.2 % corresponds to a relative reduction of the non-wearing rate of 35.7 % (2.8 to 1.8 %). The reduction of the number of fatalities associated with this reduction of non-wearing is 25 % of the maximum potential (3.2/12.8), consistent with the tendency for non-wearers to become a more high-risk group the higher the rate of seat belt wearing gets. The application of the other results presented in Table 3 is somewhat less complicated. The results of Ferris yet al. (2013) have been applied to estimate the effects of random breath testing. Drinking and driving has declined over time in Norway (Elvik 2016C). One might therefore expect drinking drivers to become a more high-risk group over time, just as non-wearers of seat belts have become. The increase in fatality risk associated with a certain
The potential for reducing the number of killed or seriously injured road users in Norway in the period 2018-2030
38 Copyright © Institute of Transport Economics, 2020
blood alcohol concentration would then tend to increase over time. This, however, does not appear to be the case. Based on a roadside survey in 1981-82, Glad (1985) estimated the relative fatality rate of a drinking driver (compared to a sober driver) to 158. Gjerde et al. (2011) estimated a relative fatality rate of 69, based on a roadside survey in 2005-06. A similar roadside survey in 2008-09 indicated a relative fatality rate of 125 (Gjerde et al. 2013). Both these comparatively recent studies indicate a lower relative fatality rate than in 1981-82. Based on this, the road accident modification factors of Ferris et al. (2013) have been applied directly, not adjusting for changes in risk associated with changes in the prevalence of drinking and driving. As far as speed enforcement is concerned, a model developed by Elvik (2015B) has been applied to estimate changes in the rate of speeding associated with changes in the amount of enforcement. Changes in the rate of speeding have been converted to change in the number of road accidents by applying the comprehensive and unified framework for estimating changes in safety associated with changes in speed developed by Elvik (2019; published after the publication of this report in Norwegian). For drug enforcement, the road accident modification factors provided by Cameron et al. (2016) have been applied. Studies reviewed by Elvik (2018) indicate that driving under the influence of drugs may be subject to a selection mechanism, akin to the one observed for not wearing seat belts. The fewer drug-influenced drivers there are (as a percentage of all drivers), the higher is their road accident rate. Unfortunately, there are many ways in which such a relationship can arise. It has therefore not been assumed that those who continue to drive under the influence of drugs after an increase in enforcement have a higher risk than those who stop driving under the influence of drugs.
4.4 A comprehensive and unified framework for analysing the effects on traffic injury of measures influencing speed
This section is based on a paper published by Elvik (2019) after the publication of the report in Norwegian. The model used to estimate the effects on safety of measures that influence speed can be explained by reference to Table 4. It is assumed that the speed of traffic follows a normal distribution. It is further assumed that the entire speed distribution is contained within plus or minus three standard deviations from the mean speed of traffic. This may not always be exactly correct, but it is easy to modify the model by assuming, for example, a slightly skewed distribution with a tail of high speeds. However, working with the normal distribution is easy and preferable to making ad hoc assumptions about speed distribution in every study. All you need to know in order to define the full distribution is mean speed and an indicator of its dispersion. A statistic widely published is the 85th percentile of speed, i.e. the speed below which 85 % of traffic drives. The difference between 85 percentile speed and mean speed (assumed to be equal to median speed) corresponds to 1.04 standard deviations. Table 4 uses the speed limit of 80 km/h as example. The mean speed of traffic is 76.1 km/h. To model changes in speed, the speed distribution is divided into 12 intervals, each of them representing half a standard deviation. There are six intervals below the mean speed of traffic, six intervals above the mean speed of traffic. The mean speed of traffic in any interval is assumed to equal the mean of the speeds at the lower and upper limits of the interval.
The Potential for Reducing the Number of Killed or Seriously Injured Road Users in Norway in the Period 2018-2030
Copyright © Institute of Transport Economics, 2020 39
For each interval of the speed distribution, the relative rate of fatalities, serious injuries and slight injuries for drivers driving at the mean speed within that interval has been estimated. The relative rate of fatalities and injuries has been set to 1.000 at the mean speed of traffic. These relative rates are based on a review of the relationship between speed and road accident involvement at the aggregate and individual levels (Elvik et al. 2019), suggesting that there is great similarity between, on the one hand, changes in mean speed of traffic and changes in the number of road accidents, and, on the other hand, a driver’s speed and his or her relative road accident rate. The exponential model of the relationship between speed and road safety has been used to estimates the relative rates. The exponential model has been preferred to the power model for two reasons. First, it fits individual driver data better than the power model. Second, it fits better to high-speed data points than the power model, which underestimates the steepness of the relationship between speed and safety at high speeds. Coefficients of 0.08 for fatalities (Elvik et al. 2019), 0.06 for serious injuries (Elvik 2014) and 0.04 for slight injuries (Elvik 2014) have been applied. For a driver in the first interval above the mean, relative fatality rate is:
Relative fatality rate (0-0.5 above mean) = 𝑒𝑒�(77.9−76.1)∙0.08� = 1.155. Relative rates of serious and slight injuries have been estimated the same way, using the coefficients of 0.06 and 0.04, respectively. The contribution of drivers in each speed interval to the total number of fatalities or injuries is estimated by multiplying relative rate with the percentage of traffic belonging to an interval. For the uppermost interval, the contribution to fatalities becomes: 0.6 ∙ 4.874 = 2.92. It should be noted that this update was published after the report was published in Norwegian. Thus, in the report, coefficients of 0.065 for fatalities, 0.061 for serious injuries and 0.028 for slight injuries were applied. The model was used to estimate the effects of speed enforcement, increased fixed penalties and Intelligent Speed Adaptation (ISA). Elvik (2015B) estimated the relationship between changes in the level of enforcement and changes in the rate of speeding. Changes in the level of enforcement was defined as the natural logarithm of the number of citations for speeding. The coefficient associated with this variable was -0.349. Doubling enforcement (doubling the number of citations) has a value of 0.693 (= ln(2)). Such an increase in enforcement will reduce speeding by 𝑒𝑒(0.693 ∙ −0.349) = 0.785 = 21.5 %. Three levels of violations were identified, and the coefficient associated with a one-step increase in the severity of a violation was -0.011. The severity levels for violations were speeding by 6-10 km/h (level 1), by 11-15 km/h (level 2) and by 16 km/h or more (level 3). Applying these levels, the expected decline in speeding if enforcement increases by 100 % is estimated to, respectively, 22.3 %, 23.2 % and 24.0 %. Violations have been defined as speeds in the intervals 1-1.5, 1.5-2, 2-2.5 and 2.5-3 standard deviations above the mean speed of traffic. At the speed limit of 80 km/h, the mean speed of traffic in these intervals is, respectively, 85.1, 88.7, 92.3 and 95.9 km/h. It has been assumed that the police tolerates minor speeding of up to about 5 km/h above the speed limit.
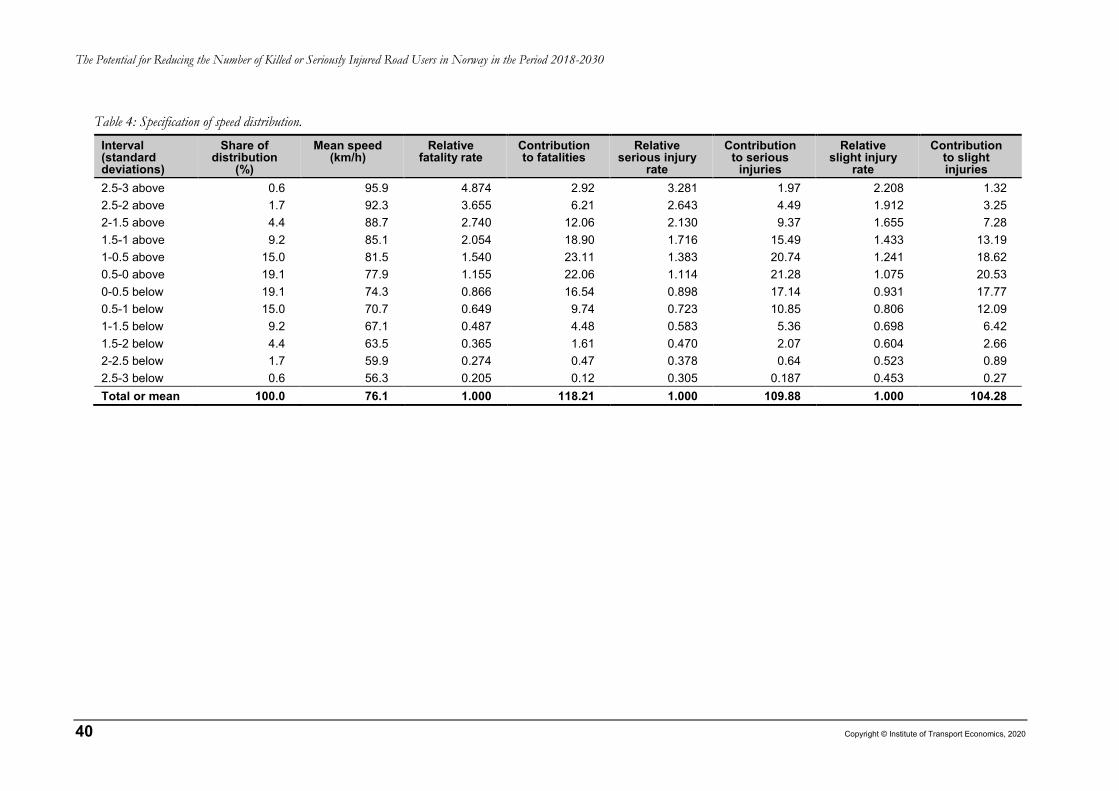
The Potential for Reducing the Number of Killed or Seriously Injured Road Users in Norway in the Period 2018-2030
40 Copyright © Institute of Transport Economics, 2020
Table 4: Specification of speed distribution.
Interval (standard deviations)
Share of distribution
(%)
Mean speed (km/h)
Relative fatality rate
Contribution to fatalities
Relative serious injury
rate
Contribution to serious
injuries
Relative slight injury
rate
Contribution to slight injuries
2.5-3 above 0.6 95.9 4.874 2.92 3.281 1.97 2.208 1.32 2.5-2 above 1.7 92.3 3.655 6.21 2.643 4.49 1.912 3.25 2-1.5 above 4.4 88.7 2.740 12.06 2.130 9.37 1.655 7.28 1.5-1 above 9.2 85.1 2.054 18.90 1.716 15.49 1.433 13.19 1-0.5 above 15.0 81.5 1.540 23.11 1.383 20.74 1.241 18.62 0.5-0 above 19.1 77.9 1.155 22.06 1.114 21.28 1.075 20.53 0-0.5 below 19.1 74.3 0.866 16.54 0.898 17.14 0.931 17.77 0.5-1 below 15.0 70.7 0.649 9.74 0.723 10.85 0.806 12.09 1-1.5 below 9.2 67.1 0.487 4.48 0.583 5.36 0.698 6.42 1.5-2 below 4.4 63.5 0.365 1.61 0.470 2.07 0.604 2.66 2-2.5 below 1.7 59.9 0.274 0.47 0.378 0.64 0.523 0.89 2.5-3 below 0.6 56.3 0.205 0.12 0.305 0.187 0.453 0.27 Total or mean 100.0 76.1 1.000 118.21 1.000 109.88 1.000 104.28
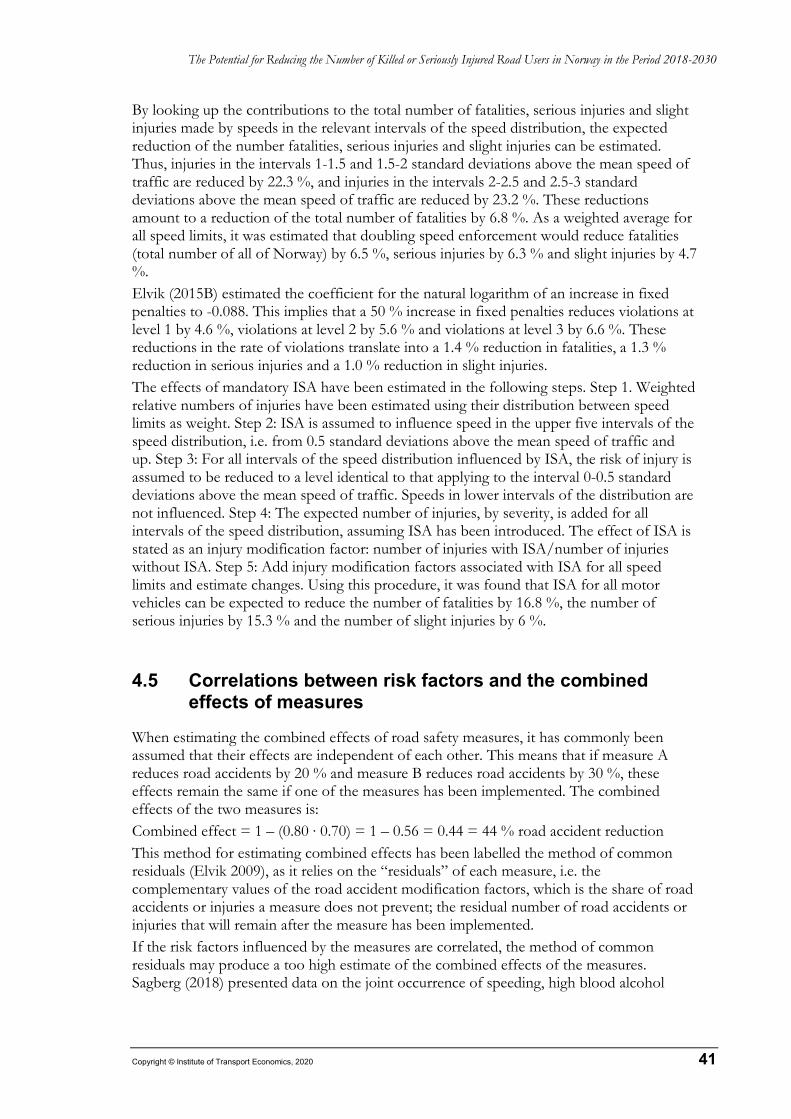
The Potential for Reducing the Number of Killed or Seriously Injured Road Users in Norway in the Period 2018-2030
Copyright © Institute of Transport Economics, 2020 41
By looking up the contributions to the total number of fatalities, serious injuries and slight injuries made by speeds in the relevant intervals of the speed distribution, the expected reduction of the number fatalities, serious injuries and slight injuries can be estimated. Thus, injuries in the intervals 1-1.5 and 1.5-2 standard deviations above the mean speed of traffic are reduced by 22.3 %, and injuries in the intervals 2-2.5 and 2.5-3 standard deviations above the mean speed of traffic are reduced by 23.2 %. These reductions amount to a reduction of the total number of fatalities by 6.8 %. As a weighted average for all speed limits, it was estimated that doubling speed enforcement would reduce fatalities (total number of all of Norway) by 6.5 %, serious injuries by 6.3 % and slight injuries by 4.7 %. Elvik (2015B) estimated the coefficient for the natural logarithm of an increase in fixed penalties to -0.088. This implies that a 50 % increase in fixed penalties reduces violations at level 1 by 4.6 %, violations at level 2 by 5.6 % and violations at level 3 by 6.6 %. These reductions in the rate of violations translate into a 1.4 % reduction in fatalities, a 1.3 % reduction in serious injuries and a 1.0 % reduction in slight injuries. The effects of mandatory ISA have been estimated in the following steps. Step 1. Weighted relative numbers of injuries have been estimated using their distribution between speed limits as weight. Step 2: ISA is assumed to influence speed in the upper five intervals of the speed distribution, i.e. from 0.5 standard deviations above the mean speed of traffic and up. Step 3: For all intervals of the speed distribution influenced by ISA, the risk of injury is assumed to be reduced to a level identical to that applying to the interval 0-0.5 standard deviations above the mean speed of traffic. Speeds in lower intervals of the distribution are not influenced. Step 4: The expected number of injuries, by severity, is added for all intervals of the speed distribution, assuming ISA has been introduced. The effect of ISA is stated as an injury modification factor: number of injuries with ISA/number of injuries without ISA. Step 5: Add injury modification factors associated with ISA for all speed limits and estimate changes. Using this procedure, it was found that ISA for all motor vehicles can be expected to reduce the number of fatalities by 16.8 %, the number of serious injuries by 15.3 % and the number of slight injuries by 6 %.
4.5 Correlations between risk factors and the combined effects of measures
When estimating the combined effects of road safety measures, it has commonly been assumed that their effects are independent of each other. This means that if measure A reduces road accidents by 20 % and measure B reduces road accidents by 30 %, these effects remain the same if one of the measures has been implemented. The combined effects of the two measures is: Combined effect = 1 – (0.80 ∙ 0.70) = 1 – 0.56 = 0.44 = 44 % road accident reduction This method for estimating combined effects has been labelled the method of common residuals (Elvik 2009), as it relies on the “residuals” of each measure, i.e. the complementary values of the road accident modification factors, which is the share of road accidents or injuries a measure does not prevent; the residual number of road accidents or injuries that will remain after the measure has been implemented. If the risk factors influenced by the measures are correlated, the method of common residuals may produce a too high estimate of the combined effects of the measures. Sagberg (2018) presented data on the joint occurrence of speeding, high blood alcohol
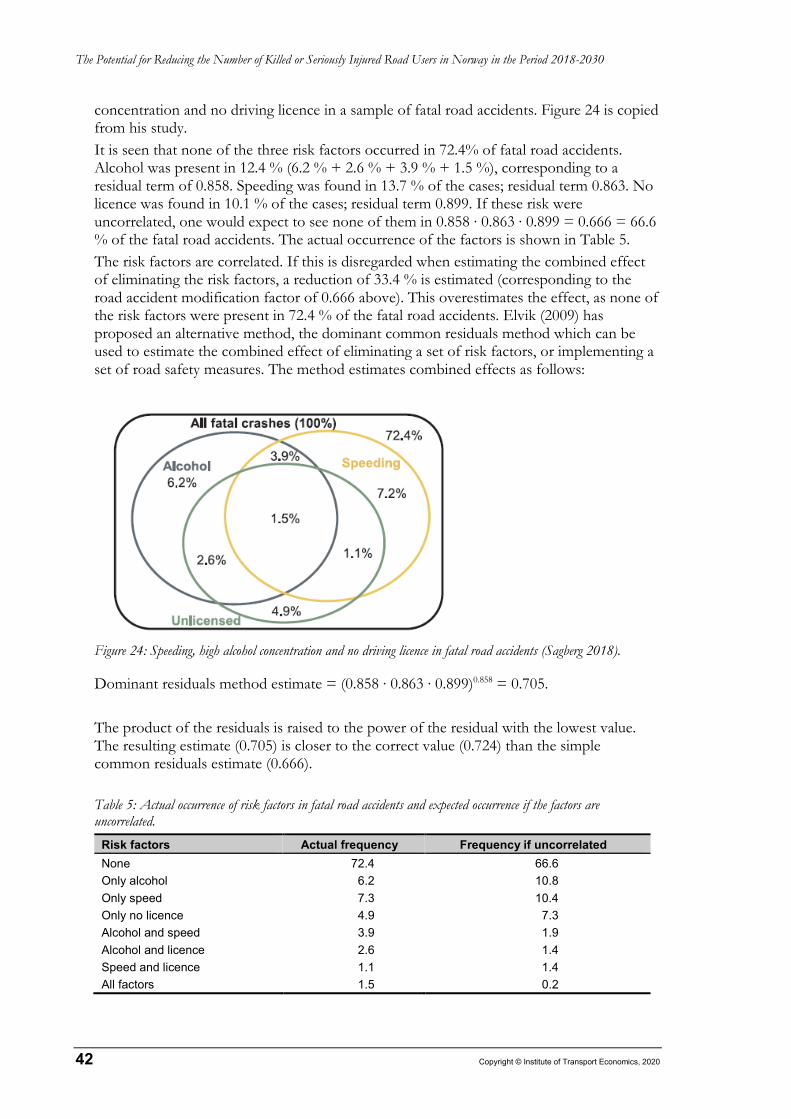
The Potential for Reducing the Number of Killed or Seriously Injured Road Users in Norway in the Period 2018-2030
42 Copyright © Institute of Transport Economics, 2020
concentration and no driving licence in a sample of fatal road accidents. Figure 24 is copied from his study. It is seen that none of the three risk factors occurred in 72.4% of fatal road accidents. Alcohol was present in 12.4 % (6.2 % + 2.6 % + 3.9 % + 1.5 %), corresponding to a residual term of 0.858. Speeding was found in 13.7 % of the cases; residual term 0.863. No licence was found in 10.1 % of the cases; residual term 0.899. If these risk were uncorrelated, one would expect to see none of them in 0.858 ∙ 0.863 ∙ 0.899 = 0.666 = 66.6 % of the fatal road accidents. The actual occurrence of the factors is shown in Table 5. The risk factors are correlated. If this is disregarded when estimating the combined effect of eliminating the risk factors, a reduction of 33.4 % is estimated (corresponding to the road accident modification factor of 0.666 above). This overestimates the effect, as none of the risk factors were present in 72.4 % of the fatal road accidents. Elvik (2009) has proposed an alternative method, the dominant common residuals method which can be used to estimate the combined effect of eliminating a set of risk factors, or implementing a set of road safety measures. The method estimates combined effects as follows:
Figure 24: Speeding, high alcohol concentration and no driving licence in fatal road accidents (Sagberg 2018).
Dominant residuals method estimate = (0.858 ∙ 0.863 ∙ 0.899)0.858 = 0.705. The product of the residuals is raised to the power of the residual with the lowest value. The resulting estimate (0.705) is closer to the correct value (0.724) than the simple common residuals estimate (0.666).
Table 5: Actual occurrence of risk factors in fatal road accidents and expected occurrence if the factors are uncorrelated.
Risk factors Actual frequency Frequency if uncorrelated None 72.4 66.6 Only alcohol 6.2 10.8 Only speed 7.3 10.4 Only no licence 4.9 7.3 Alcohol and speed 3.9 1.9 Alcohol and licence 2.6 1.4 Speed and licence 1.1 1.4 All factors 1.5 0.2
The Potential for Reducing the Number of Killed or Seriously Injured Road Users in Norway in the Period 2018-2030
Copyright © Institute of Transport Economics, 2020 43
5 Effects of road safety measures
This chapter presents the estimated effects of the road safety measures on the number of killed or seriously injured road users. Effects are presented for 2024 and 2030. It is discussed whether the targets for reducing the number of killed or seriously injured road users that have been set for these years can be realised or not. The potential for reducing the number of injuries sustained by pedestrians and cyclists is discussed, based on two studies made in the city of Oslo in 2014 and 2016 (Melhuus et al. 2015, 2017).
5.1 Estimated reduction of the number of killed or seriously injured road users in 2024 and 2030
The basis of the estimates will first be summarised: 1. Estimates are based on a counterfactual trend projected to 2024 and 2030. This
trend contains the expected effects of a continued normal renewal of the car fleet, but no new safety measures.
2. According to the counterfactual trend, the number of fatalities is estimated to be 89 in 2030 and the number of seriously injured road users 523 in 2030.
3. Road safety measures have been divided into three main groups: (1) Road-related measures; (2) Vehicle-related measures and (3) Enforcement, including safety management in transport companies. In each group, the dominant common residuals method (see section 4.5) was applied to estimate the combined effects of the road safety measures.
4. The combined effects of the measures for all three groups put together have been estimated both by the common residuals method and the dominant common residuals method.
5. Four alternative packages of measures have been developed: (1) Maximum use of measures that are currently used, but no new measures are introduced; (2) New technology, meaning that ISA, alcohol ignition interlock and seat belt ignition interlock are introduced. These measures replace speed enforcement, random breath testing and seat belt enforcement: (3) Complete renewal of the car fleet, i.e. the current car fleet is replaced by a car fleet that have the safety new cars can be expected to have by 2030 based on a projection of the recent trend in car safety; (4) New technology and new car fleet, which is a combination of alternatives 2 and 3. A more detailed description of which measures are included in each alternative is given later in the chapter.
5.1.1 First order effects The term first order effects denotes the effects each road safety measure has if implemented as a separate measure. Table 6 lists the first order effects of the measures.

The Potential for Reducing the Number of Killed or Seriously Injured Road Users in Norway in the Period 2018-2030
44 Copyright © Institute of Transport Economics, 2020
Table 6: Estimated first order effects of the measures on fatalities and serious injuries in 2024 and 2030
Reduction in 2024 Reduction in 2030 Measure
Maximum use (2024 and 2030)
Killed
Serious injury
Killed
Serious injury
Expected without measures (but with normal car fleet renewal): 102.6 563.2 88.7 522.9 Road-related measures1
New motorways 177 km; 230 km 1.9 3.6 2.4 4.7 Median barriers 38 km; 50 km 0.2 0.7 0.2 1.3 Median rumble strips 2695 km; 5005 km 1.4 4.1 2.2 7.0 Road lighting 6760 mill. veh.km; 12560 mill. veh.km 3.2 12.0 5.1 20.7 Roundabouts 1050; 1950 1.4 4.9 1.6 5.6 Upgrade pedestrian crossings 525; 975 0.5 3.2 0.6 3.7 Speed limit 80 to 70 km/t 30% of roads with 80 km/t 8.5 30.8 7.4 28.6
Enforcement2 Speed enforcement Doubling of current level 6.7 35.5 5.8 32.9 Seat belt enforcement Doubling of current level 2.8 4.5 2.4 4.2 Random breath testing Doubling of current level 1.7 4.8 1.5 4.4 Drug enforcement Doubling of current level 0.5 2.0 0.5 1.8 Service-/rest hour enforcement Doubling of current level 1.9 4.4 1.7 4.1 Speed cameras 1225 mill. veh.km; 2275 mill. veh.km 3.5 11.1 5.7 19.2 Section control 285 mill. veh.km; 2860 mill. veh.km 3.2 10.5 5.2 18.1 Increased fixed penalties 50% increase 1.4 7.3 1.2 6.8 Safety management in companies
Highest level in 92 % of companies 14.3 23.3 12.4 21.6
Vehicle-related measures3 Electronic stability control 96→100; 99→100 0.8 2.4 0.2 0.5 Frontal impact air bags 99→100; 100→100 1.4 3.9 0.5 1.6 Side impact air bags 95→100; 99→100 0.2 0.8 0.0 0.1 Crashworthiness 0.871→0.771; 0.853→0.771 7.8 37.6 6.8 34.9 Pedestrian impact protection 0.748→0.645; 0.702→0.645 0.8 11.2 0.7 10.4 Seat belt reminder 94.4→100; 99.1→100 0.4 1.2 0.0 0.2 Autonomous cruise control 27→100; 53→100 2.2 10.8 1.3 6.5 Emergency brake assist 92.2→100; 97.8→100 0.2 0.8 0.1 0.2 Lane departure warning 28.5→100; 54.4→100 2.6 12.6 1.5 7.7 Speed alert 34.7→100; 57.2→100 3.9 17.2 2.2 10.7 E-call 52.6→100; 79.2→100 0.9 0.0 0.3 0.0 Electronic driving licence 37.7→100; 70→100 2.7 14.6 1.1 5.8 Faster renewal of car fleet 0.96→0.94; 0.88→0.80 1.5 7.2 4.3 22.4
Measures that eliminate speeding, drinking and driving and non-use of seat belts; complete renewal of car fleet Mandatory ISA 100% of vehicles 17.2 86.2 14.9 80.0 Alcohol ignition interlock 100% of vehicles 10.3 28.2 8.9 26.1 Seat belt ignition interlock 100% of vehicles 11.0 18.0 9.5 16.7 Complete renewal of car fleet 100% of vehicles 21.4 102.6 15.4 79.5
1 The numbers state km or road or million vehicle km influenced by the measure in 2024 (first number) or 2030 (second number). 2 The numbers state vehicle km of travel in 2024 (first) or 2030 (second) influenced by speed cameras or section control. 3 The numbers state the share of vehicle km influenced by the measure in 2024 (first) or 2030 (second).
For the years 2024 and 2030, targets have been set for the reduction of the number of killed or seriously injured road users. The first order effects listed in table 6 are the effects the measures have one-by-one, before their combined effects have been estimated. One cannot find the total effects of the measures by summing the numbers given in Table 6.
The Potential for Reducing the Number of Killed or Seriously Injured Road Users in Norway in the Period 2018-2030
Copyright © Institute of Transport Economics, 2020 45
Table 6 indicates that most measures can bring about a small reduction in the number of road road accident fatalities and serious injuries. To obtain a large reduction, all measures have to be implemented. A few measures have the potential to bring about a larger reduction of fatalities and serious injuries. This applies to safety management in transport companies, mandatory ISA, alcohol ignition interlock, seat belt ignition interlock and complete renewal of the car fleet. These measures are not realistic, but show the potential for improving road safety by eliminating speeding, drinking and driving and non-use of seat belts; as well getting rid of all cars that do not have state-of-the art safety features. For most measures, the estimated reduction of the number of killed or seriously injured road users is smaller in 2030 than in 2024. There are two reasons for this. In the first place, the number of killed or seriously injured road users is expected to decline even if no new road safety measures are introduced. All else equal, the number of killed or seriously injured road users a measure can influence will be smaller in 2030 than in 2024 and smaller in 2024 than in 2018. In the second place, the effects of vehicle related measures is defined as the difference between the effects they have at 100 % market penetration and the effects they have at the current market penetration rate. Thus, as market penetration approaches 100 %, the remaining potential effect becomes smaller and smaller. For some measures, the estimated decline in fatalities and serious injuries is larger in 2030 than in 2024. This applies to measures that are introduced gradually throughout the period 2018-2030. As an example, it is not realistic to build all new motorways in a single year; rather the expansion of motorways takes place gradually until the final year of the study, 2030. More motorways will be completed in 2030 than in 2024. Effects have been estimated on an annual basis, but are presented only for the years 2024 and 2030, as these are the years for which policy targets have been set. No great error is made by interpolating linearly to obtain results for other years.
5.1.2 Alternative combinations of measures Table 7 shows the measures that are included in the four alternative combinations of measures that have been developed. These alternatives are:
1. Maximum use of current measures: All measures currently in use are implemented to the maximum extent. This includes, road-related measures, most vehicle-related measures and enforcement. No new measures are introduced.
2. New technology: 100 % use of ISA, alcolock and seat belt lock is included. Most measures in alternative 1 are also included, except for speed enforcement, random breath testing, seat belt enforcement, speed cameras, section control, seat belt reminder and speed alert.
3. Car fleet renewal: None of vehicle-related measures are included; these are replaced by a single measure: complete renewal of the car fleet. Road-related measure and enforcement are included as in alternative 1.
4. New technology and new cars: Complete renewal of the car fleet is included, as well as the new technologies included in alternative 2. Road-related measures are included, as well as those enforcement measures that are not replaced by new technology.

The Potential for Reducing the Number of Killed or Seriously Injured Road Users in Norway in the Period 2018-2030
46 Copyright © Institute of Transport Economics, 2020
Table 7: Alternative combinations of road safety measures. Measures included = X
Measure
Maximum use (2024 and 2030)
1 Current
measures maximum
2 New
technology
3 Renewal
of car fleet
4 New technology
and new car fleet
New motorways 177 km; 230 km X X X X Median barriers 38 km; 50 km X X X X Median rumble strips 2695 km; 5005 km X X X X Road lighting 6760 mill. veh.km; 12560
mill. veh.km X X X X
Roundabouts 1050; 1950 X X X X Upgrade pedestrian crossings 525; 975 X X X X Speed limit 80 to 70 km/t 30% of roads with 80 km/t X X X X Speed enforcement Doubling of current level X X Seat belt enforcement Doubling of current level X X Random breath testing Doubling of current level X X Drug enforcement Doubling of current level X X X X Service-/rest hour enforcement
Doubling of current level X X X X
Speed cameras 1225 mill. veh.km; 2275 mill. veh.km
X X
Section control 285 mill. veh.km; 2860 mill. veh.km
X X
Increased fixed penalties 50% increase X X X X Safety management in companies
Highest level in 92 % of companies
X X X X
Electronic stability control 96→100; 99→100 X X Frontal impact air bags 99→100; 100→100 X X Side impact air bags 95→100; 99→100 X X Crashworthiness 0.871→0.771;
0.853→0.771 X X
Pedestrian impact protection 0.748→0.645; 0.702→0.645
X X
Seat belt reminder 94.4→100; 99.1→100 X Autonomous cruise control 27→100; 53→100 X X Emergency brake assist 92.2→100; 97.8→100 X X Lane departure warning 28.5→100; 54.4→100 X X Speed alert 34.7→100; 57.2→100 X E-call 52.6→100; 79.2→100 X X Electronic driving licence 37.7→100; 70→100 X X Faster renewal of car fleet 0.96→0.94; 0.88→0.80 X X
Measures that eliminate speeding, drinking and driving and non-use of seat belts; complete renewal of car fleet Mandatory ISA 100% of vehicles X X Alcohol ignition interlock 100% of vehicles X X Seat belt ignition interlock 100% of vehicles X X Complete renew3al of car fleet 100% of vehicles X X
5.1.3 Alternative 1: Current measures maximum Figure 25 shows the estimated change in the number of killed or seriously injured road users in 2024 and 2030 if currently used road safety measures are implemented to their maximum conceivable extent.

The Potential for Reducing the Number of Killed or Seriously Injured Road Users in Norway in the Period 2018-2030
Copyright © Institute of Transport Economics, 2020 47
Figure 25: Maximum potential for reducing the number of killed or seriously injured road users by 2024 and 2030 by maximum use if currently used road safety measures.
A decline in the number of killed or seriously injured road users is expected to occur even without new road safety measures. By maximum use of currently used road safety measures, the number of fatalities can be reduced to 50-60 in 2024 and 41-50 in 2030. The number of seriously injured road users can be reduced to 351-382 in 2024 and 311-340 in 2030. As mentioned in Chapter 4, the dominant common residuals method is the most realistic. According to estimates based on this method, it is possible to reduce the number of killed or seriously injured road users to 50 + 340 = 390 by 2030. It is clear that the number of fatalities can be reduced to well below 100 by 2030. The number of fatalities was 106 in 2017 and 108 in 2018. Cutting these numbers by half appears to be possible.
5.1.4 Alternative 2: New technology Estimates applying the dominant common residuals method indicate that eliminating speeding, drinking and driving and non-use of seat belts can reduce the number of fatalities by 28 %, the number of serious injuries by 19 % and the number of slight injuries by 10 %. These reductions are smaller than previous estimates have suggested. An earlier version of the analyses presented in this report (Elvik and Høye 2015) found that the number of fatalities could be reduced by 33 % and the number of serious injuries by 25 % according to the dominant common residuals method. An estimate based on data for 2010 (Vaa, Assum and Elvik 2012) indicated a potential reduction of the number of fatalities by 35 %. Elvik (1997) relying on data for the middle of the 1990s estimated that eliminating speeding, drinking and driving and non-use of seat belts could reduce the number of fatalities by 36 %. Thus, in successive studies, the potential for reducing the number of fatalities has gone from 36 % (1997), to 35 % (2012), to 33 % (2015) and finally 28 % (2018).
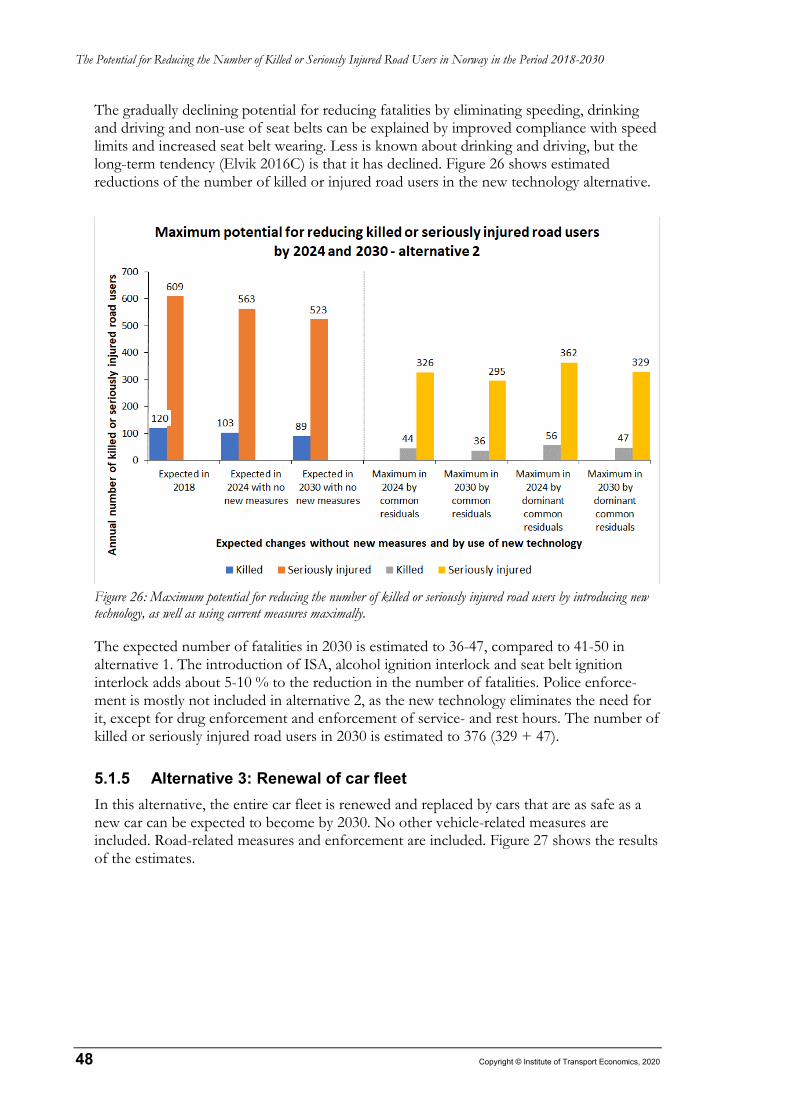
The Potential for Reducing the Number of Killed or Seriously Injured Road Users in Norway in the Period 2018-2030
48 Copyright © Institute of Transport Economics, 2020
The gradually declining potential for reducing fatalities by eliminating speeding, drinking and driving and non-use of seat belts can be explained by improved compliance with speed limits and increased seat belt wearing. Less is known about drinking and driving, but the long-term tendency (Elvik 2016C) is that it has declined. Figure 26 shows estimated reductions of the number of killed or injured road users in the new technology alternative.
Figure 26: Maximum potential for reducing the number of killed or seriously injured road users by introducing new technology, as well as using current measures maximally.
The expected number of fatalities in 2030 is estimated to 36-47, compared to 41-50 in alternative 1. The introduction of ISA, alcohol ignition interlock and seat belt ignition interlock adds about 5-10 % to the reduction in the number of fatalities. Police enforce-ment is mostly not included in alternative 2, as the new technology eliminates the need for it, except for drug enforcement and enforcement of service- and rest hours. The number of killed or seriously injured road users in 2030 is estimated to 376 (329 + 47).
5.1.5 Alternative 3: Renewal of car fleet In this alternative, the entire car fleet is renewed and replaced by cars that are as safe as a new car can be expected to become by 2030. No other vehicle-related measures are included. Road-related measures and enforcement are included. Figure 27 shows the results of the estimates.
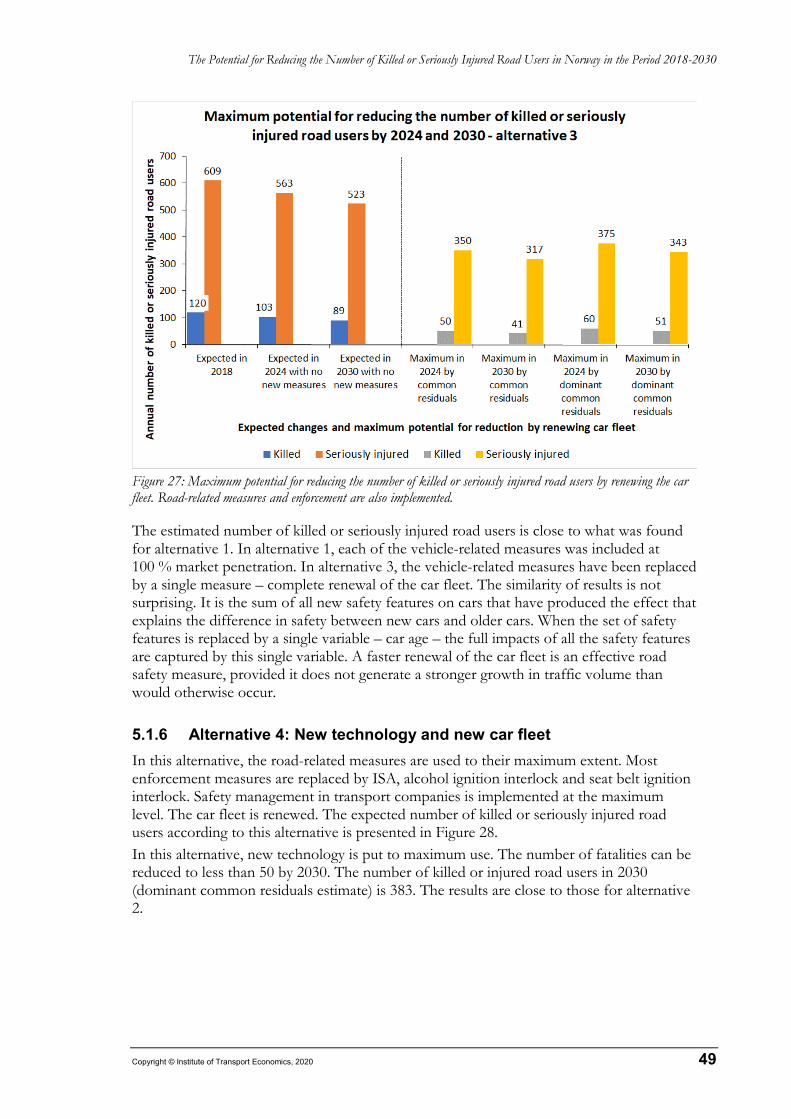
The Potential for Reducing the Number of Killed or Seriously Injured Road Users in Norway in the Period 2018-2030
Copyright © Institute of Transport Economics, 2020 49
Figure 27: Maximum potential for reducing the number of killed or seriously injured road users by renewing the car fleet. Road-related measures and enforcement are also implemented.
The estimated number of killed or seriously injured road users is close to what was found for alternative 1. In alternative 1, each of the vehicle-related measures was included at 100 % market penetration. In alternative 3, the vehicle-related measures have been replaced by a single measure – complete renewal of the car fleet. The similarity of results is not surprising. It is the sum of all new safety features on cars that have produced the effect that explains the difference in safety between new cars and older cars. When the set of safety features is replaced by a single variable – car age – the full impacts of all the safety features are captured by this single variable. A faster renewal of the car fleet is an effective road safety measure, provided it does not generate a stronger growth in traffic volume than would otherwise occur.
5.1.6 Alternative 4: New technology and new car fleet In this alternative, the road-related measures are used to their maximum extent. Most enforcement measures are replaced by ISA, alcohol ignition interlock and seat belt ignition interlock. Safety management in transport companies is implemented at the maximum level. The car fleet is renewed. The expected number of killed or seriously injured road users according to this alternative is presented in Figure 28. In this alternative, new technology is put to maximum use. The number of fatalities can be reduced to less than 50 by 2030. The number of killed or injured road users in 2030 (dominant common residuals estimate) is 383. The results are close to those for alternative 2.
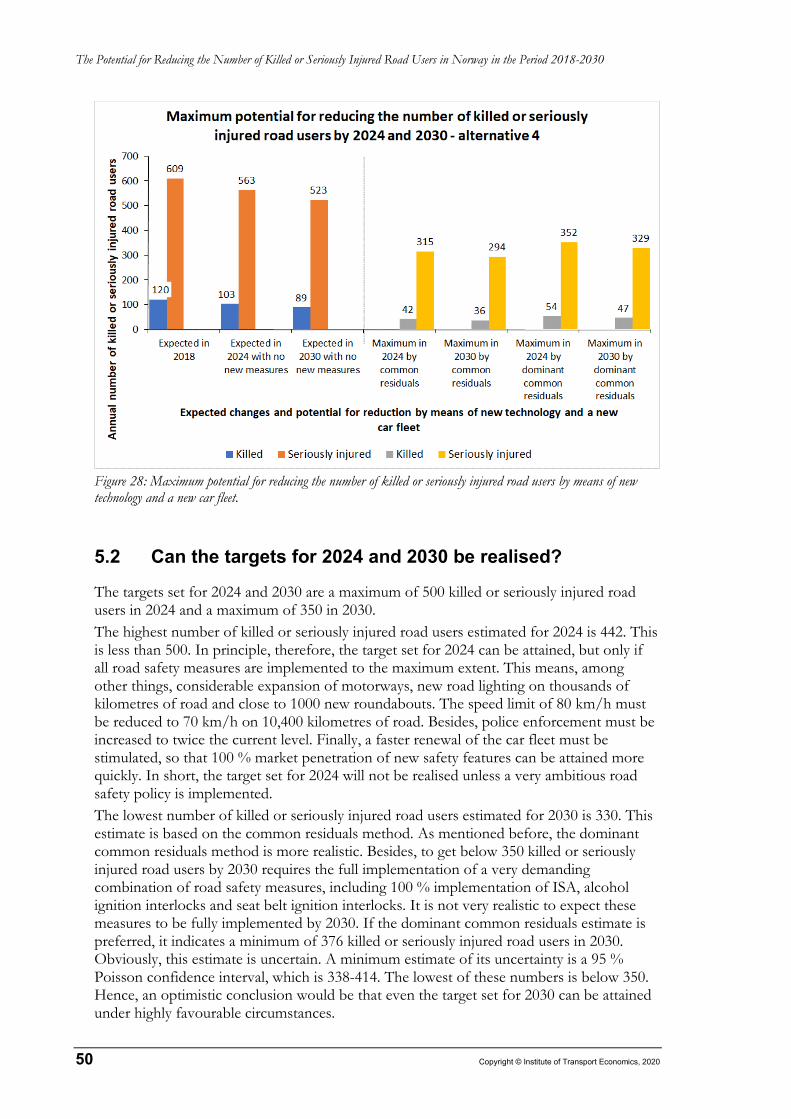
The Potential for Reducing the Number of Killed or Seriously Injured Road Users in Norway in the Period 2018-2030
50 Copyright © Institute of Transport Economics, 2020
Figure 28: Maximum potential for reducing the number of killed or seriously injured road users by means of new technology and a new car fleet.
5.2 Can the targets for 2024 and 2030 be realised?
The targets set for 2024 and 2030 are a maximum of 500 killed or seriously injured road users in 2024 and a maximum of 350 in 2030. The highest number of killed or seriously injured road users estimated for 2024 is 442. This is less than 500. In principle, therefore, the target set for 2024 can be attained, but only if all road safety measures are implemented to the maximum extent. This means, among other things, considerable expansion of motorways, new road lighting on thousands of kilometres of road and close to 1000 new roundabouts. The speed limit of 80 km/h must be reduced to 70 km/h on 10,400 kilometres of road. Besides, police enforcement must be increased to twice the current level. Finally, a faster renewal of the car fleet must be stimulated, so that 100 % market penetration of new safety features can be attained more quickly. In short, the target set for 2024 will not be realised unless a very ambitious road safety policy is implemented. The lowest number of killed or seriously injured road users estimated for 2030 is 330. This estimate is based on the common residuals method. As mentioned before, the dominant common residuals method is more realistic. Besides, to get below 350 killed or seriously injured road users by 2030 requires the full implementation of a very demanding combination of road safety measures, including 100 % implementation of ISA, alcohol ignition interlocks and seat belt ignition interlocks. It is not very realistic to expect these measures to be fully implemented by 2030. If the dominant common residuals estimate is preferred, it indicates a minimum of 376 killed or seriously injured road users in 2030. Obviously, this estimate is uncertain. A minimum estimate of its uncertainty is a 95 % Poisson confidence interval, which is 338-414. The lowest of these numbers is below 350. Hence, an optimistic conclusion would be that even the target set for 2030 can be attained under highly favourable circumstances.
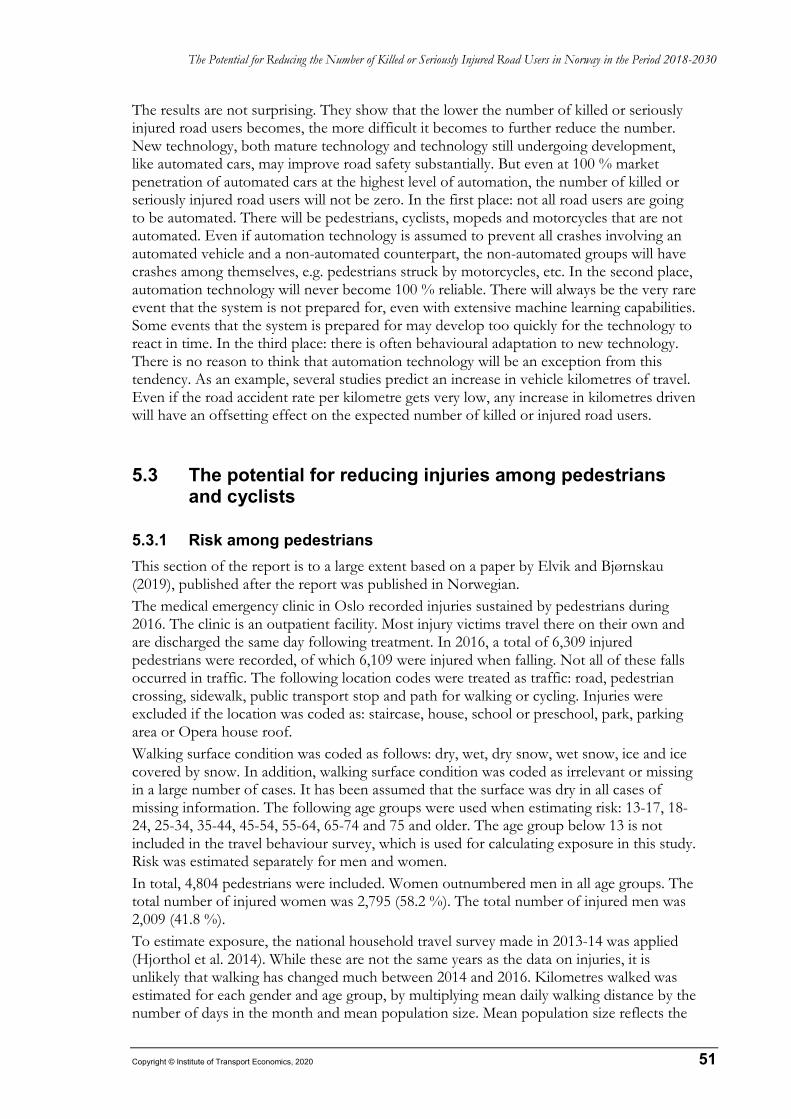
The Potential for Reducing the Number of Killed or Seriously Injured Road Users in Norway in the Period 2018-2030
Copyright © Institute of Transport Economics, 2020 51
The results are not surprising. They show that the lower the number of killed or seriously injured road users becomes, the more difficult it becomes to further reduce the number. New technology, both mature technology and technology still undergoing development, like automated cars, may improve road safety substantially. But even at 100 % market penetration of automated cars at the highest level of automation, the number of killed or seriously injured road users will not be zero. In the first place: not all road users are going to be automated. There will be pedestrians, cyclists, mopeds and motorcycles that are not automated. Even if automation technology is assumed to prevent all crashes involving an automated vehicle and a non-automated counterpart, the non-automated groups will have crashes among themselves, e.g. pedestrians struck by motorcycles, etc. In the second place, automation technology will never become 100 % reliable. There will always be the very rare event that the system is not prepared for, even with extensive machine learning capabilities. Some events that the system is prepared for may develop too quickly for the technology to react in time. In the third place: there is often behavioural adaptation to new technology. There is no reason to think that automation technology will be an exception from this tendency. As an example, several studies predict an increase in vehicle kilometres of travel. Even if the road accident rate per kilometre gets very low, any increase in kilometres driven will have an offsetting effect on the expected number of killed or injured road users.
5.3 The potential for reducing injuries among pedestrians and cyclists
5.3.1 Risk among pedestrians This section of the report is to a large extent based on a paper by Elvik and Bjørnskau (2019), published after the report was published in Norwegian. The medical emergency clinic in Oslo recorded injuries sustained by pedestrians during 2016. The clinic is an outpatient facility. Most injury victims travel there on their own and are discharged the same day following treatment. In 2016, a total of 6,309 injured pedestrians were recorded, of which 6,109 were injured when falling. Not all of these falls occurred in traffic. The following location codes were treated as traffic: road, pedestrian crossing, sidewalk, public transport stop and path for walking or cycling. Injuries were excluded if the location was coded as: staircase, house, school or preschool, park, parking area or Opera house roof. Walking surface condition was coded as follows: dry, wet, dry snow, wet snow, ice and ice covered by snow. In addition, walking surface condition was coded as irrelevant or missing in a large number of cases. It has been assumed that the surface was dry in all cases of missing information. The following age groups were used when estimating risk: 13-17, 18-24, 25-34, 35-44, 45-54, 55-64, 65-74 and 75 and older. The age group below 13 is not included in the travel behaviour survey, which is used for calculating exposure in this study. Risk was estimated separately for men and women. In total, 4,804 pedestrians were included. Women outnumbered men in all age groups. The total number of injured women was 2,795 (58.2 %). The total number of injured men was 2,009 (41.8 %). To estimate exposure, the national household travel survey made in 2013-14 was applied (Hjorthol et al. 2014). While these are not the same years as the data on injuries, it is unlikely that walking has changed much between 2014 and 2016. Kilometres walked was estimated for each gender and age group, by multiplying mean daily walking distance by the number of days in the month and mean population size. Mean population size reflects the
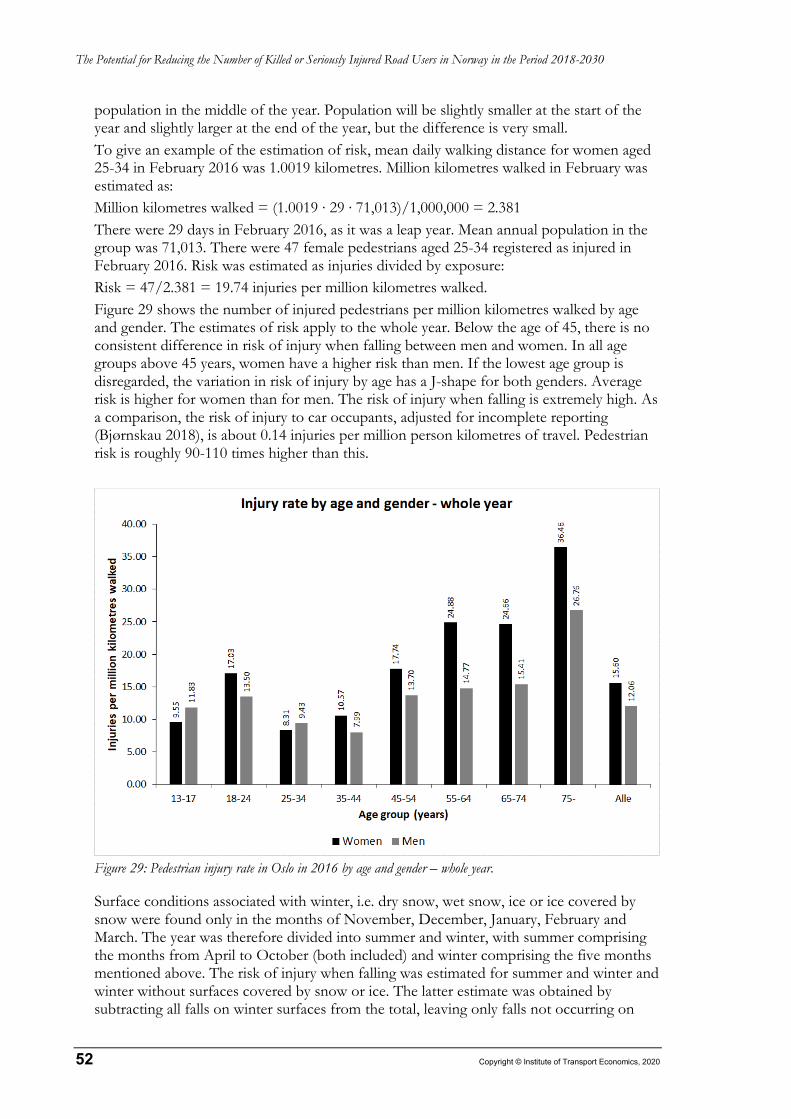
The Potential for Reducing the Number of Killed or Seriously Injured Road Users in Norway in the Period 2018-2030
52 Copyright © Institute of Transport Economics, 2020
population in the middle of the year. Population will be slightly smaller at the start of the year and slightly larger at the end of the year, but the difference is very small. To give an example of the estimation of risk, mean daily walking distance for women aged 25-34 in February 2016 was 1.0019 kilometres. Million kilometres walked in February was estimated as: Million kilometres walked = (1.0019 ∙ 29 ∙ 71,013)/1,000,000 = 2.381 There were 29 days in February 2016, as it was a leap year. Mean annual population in the group was 71,013. There were 47 female pedestrians aged 25-34 registered as injured in February 2016. Risk was estimated as injuries divided by exposure: Risk = 47/2.381 = 19.74 injuries per million kilometres walked. Figure 29 shows the number of injured pedestrians per million kilometres walked by age and gender. The estimates of risk apply to the whole year. Below the age of 45, there is no consistent difference in risk of injury when falling between men and women. In all age groups above 45 years, women have a higher risk than men. If the lowest age group is disregarded, the variation in risk of injury by age has a J-shape for both genders. Average risk is higher for women than for men. The risk of injury when falling is extremely high. As a comparison, the risk of injury to car occupants, adjusted for incomplete reporting (Bjørnskau 2018), is about 0.14 injuries per million person kilometres of travel. Pedestrian risk is roughly 90-110 times higher than this.
Figure 29: Pedestrian injury rate in Oslo in 2016 by age and gender – whole year.
Surface conditions associated with winter, i.e. dry snow, wet snow, ice or ice covered by snow were found only in the months of November, December, January, February and March. The year was therefore divided into summer and winter, with summer comprising the months from April to October (both included) and winter comprising the five months mentioned above. The risk of injury when falling was estimated for summer and winter and winter without surfaces covered by snow or ice. The latter estimate was obtained by subtracting all falls on winter surfaces from the total, leaving only falls not occurring on
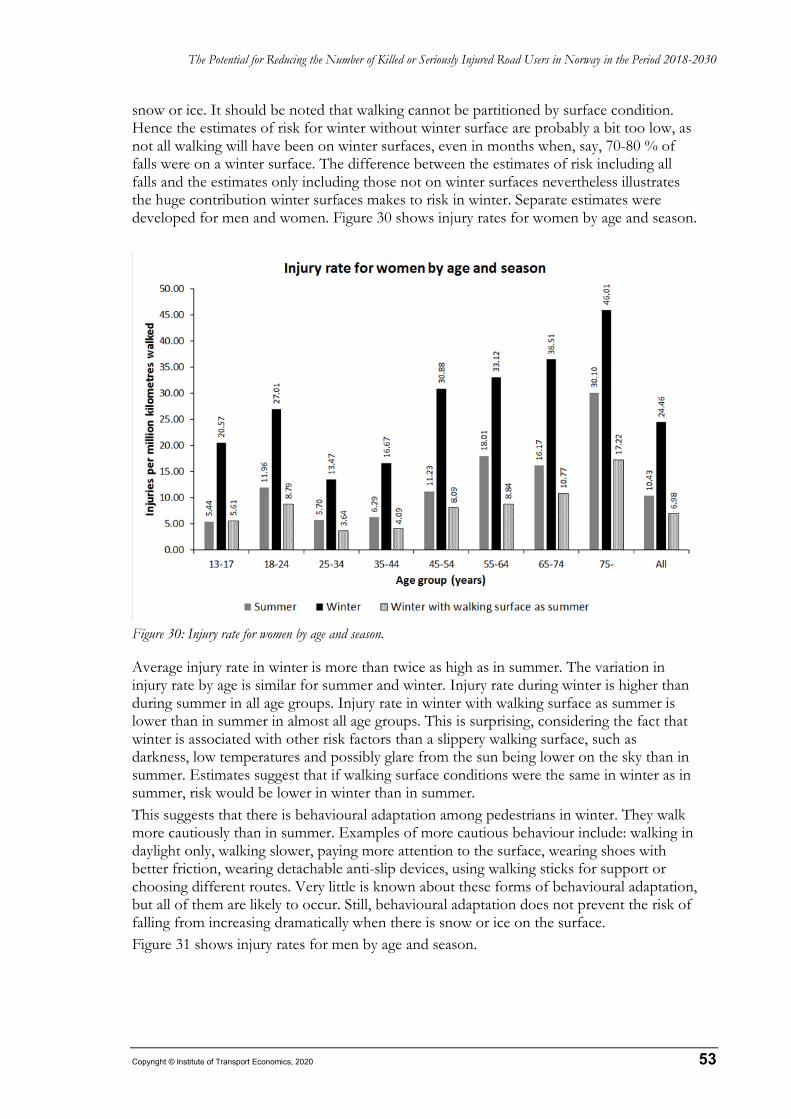
The Potential for Reducing the Number of Killed or Seriously Injured Road Users in Norway in the Period 2018-2030
Copyright © Institute of Transport Economics, 2020 53
snow or ice. It should be noted that walking cannot be partitioned by surface condition. Hence the estimates of risk for winter without winter surface are probably a bit too low, as not all walking will have been on winter surfaces, even in months when, say, 70-80 % of falls were on a winter surface. The difference between the estimates of risk including all falls and the estimates only including those not on winter surfaces nevertheless illustrates the huge contribution winter surfaces makes to risk in winter. Separate estimates were developed for men and women. Figure 30 shows injury rates for women by age and season.
Figure 30: Injury rate for women by age and season.
Average injury rate in winter is more than twice as high as in summer. The variation in injury rate by age is similar for summer and winter. Injury rate during winter is higher than during summer in all age groups. Injury rate in winter with walking surface as summer is lower than in summer in almost all age groups. This is surprising, considering the fact that winter is associated with other risk factors than a slippery walking surface, such as darkness, low temperatures and possibly glare from the sun being lower on the sky than in summer. Estimates suggest that if walking surface conditions were the same in winter as in summer, risk would be lower in winter than in summer. This suggests that there is behavioural adaptation among pedestrians in winter. They walk more cautiously than in summer. Examples of more cautious behaviour include: walking in daylight only, walking slower, paying more attention to the surface, wearing shoes with better friction, wearing detachable anti-slip devices, using walking sticks for support or choosing different routes. Very little is known about these forms of behavioural adaptation, but all of them are likely to occur. Still, behavioural adaptation does not prevent the risk of falling from increasing dramatically when there is snow or ice on the surface. Figure 31 shows injury rates for men by age and season.

The Potential for Reducing the Number of Killed or Seriously Injured Road Users in Norway in the Period 2018-2030
54 Copyright © Institute of Transport Economics, 2020
Figure 31: Injury rate for men by age and season.
The pattern is very similar to that found for women. Risk increases substantially when the surface is covered by snow or ice. The increase in risk of getting injured when falling in winter is, however, slightly smaller among men than among women. This can be seen from Figure 32, which shows relative injury rate in winter by age and gender.
Figure 32: Relative injury rate in winter by age and gender.
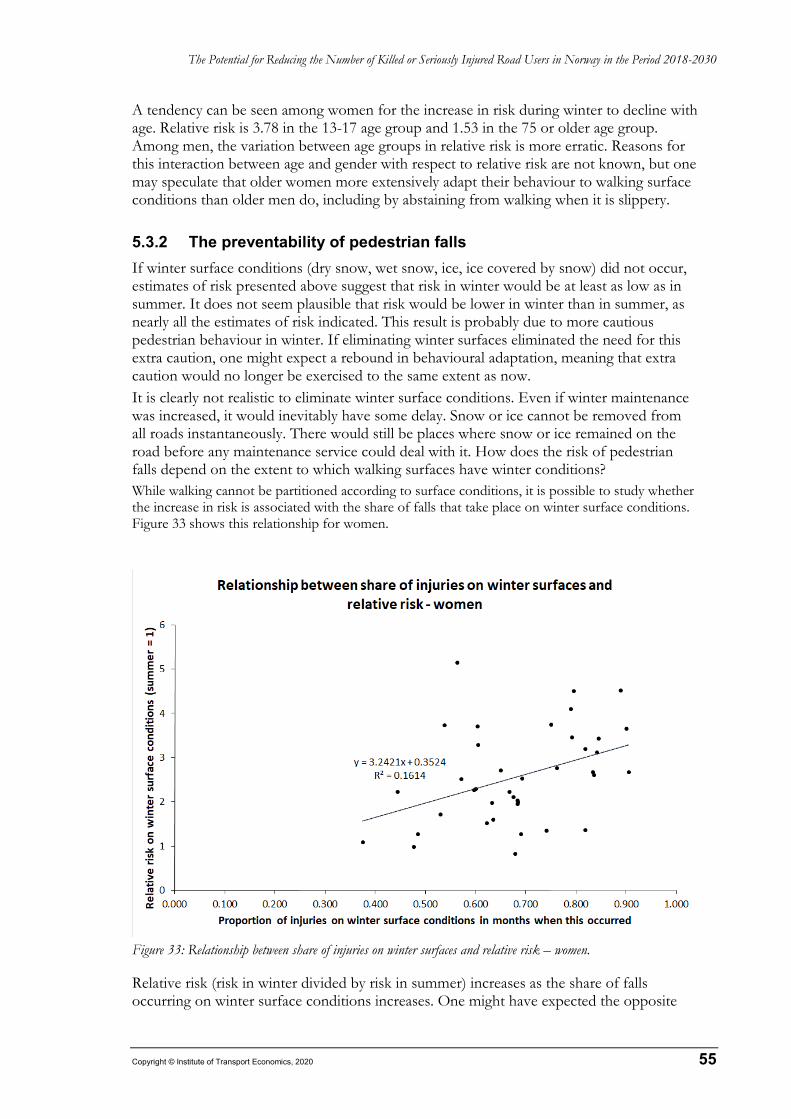
The Potential for Reducing the Number of Killed or Seriously Injured Road Users in Norway in the Period 2018-2030
Copyright © Institute of Transport Economics, 2020 55
A tendency can be seen among women for the increase in risk during winter to decline with age. Relative risk is 3.78 in the 13-17 age group and 1.53 in the 75 or older age group. Among men, the variation between age groups in relative risk is more erratic. Reasons for this interaction between age and gender with respect to relative risk are not known, but one may speculate that older women more extensively adapt their behaviour to walking surface conditions than older men do, including by abstaining from walking when it is slippery.
5.3.2 The preventability of pedestrian falls If winter surface conditions (dry snow, wet snow, ice, ice covered by snow) did not occur, estimates of risk presented above suggest that risk in winter would be at least as low as in summer. It does not seem plausible that risk would be lower in winter than in summer, as nearly all the estimates of risk indicated. This result is probably due to more cautious pedestrian behaviour in winter. If eliminating winter surfaces eliminated the need for this extra caution, one might expect a rebound in behavioural adaptation, meaning that extra caution would no longer be exercised to the same extent as now. It is clearly not realistic to eliminate winter surface conditions. Even if winter maintenance was increased, it would inevitably have some delay. Snow or ice cannot be removed from all roads instantaneously. There would still be places where snow or ice remained on the road before any maintenance service could deal with it. How does the risk of pedestrian falls depend on the extent to which walking surfaces have winter conditions? While walking cannot be partitioned according to surface conditions, it is possible to study whether the increase in risk is associated with the share of falls that take place on winter surface conditions. Figure 33 shows this relationship for women.
Figure 33: Relationship between share of injuries on winter surfaces and relative risk – women.
Relative risk (risk in winter divided by risk in summer) increases as the share of falls occurring on winter surface conditions increases. One might have expected the opposite

The Potential for Reducing the Number of Killed or Seriously Injured Road Users in Norway in the Period 2018-2030
56 Copyright © Institute of Transport Economics, 2020
pattern if there was a learning effect. Surely, pedestrians get more training in walking on winter surface conditions the more common such conditions are. Figure 33 shows, however, that the more prevalent winter surfaces are, the higher is the risk associated with them. The regression equation in Figure 33 suggests that if winter surface conditions were eliminated, risk would be lower than in summer (3.421 ∙ 0 + 0.3524 = 0 + 0.3524 = 0.3524, or 65 % lower risk than in summer). On the average, the proportion of injuries to women in winter occurring on winter surface conditions is 0.713. An older Swedish study (Möller et al. 1991) suggests that by increasing winter maintenance, one may reduce the occurrence of winter surface conditions by up to 50 %. This means that the proportion of injuries on winter surfaces among women would be reduced to 0.356. Applying the regression equation in Figure 33, a reduction of the proportion of injuries on winter surfaces from 0.713 to 0.356 implies a reduction of relative risk of about 43 %. The relationship between the share of injuries occurring on winter surface conditions and relative risk for men is shown in Figure 34. The relationship differs from that found for women.
Figure 34: Relationship between share of injuries on winter surfaces and relative risk – men.
Among men, there is no relationship between the share of injuries occurring on winter surface conditions and relative risk. Thus, reducing the prevalence of winter surface conditions would apparently not reduce relative risk in winter among men. It is obviously not possible to interpret the relationships in Figures 33 and 34 as causal relationships that predict what would happen if winter maintenance was improved. These relationships are static statistical relationships only and do not account for the behavioural adaptations to changes in surface conditions that might be expected to occur if winter surface conditions became less common or less slippery. It is nevertheless possible to use the relationships in Figures 33 and 34 to estimate a potential reduction of pedestrian injury if winter surface conditions became less common.
The Potential for Reducing the Number of Killed or Seriously Injured Road Users in Norway in the Period 2018-2030
Copyright © Institute of Transport Economics, 2020 57
For women, the potential for reducing risk was estimated by assuming, as noted above, a 50 % reduction in the occurrence of winter surfaces, and a reduction of relative risk of 43 % on the remaining 50 % of winter surfaces. The amount of walking was assumed not to change. Under these assumptions, the potential for reducing the number of injuries to women, using women aged 25-34 as illustration, was estimated as follows:
1. There were 186 injuries in summer. This number remains unchanged. 2. The occurrence of winter surfaces is reduced by 50 %. This means that exposure in
winter, now 16.475 million walking kilometres, is reduced by 50 %. The remaining 50 % will have the same injury risk as in summer, 5.70 injuries per million kilometres walked. Thus, the expected number of injuries is 16.475/2 ∙ 5.70 = 46.9, rounded to 47.
3. Current risk is 13.47 injuries per million walking kilometres in winter and 5.70 injuries per million walking kilometres in summer. The difference in risk (13.47 – 5.70 = 7.77) is reduced to 0.565 of its current value. Risk on winter surfaces then becomes 10.09 per million walking kilometres. The expected number of injuries on winter surfaces becomes 16.475/2 ∙ 10.09 = 83.1, rounded to 83.
4. The total expected number of injuries is 186 + 47 + 83 = 316. The current number of injuries is 408. Estimates were done for each age group and summed for all age groups. A potential reduction of the number of injuries of about 23 % was found.
For men, it was assumed that exposure on winter surfaces could be reduced by 50 %, but no change in relative risk was assumed. Thus, their expected number of injuries was summer injuries, plus half of winter walking at the current risk in summer, plus half of winter walking at the current risk in winter. Under these assumptions, a potential reduction of the number of injuries (whole year) of 15 % was estimated. These estimates should be interpreted as the maximum possible reduction of injuries, as they do not account for possible behavioural adaptation in the form of more walking or less cautious behaviour.
5.3.3 Risk among cyclists The emergency medical clinic in Oslo recorded a total of 2184 injured cyclists in 2014 (Melhuus et al. 2015). Of these, 1673 were injured in traffic. When estimating risk, men and women are considered separately. There were 597 injured women and 1020 injured men. The following road surface conditions were coded (the codes were not the same as those used for pedestrians): Dry asphalt, wet asphalt, loose gravel, leaves, ice or snow. It will be assumed that enhanced road maintenance has the potential to influence injuries occurring on loose gravel, leaves and ice or snow. Both among men and women, 11 % of injuries occurred on these types of surface. Gravel, leaves, ice or snow was recorded in all months of the year, not just in winter. Thus, improved maintenance of road surfaces has a potential to reduce cyclist injuries in all months of the year. A problem when estimating how cyclist risk varies throughout the year, is that the amount of cycling varies very much during the year. Those who cycle all year round differ in many respects from those who only cycle in summer. Spolander (2018) found that those who cycle the whole year have a lower injury risk in winter than in summer. He suggested that those who cycle the whole year are more skilled than those who only cycle in summer. Risk has been estimated by relying on the national household travel survey (Hjorthol et al. 2014), applied the same way as for pedestrians. Table 8 shows injury risk to cyclists by gender and season (summer = April-October; winter = November, December, January, February, March).

The Potential for Reducing the Number of Killed or Seriously Injured Road Users in Norway in the Period 2018-2030
58 Copyright © Institute of Transport Economics, 2020
Table 8: Injury risk to cyclists in Oslo by gender and season. Injuries per million cycle kilometres. Season Women Men Total Summer 9.53 10.65 10.21 Winter 9.35 10.72 10.18 Whole year 9.51 10.66 10.20
The differences in risk between summer and winter are minimal. Women have a lower risk than men. The variation of risk throughout the year does not give any clues about the potential for reducing injury risk by improving road maintenance. A limitation of the estimates of risk given in Table 8 is that they apply to all cyclists. However, there are probably differences in risk between all year round cyclists and those who only cycle in summer. The all year cyclists cannot easily be identified, but as an approximation the groups for which injuries have been recorded in every month of the year are regarded as all year cyclists. For women aged 35-44, injuries were recorded in all months of the year. The same applies to men aged 45-54. These groups are therefore treated as all year cyclists. Estimates of risk for all year cyclists and for seasonal cyclists are shown in Table 9: Table 9: Injury risk by season, gender and whether cyclists are seasonal or whole year. Injuries per million kilometres cycled.
Women Men Group Summer Winter All year Summer Winter All year All cyclists 9.53 9.35 9.51 10.65 10.72 10.66 All year cyclists 6.11 8.12 6.32 9.12 4.50 7.80
As expected, all year cyclists have a lower risk than seasonal cyclists, both among men and among women. Among women, all year cyclists have a higher risk in winter than in summer. Among men, the opposite tendency is found: risk is higher in summer than in winter.
5.3.4 The preventability of cyclist injury The analyses presented above do not give any clues about the preventability of cyclist injury. It is known from other studies (Niska and Eriksson 2013) that loose gravel or sand, leaves, ice or snow are risk factors for bicycle crashes. As noted above, these risk factors were recorded in 11 % of cyclist crashes. It is difficult to say whether there will be behavioural adaptation among cyclists to a higher standard of road maintenance. A rough estimate of the proportion of injuries that can be prevented by improving road maintenance is 5-10%. This is smaller than the proportion of pedestrian falls that can be prevented.
The Potential for Reducing the Number of Killed or Seriously Injured Road Users in Norway in the Period 2018-2030
Copyright © Institute of Transport Economics, 2020 59
6 Discussion of the results
The objective of the analyses presented in this report is to estimate the potential for reducing the number of traffic fatalities and seriously injured road users by 2024 and by 2030, assuming that the road safety measures start to be implemented during 2018. An estimate of the potential for reducing the number of fatalities and serious injuries informs policy makers about the opportunities that exist. However, the estimates should not be interpreted as a realistic forecast of the results of road safety policy in the years ahead. It is possible to reduce the number of killed or seriously injured road users considerably by 2024 and 2030. The target set for 2024, a maximum of 500 killed or seriously injured road users is attainable, but realising the target is only possible by increasing the use of all road safety measures included in the study. The target set for 2030, a maximum of 350 killed or seriously injured road users, seems more difficult to realise, even if all road safety measures are stepped up. The results of the analyses are uncertain. There are many sources of uncertainty. Elvik (2010A) identified ten sources of uncertainty in estimated benefits of road safety programmes:
1. Random variation in the number of injuries influenced by a measure 2. Incomplete reporting of injuries in official road accident statistics 3. Uncertainty about which types of injury a measure influences 4. Random variation in the effects of a road safety measure 5. Unknown sources of systematic variation in the effects of a road safety measure 6. Incomplete knowledge of potential changes over time in the effects of a road safety
measure 7. Incomplete knowledge of the combined effects of a set of road safety measures 8. Uncertainty about the baseline trend in the number of killed or injured road users 9. Uncertainty about whether road safety measures will actually be fully implemented
as assumed when estimating their effects 10. Uncertain monetary valuation of the benefits of preventing traffic injury.
Elvik (2010A) discusses the possibility of quantifying these sources of uncertainty. He concludes that not all of them can be meaningfully quantified. This means that their combined contribution – total uncertainty resulting from all sources – cannot be quantified. Hence, from a theoretical point of view, road safety policy is best viewed as decision making under uncertainty, meaning that the probability distribution of potential outcomes is unknown. Indeed, even the range of potential outcomes must be treated as unknown, as long-term trends in the number of traffic fatalities are notoriously unpredictable (Elvik 2010B). Random variation, sources 1 and 4 on the list, is irreducible and unavoidable and thus represents the limit of how precisely one can know the effects of a road safety programme. If random variation is modelled by assuming a Poisson distribution, the 95 % confidence interval for the highest predicted number of killed or seriously injured road users in 2024 (442) spans from 401 to 483. Actually, uncertainty is larger than this interval when random variation in the effects of the road safety measures is taken into account, not just random variation in the number of killed or seriously injured road users predicted by using point estimates for the effect of each road safety measure. For 2030, a 95 % Poisson confidence

The Potential for Reducing the Number of Killed or Seriously Injured Road Users in Norway in the Period 2018-2030
60 Copyright © Institute of Transport Economics, 2020
interval for the predicted number of killed or seriously injured road users is from 338 to 414. Estimates refer to killed or seriously injured road users. These injuries are more completely reported in official road accident statistics (source 2 on the list) than slight injuries. Models have been developed for accounting for the uncertainty attributable to incomplete reporting, but no attempt has been made to apply these models in the analyses. In most cases, it is clear which types of injury a measure influences (source 3). In some cases, however, there is some uncertainty. Does road lighting, for example, influence crashes at night only, or does it also influence daytime crashes? Lights are not turned on in daytime, but the poles represent a fixed obstacle that can be struck by cars at any time. In general, uncertainty about which injuries a measures influences is not judged to be a major source of uncertainty in the results. The effects of the measures are stated as a percentage change in the number of killed or injured road users. For some measures, effects may vary (source 5), but for unknown reasons. Thus, if an evaluation study finds a larger effect of speed cameras in some places than in others, this could be because speeding is a larger problem in some locations than in others. However, if the study does not have any data about speeding, it is impossible to determine if variation in effect is related to variation in the rate of speeding. In the analyses, a single estimate of the effect of speed cameras has been assumed and no attempt has been made to model spatial variation in effects. It is conceivable that the effect of a road safety measure changes over time (source 6). There are two types of such variation. The first is related to technological innovation or learning which means that a given road safety measure, when implemented today, may have a different effect from what it had when implemented some time ago. As an example (Høye 2016C), seat belts appear to have become more effective over time – most probably because they are better designed, have pre-tensioners, are easier to fit correctly, and are made of more solid materials. On the other hand, roundabouts built in Norway in recent years appear to be less effective than those built earlier (Elvik 2010A). The second type of variation is the that effects of a measure, once implemented, change over time. Next to nothing is known about this type of variation, and it is difficult to study it rigorously. One could, to be sure, have an after-period of, say, 15-20 years to try to find out whether the effects of, for example, road lighting change over time. The problem is that during such a long period, many things change and it becomes increasingly difficult to know whether changes in safety are attributable to changes in the effect of road lighting or something else. In the analyses, all effects have been assumed to remain unchanged over time. This is the simplest assumption that can be made, but it is unknown how correct it is. Two models were applied to estimate the combined effects of the measures (source 7). Neither model has a good empirical foundation. However, to the extent the accuracy of the model can be assessed, the most conservative of them, the dominant common residuals model, is judged to be the most realistic. The trend in the number of fatalities and injuries that can be expected to occur if no new road safety measures are introduced is also profoundly uncertain (source 8). Previous road safety policy analyses (Elvik, Muskaug and Vaaje 1984, Elvik 1999, Elvik 2007) were based on a baseline scenario predicting an increase in the number of fatalities and injuries. These analyses have all turned out to be too pessimistic. There has been a larger reduction of the number of fatalities and injuries that the analyses predicted. It is, unfortunately, not possible to explain very well why the policy analyses predicted so badly. The analyses most likely did not include all of the factors that produce the long-term downward trend in the number of fatalities and injuries.

The Potential for Reducing the Number of Killed or Seriously Injured Road Users in Norway in the Period 2018-2030
Copyright © Institute of Transport Economics, 2020 61
The number of traffic fatalities in Norway has declined considerably since 1970, but the decline has not been steady and periods of several years when there was no decline have occurred. After the year 2000, the decline has become more steady and uninterrupted. By contrast, the number of fatalities in 1981 was 338, and a lower number did not occur until 1990. The number of fatalities increased in 1982, 1983, 1986 and 1989. Similar frequent increases have not been observed after 2000. Obviously, this does not rule out that a longer period of stagnation may occur, but we regard it as improbable. Even if the renewal of the car fleet continues at its current rate, cars will become safer for many years to come. Current road investment plans foresee a rapid expansion of motorways in the coming years. These are trends that are likely to sustain the downward trend in the number of fatalities and serious injuries. It is important to remember that random variation, in particular in the number of fatalities, can produce quite large fluctuations in the number. If the current annual expected number is 100 fatalities, a 95 % Poisson confidence interval is from 80 to 120 fatalities. Variation within this range does not necessarily suggest that the underlying downward trend has changed. The estimates show the potential for improving road safety. It was not part of the study to assess the likelihood that the measures will be implemented (source 9). The targets for 2024 and 2030 are very ambitious and unlikely to be attained unless all measures included in the analyses are fully implemented. Previous studies (Elvik 2008) show that ambitious targets can be more successful than less ambitious targets, at least as long the ambitious targets remain within reach if an extra effort is made. Finally, the analyses did not include cost-benefit analyses. Thus, source 10 of uncertainty, regarding the monetary valuation of road safety, is not relevant.
The Potential for Reducing the Number of Killed or Seriously Injured Road Users in Norway in the Period 2018-2030
62 Copyright © Institute of Transport Economics, 2020
7 Conclusions
The most important results of the study presented in this report can be summarised as follows:
1. A small decline in the number of killed or seriously injured road users can be expected to occur before 2030 even if no new road safety measures are implemented.
2. Policy targets are a maximum of 500 killed or seriously injured road users in 2024 and a maximum of 350 in 2030.
3. To realise these targets, road safety measures have to be implemented to a greater extent than they are today. The potential for reducing the number of killed or seriously injured road users by implementing 33 road safety measures to their maximum conceivable extent has been estimated.
4. Four alternatives for the use of the road safety measures have been developed: a. Maximum use of measures that are currently used. b. Road-related and vehicle-related measures are used maximally; in addition
ISA, alcohol ignition interlock and seat belt ignition interlock are introduced.
c. Road-related measure and enforcement are used maximally and the car fleet is completely renewed.
d. Road-related measure and some enforcement measures are used maximally; in addition ISA, alcolock, seat belt lock and complete renewal of the car fleet are introduced.
5. The maximum use of road-related measures is indicated by the number of kilometres of road or number of locations where they are implemented. Maximum use of enforcement is twice the current level. Maximum use of vehicle-related measures is that 100 % of vehicles have the measure.
6. In all alternatives, the number of fatalities is reduced to 40-60 in 2024 and 2030. The number of seriously injured road users is reduced to 300-390 in 2024 and 2030. The decline in the number of killed or seriously injured road users is steepest before 2024.
7. It is possible to reduce the number of killed or seriously injured road users to 500 by 2024, but all road safety measures must then be used to their maximum extent. If present policy is continued, the target will not be reached.
8. It is unlikely that the target of 350 killed or seriously injured road users in 2030 will be reached, even if all road safety measures are used maximally.
In addition to these analyses, the report discussed the possibility of reducing injuries to pedestrians and cyclists, based on data collected in 2014 and 2016 by an emergency medical clinic in Oslo. It is concluded that the number of pedestrian injuries can be reduced by 15-23 % and the number of cyclist injuries reduced by 5-10 %.
The Potential for Reducing the Number of Killed or Seriously Injured Road Users in Norway in the Period 2018-2030
Copyright © Institute of Transport Economics, 2020 63
8 References
References marked by # are reports produced within the BEST research programme funded by the Norwegian Public Roads Administration. Bogstrand, S. T., Gjerde, H., Normann, P. T., Ekeberg, Ø. 2012. Alcohol, psychoactive
substances and non-fatal road traffic accidents – a case-control study. BMC Public Health, 12, 734 (pages 1-9).
Cameron, M., Newstead, S., Diamantopoulou, K. 2016. A resource allocation model for traffic enforcement. Journal of the Australasian College of Road Safety, 27, 23-36.
Elder, R. W., Voas, R., Beirness, D., Shults, R. A., Sleet, D. A., Nichols, J. L., Compton, R. 2011. Effectiveness of ignition interlocks for preventing alcohol-impaired driving and alcohol-related crashes. American Journal of Preventive Medicine, 40, 362-376.
Elvik, R. 1997. Vegtrafikklovgivning, kontroll og sanksjoner. Notat 1073. Oslo, Transportøkonomisk institutt.
Elvik, R. 1999. Bedre trafikksikkerhet i Norge. Rapport 446. Oslo, Transportøkonomisk institutt.
Elvik, R. 2007. Prospects for improving road safety in Norway. Report 897. Oslo, Institute of Transport Economics.
Elvik, R. 2008. Road safety management by objectives: A critical analysis of the Norwegian approach. Accident Analysis and Prevention, 40, 1115-1122.
Elvik, R. 2009. An exploratory analysis of models for estimating the combined effects of road safety measures. Accident Analysis and Prevention, 41, 876-880.
Elvik, R. 2010A. Sources of uncertainty in estimated benefits of road safety programmes. Accident Analysis and Prevention, 42, 2171-2178.
Elvik, R. 2010B. The stability of long-term trends in the number of traffic fatalities in a sample of highly motorised countries. Accident Analysis and Prevention, 42, 245-260.
Elvik, R. 2013. A re-parameterisation of the Power Model of the relationship between the speed of traffic and the number of accidents and accident victims. Accident Analysis and Prevention, 50, 854-860.
# Elvik, R. 2014. Fart og trafikksikkerhet. Nye modeller. Rapport 1296. Oslo, Transportøkonomisk institutt.
Elvik, R. 2015A. Methodological guidelines for developing accident modification functions. Accident Analysis and Prevention, 80, 26-36.
Elvik, R. 2015B. Speed enforcement in Norway: testing a game-theoretic model of the interaction between drivers and the police. Accident Analysis and Prevention, 84, 128-133.
Elvik, R. 2015C. Risk of traffic injury associated with the use of drugs. Working paper SM/50781. Oslo, Institute of Transport Economics.
Elvik, R. 2016A. Association between increase in fixed penalties and road safety outcomes: A meta-analysis. Accident Analysis and Prevention, 92, 202-210.

The Potential for Reducing the Number of Killed or Seriously Injured Road Users in Norway in the Period 2018-2030
64 Copyright © Institute of Transport Economics, 2020
Elvik, R. 2016B. Safety-in-numbers: estimates based on a sample of pedestrian crossings in Norway. Accident Analysis and Prevention, 91, 175-182.
Elvik, R. 2016C. Does the influence of risk factors on accident occurrence change over time? Accident Analysis and Prevention, 91, 91-102.
# Elvik, R. 2017A. Miniscenario: Fartsgrensepolitikk. Virkninger på trafikksikkerhet av ulike fartsgrenser. Rapport 1589. Oslo, Transportøkonomisk institutt.
Elvik, R. 2017B. Road safety effects of roundabouts: a meta-analysis. Accident Analysis and Prevention, 99, 364-371.
Elvik, R. 2018. Interpreting interaction effects in estimates of the risk of traffic injury associated with the use of illicit drugs. Accident Analysis and Prevention, 113, 224-235.
Elvik, R. 2019. A comprehensive and unified framework for analysing the effects on injuries of measures influencing speed. Accident Analysis and Prevention, 125, 63-69.
Elvik, R., Bjørnskau, T. 2019. Risk of pedestrian falls in Oslo, Norway: relation to age, gender and walking surface condition. Journal of Transport and Health, 12, 359-370.
# Elvik, R., Assum, T., Olsen, S. 2017. Hva fremmer og hindrer gjennomføring av effektive trafikksikkerhetstiltak? Rapport 1605. Oslo, Transportøkonomisk institutt.
# Elvik, R., Høye, A. 2015. Hvor mye kan antall drepte og hardt skadde i trafikken reduseres? Foreløpige beregninger. Rapport 1417. Oslo, Transportøkonomisk institutt.
Elvik, R., Muskaug, R., Vaaje, T. 1984. Virkninger av alternative strategier for å øke trafikksikkerheten i Norge. TØI-rapport. Oslo, Transportøkonomisk institutt.
Elvik, R. Ulstein, H., Syrstad, R., Wifstad, K., Seeberg, A., Gulbrandsen, M., Welde, M. 2017. An Empirical Bayes before-after evaluation of road safety effects of a new motorway in Norway. Accident Analysis and Prevention, 108, 285-296.
Elvik, R., Vadeby, A., Hels, T., Schagen, I. van 2019. Updated estimates of the relationship between speed and road safety at the aggregate and individual levels. Accident Analysis and Prevention, 123, 114-122.
Ferris, J., Mazerolle, L., King, M., Bates, L., Bennett, S., Devaney, M. 2013. Random breath testing in Queensland and Western Australia: Examination of how the random breath testing rate influences alcohol related traffic crash rates. Accident Analysis and Prevention, 60, 181-188.
Gjerde, H., Normann, P. T., Christophersen, A. S., Samuelsen, S. O., Mørland, J. 2011. Alcohol, psychoactive drugs and fatal road traffic accidents in Norway: a case-control study. Accident Analysis and Prevention, 43, 1197-1203.
Gjerde, H., Christophersen, A. S., Normann, P. T., Mørland, J. 2013. Associations between substance use among car and van drivers in Norway and fatal injury in road traffic accidents: A case-control study. Transportation Research Part F, 17, 134-144.
Glad, A. 1985. Research on drinking and driving in Norway. A survey of recent research on drinking and driving and on drinking drivers. State-of-the-art report 15 (Yellow series). Oslo, Institute of Transport Economics.
Haldorsen, I. 2010-2014. Sikre biler. Notater; Statens vegvesen, Vegdirektoratet. Hjorthol, R., Engebretsen, Ø, Uteng, T. P. 2104. Den nasjonale reisevaneundersøkelsen
2013/14. Nøkkelrapport. Rapport 1383. Oslo, Transportøkonomisk institutt. HLDI 2011A. Acura collision avoidance features: initial results. Highway loss data institute:
Bulletin, 28(21), 1-8. HLDI 2011B. Buick collision avoidance features: initial results. Highway loss data institute:
Bulletin, 28(22), 1-7.
The Potential for Reducing the Number of Killed or Seriously Injured Road Users in Norway in the Period 2018-2030
Copyright © Institute of Transport Economics, 2020 65
HLDI 2011C. Mazda collision avoidance features: initial results. Highway loss data institute: Bulletin, 28(13), 1-8.
HLDI 2012A. Mercedes collision avoidance features: initial results. Highway loss data institute: Bulletin, 28(21), 1-8.
HLDI 2012B. Volvo collision avoidance features: initial results. Highway loss data institute: Bulletin, 29(5), 1-10.
Hössinger, R., Berger, W. J. 2012. Stated response to increased enforcement density and penalty size for speeding and driving unbelted. Accident Analysis and Prevention, 49, 501-511.
Høye, A. 2014A. Evaluering av effekt på ulykker ved bruk av punkt-ATK. Rapport 1384. Oslo, Transportøkonomisk institutt.
Høye, A. 2014B. Evaluering av effekt på ulykker ved bruk av streknings-ATK. Rapport 1339. Oslo, Transportøkonomisk institutt.
Høye, A. 2015. Revisjon av Trafikksikkerhetshåndboken: 4.14 Kollisjonsputer i lette kjøretøy. Arbeidsdokument 50993. Oslo, Transportøkonomisk institutt.
# Høye, A., Hesjevoll, I. & Vaa, T. 2015. Førerstøttesystemer – status og potensial for framtiden. TØI rapport 1450/2015. Oslo, Transportøkonomisk institutt.
Høye, A. 2014C. Revisjon av Trafikksikkerhetshåndboken: Kapittel 4.29 ESC. Arbeidsdokument 50526. Oslo, Transportøkonomisk institutt.
Høye, A. 2016A. Regulering av kjøre- og hviletid. Kapittel 6.10 i Trafikksikkerhetshåndboken, elektronisk utgave. Revidert 2016.
Høye, A. 2016B. Utvikling av ulykkesmodeller for ulykker på riks- og fylkesvegnettet i Norge (2010-2015). Rapport 1522. Oslo, Transportøkonomisk institutt.
Høye, A. 2016C. How would increasing seat belt use affect the number of killed or seriously injured light vehicle occupants? Accident Analysis and Prevention, 88, 175-186.
# Høye, A. 2017. Bilalder og risiko. Rapport 1607. Oslo, Transportøkonomisk institutt. Høye, A., Bjørnskau, T., Elvik, R. 2014. Hva forklarer nedgangen i antall drepte og hardt
skadde i trafikken fra 2000 til 2012? Rapport 1299. Oslo, Transportøkonomisk institutt. Kloeden, C. N., Ponte, G., McLean, A. J. 2001. Travelling speed and the risk of crash
involvement on rural roads. Report CR 204. Road Accident Research Unit, Adelaide University, Adelaide.
Krafft, M., Kullgren, A., Lie, A., Tingvall, C. 2006. The Use of Seat Belts in Cars with Smart Seat Belt Reminders-Results of an Observational Study. Traffic Injury Prevention, 7, 125-129.
Kullgren, A., Lie, A., Tingvall, C. 2010. Comparison Between Euro NCAP Test Results and Real-World Crash Data. Traffic Injury Prevention, 11(6), 587-593.
Kvisberg, J. 2003. Hovedoppgave for faggruppe veg og samferdsel. Analyse av kryssulykker på hovedvegnettet i Region Øst. Trondheim, NTNU, Fakultet for ingeniørvitenskap og teknologi, Institutt for bygg, anlegg og transport.
Lahrmann, H., Agerholm, N., Tradisauskas, N., Berthelsen, K. K., Harms, L. 2012. Pay as You Speed, ISA with incentives for not speeding: Results and interpretation of speed data. Accident Analysis & Prevention, 48, 17-28.
Lie, A., Tingvall, C. 2001. How does Euro NCAP results correlate to real life injury risks - a paired comparison study of car-to-car crashes. Paper presented at the IRCOBI Conference, Montpellier, France.
The Potential for Reducing the Number of Killed or Seriously Injured Road Users in Norway in the Period 2018-2030
66 Copyright © Institute of Transport Economics, 2020
# Melhuus, K., Siverts, H., Enger, M., Schmidt, M. 2015. Smaken av asfalt. Sykkelskader i Oslo 2014 Oslo skadelegevakt. Oslo, Statens vegvesen, Oslo Universitetssykehus, Helsedirektoratet.
# Melhuus, K., Siverts, H., Enger, M., Schmidt, M. 2017. Snøen som falt i fjor. Fotgjengerskader i Oslo 2016 Oslo skadelegevakt. Oslo, Statens vegvesen, Oslo Universitetssykehus, Helsedirektoratet.
Möller, S., Wallman, C. G., Gregersen, N. P. 1991. Vinterväghållning i tätort – trafiksäkerhet och framkomlighet. Huvurapport. Stockholm, TFB & VTI forskning/research 2 1991.
Niska, A., Eriksson, J. 2013. Statistik över cyklisters olyckor. Faktaunderlag til gemensam strategi för säker cykling. VTI-rapport 801. Linköping, Väg- och Transportforskningsinstitutet.
Nævestad, T-O., Phillips, R. O., Elvebakk,B. 2018. The safety ladder: developing an evidence-based safety management strategy for small road transport companies, Transport Reviews, 38, 372-393.
# Nævestad, T-O., Phillips, R. O., Hovi, I. B., Jordbakke, G. N., Elvik, R. 2018. Miniscenario: Sikkerhetsstigen. Innføre tiltak for sikkerhetsstyring i godstransportbedrifter. Rapport 1620. Oslo, Transportøkonomisk institutt.
Opplysningsrådet for veitrafikken. 2016. Kvaliteten på det norske veinettet 2016. Del 1 – Sammenligning med Europa. Oslo, Opplysningsrådet for veitrafikken.
Page, Y., Cuny, S., Zangmeister, T., Kreiss, J. P., & Hermitte, T. 2009. The evaluation of the safety benefits of combined passive and on-board active safety applications. Retrieved from Annals of Advances in Automotive Medicine, 53 (Proceedings of the 53rd Annual Conference of the Association for the Advancement of Automotive Medicine), pp. 117-127.
Ragnøy, A. 2004. Endring av fartsgrenser. Effekt på kjørefart og ulykker. Rapport 729. Oslo, Transportøkonomisk institutt.
Ringen, S. 2017. Dybdeanalyser av dødsulykker i vegtrafikken 2016. Rapport 640. Oslo, Statens vegvesen, Vegdirektoratet.
# Sagberg, F. 2017. Miniscenario: Påbud om restriktive kjøretøytiltak – effekt på antall drepte og hardt skadde trafikanter. Rapport 1579. Oslo, Transportøkonomisk institutt.
Sagberg, F. 2018. Characteristics of fatal road crashes involving unlicensed drivers or riders: Implications for countermeasures. Accident Analysis and Prevention, 117, 270-275.
Schittenhelm, H. 2013. Advanced Brake Assist–Real World effectiveness of current implementations and next generation enlargements by Mercedes-Benz. Paper Number 13-0194. Proceedings of the 23rd International Technical Conference on the Enhanced Safety of Vehicles (ESV).
Spolander, K. 2018. Olyckor och risker som följd av ökad gång- och cykeltrafik. Stockholm, Fotgängarnas Förening – FOT.
Statens vegvesen, Politiet, Trygg Trafikk, Utdanningsdirektoratet, Kommunenes Sentralforbund, Helsedirektoratet. 2018. Nasjonal tiltaksplan for trafikksikkerhet på veg 2018-2021. Oslo, Vegdirektoratet.
Strandroth, J., Rizzi, M., Sternlund, S., Lie, A., & Tingvall, C. 2011. The Correlation Between Pedestrian Injury Severity in Real-Life Crashes and Euro NCAP Pedestrian Test Results. Traffic Injury Prevention, 12(6), 604-613.
# Sundfør, H. B., Bjørnskau, T. 2017. Fotgjengerskader i Oslo i 2016. En analyse av skadedata fra Oslo legevakt. Rapport 1609. Oslo, Transportøkonomisk institutt

The Potential for Reducing the Number of Killed or Seriously Injured Road Users in Norway in the Period 2018-2030
Copyright © Institute of Transport Economics, 2020 67
Vaa, T., Assum, T., Elvik, R. 2012.Førerstøttesystemer: Beregning av trafikksikkerhetseffekter ved ulike implementeringsnivåer. Rapport 1202. Oslo, Transportøkonomisk institutt.
Vadeby, A., Forsman, Å. 2017. Changes in speed distribution: Applying aggregated safety effect models to individual vehicle speeds. Accident Analysis and Prevention, 103, 20-28.
Institute of Transport Economics (TØI) Norwegian Centre for Transport Research Established in 1964, the Institute of Transport Economics is an interdisciplinary, applied research centre with approximately 90 professionals. Its mission is to develop and disseminate transportation knowledge that has scientific quality and practical application. A private, non-profit foundation, TØI receives basic funding from the Research Council of Norway. However, the greater part of its revenue is generated through contract research. An important part of its activity is international research cooperation, mostly in the form of projects under the Framework Programmes of the European Commission.
Visiting and postal address: Institute of Transport Economics + 47 22 57 38 00 Gaustadalléen 21 [email protected] NO-0349 Oslo www.toi.no
TØI participates in the Oslo Centre for Interdisciplinary Environmental and Social Research (CIENS) located near the University of Oslo. See www.ciens.no
TØI covers all modes of transport and virtually all topics in transportation, including road safety, public transport, climate change and the environment, travel behaviour, tourism, land use and urban planning, decision-making processes, freight and travel demand, as well as general transport economics. Claiming copyright to its products, TØI acts independently of its clients in matters of scientific approach, professional judgment and evaluation. TØI reports are generally downloadable for free at www.toi.no.