apec’s potential for reducing energy intensity: the...
TRANSCRIPT
APEC’s Potential for Reducing Energy Intensity: The Research Evidence
APERC Workshop at EWG 41
9 May 2011
Ralph D. Samuelson
• 2007 Sydney APEC Leaders’ Declaration on Climate Change, Energy Security and Clean Development –– “Agree to work towards achieving an APEC-wide
regional aspirational goal of a reduction in energy intensity of at least 25 per cent by 2030 (with 2005 as the base year)”
• 2010 Yokohama APEC Leaders Growth Strategy –– “APEC will assess the potential for reducing the energy
intensity of economic output in APEC economies between 2005 and 2030, beyond the 25 percent aspirational goal already agreed to by APEC Leaders in 2007
Current Status of APEC’s Intensity Goal
A. What level of APEC-wide energy intensity reduction would be consistent with business-as-usual?
B. What level of APEC-wide energy intensity reduction would be consistent with what APEC economies currently pledge to achieve?
C. What level of APEC-wide energy intensity reduction would be consistent with a global effort to limit temperature rises to 2o C?
APEC-Wide Energy Intensity Reduction:Key Research Questions
• To help answer these questions, APERC has arranged with the International Energy Agency (IEA) to have access to the detailed model results they developed for their World Energy Outlook 2010
– APERC has broken-out results for the APEC economies, and analyzed their impacts on energy intensity improvement for the APEC region
• APERC is of the view that the IEA’s model and model results are more suited for this analysis than any others that we could obtain access to.
APERC’s Modeling Approach
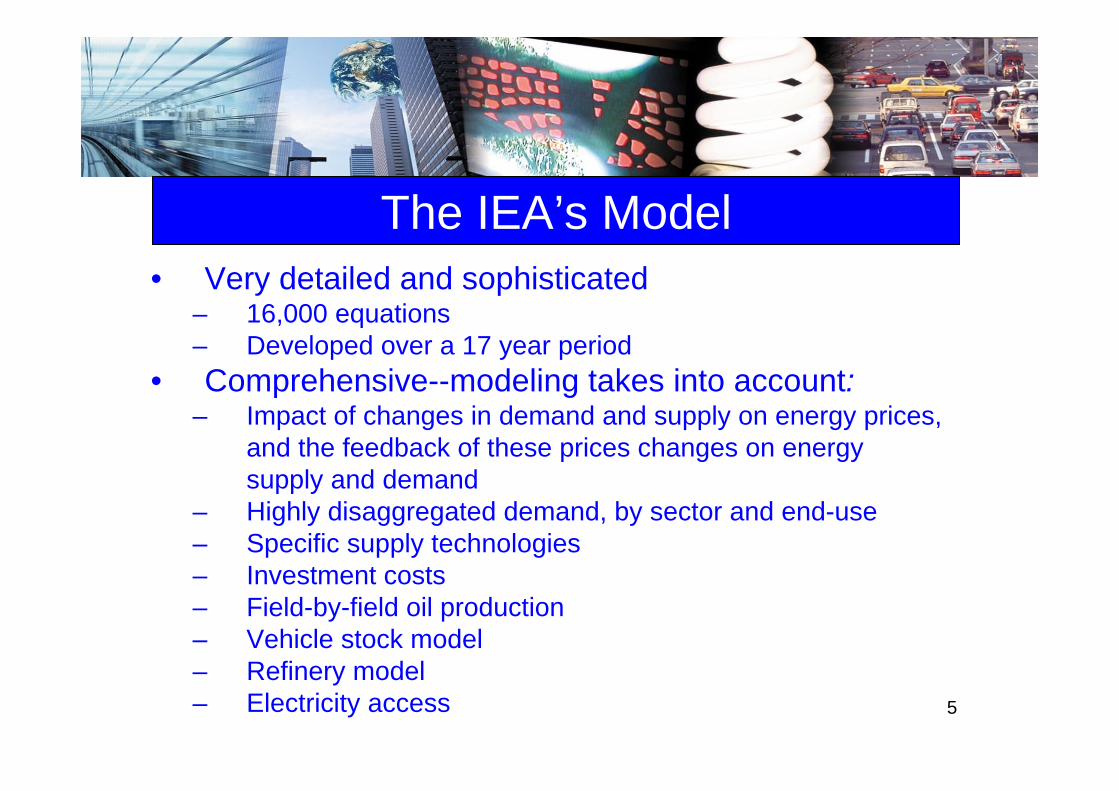
• Very detailed and sophisticated– 16,000 equations– Developed over a 17 year period
• Comprehensive--modeling takes into account:– Impact of changes in demand and supply on energy prices,
and the feedback of these prices changes on energy supply and demand
– Highly disaggregated demand, by sector and end-use– Specific supply technologies– Investment costs– Field-by-field oil production– Vehicle stock model– Refinery model– Electricity access
The IEA’s Model
5
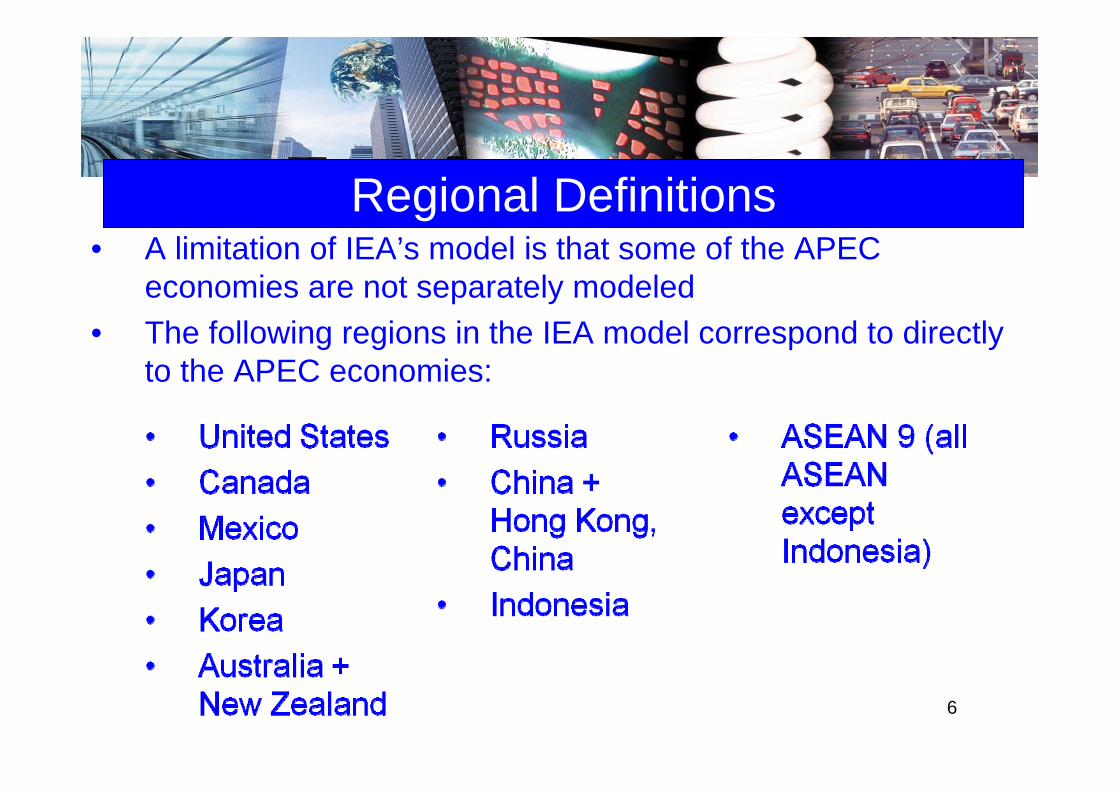
• A limitation of IEA’s model is that some of the APEC economies are not separately modeled
• The following regions in the IEA model correspond to directly to the APEC economies:
6
Regional Definitions
• Results for Chinese Taipei, Chile, Peru and Papua New Guinea were combined in the IEA’s model with a number of other non-APEC economies, hence we use APERC model results for them
Regional Definitions - Continued
7
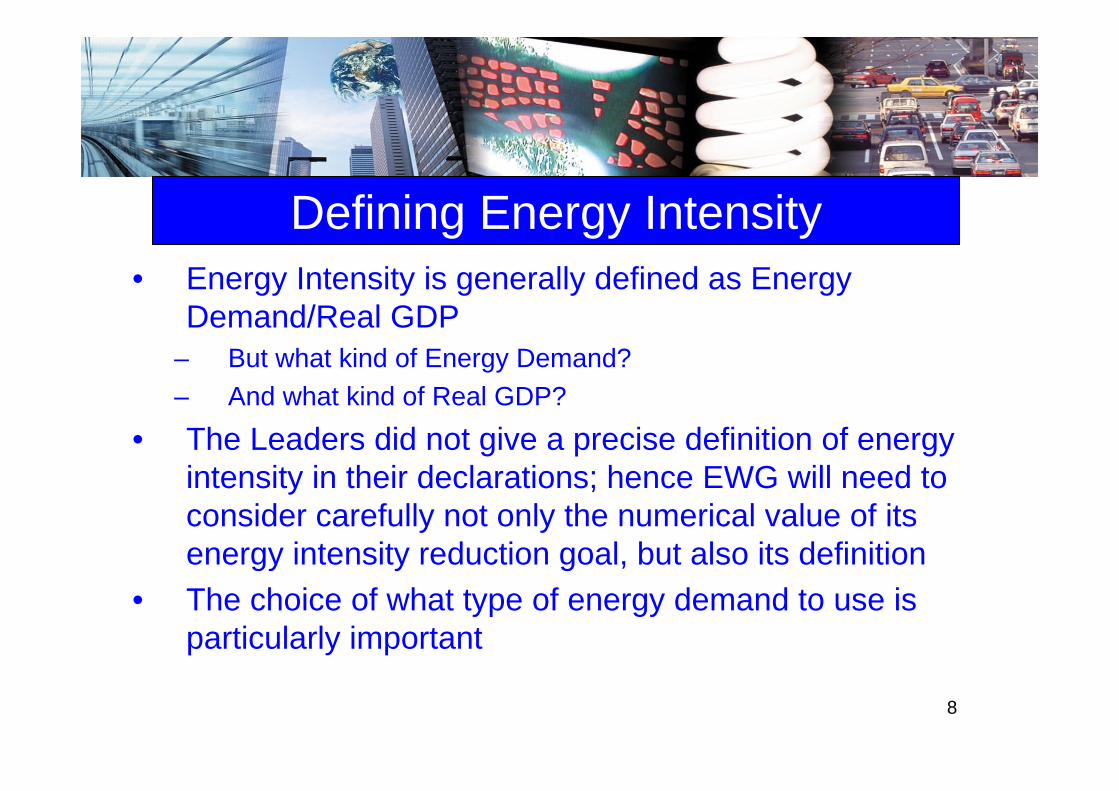
• Energy Intensity is generally defined as Energy Demand/Real GDP
– But what kind of Energy Demand?– And what kind of Real GDP?
• The Leaders did not give a precise definition of energy intensity in their declarations; hence EWG will need to consider carefully not only the numerical value of its energy intensity reduction goal, but also its definition
• The choice of what type of energy demand to use is particularly important
Defining Energy Intensity
8
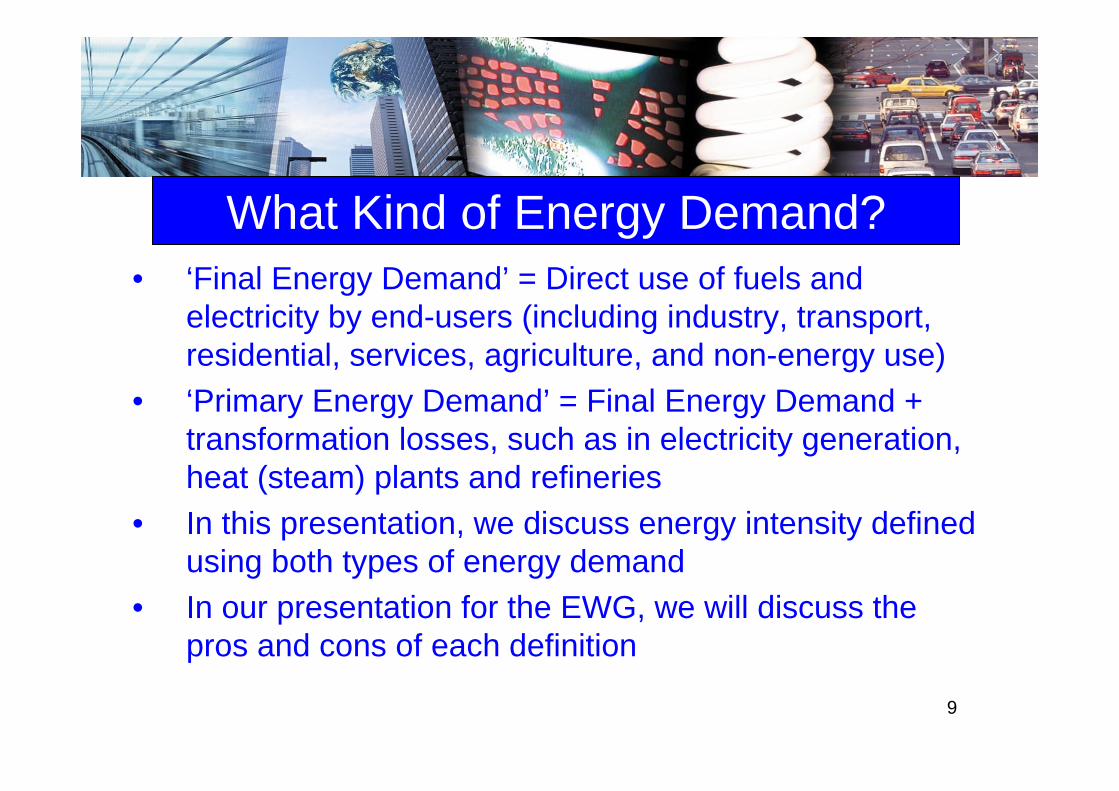
• ‘Final Energy Demand’ = Direct use of fuels and electricity by end-users (including industry, transport, residential, services, agriculture, and non-energy use)
• ‘Primary Energy Demand’ = Final Energy Demand + transformation losses, such as in electricity generation, heat (steam) plants and refineries
• In this presentation, we discuss energy intensity defined using both types of energy demand
• In our presentation for the EWG, we will discuss the pros and cons of each definition
What Kind of Energy Demand?
9
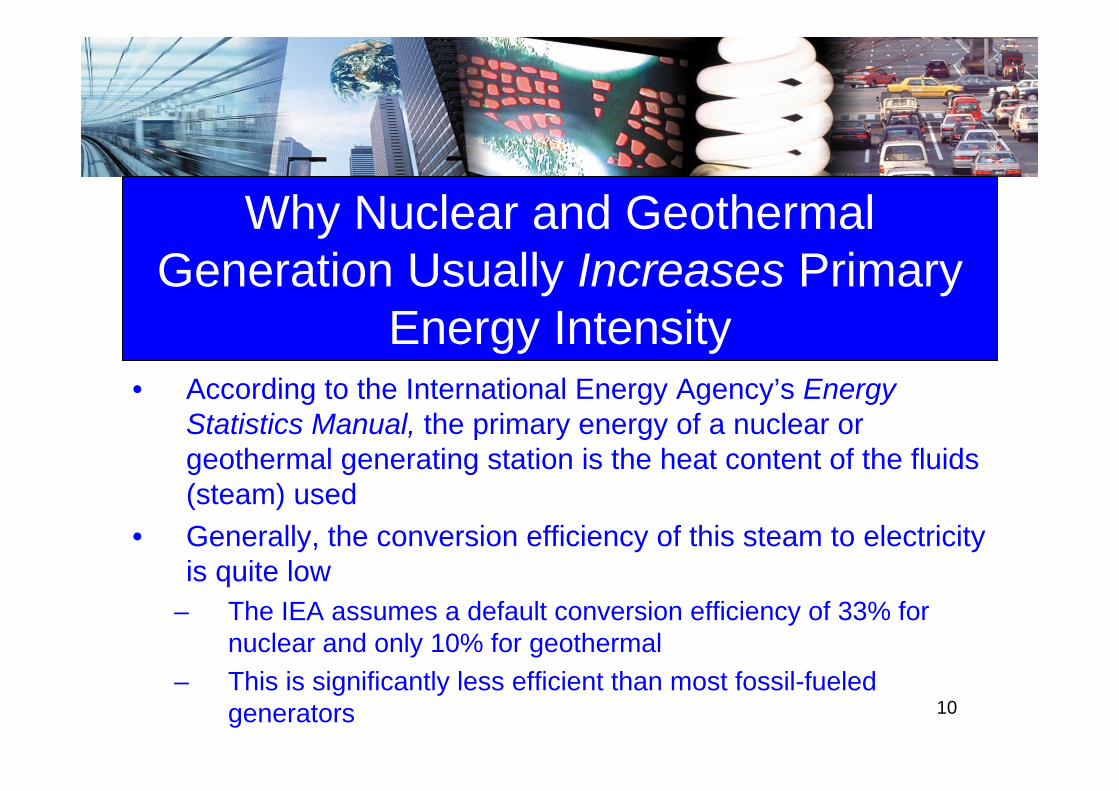
• According to the International Energy Agency’s Energy Statistics Manual, the primary energy of a nuclear or geothermal generating station is the heat content of the fluids (steam) used
• Generally, the conversion efficiency of this steam to electricity is quite low
– The IEA assumes a default conversion efficiency of 33% for nuclear and only 10% for geothermal
– This is significantly less efficient than most fossil-fueled generators
Why Nuclear and Geothermal Generation Usually Increases Primary
Energy Intensity
10
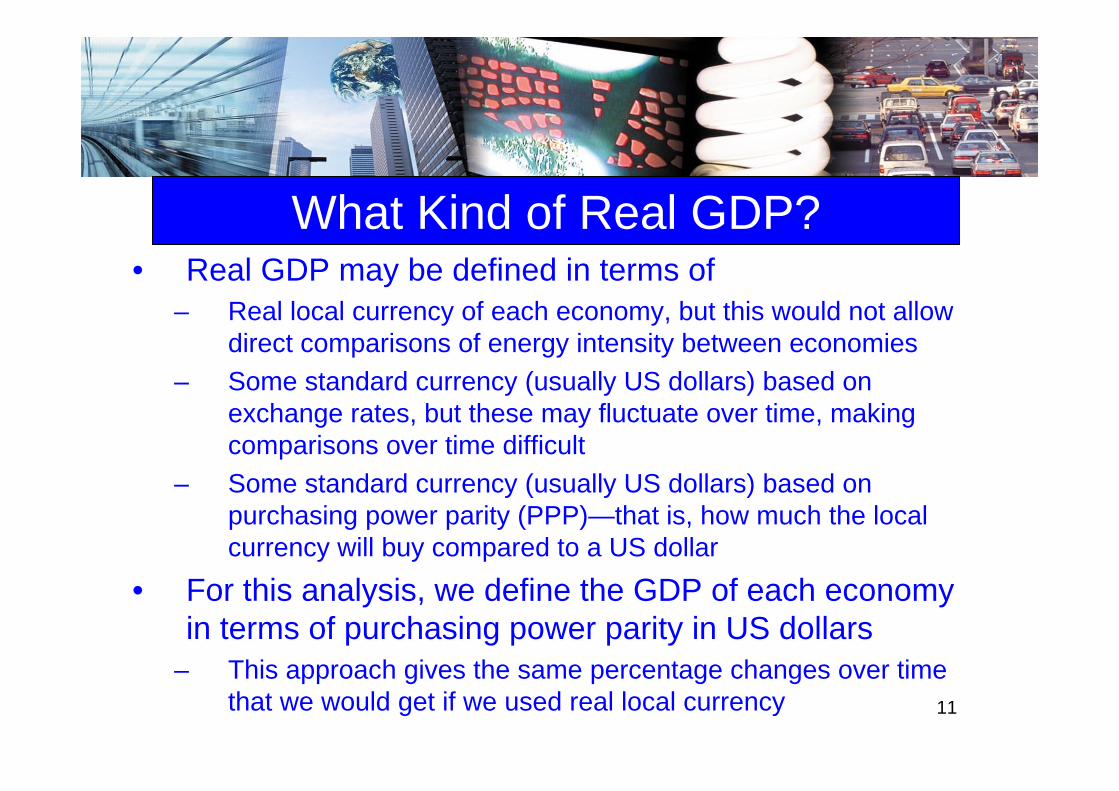
• Real GDP may be defined in terms of– Real local currency of each economy, but this would not allow
direct comparisons of energy intensity between economies– Some standard currency (usually US dollars) based on
exchange rates, but these may fluctuate over time, making comparisons over time difficult
– Some standard currency (usually US dollars) based on purchasing power parity (PPP)—that is, how much the local currency will buy compared to a US dollar
• For this analysis, we define the GDP of each economy in terms of purchasing power parity in US dollars
– This approach gives the same percentage changes over time that we would get if we used real local currency
What Kind of Real GDP?
11
A. What Level of APEC-Wide Energy Intensity Reduction Would Be Consistent with Business As Usual?

0
50
100
150
200
250
1990 2000 2005 2015 2030
Index (2005 = 100)
Primary Energy Supply GDP Index Intensity Index
APERC’s Business-As-Usual Outlook
13From APERC, APEC Energy Demand and Supply Outlook 4th Edition, Figure 1.5
Energy Intensity Down 38% by 2030 vs. 2005

What Happened to Primary Energy Intensity Over the 25 Years from 1980-2005?
140.000
0.050
0.100
0.150
0.200
0.250
0.300
0.350
1980 1985 1990 1995 2000 2005 2010
Prim
ary En
ergy Intensity
(Mtoe/million 20
05 US$ PPP
)
APEC 20 Total*APEC 21 Total
*Excludes Russia, for which data was not available for the earlier periods.
Primary Energy Intensity Down 33% vs. 1980

What Happened to Final Energy Intensity Over the 25 Years from 1980-2005?
15
0.000
0.050
0.100
0.150
0.200
0.250
1980 1985 1990 1995 2000 2005 2010
Fina
l Ene
rgy Intensity
(Mtoe/million 20
05 US $ PP
P)
APEC 20 Total*APEC 21 Total
*Excludes Russia, for which data was not available for the earlier periods.
Final Energy Intensity Down 39% vs. 1980

What Happened to Primary Energy Intensity By Economy Over the 25 Years from 1980-2005?
16‐100% ‐75% ‐50% ‐25% 0% 25% 50% 75%
AustraliaBrunei Darussalam
CanadaChileChina
Hong Kong, ChinaIndonesia
JapanKorea
MalaysiaMexico
New ZealandPapua New Guinea
PeruPhilippines
Russian FederationSingapore
Chinese TaipeiThailand
United StatesViet Nam
APEC 20 Total*
1980 ‐ 2005
*Excludes Russia, for which data was not available for 1980‐1990.
Primary Energy Intensity Down 33% vs. 1980

What Happened to Final Energy Intensity by Economy Over the 25 Years from 1980-2005?
17‐100% ‐75% ‐50% ‐25% 0% 25% 50% 75%
AustraliaBrunei Darussalam
CanadaChileChina
Hong Kong, ChinaIndonesia
JapanKorea
MalaysiaMexico
New ZealandPapua New Guinea
PeruPhilippines
Russian FederationSingapore
Chinese TaipeiThailand
United StatesViet Nam
APEC 20 Total*
1980 ‐ 2005
*Excludes Russia, for which data was not available for 1980‐1990.
Final Energy Intensity Down 39% vs. 1980

What Has Happened to Primary Energy Intensity Since 2005?
18‐20% ‐15% ‐10% ‐5% 0% 5% 10%
AustraliaBrunei Darussalam
CanadaChileChina
Hong Kong, ChinaIndonesia
JapanKorea
MalaysiaMexico
New ZealandPapua New Guinea
PeruPhilippines
Russian FederationSingapore
Chinese TaipeiThailand
United StatesViet Nam
APEC 20 Total*APEC 21 Total
2005 ‐ 2008
*Excludes Russia, for which data was not available for 1980‐1990.
6% Improvement—If this rate continues, will be 38% by
2030

What Has Happened to Final Energy Intensity Since 2005?
19‐20% ‐15% ‐10% ‐5% 0% 5% 10%
AustraliaBrunei Darussalam
CanadaChileChina
Hong Kong, ChinaIndonesia
JapanKorea
MalaysiaMexico
New ZealandPapua New Guinea
PeruPhilippines
Russian FederationSingapore
Chinese TaipeiThailand
United StatesViet Nam
APEC 20 Total*APEC 21 Total
2005 ‐ 2008
*Excludes Russia, for which data was not available for 1980‐1990.
6% Improvement—If this rate continues, will be 40% by
2030

What Has Happened to Primary Energy Intensity In 2009 and 2010?
20‐14.0% ‐12.0% ‐10.0% ‐8.0% ‐6.0% ‐4.0% ‐2.0% 0.0% 2.0% 4.0% 6.0%
AustraliaBrunei Darussalam
CanadaChileChina
Hong Kong, ChinaIndonesia
JapanKorea
MalaysiaMexico
New ZealandPapua New Guinea
PeruPhilippines
Russian FederationSingapore
Chinese TaipeiThailand
United StatesVietnam
All Available Data
2009
2010

What Has Happened to Final Energy Intensity In2009 and 2010?
21‐14.0% ‐12.0% ‐10.0% ‐8.0% ‐6.0% ‐4.0% ‐2.0% 0.0% 2.0% 4.0% 6.0%
AustraliaBrunei Darussalam
CanadaChileChina
Hong Kong, ChinaIndonesia
JapanKorea
MalaysiaMexico
New ZealandPapua New Guinea
PeruPhilippines
Russian FederationSingapore
Chinese TaipeiThailand
United StatesVietnam
All Available Data
2009
2010

What Do Modelers in Well-Known Research Institutes Say About APEC’s Potential for Reducing Energy
Intensity in BAU Case?
220
50
100
150
200
250
2005 2010 2015 2020 2025 2030
Energy Intensity
(toe/million 2005 PPP intl. $)
Primary Energy Intensity in IEA 2010 Current Policies ScenarioPrimary Energy Intensity in EIA 2010 Reference CasePrimary Energy Intensity in APERC 2009 BAU ProjectionFinal Energy Intensity in APERC 2009 BAU Projection"Final Energy Intensity in IEA 2010 Current Policies Scenario"
Raw Data for IEA Case © OECD/IEA 2010; calculations by APERC

What Is APEC’s Potential for Reducing Primary Energy Intensity in the IEA’s Current Policies Scenario?
23‐80% ‐60% ‐40% ‐20% 0% 20% 40% 60%
United States
Canada
Mexico
Japan
Korea
Australia + New Zealand
Russia
China + Hong Kong, China
Indonesia
ASEAN 9
Chinese Taipei*
Chile*
Peru*
Papua New Guinea*
APEC11+ASEAN9
Total APEC
2005‐2008
2008‐2030
*APERCModel Results
39% Improvement
by 2030
Raw Data for IEA Case © OECD/IEA 2010; calculations by APERC

What Is APEC’s Potential for Reducing Final Energy Intensity in the IEA’s Current Policies Scenario?
24‐80% ‐60% ‐40% ‐20% 0% 20% 40% 60%
United States
Canada
Mexico
Japan
Korea
Australia + New Zealand
Russia
China + Hong Kong, China
Indonesia
ASEAN 9
Chinese Taipei*
Chile*
Peru*
Papua New Guinea*
APEC11+ASEAN9
Total APEC
2005‐2008
2008‐2030
*APERCModel Results
40% Improvement
by 2030
Raw Data for IEA Case © OECD/IEA 2010; calculations by APERC

• Any conclusions about what the world is going to be like 25 years from now, even under business as usual, is subject to many uncertainties, including
– Technological developments– Political developments– Economic developments– Environmental developments
• Hence, all the conclusions here must be regarded as approximate
Key Uncertainties
25

B. What Level of APEC-Wide Energy Intensity Reduction Would Be Consistent with What APEC Economies Currently Pledge to Achieve?

‐80% ‐60% ‐40% ‐20% 0% 20% 40% 60%
United States
Canada
Mexico
Japan
Korea
Australia + New Zealand
Russia
China + Hong Kong, China
Indonesia
ASEAN 9
Chinese Taipei*
Chile*
Peru*
Papua New Guinea*
APEC11+ASEAN9
Total APEC
2005‐2008
2008‐2030
*APERCModel Results
What Is APEC’s Potential for Reducing Primary Energy Intensity in the IEA’s New Policies Scenario?
27
42% Improvement
by 2030
Raw Data for IEA Case © OECD/IEA 2010; calculations by APERC

‐80% ‐60% ‐40% ‐20% 0% 20% 40% 60%
United States
Canada
Mexico
Japan
Korea
Australia + New Zealand
Russia
China + Hong Kong, China
Indonesia
ASEAN 9
Chinese Taipei*
Chile*
Peru*
Papua New Guinea*
APEC11+ASEAN9
Total APEC
2005‐2008
2008‐2030
*APERCModel Results
What Is APEC’s Potential for Reducing Final Energy Intensity in the IEA’s New Policies Scenario?
28
43% Improvement
by 2030
Raw Data for IEA Case © OECD/IEA 2010; calculations by APERC

The New Policies Scenario takes into account all policies and measures included in the Current Policies Scenario as well as the following:
• “Cautious” implementation of the Copenhagen Accord commitments by 2020
• Continuation of the European Union Emissions Trading Scheme
• For 2020-2035, additional measures to maintain the pace of the global decline in carbon intensity...established in the period 2008-2020”
The IEA “New Policies Scenario”

• In addition the uncertainties already highlighted in the business-as-usual discussion, there are a number of additional uncertainties regarding how a “New Policies Scenario” would actually unfold, including
– How each economy’s pledge should be interpreted– The extent to which each economy will be able to implement
the pledges they have made– What will happen in the years after the current pledges expire
• So again, all the conclusions here must be regarded as approximate
Key Uncertainties
30

C. What Level of Intensity Reduction Would Be Consistent with Global Efforts to Limit Temperature Rises to 2o C?

2o C Limit in “Cancun Agreements”(194 Parties Participating, adopted 11 December 2010)
32

Why 450 PPM?
33
From: Intergovernmental Panel on Climate Change, Climate Change 2007: Synthesis Report, Figure 5.1, p 66.

“The 450 scenario takes into account all policies and measures included in the New Policies Scenario, some of which are assumed to be substantially strengthened and extended, plus the following:
• Implementation by 2020 of the high-end of the range of the Copenhagen Accord commitments, where they are expressed as ranges
• National policies and measures, such as efficiency standards for buildings and labelling of appliances
• Extension of nuclear plant lifetimes by 5 to 10 years with respect to the New Policies Scenaro
The IEA “450 Scenario”

‐80% ‐60% ‐40% ‐20% 0% 20% 40% 60%
United States
Canada
Mexico
Japan
Korea
Australia + New Zealand
Russia
China + Hong Kong, China
Indonesia
ASEAN 9
Chinese Taipei*
Chile*
Peru*
Papua New Guinea*
APEC11+ASEAN9
Total APEC
2005‐2008
2008‐2030
*APERCModel Results
What Is APEC’s Potential for Reducing Primary Energy Intensity in the IEA’s 450 Scenario?
35
47% Improvement
by 2030
Raw Data for IEA Case © OECD/IEA 2010; calculations by APERC

‐80% ‐60% ‐40% ‐20% 0% 20% 40% 60%
United States
Canada
Mexico
Japan
Korea
Australia + New Zealand
Russia
China + Hong Kong, China
Indonesia
ASEAN 9
Chinese Taipei*
Chile*
Peru*
Papua New Guinea*
APEC11+ASEAN9
Total APEC
2005‐2008
2008‐2030
*APERCModel Results
What Is APEC’s Potential for Reducing Final Energy Intensity in the IEA’s 450 Scenario ?
36
47% Improvement
by 2030
Raw Data for IEA Case © OECD/IEA 2010; calculations by APERC

• Oil prices are assumed to reach– $130/barrel by 2030 in the Current Policies Scenario– $110/barrel by 2030 in the New Policies Scenario– $90/barrel by 2030 in the 450 Scenario
• If oil prices turn out to be higher than this, it would reduce oil demand and thus reduce (improve) energy intensity
– A approximate rule-of-thumb is that a 10% reduction in oil demand improves primary energy intensity by 1.5% and final energy intensity by 2.0%
How Would Higher Oil Prices Affect These Results?
37

• In addition the uncertainties already highlighted in the business-as-usual discussion, there are a number of additional uncertainties regarding how a “450 Scenario”would actually unfold, including
– How much emission reduction would be expected of APEC economies vs. the rest of the world
– How much emission reduction would come from the energy sector vs. other sectors (agriculture, forestry, etc.)
– How much emission reduction would come from energy intensity reduction vs. lower carbon energy supply
• So again, all the conclusions here must be regarded as approximate
Key Uncertainties
38

D. Summary

Key Conclusions
40
• APEC EWG will need to consider carefully not only the numerical value of its energy intensity reduction target, but also its definition—primary or final energy intensity?
• The choice of definition does not change the target very much, but will change how APEC economies meet the target
• All numerical conclusions are very approximate, as there are a variety of uncertainties that could affect them
• A possible increase in oil prices above those assumed here will make any energy intensity target easier to meet

A.As a rough approximation, a 38-40% APEC-wide energy intensity reduction would be consistent with business-as-usual B.As a rough approximation, a 42-43% APEC-wide energy intensity reduction would be consistent with with “cautious” implementation of current pledgesC. As a rough approximation, a 47% APEC-wide energy intensity reduction would be consistent with cooperative efforts to limit temperature rises to 2o C
Some Indicative APEC-wide Energy Intensity Reduction Potentials for 2005-2030 Based on the Results
Presented Here
41

Appendix – Summary of Key Modeling Assumptions

Population Assumptions
43World Energy Outlook 20010 © OECD/IEA 2010, http://www.worldenergyoutlook.org/docs/weo2010/World_Energy_Model.pdf

GDP Assumptions
44World Energy Outlook 20010 © OECD/IEA 2010, http://www.worldenergyoutlook.org/docs/weo2010/World_Energy_Model.pdf

Fossil Fuel Price Assumptions
45World Energy Outlook 20010 © OECD/IEA 2010,

46World Energy Outlook 2010 © OECD/IEA 2010,

47World Energy Outlook 2010 © OECD/IEA 2010,

48World Energy Outlook 2010 © OECD/IEA 2010,

49World Energy Outlook 2010 © OECD/IEA 2010,

50World Energy Outlook 2010 © OECD/IEA 2010,