the political ideologies of law clerks and their judges
TRANSCRIPT
University of Chicago Law SchoolChicago UnboundCoase-Sandor Working Paper Series in Law andEconomics Coase-Sandor Institute for Law and Economics
2016
The Political Ideologies of Law Clerks and theirJudgesAdam Bonica
Adam S. Chilton
Jacob Goldin
Kyle Rozema
Maya Sen
Follow this and additional works at: https://chicagounbound.uchicago.edu/law_and_economics
Part of the Law Commons
This Working Paper is brought to you for free and open access by the Coase-Sandor Institute for Law and Economics at Chicago Unbound. It has beenaccepted for inclusion in Coase-Sandor Working Paper Series in Law and Economics by an authorized administrator of Chicago Unbound. For moreinformation, please contact [email protected].
Recommended CitationAdam Bonica, Adam S. Chilton, Jacob Goldin, Kyle Rozema & Maya Sen, " The Political Ideologies of Law Clerks and their Judges"(Coase-Sandor Working Paper Series in Law and Economics No. 754, 2016).

Electronic copy available at: http://ssrn.com/abstract=2739478
The Political Ideologies of Law Clerksand their Judges
Adam Bonica, Adam Chilton, Jacob Goldin, Kyle Rozema, & Maya Sen∗
February 29, 2016
We study the political ideology of judicial law clerks using a novel datasetthat combines the most comprehensive data sources on political ideologyand the identity of U.S. federal law clerks. First, we examine the distribu-tion of clerks’ ideology and find that clerks tend to be disproportionatelyliberal, with clerks on lower courts being more liberal on average thanclerks for higher courts. Second, we find that judges tend to consistentlyhire clerks with similar ideologies and that those ideologies track availablemeasures of the judge’s own ideology. Finally, we develop a dynamicclerk-based measure of judicial ideology and document its value as acomplement to existing approaches.
JEL: M51
Keywords : Political Ideologies, Law Clerks, Judges
∗Bonica: Stanford University, Department of Political Science, Encina Hall, 616 Serra Street,Stanford, CA 94305, e-mail: [email protected]. Chilton: University of Chicago Law School, 1111E. 60th Street, Chicago, IL 60601, e-mail: [email protected]. Goldin: Stanford Law School,e-mail: [email protected]. Rozema: Northwestern Pritzker School of Law, Levy Mayer Hall,375 East Chicago Avenue, Chicago, Illinois 60611, e-mail: [email protected]. Sen:Harvard University, Kennedy School of Government, 79 John F. Kennedy Street, Cambridge, MA02138, e-mail: maya [email protected].

Electronic copy available at: http://ssrn.com/abstract=2739478
1 Introduction
Law clerks occupy a central position in both academic and popular accounts
of the American judicial process. Large literatures in law and political science doc-
ument the role that clerks play in everything from the management of disputes in
district courts to the drafting of opinions at the U.S. Supreme Court (Rehnquist, 1957;
Newland, 1961; Baier, 1973; Mahoney, 1988; Chen, 1994; Ditslear and Baum, 2001;
Peppers, 2006; Avery et al., 2007; Peppers et al., 2008). Non-academic writing about
the judiciary emphasizes the importance of clerks as well, including a number of “tell-
all” books written by former clerks (Lazarus, 2005; Peppers and Ward, 2013; Cushman
and Peppers, 2015).
Despite the fascination with law clerks, a lack of data has impeded efforts to
study the group empirically, leaving many of the most basic facts about them largely
unknown. Because the ideology of legal actors is known to influence the decisions
they make (e.g., Sunstein et al., 2006; Miles and Sunstein, 2007; Chilton and Posner,
2015), the political ideology of clerks is of particular interest. For example, how do
clerks’ political views compare to other lawyers? Do judges hire clerks with ideological
leanings that are similar to their own? Does the ideology of the clerks that judges hire
tend to evolve over time? Given the potential influence of clerks on case outcomes
and the doctrines set out in judicial opinions (Chen, 1994; Peppers, 2006; Ward and
Weiden, 2006; Peppers and Zorn, 2008), these questions are not just theoretical.
In this article we study the political ideology of judicial law clerks. We do
so by constructing a novel dataset of clerk ideology that links the most comprehensive
population-level data available on political ideology with the most extensive datasets
on the identity of U.S. federal law clerks. Our data on political ideology exploits polit-
ical donations disclosed to the Federal Elections Commission between 1979 and 2014,
1

Electronic copy available at: http://ssrn.com/abstract=2739478
known as the Database on Ideology, Money in Politics, and Elections (DIME) (Bonica,
2013). Using this information, Bonica (2014) places roughly 15 million individuals on
an ideological spectrum based on who the individuals donated to and how much money
they contributed. Our data on the identity of U.S. federal law clerks comes from two
sources. First, we use data collected by Katz and Stafford (2010) on the identity of
roughly 18,000 individuals that served as either U.S. district or circuit court clerks be-
tween 1995 and 2004. Second, we use data from the Supreme Court Information Office
to identify the roughly 1,700 individuals who clerked on the U.S. Supreme Court be-
tween 1960 and 2015. Our final matched sample comprises information on the identity
and ideology of 7,969 individuals that completed federal district, circuit, or Supreme
Court clerkships.
We use these data to study the ideology of clerks in three ways. First,
we explore the overall distribution of clerks’ ideologies. The data reveal that clerks
generally skew to the left of the ideological spectrum, but that substantial variation
in clerk ideology exists by clerk subpopulations. In particular, female clerks are more
liberal than male clerks, clerks who attended Top 14 law schools are more liberal than
clerks from other law schools, and clerks on lower courts are more liberal than clerks on
higher courts. We also compare the ideology of clerks with that of other lawyers and
find that clerks more closely resemble the alumni of the elite law schools from which
they overwhelmingly come rather than the population of other lawyers.
Second, we analyze how the ideology of clerks corresponds to the ideology of
the judges they serve, using existing measures of judicial ideology. We first examine
the degree to which clerk ideology and judge ideology correlate. Our analysis reveals
that clerk ideology is strongly correlated with the ideology of their hiring judges. In-
terestingly, although clerks for conservative judges tend to be more conservative than
the clerks for liberal judges, we find that even many of the former group are left of
2

center. We also investigate the extent to which judges tend to hire ideologically similar
clerks over time and find strong evidence that they do. Moreover, this tendency toward
consistency becomes stronger at higher levels of federal courts.
Finally, we use the data on clerk ideology to construct a new measure of
the political ideology of judges. Our approach is motivated by the agency relationship
between judges and their law clerks. In particular, if judges tend to hire clerks with
similar ideological profiles (or if clerks prefer to work for judges who share their own
ideology), then the ideology of the clerks hired by a judge provides a signal as to the
ideology of the judge. We construct a clerk-based measure of judicial ideology for the
1083 district, appellate, and Supreme Court judges in our sample and validate the
approach using a common alternative measure of judicial ideology (Giles et al., 2001).
While admittedly imperfect, the new measure complements existing ap-
proaches in important ways.1 First, we leverage the fact that federal judges gener-
ally hire new law clerks each year to estimate judicial ideology dynamically. Thus,
unlike most existing measures of lower-court judge ideology, which estimate ideology
statically at the time of appointment (Giles et al., 2001; Epstein et al., 2007; Bonica
and Sen, 2016), our measure captures within-judge changes in ideology over time. A
second advantage of our approach is that it is available for the entirety of the federal
bench. That is, although not all judges make political contributions themselves (which
prevents the construction of ideology for many judges, as in Bonica and Sen, 2016) or
hear cases on overlapping panels (as is required for item response theory models that
are used to estimate ideology based on similarities in voting patterns, as in Martin
and Quinn, 2002), the vast majority of federal judges hire multiple law clerks each
year who often make contributions. To our knowledge, our approach is among the
first to allow time-varying estimates of the ideology of all judges outside the Supreme
1For a discussion of existing approaches to measuring judicial ideology, see generally Bailey (2016).
3

Court—a possibility that opens up a variety of questions for future research to explore.
This paper proceeds as follows. In Part 2 we briefly explain the role of clerks
in the U.S. legal system. In Part 3 we describe the sources of our data and how we
linked the political ideology measures to the identities of clerks. In Part 4 we present
information on the ideological distribution of law clerks. In Part 5 we explore the
relationship between the ideology of clerks and the judges who hire them. In Part 6
we develop a clerk-based measure of judicial ideology and illustrate its application. In
Part 7 we briefly discuss the limitations of our results and directions for future research.
2 The Role of Law Clerks
Given the well-documented role that law clerks play in the American legal
system, in this section we provide a brief sketch of their responsibilities and the small
but growing empirical literature on them. Clerks are typically hired by individual
judges to help that judge fulfill his or her duties. A clerk may help the judge by drafting
memos on upcoming cases, assisting with preparations for trial or oral arguments, and
writing the first draft of orders and final decisions (Newland, 1961; Baier, 1973; Peppers,
2006). The actual amount of responsibility given to clerks varies—some judges assign
their clerks with little more than copy editing whereas others delegate substantial
responsibility for the writing of opinions (Gulati and Posner, 2015).
Federal clerkships are prestigious, but usually temporary, appointments.
Federal judges usually hire clerks to work for them in the first few years after the
clerks have completed law school, meaning that most law clerks are in their mid-20s.
Typically, judges hire clerks to work for one year, but some judges hire clerks to work
for two years or longer. The number of clerks that judges are allowed to hire varies
based on the court and the workload of the judge. For example, at the Supreme Court
4

the Chief Justice can hire up to five clerks per term, Associate Justices can hire up to
four clerks, and retired Justices can hire up to one clerk per term.
To date, scholarship on law clerks has mostly been qualitative, documenting
the clerkship hiring process and the manner in which clerks are relied upon by judges.
However, a small but growing empirical literature has analyzed various aspects of the
hiring and influence of clerks, such as by surveying clerks and judges (Avery et al.,
2001, 2007; Peppers et al., 2008) and by studying networks and peer effects among law
clerks (Katz and Stafford, 2010). More recently, Rozema and Peng (2015) estimate a
model of the Supreme Court clerk hiring process, drawing on federal appellate clerk
data.
3 Data
Our analysis relies on a novel dataset we created that contains information
on the political ideology of U.S. federal law clerks. In this section, we first describe
our data on political ideology. We then discuss our two data sources on the identity
of federal law clerks. Finally, we explain the process we used to link these sources of
data.
3.1 Ideology Data
Our data on ideology come from the Database on Ideology, Money, and Elec-
tions (DIME) (Bonica, 2014), which contain information from the universe of campaign
contributions disclosed by the Federal Election Commission and state agencies. These
data include contributions made in local, state, and federal elections from 1979 to 2014
for individuals, political action committees, and corporations, and include approxi-
5

mately 100 million contributions and related information.2
We rely on DIME for its reporting of ideological scores known as common-
space “CFscores,” which are calculated from individual contributions using a scaling
methodology described in Bonica (2014). The approach derives ideological scores from
campaign contributions by assuming that individual donors tend to contribute to can-
didates with whom they are in ideological agreement. For example, we infer that an
individual who contributes to mostly center-left candidates will herself have a center-
left political ideology. The resulting CFscores situate individuals on a unidimensional
ideological scale, from extremely liberal to extremely conservative. The scale is nor-
malized such that it has a mean of zero and a standard deviation of one with respect
to the population of U.S. donors. For example, Hilary Clinton and Barack Obama, on
the ideological left side of the spectrum, have CFscores of -1.16 and -1.65, respectively;
Ron Paul and Scott Walker, on the ideological right, have CFscores of 1.57 and 1.28,
respectively; and Chris Christie and Joseph Lieberman, ideologically more moderate,
have CFscores of 0.46 and -0.54, respectively.
The CFscores have been extensively validated in prior work. As discussed by
Bonica (2014), the scores yield measures comparable to widely used ideological scores
for political actors. For example, CFscores have been shown to correlate strongly with
existing ideological estimates for Congressional representatives to recover the rank-
orderings of Supreme Court Justices yielded by existing measures, and outperform
ideological scalings for lower court federal judges (Bonica and Sen, 2016). As applied
to judicial clerks, an important advantage of the CFscore is that other measures of
ideology are generally unavailable, with the (rare) exception of those clerks who go on
to hold political office themselves.
An important concern with the CFscore methodology is that some donors
2More information can be found at http://data.stanford.edu/dime.
6
may contribute strategically for reasons other than an affinity for the recipient’s ide-
ological beliefs, such as a corporation that contributes to rival candidates during a
single election (Bonica, 2014; Bonica et al., 2015; Bonica and Woodruff, 2015). In
the context of the legal profession, one could imagine that some lawyers strategically
donate to those judges before whom they expect to argue cases. However, as discussed
in Bonica and Sen (2015), for individuals who are both recipients of contributions and
donors themselves, the CFscores derived from donations made are strongly correlated
with the CFscores derived from donations received. This correlation would emerge if
contributions were primarily motivated by ideological affinity between the contribu-
tor and recipient; it would be unexpected if contributions were simply the result of
strategic behavior by donors. Moreover, it is unlikely that many clerks make strategic
contributions to obtain their clerkship—most clerks are recent law school graduates
and the majority of the donations used to derive their CFscores occur well after their
clerkship concludes.3
Another limitation with DIME CFscores is that they are only available for
individuals who have made a political donation. Individuals who donate may differ
in potentially unobservable ways from those who do not. Although we will return to
this issue below, we note that concerns about selection into the donor population may
be less severe in the context of the present study than in other applications. This is
because although only about 5% of the U.S. population make a contribution during our
sample period, over 40% of lawyers (Bonica et al., 2015) do so. As we will see below,
the contribution rates among the clerks in our sample are in line with this figure for
3Of course, a potential concern is that a clerk’s ideology may change between the time of theclerkship and the time that subsequent donations are made. In practice, Bonica (2014) observes littleyearly variation when looking at the estimated ideology of political actors (members of Congress),a finding in line with broader literature within political science suggesting fairly stable partisan af-filiations over people’s lifespans (e.g., Green et al., 2004). However, as we discuss below, the samemay not be true for federal judges, for whom a lifetime appointment onto a federal court appears tobe a significant life-altering event. Thus, some ideological drift has been observed for federal judges,including Supreme Court Justices (Epstein et al., 2007).
7
lawyers.
3.2 Clerkship Data
Our data on the identity of U.S. federal law clerks comes from two sources.
The first source is a dataset constructed by Katz and Stafford (2010) that provides
information on law clerks who worked for federal appellate and district court judges
between 1995 and 2004. The clerkship data contain the clerk’s name, law school, and
the federal judge for whom the clerk worked. The data contain 5,082 circuit court
clerks and 12,672 district court clerks.
We evaluated the completeness of the Katz and Stafford (2010) clerkship
data in two ways. First, we investigated whether there was systemic failure to locate
judges by comparing the number of judges in the data with the number of judges
officially appointed in each year. Officially, there were between 154 and 163 appointed
circuit court judges (non-vacant seats) and between 603 and 664 appointed district
court judges for all years in the sample (1995 to 2004) (United States Courts, 2005;
Gryski et al., 2013). The clerkship data contains between 149 and 160 circuit court
judges each year, with the exception of 2001 (139 COA judges), and between 570 and
657 district court judges each year. Given that the clerkship data only includes active
judges who also hire law clerks, these facts offer some evidence that Katz and Stafford
located the large majority of federal judges who hired clerks.
Second, we investigated whether the clerkship data was likely to identify
clerks conditional on locating a judge within a year. We compared the mean number
of clerks located for each judge-year to the number of clerks we might expect judges
to hire each year. Under current Judicial Conference policy, full time federal judges
may hire up to five staff members, which include law clerks and judicial assistants
8

such as a secretary and court reporter (28 U.S.C. §331). If the circuit judge handles
less than a full case load, the number of judicial staff members declines proportionally
with the reduction in case load (e.g., a judge with a half case load gets two clerks) (28
U.S.C. §331). The yearly mean number of circuit court clerks per judge in the data is
consistently around three. A back of the envelope calculation suggests anywhere from
462 (154 circuit court judges per year times 3 clerks per judge) to 652 (163 circuit
court judges per year times 4 clerks per judge) circuit court clerks per year, which is
consistent with the clerkship data. The yearly mean number of district court clerks per
judge in the data is consistently around two. Before 2008, it was common for district—
but not circuit—court judges to employee “career clerks” (Milenkovski, 2008), which
are not in the data and explains why the number of district court clerks is around two.
Overall, it appears that Katz and Stafford captured the large majority of federal court
clerkships.
We supplement the Katz and Stafford data with data on Supreme Court
clerks from the Supreme Court Information Office. This data contains the universe
of clerks who worked at the Supreme Court between 1960 to 2015, a total of 1,691
Supreme Court clerks.
3.3 Linking the Clerkship and Ideology Data
We linked the data on political ideology and the identity of clerks using a
three step matching process. First, because the identifying information reported in
the clerkship data was limited to name, law school attended, and year of graduation,
we started by comparing the clerkship data against the Martindale-Hubbell directory.
We did so because the Martindale-Hubbell directory is among the most comprehensive
databases of attorneys in the United States today and has the significant benefit of
9

including additional information not contained in the clerkship data, including a unique
identifier number, current employer, geographic location, and, in some cases, area of
practice (Whisner, 2014). Fortunately, given the much smaller population of lawyers
as compared to donors, a small amount of information (name, law school, and year of
degree) was sufficient to uniquely match most clerks against records in the Martindale-
Hubbell directory. This step also gave us additional information on the clerks (e.g.,
gender).
Second, we used this additional information to match the clerks data to their
contribution records in DIME using an automated algorithm. The algorithm operated
by scanning (1) first, last, and middle name,4 (2) suffix, (3) title, (4) address, (5) firm
or employer, and (6) geographic proximity.
Third, we also recovered DIME scores for federal judges who served at any
point between 1995 and 2004, inclusive. For this, we took existing lists of federal judges
(for example, from the Federal Judicial Center) and manually matched them against
DIME CFscores.
Table 1: Proportion of Law Clerks Matched to Donations
Political Party ofAppointing President
Court Democrat Republican All
District Court 38.2 36.2 37.1
Appeals Court 46.2 45.1 45.5
Supreme Court 56.0 56.6 56.4
Total 41.3 40.9 41.0
4To adjust for variations across records, we used the Jaro-Winkler algorithm, which measures thedistance between two strings (in this case, names); the higher the distance, the more alike two stringsare.
10

Table 1 shows the proportion of clerks in our sample who we could match to
political campaign donations, disaggregated by court level and by the political party
of the president who appointed that clerk’s judge. There appears to be a positive
relationship between the level of the court and the proportion of clerks who donate.
For example, Supreme Court clerks donate at a much higher rate than district court
clerks (nearly 60% compared to 37%). Roughly half of all appellate court clerks in our
sample are contributors (46%), which is slightly higher than the overall contribution
rate of lawyers as a whole (43.4%, as reported by Bonica et al. (2015)). It is also worth
noting that, at each level, clerks for Republican-appointed judges donate at comparable
rates to clerks for Democratic-appointed judges.5
4 The Ideology of Clerks
We begin by looking at the distribution of clerks’ ideology. We first look
at the distribution of our overall sample. We then disaggregate the ideology of clerks
by gender, court, and law school. Finally, we compare the ideology of clerks to the
ideology of other lawyers.
4.1 Clerk Ideology Overall
Figure 1 plots the overall distribution of the ideology of the clerks in our
sample. The x-axis is the CFscore, which runs roughly from extremely liberal on the
far left to extremely conservative on the far right. The y-axis represents the proportion
of clerks that have a particular ideology. The line in Figure 1 is a density curve that
shows the proportion of clerks that have a particularly ideology score.
5Table A1 in the Appendix provides a breakdown of clerk donation rates by law school.
11

Figure 1: Distribution of Clerk CFscores
There are several things worth noting about Figure 1. First, the majority of
clerks in our sample are to the left of the ideological spectrum. In fact, 75% of clerks
have a CFscore that is below zero. Second, the mean CFscore for the clerks in our
sample is -0.60, and the median CFscore is -0.97. To put this in perspective, the mean
is roughly comparable the CFscore of Bill Clinton (-0.68). Additionally, although
Figure 1 shows a much higher density of liberal clerks than conservative clerks, the
distribution of clerk CFscores is bimodal. For example, not only do 25% of clerks have
a conservative CFscore, there are also a large number of law clerks with a CFscore
of roughly 1.0, which is comparable to the CFscore of Mitt Romney (0.88). Taken
together, this suggests that although clerks are largely liberal, they are still somewhat
12

representative of the two party divide in American politics.
4.2 Clerk Ideology by Gender
Figure 2: Distribution of Clerk CFscores by Gender
Figure 2 plots the distribution of clerk CFscores stratified by gender.6 Fig-
ure 2 highlights that male clerks are, on average, more conservative than female clerks.
Male clerks have a mean CFscore of -0.48, and a median CFscore of -0.85. In contrast,
female clerks have a mean CFscore of -0.85, and a median CFscore of -1.14. This differ-
ence is due to the fact that there the male CFscore distribution exhibits an even more
6In our sample, 60% of the clerks are male and 38% of the clerks are female (we were unable toidentify the gender of 2%).
13

apparent bimodal distribution than the overall sample. In other words, a relatively
large fraction of male clerks are conservative, but only a small fraction of females are
noticeably conservative.
4.3 Clerk Ideology by Court
Figure 3: Distribution of Clerk CFscores by Court
Figure 3 plots the distribution of clerk CFscores stratified by level of court.
The mean clerk CFscore for clerks who worked in district courts is -0.62, for clerks who
worked in appellate courts is -0.63, and for clerks who worked in the Supreme Court is
-0.48. Perhaps the most striking fact about Figure 3 is that higher-level courts employ
clerks who are more divided along the ideological spectrum. That is, there is a more
14

bimodal distribution for the Supreme Court than the circuit courts, and similarly a
more bi-modal distribution for the circuit courts than the district courts. To be more
exact, 32% of Supreme Court clerks, 25% of circuit court clerks, and 24% of district
court clerks had a positive (and thus conservative) CFscore.
4.4 Clerk Ideology by Law School
Figure 4 plots the distribution of clerk ideology stratified by law school. The
Figure presents the ideology of clerks that attended the Top 14 law schools based on
the 2015 U.S. News & World Report rankings. Clerks from law schools outside the
listed 14 institutions are grouped in the residual “All Other” category.7
Overall, clerk ideology appears to be somewhat correlated within law schools,
providing evidence that clerks either sort into law schools based on political views or
law schools shape the political views of their students, or some combination of both.
Clerks from law schools in areas that have a reputation of having a particularly liberal
population (e.g., Berkeley, Stanford, NYU) are typically more liberal than clerks from
areas that have a reputation of having a more conservative population (e.g., Virginia,
Duke). However, other law schools that presumably pull from wider geographic areas
(e.g., Harvard, Yale) appear to have a bimodal distribution of clerks, with ideologies
that mimics that of the entire sample of clerks.
7We focus on the Top 14 law schools because federal clerks largely come from the most prestigiouslaw schools and because these schools have been consistently recognized as the top tier by U.S. News &World Report rankings. These schools have also been schools examined in prior research on ideology(Bonica et al., 2015; Chilton and Posner, 2015).
15

Figure 4: Distribution of Clerk CFscore by Law School
Note: Vertical line indicates the median clerk CFscore for the given law school.
16
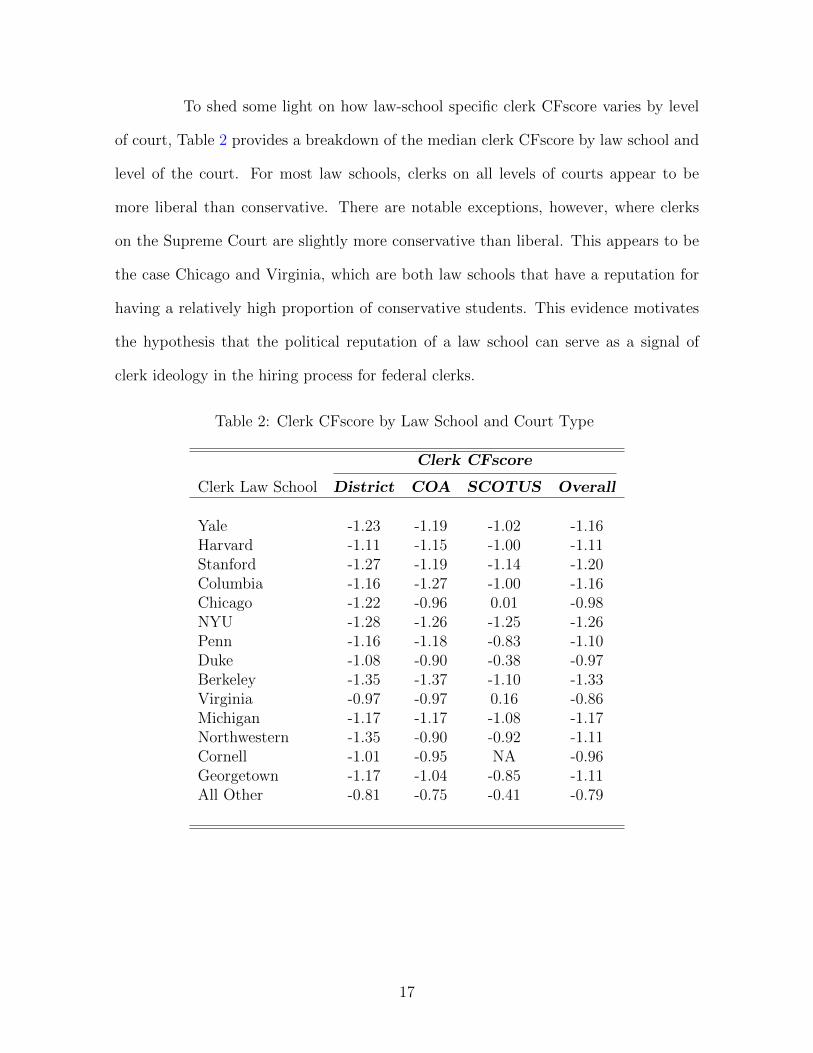
To shed some light on how law-school specific clerk CFscore varies by level
of court, Table 2 provides a breakdown of the median clerk CFscore by law school and
level of the court. For most law schools, clerks on all levels of courts appear to be
more liberal than conservative. There are notable exceptions, however, where clerks
on the Supreme Court are slightly more conservative than liberal. This appears to be
the case Chicago and Virginia, which are both law schools that have a reputation for
having a relatively high proportion of conservative students. This evidence motivates
the hypothesis that the political reputation of a law school can serve as a signal of
clerk ideology in the hiring process for federal clerks.
Table 2: Clerk CFscore by Law School and Court Type
Clerk CFscore
Clerk Law School District COA SCOTUS Overall
Yale -1.23 -1.19 -1.02 -1.16Harvard -1.11 -1.15 -1.00 -1.11Stanford -1.27 -1.19 -1.14 -1.20Columbia -1.16 -1.27 -1.00 -1.16Chicago -1.22 -0.96 0.01 -0.98NYU -1.28 -1.26 -1.25 -1.26Penn -1.16 -1.18 -0.83 -1.10Duke -1.08 -0.90 -0.38 -0.97Berkeley -1.35 -1.37 -1.10 -1.33Virginia -0.97 -0.97 0.16 -0.86Michigan -1.17 -1.17 -1.08 -1.17Northwestern -1.35 -0.90 -0.92 -1.11Cornell -1.01 -0.95 NA -0.96Georgetown -1.17 -1.04 -0.85 -1.11All Other -0.81 -0.75 -0.41 -0.79
17

4.5 Clerk Ideology Compared to Other Lawyers
Finally, we examine how the ideology of clerks compares to the ideology
of lawyers overall. To do so, Figure 5 presents the ideology of law clerks alongside
the ideology of all lawyers and lawyers who received their law degree from a Top 14
law school. We generated the data for the population of clerks in our sample and all
other lawyers with DIME CFscore by linking the DIME CFscores with the Martindale-
Hubbell directory of lawyers (for more information, see Bonica et al. (2015)).
Figure 5: Distribution of CFscores for Clerks and Lawyers
Although Figure 5 reveals that all three populations have roughly similar
ideological distributions, it also reveals that clerks are more liberal on average than
lawyers overall and than graduates from Top 14 schools. Moreover, it reveals that the
18

distribution of clerks more closely resembles the distribution of graduates from Top
14 law schools than it does the overall population of lawyers. For instance, the mean
CFscore for clerks, attorneys from Top 14 law schools, and all attorneys are -0.60,
-0.55, and -0.32, respectively. Of course, this is perhaps unsurprising because judges
tend to hire clerks from elite schools.
Table 3: Difference Between Clerk Ideology and Lawyer Ideology
CFscore
(1) (2) (3) (4)
Indicator for Clerk -0.224∗∗∗ -0.152∗∗∗ -0.028 -0.005(0.021) (0.021) (0.021) (0.020)
Top 14 Law School -0.301∗∗∗
(0.004)
Years as a Lawyer 0.005∗∗∗ 0.006∗∗∗ 0.006∗∗∗
(0.000) (0.000) (0.000)
Female -0.347∗∗∗ -0.345∗∗∗ -0.300∗∗∗
(0.003) (0.003) (0.003)
Law School FE No No No Yes
Observations 385,758 385,758 385,758 385,758R2 0.000 0.039 0.056 0.141
Note: Standard errors in parentheses. ∗ p<0.1, ∗∗ p<0.05, ∗∗∗
p<0.01
To further investigate the sources of ideological differences between clerks
and the overall lawyer population, Table 3 regresses lawyer CFscore on an indicator
for whether the individual was a clerk. As reflected in Figure 5, Column (1) shows
that clerks are on average more liberal than other lawyers. Column (2) adds control
variables for years practicing law and gender; the coefficient on the clerk indicator
19
declines in magnitude but is still statistically significant. Columns (3) and (4) account
for the clerk’s law school, with an indicator for having attended a Top 14 law school and
law school fixed effects (respectively). With these additional controls, the differences
between clerk and non-clerk ideologies is close to zero and statistically insignificant,
suggesting that gender, law school, and age cohort explain the ideological differences
we observe between clerks and other lawyers.
5 The Role of Clerk Ideology in Clerkship Hiring
Given the important role that clerks play within judicial chambers, it is
worth examining whether judges exclusively hire clerks who are ideological allies or
whether they hire clerks broadly from across the ideological spectrum.8 This is impor-
tant because ideological sorting within clerk hiring might exacerbate already existing
levels of polarization (Liptak, 2010). In addition, because clerks often take lead roles
in the research and drafting of opinions, clerks who exclusively share the ideology of
their judicial employers (or, alternatively, clerks who represent a diversity of ideological
opinions) may in the end affect the decisions that judges produce. Lastly, there may be
profound differences in clerk hiring by judges on different levels of courts or among cer-
tain kinds of judges (for example, extremely liberal or extremely conservative judges).
To date, these have been questions which have been addressed by anecdotal evidence
only.
In this section, we investigate the relation between clerk ideology and the
ideology of the judge who hires them. First, we examine the consistency in the ideology
of the clerks hired by a judge over time to study the importance of ideology in the
8Some judges are open about the weight they attached to ideology in the clerkship hiring pro-cess. For example, (Liptak, 2010) quotes Justice Thomas: ”I won’t hire clerks who have profounddisagreements with me. It’s like trying to train a pig. It wastes your time, and it aggravates the pig.
20
clerkship hiring process. After finding evidence that the clerks hired by a judge tend
to be ideologically similar to one another, we examine the correlation between judge and
clerk CFscores to investigate whether judges tend to hire clerks who are in ideological
alignment with their own beliefs. We also study how these effects vary across circuits
and types of courts.
5.1 Ideological Consistency Among Hired Clerks
Before turning to the question of whether judges hire clerks who share their
ideologies, an initial question to ask is whether judges even hire ideologically similar
clerks in the first place. That is, if clerk ideology played no role in the process by which
clerks were matched to judges, we would not expect the ideology of a clerk hired by
a judge to be the same as the ideology of other clerks hired by the judge in the same
year or in other years.
To study the extent to which judges hire clerks with consistent ideologies,
we regress clerk ideology on the average ideology of all other clerks hired by the same
judge, according to Equation (1).
CFij = βCFij + γi + εij (1)
where CFij is the CFscore for clerk i who clerked for judge j. The regressor of interest,
CFij, is the mean CFscore of all clerks hired by judge j excluding clerk i, CFij =
1Nj−1
(∑Nj
k=1 CFkj − CFij
)and Nj denotes the number of clerks in our sample who
clerked for judge j. We also include a vector of law school fixed effects, γi, to account
for the possibility that ideological consistency among a judge’s clerks is driven by
a judge’s tendency to hire clerks from a particular law school.9 The coefficient of
9The results are largely unchanged when we exclude law school fixed effects.
21

interest, β, thus captures the extent to which the ideology of a given clerk resembles
the ideology of the other clerks hired by the same judge, holding constant law school
attended. A coefficient of zero would indicate that ideology does not enter (either
directly or indirectly) into the clerkship hiring process.10 In contrast, if judges hired
clerks based on a fixed ideological target, we would expect to obtain a coefficient of
1; an observer’s best guess for the ideology of a randomly drawn clerk would be the
average ideology of the other clerks hired by the same judge.
Table 4: Ideological Consistency in Clerk Hiring
CFscore
Level of Court
All Courts District Appeals Supreme All Courts(1) (2) (3) (4) (5)
All Other Clerks 0.688∗∗∗ 0.617∗∗∗ 0.702∗∗∗ 0.914∗∗∗ 0.598∗∗∗
(0.016) (0.021) (0.033) (0.046) (0.030)
Republican Appointed Judge 0.179∗∗∗
(0.032)
All Other Clerks×Republican Appointed Judge 0.078∗∗
(0.036)
Clerk Law School FE Yes Yes Yes Yes Yes
Observations 7,846 4,598 2,296 952 7,846R2 0.223 0.205 0.215 0.350 0.227
Note: Standard errors in parentheses. ∗ p<0.1, ∗∗ p<0.05, ∗∗∗ p<0.01.
10It is also possible that a judge might care about a potential clerk’s ideology but that concern notmanifest itself in hiring ideologically similar clerks. As an example, for many years Justice Scalia wasrumored to hire one liberal clerk each term in addition to three conservatives. See Appendix FigureA1, which presents the ideology Scalia’s clerks by year. Although we cannot confirm or reject the “oneliberal per term” theory without observing the universe of hired clerks, we note that we frequentlyobserve one (and no more than one) liberal Scalia clerk per term for years after 1988, and virtuallyno liberal clerks after 2005.
22

Table 4 displays the results. Columns (1) and (5) represent the full sample of
all law clerks, while Columns (2) through (4) stratify the sample by level of court. The
Table suggests that the ideological consistency among clerks hired by a judge increases
with the level of the court. That is, we observe larger point estimates for Supreme
Court clerks than for circuit court clerks and larger point estimates for circuit court
clerks than for district court clerks.
There are several potential reasons for this pattern. First, judges higher
in the judicial hierarchy may have stronger preferences for clerk ideology given the
greater flexibility of judges on such courts to decide cases in ways that are consistent
with their policy preferences. That is, lower court judges may be constrained by
doctrine and past precedent in a way that circuit court judges are not, especially
those on the Supreme Court. Second, judges across the judicial hierarchy might face
different information asymmetries regarding a potential clerk’s ideology; specifically,
Supreme Court justices can rely on information from appellate court judges to form
better expectations regarding a potential clerk’s ideology. Third, judges higher up the
judicial hierarchy can be more selective when hiring clerks, and thus may have an easier
time finding qualified candidates that meet their ideological preferences.
Column (5) of Table 4 adds an interaction term for the judges appointed
by Republican presidents. Unsurprisingly, the main effect associated with being a
Republican appointee is positive and statistically significant (such judges tend to hire
more conservative clerks). Interestingly, the coefficient on the interaction term is also
positive and statistically significant, which suggests that Republican appointees have
a greater tendency to be more ideologically consistent in the clerks that they hire than
Democratic appointees.
Table 5 provides some additional context by examining the results from the
same specification for Court of Appeals clerks, disaggregated by Circuit. The results
23

Table 5: Predicting Clerk CFscore from Mean of All Other Clerk CFscores by Circuit
Circuit Coef. Std Error N
1st Circuit -0.778 (0.871) 8910th Circuit 0.023 (0.263) 1205th Circuit 0.371∗∗ (0.172) 2527th Circuit 0.535∗∗∗ (0.138) 1402nd Circuit 0.557∗∗∗ (0.145) 21211th Circuit 0.647∗∗∗ (0.097) 856th Circuit 0.671∗∗∗ (0.117) 2069th Circuit 0.671∗∗∗ (0.108) 4178th Circuit 0.718∗∗∗ (0.138) 132DC Circuit 0.748∗∗∗ (0.146) 1744th Circuit 0.821∗∗∗ (0.079) 1653rd Circuit 0.854∗∗∗ (0.107) 162
Note: Standard errors in paren-theses. ∗ p<0.1, ∗∗ p<0.05, ∗∗∗
p<0.01.
here show interesting variation by circuit. Except for the First and Tenth Circuits,
all of the results are positive and statistically significant.11 However, these findings do
not appear to us to correlate strongly with the perceived ideological reputations of the
circuits. For example, the Ninth Circuit, well-known for being liberal, is on par with
the more conservative Eleventh Circuit. Among the courts where judges hire the most
ideologically consistent clerks are the D.C. Circuit, as well as the Third and Fourth
Circuits.
5.2 The Relationship Between Judge and Clerk Ideology
Having documented that judges tend to hire clerks with similar ideologies
to their other clerks, we turn now to the question of how clerk ideology relates to the
11The result for the Fifth Circuit is only significant at the 10% level, but all of the other resultsare highly significant.
24

ideology of the hiring judge. As described above, we measure judge ideology the same
way as we measure clerk ideology – using the CFscore for each judge who appears
in DIME.12 We supplement the CFscore data with data on the political party of the
president who appointed the judge, a common proxy for judicial ideology.
We begin by examining the overall ideology of federal judges in the United
States.13 Figure 6 plots the distribution of judge CFscores, with each judge representing
a single observation. Like the distribution of clerk CFscores, the distribution of judge
CFscores is bimodal, revealing one mode at the center-right end of the distribution and
one mode at the center-left of the distribution.
Figure 6: Distribution of Judge CFscores
12We match 93 percent of judges to DIME. We refer readers to Bonica and Sen (2016) for anextended discussion of the strengths and weaknesses of using political contributions to measure judicialideology.
13See Bonica and Sen (2015) for additional work along these lines.
25

The same pattern is borne out by Figure 7, which disaggregates the judicial
CFscore distribution by the party of the appointing president. Predictably, judges
appointed by Democratic presidents have a median CFscore that is left of center,
whereas judges appointed by Republican presidents have a median CFscore that is
right of center.14 It is worth noting that there are some exceptions to this general
pattern. For example, of the 651 Republican appointed judges, we measure 10.8%
(70 judges) to be at least somewhat liberal (negative CFscore); of the 474 Democratic
appointed judges, we measure 11.4% (54 judges) to be at least somewhat conservative
(positive CFscore).
Figure 7: Distribution of Judge CFscores by Political Party of Appointing President
As Figures 6 and 7 make clear, however, judges tend to be more conservative
14This sort of bimodal distribution also characterizes ideological distributions in other branches ofgovernment, for example in Congress.
26
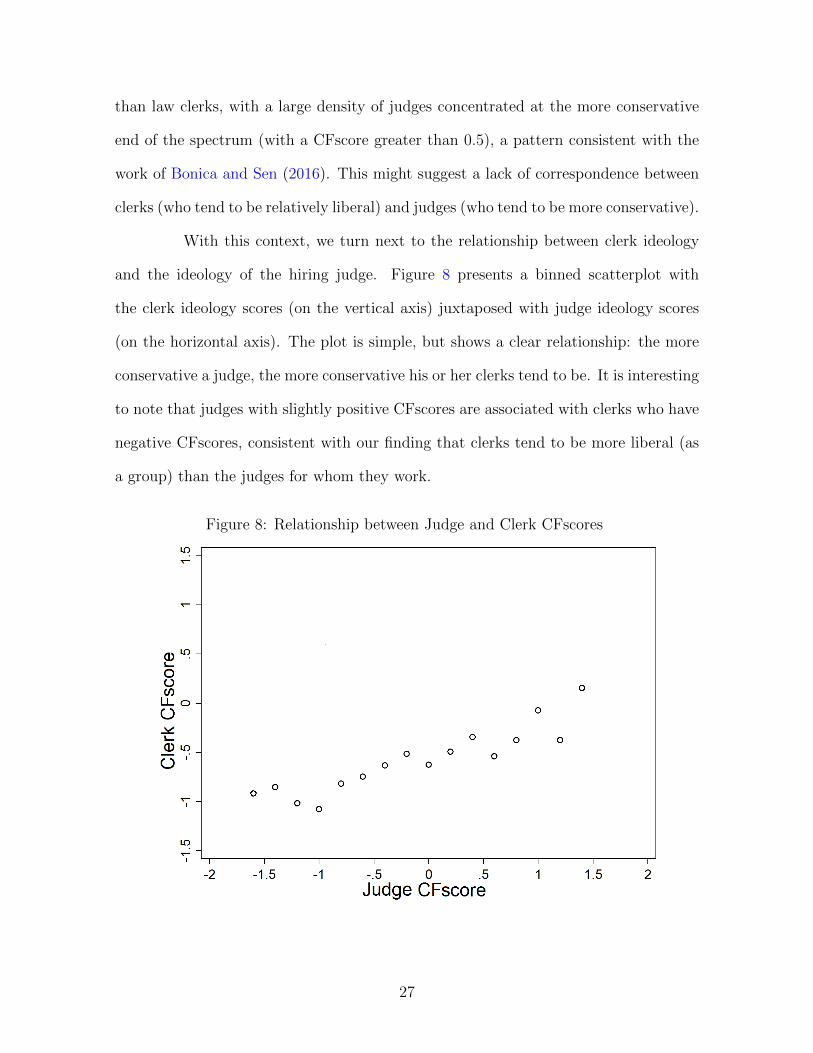
than law clerks, with a large density of judges concentrated at the more conservative
end of the spectrum (with a CFscore greater than 0.5), a pattern consistent with the
work of Bonica and Sen (2016). This might suggest a lack of correspondence between
clerks (who tend to be relatively liberal) and judges (who tend to be more conservative).
With this context, we turn next to the relationship between clerk ideology
and the ideology of the hiring judge. Figure 8 presents a binned scatterplot with
the clerk ideology scores (on the vertical axis) juxtaposed with judge ideology scores
(on the horizontal axis). The plot is simple, but shows a clear relationship: the more
conservative a judge, the more conservative his or her clerks tend to be. It is interesting
to note that judges with slightly positive CFscores are associated with clerks who have
negative CFscores, consistent with our finding that clerks tend to be more liberal (as
a group) than the judges for whom they work.
Figure 8: Relationship between Judge and Clerk CFscores
27

Table 6 confirms this visual evidence by regressing clerk ideology, CFij, on
judge ideology, CFj. Column (1) replicates the basic finding from Figure 8. A standard
deviation shift in judicial ideology is associated with a 0.35 standard deviation shift
in the average ideology of the clerks hired by that judge. Column (2) adds clerk-level
controls, specifically the law school attended. The results are largely unchanged by
this addition.
Table 6: Relationship Between Judge and Clerk Ideologies
Clerk CFscore
Level of Court
All All District Appeals Supreme All(1) (2) (3) (4) (5) (6)
Judge CFscore 0.345∗∗∗ 0.313∗∗∗ 0.248∗∗∗ 0.361∗∗∗ 0.728∗∗∗ 0.301∗∗∗
(0.014) (0.014) (0.018) (0.025) (0.085) (0.030)
Republican Appointed Judge -0.105∗∗∗
(0.033)
All Other Clerks -0.085∗
×Republican Appointed Judge (0.045)
Law School FE No Yes Yes Yes Yes Yes
Observations 7,252 7,252 4,622 2,283 347 7,252R2 0.074 0.107 0.096 0.133 0.276 0.108
Note: Standard errors clustered by judge in parentheses. ∗ p<0.1, ∗∗
p<0.05, ∗∗∗ p<0.01.
We next explore whether these patterns vary by the type of court or the
party of the president that appointed the judge. Figure 9 begins this analysis by
plotting the distribution of clerks by the level of court. The figure shows that the
basic pattern demonstrated by Figure 8 still holds: more conservative judges tend to
hire more conservative clerks, on average, and this is consistent across the judicial
28

hierarchy. Columns (3) to (5) of Table 6 provides additional support. While clerk
ideology is positively and significantly associated with judge ideology at all levels of
court, the effects are more pronounced at circuit courts than at district courts, and
most pronounced at the Supreme Court.
Figure 9: Correlation between Judge and Clerk CFscore by Court
Finally, we examine whether the relationship between judge and clerk ideol-
ogy varies based on the party of the president who appointed the judge. Column (6)
of Table 6 provides suggestive evidence that it does – the coefficient on the interaction
between the judge being appointed by a Republican president and judicial ideology is
negative and marginally significant. The result suggests that the clerks of Democratic
appointees more closely resemble the ideologies of their judges than do the clerks of
Republican appointees – a result that is not surprising given the greater prevalence of
liberal versus conservative clerks.
29

Figure 10: Distribution of Clerk CFscore by the Party of Judge’s Appointing President
Figure 11: Clerk Ideology for Republican-Appointed Judges by Level of Court
30

However, Figure 10, which plots the distribution of law clerk ideology by
the party of the appointing President, adds important context to this story. The
figure shows that although Republican appointees hire relatively more conservative
clerks than Democratic appointees, in absolute terms the former nonetheless hire more
liberal than conservative clerks. This is a surprising fact and is worth emphasizing:
judges appointed by Republicans are more likely to hire clerks who come from the
left-side of the ideological spectrum. Although future research will be required to
determine exactly why this is the case, one possibility is that this might simply be due
to the fact that graduates from the top law schools—who largely serve as the potential
applicant pool for most clerkships—are overwhelmingly liberal. Thus, conservative
judges may not have many options in terms of hiring graduates from top law schools
and hiring conservatives. Figure 11 presents additional evidence consistent with this
theory. The hiring of liberal clerks by Republican appointees is less common for circuit
court judges—who can typically select from a broader pool of applicants than district
court judges—and even slightly less common for the Supreme Court, where justices
have an exceptionally wide pool of qualified applicants from which to select.15
Before concluding this section, it bears emphasizing that the results pre-
sented here should be interpreted as descriptive; our analysis does not permit conclu-
sions about the causal directions at work. In particular, the correlation between clerk
and judge ideology that we observe could result from judges prioritizing the hiring of
ideologically aligned clerks, or it could just as easily be clerks prioritizing ideologically
aligned judges when deciding which clerkships to apply for and which to accept. Alter-
natively, the matching of ideologically similar clerks and judges could stem from more
complicated channels. For example, it could be that judges do not care about clerk
15Of course, it is also possible that this pattern reflects increasing attention to clerk ideology byjudges when hiring clerks at higher levels of courts.
31
ideology but base their hiring decisions on recommendations from lower court judges
or law school professors who do.
6 A Clerk-Based Measure of Judicial Ideology
After documenting the tight link between existing measures of judicial ide-
ology and clerk ideology in the previous section, we now turn to leveraging our data
to develop a measure of judicial ideology based on the ideology of the clerks a judge
hires. The rationale behind the measure is that clerks will tend to work for judges with
whom they are ideologically aligned. The mechanism behind this process could be
judges seeking ideologically aligned clerks to hire, clerks seeking ideologically aligned
judges to work for, or other factors driving the correlation, such as shared law school
or geographic networks.
In this section, we explain why our clerk-based measures of judicial ideology
offer several important advantages that make them appealing complements to existing
sources of information on judicial ideology, particularly in cases where existing ideo-
logical measures are missing, unreliable, or static. We also describe how the measure is
constructed, explore how it varies by judges and courts, and validate it by comparing
it to an existing measure of judicial ideology.
6.1 Existing Measures of Judicial Ideology
There is a fairly extensive literature on the how best to address the method-
ological issues associated with trying to measure the ideology of judges across tiers of
the federal judiciary.16 For the U.S. Supreme Court, methodological issues are less of a
concern: the simple fact that the nine Justices sit together makes it straightforward to
16See Fischman and Law (2009) for an overview.
32
leverage votes on cases to generate dynamic ideological estimates. For example, Mar-
tin and Quinn (2007) have used Bayesian ideal-point estimation to generate measures
of Supreme Court ideology that have become widely used in both law and political
science.17
For the lower courts, however, methodological issues are more of a concern.
This is because judges—including U.S. district court judges or circuit court judges—
rarely sit together outside of their home jurisdictions, making it difficult to “bridge”
votes on case outcomes across different courts to generate scalable ideological esti-
mates.18 Given this problem, alternative methods of measuring judicial ideology have
been developed for federal district and circuit courts. Perhaps the best known are Judi-
cial Common Space (JCS) Scores (Giles et al., 2001; Epstein et al., 2007; Boyd, 2010),
which leverage the identity of the appointing political actors to produce estimates of
the ideology of a given judge. Specifically, JCS Scores rely on the ideal point estimate
of either the judge’s appointing President or, in the event that the President and the
home-state Senator(s) are of the same party, then that of the senior co-partisan Senator
(or an average of both Senators, if both are of the same party). More recently, Bonica
and Sen (2016) use the DIME scores we leverage here to generate estimates for federal
district and circuit court judges based on their political contributions.
Although the JCS and the Bonica and Sen scores are useful measures of lower-
court judge ideology, they are both estimated at time of investiture and are therefore
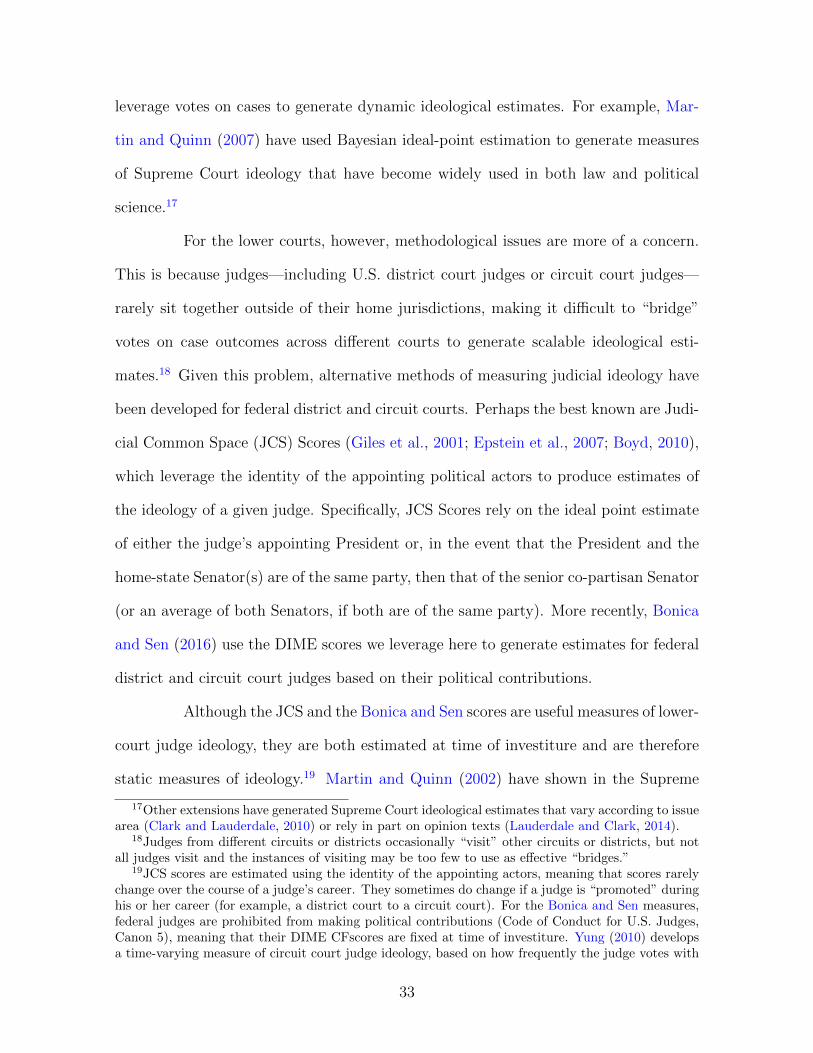
static measures of ideology.19 Martin and Quinn (2002) have shown in the Supreme
17Other extensions have generated Supreme Court ideological estimates that vary according to issuearea (Clark and Lauderdale, 2010) or rely in part on opinion texts (Lauderdale and Clark, 2014).
18Judges from different circuits or districts occasionally “visit” other circuits or districts, but notall judges visit and the instances of visiting may be too few to use as effective “bridges.”
19JCS scores are estimated using the identity of the appointing actors, meaning that scores rarelychange over the course of a judge’s career. They sometimes do change if a judge is “promoted” duringhis or her career (for example, a district court to a circuit court). For the Bonica and Sen measures,federal judges are prohibited from making political contributions (Code of Conduct for U.S. Judges,Canon 5), meaning that their DIME CFscores are fixed at time of investiture. Yung (2010) developsa time-varying measure of circuit court judge ideology, based on how frequently the judge votes with
33

Court context, however, that there is ideological movement over a judge’s tenure, in-
cluding systematic intellectual drift (Epstein et al., 2007). Lower-court judges, al-
though perhaps more constrained in their decision-making, may also exhibit temporal
movement in ideology.
For this reason, an important feature of our clerk-based measure of ideology
is that it is dynamic. Because most clerkships are one-year terms, judges must hire new
clerks each year. As a result, changes in judicial ideology over time may be reflected
in changes in the ideological composition of the clerks the judge hires. Although the
results in the previous section show that the correlation between clerks’ ideologies and
those of their hiring judge is by no means perfect, the measure may be quite useful for
examining within-judge changes over time. Indeed, if judges’ changing ideologies are
realized in part through their choice of law clerks, then these measures should capture
meaningful ideological changes over time.
In addition, under our approach, ideology can be estimated for nearly every
federal judge. Although not every judge will have made sufficient political contributions
themselves to approximate their ideology from DIME, nearly every judge with several
years of experience on the bench will have hired at least several clerks who do make
contributions. Along these lines, the more years a judge is on the bench, the more
reliable our measure becomes, as each newly hired clerk offers a potentially new data
point. In contrast, most existing measures of ideology, like JCS scores, do not grow
in reliability because they turn on information that is fixed at the time of a judge’s
investiture. The flip side to this coin is that a judge’s clerk-based ideology score may be
quite noisy in the first few years of a judge’s appointment. Relatedly, the clerk-based
score for a particular judge may be unavailable in the first few years following a judge’s
appointment, as recent clerks may not make political contributions for several years
Democrat versus Republican appointees during a given term.
34

after the clerkship concludes.
6.2 Method
To obtain our clerk-based measure of judicial ideology, we average the CFs-
cores of each clerk employed by a particular judge. That is, we define the clerk-based
ideology score for judge j, CBIj, as
CBIj =1
Nj
Nj∑i=1
CFij
where CFij denotes the CFscore of clerk i who worked for judge j and Nj denotes the
number of clerks in our sample who worked for judge j. To reduce the noisiness of the
measure, we compute CBIj only for judges for whom Nj ≥ 4.
Using this approach, we compute the clerk-based ideology score for each
federal judge at the district, appellate, and Supreme Court levels.
6.3 Judicial Ideology Based on Clerk Ideology
To illustrate the viability of using clerk ideology to measure judicial ideology,
Table 7 presents the names of those 15 federal circuit court judges with the most
liberal and the most conservative law clerks based on their clerks’ average CFscores.20
Unsurprisingly, the 15 judges with the most conservative law clerks are all Republican-
appointed judges. On this list are prominent conservatives, including former “feeder
judge” J. Michael Luttig of the Fourth Circuit21 and Samuel Alito of the Third Circuit.
The prominence of these names on lists of potential U.S. Supreme Court appointments
(and of one name, Alito, who eventually did become a Supreme Court Justice) gives
20Table A4 in the Appendix presents the same table for district court judges.21Luttig was the former boss of 2016 Presidential candidate Senator Ted Cruz (R-TX), who clerked
for Luttig in the 1995-1996 term.
35

some suggestive support for the idea that hiring conservative law clerks could have
been an important ideological signal of political interest.
However, the list of the 15 judges with the most liberal law clerks is more
surprising and, indeed, includes not one but two Republican-appointed judges: David
Thompson of the Ninth Circuit and Edward Becker of the Third Circuit. Both men
were Ronald Reagan appointees and were known for being strong moderates; Becker in
particular enjoyed a reputation for ideological plurality in his chambers and routinely
invited his law clerks to spar about different cases with him. The rest of the names on
the list of judges hiring liberal clerks include known liberals such as Stephen Reinhardt
(Ninth Circuit) and Marsha Berzon (Ninth Circuit). Of the 15 judges, nine are from
the Ninth Circuit.
As another illustration of the validity of using clerk ideology as a measure
of judicial ideology, Table 8 presents the average clerk CFscore for the more recent
members of the U.S. Supreme Court from most liberal to most conservative.22 Not
only do most of these CFscores suggest that Supreme Court law clerks are fairly liberal
on average (which was echoed in Figure 9), but the relative ranking of the justices
recovers familiar patterns. On the most liberal end of the hiring spectrum is Ruth
Bader Ginsburg and on the most conservative end is Clarence Thomas, with justices
like Potter Stewart, Hugo Black, and Sandra Day O’Connor falling in between. Perhaps
the lone surprise of this table is the fact that Anthony Kennedy’s clerks (mean CFscore
of 0.16) are more conservative than Chief Justice John Roberts’ clerks (mean CFscore
0.12), suggesting that Kennedy’s clerks are actually quite conservative relative to the
Justice’s own moderate reputation.23
22The scores for every federal circuit and district judge are reported in Appendix Tables A2 andA3, respectively.
23Appendix Figure A2 illustrates the distribution of clerk ideology by justice.
36

Table 7: Circuit Court Judges with the most liberal and conservative clerks
Appointing MeanJudge Name Circuit Party CFscore
Marsha S Berzon 9 Democrat -1.39Stephen R Reinhardt 9 Democrat -1.38William A Fletcher 9 Democrat -1.37Diane P Wood 7 Democrat -1.34James R Browning 9 Democrat -1.32Harry Pregerson 9 Democrat -1.30David R Thompson 9 Republican -1.30Michael R Murphy 10 Democrat -1.29Raymond C Fisher 9 Democrat -1.29Edward R Becker 3 Republican -1.29Susan P Graber 9 Democrat -1.29Fred I Parker 2 Democrat -1.28Francis D Murnaghan 4 Democrat -1.28Richard C Tallman 9 Democrat -1.28Roger L Gregory 4 Democrat -1.28
Jerry E Smith 5 Republican 0.14Edward Leavy 9 Republican 0.15Daniel A Manion 7 Republican 0.16Patrick E Higginbotham 5 Republican 0.18Joel F Dubina 11 Republican 0.20H Emory Widener 4 Republican 0.25Laurence Hirsch Silberman DC Republican 0.38Karen Johnson Williams 4 Republican 0.44Edith H Jones 5 Republican 0.47D Brooks Smith 3 Republican 0.50David A Nelson 6 Republican 0.57Samuel A Alito 3 Republican 0.60J Michael Luttig 4 Republican 0.69J L Edmondson 11 Republican 0.78Frank Magill 8 Republican 0.91
Note: Restricted to circuit court judges with at least 4 nonmissing CFscores.
37

Table 8: Average Clerk CFscore for Supreme Court Justices
Appointing MeanJustice Name Party CFscore
Ruth Bader Ginsburg Democrat -1.21Stephen Breyer Democrat -1.16Abe Fortas Democrat -1.15David Souter Republican -1.01Harry A Blackmun Republican -0.96John Paul Stevens Republican -0.94Thurgood Marshall Democrat -0.93William J Brennan Republican -0.82John M Harlan Republican -0.78William O Douglas Democrat -0.75Arthur J Goldberg Democrat -0.71Stanley Reed Democrat -0.69Potter Stewart Republican -0.69Lewis F Powell Republican -0.61Sandra Day Oconnor Republican -0.58Earl Warren Republican -0.57Byron R White Democrat -0.51Tom C Clark Democrat -0.31Hugo L Black Democrat -0.25Warren E Burger Republican -0.12John Roberts Republican 0.12Anthony Kennedy Republican 0.16William Rehnquist Republican 0.21Antonin Scalia Republican 0.46Samuel Alito Republican 0.59Clarence Thomas Republican 0.86
Note: Restricted to justices with at least 4 nonmissing CFscores.
38

6.4 Judicial Ideology by District and Circuit Courts
An appealing feature of creating a measure of judicial ideology based on the
ideology of clerks is that it makes it possible to construct a measure of the ideology of
a given district or circuit court. To illustrate this, Figure 12 provides a heat map of
the political ideology of clerks by state for district and circuit courts. For the top panel
(district courts by state), the mean CFscore was calculated by averaging clerk CFscores
across all district courts within the state. For states with more than one federal district,
the average for the state was calculated without weighting by district. That is, if a
state with two districts has more observations in one district than the other district, the
district with more observations will be given a larger weight. These results show that
the average ideology of district court clerks in the typically conservative southern states
is more conservative than most other states. These results are all relative, however.
For example, of the 94 federal districts, only eight have an average conservative average
clerk CFscore (that is, a CFscore greater than 0).24
24Table A5 in the Appendix presents the average clerk CFscore by district court.
39

Figure 12: Map of Clerk CFscores in District and Appeals Courts
Panel A: District Courts (by state)
Panel B: Circuit Courts
40

The bottom panel of Figure 12 provides the average clerk CFscore for the
12 circuit courts. The mean clerk CFscore for each circuit was calculated by averaging
the CFscores for all of the clerks that worked for a judge in a given circuit. Among
other things, these results reveal that the First Circuit is the most liberal and the
Fifth Circuit is the most conservative. That said, although the Fifth Circuit has the
most conservative courts of all the circuits, the Fifth Circuit clerks are still liberal on
balance: the mean CFscore for the circuit is -0.62 and the median CFscore for the
circuit is -0.38.25 Finally, it is worth noting that there is more variation between clerk
ideology for district court clerks by state than for circuit court clerks.
6.5 Judicial Ideology Over Time
In addition to forming the basis for a ranking of judges or district and circuit
courts by ideology, an advantage of the clerk-based ideology scores is that they provide a
way to measure changes in a judge’s ideology over time. Although year-to-year changes
in clerk ideology are more likely to reflect idiosyncratic noise rather than changes in
judge ideology, a consistent shift in clerk ideology between the early and late stages of
a judge’s career may indicate ideological evolution over time.
To illustrate the dynamic nature of the approach, we investigate changes in
the ideology of the clerks hired by U.S. Supreme Court justices over time. We focus
this analysis on Supreme Court justices because we have a longer window of data
availability for this group; future work could extend this approach to district court or
circuit judges. The specification we consider is:
CBIjt = αj + βj t+ εjt
25Table A6 in the Appendix presents the mean and median CFscores for each federal circuit court.
41

where the unit of observation is judge j in term t. We estimate the specification
separately for each justice. The coefficient of interest is βj, which measures whether
the ideology of the justice has systematically changed over the course of his or her
tenure on the Supreme Court.
Table 9: Results for Time Trend By Justice
Justice Coef. SE N
John M Harlan -0.0869∗ (0.0461) 17Hugo L Black -0.0425 (0.0637) 13Sandra Day O’Connor -0.0353∗∗ (0.0143) 61Harry A Blackmun -0.0336∗∗∗ (0.0108) 55Earl Warren -0.0340 (0.0471) 13William O Douglas -0.0292 (0.0292) 22David Souter -0.0207 (0.0162) 51Potter Stewart -0.0202 (0.0245) 32John Paul Stevens -0.0178∗ (0.0104) 60William J Brennan -0.0137 (0.0096) 64Lewis F Powell -0.0128 (0.0273) 33John Roberts -0.0121 (0.2050) 12Ruth Bader Ginsburg -0.0109 (0.0146) 34Tom C Clark -0.0107 (0.0546) 13Thurgood Marshall -0.0075 (0.0142) 57Stephen Breyer -0.0045 (0.0173) 39Byron R White -0.0041 (0.0120) 66Clarence Thomas -0.0037 (0.0134) 58William Rehnquist -0.0004 (0.0123) 53Anthony Kennedy 0.0038 (0.0201) 60Antonin Scalia 0.0256 (0.0170) 55Warren E Burger 0.0301 (0.0244) 44Samuel Alito 0.0574 (0.1340) 13
Note: Restricted to Justices with 10 or more clerkswith nonmissing CFscores. ∗ p<0.1, ∗∗ p<0.05, ∗∗∗
p<0.01.
The results of the analysis are presented in Table 9. The justices are ordered
by the estimated coefficient on the time trend. For most justices, no statistically
42

significant shift in ideology is detectable over the course of our sample. However, there
are several important exceptions. In particular, the analysis supports the common
narrative that Sandra Day O’Connor and Harry Blackmun became more liberal over
the course of their careers. The coefficient for each of these justices is approximately
-0.034, which, over the course of a 20-year tenure, would be associated with a shift in
ideology comparable to the difference between Earl Warren and John Roberts.
6.6 Validating Our Measure of Judicial Ideology
As a final way of investigating the validity of using clerk ideology as a mea-
sure of judicial ideology, we examine how our measures compare to the widely used
Judicial Common Space (JCS) scores. As previously noted, JCS scores are a measure
of judicial ideology based on the ideology of the political actors that appoint a given
judge. Although JCS scores represent an improvement over simply relying on the party
of the appointing president, however, they are not able to account for changes in ju-
dicial ideology over time. In Figure 13, we plot the mean JCS score and the mean
clerk CFscore for each of the circuit courts from 1995 to 2004. The overall correlation
between our clerks-based measure and the JCS scores is 0.18.
43
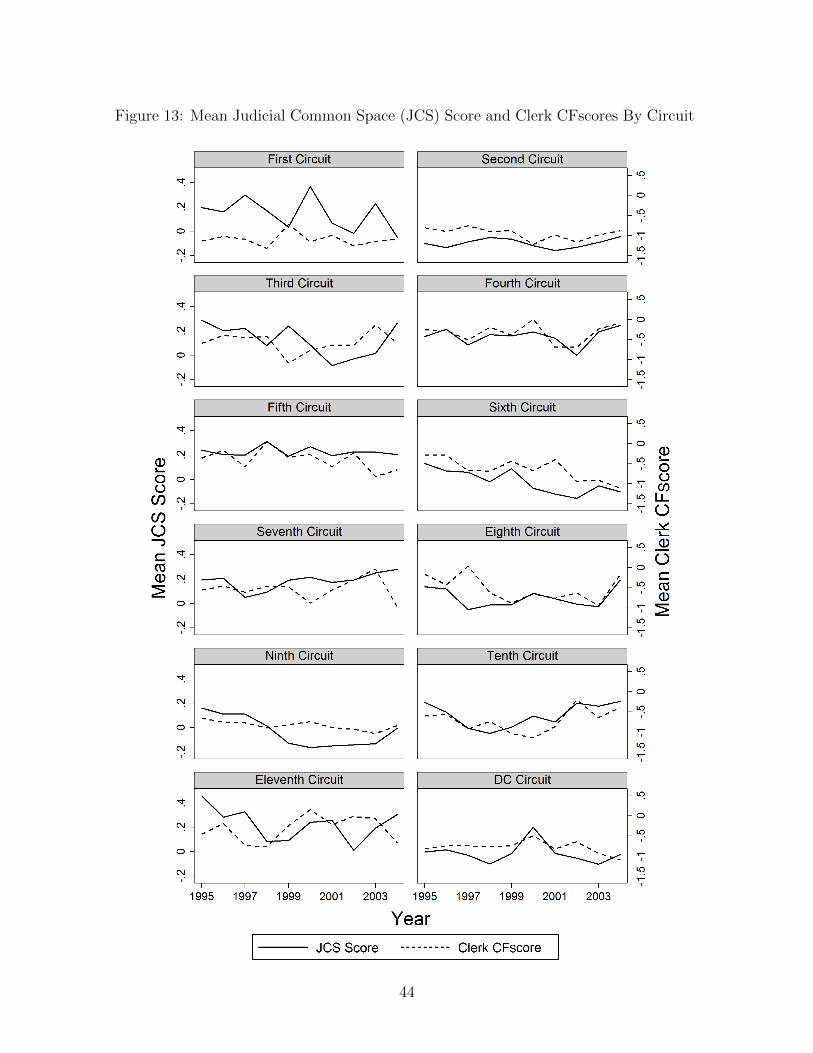
Figure 13: Mean Judicial Common Space (JCS) Score and Clerk CFscores By Circuit
44

The results in Figure 13 reveal that these two measures produce compara-
ble estimates for the ideology of each circuit. The most noticeable exception is the
First Circuit, where the mean JCS is both more conservative and has a higher vari-
ance than the clerk-based measure. Overall, however, these results suggest that using
clerk ideology is a reasonable proxy for the relative ideology of different federal courts.
Because the clerk-based measure is able to produce comparable estimates for federal
district, circuit, and Supreme Court judges that vary over the course of a judge’s ca-
reer, however, there may be many applications were they provide a superior method
for estimating judicial ideology than the existing measures.
7 Conclusion
In this article, we have explored the political ideology of judicial law clerks
in United States federal courts. We documented several interesting results. First,
we found that clerks tend to be disproportionately liberal, and that their ideologies
resemble the alumni of the elite law schools from which a large proportion graduate
rather than the population of other lawyers. Second, we found that judges tend to
be at least somewhat consistent in hiring clerks with similar ideologies, and that this
consistency is most pronounced for Supreme Court justices and least pronounced for
district court judges. We also found that the ideology of judges is strongly predictive
of the ideology of their clerks, but that even many conservative judges tend to hire
clerks who are relatively liberal. Finally, we developed and validated a clerk-based
measure of judicial ideology, which has the dual benefits of placing all judges in the
federal judiciary on a continuous ideological spectrum and capturing changes in judicial
ideology over time.
It is worth noting a few limitations of our methods and results. First, our
45

results are based on the 41% of federal law clerks for whom we were able to find
corresponding campaign contributions. As a result, it is possible that a different picture
would emerge if we were able to observe the ideological leanings of every individual
that ever served as a clerk. In particular, our results will be biased if a clerk’s ideology
is correlated with the probability of donating in ways that are correlated with our
variables of interest. For example, if liberal individuals who clerk for conservative
judges are less likely to donate—e.g., because they are generally less political—our
approach would make law clerks appear more conservative than they actually are.
That said, we believe this concern is mitigated in our application by the fact that the
donation rate among clerks is approximately eight times greater than in the overall
population.
Second, our measures of ideology are based on the campaign contributions
that an individual makes over the course of a lifetime. For example, a lawyer may
have served as a clerk ten years before making the donations that form the basis of the
ideology score we employ. A concern with this approach is thus that the ideology of
individuals may be different in our data than it was when they clerked. Although this
may be the case for some individuals in our dataset, we believe that it is unlikely to
systematically bias our results because individual ideology has been found to be fairly
consistent over time.
With these caveats, our findings shed significant light on the political ideol-
ogy of judicial law clerks. This knowledge is important directly because clerks play an
important role in the American judicial process, and indirectly because systematic pat-
terns in clerk ideology by judge can complement existing measures of judicial ideology.
With a more complete picture of the ideology of clerks, an interesting avenue for future
research would be to investigate their influence on our legal system. Indeed, given the
large amount of scholarship documenting the role that clerks have in drafting judicial
46

opinions, it would be interesting if the ideologies of the clerks influence the way cases
are decided to a detectable degree.
47

References
Avery, C., C. Jolls, R. Posner, and A. Roth (2001). The Market for Federal JudicialLaw Clerks. University of Chicago Law Review 68 (1), 793–902.
Avery, C., C. Jolls, R. Posner, and A. Roth (2007). The New Market for FederalJudicial Law Clerks. University of Chicago Law Review 74 (1), 447–486.
Baier, P. (1973). The Law Clerks: Profile of an Institution. Vanderbilt Law Re-view 26 (2), 1125–1177.
Bailey, M. (2016). Measuring Ideology on the Courts. Working Paper .
Bonica, A. (2013). Database on Ideology, Money in Politics, and Elections: Publicversion 1.0 [Computer file]. Stanford, CA: Stanford University Libraries http://
data.stanford.edu/dime.
Bonica, A. (2014). Mapping the Ideological Marketplace. American Journal of PoliticalScience 58, 367–386.
Bonica, A., A. Chilton, and M. Sen (2015). The Political Ideologies of AmericanLawyers. Journal of Legal Analysis (Forthcoming).
Bonica, A. and M. Sen (2015). The Politics of Selecting the Bench from the Bar: TheLegal Profession and Partisan Incentives to Politicize the Judiciary. Working Paper .
Bonica, A. and M. Sen (2016). A Common-Space Scaling of the American Judiciaryand Legal Profession. Working Paper .
Bonica, A. and M. Woodruff (2015). A Common-Space Measure of State SupremeCourt Ideology. Journal of Law, Economics, and Organization 58, 2–27.
Boyd, C. (2010). Federal District Court Judge Ideology Data. University of Georgia.
Chen, J. (1994). The Mystery and the Mastery of the Judicial Power. Missouri LawReview 59 (2), 281–306.
Chilton, A. and E. Posner (2015). An Empirical Study of Political Bias in LegalScholarship. Journal of Legal Studies (forthcoming).
Clark, T. and B. Lauderdale (2010). Locating Supreme Court Opinions in DoctrineSpace. American Journal of Political Science 54 (4), 871–890.
Cushman, C. and T. Peppers (2015). Of Courtiers and Kings: More Stories of SupremeCourt Law Clerks and Their Justices. University of Virginia Press.
Ditslear, C. and L. Baum (2001). Selection of Law Clerks and Polarization in the U.S.Supreme Court. Journal of Politics 63 (3), 869–885.
48

Epstein, L., A. Martin, K. Quinn, and J. Segal (2007). Ideological Drift AmongSupreme Court Justices: Who, When, and How Important? Northwestern Uni-versity Law Review 101 (4), 1483–1542.
Epstein, L., A. Martin, J. Segal, and C. Westerland (2007). The Judicial CommonSpace. Journal of Law, Economics, and Organization 23, 303–325.
Fischman, J. and D. Law (2009). What Is Judicial Ideology, and How Should WeMeasure It? Washington University Journal of Law and Policy 29, 133–214.
Giles, M., V. Hettinger, and T. Peppers (2001). Picking Federal Judges: A Note onPolicy and Partisan Selection Agendas. Political Research Quarterly 54 (3), 623–641.
Green, D. P., B. Palmquist, and E. Schickler (2004). Partisan Hearts and Minds:Political Parties and the Social Identities of Voters. Yale University Press.
Gryski, G., G. Zuk, and S. Goldman (2013). A Multi-User Data Base on the Attributesof U.S. District Court Judges, 1789-2000. National Science Foundation Grant: SBR-9810564 (principal district court award).
Gulati, M. and R. Posner (2015). The Management of Staff by Federal Court of AppealsJudges. Working Paper .
Katz, D. and D. Stafford (2010). Hustle and Flow: A Social Network Analysis of theAmerican Federal Judiciary. Ohio State Law Journal 71, 457–507.
Lauderdale, B. E. and T. Clark (2014). Scaling Politically Meaningful DimensionsUsing Texts and Votes. American Journal of Political Science 58 (3), 754–771.
Lazarus, E. (2005). Closed Chambers: The Rise, Fall, and Future of the ModernSupreme Court Paperback. Penguin Books.
Liptak, A. (2010). A Sign of the Court’s Polarization: Choice of Clerks. New YorkTimes, Sept. 6, 2010 .
Mahoney, J. (1988). Law Clerks: For Better or For Worse? Brooklyn Law Review 54 (2),321–350.
Martin, A. and K. Quinn (2002). Dynamic Ideal Point Estimation via Markov ChainMonte Carlo for the U.S. Supreme Court, 1953-1999. Political Analysis 10 (2), 134–153.
Martin, A. and K. Quinn (2007). Assessing Preference Change on the U.S. SupremeCourt. Journal of Law, Economics, and Organization 23 (2), 303–325.
Milenkovski, K. (2008). Federal Courts to Employ Fewer Career Law Clerks. AmericanBar Association Journal .
Miles, T. and C. Sunstein (2007). Do Judges Make Regulatory Policy? An EmpiricalInvestigation of Chevron. University of Chicago Law Review 73, 823–81.
49

Newland, C. (1961). Personal Assistants to Supreme Court Justices: The Law Clerks.Oregon Law Review 40 (1), 299–317.
Peppers, T. (2006). Courtiers of the Marble Palace: The Rise and Influence of theSupreme Court Law Clerk. Stanford Law and Politics.
Peppers, T., M. Giles, and B. Tainer-Parkins (2008). Inside Judicial Chambers: HowFederal District Court Judges Select and Use their Law Clerks. Albany Law Re-view 71, 623–645.
Peppers, T. and A. Ward (2013). In Chambers: Stories of Supreme Court Law Clerksand Their Justices. University of Virginia Press.
Peppers, T. and C. Zorn (2008). Law Clerk Influence on Supreme Court Decision-Making. DePaul Law Review 58 (3), 51–78.
Rehnquist, W. (1957). Who Writes Decisions of the Supreme Court. U.S. News &World Report, December, 13, 1957 .
Rozema, K. and S. Peng (2015). It’s Not What You Know But Who-You-Know Knows.Working Paper .
Sunstein, C., D. Schkade, and L. Ellman (2006). Are Judges Political? An EmpiricalAnalysis of the Federal Judiciary. Brookings Institution Press.
United States Courts (2005). Total Judicial Officers. Courts of Appeals, Dis-trict Courts, Bankruptcy Courts (September 30, 2005), Table 1.1, available athttp://www.uscourts.gov/file/13841/download [last accessed on January 17, 2016].
Ward, A. and D. Weiden (2006). Sorcerers’ Apprenticies: 100 Years of Law Clerks atthe United States Supreme Court. New York University Press.
Whisner, M. (2014). The 4-1-1 on Lawyer Directories. Law Library Journal 106 (2),257–66.
Yung, C. R. (2010). Judged by the Company You Keep: An Empirical Study of theIdeologies of Judges on the United States Courts of Appeals. Boston College LawReview 51, 1133–1208.
50

8 Appendix
Table A1: Proportion of Law Clerks Matched to Donations by Law School
Law School Proportion
Yale 55.5Harvard 53.4Stanford 54.0Columbia 50.1Chicago 55.2NYU 46.4Penn 42.8Duke 39.6Berkeley 49.1Virginia 47.3Michigan 42.5Northwestern 47.9Cornell 40.8Georgetown 46.3All Other 35.5
51
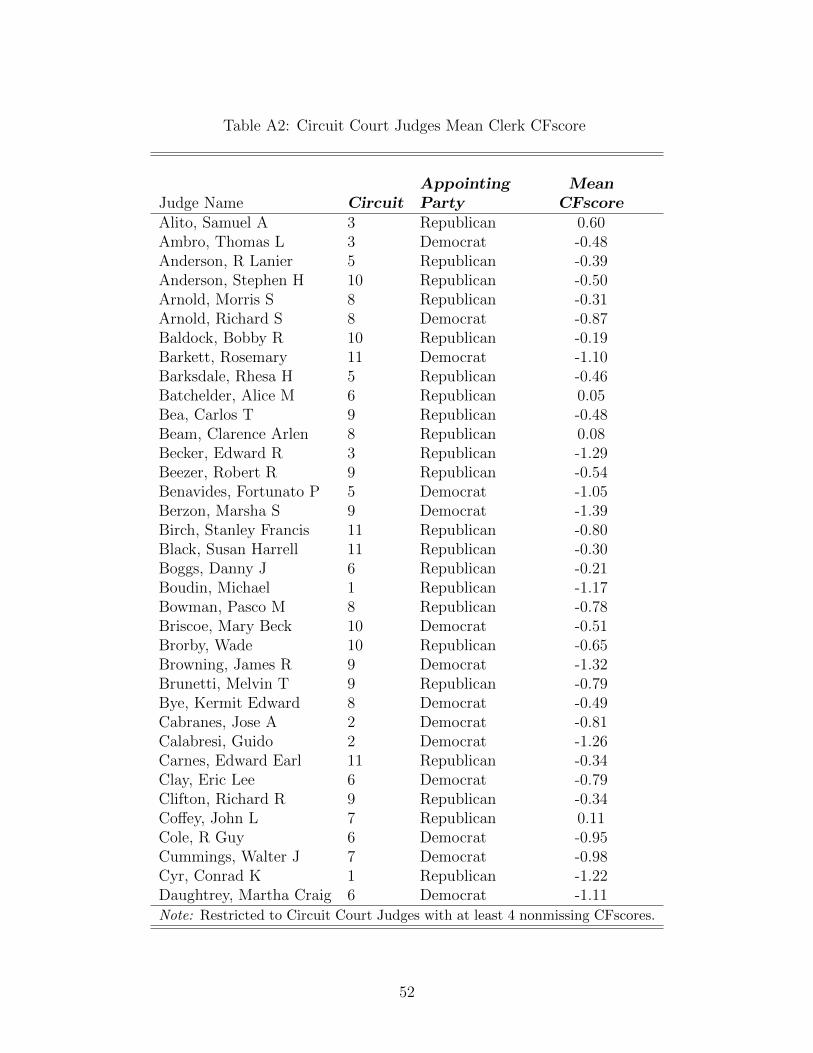
Table A2: Circuit Court Judges Mean Clerk CFscore
Appointing MeanJudge Name Circuit Party CFscoreAlito, Samuel A 3 Republican 0.60Ambro, Thomas L 3 Democrat -0.48Anderson, R Lanier 5 Republican -0.39Anderson, Stephen H 10 Republican -0.50Arnold, Morris S 8 Republican -0.31Arnold, Richard S 8 Democrat -0.87Baldock, Bobby R 10 Republican -0.19Barkett, Rosemary 11 Democrat -1.10Barksdale, Rhesa H 5 Republican -0.46Batchelder, Alice M 6 Republican 0.05Bea, Carlos T 9 Republican -0.48Beam, Clarence Arlen 8 Republican 0.08Becker, Edward R 3 Republican -1.29Beezer, Robert R 9 Republican -0.54Benavides, Fortunato P 5 Democrat -1.05Berzon, Marsha S 9 Democrat -1.39Birch, Stanley Francis 11 Republican -0.80Black, Susan Harrell 11 Republican -0.30Boggs, Danny J 6 Republican -0.21Boudin, Michael 1 Republican -1.17Bowman, Pasco M 8 Republican -0.78Briscoe, Mary Beck 10 Democrat -0.51Brorby, Wade 10 Republican -0.65Browning, James R 9 Democrat -1.32Brunetti, Melvin T 9 Republican -0.79Bye, Kermit Edward 8 Democrat -0.49Cabranes, Jose A 2 Democrat -0.81Calabresi, Guido 2 Democrat -1.26Carnes, Edward Earl 11 Republican -0.34Clay, Eric Lee 6 Democrat -0.79Clifton, Richard R 9 Republican -0.34Coffey, John L 7 Republican 0.11Cole, R Guy 6 Democrat -0.95Cummings, Walter J 7 Democrat -0.98Cyr, Conrad K 1 Republican -1.22Daughtrey, Martha Craig 6 Democrat -1.11Note: Restricted to Circuit Court Judges with at least 4 nonmissing CFscores.
52

Table A2: (cont.) Circuit Court Judges Mean Clerk CFscore
Appointing MeanJudge Name Circuit Party CFscoreDavis, W Eugene 5 Republican -0.56Demoss, Harold R 5 Republican 0.00Dennis, James L 5 Democrat -0.29Dubina, Joel F 11 Republican 0.20Duhe, John M 5 Republican -0.71Easterbrook, Frank H 7 Republican -0.84Ebel, David M 10 Republican -0.77Edmondson, J L 11 Republican 0.78Edwards, Harry T DC Democrat -1.17Ervin, Sam J 4 Democrat -0.83Evans, Terence T 7 Democrat -0.37Fagg, George G 8 Republican -0.75Fernandez, Ferdinand Francis 9 Republican -0.80Fisher, Raymond C 9 Democrat -1.29Flaum, Joel M 7 Republican -0.96Fletcher, Betty Binns 9 Democrat -1.23Fletcher, William A 9 Democrat -1.37Fuentes, Julio M 3 Democrat -1.21Garland, Merrick B DC Democrat -0.93Garwood, Will 5 Republican 0.05Garza, Emilio M 5 Republican -0.59Gibbons, Julia Smith 6 Republican -0.74Gilman, Ronald Lee 6 Democrat -0.94Ginsburg, Douglas H DC Republican -0.39Gould, Ronald M 9 Democrat -0.51Graber, Susan P 9 Democrat -1.29Greenberg, Morton I 3 Republican -0.82Gregory, Roger L 4 Democrat -1.28Hall, Cynthia Holcomb 9 Republican -1.25Hamilton, Clyde H 4 Republican -0.48Hansen, David R 8 Republican -0.06Hartz, Harris L 10 Republican -0.89Hatchett, Joseph Woodrow 5 Republican -0.76Hawkins, Michael Daly 9 Democrat -0.35Henderson, Karen Lecraft DC Republican -0.26Higginbotham, Patrick E 5 Republican 0.18Note: Restricted to Circuit Court Judges with at least 4 nonmissing CFscores.
53
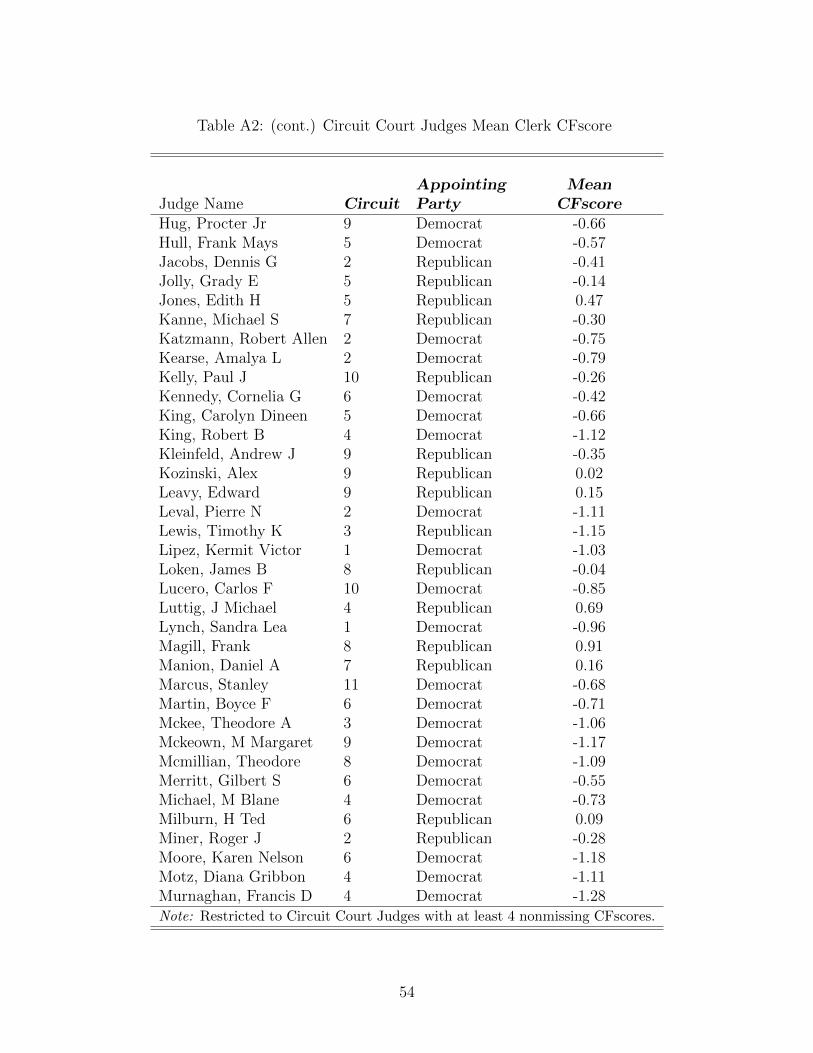
Table A2: (cont.) Circuit Court Judges Mean Clerk CFscore
Appointing MeanJudge Name Circuit Party CFscoreHug, Procter Jr 9 Democrat -0.66Hull, Frank Mays 5 Democrat -0.57Jacobs, Dennis G 2 Republican -0.41Jolly, Grady E 5 Republican -0.14Jones, Edith H 5 Republican 0.47Kanne, Michael S 7 Republican -0.30Katzmann, Robert Allen 2 Democrat -0.75Kearse, Amalya L 2 Democrat -0.79Kelly, Paul J 10 Republican -0.26Kennedy, Cornelia G 6 Democrat -0.42King, Carolyn Dineen 5 Democrat -0.66King, Robert B 4 Democrat -1.12Kleinfeld, Andrew J 9 Republican -0.35Kozinski, Alex 9 Republican 0.02Leavy, Edward 9 Republican 0.15Leval, Pierre N 2 Democrat -1.11Lewis, Timothy K 3 Republican -1.15Lipez, Kermit Victor 1 Democrat -1.03Loken, James B 8 Republican -0.04Lucero, Carlos F 10 Democrat -0.85Luttig, J Michael 4 Republican 0.69Lynch, Sandra Lea 1 Democrat -0.96Magill, Frank 8 Republican 0.91Manion, Daniel A 7 Republican 0.16Marcus, Stanley 11 Democrat -0.68Martin, Boyce F 6 Democrat -0.71Mckee, Theodore A 3 Democrat -1.06Mckeown, M Margaret 9 Democrat -1.17Mcmillian, Theodore 8 Democrat -1.09Merritt, Gilbert S 6 Democrat -0.55Michael, M Blane 4 Democrat -0.73Milburn, H Ted 6 Republican 0.09Miner, Roger J 2 Republican -0.28Moore, Karen Nelson 6 Democrat -1.18Motz, Diana Gribbon 4 Democrat -1.11Murnaghan, Francis D 4 Democrat -1.28Note: Restricted to Circuit Court Judges with at least 4 nonmissing CFscores.
54

Table A2: (cont.) Circuit Court Judges Mean Clerk CFscore
Appointing MeanJudge Name Circuit Party CFscoreMurphy, Diana E 8 Democrat -1.23Murphy, Michael R 10 Democrat -1.29Nelson, David A 6 Republican 0.57Nelson, Thomas G 9 Republican -1.04Niemeyer, Paul V 4 Republican -0.68Noonan, John T 9 Republican -0.59Norris, Alan E 6 Republican -0.17Nygaard, Richard L 3 Republican 0.07Oscannlain, Diarmuid F 9 Republican 0.04Paez, Richard A 9 Democrat -1.06Parker, Barrington D 2 Republican -1.02Parker, Fred I 2 Democrat -1.28Parker, Robert M 5 Democrat -0.56Politz, Henry A 5 Democrat -0.64Pooler, Rosemary S 2 Democrat -1.18Posner, Richard A 7 Republican -0.41Pregerson, Harry 9 Democrat -1.31Randolph, A Raymond DC Republican -1.02Rawlinson, Johnnie B 9 Democrat -0.64Reinhardt, Stephen R 9 Democrat -1.38Rendell, Marjorie O 3 Democrat -1.06Ripple, Kenneth F 7 Republican -0.07Rogers, John M 6 Republican -0.93Rogers, Judith W DC Democrat -1.15Roth, Jane R 3 Republican -1.12Rovner, Ilana Diamond 7 Republican -0.89Ryan, James L 6 Republican -0.56Rymer, Pamela Ann 9 Republican -0.45Sack, Robert David 2 Democrat -1.12Schroeder, Mary M 9 Democrat -1.09Scirica, Anthony J 3 Republican -0.99Selya, Bruce M 1 Republican -1.14Sentelle, David B DC Republican -0.06Shedd, Dennis W 4 Republican 0.74Silberman, Laurence Hirsch DC Republican 0.38Siler, Eugene E 6 Republican -0.06Note: Restricted to Circuit Court Judges with at least 4 nonmissing CFscores.
55

Table A2: (cont.) Circuit Court Judges Mean Clerk CFscore
Appointing MeanJudge Name Circuit Party CFscoreSilverman, Barry G 9 Democrat -0.67Sloviter, Dolores K 3 Democrat -0.67Smith, D Brooks 3 Republican 0.50Smith, Jerry E 5 Republican 0.14Smith, Lavenski R 8 Republican -0.83Stahl, Norman H 1 Republican -1.07Stewart, Carl E 5 Democrat -0.68Straub, Chester J 2 Democrat -1.13Suhrheinrich, Richard F 6 Republican 0.10Tacha, Deanell Reece 10 Republican -0.75Tallman, Richard C 9 Democrat -1.28Tashima, A Wallace 9 Democrat -1.07Tatel, David S DC Democrat -1.22Thomas, Sidney R 9 Democrat -1.15Thompson, David R 9 Republican -1.30Tjoflat, Gerald Bard 5 Republican -0.76Torruella, Juan R 1 Republican -0.96Trott, Stephen S 9 Republican -0.61Tymkovich, Timothy M 10 Republican 0.09Vanantwerpen, Franklin S 3 Republican -1.35Wald, Patricia M DC Democrat -0.92Walker, John M 2 Republican -1.13Wardlaw, Kim Mclane 9 Democrat -1.26Widener, H Emory 4 Republican 0.25Wiener, Jacques L 5 Republican -0.59Wilkins, Willliam W 4 Republican -0.10Wilkinson, J Harvie 4 Republican 0.12Williams, Karen Johnson 4 Republican 0.44Williams, Stephen F DC Republican -1.16Wilson, Charles Reginald 11 Democrat -0.57Winter, Ralph K 2 Republican -0.61Wollman, Roger L 8 Republican -0.26Wood, Diane P 7 Democrat -1.34Note: Restricted to Circuit Court Judges with at least 4 nonmissing CFscores.
56

Table A3: District Court Judges Mean Clerk CFscore
Appointing MeanJudge Name District Party CFscoreAdams, Henry Lee FL MD Democrat -0.43Adelman, Lynn WI ED Democrat -1.12Alesia, James H IL ND Republican -0.20Alsup, William Haskell CA ND Democrat -0.46Amon, Carol Bagley NY ED Republican -0.74Andersen, Wayne R IL ND Republican -0.61Anderson, G Ross SC ST Democrat -0.22Anderson, Joseph F SC ST Democrat -0.44Armstrong, Saundra Brown CA ND Republican -1.27Arterton, Janet Bond CT ST Democrat -1.43Aspen, Marvin E IL ND Democrat 0.11Atlas, Nancy Friedman TX SD Democrat -0.40Babcock, Lewis Thorton CO ST Republican -1.25Baer, Harold Jr NY SD Democrat -0.98Baird, Lourdes G CA CD Republican -0.95Barbadoro, Paul James NH ST Republican -0.67Barbour, William H MS SD Republican -0.14Barker, Sarah Evans IN SD Republican -0.77Barry, Maryanne Trump NJ ST Democrat -1.12Bartle, Harvey Iii PA ED Republican -0.81Bartlett, D Brook MO WD Republican -0.34Bassler, William G NJ ST Republican -0.64Battey, Richard Howard SD ST Republican 1.27Batts, Deborah A NY SD Democrat -1.34Beaty, James A NC MD Democrat -0.28Beistline, Ralph R AK ST Republican 0.90Belot, Monti L KS ST Republican -0.21Benson, Dee UT ST Republican 0.34Berman, Richard M NY SD Democrat -0.86Berrigan, Helen Ginger LA ED Democrat -0.82Bertelsman, William O KY ED Democrat 0.26Bissell, John W NJ ST Republican -0.95Black, Bruce D NM ST Democrat -0.94Blackkburn, Sharon Lovelace AL ND Republican -0.40Blake, Catherine C MD ST Democrat -0.97Block, Frederic NY ED Democrat -0.67Note: Restricted to District Court Judges with at least 4 nonmissing CFscores.
57

Table A3: (cont.) District Court Judges Mean Clerk CFscore
Appointing MeanJudge Name District Party CFscoreBorman, Paul D MI ED Democrat 0.03Bowen, Dudley H GA SD Democrat -0.18Boyle, Terrene W NC ED Republican 0.04Bramlette, David C MS SD Republican -0.54Breyer, Charles R CA ND Democrat -1.32Brieant, Charles L NY SD Republican -0.74Brimmer, Clarence A WY ST Republican 0.12Brinkema, Leonle M VA ED Democrat -0.83Briones, David TX WD Democrat -0.15Broadwater, W Craig WV ND Democrat -0.80Brody, Anita B PA ED Republican -0.66Brody, Morton Aaron ME ST Republican -0.22Broomfield, Robert C AZ ST Republican -1.24Brown, Anna J OR ST Democrat -0.92Brown, Garrett E NJ ST Republican 0.21Brown, Paul N TX ED Republican 0.26Bryan, Robert J WA WD Republican 0.35Buchmeyer, Jerry TX ND Democrat -0.79Buchwald, Naomi Reice NY SD Democrat -1.04Bucklew, Susan Cawthon FL MD Democrat -0.76Bucklo, Elane E IL ND Democrat -0.63Buckwalter, Ronald L PA ED Republican -0.10Bullock, Frank W NC MD Republican 0.30Burgess, Franklin Douglas WA WD Democrat -1.04Burrage, Michael OK WD Democrat 1.19Burrell, Garland E CA ED Republican -0.74Butler, Charles R AL SD Republican -0.57Cahn, Edward N PA ED Republican -0.74Camp, Jack T GA ND Republican -0.41Campbell, Tena UT ST Democrat -1.14Caputo, A Richard PA MD Democrat -0.82Carnes, Julie E GA ND Democrat -0.55Carr, James Gray OH ND Democrat -0.75Carter, David O CA CD Democrat -1.31Carter, Gene ME ST Republican -0.07Casellas, Salvador E PR ST Democrat -0.43Note: Restricted to District Court Judges with at least 4 nonmissing CFscores.
58

Table A3: (cont.) District Court Judges Mean Clerk CFscore
Appointing MeanJudge Name District Party CFscoreCasey, Richard Conway NY SD Democrat 0.01Castillo, Ruben IL ND Democrat -1.01Cauthron, Robin J OK WD Republican -0.50Cebull, Richard F MT ST Republican -1.13Cerezo, Carmen Consuelo PR ST Democrat -1.11Chasanow, Deborah K MD ST Democrat -0.70Chatigny, Robert N CT ST Democrat -0.70Chesler, Stanley R NJ ST Republican -1.16Chesney, Maxine M CA ND Democrat -1.02Chin, Denny NY SD Democrat -0.91Cindrich, Robert J PA WD Democrat -0.79Cleland, Robert Hardy MI ED Republican 0.51Clement, Edith Brown LA ED Republican 0.05Clemon, U W AL ND Democrat -1.16Coar, David H IL ND Democrat -0.91Cobb, Howell TX ED Republican 0.55Cohn, Avern MI ED Democrat -0.96Collier, Curtis L TN ED Democrat -0.37Collier, Lacey A FL ND Republican -0.18Collins, Audrey B CA CD Democrat -1.18Collins, Raner C AZ ST Democrat -1.59Conlon, Suzanne B IL ND Republican -0.25Conmy, Patrick A ND ST Republican -0.50Conway, Anne C FL MD Republican -0.69Conway, John E NM ST Republican -1.28Cooper, Clarence GA ND Democrat -1.03Cooper, Florence Marie CA CD Democrat -0.99Cooper, Mary L NJ ST Republican -1.14Cote, Denise NY SD Democrat -0.79Coughenour, John C WA WD Republican -0.87Covello, Alfred Vincent CT ST Republican 0.24Crabb, Barbara B WI WD Democrat -0.95Cummings, Samuel R TX ND Republican 0.65Currie, Mcgowan Cameron SC ST Democrat -0.22Dalzell, Stewart PA ED Republican -1.17Damrell, Frank C CA ED Democrat -0.33Note: Restricted to District Court Judges with at least 4 nonmissing CFscores.
59
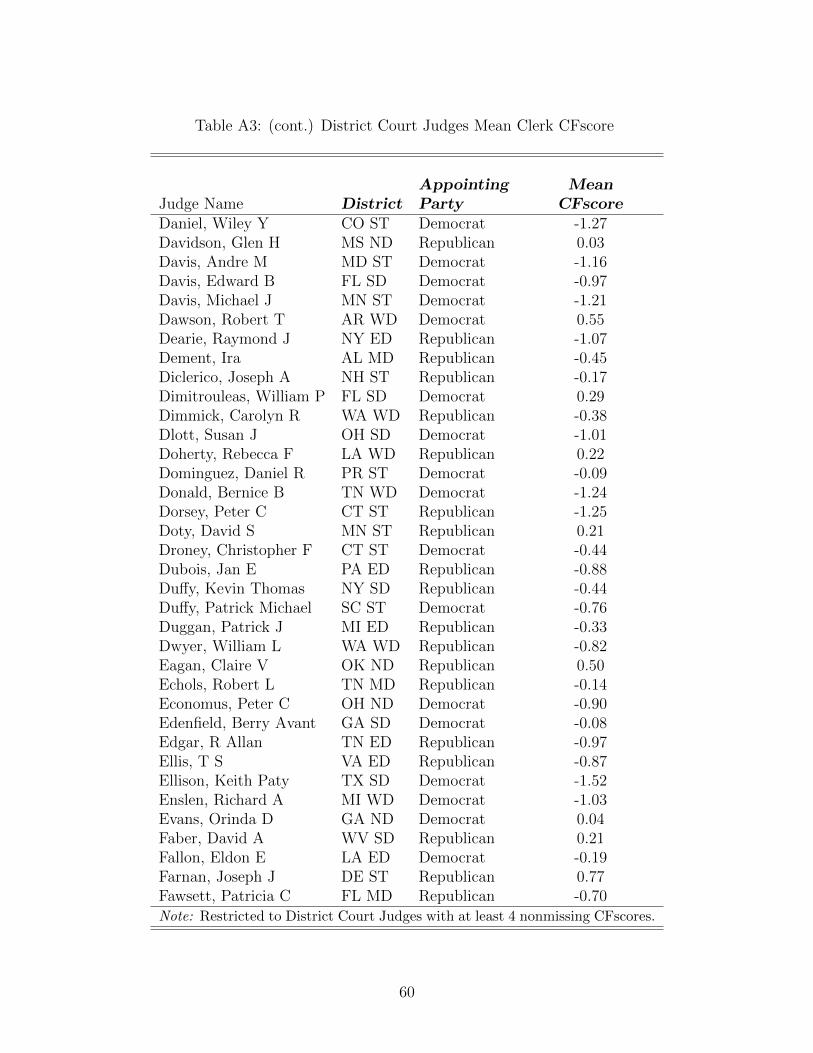
Table A3: (cont.) District Court Judges Mean Clerk CFscore
Appointing MeanJudge Name District Party CFscoreDaniel, Wiley Y CO ST Democrat -1.27Davidson, Glen H MS ND Republican 0.03Davis, Andre M MD ST Democrat -1.16Davis, Edward B FL SD Democrat -0.97Davis, Michael J MN ST Democrat -1.21Dawson, Robert T AR WD Democrat 0.55Dearie, Raymond J NY ED Republican -1.07Dement, Ira AL MD Republican -0.45Diclerico, Joseph A NH ST Republican -0.17Dimitrouleas, William P FL SD Democrat 0.29Dimmick, Carolyn R WA WD Republican -0.38Dlott, Susan J OH SD Democrat -1.01Doherty, Rebecca F LA WD Republican 0.22Dominguez, Daniel R PR ST Democrat -0.09Donald, Bernice B TN WD Democrat -1.24Dorsey, Peter C CT ST Republican -1.25Doty, David S MN ST Republican 0.21Droney, Christopher F CT ST Democrat -0.44Dubois, Jan E PA ED Republican -0.88Duffy, Kevin Thomas NY SD Republican -0.44Duffy, Patrick Michael SC ST Democrat -0.76Duggan, Patrick J MI ED Republican -0.33Dwyer, William L WA WD Republican -0.82Eagan, Claire V OK ND Republican 0.50Echols, Robert L TN MD Republican -0.14Economus, Peter C OH ND Democrat -0.90Edenfield, Berry Avant GA SD Democrat -0.08Edgar, R Allan TN ED Republican -0.97Ellis, T S VA ED Republican -0.87Ellison, Keith Paty TX SD Democrat -1.52Enslen, Richard A MI WD Democrat -1.03Evans, Orinda D GA ND Democrat 0.04Faber, David A WV SD Republican 0.21Fallon, Eldon E LA ED Democrat -0.19Farnan, Joseph J DE ST Republican 0.77Fawsett, Patricia C FL MD Republican -0.70Note: Restricted to District Court Judges with at least 4 nonmissing CFscores.
60

Table A3: (cont.) District Court Judges Mean Clerk CFscore
Appointing MeanJudge Name District Party CFscoreFeldman, Martin L LA ED Republican -0.90Fenner, Gary A MO WD Democrat -0.62Fish, A Joe TX ND Republican -0.16Fitzpatrick, Duross GA MD Republican -0.35Fitzwater, Sidney A TX ND Republican 0.36Folsom, David TX ED Democrat -0.51Forester, Karl S KY ED Republican 0.17Forrester, J Owen GA ND Republican 0.36Frank, Donovan W MN ST Democrat 0.51Friedman, Bernard A MI ED Republican -0.76Friedman, Paul L DC ST Democrat -1.41Furgeson, W Royal TX WD Democrat -0.85Fuste, Jose Antonio PR ST Republican -1.19Gadola, Paul V MI ED Republican -0.24Garaufis, Nicholas G NY ED Democrat -1.21Garbis, Marvin Joseph MD ST Republican -0.68Garcia, Hipolito Frank TX WD Democrat 0.90Garcia, Orlando Luis TX WD Democrat -0.95Garcia-gregory, Jay A PR ST Democrat -1.14Gershon, Nina NY ED Democrat -1.21Gertner, Nancy MA ST Democrat -1.10Gex, Walter J MS SD Republican 1.19Gilbert, J Phil IL SD Republican -1.09Giles, James T PA ED Democrat -1.25Gillmor, Helen W HI ST Democrat -0.92Gilmore, Vanessa D TX SD Democrat -0.80Gleeson, John NY ED Democrat -0.86Gold, Alan Stephen FL SD Democrat -1.18Gonzalez, Irma E CA SD Republican -1.36Goodwin, Joseph Robert WV SD Democrat -0.39Gorton, Nathaniel Matheson MA ST Republican -0.97Graham, Donald L FL SD Republican -0.50Greenaway, Joseph A NJ ST Democrat -1.10Griesa, Thomas P NY SD Republican -1.25Gwin, James S OH ND Democrat -0.95Haden, Charles H WV SD Republican -0.79Note: Restricted to District Court Judges with at least 4 nonmissing CFscores.
61

Table A3: (cont.) District Court Judges Mean Clerk CFscore
Appointing MeanJudge Name District Party CFscoreHaggerty, Ancer Lee OR ST Democrat -1.26Haight, Charles S NY SD Republican -0.65Hall, Janet Celeste CT ST Democrat -0.81Hamilton, David F IN SD Democrat -0.88Hamilton, Jean C MO ED Republican -0.92Hamilton, Phyllis J CA ND Democrat -1.44Harmon, Melinda F TX SD Republican -0.90Harrington, Edward F MA ST Republican -0.98Hatter, Terry J CA CD Democrat -0.69Head, Hayden W TX SD Republican 0.48Heartfield, Thad TX ED Democrat -0.09Hellerstein, Alvin K NY SD Democrat -0.72Henderson, Thelton E CA ND Democrat -1.14Hendren, Jimm Larry AR WD Republican -0.55Herlong, Henry M SC ST Republican 0.49Herndon, David R IL SD Democrat -0.64Heyburn, John Gilpin KY WD Republican -0.42Hibbler, William J IL ND Democrat 0.17Higgins, Thomas A TN MD Republican -0.46Highsmith, Shelby FL SD Republican 0.98Hilton, Claude M VA ED Republican -0.05Hinkle, Robert Lewis FL ND Democrat -1.15Hinojosa, Ricardo H TX SD Republican 0.80Hogan, Michael R OR ST Republican -0.10Hogan, Thomas F DC ST Republican -0.75Holmes, Sven Erik OK ND Democrat -0.67Holschuh, John D OH SD Democrat -0.41Hood, Denise Page MI ED Democrat -0.83Hood, Joseph M KY ED Republican -0.26Hornby, D Brock ME ST Republican -0.90Houck, C Weston SC ST Democrat -0.54Howard, George Jr AR ED Democrat -0.84Howard, Malcolm J NC ED Republican -0.44Hoyt, Kenneth M TX SD Republican -0.03Huck, Paul C FL SD Democrat -0.90Hudspeth, Harry Lee TX WD Democrat -0.06Note: Restricted to District Court Judges with at least 4 nonmissing CFscores.
62

Table A3: (cont.) District Court Judges Mean Clerk CFscore
Appointing MeanJudge Name District Party CFscoreHuff, Marilyn L CA SD Republican -0.64Hughes, Lynn Nettleton TX SD Democrat 0.27Hull, Thomas Gray TN ED Republican 0.56Hunt, Roger L NV ST Democrat -0.21Hunt, Willis B GA ND Democrat -0.30Hupp, Harry L CA CD Republican -1.15Hurley, Daniel T FL SD Democrat -0.31Hutton, Herbert J PA ED Republican -0.20Illston, Susan Y CA ND Democrat -1.11Irenas, Joseph E NJ ST Republican -1.07Jack, Janis Graham TX SD Democrat -0.90Jackson, Carol E MO ED Republican -1.31Jackson, Raymond A VA ED Democrat -1.20Jackson, Thomas Penfield DC ST Democrat -0.39Jenkins, Martin J CA ND Democrat -1.21Jensen, D Lowell CA ND Republican -0.88Johnson, Norma Holloway DC ST Democrat -0.49Johnson, Sterling Jr NY ED Republican -1.12Jones, Barbara S NY SD Democrat -0.71Jones, James Parker VA WD Democrat -1.10Jones, Napoleon A CA SD Democrat -1.28Jones, Robert Edward OR ST Republican -0.63Jordan, Adalberto Jose FL SD Democrat -1.37Joyner, J Curtis PA ED Republican -0.79Justice, William Wayne TX ED Democrat -1.12Kahn, Lawrence E NY ND Democrat -0.89Kane, Yvette PA MD Democrat -0.72Kaplan, Lewis A NY SD Democrat -0.79Katz, Marvin PA ED Republican -1.25Kauffman, Bruce W PA ED Democrat -0.66Kay, Alan C HI ST Republican -0.34Kazen, George P TX SD Democrat -1.03Keeley, Irene M WV ND Republican 0.18Keep, Judith N CA SD Democrat -0.53Keeton, Robert E MA ST Democrat -0.66Keller, William D CA CD Republican -0.27Note: Restricted to District Court Judges with at least 4 nonmissing CFscores.
63
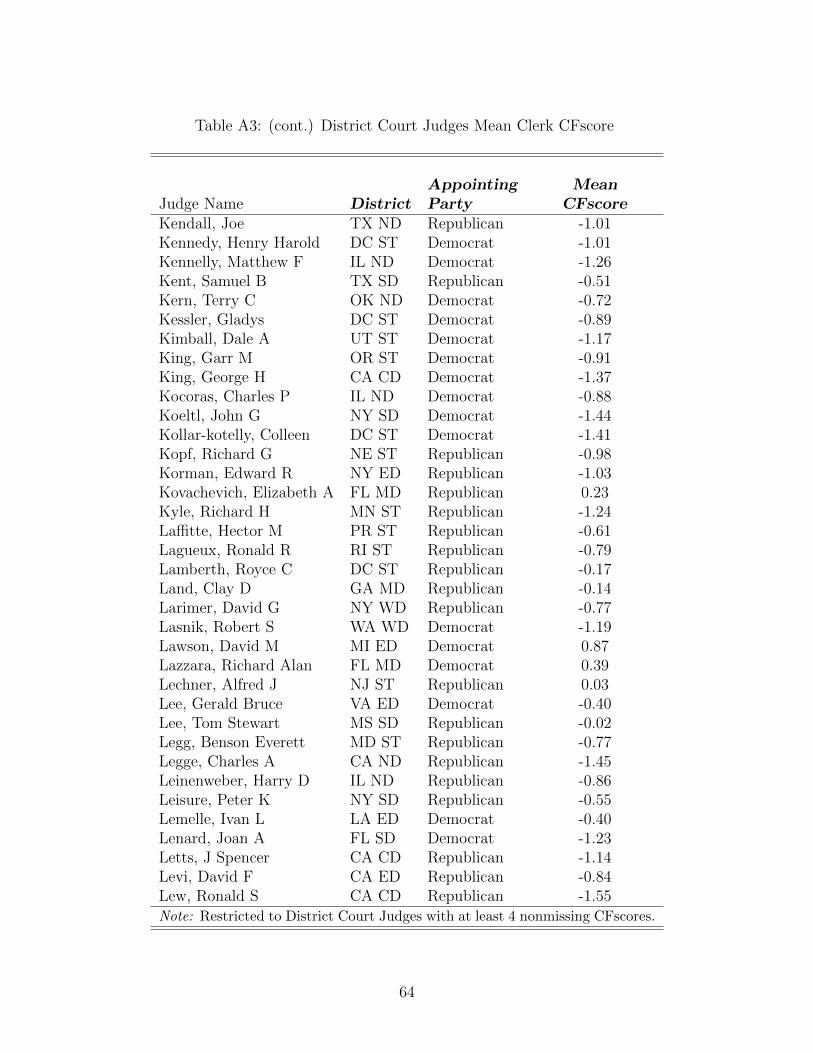
Table A3: (cont.) District Court Judges Mean Clerk CFscore
Appointing MeanJudge Name District Party CFscoreKendall, Joe TX ND Republican -1.01Kennedy, Henry Harold DC ST Democrat -1.01Kennelly, Matthew F IL ND Democrat -1.26Kent, Samuel B TX SD Republican -0.51Kern, Terry C OK ND Democrat -0.72Kessler, Gladys DC ST Democrat -0.89Kimball, Dale A UT ST Democrat -1.17King, Garr M OR ST Democrat -0.91King, George H CA CD Democrat -1.37Kocoras, Charles P IL ND Democrat -0.88Koeltl, John G NY SD Democrat -1.44Kollar-kotelly, Colleen DC ST Democrat -1.41Kopf, Richard G NE ST Republican -0.98Korman, Edward R NY ED Republican -1.03Kovachevich, Elizabeth A FL MD Republican 0.23Kyle, Richard H MN ST Republican -1.24Laffitte, Hector M PR ST Republican -0.61Lagueux, Ronald R RI ST Republican -0.79Lamberth, Royce C DC ST Republican -0.17Land, Clay D GA MD Republican -0.14Larimer, David G NY WD Republican -0.77Lasnik, Robert S WA WD Democrat -1.19Lawson, David M MI ED Democrat 0.87Lazzara, Richard Alan FL MD Democrat 0.39Lechner, Alfred J NJ ST Republican 0.03Lee, Gerald Bruce VA ED Democrat -0.40Lee, Tom Stewart MS SD Republican -0.02Legg, Benson Everett MD ST Republican -0.77Legge, Charles A CA ND Republican -1.45Leinenweber, Harry D IL ND Republican -0.86Leisure, Peter K NY SD Republican -0.55Lemelle, Ivan L LA ED Democrat -0.40Lenard, Joan A FL SD Democrat -1.23Letts, J Spencer CA CD Republican -1.14Levi, David F CA ED Republican -0.84Lew, Ronald S CA CD Republican -1.55Note: Restricted to District Court Judges with at least 4 nonmissing CFscores.
64

Table A3: (cont.) District Court Judges Mean Clerk CFscore
Appointing MeanJudge Name District Party CFscoreLifland, John C NJ ST Republican -0.78Lindberg, George W IL ND Republican -0.60Lindsay, Reginald C MA ST Democrat -1.02Little, F A LA WD Republican -0.77Lodge, Edward J ID ST Republican -1.11Longstaff, Ronald E IA SD Republican 0.01Lovell, Charles C MT ST Republican -0.68Lozano, Rudolpho IN ND Republican 0.02Ludwig, Edmund V PA ED Republican -0.63Lungstrum, John Watson KS ST Republican -0.95Lynn, Barbara M TX ND Democrat -0.50Magnuson, Paul A MN ST Republican -0.96Manella, Nora M CA CD Democrat -1.32Manning, Blanche M IL ND Democrat -1.27Marbley, Algenon L OH SD Democrat -1.17Marovich, George M IL ND Republican -0.13Marrero, Victor NY SD Democrat -0.81Marshall, Consuelo B CA CD Democrat -1.22Marten, J Thomas KS ST Democrat -0.88Martin, Beverly B GA ND Democrat -1.23Martin, John S NY SD Republican -1.37Martinez, Philip R TX WD Republican 0.12Matia, Paul R OH ND Republican -1.04Matsch, Richard P CO ST Republican -0.34Matz, A Howard CA CD Democrat -1.19Mcauliffe, Steven James NH ST Republican -1.31Mcavoy, Thomas J NY ND Republican -0.11Mcbryde, John H TX ND Republican 0.87Mccalla, Jon P TN WD Republican -0.56Mcdade, Joe Billy IL CD Republican -0.27Mckeague, David W MI WD Republican -0.18Mckelvie, Roderick R DE ST Republican -0.79Mckenna, Lawrence M NY SD Republican -0.91Mckibben, Howard D NV ST Republican -0.50Mckinley, Joseph H KY WD Democrat -0.66Mckinney, Larry J IN SD Republican -0.66Note: Restricted to District Court Judges with at least 4 nonmissing CFscores.
65

Table A3: (cont.) District Court Judges Mean Clerk CFscore
Appointing MeanJudge Name District Party CFscoreMclaughlin, Mary A PA ED Democrat -1.46Mcmahon, Colleen NY SD Democrat -0.28Mcnamee, Stephen M AZ ST Republican 0.05Means, Terry R TX ND Republican 1.16Melancon, Tucker L LA WD Democrat -0.20Melloy, Michael Joseph IA ND Republican -1.23Merryday, Steven D FL MD Republican 0.15Messitte, Peter J MD ST Democrat -1.17Middlebrooks, Donald M FL SD Democrat -0.91Mihm, Michael M IL CD Republican -0.92Miles-lagrange, Vicki OK WD Democrat -0.30Miller, Robert L IN ND Republican 0.45Miller, Walker D CO ST Democrat -0.45Mills, Michael P MS ND Republican 0.59Mills, Richard IL CD Republican -0.62Molloy, Donald W MT ST Democrat -0.55Mollway, Susan Oki HI ST Democrat -1.10Montgomery, Ann D MN ST Democrat -0.60Moody, James M AR ED Democrat 0.93Moody, James S FL MD Democrat 0.60Moon, Norman K VA WD Democrat -1.00Moore, Michael K FL SD Republican -0.81Moore, William T GA SD Democrat -0.69Mordue, Norman A NY ND Democrat 0.73Moreno, Federico A FL SD Republican -0.20Morgan, Henry Coke VA ED Republican 0.06Morrow, Margaret Mary CA CD Democrat -1.26Moskowitz, Barry T CA SD Democrat -1.07Motz, J Frederick MD ST Republican -1.09Mukasey, Michael B NY SD Republican -0.76Mullen, Graham C NC WD Republican -0.52Munley, James M PA MD Democrat -0.34Murguia, Carlos KS ST Democrat -1.27Murguia, Mary H AZ ST Democrat -0.36Murphy, G Patrick IL SD Democrat -1.15Murphy, Harold L GA ND Democrat 0.08Note: Restricted to District Court Judges with at least 4 nonmissing CFscores.
66

Table A3: (cont.) District Court Judges Mean Clerk CFscore
Appointing MeanJudge Name District Party CFscoreNelson, Edwin L AL ND Republican -0.40Nickerson, William M MD ST Republican -0.56Nixon, John T TN MD Democrat -1.31Norgle, Charles Rondald IL ND Republican -1.11Norton, David C SC ST Republican -0.36Nowlin, James R TX WD Republican 0.79Nugent, Donald C OH ND Democrat -0.72Oliver, Solomon Jr OH ND Democrat -1.09Osteen, William Lindsay NC MD Republican -0.07Otoole, George A MA ST Democrat -1.16Padova, John R PA ED Republican -0.94Pallmeyer, Rebecca R IL ND Democrat -1.24Pannell, Charles A GA ND Democrat 0.60Parker, James A NM ST Republican -0.93Patel, Marilyn Hall CA ND Democrat -1.35Patterson, Robert P NY SD Republican -1.19Paul, Maurice M FL ND Republican -0.31Pauley, William H NY SD Democrat 0.52Payne, Robert E VA ED Republican -0.39Pechman, Marsha Jean WA WD Democrat -1.37Perry, Catherine D MO ED Democrat -0.91Phillips, Virginia A CA CD Democrat -1.39Piersol, Lawrence L SD ST Democrat -0.77Pisano, Joel A NJ ST Democrat -0.52Platt, Thomas C NY ED Republican -0.57Politan, Nicholas H NJ ST Republican -1.26Polozola, Frank J LA MD Democrat 0.60Polster, Dan A OH ND Democrat -1.22Ponsor, Michael A MA ST Democrat -0.97Porteous, G Thomas LA ED Democrat -0.84Prado, Edward C TX WD Republican -0.95Pratt, Robert W IA SD Democrat -1.14Pregerson, Dean D CA CD Democrat -1.08Preska, Loretta A NY SD Republican -0.98Pro, Philip M NV ST Republican -0.82Quist, Gordon J MI WD Republican -0.19Note: Restricted to District Court Judges with at least 4 nonmissing CFscores.
67

Table A3: (cont.) District Court Judges Mean Clerk CFscore
Appointing MeanJudge Name District Party CFscoreRaggi, Reena NY ED Republican -0.75Rainey, John D TX SD Republican 0.03Rakoff, Jed S NY SD Democrat -0.86Rambo, Sylvia H PA MD Democrat -0.23Randa, Rudolph T WI ED Republican 0.44Real, Manuel L CA CD Democrat -0.46Reasoner, Stephen M AR ED Republican -0.46Reinhard, Philip G IL ND Republican 0.09Rice, Walter H OH SD Democrat -1.03Roberts, Richard W DC ST Democrat -0.68Roberts, Victoria A MI ED Democrat -1.29Robertson, James DC ST Democrat -1.11Robinson, Mary Lou TX ND Democrat -0.66Robinson, Sue Lewis DE ST Republican -0.13Robreno, Eduardo C PA ED Republican -0.01Roettger, Norman Charles FL SD Republican 0.90Roll, John Mccarthy AZ ST Republican -0.56Rosen, Gerald E MI ED Republican -0.91Rosenbaum, James M MN ST Republican -1.15Rosenthal, Lee H TX SD Republican -0.62Ross, Allyne R NY ED Democrat -1.01Rothstein, Barbara Jacobs WA WD Democrat -1.49Rufe, Cynthia M PA ED Republican -1.51Russell, Thomas B KY WD Democrat -0.25Ryskamp, Kenneth L FL SD Republican 0.07Sands, W Louis GA MD Democrat -0.10Saris, Patti B MA ST Democrat -1.10Scheindlin, Shira A NY SD Democrat -0.78Schell, Richard A TX ED Republican -0.46Schiller, Berie M PA ED Democrat -1.08Schlesinger, Harvey Erwin FL MD Republican -0.09Schreier, Karen Elizabeth SD ST Democrat -0.42Schwartz, Allen G NY SD Democrat -1.12Scullin, Frederick J NY ND Republican 0.03Sear, Morey L LA ED Republican -0.36Seay, Frank H OK ED Democrat -0.21Note: Restricted to District Court Judges with at least 4 nonmissing CFscores.
68

Table A3: (cont.) District Court Judges Mean Clerk CFscore
Appointing MeanJudge Name District Party CFscoreSedwick, John W AK ST Republican -1.00Seitz, Patricia A FL SD Democrat -1.01Sessions, William K VT ST Democrat -0.84Seybert, Joanna NY ED Democrat -0.40Seymour, Margaret B SC ST Democrat -0.43Shabaz, John C WI WD Republican -0.73Shanahan, Thomas M NE ST Democrat -0.80Shanstrom, Jack D MT ST Republican -0.83Sharp, Allen IN ND Republican -0.47Sharp, George Kendall FL MD Republican 0.63Shaw, Charles Alexander MO ED Democrat -1.11Shubb, William B CA ED Republican -0.65Sifton, Charles P NY ED Democrat -0.96Silver, Roslyn O AZ ST Democrat -0.79Simandle, Jerome B NJ ST Republican -0.35Skretny, William M NY WD Republican 0.16Sleet, Gregory M DE ST Democrat -0.75Smith, C Lynwood AL ND Democrat -0.30Smith, Fern M CA ND Republican -1.32Smith, George C OH SD Republican 0.35Smith, Ortrie D MO WD Democrat -1.02Smith, Rebecca Beach VA ED Republican -1.27Smith, Walter S TX WD Republican 1.18Snyder, Christina A CA CD Democrat -0.99Solis, Jorge A TX ND Republican -0.37Sparks, Sam TX WD Republican -0.69Sparr, Daniel B CO ST Republican -1.11Spatt, Arthur D NY ED Republican 0.06Spencer, James R VA ED Republican -0.20Sporkin, Stanley DC ST Republican -0.92Sprizzo, John E NY SD Republican -0.28Squatrito, Dominic J CT ST Democrat -0.35Stadtmueller, J P WI ED Republican -0.57Stamp, Frederick P WV SD Republican -0.67Standish, William L PA WD Republican -0.06Stanton, Louis L NY SD Republican -1.23Note: Restricted to District Court Judges with at least 4 nonmissing CFscores.
69

Table A3: (cont.) District Court Judges Mean Clerk CFscore
Appointing MeanJudge Name District Party CFscoreSteeh, George Caram MI ED Democrat -0.57Steele, John E FL MD Democrat -0.50Stein, Sidney H NY SD Democrat -1.21Story, Richard W GA ND Democrat 0.02Stotler, Alicemarie H CA CD Republican -0.77Strand, Roger G AZ ST Republican -0.70Sullivan, Emmet G DC ST Democrat -0.84Surrick, R Barclay PA ED Democrat -0.42Swain, Laura Taylor NY SD Democrat -0.53Tarnow, Arthur J MI ED Democrat -0.95Tauro, Joseph L MA ST Republican -0.91Taylor, Anna Diggs MI ED Democrat -0.60Tevrizian, Dickran M CA CD Republican -0.76Thompson, Alvin W CT ST Democrat -1.24Thompson, Anne E NJ ST Democrat -1.15Thompson, Myron H AL MD Democrat -1.11Thornburg, Lacy H NC WD Democrat -0.05Thrash, Thomas W GA ND Democrat -0.53Tidwell, G Ernest GA ND Democrat -0.95Tilley, Norwood Carlton NC MD Republican -0.68Timlin, Robert James CA CD Democrat -0.97Tinder, John Daniel IN SD Republican 0.02Torres, Ernest C RI ST Republican -1.01Trager, David G NY ED Democrat -0.90Trimble, James T LA WD Republican -0.56Tunheim, John R MN ST Democrat -1.37Underhill, Stefan R CT ST Democrat -0.55Ungaro-benages, Ursula FL SD Republican -0.15Urbina, Ricardo M DC ST Democrat -0.17Vanaskle, Thomas I PA MD Democrat -0.27Vanbebber, G Thomas KS ST Republican -0.38Vance, Sarah S LA ED Democrat -1.21Vansickle, Fred L WA ED Republican -1.44Vazquez, Martha NM ST Democrat -1.41Vollmer, Richard W AL SD Republican 0.12Vratil, Kathryn Hoefer KS ST Republican -0.36Note: Restricted to District Court Judges with at least 4 nonmissing CFscores.
70

Table A3: (cont.) District Court Judges Mean Clerk CFscore
Appointing MeanJudge Name District Party CFscoreWaldman, Jay C PA ED Republican -1.21Walker, Vaughn R CA ND Republican -1.28Walls, William H NJ ST Democrat -1.05Walter, Donald E LA WD Republican 0.71Wanger, Oliver W CA ED Republican -0.74Ware, James CA ND Republican 0.08Wells, Lesley Brooks OH ND Democrat -1.18Werlein, Ewing Jr TX SD Republican 0.40Whelan, Thomas J CA SD Democrat -0.61Whipple, Dean MO WD Republican -0.87White, George W OH ND Democrat -0.68Whyte, Ronald M CA ND Republican -0.52Wilken, Claudia A CA ND Democrat -1.29Williams, Alexander Jr MD ST Democrat -1.13Williams, Ann Claire IL ND Democrat -1.09Wilson, Samuel G VA WD Republican 0.19Wilson, Stephen V CA CD Republican -0.78Wilson, William Roy AR ED -0.70Wingate, Henry T MS SD Republican -0.12Winmill, B Lynn ID ST Democrat -0.12Wolf, Mark L MA ST Republican -1.32Wolin, Alfred M NJ ST Republican -0.73Wood, Kimba M NY SD Republican -1.23Woodlock, Douglas P MA ST Republican -0.83Wright, Susan Webber AR ED Republican -0.17Yohn, William H PA ED Republican -0.96Young, Richard L IN SD Democrat 0.19Young, William G MA ST Republican -1.02Zagel, James B IL ND Republican -0.98Zatkoff, Lawrence P MI ED Republican -0.17Zilly, Thomas S WA WD Republican -1.35Zloch, William J FL SD Republican -1.02Zobel, Rya W MA ST Democrat -1.38Note: Restricted to District Court Judges with at least 4 nonmissing CFscores.
71

Table A4: District Court Judges with the most liberal and conservative clerks
Appointing MeanJudge Name District Party CFscoreRaner C Collins AZ ST Democrat -1.59Ronald S Lew CA CD Republican -1.55Keith Paty Ellison TX SD Democrat -1.52Cynthia M Rufe PA ED Republican -1.51Barbara Jacobs Rothstein WA WD Democrat -1.49Mary A Mclaughlin PA ED Democrat -1.46Charles A Legge CA ND Republican -1.45Phyllis J Hamilton CA ND Democrat -1.44Fred L Vansickle WA ED Republican -1.44John G Koeltl NY SD Democrat -1.43Janet Bond Arterton CT ST Democrat -1.43Colleen Kollar-kotelly DC ST Democrat -1.41Martha Vazquez NM ST Democrat -1.41Paul L Friedman DC ST Democrat -1.41Virginia A Phillips CA CD Democrat -1.39
Joseph J Farnan DE ST Republican 0.77James R Nowlin TX WD Republican 0.79Ricardo H Hinojosa TX SD Republican 0.80David M Lawson MI ED Democrat 0.87John H Mcbryde TX ND Republican 0.87Ralph R Beistline AK ST Republican 0.90Norman Charles Roettger FL SD Republican 0.90Hipolito Frank Garcia TX WD Democrat 0.90James M Moody AR ED Democrat 0.93Shelby Highsmith FL SD Republican 0.98Terry R Means TX ND Republican 1.16Walter S Smith TX WD Republican 1.18Michael Burrage OK WD Democrat 1.19Walter J Gex MS SD Republican 1.19Richard Howard Battey SD ST Republican 1.27Note: Restricted to District Court Judges with at least 4 nonmissing CFscores.
72

Table A5: Average CFscore by District Court
District Median Mean District Median Mean District Median MeanAK ST -1.07 -0.49 KS ST -1.13 -0.69 OH ND -1.07 -0.83AL MD -1.03 -0.73 KY ED 0.31 0.12 OH SD -0.86 -0.52AL ND -0.36 -0.45 KY WD -0.57 -0.46 OK ED -0.21 -0.21AL SD -0.87 -0.27 LA ED -0.81 -0.48 OK ND -0.75 -0.43AR ED -0.56 -0.34 LA MD 0.58 0.39 OK WD -0.06 -0.04AR WD -0.51 -0.06 LA WD 0.36 -0.05 OR ST -1.01 -0.69AZ ST -1.12 -0.69 MA ST -1.25 -1.00 PA ED -1.14 -0.81CA CD -1.22 -0.98 MD ST -1.11 -0.90 PA MD -0.97 -0.54CA ED -1.20 -0.69 ME ST -1.05 -0.60 PA WD -0.79 -0.64CA ND -1.30 -1.06 MI ED -0.58 -0.38 PR ST -1.17 -0.82CA SD -1.21 -0.97 MI WD -0.59 -0.25 RI ST -1.18 -0.83CO ST -1.07 -0.87 MN ST -1.30 -0.88 SC ST -0.40 -0.21CT ST -1.08 -0.75 MO ED -0.99 -0.95 SD ST -0.42 -0.13DC ST -1.14 -0.76 MO WD -0.88 -0.73 TN ED -0.61 -0.33DE ST -0.50 -0.27 MS ND 0.64 0.15 TN MD -1.02 -0.81FL MD -0.42 -0.19 MS SD 0.63 0.17 TN WD -1.19 -0.82FL ND -0.64 -0.72 MT ST -0.97 -0.75 TX ED -0.44 -0.24FL SD -0.81 -0.57 NC ED 0.32 -0.12 TX ND -0.35 -0.07GA MD -0.16 -0.32 NC MD -0.40 -0.14 TX SD -0.39 -0.30GA ND -0.55 -0.40 NC WD -0.78 -0.44 TX WD -0.30 -0.12GA SD -0.38 -0.40 ND ST -0.50 -0.17 UT ST -1.00 -0.55HI ST -1.19 -0.74 NE ST -0.95 -0.69 VA ED -0.96 -0.63IA ND -0.90 -0.80 NH ST -1.32 -0.70 VA WD -0.88 -0.48IA SD -1.10 -0.75 NJ ST -1.11 -0.80 VT ST -1.28 -0.89ID ST -0.70 -0.54 NM ST -1.23 -1.03 WA ED -1.23 -1.13IL CD -1.07 -0.65 NV ST -0.86 -0.49 WA WD -1.30 -1.01IL ND -1.13 -0.79 NY ED -1.09 -0.84 WI ED -0.80 -0.32IL SD -1.18 -1.03 NY ND 0.12 -0.15 WI WD -1.25 -0.87IN ND -0.65 0.05 NY NE -0.50 -0.50 WV ND -0.43 -0.24IN SD -0.76 -0.43 NY SD -1.12 -0.84 WV SD -0.71 -0.60
NY WD -0.95 -0.57 WY ST 0.86 0.36
73

Table A6: Median and Mean Clerk CFscore by Circuit
Clerk CFscore
Circuit Median Mean
1 -1.23 -1.072 -1.22 -0.953 -0.98 -0.594 -0.75 -0.315 -0.62 -0.386 -0.94 -0.627 -0.92 -0.538 -0.90 -0.499 -1.23 -0.8410 -1.05 -0.6911 -0.58 -0.35DC -1.22 -0.76
Figure A1: Ideology of Justice Scalia Clerks
74

Figure A2: Distribution of Clerk CFscores by Justice
Note: Vertical line indicates the median clerk CFscore for the given justice.
75