the political economy of corporate governancefaculty.london.edu/pvolpin/politicscg.pdf · 1 the...
TRANSCRIPT
1
The Political Economy of Corporate Governance
Marco Pagano and Paolo F. Volpin*
We analyze the political determinants of investor and employment protection. Our model
predicts that proportional electoral systems are conducive to weaker investor protection and
stronger employment protection than majoritarian systems. This prediction is consistent with
international panel data evidence. The proportionality of the voting system is significantly
and negatively correlated with shareholder protection in a panel of 45 countries, and
positively correlated with employment protection in a panel of 21 OECD countries. Also other
political variables affect regulatory outcomes, especially for the labor market. The origin of
the legal system has some additional explanatory power only for employment protection. (JEL
G34, K22, K42)
Recent works on corporate governance show large differences in the degree of investor
protection between countries, correlated both with the development of capital markets and
with the ownership structure of firms.1 These studies take the degree of investor protection as
exogenous. However, laws result from the political process, which in turn responds to
economic interests. In this sense, legal rules and economic outcomes are jointly determined,
politics being the link between them.
In this paper, we apply this principle to the choice of the degree of investor and
employment protection. We investigate whether a political theory can explain the observed
international differences in regulation. This question has an obvious bearing on the issue of

2
legal reform, because understanding the determinants of regulation in a given country is a
prerequisite to predicting its evolution.
Currently, the consensus explanation of the international differences in investor protection
is that they are rooted in the structure of the legal system, which is historical in origin. This
approach – proposed by Rafael La Porta, Florencio Lopez-de-Silanes, Andrei Shleifer and
Robert Vishny (1998), hereafter LLSV (1998) – is based on the classification of legal systems
into four “families”: the English common-law system and the French, German and
Scandinavian civil-law traditions. LLSV show that shareholder protection is significantly
higher in the common-law countries.
Though striking, these correlations per se do not provide a theory of the determinants of
investor protection: there is no clear reason why common law should provide non-controlling
shareholders with better protection against insiders. In fact, in contrast with this view, there is
evidence that civil law has not always been less suited to business needs than common law.2
Another problem with the “legal-origin approach” is that it lacks predictive power. Since a
country’s legal system is the outcome of choices made centuries ago, this approach implies
that in civil-law countries non-controlling shareholders are doomed to weak legal protection,
and that accordingly the stock market is bound to remain underdeveloped. However, this
hardly squares with the fact that reforms of corporate law do occur in the real world and have
been particularly notable in recent years, as corporate governance problems have come to the
fore in the policy debate.
This suggests that politicians can change company law, if they choose to do so. So the
question becomes: when and why do they decide to? Political economy models can help
answer this question, by formalizing the behavior of voters and politicians in response to their
economic interest as well as to their ideology. In these models the voting process aggregates
the conflicting preferences of voters, and the State serves as agent for the constituencies that
3
prevail. This approach has been applied extensively to the design of fiscal and monetary
policy, but can serve the study of company and labor law equally well.3 In this paper we
attempt a first step in this direction, by developing a stylized model of the political economy
of financial and labor market regulation, and by testing its predictions on a new panel of
international data.
We model an economy with three types of agents: entrepreneurs, rentiers, and workers.
After entrepreneurs have set up their firms, a political vote can change the law. Therefore,
when signing contracts, people have to take the possible outcome of elections into account. In
particular, the amount of equity finance that external investors are willing to provide is
affected by the degree of protection that they expect to receive from company law.
At the voting stage, political preferences are shaped by economic motives. Rentiers, as
minority shareholders, want strong investor protection to limit the private benefits extracted
by entrepreneurs at their expense. The latter, as controlling shareholders, have the opposite
preference. As initial owners of their companies, they ultimately bear the agency cost of weak
investor protection, in the form of reduced availability of equity capital. However, this cost is
sunk at the voting stage: once companies have raised external equity, entrepreneurs have the
incentive to weaken investor protection so as to increase their private benefits.
If the political debate were only about the degree of investor protection, this would be
trivially determined by the balance of power between entrepreneurs and rentiers. However,
firms have another important class of stakeholders: their employees. The latter’s interests can
loom large in the political debate, since they represent a large fraction of the vote and tend to
be ideologically cohesive. As a result, the political debate is likely to extend to labor issues,
such as protection against dismissal. Accordingly, we model the political agenda as centering
on the two main sets of laws that affect stakeholders: company law, insofar as it sets the
4
degree of shareholder protection; and labor law, insofar as it determines employee protection
against dismissal.
We assume that two parties (or political coalitions) compete for votes, by committing to a
policy platform before the elections. Each constituency’s voting behavior is determined by its
economic interests as well as by its ideological bias towards one of the two parties. Voters
also have individual political preferences, which are distributed differently across
constituencies. Entrepreneurs and employees are relatively homogeneous in their political
preferences and are biased towards one of the two parties. In contrast, the rest of the electorate
– which includes rentiers as well as self-employed and unemployed workers – has more
dispersed individual preferences and a less pronounced bias for either party.4
We show that the political outcome hinges crucially on whether the electoral system is
proportional (where winning a majority of the votes is crucial), or majoritarian (where
winning a majority of districts ensures victory). Our main result is that a proportional system
produces weak shareholder protection and strong employment protection, i.e. an outcome
favorable to entrepreneurs and employees and unfavorable to the residual group.5 A
majoritarian system produces the opposite: strong shareholder protection and weak
employment protection, i.e. the outcome preferred by rentiers.
The intuition behind these results is that proportional voting pushes political parties to
cater more to the preferences of social groups with homogeneous preferences, that is,
entrepreneurs and employees. This is because under this voting rule the additional mass of
voters that can be attracted by shifting a party’s platform is greater if the shift favors a
homogeneous constituency. Under a majoritarian system, by contrast, there is keen
competition for the votes of the pivotal district, because this is enough to win the elections. In
our model, the pivotal district coincides with that dominated by the residual group, precisely
because it is not ideologically committed to either party, unlike employee- or entrepreneur-
5
dominated districts. Thus the very lack of ideological commitment that makes this residual
group neglected in a proportional system makes it keenly courted in a majoritarian system.
To test these predictions, we first examine the available cross-country data on investor
protection, employment protection and political variables. Continental European countries and
Japan, which tend to have proportional voting systems, have weak investor and strong
employment protection; Anglo-Saxon countries, whose political systems tend to be
majoritarian, have the reverse. While this evidence is consistent with the model’s predictions,
it is difficult to test them against those of the main competing view that explains cross-
country variation in regulatory outcomes with the origin of the corresponding legal systems.
The difficulty arises from the high collinearity between political and legal variables within a
single cross-section.
To overcome this problem, we construct an international panel dataset for the 1990s, by
collecting data on shareholder protection and merging it with measures of employment
protection and political variables. Using panel estimation techniques, we provide a tighter test
of the two competing theories. The proportionality of the voting system is again found to be
significant and negatively correlated with shareholder protection, and positively correlated
with employment protection. We explore also whether other political variables – such as
ideological factors, district size, voting thresholds, competition among parties, and tenure of
the democratic system – affect the regulatory outcomes, and find that some of them play a
role, especially in shaping labor market regulation. In contrast with the results obtained on
cross-sectional data, in the panel the origin of the legal system has no additional explanatory
power for shareholder protection. Instead, it retains an important role in the determination of
employment protection.
Our findings accord with the growing political economy literature that identifies the
difference between majoritarian and proportional systems as a key variable in the design of

6
economic policy.6 Our contribution to this literature is to show that this variable is important
also in shaping financial and labor market regulation. The degree of proportionality helps
predicting the increase in the degree of shareholder protection and the decline in the degree of
employment protection that occurred in the 1990s. These changes in regulation, which are
relevant to the debate on corporate governance7 and labor relation systems, cannot be
explained by the inherently static legal-origin approach.
The paper is structured as follows. Section I introduces the model and its main
assumptions. The baseline model is analyzed in Sections II and III, and Section IV develops
some extensions. The empirical evidence is presented in Section V. Section VI concludes.
I. Structure of the model
Consider an economy with three types of agents: R rentiers, W workers, and E
entrepreneurs. Rentiers have only a wealth endowment, RA . Workers have a unit endowment
of labor time per period, and a wealth endowment, 0WA ≥ . Entrepreneurs have a wealth
endowment EA and an entrepreneurial idea, which is essential to set up a firm.
Figure 1 illustrates the time line. At 0=t firms are set up by hiring labor and raising
capital. Their founders can raise capital only by selling equity stakes. The availability of
equity finance determines the scale of the company. Firms hire workers who can invest in
effort to raise their productivity. In setting the initial price of equity and wages, entrepreneurs,
investors and workers take account of the legal rules expected to prevail in the future. Once
firms are set up, workers split into two subgroups: employees and self-employed (or
unemployed) workers.
At 1=t , elections are held, with either a proportional or a majoritarian system. Voters are
guided by a mix of economic interest and ideology. The members of each constituency

7
(employed workers, entrepreneurs, rentiers and self-employed workers) share both economic
interests and ideological bias towards a party, but their preferences have also an ideological
individual component. Two parties compete for votes by proposing platforms defined on two
dimensions of regulation: investor protection and employment protection. The first affects the
corporate resources that owner-managers can appropriate at the expense of other shareholders,
that is, the private benefits of control. The second affects their discretion to reduce labor costs.
At 2=t , entrepreneurs learn the individual productivity of their employees. Established
entrepreneurs can restructure their companies at a profit by replacing less productive workers
with new, less expensive ones. The feasibility of this depends on the degree of legal
protection of employed workers.
At 3=t , wages are paid, the owner-manager extracts private benefits of control, and
dividends are distributed to shareholders.
The rentiers’ objective function RU is simply the final value of their wealth. They can
invest either in the representative company’s shares or in an alternative asset (“debt”) yielding
a fixed rate of return, for simplicity normalized to zero. So their objective function is
R R RU V Bβ= + , where Rβ is their equity stake, V is the value of the company (its cash flow
net of the private benefits), and RB is their debt holding.
Workers’ expected utility is ( )WU E c eγ= − , where c is their consumption, γ is the
(positive) marginal disutility of effort and the effort e can take two values, 0 or 1. Workers,
like rentiers, can invest in equity or debt and they receive a wage w if employed. Therefore,
the consumption of employed workers is W Wc w V Bβ= + + , where w is their wage (a
random variable because it depends on whether they are retained or fired), Wβ is their equity

8
stake and WB is their debt holding. Unemployed workers instead consume W Wc V Bβ= +
because they have no labor income.
Entrepreneurs maximize the value of the stake retained in their company (their percentage
stake Eβ multiplied by the value of the company, V) plus the resources diverted from the
company (their private benefits of control, D). Since in this model entrepreneurs invest all
their wealth in their company (as shown below), their objective function is E EU V Dβ= + .
The model takes as exogenous the electoral system (majoritarian or proportional), the
number of agents of each type, technology and preferences, wealth and labor endowments. It
determines endogenously the degree of investor and employee protection, private benefits of
control, wages and employment, investment, and the equity stake of each type of investor.
Let us now explain the assumptions of the model in greater detail.
A. Firms
Firms have a fixed-coefficients production technology, with labor-capital ratio nKN =/ .
The production of Y units requires N workers and K units of capital, with NyY = ( y being
average labor productivity). A worker’s productivity can be low (equal to y) or high (equal to
y+∆). An employee becomes a high-productivity worker with probability x if he invests in
effort (e = 1), and remains a low-productivity worker otherwise (e = 0). Effort captures
investment in firm-specific human capital. It can be undertaken only by workers hired at
0=t , and is not observable. It is efficient to elicit effort, since its marginal productivity
exceeds its disutility: x γ∆ > . To induce workers to exert effort, the firm must agree to pay a
sufficiently high wage. The contractual wage cannot be made contingent on workers’
individual productivity, which is assumed to be observable but not contractible.8
9
To raise the external capital EK A− , the entrepreneur needs to sell shares in the firm.9 We
assume a perfectly elastic supply of capital, as in a small open economy. The required rate of
return on equity is normalized to zero, so that investors must break even in expectation. The
entrepreneur’s stake βΕ is determined by the external investors’ participation constraint
EE AKV −=− )1( β . The value of the company V is endogenous: once financial and labor
contracts are signed, V is reduced by the amount of private benefits that the law allows the
entrepreneur to extract. We assume that in order to keep control of the company (and extract
private benefits) the entrepreneur’s stake Eβ must meet a threshold level *β .10
At t = 0 the entrepreneur chooses the scale of the investment K once and for all, so as to
maximize his objective function. Given the linearity of the production technology, if capital is
productive, he invests as much as possible; otherwise, not at all. To guarantee investment, we
assume that the minimal profit per worker, y, exceeds the cost of capital per worker, 1/n.
Therefore, the size of the representative company, K, is determined by the sum of the
entrepreneur’s initial wealth EA and of any equity finance that he can raise.
B. Political decision
At t = 1 two political parties (or coalitions) compete for votes, designing their platforms so
as to maximize their chances of winning. The electoral system is assumed to be either
proportional (nationwide) or majoritarian (single-member districts). In the former, the winner
is the party that gets the majority of the votes, in the latter the one that wins the majority of
districts. We defer a detailed description of the political stage of the game to Section III.
The policy platforms of the two parties concern employment protection, µ, and shareholder
protection, λ, where ( , ) [0, ] [0, ]λ µ λ µ∈ × . The labor and financing contracts signed at 0=t
10
shape the economic interests of individuals − and therefore their political preferences, as we
shall see in Section II.D.
C. Reorganization
At t = 2, the entrepreneur learns the individual productivity of his employees. If an
employee is retained, he must receive the wage contractually agreed at 0=t . If an employee
is fired, he can be replaced with a new worker, whose productivity is y because he can no
longer acquire firm-specific human capital. This worker is hired at the competitive wage rate
cw , which equals the reservation utility associated with self-employment. To save notation,
the latter is set equal to zero, and so is the competitive wage:11 0=cw .
As we shall see below, the entrepreneur has the incentive to fire the Nx)1( − low-
productivity workers. However, he may be unable to fire all of them, because the law protects
employment stability. We capture this by assuming that an attempt to lay off an employee is
voided by a court with probability ( )π π µ= , which is increasing in employment protection µ.
So the entrepreneur can replace at most (1 )(1 )x Nπ− − of his low-productivity employees.
The function ( )π ⋅ captures the effectiveness of judicial enforcement: better enforcement
increases an employee’s probability of retaining his job, for a given degree of legal protection
µ. We assume that (0) 0π = and that ( ) ( ) /[ ( )]x x x xπ µ γ γ γ≤ ∆ − + ∆ − . We shall see that this
upper bound on the probability π ensures that the firm wishes to elicit effort from its
employees – irrespective of the degree of employment protection.
11
D. Extraction of private benefits
The degree of investor protection chosen at t = 1 sets a ceiling )(λD on the private
benefits that entrepreneurs can extract at 3=t . This ceiling is proportional to the size of the
company and is decreasing in the degree of shareholder protection λ: KdD )(λ= , with
derivative 0)('/ <=∂∂ KdD λλ everywhere.
II. Equilibrium
In this section we derive the model’s subgame perfect equilibria. Therefore, the model is
solved backwards, from t = 3 to 0=t . First, we determine the amount of managerial diversion
D at t = 3. Second, we consider the restructuring phase at t = 2. Next, we derive the cash flows
and the value of the firm at t = 1. Then, we characterize the political preferences of
entrepreneurs, workers and rentiers, but stop short of solving for the equilibrium values of λ
and µ chosen in the political arena at t = 1. Instead, we derive the companies’ ownership
structure and equilibrium labor contracts set at 0=t as a function of the expected legal
regime. We postpone the determination of the political equilibrium to Section III, where the
political subgame is modeled in two alternative fashions, depending on voting rules.
A. Private benefits of control
At t = 3 production generates a profit Nwy )( −=Π , the average wage w and the average
productivity y having been determined at t = 2. Since D is diverted in the form of private
benefits, dividends are D−Π . The level of private benefits that maximizes the owner-
manager’s utility, conditional on his stake βE and on shareholder protection λ , solves

12
DDEDD
+−Π≤
)(max)(β
λ. (1)
It is easy to see that the amount appropriated by the owner-manager is decreasing in the
degree of investor protection. Since 1≤Eβ , the maximum is a corner solution: diversion is
set at its upper bound )(λDD = , which by assumption is a decreasing function of λ.
B. Restructuring
Assuming that employees exert effort, a fraction x of them become high-productivity
workers, the others low-productivity. The entrepreneur retains the former and fires as many of
the latter as he is allowed to, i.e. (1 )(1 )x Nπ− − , replacing them with new hires at the
competitive wage. This increases the firm’s profits by (1 )(1 )x Nwπ− − , since the company
saves the efficiency wage w of each of these workers (recall that the competitive wage is
standardized at zero).
After restructuring, therefore, the firm has x high-productivity workers and x−1 low-
productivity ones. Average productivity is thus ∆+= xyy . High-productivity workers are
paid w. Among low-productivity workers, those hired at t = 0 and not fired at t = 2 earn the
efficiency wage w, while those replaced at t = 2 earn the competitive wage 0. Hence, the
average wage is [ ](1 ) ( )w x x wπ µ= + − , which is increasing in the degree of employment
protection µ.
13
C. Value of the firm
At 1=t , the value of the company is equal to profits less the private benefits of control,
DV −Π= . Recalling that Nwy )( −=Π and using the expressions just found for the average
productivity and wage, the company’s value at 1=t can then be written as:
[ ]{ }1 (1 ) ( ) ( )V y x x x w N Dπ µ λ= + ∆ − + − − . (2)
This expression shows that the value of the company is decreasing in the degree of
employment protection µ. Greater employment protection increases labor costs and thereby
reduces profits by preventing the replacement of incumbent low-productivity workers with
new hires. The value of the company is also increasing in shareholder protection λ, since
private benefits D are a decreasing function of this parameter.
D. Political preferences
As a result of the creation of firms, the initial three types of economic agents turn into four
political constituencies: entrepreneurs, rentiers, employees, and self-employed (or
unemployed) workers. In this section we analyze how λ and µ affect their expected utility as
of 1=t , neglecting debt holdings, which are unaffected by these parameters.
Entrepreneurs favor weak employment protection and weak shareholder protection:
1 ( )E EU V Dβ λ= + . (3)
Rentiers favor weak employment protection and strong shareholder protection, since both
increase the value of their shareholdings:
1R RU Vβ= . (4)
14
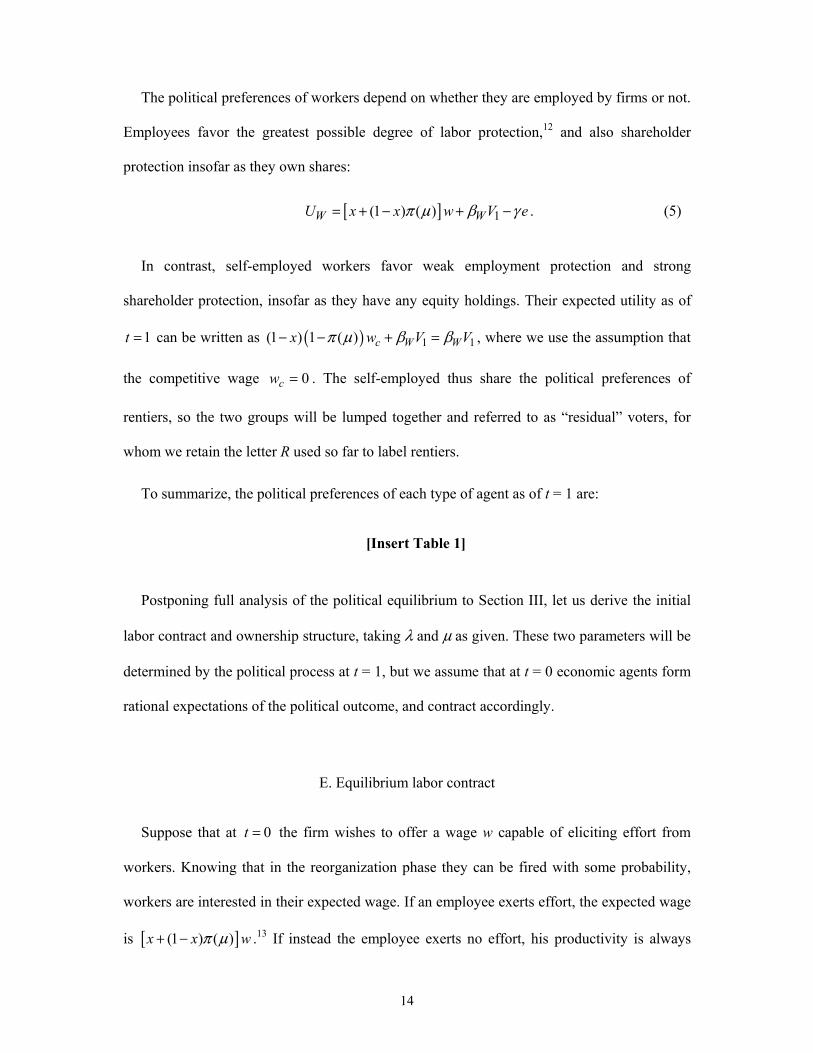
The political preferences of workers depend on whether they are employed by firms or not.
Employees favor the greatest possible degree of labor protection,12 and also shareholder
protection insofar as they own shares:
[ ] 1(1 ) ( )W WU x x w V eπ µ β γ= + − + − . (5)
In contrast, self-employed workers favor weak employment protection and strong
shareholder protection, insofar as they have any equity holdings. Their expected utility as of
1t = can be written as ( ) 1 1(1 ) 1 ( ) c W Wx w V Vπ µ β β− − + = , where we use the assumption that
the competitive wage 0=cw . The self-employed thus share the political preferences of
rentiers, so the two groups will be lumped together and referred to as “residual” voters, for
whom we retain the letter R used so far to label rentiers.
To summarize, the political preferences of each type of agent as of t = 1 are:
[Insert Table 1]
Postponing full analysis of the political equilibrium to Section III, let us derive the initial
labor contract and ownership structure, taking λ and µ as given. These two parameters will be
determined by the political process at t = 1, but we assume that at t = 0 economic agents form
rational expectations of the political outcome, and contract accordingly.
E. Equilibrium labor contract
Suppose that at 0=t the firm wishes to offer a wage w capable of eliciting effort from
workers. Knowing that in the reorganization phase they can be fired with some probability,
workers are interested in their expected wage. If an employee exerts effort, the expected wage
is [ ](1 ) ( )x x wπ µ+ − .13 If instead the employee exerts no effort, his productivity is always
15
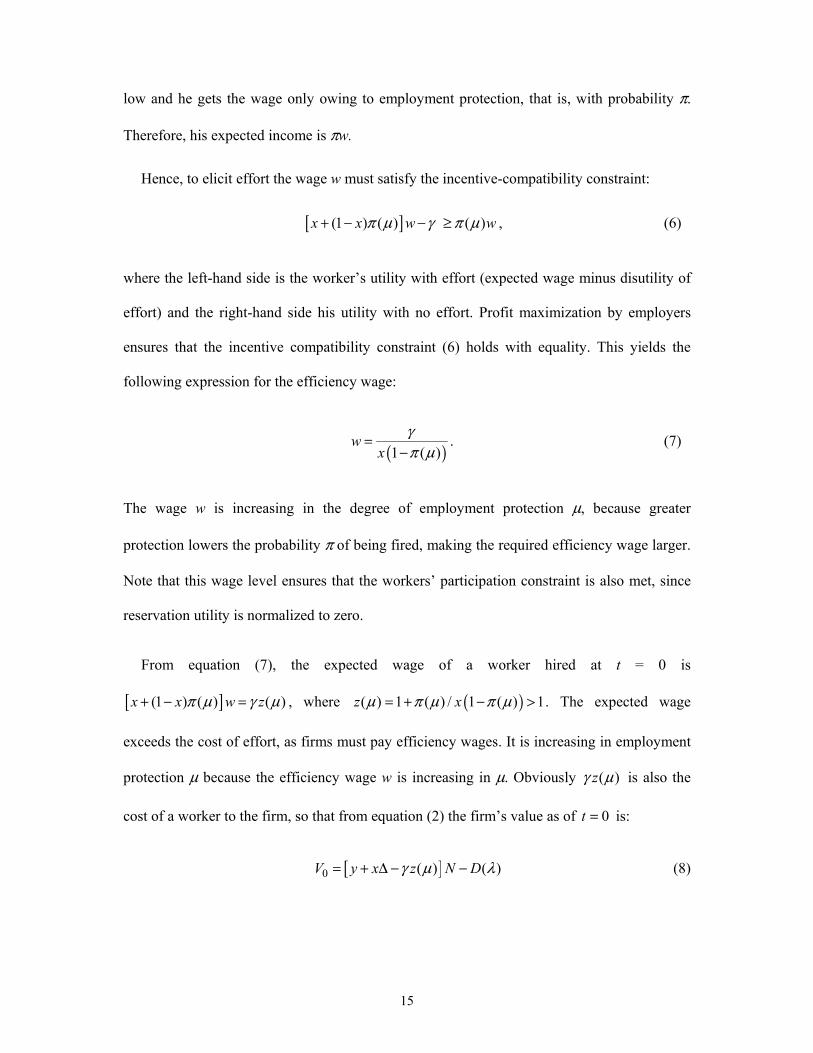
low and he gets the wage only owing to employment protection, that is, with probability π.
Therefore, his expected income is πw.
Hence, to elicit effort the wage w must satisfy the incentive-compatibility constraint:
[ ](1 ) ( ) ( )x x w wπ µ γ π µ+ − − ≥ , (6)
where the left-hand side is the worker’s utility with effort (expected wage minus disutility of
effort) and the right-hand side his utility with no effort. Profit maximization by employers
ensures that the incentive compatibility constraint (6) holds with equality. This yields the
following expression for the efficiency wage:
( )1 ( )w
xγπ µ
=−
. (7)
The wage w is increasing in the degree of employment protection µ, because greater
protection lowers the probability π of being fired, making the required efficiency wage larger.
Note that this wage level ensures that the workers’ participation constraint is also met, since
reservation utility is normalized to zero.
From equation (7), the expected wage of a worker hired at t = 0 is
[ ](1 ) ( ) ( )x x w zπ µ γ µ+ − = , where ( )( ) 1 ( ) / 1 ( ) 1z xµ π µ π µ= + − > . The expected wage
exceeds the cost of effort, as firms must pay efficiency wages. It is increasing in employment
protection µ because the efficiency wage w is increasing in µ. Obviously ( )zγ µ is also the
cost of a worker to the firm, so that from equation (2) the firm’s value as of 0=t is:
[ ]0 ( ) ( )V y x z N Dγ µ λ= + ∆ − − (8)

16
This expression shows that at t = 0 the value of the firm is decreasing in the degree of
employment protection (since the expected labor cost increases with µ) and increasing in the
degree of shareholder protection (since the private benefits of control decrease with λ).
The foregoing derivations rest on the assumption that the firm wants to elicit effort from its
employees. This is true provided the firm’s expected gain x∆ from incentivizing an employee
exceeds the cost of paying an efficiency wage ( )zγ µ . Since the latter is increasing in
employment protection µ, this condition is satisfied for any value of µ if it holds for the
maximal employment protection µ . This amounts to the assumption on ( )π µ made in
Section I.C.
F. Equilibrium ownership structure
At t = 0, the entrepreneur chooses the scale of investment to maximize the value of his
stake in the company plus his private benefits of control:
[ ]{ }0max ( ) ( ) ( )E EK
V D y x z nK d K d Kβ β γ µ λ λ+ = + ∆ − − + (9)
where in the second step we use equation (8) and the definitions of N and D. This
maximization problem must take account of the investors’ participation constraint:
01 1
[ ( )] ( )E E
EK A K A
V y x z nK d Kβ
γ µ λ− −= − = −
+ ∆ − − (10)
and the entrepreneur’s need to retain the controlling stake *Eβ β≥ .
Solving this problem, one finds that the entrepreneur chooses to retain only the control
stake *β . He will choose firm size:

17
*1 (1 *){[ ( )] ( )}
EAKy x z n dβ γ µ λ
=− − + ∆ − −
, (11)
and his implied level of utility will be:
* {[ ( )] 1} *E EU A y x z n Kγ µ= + + ∆ − − . (12)
From expressions (11) and (12), we immediately obtain:
Proposition 1. The optimal scale of the company and the entrepreneur’s ex-ante utility are
strictly increasing in the degree of shareholder protection λ, and decreasing in employment
protection µ.
Proof: See Appendix.
A low degree of shareholder protection and a high degree of employment protection create
ex-ante inefficiency by causing equity rationing. If entrepreneurs could commit to strong
shareholder protection, they would do so, because this would increase their utility. Raising
shareholder protection implies a Pareto gain. Entrepreneurs benefit, while rentiers and
workers are indifferent, since perfect competition ensures that they maintain their reservation
level of utility. Here we assume that entrepreneurs cannot precommit to support such
regulation, but in Section IV.A we discuss ways in which such precommitment could be
achieved.
By determining the entrepreneur’s optimal stake *Eβ β= , the model pins down the
aggregate equity stake of outside investors but leaves the stakes of the representative rentier
Rβ and of the representative worker Wβ indeterminate. These may depend on transaction
costs, taxation, social security, privatization policy, and other institutional arrangements that
we do not model explicitly.
18
III. Political equilibrium
As is shown in Section II.D, at t =1 there are three distinct groups of voters: entrepreneurs
(E), employed workers (W), and a residual group (R) formed by rentiers, unemployed and
self-employed workers, whose utilities are represented in equations (3), (4), and (5)
respectively. We assume that two parties (or coalitions), A and B, compete for their votes and
that no single group is an absolute majority. We denote groups by , ,j E R W= , and parties by
,p A B= . The entrepreneurs are a fraction /( )Es E E R W= + + of the total population.
Employed workers are a fraction /( )Ws EN E R W= + + . The size of residual group is
1R W Es s s= − − .
Our model of the electoral competition is an adaptation of the setting proposed by Persson
and Tabellini (1999) to compare the performance of majoritarian and proportional systems.
Parties commit to policy platforms, qA and qB respectively, before the vote. The policy qp is a
two-dimensional vector ( , ) [0, ] [0, ]λ µ λ µ∈ × . In setting their platforms qA and qB, parties act
simultaneously and do not cooperate. Each seeks to win the election because the winner
enjoys a non-monetary rent.
We assume probabilistic voting to ensure the existence of a voting equilibrium. In one-
dimensional voting problems, two-party competition is known to produce the median voter
result. But in our setting, where voters’ preferences are expressed on two dimensions, cycling
problems emerge. These problems vanish if there is uncertainty about the preferences of each
voter (Dennis C. Mueller, 1989). Specifically, we assume that voter i in group j votes for
party A if

19
( ) ( )j A j B ijU q U q δ σ> + + , (13)
where δ reflects the general popularity of party B and is uniformly distributed on
)]2/(1),2/(1[ ψψ− , while ij j ijσ σ ε= + reflects voter i’s ideological preference for party B.
The parameter jσ is the group-specific ideological preference for party B. The term ijε is
idiosyncratic to voter i and differs across groups: it is uniformly distributed on
[ 1/(2 ), 1/(2 )]j jφ φ− , where the parameter jφ is an index of group j’s ideological cohesion.
We take party A to be right wing, i.e. ideologically close to entrepreneurs, and party B to
be left wing, i.e. close to workers. The residual group is not biased towards either party, i.e.
on average has no ideological preference:
0E R Wσ σ σ σ σ= − < = < = , where .0>σ (14)
We also assume this group to have more dispersed ideological preferences than the other two:
0E W Rφ φ φ φ φ= = > = . (15)
Indeed, this social group is more heterogeneous, as it includes voters as different as rentiers,
self-employed and unemployed workers, and unlike entrepreneurs and employees all of these
lack trade associations that aggregate and direct their votes toward a party.
Before proceeding to the description of the electoral rules, we must determine the
probability that each group j will vote for party A conditional on the general popularity factor
δ . In each group there is a voter k who is indifferent between the two parties. For this voter,
the ideological component is such that ( ) ( )kj j A j B jU q U qε δ σ= − − − . All voters with an
individual ideological preference kjε ε≤ vote for party A. The others prefer party B. Hence,
the fraction of individuals in group j voting for party A is:

20
, [ ( ) ( ) ] 1/ 2A j j j A j B jp U q U qφ δ σ= − − − + . (16)
In what follows we consider two different electoral systems: in Section III.A the
proportional; in Section III.B, the majoritarian. In Section III.C we compare the systems and
discuss the results.
A. Proportional electoral system
In a proportional electoral system, the party with the absolute majority of the votes will
win the election. Hence, the probability that party A wins the election is:
,1Prob 2A j A jjp s p = ≥∑
. (17)
where ,A jp is given by (16). Integrating with respect to the general popularity factor δ ,
equation (17) becomes:
{ } 1 [ ( ) ( ) ]2A j j j A j B jjp s U q U qψ φ σ
φ= − − +∑ . (18)
where j jj sφ φ= ∑ is the average degree of ideological cohesion, which can be regarded as a
measure of the importance of ideology in voting. Expression (18) indicates that, under
proportional voting, the importance of each constituency in affecting the electoral outcome
depends both on its demographic weight js and on its ideological cohesion jφ . The intuition
is that the larger and the more cohesive a group, the larger the mass of voters who can be
attracted by a change in the political platform towards their preferred policy.
Party A will choose the platform qA so as to maximize the probability of winning in (18),
while taking the opponent’s, qB, as given. Symmetrically, party B will choose qB to maximize
21
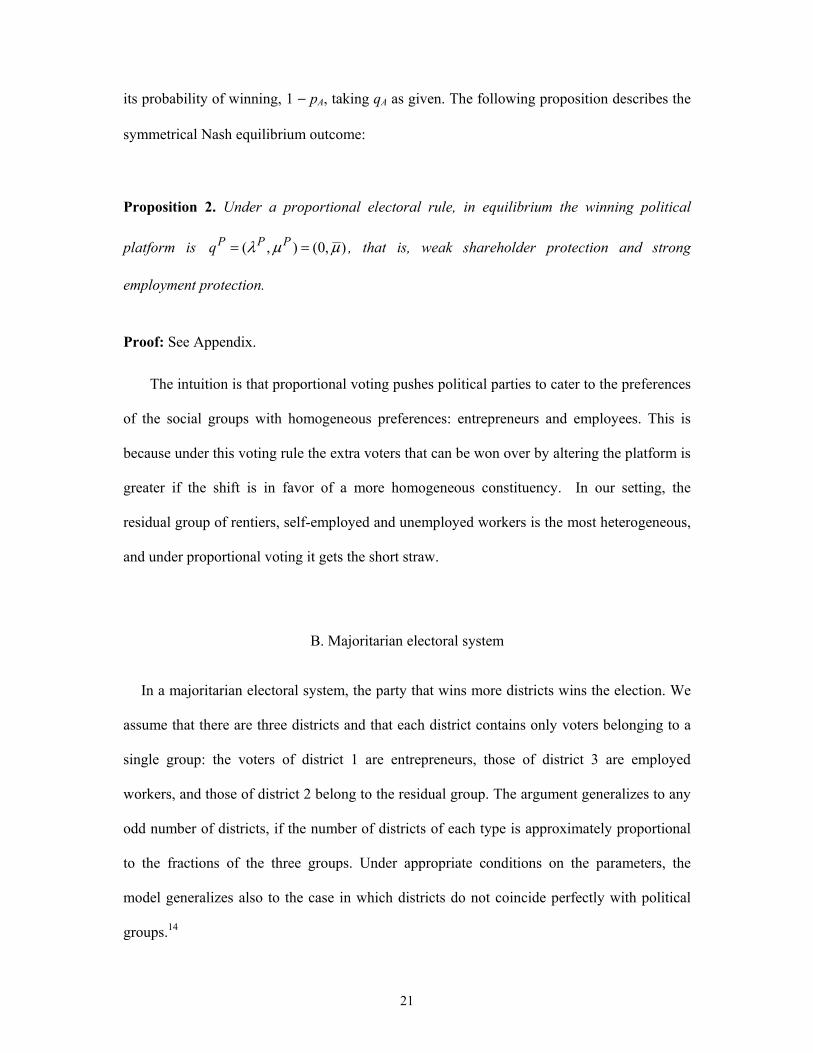
its probability of winning, 1 − pA, taking qA as given. The following proposition describes the
symmetrical Nash equilibrium outcome:
Proposition 2. Under a proportional electoral rule, in equilibrium the winning political
platform is ( , ) (0, )P P Pq λ µ µ= = , that is, weak shareholder protection and strong
employment protection.
Proof: See Appendix.
The intuition is that proportional voting pushes political parties to cater to the preferences
of the social groups with homogeneous preferences: entrepreneurs and employees. This is
because under this voting rule the extra voters that can be won over by altering the platform is
greater if the shift is in favor of a more homogeneous constituency. In our setting, the
residual group of rentiers, self-employed and unemployed workers is the most heterogeneous,
and under proportional voting it gets the short straw.
B. Majoritarian electoral system
In a majoritarian electoral system, the party that wins more districts wins the election. We
assume that there are three districts and that each district contains only voters belonging to a
single group: the voters of district 1 are entrepreneurs, those of district 3 are employed
workers, and those of district 2 belong to the residual group. The argument generalizes to any
odd number of districts, if the number of districts of each type is approximately proportional
to the fractions of the three groups. Under appropriate conditions on the parameters, the
model generalizes also to the case in which districts do not coincide perfectly with political
groups.14

22
To guarantee the existence of a voting equilibrium under the majoritarian rule, one must
assume that the entrepreneurs’ ideological bias to party A and that of the workers to party B
are strong enough (that is, σ is sufficiently large), as in Persson and Tabellini (1999). This
condition, which is derived in Appendix, ensures that there exists a symmetrical equilibrium
in pure strategies, in which the two parties announce the same platform, and competition takes
place only in district 2, which is populated by the residual group. Districts 1 and 3 are never
pivotal, because party A is so likely to win district 1 and lose district 3 that both parties are
concerned only to win over the voters of district 2.15
Therefore, the probability of party A winning is simply the probability of its obtaining the
majority of district-2 votes:
,Prob [ 1/ 2] [ ( ) ( )] 1/ 2A A R R A R Bp p U q U qψ= ≥ = − + . (19)
We conclude:
Proposition 3. Under a majoritarian electoral rule, the winning political platform in a
symmetrical equilibrium is ( , ) ( ,0)M M Mq λ µ λ= = , that is, strong shareholder protection
and weak employment protection.
Proof: See Appendix.
The intuition is that a majoritarian system creates keen competition for the pivotal district,
because this is what wins the elections. In our model, this district coincides with the voters in
the residual group, who, unlike employees or entrepreneurs, are ideologically uncommitted.
Thus the very lack of ideological commitment that makes this residual group politically
neglected in a proportional system makes it the most keenly courted constituency in a
majoritarian system.

23
C. Comparison between electoral systems
For brevity, we label the outcome predicted by Proposition 2 under the proportional system
as “corporatist”, insofar as it combines the preferences of employers and employees, at the
expense of other social groups. This contrasts with the “non-corporatist” outcome that obtains
under the majoritarian system according to Proposition 3. The hallmark of the corporatist
outcome is that the policy parameter µ is set at a higher level and λ at a lower level.
Hence the empirical prediction of these two propositions: (i) in a cross-section of countries
with different electoral systems, investor and employment protection should be negatively
correlated, and (ii) proportional systems should be associated with the corporatist outcome,
majoritarian systems with the non-corporatist. In Section V we shall see to what extent these
predictions are consistent with the data.16
IV. Extensions
In this section, we discuss three possible extensions of the model. In our model, legal rules
are chosen after firms are created. In Section IV.A we discuss how changing this timing
would affect the results. In Section IV.B we present an extension in which some firms are
created after the elections. Finally, in Section IV.C we consider how the model’s predictions
would change if, as a consequence of the diffusion of “equity culture”, the political cohesion
of minority shareholders were to increase. These extensions will be seen to yield interesting
predictions. Insofar as existing firms need to raise additional finance or new firms are created
after the elections, even a proportional electoral system may support shareholder protection.
The same result obtains also if there is a sufficient increase in the political cohesion of
minority shareholders. Therefore, the need to raise fresh capital by firms and the diffusion of

24
“equity culture” among investors may lead to better corporate governance legislation, even in
the context of a proportional voting system.
A. Timing of the elections
In our model, legal rules are chosen after firms have been created. The rationale is that
often the legal rules can be changed after contracts have been signed. The results of the model
would be very different if the rules could not be changed once firms are created, shareholder
and employee protection perhaps being enshrined in the Constitution and not changeable by
the normal legislative process.
If such regulatory “lock-in” were possible, shareholder protection λ would be set at its
highest level to avoid the inefficiency arising from equity rationing. Instead, employment
protection µ would depend on the relative political power of workers and other classes, since
the expected wage is increasing in µ (see Section II.E). Locking into low employment
protection would be efficient, as it would minimize the cost of motivating workers, but would
reduce their expected incomes, thus generating an ex-ante trade-off between efficiency and
distributional equity. But in practice both shareholder and employment protection are set by
ordinary legislation, so such “lock-in” is not realistic. An alternative potential “lock-in”
mechanism is available if entrepreneurs and financiers can “contract out” of their national
legal system, by listing the company in a foreign exchange or incorporating it in a jurisdiction
featuring better shareholder protection.17
A second important issue related to the timing of the model is whether companies go back
to the capital market after they have been started up. We assume that they need capital only at
0t = , so that at 1t = entrepreneurs want poor investor protection in order to maximize their
private benefits. If entrepreneurs needed external financing again later, then their political

25
preferences at 1t = might be different: they might prefer strong investor protection to reduce
the future cost of capital. Our assumption remains reasonable if firms need more external
financing at the start-up than afterwards.
B. Entry of new entrepreneurs
In this section we extend the model by assuming that at t = 1 workers know that with some
probability at t = 2 they will have the option of becoming entrepreneurs, by hiring unskilled
workers and raising equity capital (in this extension, the market for capital is taken to be still
open at that date, like the market for labor). Suppose that they intend to avail themselves of
this opportunity. This expected future change of role could make them politically more
favorable to shareholder protection in the present. To see this point most graphically, assume
that workers have no equity stake in their portfolios ( 0Wβ = ) and ignore labor income.
With steps similar to those followed in Section II.F to derive equations (11) and (12), one
can show that at t = 2 they will be able to create a firm of size
*1 (1 *)[ ( )]
WW
AKyn dβ λ
=− − −
. (20)
Accordingly their expected utility as of t = 1 is:
( 1)1 (1 *)[ ( )]
WW W
AU A nyyn d
ρβ λ
= + −− − −
, (21)
where ρ is the probability of becoming an entrepreneur. This expression is increasing in the
degree of shareholder protection λ:
{ }2(1 *) '( )( 1) 0
1 (1 *)[ ( )]W WU A dny
yn d
β λρλ β λ
∂ −= − − >
∂ − − −. (22)

26
Clearly, the greater the probability ρ of becoming an entrepreneur after the elections, the more
workers’ voting preference will shift towards shareholder protection. This implies that in a
proportional voting system, a party that tries to maximize the probability of winning in
expression (18) will assign a greater weight to shareholder protection. For a sufficiently high
value of ρ, even in a proportional voting system the equilibrium political platform may go
over to a positive value of λ.
C. Equity culture
It is often claimed that the recent diffusion of equity ownership in many countries has been
accompanied by a greater awareness of the importance of investor protection, as well as by
more active lobbying by institutional investors for the reform of corporate governance. In our
model, this translates into greater political cohesion of the “residual group”, which includes
minority shareholders. A simple way to capture this is to assume, in contrast with Section III,
that the ideological cohesion of this group exceeds that of the other constituencies, that is,
0φ φ> .
Under this assumption, by proceeding through the same steps as in the proof of Proposition
1, it is easy to show that under a proportional voting rule the outcome would be strong
investor protection and weak employment protection. In other words, the political outcome
would be ( , ) ( ,0)P P Pq λ µ λ= = , just as under a majoritarian voting rule. This suggests that
the diffusion of equity culture can lead to better corporate governance legislation even in the
context of a proportional voting system.

27
V. Empirical evidence
In this section we test the main implications of the model, using measures of shareholder
protection, employment protection and proxies for the political variables suggested by the
model. First, we show that OECD countries cluster in two groups, as predicted by
Propositions 2 and 3: “corporatist” countries, with weak shareholder protection and strong
employment protection; and “non-corporatist” countries, with the opposite pattern.
Internationally, therefore, we observe a negative correlation between shareholder and
employee protection. Second, we investigate the determinants of shareholder and employment
protection, comparing the predictive power of the model’s political approach and of the
established “legal origin” approach, within a panel of 45 countries comprising both OECD
and developing nations. The entire data set and details about definitions and sources are
available at http://faculty.london.edu/pvolpin/data_aer.html.
A. Shareholder protection and employee protection
Figure 2 plots an indicator of employment protection against the LLSV measure of
shareholder protection for 21 OECD countries. These indicators are the empirical counterparts
of the parameters µ and λ in our model, respectively. The measure of employment protection
is the 1990 average of the OECD Employment Protection Legislation (EPL) indicator for
regular contracts (procedural inconveniences, notice and severance pay for no-fault individual
dismissals, difficulty of dismissal) and for short-term contracts, published by Giuseppe
Nicoletti and Stefano Scarpetta (2001). The measure of shareholder protection is the “Anti-
Director Rights” index of shareholder protection compiled by LLSV (1998), which is the sum
of six dummy variables, capturing whether: (i) proxy by mail is allowed; (ii) shares are not
blocked before a shareholder meeting, (iii) cumulative voting for directors is allowed, (iv)

28
oppressed minorities are protected, (v) the share capital required to call an extraordinary
shareholder meeting is less than 10 percent, and (vi) shareholders have pre-emptive rights at
new equity offerings. The values of the two indicators are reported in the first two columns of
Table 2.
The two variables plotted in Figure 2 are inversely correlated, as shown by the fitted
regression line: their correlation is −0.62, with a p-value of 0.3 percent. This result is
consistent with the first empirical prediction of our model, highlighted in Section III.C.
The observations appear to cluster into two distinct groups: the countries of Continental
Europe and Japan, which to varying extents feature the corporatist outcome, and Anglo-Saxon
countries, which feature the non-corporatist outcome. Our model suggests that electoral
systems should differ systematically across the two clusters: the former should be associated
with proportional voting systems, and the latter with majoritarian ones.
To test this second prediction, we construct an indicator of the degree of proportionality of
the voting system based on the World Bank Database of Political Institutions (hereafter
WBDPI) described by Thorsten Beck, George Clarke, Alberto Groff, Philip Keefer, and
Patrick Walsh (2001). We combine in a single indicator three WBDPI dummy variables that
describe the electoral system: (i) PR, which equals one if at least some candidates are elected
via a proportional rule (i.e., on the basis on the percentage of votes received by their party),
and zero otherwise; (ii) PLURALTY, which equals one if at least some legislators are elected
via a majoritarian rule (i.e., a winner-take-all or first-past-the-post rule), and zero otherwise;
and (iii) HOUSESYS, which equals one if most seats are allocated via a majoritarian rule, and
zero if most seats are allocated with a proportional rule. Our synthetic indicator of
proportionality is defined as: PR − PLURALTY − HOUSESYS + 2. This variable equals 3 if
all the seats are assigned via a proportional rule (pure proportionality), 2 if the majority of

29
seats are assigned via this rule, 1 if a minority of seats are assigned proportionally, and 0 if no
seats are assigned in this way (pure majoritarianism).
The third column of Table 2 displays the average value that this indicator of
proportionality took for each country in the 1986-90 interval. This indicator is averaged over
5 years and lagged relative to shareholder and employment protection in order to capture the
likely delay and gradualism with which electoral systems affects legislation. The OECD
countries that exhibit a higher degree of proportionality tend to have stronger employment
protection and weaker shareholder protection, in accordance with the second prediction of our
model. The correlation between proportionality and shareholder protection is –0.65, with a p-
value of 0.1 percent, while the correlation between proportionality and employment protection
is 0.67, with a p-value of 0.9 percent.
The data shown in Figure 2, however, may be as consistent with our model as with the
well-known “legal origin” approach proposed by LLSV (1998). As noticed above, a non-
corporatist outcome tends to occur in Anglo-Saxon countries, that is, to be associated with
common law. This is confirmed by the data in the fourth column of Table 2, which shows the
LLSV dummy for English Legal Origin. The correlation of this variable with shareholder
protection is 0.69, and with employment protection is –0.84.18
In Table 3 we take a first stab at assessing the relative importance of the proportionality
variable and the legal origin dummies as determinants of shareholder and employment
protection, using the cross-sectional data reported in Table 2. Since according to our model
these two variables are jointly determined, we estimate a system of seemingly unrelated
regressions (SUR). Column 1 confirms the impression conveyed by Figure 2: the
proportionality of the voting system is negatively correlated with shareholder protection, and
positively associated with employment protection. Column 2 indicates that legal variables are
at least as robustly associated with our two regulatory indicators: in particular the coefficient

30
of the English Legal Origin dummy is highly significant in both regressions, with a positive
sign in the shareholder protection regression and a negative one in the employment protection
regression. In column 3 both legal and political variables are included as regressors. The
results show that both legal origin and proportionality are significantly related to shareholder
protection, whereas only the coefficients of the legal origin variables retain their statistical
significance in the employment protection regression. The R2 of the regressions in Table 3
indicates that the explanatory power of legal origin exceeds that of our political variable, and
wipes it out completely for employment protection.
However, this conclusion may reflect the collinearity between the legal and political
variables at a cross-sectional level. Indeed, English Legal Origin has a strong inverse
correlation (–0.69) with the proportionality of the voting system. But this collinearity can be
overcome by exploiting both cross-sectional and time-series variation in the data. To this
purpose, we extend the indicator constructed by LLSV (1998) to the entire interval between
1993 and 2001, relying on the answers to questionnaires sent to legal experts and business
practitioners around the world.19 Our panel includes 47 of the original 49 countries studied by
LLSV (1998), since for Jordan and Sri Lanka there were no responses to our questionnaire.20
Symmetrically, we draw from Nicoletti and Scarpetta (2001) a panel of the OECD
employment protection measure, spanning the 1990-98 interval. Finally, we construct a panel
of political indicators, including our measure of proportionality, based on the WBDPI.
Table 4, which presents descriptive statistics for this panel, reveals that there is some time-
series variation – though admittedly less than cross-country variation – in shareholder and
employment protection, as well as in political variables. To exemplify, shareholder protection
improved in 14 countries out of 47 countries. The countries recording the largest increases are
Italy and South Korea (from 1 to 5 and from 1 to 4, respectively). The overall average rose
from 3.17 to 3.60. The proportionality of the voting system changes in six countries.21 To
31
implement a systematic analysis of the correlations between political variables, legal origin
and regulatory outcomes, we resort to panel data estimation. This approach allows to control
for the effect of unobservable heterogeneity that can lead to spurious correlations, and thereby
produce unreliable cross-sectional estimates.
B. Explaining shareholder protection
Table 5 presents the results of panel regressions on the determinants of shareholder
protection. In columns 1 to 3, we re-estimate the specifications of Table 3 with maximum-
likelihood random effects on our panel. As in the cross-sectional estimates, when introduced
separately, both the proportionality indicator and the English legal origin dummy enter the
regression with highly significant coefficients. Again, shareholder protection is negatively
correlated with proportionality and positively correlated with English legal origin. However,
when political and legal variables enter jointly the list of regressors, only the coefficient of
proportionality retains its sign, magnitude and significance. In contrast, the coefficients of all
the legal origin dummies are no longer statistically different from zero.
In column 4, we report the corresponding estimates with fixed-effects estimation. In this
case, the legal origin variables cannot be included, since they are constant by definition. The
coefficient of proportionality is larger in absolute value (–1.31) and more precisely estimated
than in column 1 (–1.02), where it was obtained with random effects. The economic
significance of these estimates is also quite large: changing the voting system from the
average degree of proportionality (Proportionality=1.77) to a pure majoritarian system
(Proportionality=0) is associated with an estimated increase in shareholder protection between
1.8 and 2.3 – a large increase for a variable that ranges between 0 and 6.
Another interesting finding that emerges from Table 5 is that the coefficients of the time
dummies are almost monotonically increasing with time, from approximately 0 in 1994 to

32
almost 0.5 in 2001. Therefore, over the 1990s the shareholder protection index improved on
average by almost half a point, for reasons independent of electoral systems. This finding also
implies that in this decade there was international convergence in shareholder protection.
C. Explaining employment protection in OECD countries
In Table 6, the same panel-data estimation is carried out for employment protection. Since
in this case the dependent variable is the OECD measure of employment protection, the panel
is limited to the 21 OECD countries for the 1990-1998 interval.
As in Table 5, we start by estimating three random effects regressions with calendar year
dummies. Column 1 shows that proportionality by itself has a positive and statistically
significant coefficient. Column 2 indicates that English, Scandinavian and German legal-
origin dummies are negatively correlated with employment protection, the effect being
particularly large for the English legal-origin dummy. This implies that French legal-origin
countries, being the default case, feature significantly higher degree of employment
protection. In column 3, political and legal variables are used jointly as regressors, and their
coefficients are seen to be all significantly different from zero. This is in striking contrast with
the cross-sectional results presented in column 3 of Table 3, where the proportionality of the
voting system loses all explanatory power once the legal origin dummies are included in the
regression. It also differs from the panel data estimates obtained for shareholder protection in
Table 5, since for employment protection legal origin retains considerable explanatory power.
Fixed-effect estimates confirm the strong correlation between proportionality and
employment protection: in column 4 the coefficient of proportionality is almost identical and
as precisely estimated as in the random effect regression of column 1. It is also economically
significant: changing the voting system from the average degree of proportionality to a pure

33
majoritarian system is associated with an estimated increase in employee protection of 0.8
points, a large effect for a variable ranging between 0.2 and 4.2 in the sample.
Table 6 also indicates that on average employment protection decreased in OECD
countries during the 1990s: the coefficients of the time dummies are decreasing with time,
from approximately 0 in 1991 to –0.3 in 1998. Since the indicator has a lower bound at zero,
this suggests international convergence also in the degree of employment protection.
D. Robustness check: other political variables
So far, our empirical analysis has focused on the proportionality of the voting system, since
this political variable emerged directly from our model as the relevant one. However, other
features of political systems may contribute to shape regulatory outcomes.
Like proportionality, some of these features have to do with the design of the voting
system or of the political system. Such are the average size of voting districts and the
threshold for representation in parliament. The potential impact of some of these variables is
intrinsically related to the proportionality of the voting system. The size of voting districts is
relevant for a majoritarian system but not for a purely proportional one, and it is more relevant
the larger is the proportion of seats assigned by a majoritarian mechanism. So it makes sense
to interact this variable with a measure of “majoritarianism”, defined as the complement to
our proportionality measure. Conversely, a voting threshold is present only in proportional
systems, and its impact is likely to be larger the greater is the fraction of seats assigned via
such mechanism. So it seems appropriate to interact it with our measure of proportionality.
Other potentially relevant political variables relate to the behavior of voters rather than to
the design of the system. Such is the political color of the executive, the degree of competition
between political parties, and the length of democratic tradition in the country.

34
In this section we explore whether adding these variables to the baseline specifications of
our panel regressions (column 3 in Tables 5 and 6, respectively) affects the results concerning
the degree of proportionality. A potential by-product of this exercise is to identify other
political mechanisms affecting shareholder and employment protection.
In Table 7 we perform a general-to-specific specification search. Column 1 reports the
estimates of a random-effects regression for shareholder protection that, beside our measure
of proportionality and the legal origin dummies, includes all the political variables mentioned
above. In column 2 we retain only the variables whose coefficients are significantly different
from zero at the 5 percent level: Proportionality and Center.22 The coefficient of
Proportionality is still negative and precisely estimated, and only slightly smaller in absolute
value than in Table 5. The positive coefficient of Center indicates that shareholders enjoy
better protection in countries where the electorate is less polarized between left- and right-
wing parties. The result can be reconciled with our model, where the constituency that
supports shareholder protection is assumed to be in the middle of the political spectrum and to
have looser ideological allegiances to the two competing parties.
In columns 3 and 4 we repeat the specification search for employment protection. In this
case, we cannot include Competitiveness of Democracy among the explanatory variables,
since for OECD countries this variable always equals 1. Employment protection appears to be
correlated with a larger set of variables than shareholder protection.
First, as in Table 6, the coefficients of both proportionality and legal origin variables retain
their sign and statistical significance, although their absolute value is considerably reduced.23
Second, a higher voting threshold is associated with stronger employment protection. This
may reflect the fact that thresholds reduce the significance of voters belonging to smaller, less
cohesive political groups, such as minority shareholders, and by the same token they increase
the weight of larger, more cohesive ones, such as employees.

35
Third, the tenure of democracy appears to be inversely correlated with employment
protection: younger democracies are more pro-worker. Since this regression is estimated on
data for OECD countries, the youngest democracies in the sample are those of countries such
as Spain, Portugal and Greece, followed by Germany, Japan and Italy. Probably as these
countries emerged from former right-wing dictatorships, the new democratic legislators
passed pro-worker legislation to ensure their popular support.
Finally, the political orientation of the executive (left, right or center) appears to have no
additional explanatory power for employment protection, once the other political variables
and the legal origin dummies are included. In this respect, the panel data evidence confirms
the cross-sectional findings by Botero et al. (2003), who report that legal origin variables wipe
out the effect of the political power of the left in accounting for international variation in labor
regulation.
In summary, the evidence of Table 7 confirms that the proportionality variable is the most
significant political variable in explaining both shareholder and employment protection, while
legal origin dummies retain considerable explanatory power for labor market regulation. In
addition, the estimates suggest that other political variables are significantly related to the
observed regulatory outcomes, especially insofar as employment protection is concerned.
Given the exploratory nature of this evidence, more remains to be done to exploit the
observed variation in the data. For such empirical efforts to be fruitful, the theory presented in
this paper should be extended so as to generate further predictions linking political variables
to regulatory outcomes. We leave this task to future research.

36
VI. Conclusion
This paper proposes a model of the political determinants of the degree of shareholder and
employment protection. Under proportional voting the political outcome is a low degree of
shareholder protection and a high degree of employment protection. This benefits
entrepreneurs and workers, while damaging outside shareholders. Weak shareholder
protection allows entrepreneurs to extract high private benefits of control, while strong worker
protection enables low-productivity workers to retain well-paid jobs. In contrast, in a
majoritarian system, legislation will feature strong shareholder protection and weak employee
protection, which is the outcome preferred by outside shareholders.
This prediction is consistent with international panel data evidence. The proportionality of
the voting system is significantly and negatively correlated with shareholder protection in a
panel of 45 countries, and positively correlated with employment protection in a panel of 21
OECD countries. Also other political variables – such as ideological factors, district size,
voting thresholds, and the tenure of the democratic system – appear to affect regulatory
outcomes. The origin of the legal system has some additional explanatory power only for
employment protection.

37
Appendix
Proof of Proposition 1. By using (10), we can rewrite the problem as:
max [ ( )] EK
y x z nK K Aγ µ+ ∆ − − +
subject only to the constraint:
1 *[ ( )] ( )
EK Ay x z nK d K
βγ µ λ
−− ≥+ ∆ − −
.
Since by assumption 1Ny > and x γ∆ > , the objective function is strictly increasing in K,
while the constraint is decreasing in K. Hence, the optimal policy requires the constraint to be
binding. This implies that *Eβ β= and that the optimal investment K* is given by (11).
Substituting K* into the entrepreneur’s objective function, one finds his indirect utility (12).
Differentiating expression (11) with respect to λ yields:
* 1 ** '( ) 01 (1 *){[ ( )] ( )}
K K dy x z n d
β λλ β γ µ λ
∂ −= − >∂ − − + ∆ − −
.
Similarly, differentiating expression (11) with respect to µ yields:
* (1 *)* '( ) 01 (1 *){[ ( )] ( )}
K nK zy x z n d
β γ µµ β γ µ λ
∂ −= − <∂ − − + ∆ − −
.
Since it is immediate from (12) that *EU is increasing in K*, it is also increasing in λ and
decreasing in µ.

38
Proof of Proposition 2. For party A, maximizing the probability of winning given in (18) is
equivalent to maximizing the politically-weighted social surplus ( ) ( )A j j j AjU q s U qφ= ∑ .
Using (3), (4) and (5), one can rewrite this expression as:
( ) [ (1 ) ]A E E W WU q V s D s x x wβ φ φ µ= + + + − ,
where 0 0[ ( ) ] /( )E R W WE R W EN EN E R Wβ φβ φ β φ β φβ= + + − + + + is a weighted average of
the equity holdings in the economy, where the weights are the products of the size and the
ideological cohesion of the respective constituencies. Recall that the ideological cohesion of
entrepreneurs Eφ and workers Wφ equals φ and that of the residual group is 0φ φ< . The first
derivative of the politicians’ objective function with respect to λ is:
( )EU Ds Kφ βλ λ
∂ ∂= −∂ ∂
, (A1)
and the first derivative with respect to µ is:
( )(1 ) ( )(1 )W EU s N x w N s x wφ β φ βµ
∂ = − − = − −∂
, (A2)
where in the second step we have used the fact that W Es Ns= . The sign of these two
derivatives coincides with that of the expression Es φ β− . To determine the sign of the latter,
notice that equilibrium in the equity market requires that the total holdings of domestic equity
by domestic investors do not exceed the total stock of domestic equity:
E R WE R W Eβ β β+ + ≤ ,
where the inequality is strict if there are foreign shareholders. Using this inequality and the
definition of β , we find that
39
0( )( ) R W
E ER W ENs s
E R Wβ ββ φ φ φ φ+ −
≤ − − <+ +
,
which implies that 0Es φ β− > . Hence, the derivative (A1) is strictly negative and the
derivative (A2) is strictly positive. Therefore the optimal platform offered by both parties
under the proportional electoral rule is a corner solution: 0Pλ = and Pµ µ= . In
equilibrium, party A wins with probability * 1/ 2 ( 1) /A Ep s Nψφσ φ= − − , and party B with
probability *1 Ap− .
Proof of Proposition 3. We proceed in two steps. First, we find a sufficient condition for the
existence of a symmetrical Nash equilibrium in which district 2 is pivotal and therefore the
political outcome is (0, 1). Next, we prove that this is the unique symmetrical Nash
equilibrium in pure strategies.
First, notice that the candidate symmetrical Nash equilibrium satisfies the following three
conditions: (i) each party wins district 2 with ½ probability; (ii) each party wins the district
where it is ideologically favored; (iii) deviating from the strategy of maximizing the
probability of winning district 2 is not optimal. Notice that, taken together, conditions (i) and
(ii) imply that the party that wins district 2 wins the elections, i.e. that it is the pivotal district.
Suppose for the moment that condition (iii) holds. Then the only symmetrical equilibrium is
one in which party A maximizes Ap in (19), and party B maximizes 1 Ap− . To do so, they
will both announce the platform ( , ) ( ,0)M M Mq λ µ λ= = , and win the majority of the votes
in district 2 with ½ probability, as suggested by condition (i).
Condition (iii) also implies that the party winning in district 2 wins also in another district:
otherwise, it would not win the elections. In particular, in equilibrium party A wins in district

40
1 and party B wins in district 3, provided 1/ 2σ ψ> . To show this, notice that 1Pr( 1/ 2) 1Ap ≥ =
is equivalent to Pr( ) 1δ σ≤ = in a symmetrical equilibrium, which holds if 1/ 2σ ψ> . The
same condition implies that party B wins in district 3, i.e. 3Pr( 1/ 2) 1Bp ≥ = .
Now we turn to condition (iii) itself, and establish that it holds for sufficiently large values of
σ . Consider first whether party B has the incentive to deviate from its candidate equilibrium
strategy, by competing for votes in districts 1 and 3. The deviation, denoted by platform q̂ , is
optimal if:
ˆ
1 1 1ˆ ˆmax min [ ( ) ( ) ] , [ ( ) ( ) ]2 2 2E E A W W A
qU q U q U q U qψ σ ψ σ − − + − + + ≥
.
By substituting from equations (3), (4) and (5), and recalling that in the candidate equilibrium
( ,0)Aq λ= , this becomes:
{ }ˆ
ˆ ˆˆ ˆmax min (1 )[ ( ) ( )] (1 ) , (1 )(1 ) [ ( ) ( )] 0.E E W Wq
D D x Nw N x w D Dβ λ λ β µ σ β µ β λ λ σ− − − − − − − − − + ≥
The deviation is not profitable if the first term ˆ ˆ(1 )[ ( ) ( )] (1 )E ED D x Nwβ λ λ β µ σ− − − − − is
negative. This is ensured by condition (1 *)[ (0) ( )]D Dσ β λ> − − , under which the maximal
value of this expression is negative.
Consider next if party A has the incentive to deviate from its candidate equilibrium strategy,
by competing for districts 1 and 3. The deviation, denoted by platform 'q , is optimal if:
1 1 1max min [ ( ') ( ) ] , [ ( ') ( ) ]2 2 2W W B E E B
qU q U q U q U qψ σ ψ σ
′
− − + − + + ≥
.
By substituting from equations (3), (4) and (5), this becomes:
{ }'
max min (1 )(1 ) ' [ ( ') ( )] , (1 )[ ( ') ( )] (1 ) ' 0.W W E Eq
N x w D D D D x wNβ µ β λ λ σ β λ λ β µ σ− − − − − − − − − + ≥

41
For the deviation not to be profitable, it is sufficient that the first term
(1 )(1 ) ' [ ( ') ( )]W WN x w D Dβ µ β λ λ σ− − − − − is negative. Condition (1 )(1 )W N x wσ β> − −
ensures that this term is always negative, since it makes its maximal value negative.
In conclusion, a sufficient condition for the existence of a symmetrical Nash equilibrium is
1max , (1 *)[ (0) ( )], (1 )(1 )2 WD D N x wσ β λ βψ
> − − − −
.
Finally, we show that ( λ , 0) is the unique equilibrium outcome in symmetrical strategies.
Indeed, for any policy platform ( , ) ( ,0)λ µ λ≠ offered by party A, party B can increase its
probability of winning by offering a platform ( , ) for any >0λ ε µ ε+ . With this deviation,
party B is elected with probability 1, by winning districts 2 and 3. Similarly, for any policy
platform ( , ) ( ,0)λ µ λ≠ offered by party B, party A can increase its probability of winning by
offering a platform ( , ) for any >0λ µ ε ε− . With this deviation, party A is elected with
probability 1, by winning districts 1 and 2.

42
References
Bebchuk, Lucian A. “A Rent Protection Theory of Corporate Ownership and Control.”
National Bureau of Economic Research (Cambridge, MA) Working Paper No. 7203,
July 1999.
Bebchuk, Lucian A. and Roe, Mark J. “A Theory of Path Dependence in Corporate
Governance and Ownership.” Stanford Law Review, November 1999, 52, pp. 127-70.
Beck, Thorsten; Clarke, George; Groff, Alberto; Keefer, Philip and Walsh, Patrick. “New
Tools and Tests in Comparative Political Economy: The Database of Political
Institutions.” World Bank Economic Review, 2001, 15(1), pp. 165-76.
Botero, Juan, Simeon Djankov, Rafael La Porta, Florencio Lopez-de-Silanes, and Andrei
Shleifer. “The Regulation of Labor.” Working paper, Harvard University, May 2003.
Coffee, John C. “The Future as History: The Prospects for Global Convergence in Corporate
Governance and Its Implications.” Northwestern University Law Review, 1999,
93(3), 641-708.
Drazen, Allan. Political Economy in Macroeconomics. Princeton, NJ: Princeton University
Press, 2000.
Gilson, Ronald J. “Globalizing Corporate Governance: Convergence of Form or Function.”
American Journal of Comparative Law, 2001, 49, 329-57.
Hansmann, Henri B. and Kraakman Reinier H. “The End of History for Corporate Law.”
Georgetown Law Journal, 2001, 89, 439-68.
La Porta, Rafael; Lopez-de-Silanes, Florencio; Shleifer, Andrei and Vishny, Robert W.
“Legal Determinants of External Finance.” Journal of Finance, 1997, 52, 1131-50.
43
La Porta, Rafael; Lopez-de-Silanes, Florencio; Shleifer, Andrei and Vishny, Robert W. “Law
and Finance.” Journal of Political Economy, 1998, 107, 1113-55.
La Porta, Rafael; Lopez-de-Silanes, Florencio and Shleifer, Andrei. “Corporate Ownership
Around the World.” Journal of Finance, 1999, 54, 471-517.
Lamoreaux, Naomi R. and Rosenthal, Jean-Laurent. “Legal Regime and Business’s
Organizational Choice: A Comparison of France and the United States during the
Mid-Nineteenth Century.” National Bureau of Economic Research (Cambridge, MA)
Working Paper No. 10288, February 2004.
Milesi-Ferretti, Gian Maria; Perotti, Roberto and Massimo Rostagno. “Electoral Systems and
Public Spending.” Quarterly Journal of Economics, May 2002, 117, 609-57.
Mueller, Dennis C. Public Choice II. Cambridge, UK: Cambridge University Press, 1989.
Nicoletti, Giuseppe and Scarpetta, Stefano. “Interaction Between Product and Labour Market
Regulations: Do They Affect Employment? Evidence from the OECD Countries”,
paper presented at the Banco de Portugal Conference on "Labour Market Institutions
and Economic Outcomes", 3-4 June 2001, Lisbon.
Pagano, Marco and Volpin, Paolo F. “Workers, Managers, and Corporate Control.” Journal of
Finance, forthcoming.
Pagano, Marco; Randl, Otto; Röell, Ailsa and Zechner, Josef. “What Makes Stock Exchanges
Succeed? Evidence from Cross-Listing Decisions,” European Economic Review,
2001, 45, 770-82.
Perotti, Enrico and von Thadden, Ernst-Ludwig. “The Political Economy of Bank and Market
Dominance,” Working Paper, University of Amsterdam, September 2003.
Persson, Torsten and Tabellini, Guido. The Economic Effect of Constitutions: What Do the
Data Say? Cambridge, MA: MIT Press, 2004.
44
Persson, Torsten and Tabellini, Guido. “The Size and Scope of Government: Comparative
Politics with Rational Politicians.” European Economic Review, 1999, 43, 699-735.
Persson, Torsten and Tabellini, Guido. Political Economics. Cambridge, MA: MIT Press,
2000.
Rajan, Raghuram and Zingales, Luigi. “The Great Reversals: The Politics of Financial
Development in the 20th Century.” Journal of Financial Economics, 2003, 69, 5-50.
Reese, William A., Jr and Weisbach, Michael S. “Protection of Minority Shareholder
Interests, Cross-listing in the United States, and Subsequent Equity Offerings.”
Journal of Financial Economics, 2002, 66, 65-104.
Roe, Mark J. “Political Preconditions to Separating Ownership from Control: The
Incompatibility of the American Public Firm with Social Democracy.” Stanford Law
Review, 2000, 53, 539-606.
45
Footnotes:
* Pagano: CSEF, Facoltà di Economia, Università di Napoli Federico II, Via Cintia, 80126 Napoli, Italy, phone
+39-081-5752508, fax +39-081-5752243 (e-mail [email protected]). Volpin: Institute of Finance and
Accounting, London Business School, Regent’s Park, London NW1 4SA, U.K., phone +44-20-72625050, fax
+44-20-77243317 (e-mail: [email protected]). We thank two anonymous referees, Lucian Bebchuk, Sandro
Brusco, Andreas Busch, Marcello D’Amato, Oliver Hart, Martin Hellwig, Alessandro Lizzeri, Carla Musella,
Dennis Mueller, Fausto Panunzi, Michele Polo, Jean-Charles Rochet, Mark Roe, Gerard Roland, Howard
Rosenthal, Andrei Shleifer, Anjan Thakor, and Jean Tirole for insightful comments and suggestions. We also
thank participants at seminars at the Banca d’Italia, Bocconi, European Central Bank, Harvard, Harvard Law
School, London Business School, Oesterreichische Nationalbank, Princeton, Toulouse, Yale, the Tilburg
University conference on “Convergence and diversity in corporate governance regimes and capital markets”, the
CEPR workshop on “Understanding Financial Architecture: Legal and Political Framework and Economic
Activity”, the JFI symposium “Corporate Finance with Blurring Boundaries between Banks and Financial
Markets”, the 2001 European Summer Symposium in Financial Markets, the 2001 EEA and EFA meetings, the
2002 AFA meetings, the 2002 Money, Macro and Finance Annual Conference and the 2004 FIRS Conference on
Banking, Insurance and Intermediation. We thank the World Bank, Giuseppe Nicoletti and Stefano Scarpetta of
the OECD, and Bernardo Bortolotti for providing data. The research has been supported by the Italian Ministry
of University and Scientific and Technological Research (MURST), ISFSE-CNR, the National Science
Foundation Graduate Fellowship program and the JP Morgan Chase Research Fellowship at LBS. This paper is
produced as part of a CEPR research network on The Industrial Organization of Banking and Financial Markets
in Europe, funded by the European Commission under the Training and Mobility of Researchers Programme
(contract No ERBFMRXCT980222).
1 See La Porta, Lopez-de-Silanes, Shleifer and Vishny (1997), La Porta, Lopez-de-Silanes, Shleifer and Vishny
(1998), and La Porta, Lopez-de-Silanes and Shleifer (1999).
2 The evidence in Raghuram Rajan and Luigi Zingales (2003) suggests that the finding by La Porta, et al. (1997)
that common-law countries are more financially developed does not generalize to the past. For instance, they
document that at the beginning of the 20th century French capital markets were more developed than those of the
United States. Lamoreaux, Naomi R. and Jean-Laurent Rosenthal (2004) produce evidence that in the 19th
century the French Code de Commerce and legal practice offered more sophisticated and flexible solutions to
organize business than the Anglo-American legal regime.
46
3 For a comprehensive treatment of the political economy approach and of its applications to fiscal and monetary
policy, see Allan Drazen (2000) and Torsten Persson and Guido Tabellini (2000).
4 Therefore, in our model voters are guided by a mix of economic interest and ideology. This contrasts with
others who view voters as driven entirely by ideological factors. For instance, Mark J. Roe (2000) attributes the
differences between the corporate governance systems in the Unites States and in Continental Europe to the
incompatibility of the American ideology with the social democracy common in European countries. In his view,
in Europe the State is entrusted with the task of sustaining a social pact between classes, whereby greater
equality is exchanged for reduced efficiency.
5 Pagano and Volpin (2003) show that a similar convergence of interests between entrepreneurs (or managers)
and employees can occur also at the individual company level, not just in the political arena as in this model.
6 Gian Maria Milesi-Ferretti, Roberto Perotti, and Massimo Rostagno (2002) document the existence of a strong
and very robust positive relationship between the degree of proportionality of the electoral system and the size of
transfer spending in OECD countries. Persson and Tabellini (2004) analyze the impact of the choice between
proportional and majoritarian electoral rules on a broad range of fiscal policy choices. They provide evidence
that majoritarian systems tend to have smaller governments, less welfare spending and lower deficits than
proportional systems.
7 Legal scholars are divided over the degree of convergence that we are likely to see in corporate law, in
contractual behavior and in business practices. Henri B. Hansmann and Reinier H. Kraakman (2000) argue that
shareholder pressure will ensure gradual convergence in corporate law as well. John C. Coffee (1999) suggests
that corporate governance will converge via actual business practices. Ronald J. Gilson (2001) argues that one is
likely to observe interplay of all three types of convergence, with a range of different potential outcomes. In
contrast, Lucian A. Bebchuk and Roe (1999) question the idea of smooth and rapid convergence towards a single
system of corporate governance, since political and economic forces tend to promote path dependence in
corporate law and in business practice.
8 We view the non-contractibility of individual productivity as a feature of production technology. One could
equivalently assume that individual productivity is contractible, but employment protection legislation constrains
the extent to which contracts can be made contingent on individual productivity. The reason is that contingent
contracts could be effectively used to fire low-productivity workers, by paying them less than their reservation
wage. (Under this interpretation, the employment protection parameter µ that will be introduced below would be
the probability that a court would not enforce such a contingent contract.)

47
9 Our model could accommodate the presence of debt, but in this stylized modeling of the agency problem,
external debt and equity would not be intrinsically different, except for the possibly different degree of legal
protection afforded to creditors and shareholders. In a richer model, debt and equity contracts would pay in
different states of nature, and would thus be intrinsically different. Enrico Perotti and Ernst-Ludwig von Thadden
(2003) explore a political economy model where creditors tend to side with employees against shareholders.
10 As shown by Bebchuk (1999), the entrepreneurs’ decision to retain control depends on the magnitude of the
private benefits conferred by control. Here we are implicitly assuming that these benefits are large enough as to
make control desirable even when shareholder protection is strong.
11 To break the tie, we assume that at this wage a worker prefers to become an employee to remaining self-
employed.
12 This requires that workers do not own the entire firm ( 1WN β < ), which holds by assumption, since the
entrepreneur owns a positive stake *β .
13 The first term refers to the high-productivity state: in this state, which occurs with probability x, the worker
always receives the agreed wage w because the firm has no incentive to fire him. The second term refers to the
low-productivity state. This occurs with probability 1−x, and the worker is retained with probability µ, so that he
is paid the wage with probability (1−x)µ.
14 As shown in the Proof of Proposition 3, the existence of a symmetric equilibrium requires that only the district
inhabited by the residual group is pivotal. The entrepreneur- and employee-dominated districts are not pivotal
when the ideological bias of entrepreneurs and workers towards their respective party is sufficiently large that
the competing party cannot win them over. If entrepreneurs and employees represent only a simple majority of
the inhabitants in their districts rather than the totality, the conditions for the existence of the equilibrium become
more stringent, in the sense that greater ideological polarization of workers and entrepreneurs is required.
15 The analysis in this section can be generalized to the case in which other districts are pivotal, by assuming that
there is uncertainty on the pivotal district. With this generalization, parties effectively maximize a social surplus
defined by the weighted average of the utility of all social groups, where the weights are the probabilities that
each district (group) will be pivotal. Even in this more general case, in the majoritarian system the preferences of
rentiers affect the outcome more than in the proportional system. To understand why, recall that the political
weight of the rentiers in a proportional system is inversely related to their ideological dispersion, and therefore

48
under our assumptions is very low. In a majoritarian system their weight is likely to be greater, because it is
given by the probability of their district’s being pivotal, which is unaffected by ideological dispersion.
16 Combining the results in this section with Proposition 1, we also predict less investment and more
unemployment in countries with proportional elections.
17 This mechanism is discussed by Coffee (1999) and Gilson (2001). Relevant evidence is provided by Pagano,
Ailsa Röell, Otto Randl and Josef Zechner (2001) and William A. Jr Reese, and Michael S. Weisbach (2002).
18 This correlation is consistent with the findings of the recent study by Juan Botero, Simeon Djankov, La Porta,
Lopez-de-Silanes, and Shleifer (2003) on the regulation of labor markets.
19 Details on sources are in a technical appendix available upon request from the authors.
20 In our panel data regression we have only 45 countries, because our political variables are not available for
Hong Kong and Nigeria.
21 The proportionality of the voting system increases in Italy (1994) and Venezuela (1989), while it decreases in
France (1986), Japan (1994), New Zealand (1993) and Venezuela (1989).
22 If the regression is estimated with fixed effects (not reported for brevity), only the coefficient of
Proportionality is statistically different from zero at the 5 percent level.
23 As for shareholder protection regression, this result survives also if the equation is estimated with fixed
effects. With this estimation method, however, the coefficients of the other political variables are not
significantly different from zero at conventional significance levels.
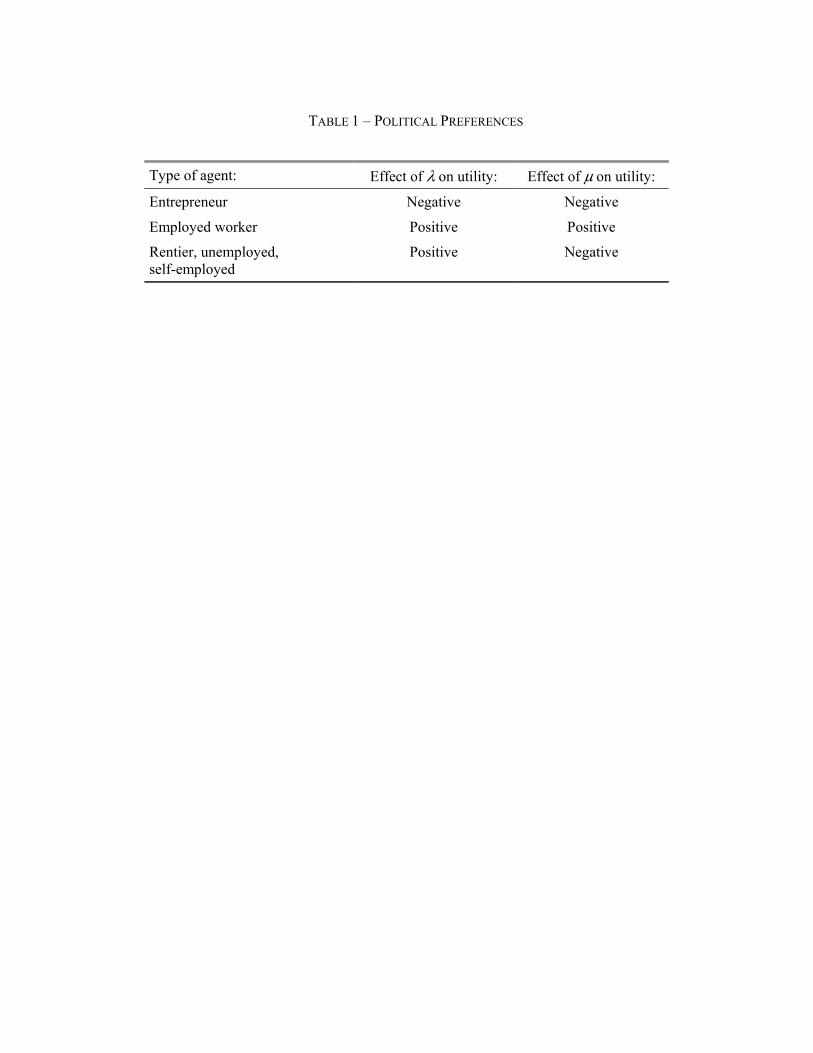
TABLE 1 – POLITICAL PREFERENCES
Type of agent: Effect of λ on utility: Effect of µ on utility:
Entrepreneur Negative Negative
Employed worker Positive Positive
Rentier, unemployed, self-employed
Positive Negative

1
TABLE 2 – SHAREHOLDER PROTECTION, EMPLOYMENT PROTECTION, AND ELECTORAL RULES
Country
Shareholder Protection
(1)
Employment Protection (1990)
(2)
Proportionality (1986-90 average)
(3)
English Legal Origin
(4)
Australia 4 1.06 1 1 Austria 2 2.39 3 0 Belgium 0 3.02 3 0 Canada 5 0.63 0 1 Denmark 2 2.43 3 0 Finland 3 2.22 3 0 France 3 2.73 1 0 Germany 1 3.55 2 0 Greece 2 3.61 2 0 Ireland 4 1.00 3 1 Italy 1 4.15 3 0 Japan 4 2.64 0 0 Netherlands 2 3.06 3 0 New Zealand 4 1.01 0 1 Norway 4 3.09 3 0 Portugal 3 4.20 3 0 Spain 4 3.66 2 0 Sweden 3 3.45 3 0 Switzerland 2 1.27 2 0 United Kingdom 5 0.51 0 1 United States 5 0.22 0 1
Notes: Shareholder Protection is the Anti-director Rights index designed by LLSV (1998): it is the sum of six dummy variables, indicating if proxy by mail is allowed, shares are not blocked before a shareholder meeting, cumulative voting for directors is allowed, oppressed minorities are protected, the percentage of share capital required to call an extraordinary shareholder meeting is less than 10 percent, and existing shareholders have preemptive rights at new equity offerings. Employment Protection is the EPL measure defined as the average of indicators for regular contracts (procedural inconveniences, notice and severance pay for no-fault individual dismissals, difficulty of dismissal) and short-term contracts (fixed-term and temporary) in 1990. Values increase with the strictness of protection. Source: Nicoletti and Scarpetta (2001). Proportionality equals 3 if a 100 percent of seats are assigned via a proportional rule, 2 if the majority of seats are assigned by this rule, 1 if a minority of seats is assigned proportionally, and 0 if no seats are assigned in this way. It is defined as PR – PLURALTY – HOUSESYS + 2, which are variables drawn from the World Bank Database of Political Institutions 2000 (hereafter WBDPI), and defined in Beck et al. (2002). English Legal Origin is a dummy variable that takes value 1 if the origin of the legal system is the English Law and 0 otherwise, based on LLSV (1998).

2
TABLE 3 – DETERMINANTS OF SHAREHOLDER AND EMPLOYMENT PROTECTION: CROSS-SECTIONAL SEEMINGLY UNRELATED REGRESSIONS
(1) (2) (3) Dependent variable: Shareholder Protection Constant 4.38***
(0.42) 2.14***
(0.36) 3.55***
(0.58) Average Proportionality
-0.72***
(0.19) -0.58***
(0.20) English Legal Origin 2.36***
(0.53) 1.33**
(0.58) German Legal Origin 0.11
(0.60) -0.29
(0.53) Scandinavian Legal Origin
0.86
(0.60) 1.19**
(0.52) R2 0.416 0.522 0.656 Dependent variable: Employment Protection Constant 1.18***
(0.38) 3.49***
(0.20) 3.20***
(0.38) Average Proportionality
0.63***
(0.17) 0.12
(0.13) English Legal Origin -2.75***
(0.30) -2.54***
(0.38) German Legal Origin -1.03***
(0.34) -0.94***
(0.35) Scandinavian Legal Origin
0.69**
(0.34) -0.76**
(0.34) R2 0.395 0.805 0.813 Number of Observations
21 21 21
Notes: The dependent variables are Shareholder Protection, which is the Anti-director Rights index designed by LLSV (1998), and Employment Protection, which is the EPL indicator by Nicoletti and Scarpetta (2001). Average Proportionality is the 1986-90 average of Proportionality as defined in Table 3. English, German and Scandinavian Legal Origin are dummy variables that reflect the origin of the legal system, drawn from LLSV (1998). Standard errors are reported in parenthesis. *, **, *** indicate significance at 10, 5, and 1 percent level, respectively.
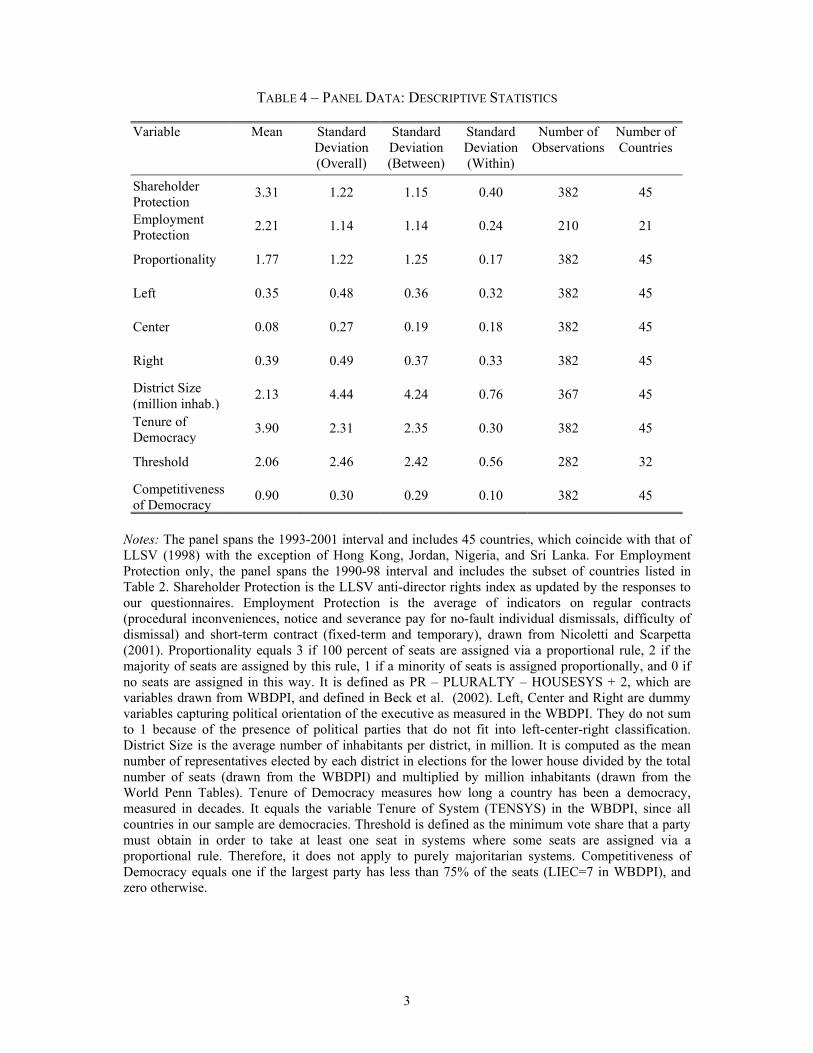
3
TABLE 4 – PANEL DATA: DESCRIPTIVE STATISTICS
Variable Mean Standard Deviation (Overall)
Standard Deviation (Between)
Standard Deviation (Within)
Number of Observations
Number of Countries
Shareholder Protection
3.31 1.22 1.15 0.40 382 45
Employment Protection
2.21 1.14 1.14 0.24 210 21
Proportionality 1.77 1.22 1.25 0.17 382 45
Left 0.35 0.48 0.36 0.32 382 45
Center 0.08 0.27 0.19 0.18 382 45
Right 0.39 0.49 0.37 0.33 382 45
District Size (million inhab.)
2.13 4.44 4.24 0.76 367 45
Tenure of Democracy
3.90 2.31 2.35 0.30 382 45
Threshold 2.06 2.46 2.42 0.56 282 32
Competitiveness of Democracy
0.90 0.30 0.29 0.10 382 45
Notes: The panel spans the 1993-2001 interval and includes 45 countries, which coincide with that of LLSV (1998) with the exception of Hong Kong, Jordan, Nigeria, and Sri Lanka. For Employment Protection only, the panel spans the 1990-98 interval and includes the subset of countries listed in Table 2. Shareholder Protection is the LLSV anti-director rights index as updated by the responses to our questionnaires. Employment Protection is the average of indicators on regular contracts (procedural inconveniences, notice and severance pay for no-fault individual dismissals, difficulty of dismissal) and short-term contract (fixed-term and temporary), drawn from Nicoletti and Scarpetta (2001). Proportionality equals 3 if 100 percent of seats are assigned via a proportional rule, 2 if the majority of seats are assigned by this rule, 1 if a minority of seats is assigned proportionally, and 0 if no seats are assigned in this way. It is defined as PR – PLURALTY – HOUSESYS + 2, which are variables drawn from WBDPI, and defined in Beck et al. (2002). Left, Center and Right are dummy variables capturing political orientation of the executive as measured in the WBDPI. They do not sum to 1 because of the presence of political parties that do not fit into left-center-right classification. District Size is the average number of inhabitants per district, in million. It is computed as the mean number of representatives elected by each district in elections for the lower house divided by the total number of seats (drawn from the WBDPI) and multiplied by million inhabitants (drawn from the World Penn Tables). Tenure of Democracy measures how long a country has been a democracy, measured in decades. It equals the variable Tenure of System (TENSYS) in the WBDPI, since all countries in our sample are democracies. Threshold is defined as the minimum vote share that a party must obtain in order to take at least one seat in systems where some seats are assigned via a proportional rule. Therefore, it does not apply to purely majoritarian systems. Competitiveness of Democracy equals one if the largest party has less than 75% of the seats (LIEC=7 in WBDPI), and zero otherwise.
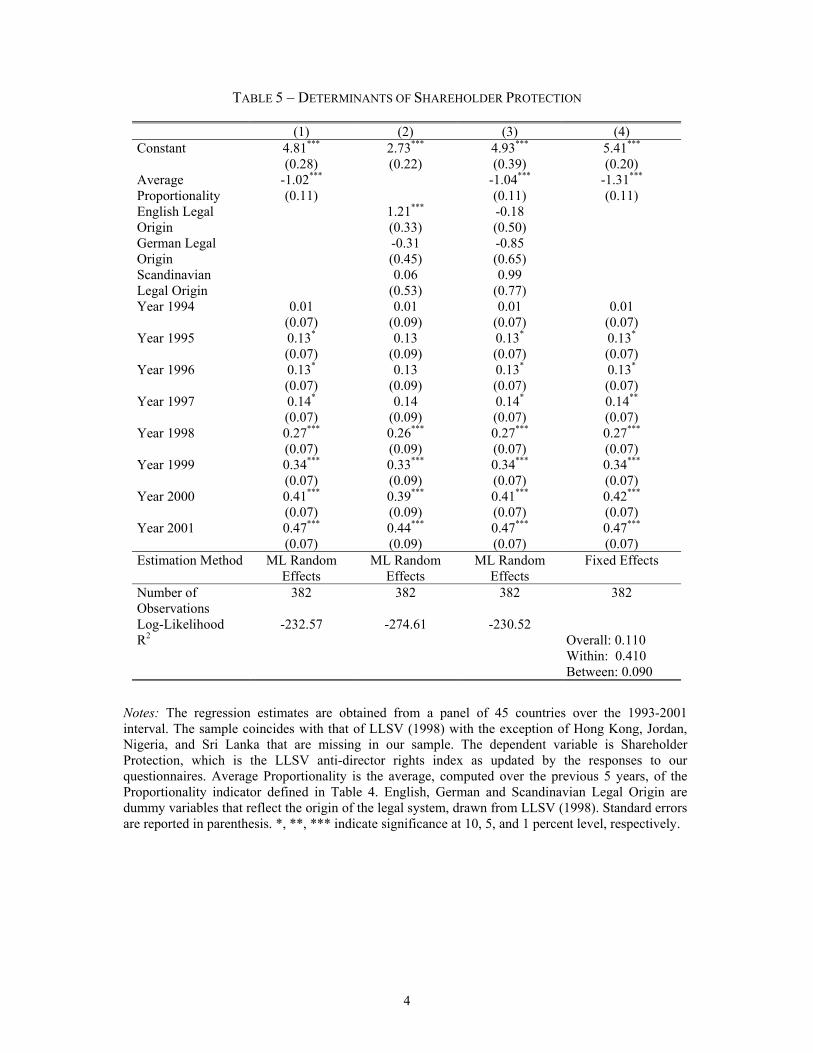
4
TABLE 5 – DETERMINANTS OF SHAREHOLDER PROTECTION
(1) (2) (3) (4) Constant 4.81***
(0.28) 2.73***
(0.22) 4.93***
(0.39) 5.41***
(0.20) Average Proportionality
-1.02***
(0.11) -1.04***
(0.11) -1.31***
(0.11) English Legal Origin
1.21***
(0.33) -0.18
(0.50)
German Legal Origin
-0.31
(0.45) -0.85
(0.65)
Scandinavian Legal Origin
0.06
(0.53) 0.99
(0.77)
Year 1994 0.01
(0.07) 0.01
(0.09) 0.01
(0.07) 0.01
(0.07) Year 1995 0.13*
(0.07) 0.13
(0.09) 0.13*
(0.07) 0.13*
(0.07) Year 1996 0.13*
(0.07) 0.13
(0.09) 0.13*
(0.07) 0.13*
(0.07) Year 1997 0.14*
(0.07) 0.14
(0.09) 0.14*
(0.07) 0.14**
(0.07) Year 1998 0.27***
(0.07) 0.26***
(0.09) 0.27***
(0.07) 0.27***
(0.07) Year 1999 0.34***
(0.07) 0.33***
(0.09) 0.34***
(0.07) 0.34***
(0.07) Year 2000 0.41***
(0.07) 0.39***
(0.09) 0.41***
(0.07) 0.42***
(0.07) Year 2001 0.47***
(0.07) 0.44***
(0.09) 0.47***
(0.07) 0.47***
(0.07) Estimation Method ML Random
Effects ML Random
Effects ML Random
Effects Fixed Effects
Number of Observations
382 382 382 382
Log-Likelihood -232.57 -274.61 -230.52 R2 Overall: 0.110
Within: 0.410 Between: 0.090
Notes: The regression estimates are obtained from a panel of 45 countries over the 1993-2001 interval. The sample coincides with that of LLSV (1998) with the exception of Hong Kong, Jordan, Nigeria, and Sri Lanka that are missing in our sample. The dependent variable is Shareholder Protection, which is the LLSV anti-director rights index as updated by the responses to our questionnaires. Average Proportionality is the average, computed over the previous 5 years, of the Proportionality indicator defined in Table 4. English, German and Scandinavian Legal Origin are dummy variables that reflect the origin of the legal system, drawn from LLSV (1998). Standard errors are reported in parenthesis. *, **, *** indicate significance at 10, 5, and 1 percent level, respectively.

5
TABLE 6 – DETERMINANTS OF EMPLOYMENT PROTECTION IN OECD COUNTRIES
(1) (2) (3) (4) Constant 1.51***
(0.25) 3.41***
(0.19) 2.61***
(0.28) 1.53***
(0.17) Average Proportionality
0.46***
(0.08) 0.34***
(0.08) 0.45***
(0.09) English Legal Origin
-2.50***
(0.28) -1.94***
(0.34)
German Legal Origin
-0.86***
(0.32) -0.66*
(0.35)
Scandinavian Legal Origin
-0.81***
(0.32) -1.03***
(0.35)
Year 1991 -0.03
(0.05) -0.02
(0.06) -0.03
(0.05) -0.03
(0.06) Year 1992 -0.09*
(0.05) -0.08
(0.06) -0.09
(0.05) -0.09
(0.06) Year 1993 -0.22***
(0.05) -0.21***
(0.06) -0.21***
(0.05) -0.22***
(0.06) Year 1994 -0.22***
(0.05) -0.21***
(0.06) -0.22***
(0.05) -0.22***
(0.06) Year 1995 -0.26***
(0.05) -0.25***
(0.06) -0.26***
(0.05) -0.26***
(0.06) Year 1996 -0.31***
(0.05) -0.29***
(0.06) -0.30***
(0.05) -0.30***
(0.06) Year 1997 -0.31***
(0.05) -0.29***
(0.06) -0.30***
(0.05) -0.30***
(0.06) Year 1998 -0.31***
(0.05) -0.29***
(0.06) -0.30***
(0.05) -0.30***
(0.06) Estimation Method
ML Random Effects
ML Random Effects
ML Random Effects
Fixed Effects
Number of Observations
210 210 210 210
Log-Likelihood -18.53 -18.05 -8.59 R2 Overall: 0.307
Within: 0.347 Between: 0.306
Notes: The regression estimates are obtained from a panel of the 21 OECD countries listed in Table 2 over the 1990-98 interval. The dependent variable is Employment Protection, which is the average of indicators on regular contracts and short-term contract, drawn from Nicoletti and Scarpetta (2001). Average Proportionality is the average, computed over the previous 5 years, of the Proportionality indicator defined in Table 4. English, German and Scandinavian Legal Origin are dummy variables that reflect the origin of the legal system, drawn from LLSV (1998). Standard errors are reported in parenthesis. *, **, *** indicate significance at 10, 5, and 1 percent level, respectively.
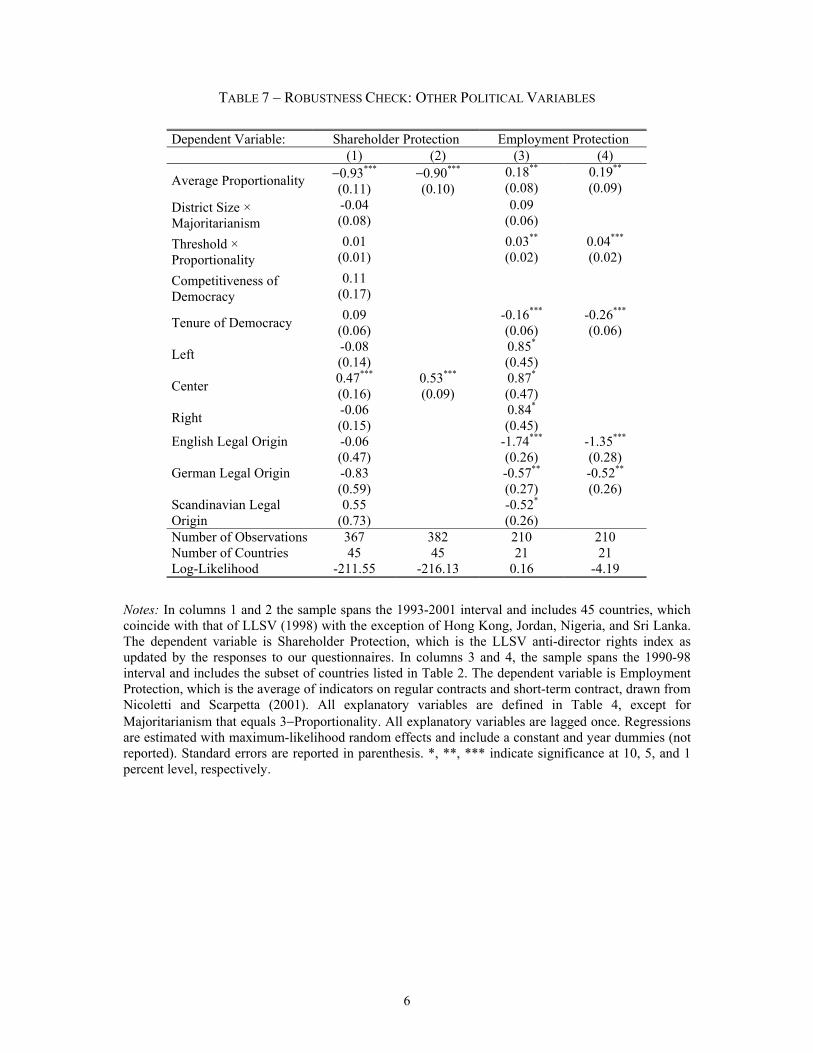
6
TABLE 7 – ROBUSTNESS CHECK: OTHER POLITICAL VARIABLES
Dependent Variable: Shareholder Protection Employment Protection (1) (2) (3) (4)
Average Proportionality −0.93***
(0.11) −0.90***
(0.10) 0.18**
(0.08) 0.19**
(0.09) District Size × Majoritarianism
-0.04
(0.08) 0.09
(0.06)
Threshold × Proportionality
0.01
(0.01) 0.03**
(0.02) 0.04***
(0.02)
Competitiveness of Democracy
0.11
(0.17)
Tenure of Democracy 0.09
(0.06) -0.16***
(0.06) -0.26***
(0.06)
Left -0.08
(0.14) 0.85*
(0.45)
Center 0.47***
(0.16) 0.53***
(0.09) 0.87*
(0.47)
Right -0.06
(0.15) 0.84*
(0.45)
English Legal Origin -0.06
(0.47) -1.74***
(0.26) -1.35***
(0.28) German Legal Origin -0.83
(0.59) -0.57**
(0.27) -0.52**
(0.26) Scandinavian Legal Origin
0.55
(0.73) -0.52*
(0.26)
Number of Observations 367 382 210 210 Number of Countries 45 45 21 21 Log-Likelihood -211.55 -216.13 0.16 -4.19
Notes: In columns 1 and 2 the sample spans the 1993-2001 interval and includes 45 countries, which coincide with that of LLSV (1998) with the exception of Hong Kong, Jordan, Nigeria, and Sri Lanka. The dependent variable is Shareholder Protection, which is the LLSV anti-director rights index as updated by the responses to our questionnaires. In columns 3 and 4, the sample spans the 1990-98 interval and includes the subset of countries listed in Table 2. The dependent variable is Employment Protection, which is the average of indicators on regular contracts and short-term contract, drawn from Nicoletti and Scarpetta (2001). All explanatory variables are defined in Table 4, except for Majoritarianism that equals 3−Proportionality. All explanatory variables are lagged once. Regressions are estimated with maximum-likelihood random effects and include a constant and year dummies (not reported). Standard errors are reported in parenthesis. *, **, *** indicate significance at 10, 5, and 1 percent level, respectively.
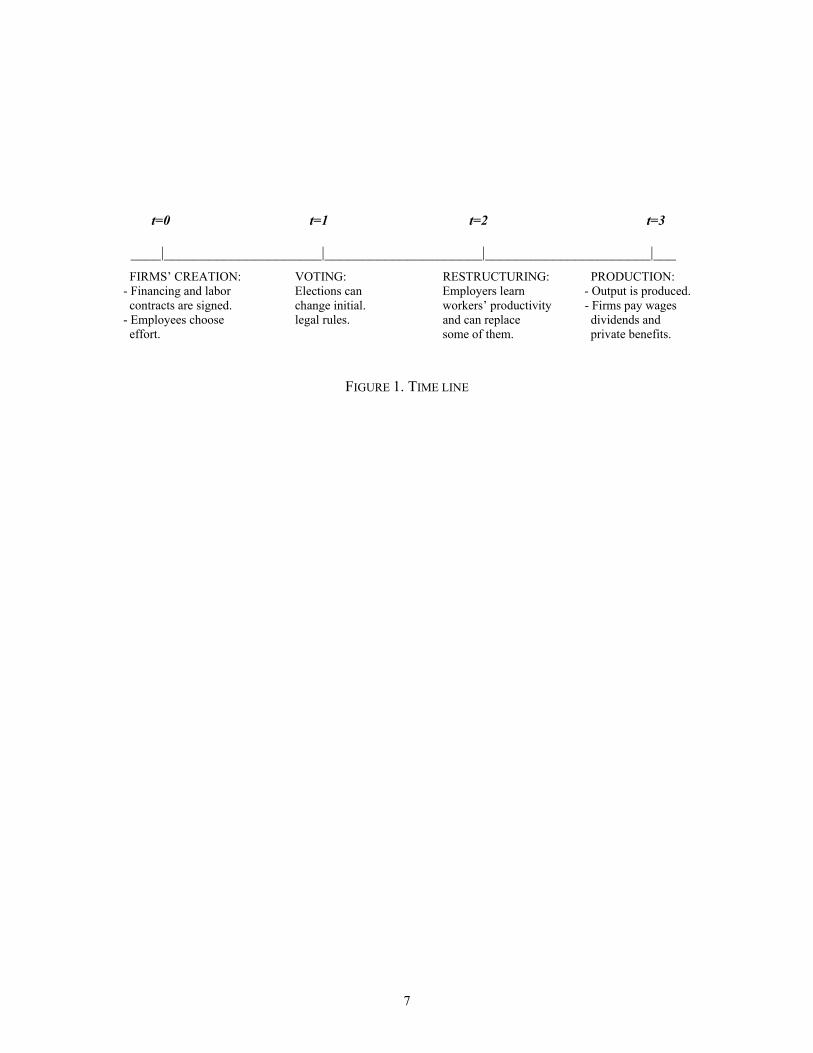
7
t=0 t=1 t=2 t=3
____|_____________________|_____________________|______________________|___ FIRMS’ CREATION: VOTING: RESTRUCTURING: PRODUCTION: - Financing and labor Elections can Employers learn - Output is produced. contracts are signed. change initial. workers’ productivity - Firms pay wages - Employees choose legal rules. and can replace dividends and effort. some of them. private benefits.
FIGURE 1. TIME LINE

8
FIGURE 2. EMPLOYEE AND SHAREHOLDER PROTECTION Notes: Employment Protection Legislation is the OECD 1990 average of indicators on regular contracts (procedural inconveniences, notice and severance pay for no-fault individual dismissals, difficulty of dismissal), short-term contract (fixed-term and temporary), and collective dismissals. Values increase with the strictness of protection. Source: Nicoletti and Scarpetta (2001). Shareholder Rights is the anti-director rights indicator from Table 2 of LLSV (1998).
USA UK CAN
IRLNZL
SWI
AUS
FIN
AUT
JPN
DNK
FRA
BEL
NOR
NLD
SWE
GRE
GER
SPA
ITA
POR
01
23
45
6S
hare
hold
er P
rote
ctio
n
0 1 2 3 4 5Employment Protection Legislation