the political culture of democracy in bolivia: 1998
TRANSCRIPT


The Political Culture of Democracy
in Bolivia: 1998
Lighter shading = more political tolerance
by:
Mitchell A. SeligsonDepartment of Political Science
University of Pittsburgh
Pittsburgh, PA 15260
(412) 648-7268
December, 1998
Prepared for U.S. Agency for International Development
La Paz, Bolivia
The Political Culture of Democracy in Bolivia: 1998 1 Introduction and Executive Summary
Contents
List of Figures . . . . . . . . . . . . . . . . . . . . . . . . . . . . . . . . . . . . . . . . . . . . . . . . . . . . . . . . 4
Introduction and Executive Summary . . . . . . . . . . . . . . . . . . . . . . . . . . . . . . . . . . . . . 10
Chapter I: Methodology and Sample Characteristics . . . . . . . . . . . . . . . . . . . . . . . . . 18Sample Design . . . . . . . . . . . . . . . . . . . . . . . . . . . . . . . . . . . . . . . . . . . . . . . . . 18Sample Weights . . . . . . . . . . . . . . . . . . . . . . . . . . . . . . . . . . . . . . . . . . . . . . . . 23Sample Distribution . . . . . . . . . . . . . . . . . . . . . . . . . . . . . . . . . . . . . . . . . . . . . 26Sample Characteristics . . . . . . . . . . . . . . . . . . . . . . . . . . . . . . . . . . . . . . . . . . 28
Comparisons with Census Data . . . . . . . . . . . . . . . . . . . . . . . . . . . . . . 28Key Demographic Characteristics . . . . . . . . . . . . . . . . . . . . . . . . . . . . . 29Key Socio-Economic Characteristics . . . . . . . . . . . . . . . . . . . . . . . . . . 31Ethnicity . . . . . . . . . . . . . . . . . . . . . . . . . . . . . . . . . . . . . . . . . . . . . . . . . 37Employment . . . . . . . . . . . . . . . . . . . . . . . . . . . . . . . . . . . . . . . . . . . . . 44
Analysis Plan . . . . . . . . . . . . . . . . . . . . . . . . . . . . . . . . . . . . . . . . . . . . . . . . . . 44
Chapter II. . . . . . . . . . . . . . . . . . . . . . . . . . . . . . . . . . . . . . . . . . . . . . . . . . . . . . . . . . . 46
System Support . . . . . . . . . . . . . . . . . . . . . . . . . . . . . . . . . . . . . . . . . . . . . . . . . . . . . 46The Theory and the Measurement . . . . . . . . . . . . . . . . . . . . . . . . . . . . . . . . . . 46
Comparisons with Other Countries . . . . . . . . . . . . . . . . . . . . . . . . . . . . 50Factors that Influence Political Support . . . . . . . . . . . . . . . . . . . . . . . . . . . . . . 52
Demographic Factors . . . . . . . . . . . . . . . . . . . . . . . . . . . . . . . . . . . . . . 53Socio-Economic Status (Education and Income) . . . . . . . . . . . . . . . . . 54Geographic Factors . . . . . . . . . . . . . . . . . . . . . . . . . . . . . . . . . . . . . . . . 56Ethnicity and Religion . . . . . . . . . . . . . . . . . . . . . . . . . . . . . . . . . . . . . . 60Ideology and Political Preference . . . . . . . . . . . . . . . . . . . . . . . . . . . . . 64An Overall Model of System Support in Bolivia . . . . . . . . . . . . . . . . . . . 69
Institutional Support . . . . . . . . . . . . . . . . . . . . . . . . . . . . . . . . . . . . . . . . . . . . . 70Conclusions . . . . . . . . . . . . . . . . . . . . . . . . . . . . . . . . . . . . . . . . . . . . . . . . . . . 73
Chapter III. Political Tolerance . . . . . . . . . . . . . . . . . . . . . . . . . . . . . . . . . . . . . . . . . 74Overall and Comparative Levels of Tolerance . . . . . . . . . . . . . . . . . . . . . . . . . 77Correlates of Tolerance . . . . . . . . . . . . . . . . . . . . . . . . . . . . . . . . . . . . . . . . . . 79System Support and Tolerance . . . . . . . . . . . . . . . . . . . . . . . . . . . . . . . . . . 86Empirical Relationship Between Tolerance and System Support in Bolivia . . . 89
Departmental Distribution of Support for Democracy . . . . . . . . . . . . . . 92Other Measures of Political Tolerance . . . . . . . . . . . . . . . . . . . . . . . . . . . . . . . 95Conclusions . . . . . . . . . . . . . . . . . . . . . . . . . . . . . . . . . . . . . . . . . . . . . . . . . . . 98
Chapter IV. Civil Society Participation . . . . . . . . . . . . . . . . . . . . . . . . . . . . . . . . . . . . 99Levels of Participation . . . . . . . . . . . . . . . . . . . . . . . . . . . . . . . . . . . . . . . . . . 100Determinants of Civil Society Participation . . . . . . . . . . . . . . . . . . . . . . . . . . 102
The Political Culture of Democracy in Bolivia: 1998 2 Introduction and Executive Summary
Gender . . . . . . . . . . . . . . . . . . . . . . . . . . . . . . . . . . . . . . . . . . . . . . . . 103Age . . . . . . . . . . . . . . . . . . . . . . . . . . . . . . . . . . . . . . . . . . . . . . . . . . . 104Size of Community . . . . . . . . . . . . . . . . . . . . . . . . . . . . . . . . . . . . . . . 106Geographic Location . . . . . . . . . . . . . . . . . . . . . . . . . . . . . . . . . . . . . . 109Ethnicity . . . . . . . . . . . . . . . . . . . . . . . . . . . . . . . . . . . . . . . . . . . . . . . . 112Family Size . . . . . . . . . . . . . . . . . . . . . . . . . . . . . . . . . . . . . . . . . . . . . 113
Demand-Making Participation . . . . . . . . . . . . . . . . . . . . . . . . . . . . . . . . . . . . 114Frequency of Demand-Making . . . . . . . . . . . . . . . . . . . . . . . . . . . . . . 115
Determinants of Demand-Making . . . . . . . . . . . . . . . . . . . . . . . . . . . . . . . . . 118Civil Society Participaiton . . . . . . . . . . . . . . . . . . . . . . . . . . . . . . . . . . 118Gender . . . . . . . . . . . . . . . . . . . . . . . . . . . . . . . . . . . . . . . . . . . . . . . . 118Age . . . . . . . . . . . . . . . . . . . . . . . . . . . . . . . . . . . . . . . . . . . . . . . . . . . 119
. . . . . . . . . . . . . . . . . . . . . . . . . . . . . . . . . . . . . . . . . . . . . . . . . . . . . . 120Geographic Location . . . . . . . . . . . . . . . . . . . . . . . . . . . . . . . . . . . . . . 121Ethnicity . . . . . . . . . . . . . . . . . . . . . . . . . . . . . . . . . . . . . . . . . . . . . . . . 122Family Size . . . . . . . . . . . . . . . . . . . . . . . . . . . . . . . . . . . . . . . . . . . . . 123
Does Civil Society Participation Lead to Action? . . . . . . . . . . . . . . . . . . . . . . 124Links Between Civil Society, Tolerance and System Support . . . . . . . . . . . . 136A Multivariate Model of Civil Society Participation . . . . . . . . . . . . . . . . . . . . . 139Conclusions . . . . . . . . . . . . . . . . . . . . . . . . . . . . . . . . . . . . . . . . . . . . . . . . . . 140
Chapter V. Citizens and Local Government . . . . . . . . . . . . . . . . . . . . . . . . . . . . . . 142Level of Participation . . . . . . . . . . . . . . . . . . . . . . . . . . . . . . . . . . . . . . . . . . . 144
Gender . . . . . . . . . . . . . . . . . . . . . . . . . . . . . . . . . . . . . . . . . . . . . . . . 145Urban/Rural Differences . . . . . . . . . . . . . . . . . . . . . . . . . . . . . . . . . . . 146Departmental Differences . . . . . . . . . . . . . . . . . . . . . . . . . . . . . . . . . . 148Age and Family Size . . . . . . . . . . . . . . . . . . . . . . . . . . . . . . . . . . . . . . 151Socio-Economic Status . . . . . . . . . . . . . . . . . . . . . . . . . . . . . . . . . . . . 152Ethnicity . . . . . . . . . . . . . . . . . . . . . . . . . . . . . . . . . . . . . . . . . . . . . . . . 153A Reexamination of the DDPC Sample . . . . . . . . . . . . . . . . . . . . . . . 153A Multivariate Model of Participation in Municipal Meetings . . . . . . . . 155
Municipal Participation and Democracy . . . . . . . . . . . . . . . . . . . . . . . . . . . . . 156Various Other Forms of Local Government Participation . . . . . . . . . . . . . . . . 162Satisfaction with Municipal Services . . . . . . . . . . . . . . . . . . . . . . . . . . . . . . . 168Legitimacy of Local Government . . . . . . . . . . . . . . . . . . . . . . . . . . . . . . . . . . 174Conclusions . . . . . . . . . . . . . . . . . . . . . . . . . . . . . . . . . . . . . . . . . . . . . . . . . . 178
Chapter VI. Administration of Justice . . . . . . . . . . . . . . . . . . . . . . . . . . . . . . . . . . . . 180Victimization in Bolivia . . . . . . . . . . . . . . . . . . . . . . . . . . . . . . . . . . . . . . . . . . 180
Impact of Victimization . . . . . . . . . . . . . . . . . . . . . . . . . . . . . . . . . . . . 182Who Are the Victims of Crime? . . . . . . . . . . . . . . . . . . . . . . . . . . . . . . 184
Views of the Justice System . . . . . . . . . . . . . . . . . . . . . . . . . . . . . . . . . . . . . 187Reporting Crime . . . . . . . . . . . . . . . . . . . . . . . . . . . . . . . . . . . . . . . . . 187
Satisfaction with the Authorities . . . . . . . . . . . . . . . . . . . . . . . . . . . . . . . . . . . 194Factors Related to Satisfaction with the Police and Judiciary . . . . . . . 198

The Political Culture of Democracy in Bolivia: 1998 3 Introduction and Executive Summary
Alternative Systems of Representation . . . . . . . . . . . . . . . . . . . . . . . . . . . . . 201Discrimination . . . . . . . . . . . . . . . . . . . . . . . . . . . . . . . . . . . . . . . . . . . . . . . . 204Corruption . . . . . . . . . . . . . . . . . . . . . . . . . . . . . . . . . . . . . . . . . . . . . . . . . . . 205Conclusions . . . . . . . . . . . . . . . . . . . . . . . . . . . . . . . . . . . . . . . . . . . . . . . . . . 207
Chapter VII. Support for Anti-Democratic Measures . . . . . . . . . . . . . . . . . . . . . . . . 209Support for Coup D’Etats . . . . . . . . . . . . . . . . . . . . . . . . . . . . . . . . . . . . . . . . 209
Who Supports a Coup? . . . . . . . . . . . . . . . . . . . . . . . . . . . . . . . . . . . . 213Demographic factors . . . . . . . . . . . . . . . . . . . . . . . . . . . . . . . . 213Geography . . . . . . . . . . . . . . . . . . . . . . . . . . . . . . . . . . . . . . . . 215Income . . . . . . . . . . . . . . . . . . . . . . . . . . . . . . . . . . . . . . . . . . . 216Political Tolerance and System Support . . . . . . . . . . . . . . . . . . 217Ethnicity and Ideology . . . . . . . . . . . . . . . . . . . . . . . . . . . . . . . 218Victimization . . . . . . . . . . . . . . . . . . . . . . . . . . . . . . . . . . . . . . . 220
Overall Model of Support for a Coup . . . . . . . . . . . . . . . . . . . . . . . . . . 221Support for Civil Disobedience . . . . . . . . . . . . . . . . . . . . . . . . . . . . . . . . . . . . 222Predictors of Civil Disobedience . . . . . . . . . . . . . . . . . . . . . . . . . . . . . . . . . . 223
An Index of Civil Disobedience . . . . . . . . . . . . . . . . . . . . . . . . . . . . . . 223Socio-Economic and Demographic Factors . . . . . . . . . . . . . . . . . . . . 224Geography . . . . . . . . . . . . . . . . . . . . . . . . . . . . . . . . . . . . . . . . . . . . . 227Tolerance, System Support and Approval of Civil Disobedience . . . . 229Ideology . . . . . . . . . . . . . . . . . . . . . . . . . . . . . . . . . . . . . . . . . . . . . . . . 230Support for Coups and Approval of Civil Disobedience . . . . . . . . . . . 231Overall Multivariate Models . . . . . . . . . . . . . . . . . . . . . . . . . . . . . . . . . 233
Conclusions . . . . . . . . . . . . . . . . . . . . . . . . . . . . . . . . . . . . . . . . . . . . . . . . . . 235
Questionnaire: . . . . . . . . . . . . . . . . . . . . . . . . . . . . . . . . . . . . . . . . . . . . . . . . . . . . . 236

The Political Culture of Democracy in Bolivia: 1998 4 Introduction and Executive Summary
List of FiguresFigure I.1 Map of Bolivia: Distribution of Sample by Department . . . . . . . . . . . . . . . 27Figure I.2 Income and Urban/Rural Residence . . . . . . . . . . . . . . . . . . . . . . . . . . . . . 33Figure I.3 Income Urban/Rural Residence and Gender . . . . . . . . . . . . . . . . . . . . . . . 34Figure I.4 Indicators of Wealth . . . . . . . . . . . . . . . . . . . . . . . . . . . . . . . . . . . . . . . . . . 35Figure I.5 Wealth Urban/Rural Residence and Gender . . . . . . . . . . . . . . . . . . . . . . . 36Figure I.6 Ethnic Self-Identification . . . . . . . . . . . . . . . . . . . . . . . . . . . . . . . . . . . . . . 38Figure I.7 Ethnicity, Wealth and Gender . . . . . . . . . . . . . . . . . . . . . . . . . . . . . . . . . . 39Figure I.8 Ethnicity, Education and Gender . . . . . . . . . . . . . . . . . . . . . . . . . . . . . . . . 40Figure I.9 Language(s) Spoken While Growing Up . . . . . . . . . . . . . . . . . . . . . . . . . . 42Figure I.10 Dress and Gender . . . . . . . . . . . . . . . . . . . . . . . . . . . . . . . . . . . . . . . . . . 42Figure I.11 Dress and Wealth . . . . . . . . . . . . . . . . . . . . . . . . . . . . . . . . . . . . . . . . . . 43Figure I.12 Dress and Education . . . . . . . . . . . . . . . . . . . . . . . . . . . . . . . . . . . . . . . . 43Figure II.1 System Support in Bolivia, Core Items . . . . . . . . . . . . . . . . . . . . . . . . . . . 50Figure II.2 System Support, Core Items:
Bolivia in Comparative Perspective . . . . . . . . . . . . . . . . . . . . . . . . 52Figure II.3 Political Support/Alienation and Gender . . . . . . . . . . . . . . . . . . . . . . . . . . 53Figure II.4 Political Support/Alienation and Age . . . . . . . . . . . . . . . . . . . . . . . . . . . . . 54Figure II.5 Political Support/Alienation and Education . . . . . . . . . . . . . . . . . . . . . . . . 55Figure II.6 Political Support/Alienation and Income . . . . . . . . . . . . . . . . . . . . . . . . . . 56Figure II.7 Political Support/Alienation and
Urban/Rural Residence . . . . . . . . . . . . . . . . . . . . . . . . . . . . . . . . . 57Figure II.8 Map of Bolivia: Political Support/Alienation, Variation by Department . . . 60Figure II.9 Political Support/Alienation and Language . . . . . . . . . . . . . . . . . . . . . . . . 61Figure II.10 Political Support/Alienation and Religion . . . . . . . . . . . . . . . . . . . . . . . . 63Figure II.11 Political Support/Alienation and Attendance At Religious Services . . . . 64Figure II.12 Distribution of Sample by Ideology . . . . . . . . . . . . . . . . . . . . . . . . . . . . . 65Figure II.13 Political Support/Alienation and Ideology . . . . . . . . . . . . . . . . . . . . . . . . 66Figure II.14 Political Support-Alienation and Evaluation Of Government Performance
. . . . . . . . . . . . . . . . . . . . . . . . . . . . . . . . . . . . . . . . . . . . . . . . . . . . . . . . . . . . . 67Figure II.15 Political Support/Alienation and Presidential Vote, 1997 . . . . . . . . . . . . 68Figure II.16 Political Support/Alienation and Knowledge
Of Single-Member District Representative . . . . . . . . . . . . . . . . . . 69Figure II.17 Institutional Support: All Variables . . . . . . . . . . . . . . . . . . . . . . . . . . . . . 72Figure III.1 Political Tolerance: Overall Levels . . . . . . . . . . . . . . . . . . . . . . . . . . . . . . 77Figure III.2 Political Tolerance: Bolivia in Comparative
Perspective . . . . . . . . . . . . . . . . . . . . . . . . . . . . . . . . . . . . . . . . . . 78Figure III.3 Tolerance and Education: Bolivia in Comparative Perspective . . . . . . . 80Figure III.4 Tolerance and Ethnic Self-Identification . . . . . . . . . . . . . . . . . . . . . . . . . 82Figure III.5 Map of Bolivia: Variation in Political Tolerance by Department . . . . . . . . 83Figure III.6 Attitudes Favoring Stable Democracy:
Bolivia in Comparative Perspective . . . . . . . . . . . . . . . . . . . . . . . 91Figure III.7 Percent of Population Supportive of Democracy by Department . . . . . . . 93Figure III.8 Map of Bolivia: Percentage of Population Supportive of Democracy . . . . 94
The Political Culture of Democracy in Bolivia: 1998 5 Introduction and Executive Summary
Figure III.9 Opposition to the Suppression of Democratic Liberties: and Education-- Bolivia in Comparative Perspective . . . . . . . . . . . . . . . . . . . . . . . . 97
Figure IV.1 Civil Society Participation by Group . . . . . . . . . . . . . . . . . . . . . . . . . . . 101Figure IV.2 Civil Society Participation:
Bolivia in Comparative Perspective . . . . . . . . . . . . . . . . . . . . . . 102Figure IV.3 Civil Society Participation and Gender . . . . . . . . . . . . . . . . . . . . . . . . . 104Figure IV.4 Civil Society Participation and Age . . . . . . . . . . . . . . . . . . . . . . . . . . . . 105Figure IV.5 Civil Society Participation (total index) and Age . . . . . . . . . . . . . . . . . . 106Figure IV.6 Civil Society Participation by
Size of Community . . . . . . . . . . . . . . . . . . . . . . . . . . . . . . . . . . . 107Figure IV.7. Civil Society Participation(total index) and Size of Community . . . . . . 108Figure IV.8. Civil Society Participation by Size of Community: Divergent Patterns . 109Figure IV.8. Civil Society Participation by Department . . . . . . . . . . . . . . . . . . . . . . 111Figure IV.9 Civil Society Participation and
Ethnic Self-Identification . . . . . . . . . . . . . . . . . . . . . . . . . . . . . . . 112Figure IV.10 Civil Society Participation and Indian/Western Dress . . . . . . . . . . . . . 113Figure IV.11 Civil Society Participation and
Number of Children . . . . . . . . . . . . . . . . . . . . . . . . . . . . . . . . . . 114Figure IV.12 Demand-making: Frequency . . . . . . . . . . . . . . . . . . . . . . . . . . . . . . . 116Figure IV.13 Demand-Making:
Bolivia in Comparative Perspective . . . . . . . . . . . . . . . . . . . . . 117Figure IV.14 Civil Society Participation and Demand-Making . . . . . . . . . . . . . . . . . 118Figure IV.15 Demand-making and Gender . . . . . . . . . . . . . . . . . . . . . . . . . . . . . . . 119Figure IV.16 Demand-making and Age . . . . . . . . . . . . . . . . . . . . . . . . . . . . . . . . . . 120Figure IV.17 Demand-Making and Size of Community . . . . . . . . . . . . . . . . . . . . . . 121Figure IV.18 Demand-making and
Ethnic Self-Identification . . . . . . . . . . . . . . . . . . . . . . . . . . . . . . 123Figure IV.19 Demand-making and Children . . . . . . . . . . . . . . . . . . . . . . . . . . . . . . . 124Figure IV.20 Worked to Resolve Community Problem . . . . . . . . . . . . . . . . . . . . . . 125Figure IV.21 Personal Contributions to
Solving Community Problems: Bolivia in Comparative Perspective . . . . . . . . . . . . . . . . . . . . . . 126
Figure IV.22 Church Participation and Voluntarism . . . . . . . . . . . . . . . . . . . . . . . . . 127Figure IV.23 Church Group Participation and
Voluntarism to Solve a Community Problem . . . . . . . . . . . . . . 128Figure IV.24 School Group Participation and
Voluntarism to Solve a Community Problem . . . . . . . . . . . . . . 129Figure IV.25 Community Development Association Participation and
Voluntarism to Solve a Community Problem . . . . . . . . . . . . . . 130Figure IV.26 Professional Association Participation and
Voluntarism to Solve a Community Problem . . . . . . . . . . . . . . 131Figure IV.27 Union Participation and
Voluntarism to Solve a Community Problem . . . . . . . . . . . . . . 132
The Political Culture of Democracy in Bolivia: 1998 6 Introduction and Executive Summary
Figure IV.28 Cooperative Participation and Voluntarism to Solve a Community Problem . . . . . . . . . . . . . . 133
Figure IV.29 Civic Committee Participation and Voluntarism to Solve a Community Problem . . . . . . . . . . . . . . 134
Figure IV.30 Juntas Vecinales Participation and Voluntarism to Solve a Community Problem . . . . . . . . . . . . . . 135
Figure IV.31 OTB Participation and Voluntarism to Solve a Community Problem . . . . . . . . . . . . . . 136
Figure IV.32 Community Development Association Participation, System Support and Tolerance . . . . . . . . . . . . . . . . . . . . . . . . 137
Figure IV.33 Juntas Vecinales Participation, System Support and Tolerance . . . . . . . . . . . . . . . . . . . . . . . . 138
Figure IV.34 Civil Society Participation, System Support and Tolerance . . . . . . . . . . . . . . . . . . . . . . . . 139
Figure V.1 Attendance at Municipal Meetings: Bolivia in Comparative Perspective . . . . . . . . . . . . . . . . . . . . . . . 145
Figure V.2 Attendance at Municipal Meetings: by Gender and Strata . . . . . . . . . . . 146Figure V.3 Attendance at Municipal Meetings:
Urban-Rural Differences . . . . . . . . . . . . . . . . . . . . . . . . . . . . . . . 147Figure V.4 Attendance at Municipal Meetings:
DDPC Sample . . . . . . . . . . . . . . . . . . . . . . . . . . . . . . . . . . . . . . . 148Figure V.5 Attendance at Municipal Meetings: by Department . . . . . . . . . . . . . . . . 149Figure V.6: Map of Bolivia: Attendance at Municipal Meetings by Department . . . . 150Figure V.7 Attendance at Municipal Meeting:
and Age . . . . . . . . . . . . . . . . . . . . . . . . . . . . . . . . . . . . . . . . . . . . 151Figure V.8 Attendance at Municipal Meetings:
and Number of Children . . . . . . . . . . . . . . . . . . . . . . . . . . . . . . . . 152Figure V.9 Attendance at Municipal Meetings
and Ethnic Self-Identification . . . . . . . . . . . . . . . . . . . . . . . . . . . . 153Figure V.10 Attendance at Municipal Meetings
and System Support . . . . . . . . . . . . . . . . . . . . . . . . . . . . . . . . . 157Figure V.11 Civil Society Participation and Attendance at Municipal Meetings . . . . 158Figure V.12 Attendance at Municipal Meetings,
Civil Society Participation and System Support . . . . . . . . . . . . . 159Figure V.13 Civil Society Participation, Residence
and Attendance at Municipal Meetings . . . . . . . . . . . . . . . . . . . 160Figure V.14 Civil Society Participation, Gender
and Attendance at Municipal Meetings . . . . . . . . . . . . . . . . . . . 161Figure V.15 Attendance at Municipal Meetings,
Civil Society and Ethnic Self-Identification . . . . . . . . . . . . . . . . . 162Figure V.16 Municipal Participation:
Various Forms Compared . . . . . . . . . . . . . . . . . . . . . . . . . . . . . . . . . . 163Figure V.17 System Support and
Various forms of Municipal Participation . . . . . . . . . . . . . . . . . . . . . . . . 164
The Political Culture of Democracy in Bolivia: 1998 7 Introduction and Executive Summary
Figure V.18 Satisfaction with response from municipality among those who made a demand . . . . . . . . . . . . . . . . . . . . . . . . . . . . . . . . . . . . . . . . . . . 165
Figure V.19 Satisfaction with Response of Municipality and System Support . . . . . . . . . . . . . . . . . . . . . . . . . . . . . . . . . 166
Figure V.20 National Sample vs. DDPC Sample: Satisfaction with Response of Municipality . . . . . . . . . . . . . . . 167
Figure V.21 Satisfaction with Response of Municipality and System Support: National vs. DDPC . . . . . . . . . . . . . . . . . . 168
Figure V.22 Satisfaction with Municipal Services: Bolivia in Comparative Perspective . . . . . . . . . . . . . . . . . . . . . . 169
Figure V.23 Evaluation of Municipal Services and System Support: Bolivia in Comparative Perspective . . . . . . . . . . . . . . . . . . . . . . . . . . . 170
Figure V.24 Satisfaction with Municipal Services, System Support and Tolerance . . . . . . . . . . . . . . . . . . . . . . . . . 171
Figure V.25 Satisfaction with Municipal Services and Ethnicity . . . . . . . . . . . . . . . . . . . . . . . . . . . . . . . . . . . . . . . 172
Figure V.26 Treatment by Municipality . . . . . . . . . . . . . . . . . . . . . . . . . . . . . . . . . . 174Figure V.27 Who resolves community problems best? . . . . . . . . . . . . . . . . . . . . . . 175Figure V.28 Who Should have more responsibil ity? . . . . . . . . . . . . . . . . . . . . . . . . 176Figure V.29 Willingness to Pay More Local Taxes
for Better Services . . . . . . . . . . . . . . . . . . . . . . . . . . . . . . . . . . 177Figure V.30 Responsiveness of Municipality . . . . . . . . . . . . . . . . . . . . . . . . . . . . . . 178Figure VI.1 Victimization in Bolivia: 1998 . . . . . . . . . . . . . . . . . . . . . . . . . . . . . . . . . 181Figure VI.2 Victimization in Latin America: 1996 . . . . . . . . . . . . . . . . . . . . . . . . . . . 182Figure VI.3 Victimization and System Support . . . . . . . . . . . . . . . . . . . . . . . . . . . . . 183Figure VI.4 Victimization and Interpersonal Trust . . . . . . . . . . . . . . . . . . . . . . . . . . 184Figure VI.5 Victimization by Gender . . . . . . . . . . . . . . . . . . . . . . . . . . . . . . . . . . . . 185Figure VI.6 Victimization and Age . . . . . . . . . . . . . . . . . . . . . . . . . . . . . . . . . . . . . . 185Figure VI.7 Victimization by Urban/Rural Residence . . . . . . . . . . . . . . . . . . . . . . . . 186Figure VI.8 Victimization by Department . . . . . . . . . . . . . . . . . . . . . . . . . . . . . . . . . 186Figure VI.9 Victimization and Wealth . . . . . . . . . . . . . . . . . . . . . . . . . . . . . . . . . . . . 187Figure VI.10 Reporting of Crime . . . . . . . . . . . . . . . . . . . . . . . . . . . . . . . . . . . . . . . 188Figure VI.11 Difficulty in Reporting Crimes
to the Police or Authorities . . . . . . . . . . . . . . . . . . . . . . . . . . . . 189Figure VI.12 Difficulty in Reporting Crimes
to the Local Authority . . . . . . . . . . . . . . . . . . . . . . . . . . . . . . . . 190Figure VI.13 Ease of Reporting a Crime and Income . . . . . . . . . . . . . . . . . . . . . . . 191Figure VI.14 Ease of Reporting a Crime and Age . . . . . . . . . . . . . . . . . . . . . . . . . . 192Figure VI.15 Ease of Reporting a Crime to Police and
System Support . . . . . . . . . . . . . . . . . . . . . . . . . . . . . . . . . . . . 193Figure VI.16 Ease of Reporting a Crime to the
Community Authorities and System Support . . . . . . . . . . . . . . . . . . . . . . . . . . . . . . . . . . . . . . . . . . . 194

The Political Culture of Democracy in Bolivia: 1998 8 Introduction and Executive Summary
Figure VI.17 Ease of Reporting Crimes: by Department . . . . . . . . . . . . . . . . . . . . . . . . . . . . . . . . . . . . . 195
Figure VI.18 Treatment by the Police . . . . . . . . . . . . . . . . . . . . . . . . . . . . . . . . . . . 196Figure VI.19 Treatment by Police When Dealing with a
Matter . . . . . . . . . . . . . . . . . . . . . . . . . . . . . . . . . . . . . . . . . . . . 196Figure VI.20 Treatment by Courts . . . . . . . . . . . . . . . . . . . . . . . . . . . . . . . . . . . . . . 197Figure VI.21 Treatment by Public Prosecutor . . . . . . . . . . . . . . . . . . . . . . . . . . . . . 198Figure VI.22 Satisfaction with Treatment by Police and Victimization . . . . . . . . . . 199Figure VI.23 Satisfaction of Treatment by Police
and Urban/Rural Residence . . . . . . . . . . . . . . . . . . . . . . . . . . . 199Figure VI.24 Satisfaction of Treatment by Police and
Income . . . . . . . . . . . . . . . . . . . . . . . . . . . . . . . . . . . . . . . . . . . 200Figure VI.25 Satisfaction of Treatment by Police
and System Support . . . . . . . . . . . . . . . . . . . . . . . . . . . . . . . . . 201Figure VI.26 Which System Represents Better? . . . . . . . . . . . . . . . . . . . . . . . . . . . 203Figure VI.27 Preference for Single-Member Districts
by Department . . . . . . . . . . . . . . . . . . . . . . . . . . . . . . . . . . . . . 204Figure VI.28 Corruption in Bolivia in Comparative Perspective . . . . . . . . . . . . . . . . 205Figure VII.1 High Unemployment as a Justification for a Coup: Bolivia in Comparative
Perspective . . . . . . . . . . . . . . . . . . . . . . . . . . . . . . . . . . . . . . . . . . . . . . . . . . 210Figure VII.2 Many University Student Strikes as a Justification for a Coup: Bolivia in
Comparative Perspective . . . . . . . . . . . . . . . . . . . . . . . . . . . . . . . . . . . . . . . . . . . . . . . . . . 211
Figure VII.3 Many Strikes by Unionized Workers As a Justification for a Coup: Bolivia inComparative Perspective . . . . . . . . . . . . . . . . . . . . . . . . . . . . . . . . . . . . . . . . 212
Figure VII.4 Conditions that Might Justify a Coup . . . . . . . . . . . . . . . . . . . . . . . . . . 213Figure VII.5 Support for a Coup
and Gender . . . . . . . . . . . . . . . . . . . . . . . . . . . . . . . . . . . . . . . . 214Figure VII.6 Support for a Coup and Age . . . . . . . . . . . . . . . . . . . . . . . . . . . . . . . . 215Figure VII.7 Support for a Coup
by Department . . . . . . . . . . . . . . . . . . . . . . . . . . . . . . . . . . . . . 216Figure VII.8 Support for a Coup and Income . . . . . . . . . . . . . . . . . . . . . . . . . . . . . . 217Figure VII.9 Support for a Coup and Tolerance . . . . . . . . . . . . . . . . . . . . . . . . . . . . 218Figure VII.10 Ethnicity and Support for a Coup . . . . . . . . . . . . . . . . . . . . . . . . . . . . 219Figure VII.11 Support for a Coup and Ideology . . . . . . . . . . . . . . . . . . . . . . . . . . . . 220Figure VII.12 Support for a Coup and Victimization . . . . . . . . . . . . . . . . . . . . . . . . . 221Figure VII.13 Support for Civil Disobedience:
Bolivia in Comparative Perspective . . . . . . . . . . . . . . . . . . . . . 225Figure VII.14 Approval of Civil Disobedience
and Education . . . . . . . . . . . . . . . . . . . . . . . . . . . . . . . . . . . . . 226Figure VII.15 Approval of Civil Disobedience
and Income . . . . . . . . . . . . . . . . . . . . . . . . . . . . . . . . . . . . . . . 227Figure VII.16 Approval of Civil Disobedience
and Gender . . . . . . . . . . . . . . . . . . . . . . . . . . . . . . . . . . . . . . . 228

The Political Culture of Democracy in Bolivia: 1998 9 Introduction and Executive Summary
Figure VII.17 Approval of Civil Disobedience and Age . . . . . . . . . . . . . . . . . . . . . . . . . . . . . . . . . . . . . . . . . . 229
Figure VII.18 Approval of Blocking Streets by Department . . . . . . . . . . . . . . . . . . . . . . . . . . . . . . . . . . . . . 230
Figure VII.19 Approval of Violent Civil Protest by Department . . . . . . . . . . . . . . . . . . . . . . . . . . . . . . . . . . . . . 231
Figure VII.20 Approval of Civil Disobedience and Tolerance . . . . . . . . . . . . . . . . . . . . . . . . . . . . . . . . . . . . . 232
Figure VII.21 Approval of Civil Disobedience and Ideology . . . . . . . . . . . . . . . . . . . . . . . . . . . . . . . . . . . . . . 233
Figure VII.22 Approval of Civil Disobedience and Support for a Coup . . . . . . . . . . . . . . . . . . . . . . . . . . . . . . 221
Figure VII.23 Approval of Citizen Efforts to Overthrow an Elected Government and Support for a Coup . . . . . . . . . . . . . . . . . . . . . . . . . . . . . . . . . . . . . . . . . . . 223
The Political Culture of Democracy in Bolivia: 1998 10 Introduction and Executive Summary
1Seymour Martin Lipset, `Conditions for Democracy', Extensions Spring (1998),3-13.
Introduction and Executive Summary
Democracy requires a supportive culture, the acceptance by the citizenry andpolitical elites of the principles underlying freedom of speech, media, andassembly; rights of political parties, rule of law, human rights, and the like.Such norms do not evolve overnight.1
The great wave of democracy that has swept over the world in the last decade hasleft political scientists scrambling to explain the phenomenon. Scores of books and articleshave been published, but only the barest outlines have emerged to date. While it may takeseveral decades before we can really say with any degree of certainty why democracy“broke out” in the 1980s world-wide, a far more urgent task confronts us. We need toknow, as soon as we can, what makes democracies sustainable, and what makes themsufficiently resilient to withstand the inevitable stresses and strains that confront them?
Many political scientists believe that one key factor that enable democracies tosurvive is having a democratic political culture. This study explores the political culture ofdemocracy in Bolivia. It does so by allowing Bolivians, over 3,000 of them, to speak forthemselves in personal interviews that were conducted in the summer of 1998. In thisintroduction and executive summary, some of the main findings are reported upon, thedetails of which are contained in the chapters that follow.
• The sample was designed to represent the entire country, and as such interviewswere conducted in each of Bolivia’s nine departments, and in the three mainlanguages used in the country (Spanish, Quechua and Aymara). The sample isrepresentative of the urban/rural distribution of the population within eachdepartment, as well as the distribution of population by department at the level ofthe nation. An additional special sample was collected in six municipalities in whicha USAID development program (the DDPC program) has been operating. In total,2,977 respondents were interviewed for the national sample, and 599 wereinterviewed in the special municipal sample areas, with 100 of the latter overlappingwith the national sample.
• The sample drawn from this study closely resembles the overall population ofBolivia, not only in terms of its geographic dispersion, but in terms of basicdemographic characteristics. Precisely half of the sample was male, and halffemale, and their average age being 36. Three-fifths majority were married or wereliving in common-law unions.
The Political Culture of Democracy in Bolivia: 1998 11 Introduction and Executive Summary
• Nearly half of the respondents lived in homes in which the household income was500 Bolivianos or less per month. Incomes varied by gender, with males earningmore than females, and by place of residence, with urban dwellers earning morethan those in rural areas.
• Three-fifths of the respondents considered themselves to be ethnically “mestizo,”while ten per cent identified as Indian. The minority of “Whites” earned the greatestincome, while Indians and Blacks earned the least. Only about half the populationwas monolingual Spanish-speaking, whereas the others spoke some combinationof Spanish and Quechua and/or Aymara, and less than 10 percent weremonolingual speakers of indigenous languages.
• Support for the system, our measure of political legitimacy, is much lower than itis in Costa Rica, Latin America’s most stable democracy, but higher thanneighboring Peru. Support for the system did not vary by gender or age, but it wassignificantly lower among those with university education. At the same time, systemsupport was higher among those with higher incomes and among people who livein rural areas. Support was also higher among those with deeper religious ties andthose on the political right. In the broader measure of institutional support, politicalparties and the police score especially low, whereas reporters and the CatholicChurch score especially high.
• Systems may be political stable for long periods of time, undergirded by high levelsof system support. But such systems are not necessarily democratic. In order fora political system to be both stable and democratic, its citizens ought not onlybelieve in the legitimacy of the regime, but also be tolerant of the political rights ofothers, especially those with whom they disagree. When majorities of citizens areintolerant of the rights of others, the prospects for minority rights are dim, indeed.The study measured political tolerance in Bolivia and found some disappointingresults.
• Bolivians, on average, are notably less tolerant than other Latin Americans. In eachof the other countries in the study, when the overall scale of tolerance is computed,the level is at the mid-point of 50 or higher, whereas in Bolivia, the overall level isat 41.
• Bolivians are especially intolerant of the right of free speech and the right to run forpolitical office, two very basic civil liberties. These findings are confirmed with twodifferent measures of tolerance.
• In each of the other countries in the University of Pittsburgh Latin American PublicOpinion data base that are being analyzed in this study, higher levels of educationare associated with higher levels of tolerance. In Bolivia, however, not only istolerance lower than in other countries, it does not increase with higher education.
The Political Culture of Democracy in Bolivia: 1998 12 Introduction and Executive Summary
• The interrelationship between system support and tolerance shows that only aboutone-in-ten Bolivians are both supportive of their political system and expresspolitical tolerance. It is those Bolivians who we classify as supportive of stabledemocracy On the other hand, nearly one half of all Bolivians hold values that placedemocracy at risk.
• How do the Bolivian results compare with other countries in the University ofPittsburgh Latin American Public Opinion Project data base? Not well. Bolivia hasthe lowest proportion of its citizens who have the combination of attitudesconsidered to be supportive of stable democracy of the six countries in the dataseries, approximately matching the results for Peru, but less than one fourth thelevel of support for stable democracy found in Costa Rica.
• Dictatorships have long been infamous for suppressing and/or co-opting civil societyorganization. Citizens in such systems are deprived of their ability to providecollective expression of their demands. Democracy, on the other hand, cultivatescivil society organizations as a key element in the articulation of citizen demands.
• How active is civil society participation in Bolivia? The data in the present studyallow us to answer that question with some precision. Participation in church andschool-related groups are by far the most popular in Bolivia, as is participation incommunity/neighborhood development groups (Juntas de mejoras, juntasvecinales). These organizations are far more popular than professionalassociations, civic organizations (such as women’s groups, Lions Clubs, etc.),OTBs, and labor unions.
• In marked contrast to political tolerance, civil society participation in Bolivia doeswell in comparative terms. Civil society participation in Bolivia is higher that the othercountries in four of the seven indicators. Bolivians are more active participants inchurch groups, school groups, civic groups, and unions when compared to CostaRicans, Salvadorans, Nicaraguans, and Paraguayans. In addition, Bolivia is farahead of three of the other countries in community development organizationparticipation, only lagging behind Costa Rica. Similarly, it is second to Costa Ricain professional association participation, and second to Paraguay in cooperativeorganization participation.
• Many studies have found that females participate less than males in civil societyorganizations. Bolivia is no exception to this norm. In every form of organizationexcept civic groups, there is a significant difference. But that difference does notalways advantage males over females. Bolivian women are more active in churchand school related activities than Bolivian men.
• In Bolivia, most forms of civil society participation decline in the cities and increasein the countryside.

The Political Culture of Democracy in Bolivia: 1998 13 Introduction and Executive Summary
• In most forms of civil society participation, the population that self-identified as“White” is significantly lower than the other populations, especially those who self-identify as “Indian.” The only form of civil society participation in which the Whitepopulation is higher than the others is in church groups, but the differences arerather small, albeit statistically significant. The indigenous population is especiallyactive in the OTB’s as well as the Juntas Vecinales. The Bolivian data set alsoshows a strong association between family size and civil society participation.
• Demand-making is a vital part of civil society behavior. It is not surprising thatcontacting the president of the country to make a demand is the least frequentapproach taken by Bolivians to help solve their local problems; only 3% have gonethis route. More surprising, however, especially now that half of Bolivian legislatorsare elected from single-member districts, is that deputies were contacted by only5% of the respondents. More than twice that percentage were in contact with otherofficials, with the highest level being contacts with national officials. Demand-making in Bolivia compares favorably with the other nations. In particular, Bolivianparticipation is second only to Costa Rica in contacting a deputy, or amayor/councilman. Bolivia is actually slightly ahead of Costa Rica in contactingnational-level government officials. Contacting the President in Bolivia is similar toall of the other countries, except Costa Rica, which is far higher than the others.
• Men are far more likely to make demands then women in Bolivia. The smaller thecommunity the higher the level of demand-making, especially for all forms ofdemand-making beyond that of contacting the president of the country or a deputy.
• Those who self-identify as “White” systematically make fewer demands than thosewith other ethnic identities. It can also be seen that those who identify as Indian,are more likely to make demands than those with other identities.
• Does participation in groups lead to action? It could be that participation incommittees could be purely social events, and that citizens meet to have a goodtime, not to stimulate change in their communities. Is talk associated with action?Most definitely. Over one-third of Bolivians have worked to resolve a communityproblem. The more that Bolivians involve themselves in church groups, the morethey are willing to donate time, money, labor, attend meetings and try to formgroups to help solve community problems. Church group participation, then, ismore than a social event since it links directly to helping to build communities.
• An even sharper impact on voluntarism is found among those who attend school-related groups. Only 10-20% of those who never attend school-related groupmeetings actively attempt to solve community problems, whereas those whofrequently attend school meetings are two times more likely to be involved involuntarism.
The Political Culture of Democracy in Bolivia: 1998 14 Introduction and Executive Summary
• A stronger impact still emerges from participation in community developmentassociations. Only about 15% of those who never participate in communitydevelopment associations have donated their labor to solve a community problem,compared to over 40% voluntarism among those who frequently attend suchmeetings.
• The survey found that Bolivians are relatively active in civil society participation,and that such participation is connected to voluntarism in solving communityproblems. Are there also links to the key attitudinal variables, namely tolerance andsystem support? An examination of the civil society participation variables finds thatevery one of the nine different measures included in the study except unionmembership and professional associations are significantly positively associatedwith system support. Tolerance, on the other hand, hardly ever is significantlyassociated with civil society participation, and when it is, the direction is negative;more civil society participation, less tolerance.
• Latin American, perhaps more than any other area of the world, has had a verystrong tradition of centralization of state power. Local governments in unitarysystems and state governments in Latin America’s federal systems (i.e., Mexico,Brazil and Argentina) have all been subordinated to central government to anextreme degree. Up until its recent reforms, Bolivia’s centralist tradition wasperhaps even more extreme than in other Latin American countries. Bolivia is on thelow-side when compared with other countries in the region. Nonetheless, the studyfinds that only Nicaragua has a lower level of municipal government participation.These findings suggest that even four years after the approval of the popularparticipation law, Bolivians are not especially active in local government.
• Males participate in municipal meetings at a level over 75% higher than females.
• Participation in municipal meetings in smaller areas are at rates two and one-halftimes greater than that of Bolivians who live in cities larger than 20,000 populationin size. Bolivians in the most rural sectors of the country participate at still higherlevels, fully three times the rate in the large towns and cities. Participation inmunicipal meetings varies a great deal by department as well. Chuquisaca has thehighest level of participation, while Tarija has the lowest.
• Civil society participation is especially low among Bolivians who defined themselvesas “White.” Municipal attendance follows the same pattern.
• Does it make a difference to Bolivian democracy if its citizens attend municipalmeetings? Specifically, do system support and tolerance increase as attendanceat municipal meetings increases? And does civil society participation relate tomunicipal meeting attendance? The study found very strong evidence that systemsupport increases as municipal meeting attendance increases. Also, for those whoare “high” on their level of civil society participation, based upon the nine-
The Political Culture of Democracy in Bolivia: 1998 15 Introduction and Executive Summary
organization series, participation in municipal meetings is 2.3 times higher than thenational average. Tolerance is another matter. There is no significant associationbetween political tolerance and attending municipal meetings. Once again,tolerance is found to be problematical in Bolivia. It is not increased by education,nor is it increased by civil society participation, and now it is found that it does notincrease with attendance at municipal meetings.
• Combining civil society participation and high system support have payoffs beyondthe role of either variable acting alone. Acting together, they combine to relate toespecially high levels of municipal meeting attendance. Those with high systemsupport, are more active in municipal participation for each level of civil societyparticipation, and that among those who are the most active in civil society and whoare high on system support, municipal meeting attendance is about three times thenational average, reaching about 55%.
• Ethnicity and civil society participation interact to produce very high levels ofmunicipal participation among Indians, about three times higher than the nationalaverage. Self-identified Indians participate in municipal meetings to a greaterdegree at all levels of civil society participation than other groups, further indicatingthe importance of ethnicity.
• Among those with low system support, fewer than 30% were satisfied with theresponse of the municipality, whereas among those with high system support about55% were satisfied. These findings suggest that satisfaction of citizen demands atthe local level is vital to building support for the political system at the national level.Satisfaction of citizen demands depends, in part, on the availability of resources(especially budgets), but it also depends upon the good will of municipal officials.Absent budgets or absent good will, and citizen demands will be invariablyfrustrated. Bolivians, however, express somewhat less satisfaction than in the othercountries.
• Not only is system support associated with greater satisfaction with municipalservices, but so is political tolerance. Both system support and tolerance aresignificantly related to satisfaction, but the greater impact is noted for systemsupport.
• Twenty three per cent of the respondents have been a victim of crime within thepast year, and 21% report that a family member has been victim. These arerelatively low figures compared to many other countries in Latin America.
• Does being a victim of crime in Bolivia have an impact on one’s perception of thepolitical system? Specifically, do those who personally, or in their families,experience crime express lower support for the political system? The answer is yes.Victims express significantly less support than non-victims. And we can be certainthat it is the crime that caused the lower system support rather than the other way

The Political Culture of Democracy in Bolivia: 1998 16 Introduction and Executive Summary
around, since criminals could not possibly seek out victims on the basis of theirsystem support. These findings strongly suggest that when the political system isunable to control crime, it jeopardizes its own legitimacy.
• Among those who express the view that people in their community are verytrustworthy, fewer than one quarter have been victims of a crime (personally or inthe family), whereas among those who say people are not at all trustworthy, about40% have been victims of a crime
• Once citizens have become victims of a crime, what do they do about it? We askedthose who were victims if they reported the crime, and to which authority did theyreport it. Only a minority of victims reported the crime, and of those, most reportedit to the police.
• The major impact of perceived ease of reporting a crime is income. Reporting acrime to the police or to the community authorities is dramatically easier for thosewith higher incomes. Not surprisingly, Bolivians who believe it is difficult to report acrime are lower in system support than those who find it easier to report a crime.Victims of crimes (in the last 12 months) are significantly more negative on theirlevel of satisfaction with the police than those who have not been a victim.
• Of those who have had dealings, opinions seem about evenly split between thosewith a positive experience versus those with a negative experience. Thus, theopinions regarding the courts are more positive than are the opinions regarding thepolice.
• Bolivia has recently instituted single-member district representation. Over two-fifthsof the respondents had no opinion on this new system’s efficacy. Among those whodid, however, they were overwhelmingly in favor of the single-member system. Lessthan 8% of Bolivians favored the party list formula.
• Bolivia has enjoyed constitutionally democratic rule for over a decade. HaveBolivians turned their backs on the coup d’etat as mechanism for resolving politicalconflict? Over one-third of Nicaraguans would support a coup under conditions ofhigh unemployment, whereas 29% of Bolivians and a slightly lower percentage ofParaguayans and Salvadorans responded in this way. Similar percentages wouldsupport a coup under conditions of labor and student unrest.
• Support for coups is not in any way a function of education, ethnicity or urban/ruralresidence. Gender does have a weak relationship, however, but one that washesout in the multivariate analysis.
• Older Bolivians, those who have lived through numerous authoritarian militaryregimes, are less supportive of a coup than are the young. Young Bolivians are

The Political Culture of Democracy in Bolivia: 1998 17 Introduction and Executive Summary
about twice as likely to support a coup than those Bolivians who are over 65 yearsof age. The youth of Bolivia do not emerge as the defenders of democracy.
• Income is also related to support for coups, with wealthier Bolivians expressingmore support than poorer. Only less than one-quarter of the poorest Bolivianswould support a coup, whereas over one-third of those with the highest incomeswould do so.
• Bolivians who are more politically tolerant are far less likely to support a coup, anindication of the importance for tolerance in helping to create an atmosphere thatwould resist this severely anti-democratic behavior.
• It has been noted that victimization has a negative effect on system support. It alsoincreases the likelihood that respondents will opt for a coup. Bolivians who havebeen victims of a crime (or who have had family members who have been victims)are more likely to support a coup. Once again, criminals do not select victims onthe basis of their attitudes, so it is clear that being a victim is what accounts for thisincrease in support for anti-democratic attitudes.
• There is greater support in Bolivia for each of the forms of civil disobediencemeasured in the questionnaire than for any other country for which we have data,and the differences are statistically significant.
• Ethnicity and urban/rural residence show no significant relationship to approval ofcivil disobedience in Bolivia, but the less-well educated are more likely to approvecivil disobedience, in both its violent and non-violent forms. Income follows thesame pattern as education. For both non-violent and violent civil disobedience,Bolivians with lower levels of education are more approving.
• One associates coups with military overthrow of civilian governments, whichnormally end up repressing civil liberties of citizens. Civil disobedience, in contrast,we think of as involving citizen protest against repressive acts of government. Thus,we would expect that those who support coups should not be approving of civildisobedience. In Bolivia, this is not the case. There is a positive associationbetween the overall index of support for a coup and approval of civil disobedience.These findings are certainly troubling because they suggest an indiscriminatesupport for violent means to resolve political disagreements.
These results are presented in far greater detail in the pages that follow. In manyways, however, they merely scratch the surface of the rich data base that has beencollected for this study. Not only do these data serve as a solid base-line for comparisonswith future surveys, they also allow investigation of themes not explored here. The database stands ready to answer many other questions relevant to democracy in Bolivia.
The Political Culture of Democracy in Bolivia: 1998 18 Chapter I: Methodology and Sample Characteristics
2This point is argued forcefully by Sidney Verba, recent past President of theAmerican Political Science Association, in Verba, Sidney, "The Citizen as Respondent:Sample Surveys and American Democracy." American Political Science Review 90, no.1 (March 1996): 1-7.
3Data are from the World Bank (1997) World Development Report, 1997. OxfordUniversity Press, Washington, D. C., pp. 214-215.
Chapter I: Methodology and Sample Characteristics
Sample Design
A study of democratic values needs to be designed so that it will gather data on thevalues of all citizens, not just the active ones, the politically “important” ones, or those wholive in major towns and cities. Indeed, the major advantage of surveys over elections isthat in elections many people do not vote, and often it is the poor or the rural voter who isunder represented in the election.2 Surprisingly, many studies that claim to represent theviews of citizens, are often based on samples that systematically under represent certainsectors of the population. Often the biases that crop up in samples emerge because ofcost considerations, which in turn are a function of the dispersion of populations over wideareas, or because the multi-lingual nature of the national population makes it difficult andexpensive to conduct the interviews in all of the languages widely spoken in a givencountry.
Any serious study of democratic values in Bolivia confronts two problems in sampledesign: 1) the wide dispersal of the population; and 2) a multi-lingual population.Comparisons with other countries help put these problems in perspective. ConsiderGermany, the country with the largest population in Western Europe, is home to 82 millionpeople, who occupy 357,000 square kilometers of territory. Bolivia, in contrast, with apopulation of only 7.4 million, occupies a massive 1.1 million square kilometers.3 Boliviais the 29th largest country on the planet, but with a population about the same size of thatof the Dominican Republic, a country that is only 4% of Bolivia’s size. Indeed, all of Japan,with its 125 million people, would nearly fit into Santa Cruz Department alone. In short,Bolivia has a relatively small population living on a large land mass. From the point of viewof sample design, this creates complexities, which are only compounded by the fact thatBolivia’s population is very unevenly distributed. For example, La Paz has a populationdensity of about nearly 17 persons per square kilometer, whereas the Department ofPando, with a surface area substantially larger than Costa Rica but an estimated
The Political Culture of Democracy in Bolivia: 1998 19 Chapter I: Methodology and Sample Characteristics
4There were also small numbers of speakers of other indigenous Languages suchas Guarani, as well as speakers of Portuguese, English and other languages. The costsinvolved in preparing questionnaires in each of these languages, and having a multi-lingualstaff of interviewers available on the spot as such speakers were encountered, made theexclusion of such monolingual speakers necessary. According to the 1992 census, 0.1%of the population is monlingual Guarani-speaking.
population in December, 1997 of 53,000, has a density of fewer than .5 residents persquare kilometer.
In a multi-lingual country it is important to avoid excluding linguistic minorities. InBolivia, many languages are spoken, but Spanish is the overwhelmingly predominantlanguage. According to the Bolivian 1992 census bureau, 8.1% of the population over theage of 6 were monolingual Quechua speakers, and 3.2% of the population weremonolingual Aymara speakers.4 These numbers of monolingual speakers of indigenouslanguages however, have been declining rapidly as a result of the widespreaddissemination of the mass media. For example, the Bolivian census bureau estimates for1997 show that only 4.4% of the population are monolingual Quechua and 2.0% aremonolingual Aymara. Nonetheless, in order not to exclude the opinions of theseindividuals, it was necessary to prepare versions of the questionnaire in both Quechua andAymara, and to include bi-lingual interviewers in the survey team.
In the design of the sample, the factors of population size and its distribution neededto be considered. In addition, Bolivia’s Departments, which range so greatly in populationand geographic area, each have their own social and political profiles, and a study thatattempts to represent the country ought to be certain to include each of its departments.In order to achieve this objective, it was decided that the sample would be designed torepresent each of Bolivia’s nine departments, while still being able to speak withconfidence about the country as a whole.
It is perhaps easiest to understand the sample design methodology employed in thisstudy by making an analogy to drawing winning raffle tickets. Let us assume that there arenine high schools in a school district and the district has decided to have a raffle to raisemoney. Those who are running the raffle want to be sure that there is at least one winnerin each of the nine schools. If the tickets are each drawn at random, it may well turn outthat one or more schools would be left without a winner. In order to achieve this objective,rather than placing all of the raffle tickets in one bowl, and have nine tickets drawn out atrandom, the tickets from each school are placed in a separate bowl, and one ticket isdrawn from each.
In Bolivia, if we want to be sure that citizens from each of the nine departments areinterviewed, we must divide the sample into nine “bowls.” We call these bowls “strata.”Thus, in the Bolivia census, we have nine separate strata, one for each department. If wedo not divide the country into separate strata, then it is quite likely that most of those to be

The Political Culture of Democracy in Bolivia: 1998 20 Chapter I: Methodology and Sample Characteristics
5The worst case emerges when opinion is divided right down the middle, and on agiven question, 50% express one view and 50% express another.
interviewed would come from Bolivia’s most populous departments (La Paz, Santa Cruzand Cochabamba), and that few, if any interviews would take place in the department ofPando, the least populous department. By stratifying the sample, we guarantee adistribution of interviews across all nine departments.
Returning to the analogy of the raffle, what if we also want to guarantee that therewould be one prize per grade within each high school? We would follow the sameprocedure, and utilize one bowl for each grade within each school, and draw one ticketfrom each bowl. Of course, we would have to increase the number of total tickets drawnin order to achieve that objective. For example, if each high school had 3 grades (10th ,11th, and 12th ), then a total of 27 tickets would need to be drawn, (3 grades x 9 schools).
In Bolivia it is important to further subdivide the departments into cities, towns andvillages of various population sizes. Here again, if we placed the names of all of theresidents from each department into separate bowls, it would be likely that in a number ofdepartments we would draw most of the names from the largest cities, since those citescontain the bulk of the population. To avoid drawing the sample largely from urban areasto the exclusion of rural, we need to stratify each department by population size. It iscommon practice in Bolivia to divide the population into four clusters: 1) cities larger than20,000; 2) cities and towns of between 2,000 and 20,000; 3) “compact rural” zones, ofpopulations from 500 to 1,999; and, finally, 4) “dispersed rural” zones of fewer than 500people. Our sample for each department has been stratified in this fashion.
Since the sample has been stratified at two levels, that of the department and withineach department, we have what is called a “multi-stage stratified sample design.” But nowthe question comes as to how large a sample and how the sample should be distributedamong the strata. It is common practice to distribute the sample in direct proportion to thesize of the population in each stratum. But such a procedure does not work well when thestrata are of very different population sizes, as is the case in Bolivia. That is because thesmallest departments would have such a small sample that it would be impossible to talkabout them with any degree of confidence unless the overall national sample were very,very large. For example, Pando comprises only .6 of one percent of Bolivia’s population,and if we had a national sample of 3,000 respondents, only about 18 would likely to bedrawn from Pando.
In order to overcome this problem, it was decided to draw a sample of 300respondents per department, which would mean that 95% of the time, our sample wouldbe no more than ± 5.8% away from the true departmental view for a given question in thesurvey. This level of ± 5.8% is calculated using the standard formulas for sampling error.Thus, in the worst case scenario5 at the level of the department the survey would be a

The Political Culture of Democracy in Bolivia: 1998 21 Chapter I: Methodology and Sample Characteristics
6For example, if the results produced a 90/10 split on an item.
reasonably accurate representation of citizen views, erring by no more than 5.8% more orless (95% of the time) than the results if we could interview all adults residing there. Undermore favorable conditions6 the results could be as accurate as ± 3.5% at the level of thedepartment. Since the three departments of Bolivia that form the so-called “central axis”are so important politically (i.e., La Paz, Santa Cruz and Cochabamba), it was decided toincrease the accuracy of the sample in those departments by interviewing an additional100 respondents in each of them, for a total of 400 in each. In those three departments,our “confidence interval” for the sample is no more than ±5.0%, or nearly 1% moreaccurate than for the other departments.
The samples of 300 and 400 per department were designed to provideapproximately equal confidence intervals for each one. But once we attempt to generalizebeyond the level of the department to the nation as a whole, it is vital to adjust the samplesize so that it accurately reflects the relative population size of each department. Forexample, referring again to Pando, and comparing it to La Paz, it is necessary to decreasethe relative weight of Pando in the national sample and increase the relative weight of LaPaz in order that we can obtain an overall picture of opinion in Bolivia. To do this thesample, once drawn, was assigned post-hoc weights so that each department correctlyreflected its contribution to the national population total.
The sample design for the nine departments as a whole, with 300 interviews in sixdepartments, and 400 interviews in three departments, called for a total sample of 3,000.A sample of this size is accurate at no worse than ± 1.7%. Technically, our sampling erroris ± 1.7%. This means that if we drew repeated samples of this size in Bolivia, 95% ofthem would reflect the views of the population with no greater inaccuracy than ± 1.7%. Ofcourse, other factors other than sampling error can reduce the accuracy of the results,including non-response, errors in selecting the respondent, misunderstanding of thequestion, etc. But in terms of the science of survey sampling, a confidence interval of±1.7% is very good.
The above estimates of the accuracy of the sample could stand as stated if it werepossible to carry out what is known as a “simple random sample” of each stratum in thestudy. To do this, it would mean that the sample would be scattered randomly all overeach of the nine departments. But, to do so would mean interview costs that would beastronomically high because of very high travel expenses. In virtually all survey researchtravel costs are reduced by drawing what are known as “clustered samples,” that is, wecluster groups of interviews together in a relatively compact area such as a block, or rowof houses, and interview several people together. Clustering dramatically cuts cost,especially in a country like Bolivia where the density of population nation-wide is so low.Yet, clustering normally increased the confidence interval of the sample and thus lowersits precision. It is not possible to know with precision how much clustering increases theconfidence interval because it all depends on the degree of commonality on a given
The Political Culture of Democracy in Bolivia: 1998 22 Chapter I: Methodology and Sample Characteristics
characteristic that the residents in a single block or street have in common. For example,if all of the residents within a given city block earn a very similar salary, then the impact ofclustering on salary would be larger than for age, which presumably would vary more andcome close to approximating the variation in age within the country as a whole. Experiencesuggests that the confidence for a clustered stratified sample design of 3,000 Bolivianswould increase to around ± 2.0% from the level of ± 1.7% stated above. For the purposesof this study, a level of ± 2.0% will be assumed. It should also be noted that probabilitycriteria were used at each stage of selection until the household itself was reached. Theindividual respondent within the household was selected using quota criteria for bothgender and age in order to overcome the commonly confronted problem of having thesample incorporate too many females and too many very young or very old people. Thathousehold bias results from a higher probability of females, the very young and the veryold to be at home more often than other respondents. Quotas at the level of the householdis an economically efficient way to overcome this problem.
The survey itself was efficiently and professionally carried out by Encuestas &Estudios, the premier survey research firm in Bolivia. Founded in 1984, this firm isaffiliated with Gallup International. Over the past 14 years, Encuestas & Estudios hasconducted over 900 surveys for more than 250 clients. It currently employs 116 people fulltime, and utilizes 83 part-time interviewers, of whom 40 are bilingual (Quechua or Aymara).This firm implemented the above described sample design, and was also responsible forcarrying out multiple pre-tests of the survey instrument as well as the translation of theinstrument into Quechua and Aymara. In addition, the firm was responsible for all dataentry.
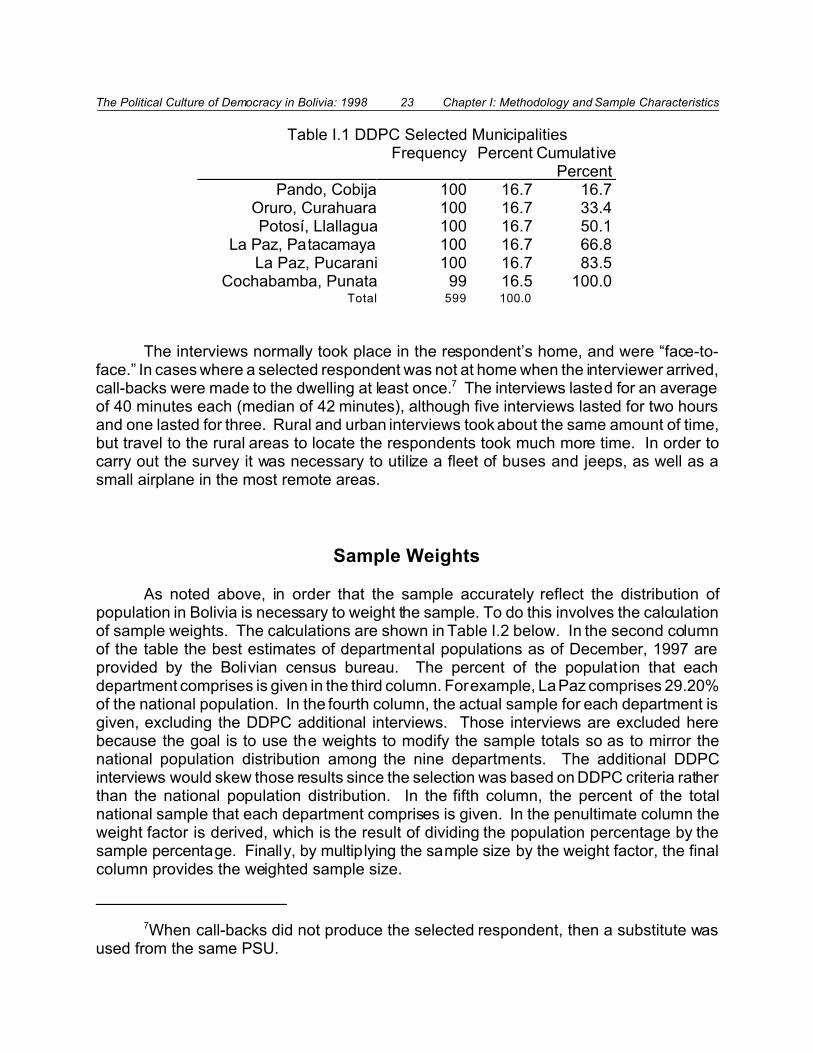
The actual number of interviews gathered by the Encuestas & Estudios firm in thenational sample was 2,977, or 23 short of the goal of 3,000. This is a remarkably highlevel of completion of the survey, and speaks well of the dedication of the interviewers andtheir supervisors. Those interviews were not, however, the only ones collected for thisstudy. USAID has been assisting the Bolivian government to improve municipalgovernance and citizen participation at the local level, in a project called “DesarrolloDemocrático y Participación Ciudadana” (hereafter DDPC), and a secondary goal of thepresent study was to create a baseline of data in selected municipalities in which thatproject has been operating. A total of 6 municipalities were selected for this baseline (seeTable I.1), and 100 interviews were to be collected in each, divided evenly between urbanand rural areas. Thus, the initial sample was expanded with these 600 interviews.Interview costs in remote Pando Department were so high that it proved necessary toincorporate 100 of the municipal sample interviews into the national sample. Thus, themunicipal study added only 500 rather than 600 interviews to the study. Of those 500additional interviews, 499 were completed, yielding a total number of completedquestionnaires of 3,476.
The Political Culture of Democracy in Bolivia: 1998 23 Chapter I: Methodology and Sample Characteristics
7When call-backs did not produce the selected respondent, then a substitute wasused from the same PSU.
Table I.1 DDPC Selected Municipalities Frequency Percent Cumulative
Percent Pando, Cobija 100 16.7 16.7
Oruro, Curahuara 100 16.7 33.4 Potosí, Llallagua 100 16.7 50.1
La Paz, Patacamaya 100 16.7 66.8 La Paz, Pucarani 100 16.7 83.5
Cochabamba, Punata 99 16.5 100.0 Total 599 100.0
The interviews normally took place in the respondent’s home, and were “face-to-face.” In cases where a selected respondent was not at home when the interviewer arrived,call-backs were made to the dwelling at least once.7 The interviews lasted for an averageof 40 minutes each (median of 42 minutes), although five interviews lasted for two hoursand one lasted for three. Rural and urban interviews took about the same amount of time,but travel to the rural areas to locate the respondents took much more time. In order tocarry out the survey it was necessary to utilize a fleet of buses and jeeps, as well as asmall airplane in the most remote areas.
Sample Weights
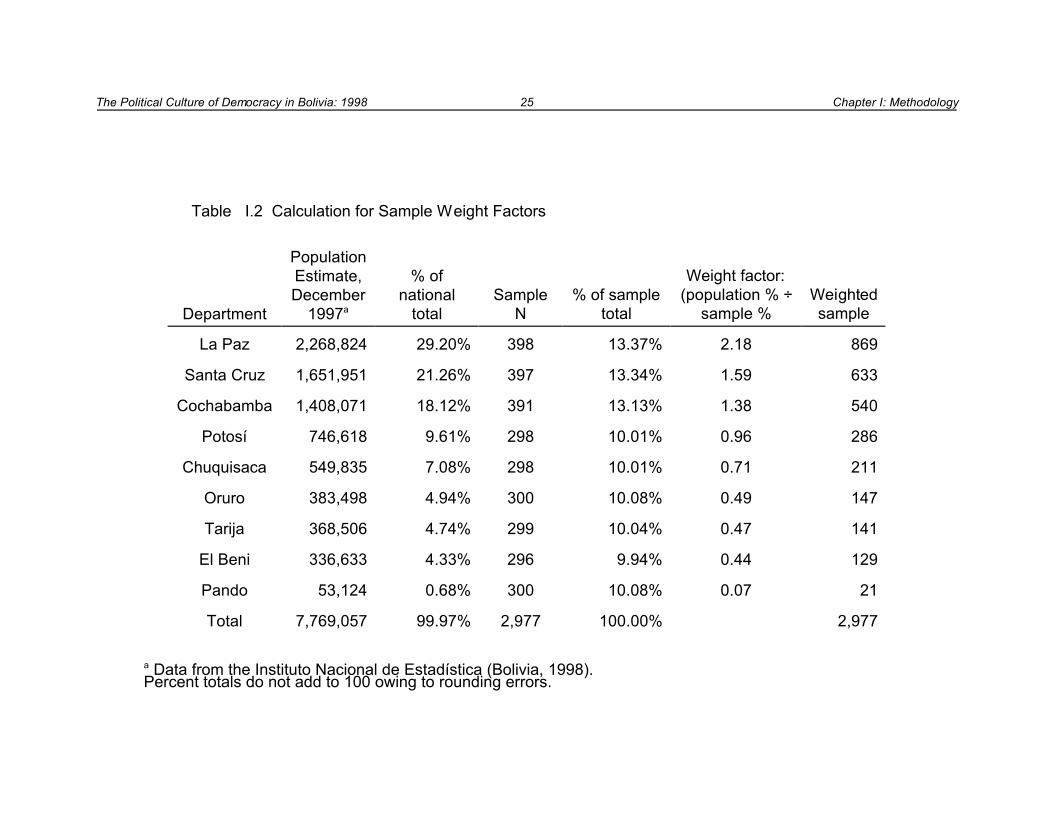
As noted above, in order that the sample accurately reflect the distribution ofpopulation in Bolivia is necessary to weight the sample. To do this involves the calculationof sample weights. The calculations are shown in Table I.2 below. In the second columnof the table the best estimates of departmental populations as of December, 1997 areprovided by the Bolivian census bureau. The percent of the population that eachdepartment comprises is given in the third column. For example, La Paz comprises 29.20%of the national population. In the fourth column, the actual sample for each department isgiven, excluding the DDPC additional interviews. Those interviews are excluded herebecause the goal is to use the weights to modify the sample totals so as to mirror thenational population distribution among the nine departments. The additional DDPCinterviews would skew those results since the selection was based on DDPC criteria ratherthan the national population distribution. In the fifth column, the percent of the totalnational sample that each department comprises is given. In the penultimate column theweight factor is derived, which is the result of dividing the population percentage by thesample percentage. Finally, by multiplying the sample size by the weight factor, the finalcolumn provides the weighted sample size.
The Political Culture of Democracy in Bolivia: 1998 24 Chapter I: Methodology and Sample Characteristics
The weighted sample shows the striking impact of the variation in population sizeamong Bolivia’s nine departments. In Pando, with less than 7% of the population, but witha sample of 300 respondents, or 10% of the sample, it is necessary to weight down thesample so that these interviews now comprise only 20 out of the 2,977. If this correctionwere not introduced, Pando would end up being as influential in the national totals asPotosí. On the other hand, when we wish to examine Pando alone, we have 300interviews to examine, thus allowing us to speak of those results with a reasonable levelof confidence. If we had interviewed only 21 respondents from Pando, virtually nothingcould have been said about the area. It should also be kept in mind that within eachdepartment, the sample was drawn proportional to the population distribution, so that largeand small population concentrations are each correctly represented.
The Political Culture of Democracy in Bolivia: 1998 25 Chapter I: Methodology
Table I.2 Calculation for Sample Weight Factors
Department
PopulationEstimate,December
1997a
% ofnational
totalSample
N% of sample
total
Weight factor:(population % ÷
sample %Weightedsample
La Paz 2,268,824 29.20% 398 13.37% 2.18 869
Santa Cruz 1,651,951 21.26% 397 13.34% 1.59 633
Cochabamba 1,408,071 18.12% 391 13.13% 1.38 540
Potosí 746,618 9.61% 298 10.01% 0.96 286
Chuquisaca 549,835 7.08% 298 10.01% 0.71 211
Oruro 383,498 4.94% 300 10.08% 0.49 147
Tarija 368,506 4.74% 299 10.04% 0.47 141
El Beni 336,633 4.33% 296 9.94% 0.44 129
Pando 53,124 0.68% 300 10.08% 0.07 21
Total 7,769,057 99.97% 2,977 100.00% 2,977
a Data from the Instituto Nacional de Estadística (Bolivia, 1998).Percent totals do not add to 100 owing to rounding errors.
The Political Culture of Democracy in Bolivia: 1998 26 Chapter I: Methodology and Sample Characteristics
Sample Distribution
It is perhaps easiest to comprehend the manner in which the sample was distributedin Bolivia by first pointing to some overall features and then looking at the distribution ona map of the country. Overall, the 3,476 interviews were conducted in 9 departments, inwhich a total of 67 provinces were targeted. In all of Bolivia there are 108 provinces, whichmeans that the sample included interviews in 62% of the nation’s provinces. Within those67 provinces, interviews were conducted in a total of 99 municipalities. In Bolivia there area total of 311 municipalities, and thus the sample included 32% of the total. In sum, thesample includes all of Bolivia’s departments, 62% of its provinces and 32% of itsmunicipalities. This is an unusually broad coverage for a sample survey and helpsreassure us that the results accurately reflect the national picture. The interviewsthemselves were distributed into 145 distinct areas, what we call “primary sampling units.”In each primary sampling unit, approximately 20 interviews were carried out. This meansthat survey teams visited 145 neighborhoods spread out among the 67 provinces. Theydid so during the month of August in 1998.
The graphical display of the interviews is shown in Figure I.1 It would be impossibleto display all 3,476 interview points, so one dot is used to display ten interviews. Thegreater density of points in departments such as Oruro and Cochabamba reflects thesmaller geographic area of these departments compared to Santa Cruz and the Beni. Inorder to maximize the confidentiality of respondents, the location of points shown herewithin each department are merely illustrative, and do not reflect the actual locations of theinterviews.

The Political Culture of Democracy in Bolivia: 1998 27 Chapter I: Methodology and Sample Characteristics
Figure I Map of Bolivia: Distribution of Sample by Department
One dot = 10 interviews(location within departments for illustrative purposes)
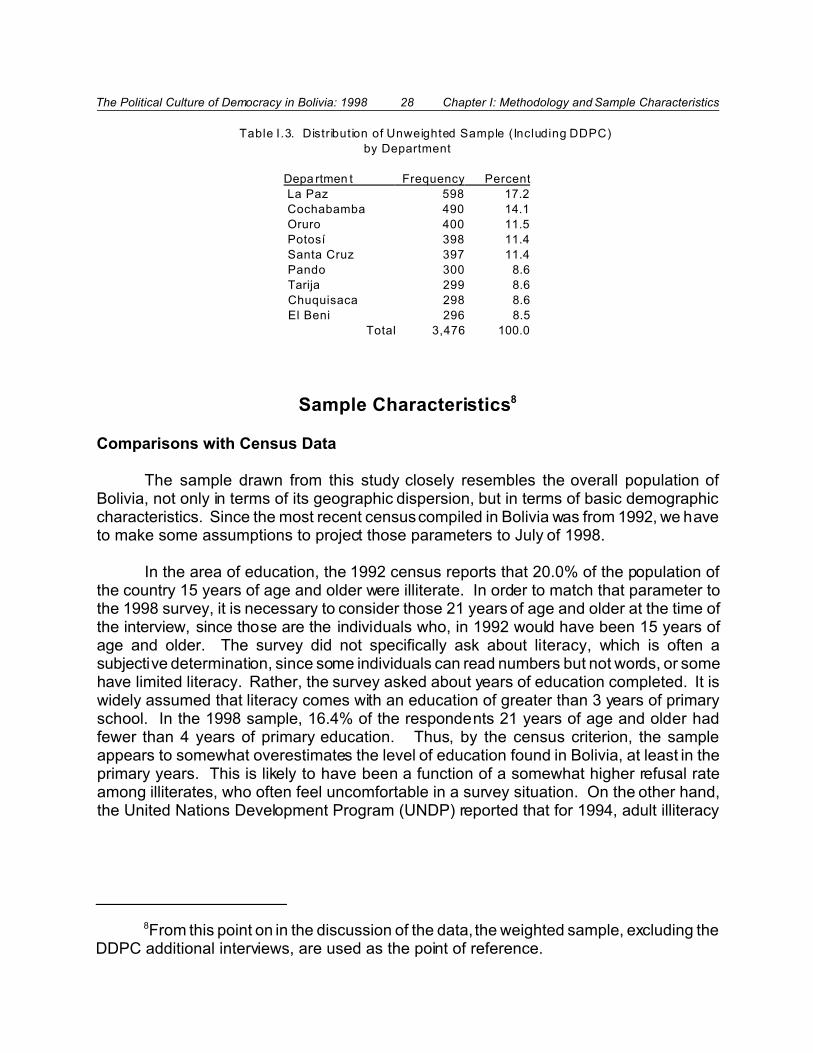
The actual number of interviews per department is shown in Table I.3. This table,like the map above, includes all of the interviews, unweighted.
The Political Culture of Democracy in Bolivia: 1998 28 Chapter I: Methodology and Sample Characteristics
8From this point on in the discussion of the data, the weighted sample, excluding theDDPC additional interviews, are used as the point of reference.
Table I.3. Distribution of Unweighted Sample (Including DDPC)
by Department
Depa rtmen t Frequency Percent
La Paz 598 17.2
Cochabamba 490 14.1
Oruro 400 11.5
Potosí 398 11.4
Santa Cruz 397 11.4
Pando 300 8.6
Tarija 299 8.6
Chuquisaca 298 8.6
El Beni 296 8.5
Total 3,476 100.0
Sample Characteristics8
Comparisons with Census Data
The sample drawn from this study closely resembles the overall population ofBolivia, not only in terms of its geographic dispersion, but in terms of basic demographiccharacteristics. Since the most recent census compiled in Bolivia was from 1992, we haveto make some assumptions to project those parameters to July of 1998.
In the area of education, the 1992 census reports that 20.0% of the population ofthe country 15 years of age and older were illiterate. In order to match that parameter tothe 1998 survey, it is necessary to consider those 21 years of age and older at the time ofthe interview, since those are the individuals who, in 1992 would have been 15 years ofage and older. The survey did not specifically ask about literacy, which is often asubjective determination, since some individuals can read numbers but not words, or somehave limited literacy. Rather, the survey asked about years of education completed. It iswidely assumed that literacy comes with an education of greater than 3 years of primaryschool. In the 1998 sample, 16.4% of the respondents 21 years of age and older hadfewer than 4 years of primary education. Thus, by the census criterion, the sampleappears to somewhat overestimates the level of education found in Bolivia, at least in theprimary years. This is likely to have been a function of a somewhat higher refusal rateamong illiterates, who often feel uncomfortable in a survey situation. On the other hand,the United Nations Development Program (UNDP) reported that for 1994, adult illiteracy

The Political Culture of Democracy in Bolivia: 1998 29 Chapter I: Methodology and Sample Characteristics
9United Nations Development Program. Human Development Report. New York:Oxford University Press, 1997, p. 166.
10World Bank. World Development Report, 1997. Washington, D. C.: OxfordUniversity Press, 1997, p. 214.
11UNDP, ibid., p. 167.
12Anuario Estadístico, 1995, p. 45.
in Bolivia was 17%, or only .6% higher than the survey results.9 The World Bank reportsthe same figure of 17% for 1995.10 Since illiteracy has been dropping steadily in Bolivia,the lower level of illiteracy in the sample may well be a function of the rising national levelof literacy. For example, the UNDP reports that in 1970, Bolivia’s illiteracy rate was 43%,11
and it thus likely that by July of 1998 the rate would have fallen from the 1994/5 figure of17% to the survey figure of 16.4%. Moreover, one must again recall the confidenceinterval issue. The results in the survey are taken to be within ±2% of the national values,and thus the sample estimate comes well within the UNDP and World Bank estimates, andwithin 1.6% of the census data.
Age is another parameter on which comparisons can be made with census data.In Bolivia the census data are presented in 5-year age cohorts, which means that thecohort of those who are 18 years of age is imbedded within the census group of 15-19.In order to match the census with the sample, we can exclude those younger than 20 andcompare the cohorts. The census reports 19.2% as falling between 20 and 24 years ofage in its 1995 estimates.12 The survey finds 17.2%, a result that falls within the ±2%confidence interval of the sample. Within this same age cohort, the census reports that49.7% are male, compared to the survey which found 47.7%, again a finding within theconfidence interval.
In sum, the sample seems to well represent Bolivia geographically anddemographically. There is every reason to believe that the findings that are drawn fromthe analysis of the survey would closely match those that would be obtained if we were tointerview the entire adult population of Bolivia. Doing so, of course, would be impossiblegiven the costs involved. For a tiny fraction of those costs, we have been able to obtainextensive information on the democratic values and behaviors of Bolivians.
Key Demographic Characteristics
In the chapters that follow a number of key demographic and socio-economiccharacteristics of the respondents will be employed in the analysis. We will often wish toknow how certain attitudes or behaviors vary by gender, age, and socio-economic status.
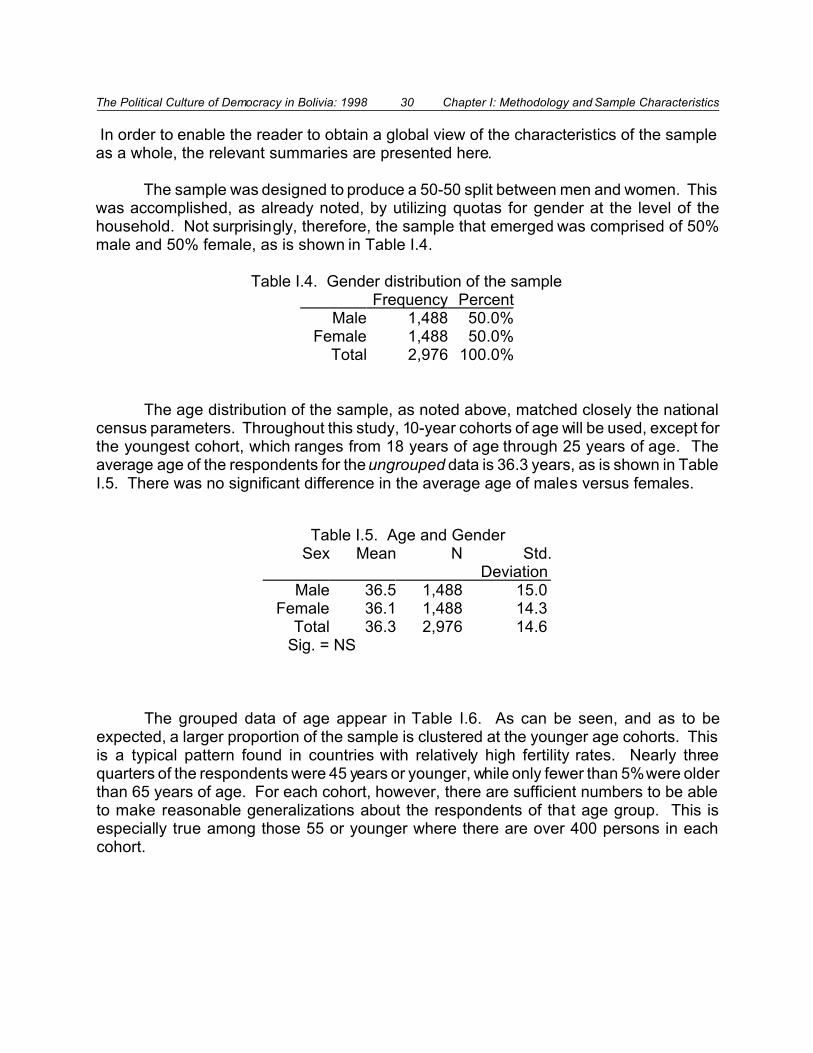
The Political Culture of Democracy in Bolivia: 1998 30 Chapter I: Methodology and Sample Characteristics
In order to enable the reader to obtain a global view of the characteristics of the sampleas a whole, the relevant summaries are presented here.
The sample was designed to produce a 50-50 split between men and women. Thiswas accomplished, as already noted, by utilizing quotas for gender at the level of thehousehold. Not surprisingly, therefore, the sample that emerged was comprised of 50%male and 50% female, as is shown in Table I.4.
Table I.4. Gender distribution of the sample Frequency Percent
Male 1,488 50.0%Female 1,488 50.0%
Total 2,976 100.0%
The age distribution of the sample, as noted above, matched closely the nationalcensus parameters. Throughout this study, 10-year cohorts of age will be used, except forthe youngest cohort, which ranges from 18 years of age through 25 years of age. Theaverage age of the respondents for the ungrouped data is 36.3 years, as is shown in TableI.5. There was no significant difference in the average age of males versus females.
Table I.5. Age and GenderSex Mean N Std.
Deviation Male 36.5 1,488 15.0
Female 36.1 1,488 14.3 Total 36.3 2,976 14.6
Sig. = NS
The grouped data of age appear in Table I.6. As can be seen, and as to beexpected, a larger proportion of the sample is clustered at the younger age cohorts. Thisis a typical pattern found in countries with relatively high fertility rates. Nearly threequarters of the respondents were 45 years or younger, while only fewer than 5% were olderthan 65 years of age. For each cohort, however, there are sufficient numbers to be ableto make reasonable generalizations about the respondents of that age group. This isespecially true among those 55 or younger where there are over 400 persons in eachcohort.
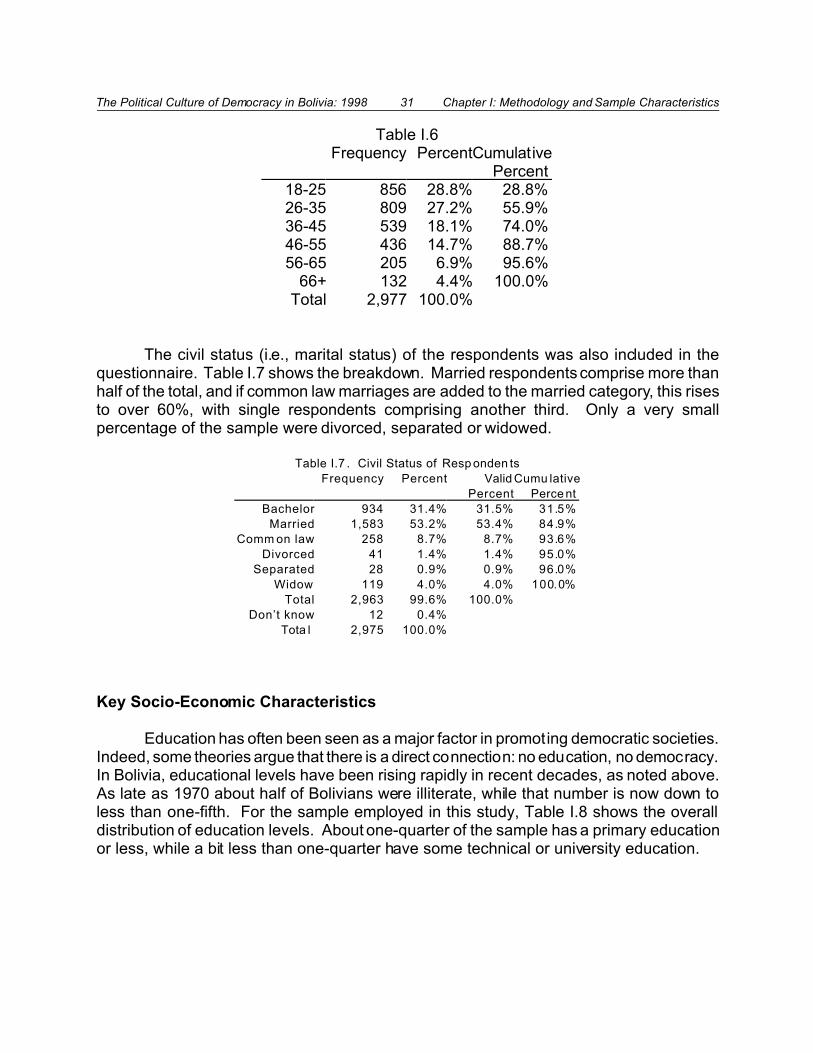
The Political Culture of Democracy in Bolivia: 1998 31 Chapter I: Methodology and Sample Characteristics
Table I.6 Frequency PercentCumulative
Percent 18-25 856 28.8% 28.8% 26-35 809 27.2% 55.9% 36-45 539 18.1% 74.0% 46-55 436 14.7% 88.7% 56-65 205 6.9% 95.6%
66+ 132 4.4% 100.0% Total 2,977 100.0%
The civil status (i.e., marital status) of the respondents was also included in thequestionnaire. Table I.7 shows the breakdown. Married respondents comprise more thanhalf of the total, and if common law marriages are added to the married category, this risesto over 60%, with single respondents comprising another third. Only a very smallpercentage of the sample were divorced, separated or widowed.
Table I.7 . Civil Status of Resp onden ts
Frequency Percent Valid
Percent
Cumu lative
Perce nt
Bachelor 934 31.4% 31.5% 31.5%
Married 1,583 53.2% 53.4% 84.9%
Comm on law 258 8.7% 8.7% 93.6%
Divorced 41 1.4% 1.4% 95.0%
Separated 28 0.9% 0.9% 96.0%
Widow 119 4.0% 4.0% 100.0%
Total 2,963 99.6% 100.0%
Don’t know 12 0.4%
Tota l 2,975 100.0%
Key Socio-Economic Characteristics
Education has often been seen as a major factor in promoting democratic societies.Indeed, some theories argue that there is a direct connection: no education, no democracy.In Bolivia, educational levels have been rising rapidly in recent decades, as noted above.As late as 1970 about half of Bolivians were illiterate, while that number is now down toless than one-fifth. For the sample employed in this study, Table I.8 shows the overalldistribution of education levels. About one-quarter of the sample has a primary educationor less, while a bit less than one-quarter have some technical or university education.
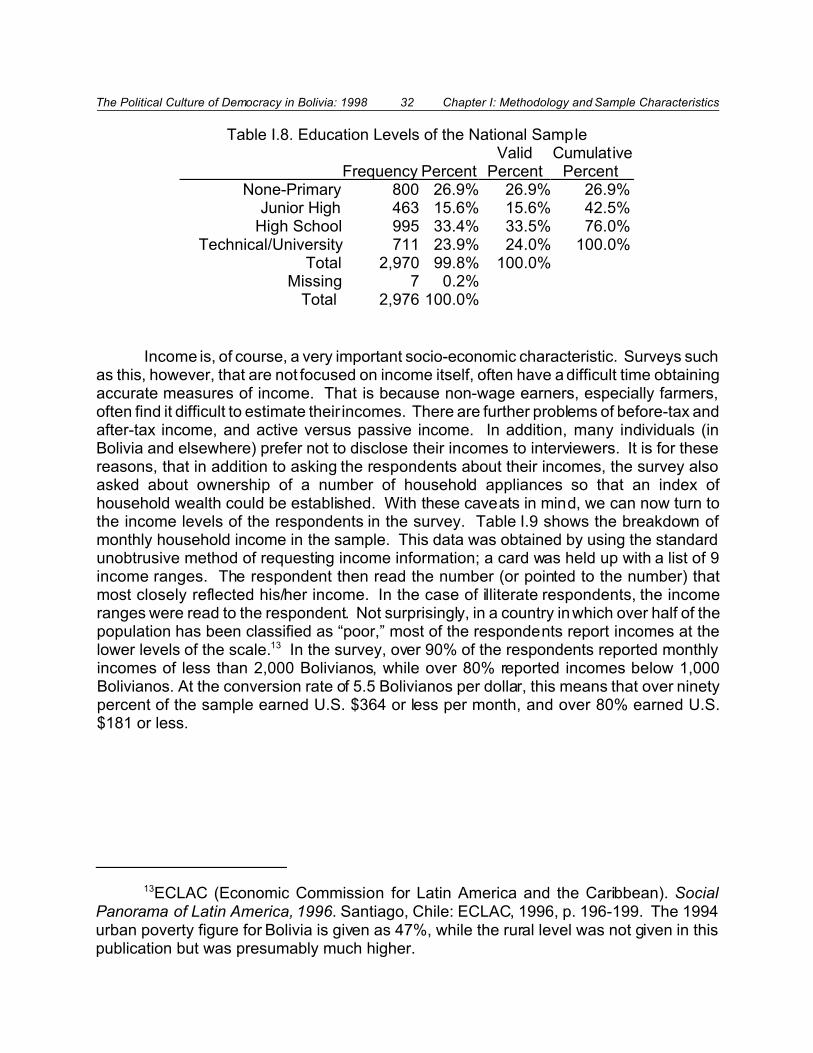
The Political Culture of Democracy in Bolivia: 1998 32 Chapter I: Methodology and Sample Characteristics
13ECLAC (Economic Commission for Latin America and the Caribbean). SocialPanorama of Latin America, 1996. Santiago, Chile: ECLAC, 1996, p. 196-199. The 1994urban poverty figure for Bolivia is given as 47%, while the rural level was not given in thispublication but was presumably much higher.
Table I.8. Education Levels of the National Sample Frequency Percent
ValidPercent
CumulativePercent
None-Primary 800 26.9% 26.9% 26.9% Junior High 463 15.6% 15.6% 42.5%
High School 995 33.4% 33.5% 76.0% Technical/University 711 23.9% 24.0% 100.0%
Total 2,970 99.8% 100.0% Missing 7 0.2%
Total 2,976 100.0%
Income is, of course, a very important socio-economic characteristic. Surveys suchas this, however, that are not focused on income itself, often have a difficult time obtainingaccurate measures of income. That is because non-wage earners, especially farmers,often find it difficult to estimate their incomes. There are further problems of before-tax andafter-tax income, and active versus passive income. In addition, many individuals (inBolivia and elsewhere) prefer not to disclose their incomes to interviewers. It is for thesereasons, that in addition to asking the respondents about their incomes, the survey alsoasked about ownership of a number of household appliances so that an index ofhousehold wealth could be established. With these caveats in mind, we can now turn tothe income levels of the respondents in the survey. Table I.9 shows the breakdown ofmonthly household income in the sample. This data was obtained by using the standardunobtrusive method of requesting income information; a card was held up with a list of 9income ranges. The respondent then read the number (or pointed to the number) thatmost closely reflected his/her income. In the case of illiterate respondents, the incomeranges were read to the respondent. Not surprisingly, in a country in which over half of thepopulation has been classified as “poor,” most of the respondents report incomes at thelower levels of the scale.13 In the survey, over 90% of the respondents reported monthlyincomes of less than 2,000 Bolivianos, while over 80% reported incomes below 1,000Bolivianos. At the conversion rate of 5.5 Bolivianos per dollar, this means that over ninetypercent of the sample earned U.S. $364 or less per month, and over 80% earned U.S.$181 or less.

The Political Culture of Democracy in Bolivia: 1998 33 Chapter I: Methodology and Sample Characteristics
Figure I Income and Urban/Rural Residence
Table I.9. Monthly Household Income in Bolivianos FrequencyPercent Valid Percent Cumulative
Percent None (housewife,
unemployed)52 1.8% 1.9% 1.9%
<250 Bolivianos 410 13.8% 15.3% 17.2% 251- 500 833 28.0% 31.0% 48.2%
501 - 1,000 868 29.2% 32.3% 80.5% 1,001 - 2,000 348 11.7% 13.0% 93.5% 2,001 - 5,000 130 4.4% 4.8% 98.3%
5,001 - 10,000 37 1.2% 1.4% 99.7% 10,001 - 20,000 8 0.3% 0.3% 100.0%
>20,000 1 0.0% 0.0% 100.0% Total 2,687 90.3% 100.0%
No response 290 9.7% Total 2,977100.0%
Income levels are strongly impacted by location of residence. Those who live inlarger towns and cities earn far more than those who live in rural areas, as is shown inFigure I.1 The income ranges listed in the figure correspond to the incomes in the tableabove. As shown in the figure, the correlation (r) between residence and income is -.33,significant at < .001. This means that as residence moves from large urban to dispersedrural, income declines sharply.
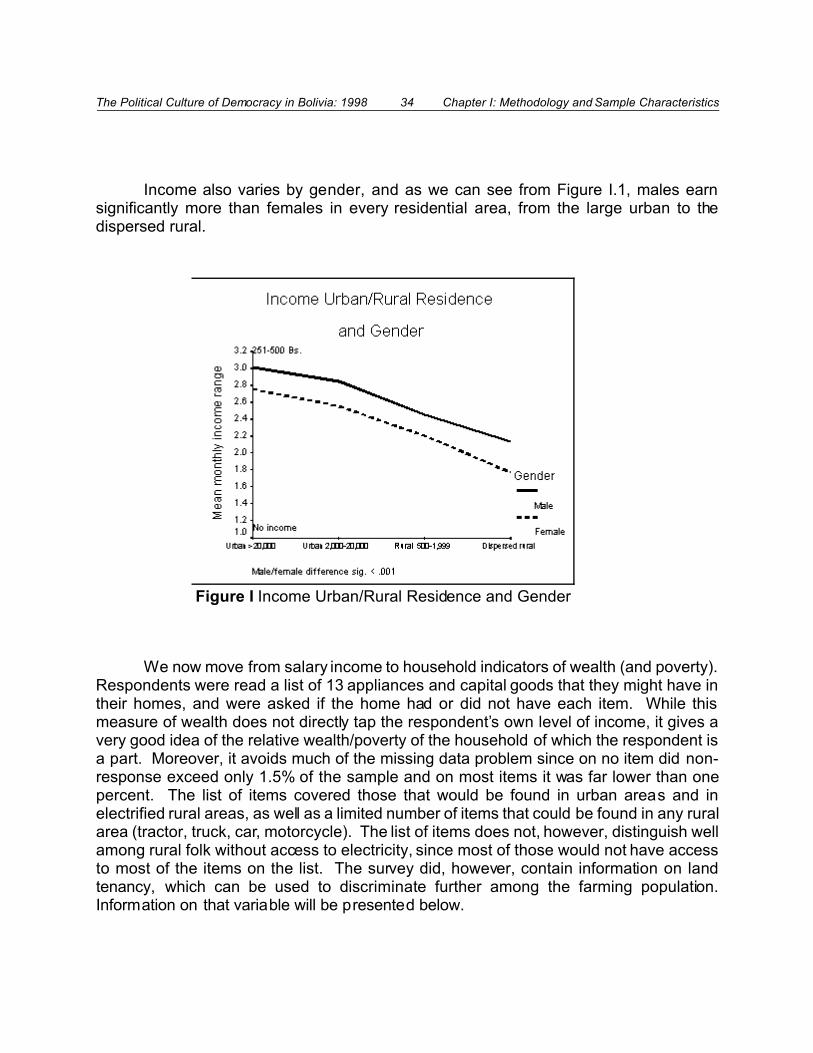
The Political Culture of Democracy in Bolivia: 1998 34 Chapter I: Methodology and Sample Characteristics
Figure I Income Urban/Rural Residence and Gender
Income also varies by gender, and as we can see from Figure I.1, males earnsignificantly more than females in every residential area, from the large urban to thedispersed rural.
We now move from salary income to household indicators of wealth (and poverty).Respondents were read a list of 13 appliances and capital goods that they might have intheir homes, and were asked if the home had or did not have each item. While thismeasure of wealth does not directly tap the respondent’s own level of income, it gives avery good idea of the relative wealth/poverty of the household of which the respondent isa part. Moreover, it avoids much of the missing data problem since on no item did non-response exceed only 1.5% of the sample and on most items it was far lower than onepercent. The list of items covered those that would be found in urban areas and inelectrified rural areas, as well as a limited number of items that could be found in any ruralarea (tractor, truck, car, motorcycle). The list of items does not, however, distinguish wellamong rural folk without access to electricity, since most of those would not have accessto most of the items on the list. The survey did, however, contain information on landtenancy, which can be used to discriminate further among the farming population.Information on that variable will be presented below.
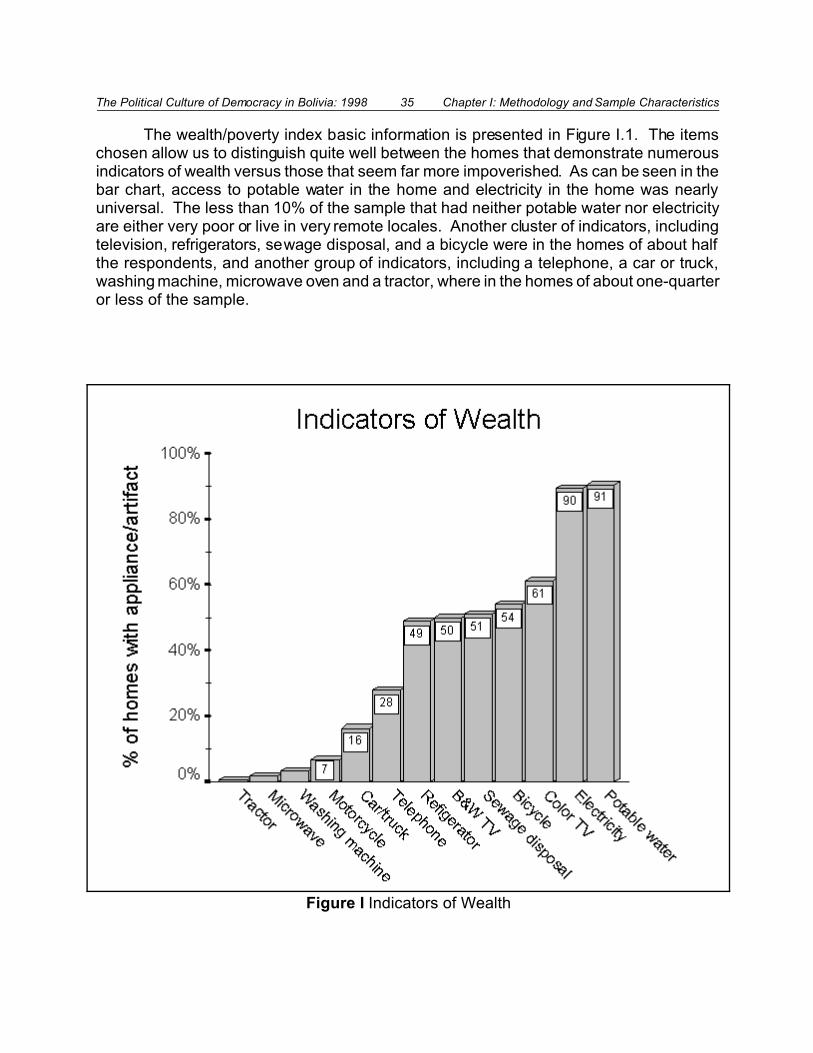
The Political Culture of Democracy in Bolivia: 1998 35 Chapter I: Methodology and Sample Characteristics
Figure I Indicators of Wealth
The wealth/poverty index basic information is presented in Figure I.1. The itemschosen allow us to distinguish quite well between the homes that demonstrate numerousindicators of wealth versus those that seem far more impoverished. As can be seen in thebar chart, access to potable water in the home and electricity in the home was nearlyuniversal. The less than 10% of the sample that had neither potable water nor electricityare either very poor or live in very remote locales. Another cluster of indicators, includingtelevision, refrigerators, sewage disposal, and a bicycle were in the homes of about halfthe respondents, and another group of indicators, including a telephone, a car or truck,washing machine, microwave oven and a tractor, where in the homes of about one-quarteror less of the sample.

The Political Culture of Democracy in Bolivia: 1998 36 Chapter I: Methodology and Sample Characteristics
14The Alpha coefficient for the items was .63. If the respondent reported on at leastthree of the items on the list, then that respondent’s score was based on the mean of thosethree items. Since missing data was very uncommon, however, and few respondentsfailed to answer all of the questions, this adjustment had little impact on the overall score.
Figure I Wealth Urban/Rural Residence and Gender
In order to be able to use these multiple indicators of wealth as a single measurethat we can use to associate with other variables in the study, we need to develop anoverall index of wealth in the home.14 On the 0-100 scale, the average for the sample asa whole was 38.6. There is only one missing case.
In an effort to check on the reliability of the wealth scale just created, it wascorrelated with the monthly income figure described above. It was found that the twomeasures of wealth correlated (r) at .52 (sig. < .001), indicating that the two are veryclosely related but clearly not exact duplicates of each other. Since the wealth scaleincludes all but one case in the entire sample, while 290 respondents did not provideincome information, the former will be used throughout this report for much of the analysisof the relationship between wealth and democratic values and behaviors.
The wealth index has the same relationship to residential location and gender as didthe income measure. These patterns are shown in Figure I.1 below.
Land rental or ownership is another way to distinguish among Bolivians socio-economically. In the weighted sample, only 5% of the respondents reported owning or
The Political Culture of Democracy in Bolivia: 1998 37 Chapter I: Methodology and Sample Characteristics
renting land. Those who did report having land averaged 24 hectares, although 35% ownor rent 1 hectare or less.
Ethnicity
The indigenous population of Bolivia is considered to the be proportionally thesecond largest in all of Latin America, after Guatemala. For this reason alone, it isimportant to have some notion of the ethnicity of the respondents in the sample. Sinceethnicity is a subjective criterion and the terminology used to define various groups variesfrom place-to-place and from time-to-time (e.g., recall the transition from the use of theterm “Negro” to the term “Black” to the term “Afro-American” in the United States), we hadto examine the wording of this question with special care. Based upon both pre-tests aswell as the relevant social science literature on the subject, we determined that the best(but not perfect!) way to determine ethnicity in Bolivia was to ask the respondent to locatethemselves in one of four categories: “Mestiza,” “Blanca,” “Indígena” or “Negra.” Thequestionnaire allowed for a fif th category, “Chola” as well as “other.” These are the termsthat Bolivians themselves use to distinguish among ethnic groups, although we hasten tonote that they are subjective terms with no precise, universal agreement as to whichindividual fits into which category. The category “White” presumably reflects those whobelieve that they are of “pure blood,” i.e., no mixture with Indian or Black blood. In reality,the reference is to cultural factors rather than blood, since it is well known that there isextensive blood type mixture throughout Bolivia. The “Mestiza” category represents suchmixtures, largely between Indian and White cultures. The category “Indian” presumablyrepresents a pure Indian culture, while “Negra” represents a pure Afro culture. Figure I.1shows the relative distribution of the responses. As can be seen, over 60% of Boliviansconsider themselves to be “Mestizos,” while nearly one-quarter consider themselves to be“White.” A surprisingly small 10% self-identify as Indian, but this, no doubt, is because ofthe availability of the “Mestizo” category. When a similar question was asked in Guatemala,in which the local discourse normally divides ethnicity into “Ladino” and “Indígena,” over40% regularly select the latter.

The Political Culture of Democracy in Bolivia: 1998 38 Chapter I: Methodology and Sample Characteristics
Figure I Ethnic Self-Identification
There are strong linkages between these self-identifications and socio-economicstatus. The wealth index developed above shows this point clearly, as can be seen inFigure I.1. Whites live in wealthier homes than do Mestizos, who in turn live in far wealthierhomes than do the Cholos, with Indians and Blacks at the bottom of the scale. Thesedifferences hold for men as well as women, except among male Mestizos and Cholos,where the relationship is slightly reversed. However, there were only eight persons whoidentified themselves as male “Cholos,” so the average wealth figures here are not reliable.

The Political Culture of Democracy in Bolivia: 1998 39 Chapter I: Methodology and Sample Characteristics
Figure I Ethnicity, Wealth and Gender
Ethnicity has a similar relationship to education, with the largest gap emergingbetween the Whites and Mestizos, on the one hand and the Cholos, Indians and Blackson the other. The results are shown in Figure I.1
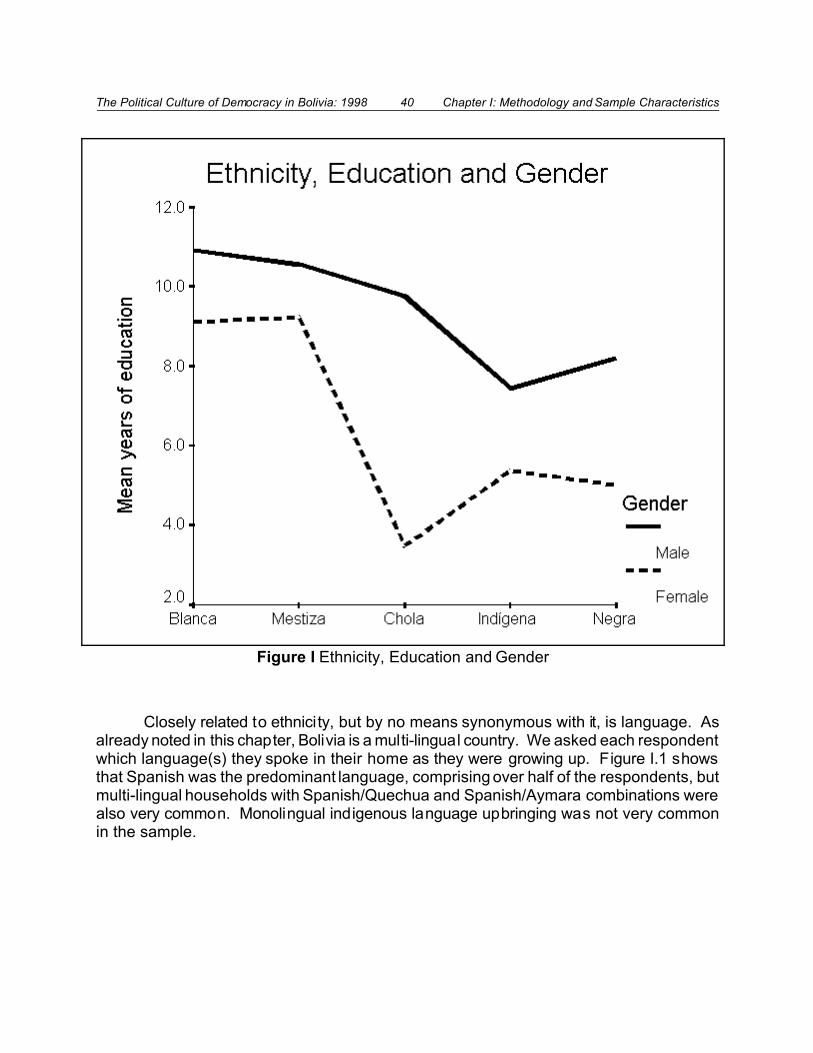
The Political Culture of Democracy in Bolivia: 1998 40 Chapter I: Methodology and Sample Characteristics
Figure I Ethnicity, Education and Gender
Closely related to ethnicity, but by no means synonymous with it, is language. Asalready noted in this chapter, Bolivia is a multi-lingual country. We asked each respondentwhich language(s) they spoke in their home as they were growing up. Figure I.1 showsthat Spanish was the predominant language, comprising over half of the respondents, butmulti-lingual households with Spanish/Quechua and Spanish/Aymara combinations werealso very common. Monolingual indigenous language upbringing was not very commonin the sample.
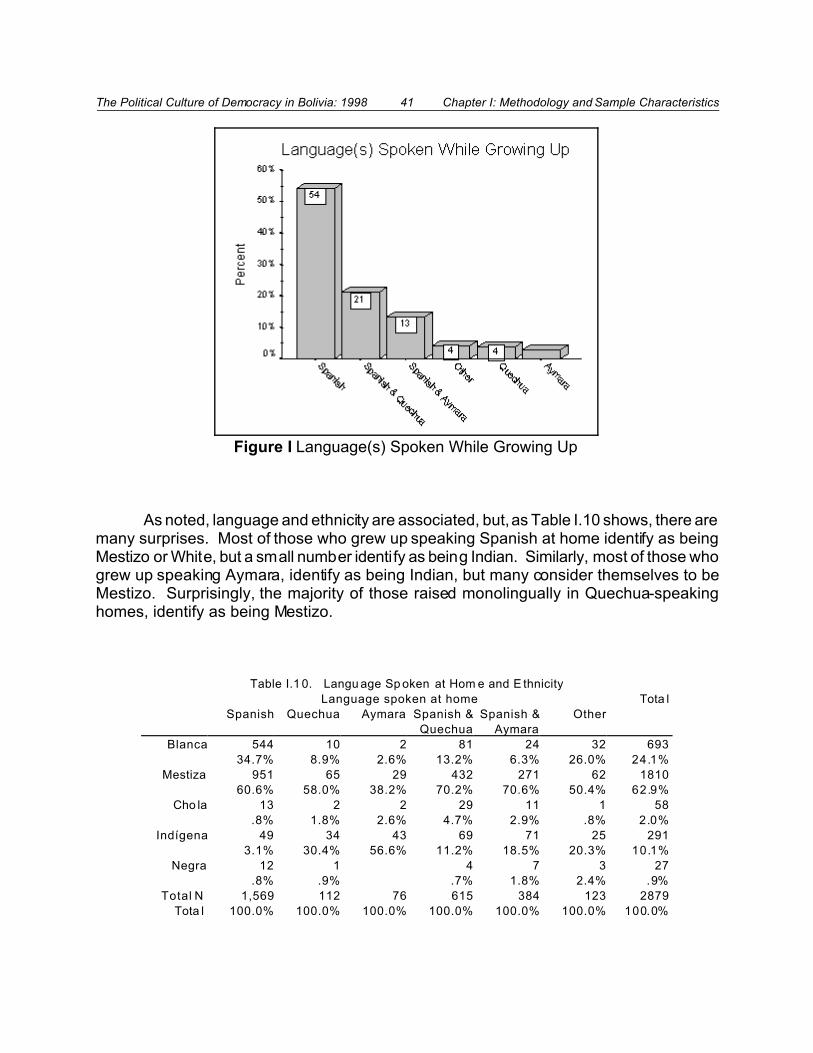
The Political Culture of Democracy in Bolivia: 1998 41 Chapter I: Methodology and Sample Characteristics
Figure I Language(s) Spoken While Growing Up
As noted, language and ethnicity are associated, but, as Table I.10 shows, there aremany surprises. Most of those who grew up speaking Spanish at home identify as beingMestizo or White, but a small number identify as being Indian. Similarly, most of those whogrew up speaking Aymara, identify as being Indian, but many consider themselves to beMestizo. Surprisingly, the majority of those raised monolingually in Quechua-speakinghomes, identify as being Mestizo.
Table I.1 0. Langu age Sp oken at Hom e and E thnicity
Language spoken at home Tota l
Spanish Quechua Aymara Spanish &
Quechua
Spanish &
Aymara
Other
Blanca 544 10 2 81 24 32 693
34.7% 8.9% 2.6% 13.2% 6.3% 26.0% 24.1%
Mestiza 951 65 29 432 271 62 1810
60.6% 58.0% 38.2% 70.2% 70.6% 50.4% 62.9%
Cho la 13 2 2 29 11 1 58
.8% 1.8% 2.6% 4.7% 2.9% .8% 2.0%
Indígena 49 34 43 69 71 25 291
3.1% 30.4% 56.6% 11.2% 18.5% 20.3% 10.1%
Negra 12 1 4 7 3 27
.8% .9% .7% 1.8% 2.4% .9%
Total N 1,569 112 76 615 384 123 2879
Tota l 100.0% 100.0% 100.0% 100.0% 100.0% 100.0% 100.0%
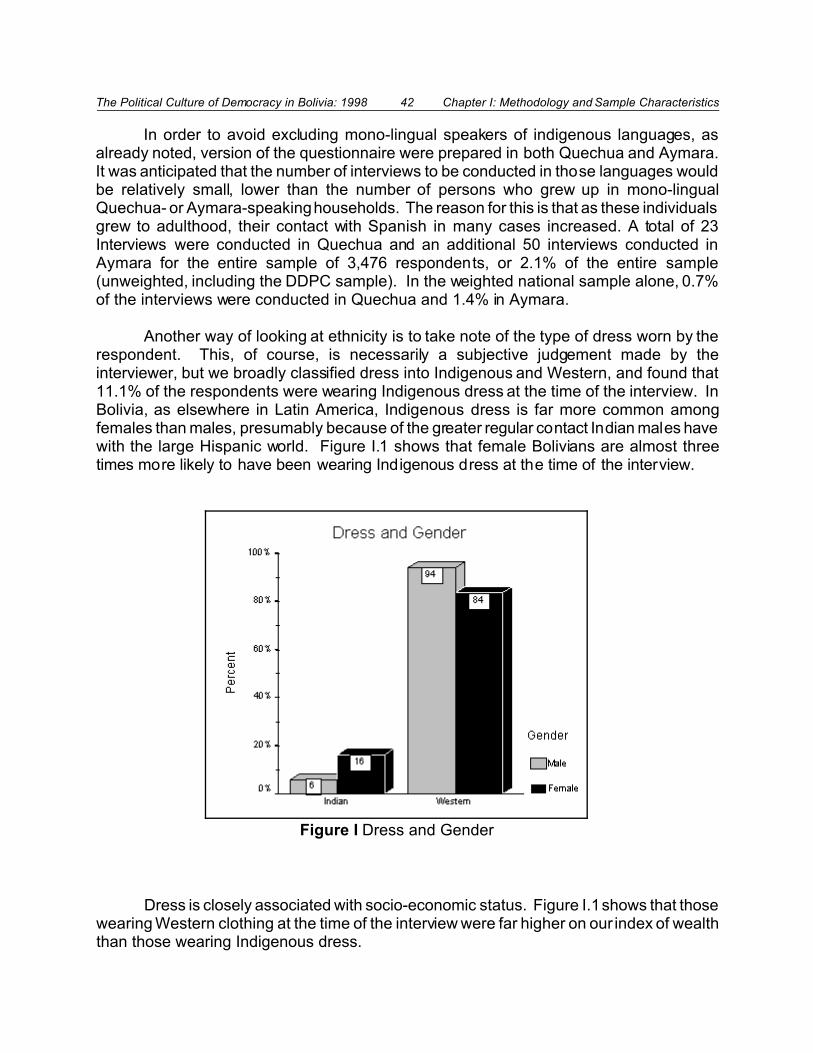
The Political Culture of Democracy in Bolivia: 1998 42 Chapter I: Methodology and Sample Characteristics
Figure I Dress and Gender
In order to avoid excluding mono-lingual speakers of indigenous languages, asalready noted, version of the questionnaire were prepared in both Quechua and Aymara.It was anticipated that the number of interviews to be conducted in those languages wouldbe relatively small, lower than the number of persons who grew up in mono-lingualQuechua- or Aymara-speaking households. The reason for this is that as these individualsgrew to adulthood, their contact with Spanish in many cases increased. A total of 23Interviews were conducted in Quechua and an additional 50 interviews conducted inAymara for the entire sample of 3,476 respondents, or 2.1% of the entire sample(unweighted, including the DDPC sample). In the weighted national sample alone, 0.7%of the interviews were conducted in Quechua and 1.4% in Aymara.
Another way of looking at ethnicity is to take note of the type of dress worn by therespondent. This, of course, is necessarily a subjective judgement made by theinterviewer, but we broadly classified dress into Indigenous and Western, and found that11.1% of the respondents were wearing Indigenous dress at the time of the interview. InBolivia, as elsewhere in Latin America, Indigenous dress is far more common amongfemales than males, presumably because of the greater regular contact Indian males havewith the large Hispanic world. Figure I.1 shows that female Bolivians are almost threetimes more likely to have been wearing Indigenous dress at the time of the interview.
Dress is closely associated with socio-economic status. Figure I.1 shows that thosewearing Western clothing at the time of the interview were far higher on our index of wealththan those wearing Indigenous dress.

The Political Culture of Democracy in Bolivia: 1998 43 Chapter I: Methodology and Sample Characteristics
Figure I Dress and Wealth
Figure I Dress and Education
In terms of education levels the differences are also sharp and statistically significant.Figure I.1 shows that those wearing Indian dress have less than have the average level ofeducation enjoyed by those who wear Western dress.
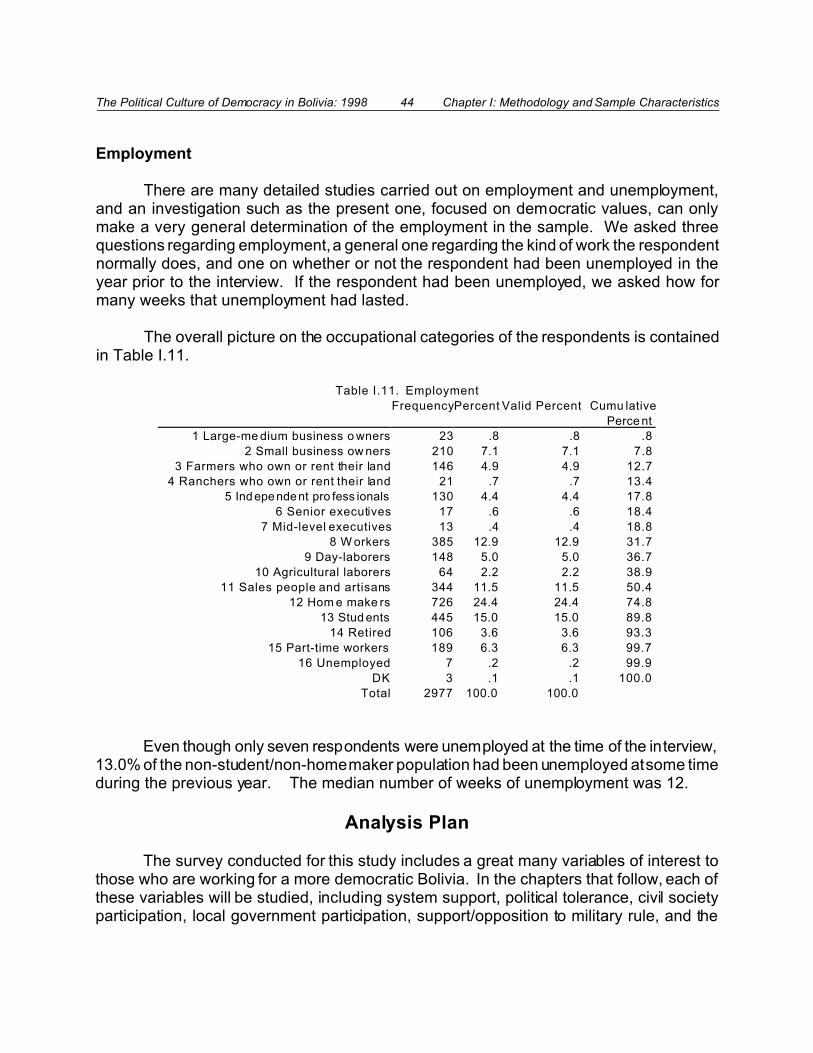
The Political Culture of Democracy in Bolivia: 1998 44 Chapter I: Methodology and Sample Characteristics
Employment
There are many detailed studies carried out on employment and unemployment,and an investigation such as the present one, focused on democratic values, can onlymake a very general determination of the employment in the sample. We asked threequestions regarding employment, a general one regarding the kind of work the respondentnormally does, and one on whether or not the respondent had been unemployed in theyear prior to the interview. If the respondent had been unemployed, we asked how formany weeks that unemployment had lasted.
The overall picture on the occupational categories of the respondents is containedin Table I.11.
Table I.11. Employment
FrequencyPercent Valid Percent Cumu lative
Perce nt
1 Large-me dium business o wners 23 .8 .8 .8
2 Small business ow ners 210 7.1 7.1 7.8
3 Farmers who own or rent their land 146 4.9 4.9 12.7
4 Ranchers who own or rent their land 21 .7 .7 13.4
5 Independent pro fess ionals 130 4.4 4.4 17.8
6 Senior executives 17 .6 .6 18.4
7 Mid-level executives 13 .4 .4 18.8
8 W orkers 385 12.9 12.9 31.7
9 Day-laborers 148 5.0 5.0 36.7
10 Agricultural laborers 64 2.2 2.2 38.9
11 Sales people and artisans 344 11.5 11.5 50.4
12 Hom e make rs 726 24.4 24.4 74.8
13 Stud ents 445 15.0 15.0 89.8
14 Retired 106 3.6 3.6 93.3
15 Part-time workers 189 6.3 6.3 99.7
16 Unemployed 7 .2 .2 99.9
DK 3 .1 .1 100.0
Total 2977 100.0 100.0
Even though only seven respondents were unemployed at the time of the interview,13.0% of the non-student/non-home maker population had been unemployed at some timeduring the previous year. The median number of weeks of unemployment was 12.
Analysis Plan
The survey conducted for this study includes a great many variables of interest tothose who are working for a more democratic Bolivia. In the chapters that follow, each ofthese variables will be studied, including system support, political tolerance, civil societyparticipation, local government participation, support/opposition to military rule, and the
The Political Culture of Democracy in Bolivia: 1998 45 Chapter I: Methodology and Sample Characteristics
administration of justice. In addition, an examination of the baseline data from the DDPCproject wil l be undertaken, and comparisons will be made with the rest of the country.
Most contemporary quantitative social science projects aim at presenting an overallmodel predicting (or explaining) the dependent variable. In some ways, this study willfollow that approach. Each of the above-mentioned variables (i.e., system support,tolerance, etc.) are dependent variables in this study, and the effort here will attempt toshow which independent variables best explain differences in support for democraticvalues and behaviors. The effort will be to show which independent variables (e.g.,gender, education, etc.) significantly explain the dependent variables (e.g., systemsupport).
This study will, however, differ from the conventional social scientific analysis ofdata. Typically, researchers disregard any variable that plays no role in the overallexplanation of the dependent variable. For example, a number of studies in Latin Americahave found that females are more intolerant than males. But further analysis has shownthat this intolerance is largely a function of the lower overall level of education and thehigher degree of church attendance of females. The overall model from typical socialscience investigations would ignore gender as a factor, arguing (correctly) that intoleranceis a function of education and religiosity. Yet, for the policy maker, it may be very importantto know that women are less tolerant than men, even if that intolerance stems from factorsother than gender itself. A policy maker concerned with the problem of political intolerancecould embark upon a long-term program of increasing national education levels, andexpect that eventually female levels would increase to those of males. On the other hand,policy makers often do not have the luxury of waiting for such long-term policies to cometo fruition, and might seek to shortcut the process in order to get more immediate results.Thus, knowledge that females in a given country are more intolerant than males,democracy-promoting programs could be aimed directly at adult females, while assistingin the long-term strategy of increasing education for young women so that they emerge asmore tolerant adults.
There are other findings that have emerged in studies of democracy that policy -makers need to know about even if they cannot or do not wish to attempt influence. Forexample, ethnicity might play a role in support for democracy and policy makers need toknow this, but they might not wish to be involved in any policies designed to affect ethnicidentity.
The presentation of the data here will take note of each of the factors that are foundto be important in explaining democratic values and behaviors so as to provide maximumassistance to policy makers. At the same time, it will conclude each discussion with amultivariate analysis that will simultaneously examine all of the predictors of the democraticbehavior or attitude and see which ones explain it best when the others are being heldconstant. Such a presentation of bi-variate and multivariate results in combination will beof greatest use to policy makers.
The Political Culture of Democracy in Bolivia: 1998 46 Chapter II: System Support
15The historical voting data are from Vanhanen, Tatu. Political and Social Structures:Part 1, American Countries 1850-1973. Tampere, Finland: Institute of Political Science,1975.
Chapter II.System Support
The Theory and the Measurement
Political instability has been endemic in Bolivia since Independence. Even withinthe highly volatile context of Latin America, Bolivia’s seemly ceaseless set of insurrections,military coups and countless constitutional re-writes, have been extreme. Only in recentyears, has this pattern begun to change markedly. From 1848 up until 1888, the countrywas run by a series of caudillos in which popular participation in politics was nil. Electionsbecame more commonplace beginning in 1888 with the election of Ancieto Arce, but evenin that year, only 1.6% of the population voted.15 But in 1896 a civil war and a coup d’etatended the elected regime of Severo Fernández Alonso, and another coup took place in1920, and another in 1930, and yet another in 1934. An assortment of militarygovernments ruled up until 1940 with the election of Enrique Peñaranda de Castillo withonly 3.1% of the national population voting. A coup also occurred in 1943, and another in1948, and yet another in May of 1951, followed by the Bolivian Revolution of 1952. TheRevolution ushered in a new age in Bolivian politics; the election of 1956 saw 28.2% of thepopulation voting, by far the highest level to that date. Yet, in 1964 elected governmentwas closed down by a coup, followed by another in 1969, resulting in military rule from1969-1978. A transition to democracy began in 1978, with a series of inconclusiveelections and coups leading to the 1980 elections, which again ended with a coup, and asuccession of military governments ending in an election in 1982, in which the presidentelected was forced out of office one year before the end of his term and new electionswere called in 1985 that produced the contested victory of Victor Paz Estensoro 1985.Since 1985, Bolivia has enjoyed a series of elected Presidents, including Jamie PazZamora from 1989-1993, Gonzalo Sánchez de Losada, 1993-1997, and today, General(ret.) Hugo Banzer Suarez.
Imposed regimes are, by definition, illegitimate, since they gain and hold power byforce. But, democratic regimes do not automatically win the support of their citizens merelyby dint of their having been elected. They have to prove themselves, often repeatedly, ofdeserving the loyalty of the population. Citizen belief in the legitimacy of democracydevelops over relatively long periods of time and depends on the ability of that system tosatisfy, over the long term, the needs and demands of the populace. In Bolivia, experiencewith democratic rule has been recent and limited, and the process of building the legitimacyof that system has only just begun.

The Political Culture of Democracy in Bolivia: 1998 47 Chapter II: System Support
16Seymour Martin Lipset, Political Man: The Social Basis of Politics. Baltimore, MD.:Johns Hopkins University Press, 1981, expanded ed., originally published 1961, p. 77.Seymour Martin Lipset, Kyoung-Ryung Seong, and John Charles Torres. "A ComparativeAnalysis of the Social Requisites of Democracy." International Social Science Journal 136(May 1993): 155-75. See also, Seymour Martin Lipset. "The Social Requisites ofDemocracy Revisited." American Sociological Review 59 (February 1994): 1-22.
17For more recent statements on this subject see Seymour Martin Lipset,Kyoung-Ryung Seong, and John Charles Torres, `A Comparative Analysis of the SocialRequisites of Democracy', International Social Science Journal 136 (May 1993), 155-75;and Seymour Martin Lipset, `The Social Requisites of Democracy Revisited', AmericanSociological Review 59 (February 1994), 1-22; and Seymour Martin Lipset, ̀ Excerpts fromThree Lectures on Democracy', Extensions, (Spring) 1998, 3-13.
18Lipset, 1981, p. 80.
The stability of a political system, and its ability to weather crises withoutsuccumbing to breakdown has been directly linked to legitimacy. Seymour Martin Lipset,one of the leading theorists in the area of democratic stability defined legitimacy as “thecapacity of the system to engender and maintain the belief that the existing politicalinstitutions are the most appropriate ones for the society".16 Lipset hypothesized, basedprimarily upon his observation of the impact of the Great Depression on Europe, thatsystems viewed by their citizens as being legitimate would survive a crisis of effectiveness(e.g. when the economy takes a nosedive), but those that were seen as illegitimate wouldtend to collapse under the stress of economic crisis. Lipset refers specifically to Germany,Austria and Spain as examples of fundamentally illegitimate systems that experiencedbreakdowns of democracy when buffeted by a crisis of effectiveness. The United Statesand Great Britain, however, survived the Great Depression without political breakdown,because of the legitimacy of these systems.17
Lipset recognized that once a system achieved a high degree of legitimacy therewas no guarantee that it would not eventually lose it. Just as political systems can undergoa crisis of effectiveness, so too could they undergo crises of legitimacy. Indeed, Lipset(1959:78) explicitly pointed out that long-term crises of effectiveness could erode legitimacybecause legitimacy itself depended upon the ability of the system to "sustain theexpectations of major groups." Consequently, "a breakdown of effectiveness, repeatedlyor for a long period will endanger even a legitimate's system stability."18 And Juan Linz(1978:16) makes much the same point in his treatise on the causes of the breakdown ofdemocracies: "Obviously no government is accorded legitimacy in this sense by all its

The Political Culture of Democracy in Bolivia: 1998 48 Chapter II: System Support
19Linz, Juan J, and Alfred Stepan, editors. The Breakdown of Democratic Regimes.Baltimore, MD., 1978, p. 16.
20World Bank. World Development Report, 1991. Washington, D. C.: OxfordUniversity Press, 1991, p. 204.
21World Bank, 1997, p. 214.
22Mitchell A. Seligson,"On the Measurement of Diffuse Support: Some Evidencefrom Mexico." Social Indicators Research 12 (January 1983b): 1-24; Mitchell A. Seligson,and Edward N. Muller, "Democratic Stability and Economic Crisis: Costa Rica 1978-1983,"
citizens, but no government can survive without that belief on the part of a substantialnumber of citizens...."19
The effectiveness of the Bolivian political system in terms of delivering economicgrowth and increased welfare to its citizens has been limited and therefore the ability of thedemocratic system to engender legitimacy significantly constrained. During the period1965-1989, annual growth averaged -.8%, and as late as 1989 life expectancy averagedonly 54 years.20 This record contrasted with an average annual growth rate of 2.0% anda life expectancy of 65 years for the lower middle-income group of countries of whichBolivia forms a part according to the World Bank. It would not at all be surprising if Boliviancitizens had reservations about the legitimacy of governments that were in power duringthis period of poor economic performance. More recently, however, Bolivia’s picture hasimproved, achieving a growth rate of 1.8% annual during the 1985-1995 period, while lifeexpectancy has risen to 61 years.21 One would hope that over time, steady improvementsin the economy and the welfare of its citizens would result in a slow, but steady, buildingof the legitimacy of the system. As these lines are being written, the entire Third World,and much of the first, faces an unprecedented economic crisis. And this crisis is occurringat a time in which never before have the economies of the world been so closely linked,and therefore the economic storms in Asia and former Soviet Union threaten to severelyweaken the economies of the rest of the world, especially those in Latin America. If theeconomies of Latin America suffer a serious decline as a result of the Asian turmoil, willdemocracy survive? And in Bolivia, is there sufficient belief in the legitimacy of democracyfor it weather the storm, or will Bolivians turn to authoritarian solutions to their problems?
In this chapter, belief in the legitimacy of the Bolivian system of government will bedescribed, and demographic and socio-economic differences in beliefs will be shown. Asa result of a long-term research project at the University of Pittsburgh, a scale of legitimacycalled “Political Support/Alienation” (PSA)has been developed, based initially on studiesin Germany, the United States, but later expanded to all of Central America, Peru,Paraguay, Venezuela and, now, Bolivia.22 The scale attempts to tap the level of support
The Political Culture of Democracy in Bolivia: 1998 49 Chapter II: System Support
301-26, September, International Studies Quarterly, 1987; in translation as: MitchellA.,Seligson, and Edward N. Muller, "Estabilidad Democrática y Crisis Económica: CostaRica, 1978-1983." Anuario de Estudios Centroamericanos 16-17, no. 2 (1990): 71-92, 2.;Edward N. Muller, Thomas O. Jukam, and Mitchell A. Seligson. "Diffuse Political Supportand Antisystem Political Behavior: A Comparative Analysis." American Journal of PoliticalScience 26 (May 1982): 240-64.; Mitchell A. Seligson, Political Culture in Paraguay: 1996Baseline Study of Democratic Values. Asunción, Paraguay: CIRD, 1997. Mitchell A.Seligson, Democratic Values in Nicaragua: 1991-1997. Report to USAID/Nicaragua.Pittsburgh, PA., 1997.
23There is no question ‘B5’ in this study. Earlier versions of the PSA series includedadditional items, including B5, but that item (and others) were dropped as they were shownto be less essential to measuring the basic concept. In order to retain consistency ofcomparisons with prior work, the original numbering system retained in this study for thisseries and all others presented in these pages.
24This was done by subtracting a score of 1 from each item (in order to give the itema lower limit of 0), and then by dividing each item by 6, and, finally multiplying by 100.
citizens have for their system of government, without focusing on the incumbent regimeitself. The core of this scale rests on five items, and each item has utilized a seven-pointresponse format, ranging from "not at all" to "a great deal." The full Spanish text of theitems are given in the questionnaire that can be found as an appendix to this study. Thenumbering system used in the questionnaire as well as in the data base is reproduced hereto enable the interested reader to further explore the data. The questions were as follows:
B1.To what extent do you believe that the courts in Bolivia guarantee a fair trial?B2. To what extent do you have respect for the political institutions of Bolivia?B3. To what extent do you think that the basic rights of citizens are well protectedby the Bolivian political system?B4. To what extent do you feel proud to live under the political system of Bolivia?B623. To what extent do you feel that one ought to support the political system ofBolivia?
In order to facilitate reading and interpretation of the items, they have beenrecalibrated on a 0-100 scale.24 The average scores for the national sample are shown inFigure II.1. The items have relatively similar averages, except for the item on the courts,which is low compared to the rest of the items in the series. It is also of note that none ofthe items have an average score in the positive end of the continuum (above 50). In lightof Bolivian political and economic history, as summarized earlier in this chapter, thesefindings should come as no surprise.
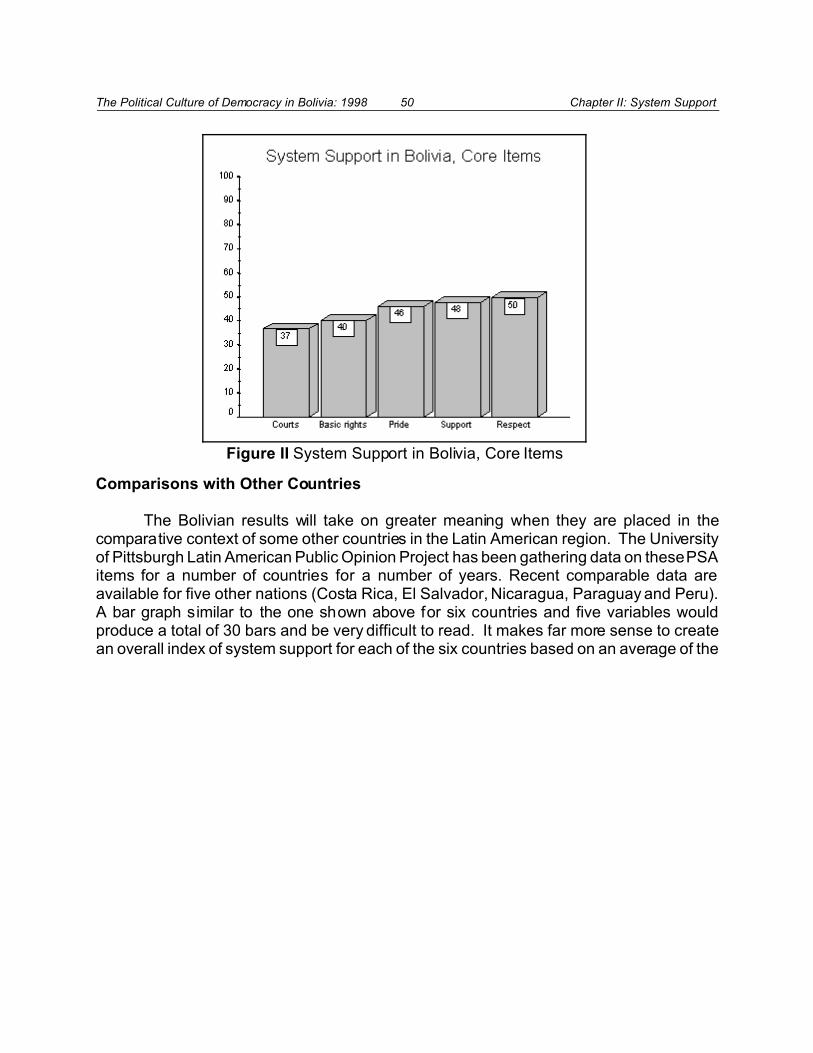
The Political Culture of Democracy in Bolivia: 1998 50 Chapter II: System Support
Figure II System Support in Bolivia, Core Items
Comparisons with Other Countries
The Bolivian results will take on greater meaning when they are placed in thecomparative context of some other countries in the Latin American region. The Universityof Pittsburgh Latin American Public Opinion Project has been gathering data on these PSAitems for a number of countries for a number of years. Recent comparable data areavailable for five other nations (Costa Rica, El Salvador, Nicaragua, Paraguay and Peru).A bar graph similar to the one shown above for six countries and five variables wouldproduce a total of 30 bars and be very difficult to read. It makes far more sense to createan overall index of system support for each of the six countries based on an average of the

The Political Culture of Democracy in Bolivia: 1998 51 Chapter II: System Support
25This was accomplished by summing the five items (which now range from 0-100)and dividing by five. The Alpha Standardized reliability coefficient for the PSA scale in eachcountry was as follows:
Bolivia .77Costa Rica .73El Salvador .78Nicaragua .70Paraguay .70Peru .80
Reliabilities approaching .8 are considered very good in cross-national survey research ofthis nature.
26These scores may differ somewhat from other published versions of the resultsfor other countries. That is because of the manner in which non-response is treated in thisreport compared to some of the others. In creating an index, it is possible to lose a greatmany cases if there is a scattering of non-response on even as few as one item in theseries. In order to maintain the maximum number of cases in the sample, the scale wascreated by assigning the mean score of each respondent’s answers to the PSA serieswhen at least three of the five items questions were answered. If fewer than three itemswere answered, then that respondent was assigned a missing value code for the entirePSA scale.
27Steve Finkel, Edward Muller, and Mitchell A. Seligson, `Economic Crisis,Incumbent Performance and Regime Support: A Comparison of Longitudinal Data fromWest Germany and Costa Rica', British Journal of Political Science 19 (July 1989), pp.
five items in the scale.25 The comparison for the six countries is shown in Figure II.1.26
The results show that Costa Rica is by far the country with the highest level of systemsupport in the series. This is not surprising given the long tradition of democratic rule inthat country for most of the past century, and the widespread respect for human rights andcivil liberties shown by successive governments there. Costa Rica does not, of course,have an army, and no significant political unrest has occurred since 1948. The othercountries are grouped together fairly closely, although Peru is clearly at the low end ofsystem support. This is also not surprising given that the incumbent regime itselfextinguished democracy in 1992 by closing the legislature and the courts, and today thecountry is run with only a thin veneer of democratic procedures. Paraguay’s level ofsystem support might seem somewhat high, given its very recent political history, but at thetime of the survey a military coup had been put down in part because of strong citizenobjection to it. El Salvador’s survey data was taken not long after the final signing of thePeace Accords that ended the brutal decade-long civil war in that country. It is difficult tosay, of course, what impact these events have on system support at any given moment intime. Prior research has shown that even serious government failures in the short run donot noticeably weaken system support in stable democracies.27 In fragile, nascent

The Political Culture of Democracy in Bolivia: 1998 52 Chapter II: System Support
329-51.
Figure II System Support, Core Items: Bolivia in Comparative Perspective
democracies like those found in most of Latin America, these events could have a largerimpact. In any event, the comparisons with other countries in Latin America showBolivians to be exhibiting levels that are comparable to its neighbors, but notably lower thanCosta Rica and higher than Peru.
Factors that Influence Political Support
This section now turns its attention to the factors related to (i.e., predictors) ofpolitical support/alienation. It first examines demographic factors, and then moves on tosocio-economic and geographic factors, and finally treats the relationship of ethnicity andreligion to system support. The section concludes with an overall mulitvariate analysis ofall of the factors working together, so that we can hold constant each of them and seewhich ones remain influential.
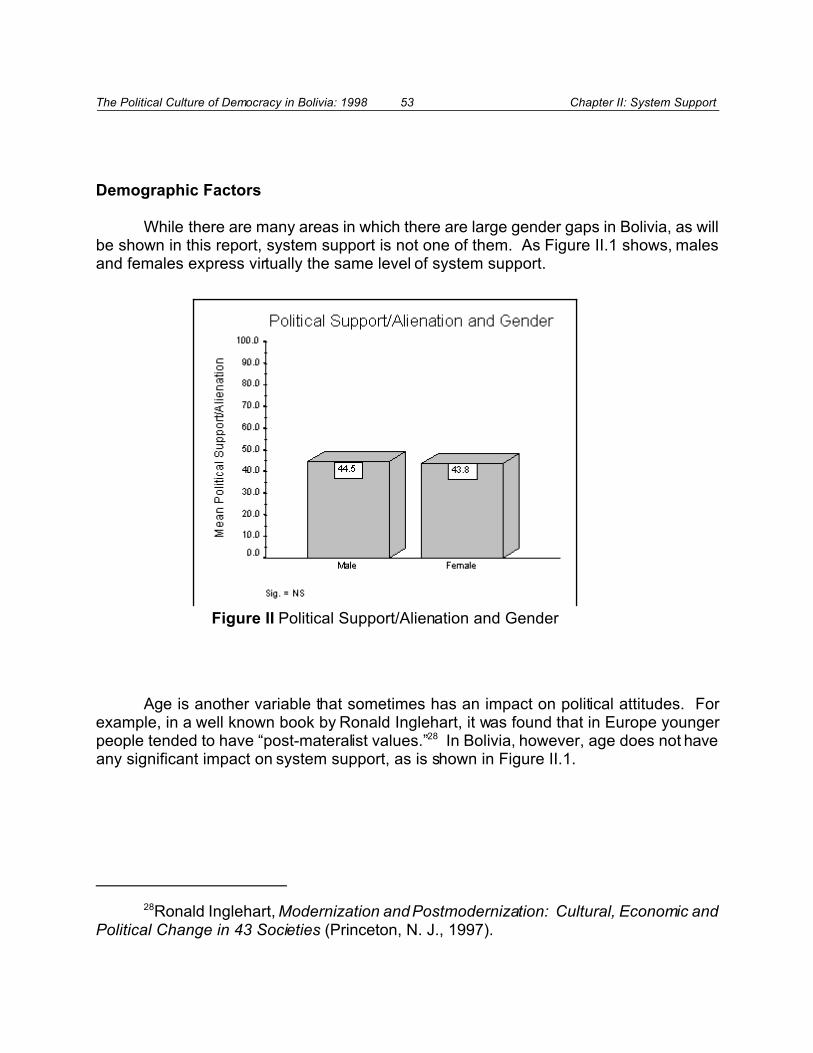
The Political Culture of Democracy in Bolivia: 1998 53 Chapter II: System Support
28Ronald Inglehart, Modernization and Postmodernization: Cultural, Economic andPolitical Change in 43 Societies (Princeton, N. J., 1997).
Figure II Political Support/Alienation and Gender
Demographic Factors
While there are many areas in which there are large gender gaps in Bolivia, as willbe shown in this report, system support is not one of them. As Figure II.1 shows, malesand females express virtually the same level of system support.
Age is another variable that sometimes has an impact on political attitudes. Forexample, in a well known book by Ronald Inglehart, it was found that in Europe youngerpeople tended to have “post-materalist values.”28 In Bolivia, however, age does not haveany significant impact on system support, as is shown in Figure II.1.

The Political Culture of Democracy in Bolivia: 1998 54 Chapter II: System Support
29The relationship is virtually identical when individual years of school are used orthe recoded, grouped years are substituted as they are in the figure.
Figure II Political Support/Alienation and Age
Socio-Economic Status (Education and Income)
Education play a role in determining levels of system support. Education wasmeasured as years of schooling completed. This variable is significantly (< .01) related tosystem support, as is shown in Figure II.1, but the relationship is not linear.29 In order toshow more clearly the impact of education, the figure focuses on the narrow range in whichthere is variation rather than on the entire 0-100 range of the Political Support/Alienationscale. Although there is some variation in system support among primary, junior high and

The Political Culture of Democracy in Bolivia: 1998 55 Chapter II: System Support
30This is established by what is known as a post-hoc test. As shown in the tablebelow, it is the university-educated group that differs from the other three.
Duncan Post Hoc Test
N Subset for alpha = .05
Education 1 2
Univers ity 707 41.4
0-Primary 721 44.2
High School 980 45.3
Junior High 443 46.2
Means for groups in homogeneous subsets are displayed.
Uses Harmonic Mean Sample Size = 658.339.
The group sizes are unequal. The harmonic mean of the group sizes is used.
Figure II Political Support/Alienation and Education
high school educated Bolivians, the real difference emerges among college educatedcitizens.30 Among that group, system support declines signif icantly.
As noted earlier in this study, wealth was measured in two ways, by income and bymaterial indicators of wealth (i.e., appliances in the home, etc.). Both can give us an ideaof the relative wealth of the respondents, but in this case, the material indicator of wealthindex showed no clear and interpretable relationship to system support, while income, onthe other hand, had a clear positive relationship with it. As shown in Figure II.1, among
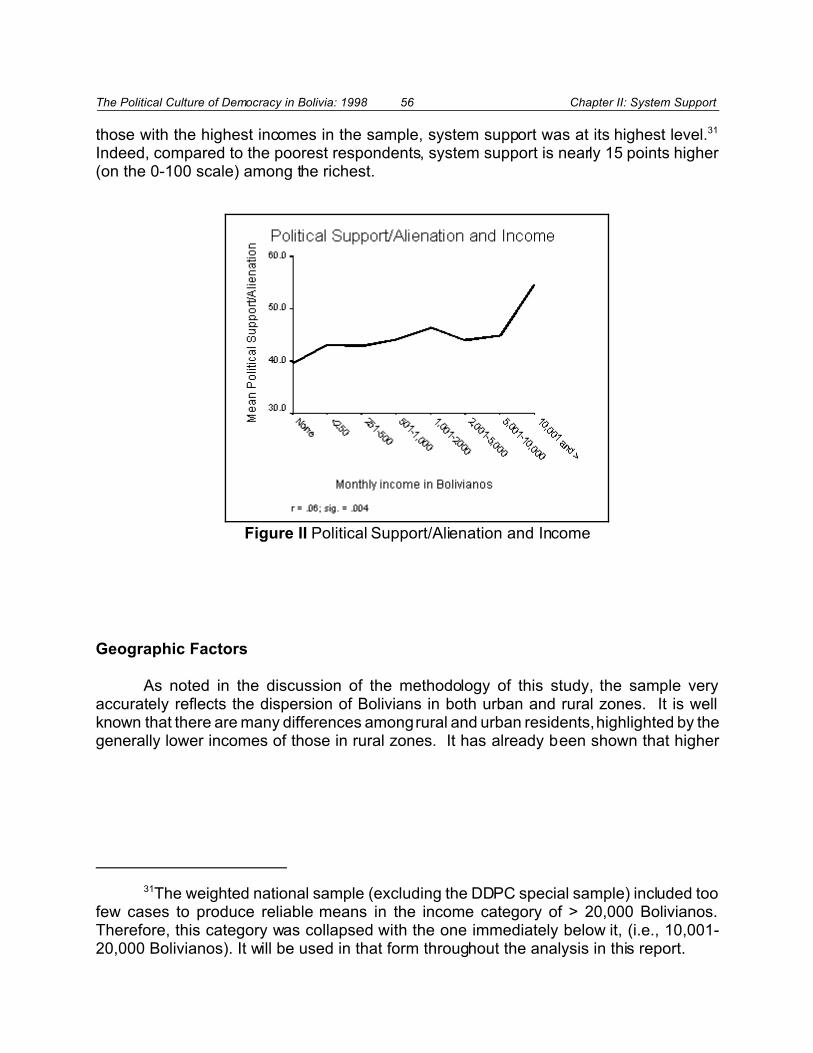
The Political Culture of Democracy in Bolivia: 1998 56 Chapter II: System Support
31The weighted national sample (excluding the DDPC special sample) included toofew cases to produce reliable means in the income category of > 20,000 Bolivianos.Therefore, this category was collapsed with the one immediately below it, (i.e., 10,001-20,000 Bolivianos). It will be used in that form throughout the analysis in this report.
Figure II Political Support/Alienation and Income
those with the highest incomes in the sample, system support was at its highest level.31
Indeed, compared to the poorest respondents, system support is nearly 15 points higher(on the 0-100 scale) among the richest.
Geographic Factors
As noted in the discussion of the methodology of this study, the sample veryaccurately reflects the dispersion of Bolivians in both urban and rural zones. It is wellknown that there are many differences among rural and urban residents, highlighted by thegenerally lower incomes of those in rural zones. It has already been shown that higher

The Political Culture of Democracy in Bolivia: 1998 57 Chapter II: System Support
32The incom e figures by zone of residence is shown in the following sum mary, based upon the 1-7
income scheme.
Monthly income in Bolivianos
UR Mean N Std.
Deviation
Urban >20,000 2.9 1,567 1.1
Urban 2,000-20,000 2.7 280 1.2
Rural 500-1,999 2.3 202 1.2
Dispersed rural 2.0 638 1.1
Total 2.6 2,687 1.2
Figure II Political Support/Alienation and Urban/Rural Residence
income is significantly associated with higher system support.32 But, as is shown in FigureII.1, urban residents are less supportive of the system than are those in rural Bolivia. Thismay be a function of the lower levels of education in rural areas, which has been shownto relate to higher system support. In the final analysis, only the multivariate studyconducted at the end of this discussion of system support will provide the full picture ofthese contradictory influences on system support. For the moment, it is important to notethat the correlation between residence and system support is moderately strong andstatistically significant. The highest support levels are found among Bolivians who live intowns in the 500-1,999 population range, although there is a slight decline among thoseliving in the even more rural areas (the “dispersed rural” region of fewer than 500residents). These differences are not only statistically significant, they are substantivelyof importance too since rural Bolivians in the 500-1,999 population category are the onlyones (by residence) who are close to falling into the positive end of the PoliticalSupport/Alienation continuum (with a score of 49.9 out of 100 points).
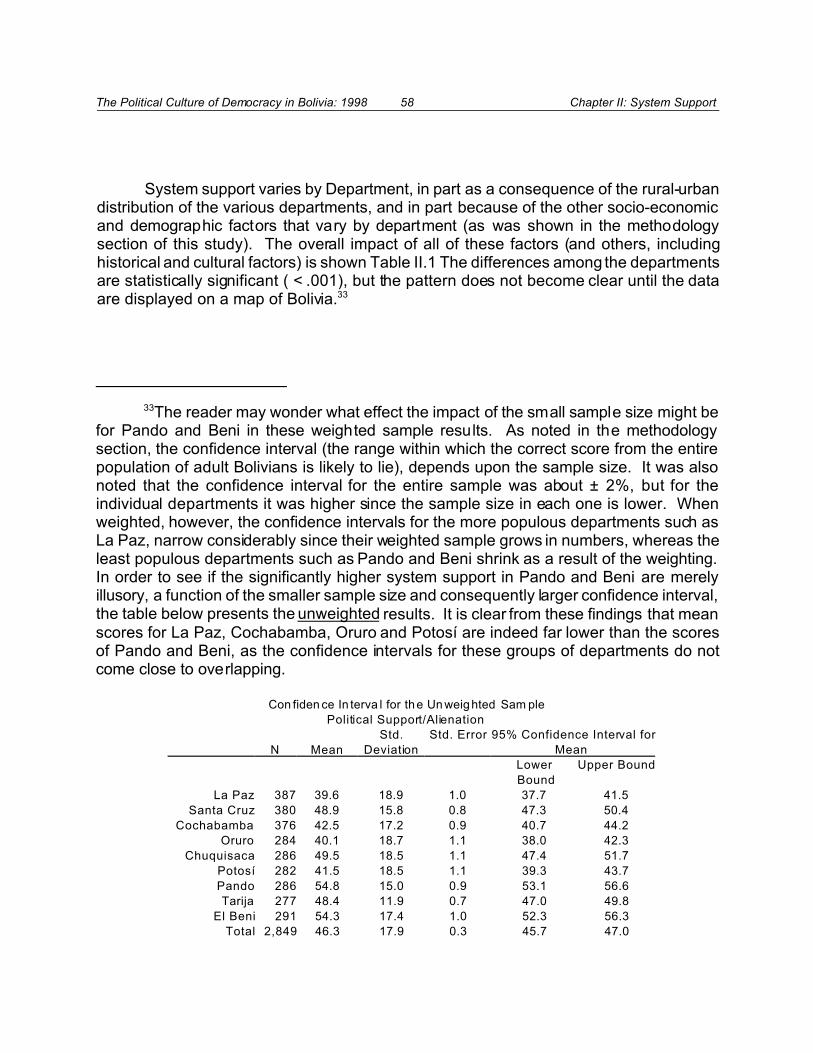
The Political Culture of Democracy in Bolivia: 1998 58 Chapter II: System Support
33The reader may wonder what effect the impact of the small sample size might befor Pando and Beni in these weighted sample results. As noted in the methodologysection, the confidence interval (the range within which the correct score from the entirepopulation of adult Bolivians is likely to lie), depends upon the sample size. It was alsonoted that the confidence interval for the entire sample was about ± 2%, but for theindividual departments it was higher since the sample size in each one is lower. Whenweighted, however, the confidence intervals for the more populous departments such asLa Paz, narrow considerably since their weighted sample grows in numbers, whereas theleast populous departments such as Pando and Beni shrink as a result of the weighting.In order to see if the significantly higher system support in Pando and Beni are merelyillusory, a function of the smaller sample size and consequently larger confidence interval,the table below presents the unweighted results. It is clear from these findings that meanscores for La Paz, Cochabamba, Oruro and Potosí are indeed far lower than the scoresof Pando and Beni, as the confidence intervals for these groups of departments do notcome close to overlapping.
Con fiden ce In terva l for the Un weighted Sam ple
Political Support/Alienation
N Mean
Std.
Deviation
Std. Error 95% Confidence Interval for
Mean
Lower
Bound
Upper Bound
La Paz 387 39.6 18.9 1.0 37.7 41.5
Santa Cruz 380 48.9 15.8 0.8 47.3 50.4
Cochabamba 376 42.5 17.2 0.9 40.7 44.2
Oruro 284 40.1 18.7 1.1 38.0 42.3
Chuquisaca 286 49.5 18.5 1.1 47.4 51.7
Potosí 282 41.5 18.5 1.1 39.3 43.7
Pando 286 54.8 15.0 0.9 53.1 56.6
Tarija 277 48.4 11.9 0.7 47.0 49.8
El Beni 291 54.3 17.4 1.0 52.3 56.3
Total 2,849 46.3 17.9 0.3 45.7 47.0
System support varies by Department, in part as a consequence of the rural-urbandistribution of the various departments, and in part because of the other socio-economicand demographic factors that vary by department (as was shown in the methodologysection of this study). The overall impact of all of these factors (and others, includinghistorical and cultural factors) is shown Table II.1 The differences among the departmentsare statistically significant ( < .001), but the pattern does not become clear until the dataare displayed on a map of Bolivia.33

The Political Culture of Democracy in Bolivia: 1998 59 Chapter II: System Support
Table II.1. Political Support/Alienation
by Department
Department Mean N
Std.
Deviation
La Paz 39.63 845 18.89
Santa Cruz 48.85 606 15.79
Cochabamba 42.49 519 17.15
Oruro 40.14 139 18.73
Chuquisaca 49.51 202 18.55
Potosí 41.52 271 18.53
Pando 54.80 20 15.38
Tarija 48.42 131 11.89
El Beni 54.27 127 17.45
Total 44.16 2,860 18.09
Sig. < .001
When the system support levels are displayed on a map of the country, as they arein Figure II.1, it is clear that there are three clusters of departments: 1) the cluster in theWest, consisting of La Paz, Cochabamba, Oruro and Potosí, with low levels of systemsupport; 2) the cluster in the East, consisting of Santa Cruz, Chuquisaca and Tarija, withintermediate levels of system support; and 3) remote Beni and Pando, with the highestlevels of system support. It is important for policy makers to know that these regionaldifferences exist in Bolivia since democracy programming could be targeted geographicallybased on these results.
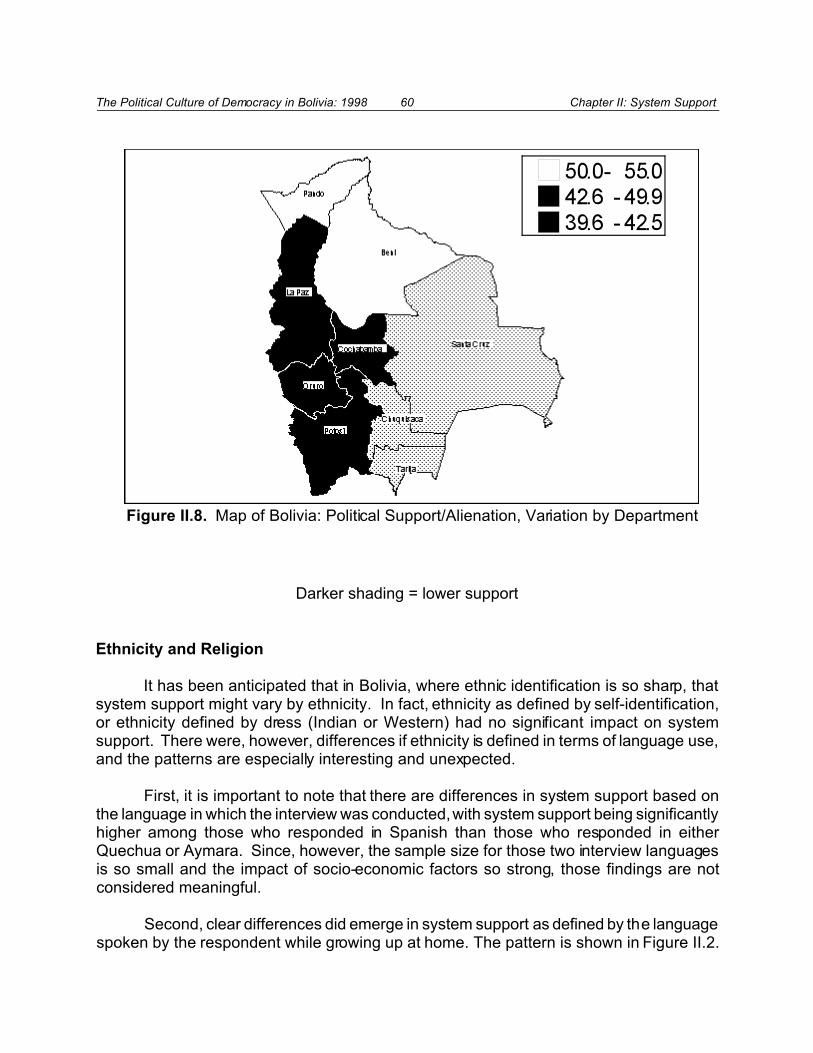
The Political Culture of Democracy in Bolivia: 1998 60 Chapter II: System Support
Figure II.8. Map of Bolivia: Political Support/Alienation, Variation by Department
Darker shading = lower support
Ethnicity and Religion
It has been anticipated that in Bolivia, where ethnic identification is so sharp, thatsystem support might vary by ethnicity. In fact, ethnicity as defined by self-identification,or ethnicity defined by dress (Indian or Western) had no significant impact on systemsupport. There were, however, differences if ethnicity is defined in terms of language use,and the patterns are especially interesting and unexpected.
First, it is important to note that there are differences in system support based onthe language in which the interview was conducted, with system support being significantlyhigher among those who responded in Spanish than those who responded in eitherQuechua or Aymara. Since, however, the sample size for those two interview languagesis so small and the impact of socio-economic factors so strong, those findings are notconsidered meaningful.
Second, clear differences did emerge in system support as defined by the languagespoken by the respondent while growing up at home. The pattern is shown in Figure II.2.
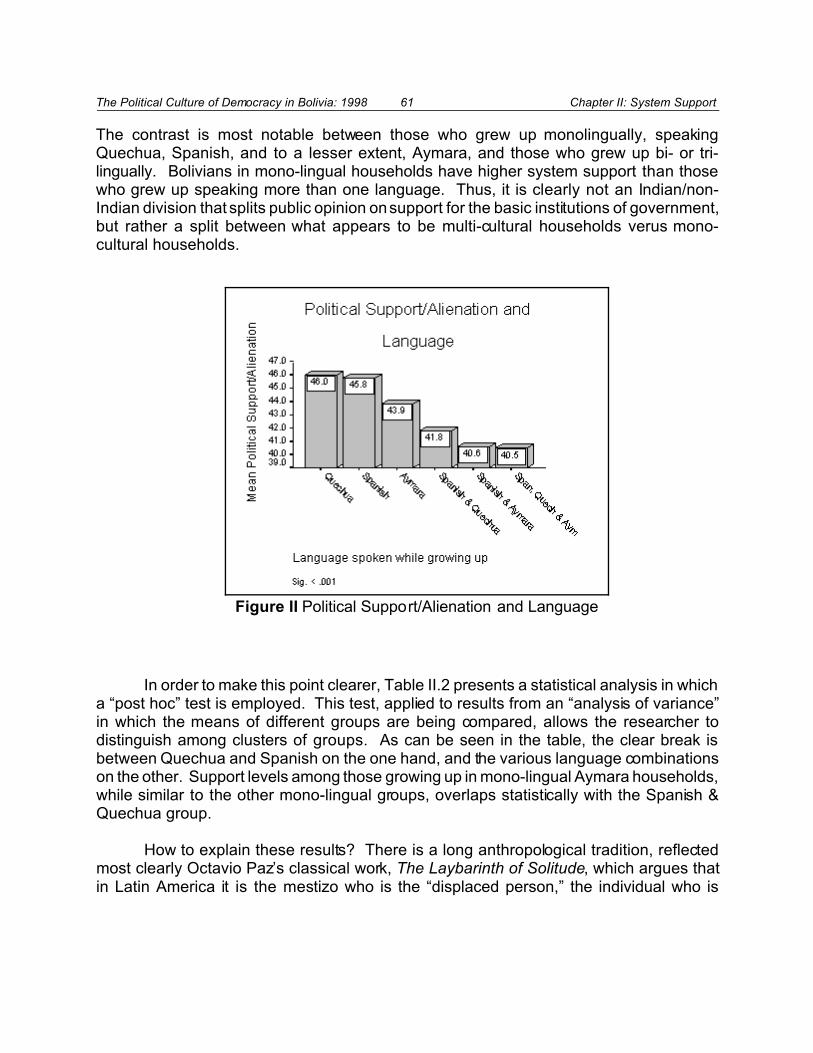
The Political Culture of Democracy in Bolivia: 1998 61 Chapter II: System Support
Figure II Political Support/Alienation and Language
The contrast is most notable between those who grew up monolingually, speakingQuechua, Spanish, and to a lesser extent, Aymara, and those who grew up bi- or tri-lingually. Bolivians in mono-lingual households have higher system support than thosewho grew up speaking more than one language. Thus, it is clearly not an Indian/non-Indian division that splits public opinion on support for the basic institutions of government,but rather a split between what appears to be multi-cultural households verus mono-cultural households.
In order to make this point clearer, Table II.2 presents a statistical analysis in whicha “post hoc” test is employed. This test, applied to results from an “analysis of variance”in which the means of different groups are being compared, allows the researcher todistinguish among clusters of groups. As can be seen in the table, the clear break isbetween Quechua and Spanish on the one hand, and the various language combinationson the other. Support levels among those growing up in mono-lingual Aymara households,while similar to the other mono-lingual groups, overlaps statistically with the Spanish &Quechua group.
How to explain these results? There is a long anthropological tradition, reflectedmost clearly Octavio Paz’s classical work, The Laybarinth of Solitude, which argues thatin Latin America it is the mestizo who is the “displaced person,” the individual who is
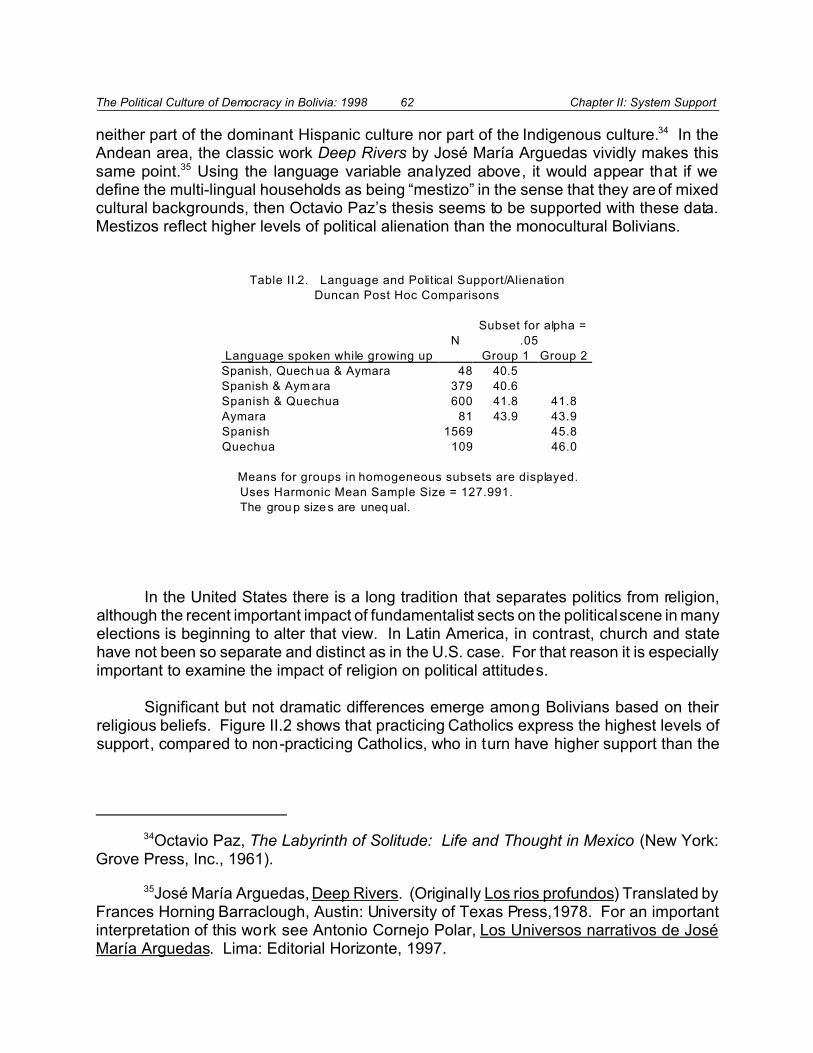
The Political Culture of Democracy in Bolivia: 1998 62 Chapter II: System Support
34Octavio Paz, The Labyrinth of Solitude: Life and Thought in Mexico (New York:Grove Press, Inc., 1961).
35José María Arguedas, Deep Rivers. (Originally Los rios profundos) Translated byFrances Horning Barraclough, Austin: University of Texas Press,1978. For an importantinterpretation of this work see Antonio Cornejo Polar, Los Universos narrativos de JoséMaría Arguedas. Lima: Editorial Horizonte, 1997.
neither part of the dominant Hispanic culture nor part of the Indigenous culture.34 In theAndean area, the classic work Deep Rivers by José María Arguedas vividly makes thissame point.35 Using the language variable analyzed above, it would appear that if wedefine the multi-lingual households as being “mestizo” in the sense that they are of mixedcultural backgrounds, then Octavio Paz’s thesis seems to be supported with these data.Mestizos reflect higher levels of political alienation than the monocultural Bolivians.
Table II.2. Language and Political Support/Alienation
Duncan Post Hoc Comparisons
N
Subset for alpha =
.05
Language spoken while growing up Group 1 Group 2
Spanish, Quech ua & Aymara 48 40.5
Spanish & Aym ara 379 40.6
Spanish & Quechua 600 41.8 41.8
Aymara 81 43.9 43.9
Spanish 1569 45.8
Quechua 109 46.0
Means for groups in homogeneous subsets are displayed.
Uses Harmonic Mean Sample Size = 127.991.
The grou p size s are uneq ual.
In the United States there is a long tradition that separates politics from religion,although the recent important impact of fundamentalist sects on the political scene in manyelections is beginning to alter that view. In Latin America, in contrast, church and statehave not been so separate and distinct as in the U.S. case. For that reason it is especiallyimportant to examine the impact of religion on political attitudes.
Significant but not dramatic differences emerge among Bolivians based on theirreligious beliefs. Figure II.2 shows that practicing Catholics express the highest levels ofsupport, compared to non-practicing Catholics, who in turn have higher support than the
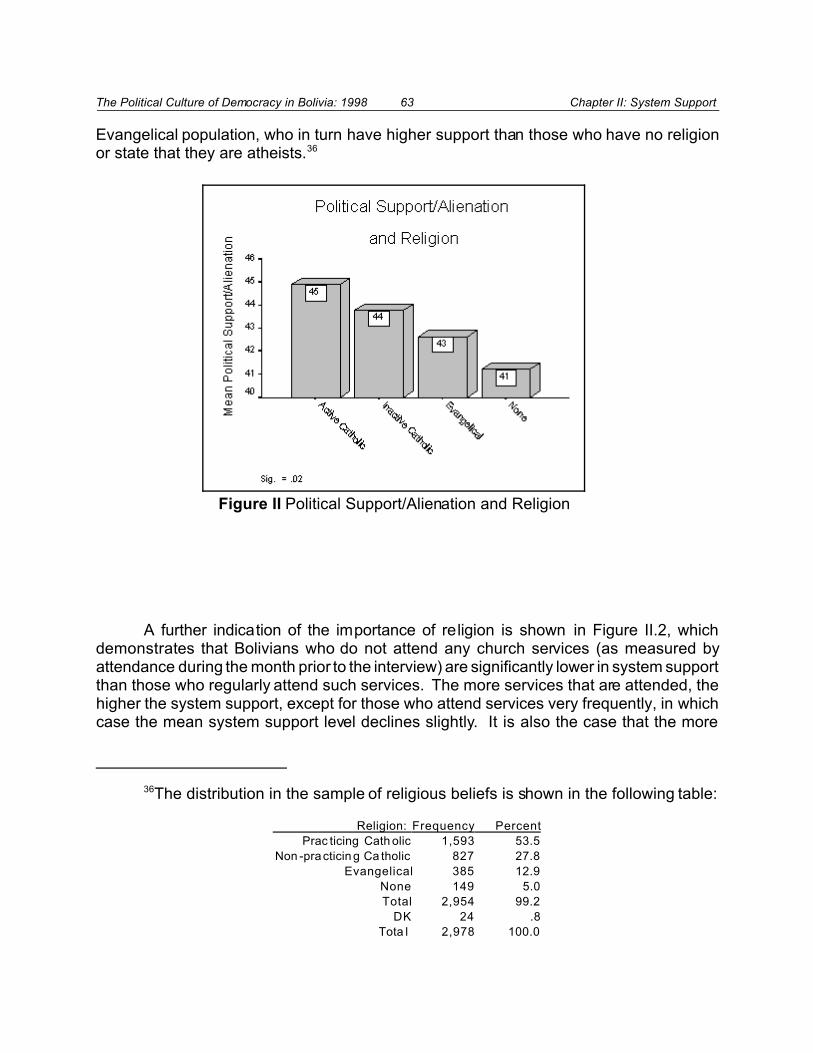
The Political Culture of Democracy in Bolivia: 1998 63 Chapter II: System Support
36The distribution in the sample of religious beliefs is shown in the following table:
Religion: Frequency Percent
Prac ticing Cath olic 1,593 53.5
Non -practicin g Ca tholic 827 27.8
Evangelical 385 12.9
None 149 5.0
Total 2,954 99.2
DK 24 .8
Tota l 2,978 100.0
Figure II Political Support/Alienation and Religion
Evangelical population, who in turn have higher support than those who have no religionor state that they are atheists.36
A further indication of the importance of religion is shown in Figure II.2, whichdemonstrates that Bolivians who do not attend any church services (as measured byattendance during the month prior to the interview) are significantly lower in system supportthan those who regularly attend such services. The more services that are attended, thehigher the system support, except for those who attend services very frequently, in whichcase the mean system support level declines slightly. It is also the case that the more
The Political Culture of Democracy in Bolivia: 1998 64 Chapter II: System Support
Figure II Political Support/Alienation and AttendanceAt Religious Services
frequently that Bolivians pray, the higher is their system support, but the difference is notstatistically significant.
Ideology and Political Preference
Attention is now turned from demographic, socio-economic, ethnic and religiouscharacteristics of Bolivians to their political belief systems. In some ways, political beliefsare as enduring as religious beliefs; in the United States, for example, individual partyidentification changes less often than religious preference. There is, of course, the agingprocess that occurs in individuals, which sometimes moves them toward a moreconservative political point of view as they grow older, but since that trend tends to becommon across all individuals as they age, there is an underlying constancy in ideologicalbeliefs. How does ideology, and its expression in terms of evaluation of political leadersand party preference relate to system support in Bolivia?
System support is directly associated with political ideology in Bolivia. But ideologyonly seems to matter on the right, rather than on the center or left. The survey included astandard and frequently-used political ideology question in which respondents were askedto locate themselves along a 10-point continuum from left to right. As can be seen inFigure II.2, the distribution of responses is close to the normal bell-shaped curve, except
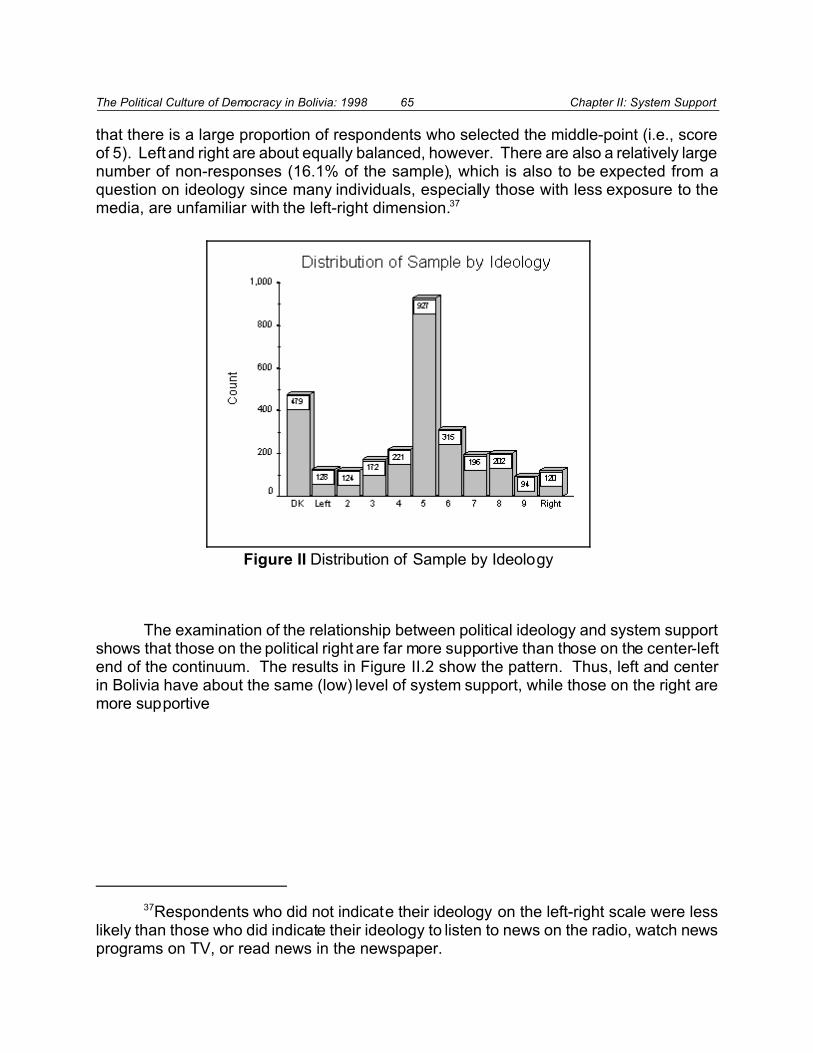
The Political Culture of Democracy in Bolivia: 1998 65 Chapter II: System Support
37Respondents who did not indicate their ideology on the left-right scale were lesslikely than those who did indicate their ideology to listen to news on the radio, watch newsprograms on TV, or read news in the newspaper.
Figure II Distribution of Sample by Ideology
that there is a large proportion of respondents who selected the middle-point (i.e., scoreof 5). Left and right are about equally balanced, however. There are also a relatively largenumber of non-responses (16.1% of the sample), which is also to be expected from aquestion on ideology since many individuals, especially those with less exposure to themedia, are unfamiliar with the left-right dimension.37
The examination of the relationship between political ideology and system supportshows that those on the political right are far more supportive than those on the center-leftend of the continuum. The results in Figure II.2 show the pattern. Thus, left and centerin Bolivia have about the same (low) level of system support, while those on the right aremore supportive

The Political Culture of Democracy in Bolivia: 1998 66 Chapter II: System Support
Figure II Political Support/Alienation and Ideology
Perception of the quality of the performance of government is also directly andstrongly linked to system support. Figure II.2 shows that those who believe that theperformance of government is “very good” are far more supportive of the overall politicalsystem than those who say that the performance of the incumbent is very poor. Thedifference between the two extremes is about 20 points on the 0-100 scale, revealing thestrongest association yet found for the system support variable.
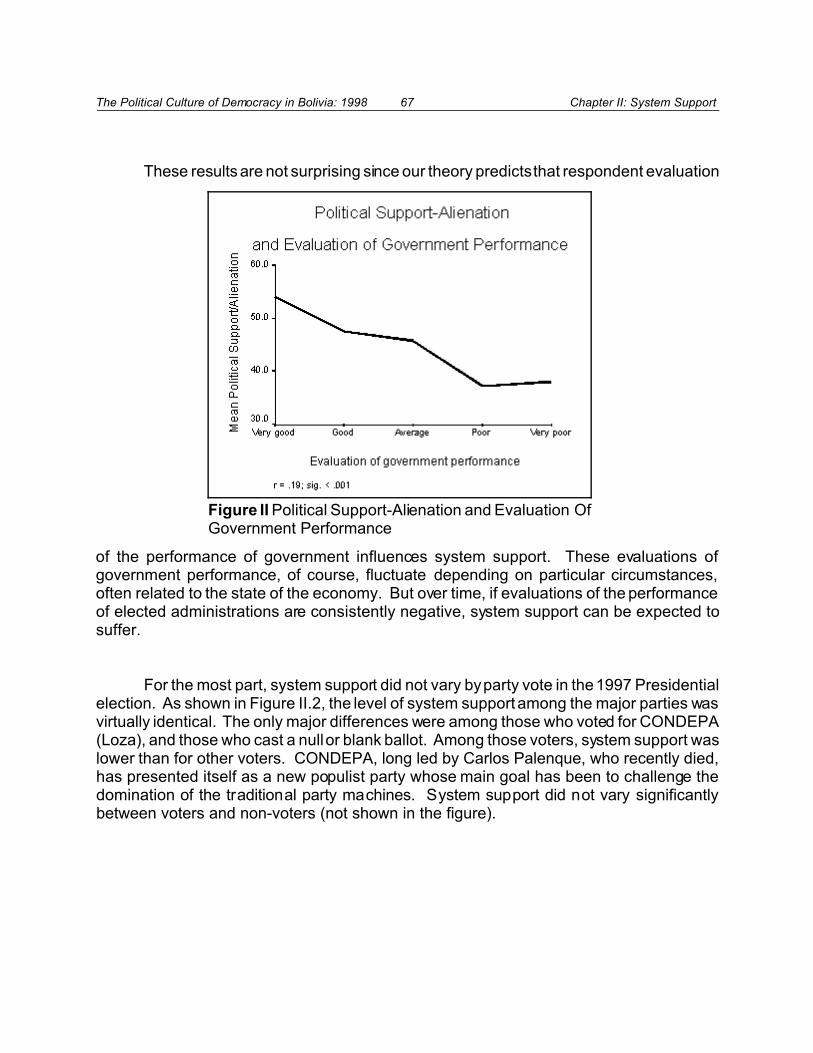
The Political Culture of Democracy in Bolivia: 1998 67 Chapter II: System Support
Figure II Political Support-Alienation and Evaluation OfGovernment Performance
These results are not surprising since our theory predicts that respondent evaluation
of the performance of government influences system support. These evaluations ofgovernment performance, of course, fluctuate depending on particular circumstances,often related to the state of the economy. But over time, if evaluations of the performanceof elected administrations are consistently negative, system support can be expected tosuffer.
For the most part, system support did not vary by party vote in the 1997 Presidentialelection. As shown in Figure II.2, the level of system support among the major parties wasvirtually identical. The only major differences were among those who voted for CONDEPA(Loza), and those who cast a null or blank ballot. Among those voters, system support waslower than for other voters. CONDEPA, long led by Carlos Palenque, who recently died,has presented itself as a new populist party whose main goal has been to challenge thedomination of the traditional party machines. System support did not vary significantlybetween voters and non-voters (not shown in the figure).

The Political Culture of Democracy in Bolivia: 1998 68 Chapter II: System Support
Figure II Political Support/Alienation and PresidentialVote, 1997
Finally, it was found that knowledge of politics was not associated with systemsupport except in one very important area: the single member district. The new“uninominal” system in Bolivia, about which more will be discussed later in this report,allows voters to cast a vote for an individual candidate for deputy. Although only 17.6%of the respondents in the survey were able to name their representative in the singlemember district, those who did were significantly higher in system support than those whocould not. These results are shown in Figure II.2.
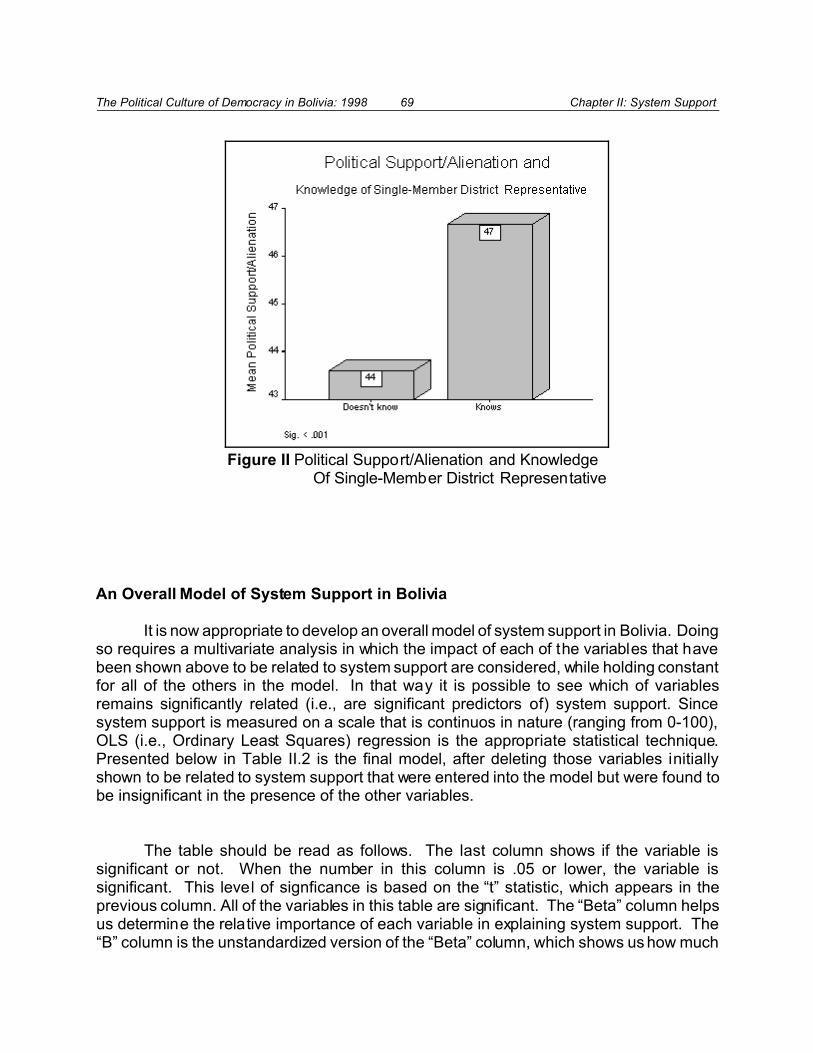
The Political Culture of Democracy in Bolivia: 1998 69 Chapter II: System Support
Figure II Political Support/Alienation and Knowledge Of Single-Member District Representative
An Overall Model of System Support in Bolivia
It is now appropriate to develop an overall model of system support in Bolivia. Doingso requires a multivariate analysis in which the impact of each of the variables that havebeen shown above to be related to system support are considered, while holding constantfor all of the others in the model. In that way it is possible to see which of variablesremains significantly related (i.e., are significant predictors of) system support. Sincesystem support is measured on a scale that is continuos in nature (ranging from 0-100),OLS (i.e., Ordinary Least Squares) regression is the appropriate statistical technique.Presented below in Table II.2 is the final model, after deleting those variables initiallyshown to be related to system support that were entered into the model but were found tobe insignificant in the presence of the other variables.
The table should be read as follows. The last column shows if the variable issignificant or not. When the number in this column is .05 or lower, the variable issignificant. This level of signficance is based on the “t” statistic, which appears in theprevious column. All of the variables in this table are significant. The “Beta” column helpsus determine the relative importance of each variable in explaining system support. The“B” column is the unstandardized version of the “Beta” column, which shows us how much

The Political Culture of Democracy in Bolivia: 1998 70 Chapter II: System Support
of a change in the dependent variable is produced by a change of 1 unit in the independentvariable. The “standard error” column is a measure of how much the B varies fromsample-to-sample, or, in other terms, it is the standard deviation of the sample distribution.
The model shows that among the socio-economic and demographic factors, theolder the respondent the lower the system support. It also shows that living in rural areasincreases system support; indeed this is the strongest predictor in the table. Higherincome and speaking only one language at home while being raised are related to highersystem support. Higher education, however, is linked to a decline in system support.Thus, we now know that the lower education levels in rural areas is only partly responsiblefor the higher levels of system support since the urban/rural variable and education bothremain significant predictors of system support. Respondents who say that religion playsan important role in their lives are more likely to express higher support for the politicalsystem, but the other measures of religion (Catholic vs. others, frequency of churchattendance and prayer) disappear as significant predictors. It is also the case that knowingthe name of the single-member district deputy, being on the right ideologically, and havinga positive evaluation of the performance of the incumbent government are factors linkedto higher system support.
Table II.2. OLS Regress ion Results: Predictors of System Sup port
Unstandardized
Coeffic ients
Standardized
Coeffic ients
B Std.
Error
Beta t Sig.
(Cons tant) 58.820 3.087 19.053 .000
Q2 Age -.063 .028 -.049 -2.218 .027
UR Urban/Rural 3.060 .321 .214 9.527 .000
INCOME Monthly income in Bolivianos 1.873 .346 .124 5.410 .000
MONOLING Monolingual upbringing 3.959 .783 .108 5.055 .000
ED Completed years of education -.366 .096 -.093 -3.798 .000
RF6r Religion is an important aspect of m y life 2.856 .624 .094 4.577 .000
GI5 Kn ows na me o f “uninom inal” depu ty 2.110 .923 .047 2.287 .022
L1 Ideolo gy (left-right) .568 .173 .067 3.291 .001
M1r Evaluation of government performance 4.317 .534 .166 8.083 .000
Adjusted r2 = .11; Sig. < .001.r = recoded from original questionnaire
Institutional Support
The focus of this investigation of political support has been on the core scale of fiveitems. In the Bolivia survey, however, a much wider range of specific political institutionswas included in the questionnaire. It is important to examine the relative degree of support

The Political Culture of Democracy in Bolivia: 1998 71 Chapter II: System Support
for each of these institutions. Each of the new items was asked using the identical seven-point scale employed for the five core items. In order to recalibrate them to the samemetric utilized for the core items, each was recoded in the same fashion yielding a 0-100range for each.
The results for the 17 items included in this series are presented in Figure II.2.There are a number of points to observe in this figure. First, a large cluster of institutionsscore in the 40s on the scale of 0-100, indicating a support somewhat in the negativerange, approximating the levels of support already seen with the system support measure.Second, two institutions fall especially low on support: political parties and the police.Parties are often rated poorly in democratic countries, but the very low rating of the policeis of concern and suggests important policy implications. Third, Congress is also low onsupport, but not dramatically lower than the large cluster of institutions in the center of thescale. Fourth, reporters and the Catholic Church are far more highly supported than anygovernment institution. Fifth, although the difference is not great, among governmentinstitutions, the municipality is more trusted than the others. It is interesting to note thatin a number of Latin American countries, municipal presidents have been successfulnational presidential candidates (e.g., Ecuador, Nicaragua). Each of these findings hasprogrammatic policy implications for those interested in strengthening democracy.
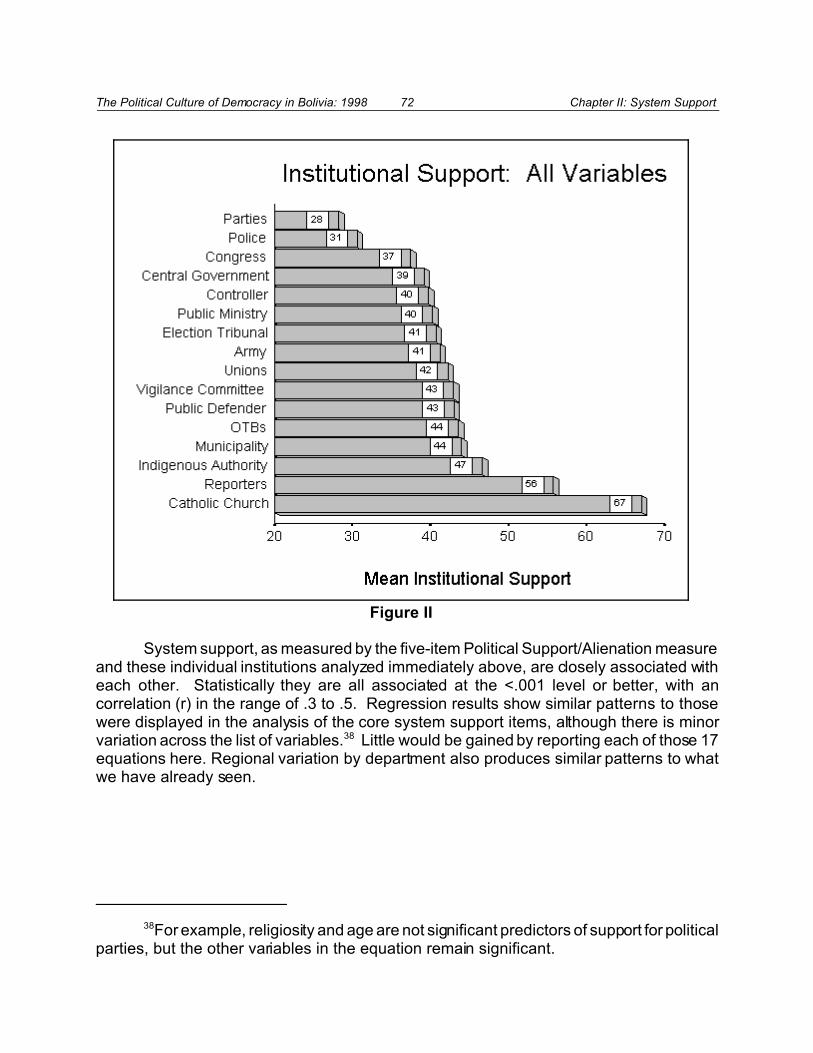
The Political Culture of Democracy in Bolivia: 1998 72 Chapter II: System Support
38For example, religiosity and age are not significant predictors of support for politicalparties, but the other variables in the equation remain significant.
Figure II
System support, as measured by the five-item Political Support/Alienation measureand these individual institutions analyzed immediately above, are closely associated witheach other. Statistically they are all associated at the <.001 level or better, with ancorrelation (r) in the range of .3 to .5. Regression results show similar patterns to thosewere displayed in the analysis of the core system support items, although there is minorvariation across the list of variables.38 Little would be gained by reporting each of those 17equations here. Regional variation by department also produces similar patterns to whatwe have already seen.
The Political Culture of Democracy in Bolivia: 1998 73 Chapter II: System Support
Conclusions
The ability of political leaders to generate support is critical to the long term survivalof any democracy. In Bolivia, it has been found that in system support is far lower than itis in a stable democracy like that of Costa Rica, but is marginally higher than in Peru.Increasing support will not occur over night and will depend crucially on the efficacy ofBolivia’s elected leaders in the years to come. The study has shown that there is a verystrong linkage between evaluation of the efficacy of the system’s performance and systemsupport, but that this association is not linked to party or candidate preference. If currentand future governments can succeed in meeting the expectations of the population, theseresults suggest that system support will increase and democratic political stability, so longabsent in Bolivia, will be achieved.
What will make this process more difficult, however, is that at present the mosthighly educated Bolivians express lower support than those with the lowest levels ofeducation, and that those in urban areas, where the most highly educated populationresides, is far lower than in rural areas. Since Bolivia, like all countries in Latin America,is undergoing a rapid process of urbanization, the challenge to increase support will be adifficult one. On the other hand, system support is positively linked with active churchattendance, an indication that civil society participation might be an important factor inraising such support. That is a subject to which this study will turn in Chapter IV.
The Political Culture of Democracy in Bolivia: 1998 74 Chapter III: Political Tolerance
39Adam Przeworski, Democracy and the Market (New York: Cambridge UniversityPress, 1991), p. 51.
40John L. Sullivan, James E. Pierson, and George E. Marcus, Political Toleranceand American Democracy (Chicago: University of Chicago Press 1982).
41For an application of this methodology to minorities in Israel and Costa Rica see:Mitchell A. Seligson, and Dan Caspi, `Arabs in Israel: Political Tolerance and EthnicConflict', The Journal of Applied Behavioral Science 19 (February 1983), 55-66; MitchellA. Seligson, and Dan Caspi, ̀ Toward and Empirical Theory of Tolerance: Radical Groupsin Israel and Costa Rica', Comparative Political Studies 15 (1983b), 385-404; and MitchellA. Seligson, and Dan Caspi, ̀ Threat, Ethnicity and Education: Tolerance Toward the CivilLiberties of the Arab Minority in Israel (in Hebrew)', Megamot 15 (May 1982), 37-53.
Chapter III. Political Tolerance
Systems may be politically stable for long periods of time, undergirded by high levelsof system support. But such systems are not necessarily democratic. In order for apolitical system to be both stable and democratic, its citizens ought not only believe in thelegitimacy of the regime, but also be tolerant of the political rights of others, especiallythose with whom they disagree. When majorities of citizens are intolerant of the rights ofothers, the prospects for minority rights are dim, indeed. As Przeworski has argued, indemocracies, citizens must agree to “subject their values and interest to the interplay ofdemocratic institutions and comply with [as yet unknown] outcomes of the democraticprocess.”39 For this reason it is important to measure the tolerance of Bolivian citizens andto examine the levels encountered within various demographic, geographic and politicalsub-sets of the population. It will also be helpful to place the Bolivian case in comparativeperspective, locating it within the larger data base of which this project forms a part.
The political science literature on political tolerance is vast, and while it was initiallyconcentrated on the United States the studies have now been broadened to include manydemocratizing countries around the world. Two basic approaches to the measurement ofpolitical tolerance have been used in these studies. One of these is called the “least-liked-group” approach.40 In this method, respondents are given a list of groups, normallyincluding extremist groups of the left and right, as well as other potentially unpopulargroups such as homosexuals. The respondent selects the group that he/she likes theleast, and then is asked a series of questions about his/her willingness to extend a varietyof political rights and civil liberties to members of that group.41 The primary limitation of thisapproach, however, is that in many countries significant portions of the respondents refuse
The Political Culture of Democracy in Bolivia: 1998 75 Chapter III: Political Tolerance
42James L. Gibson, and Amanda Gouws, `Social Identity Theory and PoliticalIntolerance in South Africa', Draft, Department of Political Science, University of Houston(1998).
43Samuel C. Stouffer, Communism, Conformity and Civil Liberties (New York:Doubleday, 1955).
44Even though different measures have been utilized in the study of tolerance, itturns out that they all seem to capture the same underlying dimension. For evidence ofthis, see James L. Gibson, "Alternative Measures of Political Tolerance: Must ToleranceBe 'Least-Liked?'," American Journal of Political Science 36 May (1992): 560-77.
to select any group. This occurs for many reasons, but the net result is that for thoserespondents, no tolerance information is obtained. For example, in a recent study of SouthAfrica, only 59% of the respondents were willing to name a group.42 There is anotherimportant limitation to this approach and that is since each respondent can select adifferent group, it is difficult to compare intolerance levels across individuals. For example,in a country like Germany, where fascist parties have been outlawed since Germanyredemocratized after World War II, it would be difficult to compare intolerance responsesto those who selected the Nazi Party, for example, with those who selected a feministorganization. That is, we would tend to accept a high level of intolerance for the civilliberties of a banned political group, than for a reformist, completely legal socialorganization. A further complication with this methodology is that it is difficult to compareintolerance levels across countries since the groups that are salient in one country wouldlikely be different in another. For example, asking about tolerating members of theSandinista Party would make considerable sense in Nicaragua, but make no sense inBolivia.
The other main method of measuring tolerance is to ask a set of questions that referto the same group or groups. This method was pioneered many years ago in the UnitedStates, where the focus was on tolerance towards communism.43 This approach workedwell, so long as communists were perceived as a threat in the United States, but once thethreat of communism receded, it was impossible to assume that lowered levels ofintolerance toward communists were an indication of a general decline of intolerance. Itbecame evident that a more general approach was needed so that comparisons could bemade across time and across countries. That is the approach taken by the University ofPittsburgh Latin American Public Opinion Project.44 The four-item series on tolerance thatwe developed reads as follows:

The Political Culture of Democracy in Bolivia: 1998 76 Chapter III: Political Tolerance
This card has a scale from 1 to 10 steps, with 1 indicating that youdisapprove a lot and 10 indicating that you approve a lot.
10 Approve
9
8
7
6
5
4
3
2
Disapprove 1
The questions that follow are to learn your opinion about different ideas thatpeople have who live in Bolivia.
D1. There are people who only say bad things about the governments ofBolivia, not only the current government, but the system of Boliviangovernment. How strongly (on the scale of 1-10), would you approve ordisapprove the right to vote of these people? Please read me the number.
D2. Thinking still of those people who only say bad things about the Boliviansystem of government, how strongly do you approve or disapprove thatthose people can carry out peaceful demonstrations with the purpose ofexpressing their points of view?
D3. How strongly do you approve or disapprove that the people who onlysay bad things about the Bolivian system of government be allowed to runfor public office?
D4. Thinking still about those people who only say bad things about theBolivian system of government, how strongly do you approve or disapproveof them appearing on television to make a speech?
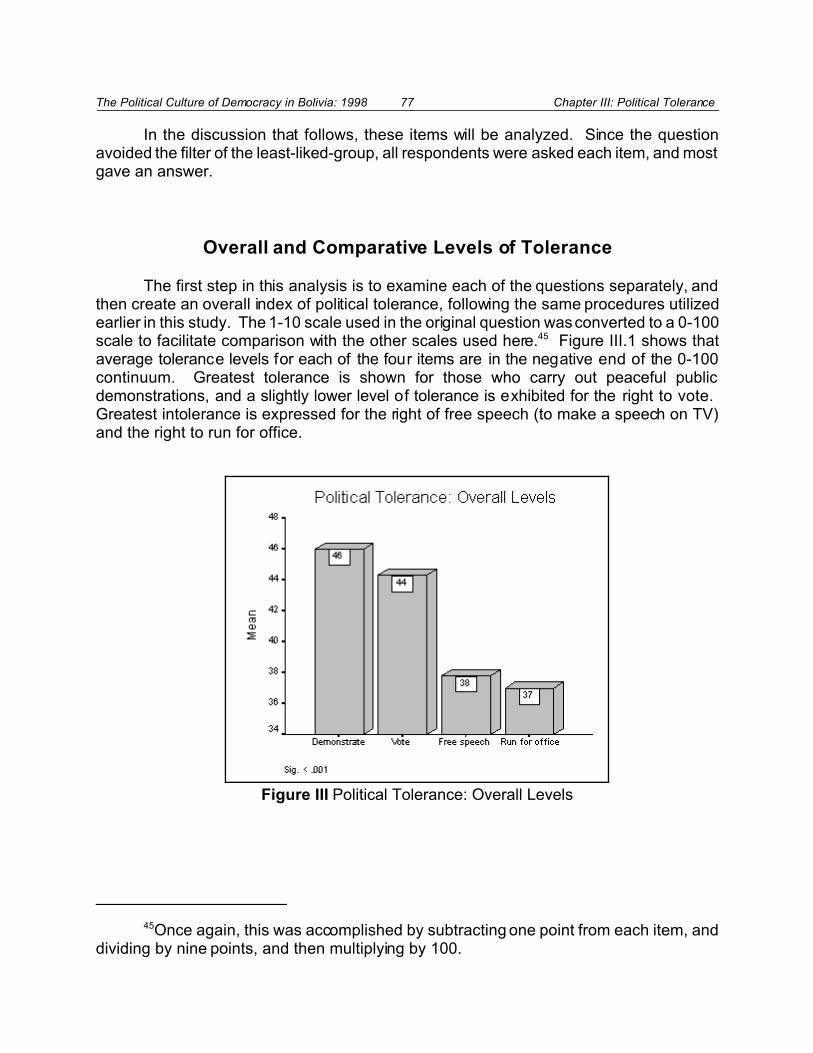
The Political Culture of Democracy in Bolivia: 1998 77 Chapter III: Political Tolerance
45Once again, this was accomplished by subtracting one point from each item, anddividing by nine points, and then multiplying by 100.
Figure III Political Tolerance: Overall Levels
In the discussion that follows, these items will be analyzed. Since the questionavoided the filter of the least-liked-group, all respondents were asked each item, and mostgave an answer.
Overall and Comparative Levels of Tolerance
The first step in this analysis is to examine each of the questions separately, andthen create an overall index of political tolerance, following the same procedures utilizedearlier in this study. The 1-10 scale used in the original question was converted to a 0-100scale to facilitate comparison with the other scales used here.45 Figure III.1 shows thataverage tolerance levels for each of the four items are in the negative end of the 0-100continuum. Greatest tolerance is shown for those who carry out peaceful publicdemonstrations, and a slightly lower level of tolerance is exhibited for the right to vote. Greatest intolerance is expressed for the right of free speech (to make a speech on TV)and the right to run for office.

The Political Culture of Democracy in Bolivia: 1998 78 Chapter III: Political Tolerance
46The scale was computed by summing up the four items and dividing by four.When a respondent gave an answer to two or three items, but did not answer one item,that respondent was assigned a score based on the mean of those questions to which ananswer was given.
Figure III Political Tolerance: Bolivia in Comparative Perspective
How high or low are these scores? We can get an idea by comparing themto the University of Pittsburgh Latin American Public Opinion Project data base used earlierin this study. Figure III.2 shows that Bolivians, on average, are notably less tolerant thanother Latin Americans. In each of the other countries, when the overall scale of toleranceis computed, the level is at the mid-point of 50 or higher, whereas in Bolivia, the overalllevel is at 41.46 These findings are certainly troubling, given the importance of a politicalculture of tolerance in helping to guard against the violation of minority rights. Theysuggest that in Bolivia, more than in the other countries in our data base, that majoritieswould be willing to allow restrictions on the rights of political minorities.
The Political Culture of Democracy in Bolivia: 1998 79 Chapter III: Political Tolerance
47For recent evidence from Russia see Donna Bahry and Stacy Burnett GordonCynthia Boaz, "Tolerance, Transition, and Support for Civil Liberties in Russia,"Comparative Political Studies 30, no. 4 August (1997): 484-510.
Correlates of Tolerance
In most studies of political tolerance conducted in the United States and abroad,education plays a major role.47 As citizens educated they learn to appreciate and respectdifferences in points of view. Education is a process by which empathy for others is ofteninculcated as one’s vistas become expanded. This process usually is most commonlyfound among those who have been exposed to a college-level education, but it sometimesoccurs as early as high school. In each of the other countries in the University ofPittsburgh Latin American Public Opinion data base that are being analyzed in this study,higher levels of education are associated with higher levels of tolerance. In Bolivia,however, not only is tolerance lower than in other countries, it does not increase with highereducation, as is shown in Figure III.2. For example, in Costa Rica, respondents withprimary education average 50 on the tolerance 0-100 scale, whereas those with auniversity education average 71. In the other countries except Bolivia the differences arenot as sharp, but the pattern is the same. Those with a university education in Bolivia,however, have virtually the same tolerance levels as those with a primary education.

The Political Culture of Democracy in Bolivia: 1998 80 Chapter III: Political Tolerance
48See Frederick D. Weil, "Tolerance of Free Speech in the United States and WestGermany, 1970-1979: An Analysis of Public Opinion Survey Data," American SociologicalReview 50 (1985): 458-74.
Figure III Tolerance and Education: Bolivia in Comparative Perspective
In combination, low tolerance and an absence of an impact of education ontolerance, are troubling findings. One must seriously question the political messages thatare being communicated in Bolivian educational institutions. Frederick D. Weil’s extensiveresearch on the United States and Germany has led him to conclude that in countrieswhere the prevailing elite norms to not emphasize tolerance, increasing education canhave little or no effect.48 It would appear from these data that something is going verywrong in Bolivia. The survey data cannot tell us what that is, of course, since that wouldrequire an examination of the school system itself, but the survey data strongly suggest
The Political Culture of Democracy in Bolivia: 1998 81 Chapter III: Political Tolerance
49In some cases, there is a significant correlation, but upon examination, therelationship is non-linear and inconsistent.
50See, for example, Mitchell A. Seligson, Joel Jutkowitz, Dinhora Azpuru and MaxLucas, La Cultura Democrática de los Guatemaltecos: Resumen (Guatemala City: ASEIS,1995); Malcolm B. Young, Mitchell A. Seligson and Joel Jutkowitz, Guatemalan Valuesand the Prospects for Democratic Development: Second Report (Arlington, VA:Development Associates, Inc, 1996), and Silvia Lucrecia del Cid Avalos Ethnicity, PoliticalCulture, and the Future of Guatemalan Democracy, Ph.D. dissertation, University ofPittsburgh, 1997 (Mitchell A. Seligson, chair).
that the democratizing messages normally associated with education in most countries arenot being transmitted, or are not being absorbed by Bolivian students. In Nicaragua, inorder to better understand the education process and its relationship to democratic values,the University of Pittsburgh administered the democratic values survey to a sample ofteachers, both public and private. It was found there that teachers, especially privateschool teachers, had levels of tolerance (and system support) higher than the mass public.One wonders what would emerge in Bolivia if a similar study were undertaken there. If itis found that Bolivian teachers are, in fact, relatively intolerant, then policy-makers mightconsider introducing a series of in-service training programs to help alter this view. On theother hand, if the teachers are tolerant, but the students are not, one would want to explorefurther what is going on in the classroom itself.
An examination of other variables that might have an association with tolerancefinds that only two, ethnic self-identification and the department of residence of therespondent, have any significant and consistent relationship with it.49 Variables such asgender, urban/rural residence, age, income, ideology, religiosity, and ethnicity that areoften linked to tolerance in other countries, show no such pattern in Bolivia.
Looking first at ethnic self-identification, Figure III.2 shows that one group, Blacks,stand out as the most tolerant. However, the sample size of the Black population is verysmall (as is the relative proportion of Blacks in Bolivia), so this finding is of limited interestto the overall study of democratic values in Bolivia. Those Bolivians who self-identify asWhite (i.e., “Blanco”) express significantly higher levels of tolerance than do otherBolivians. This finding is especially interesting in light of precisely the opposite results thathave emerged in studies conducted in Guatemala, the only country in Latin America witha larger proportion of its population that self-identified as indigenous.50 In that countryindigenous populations were found, in general, to be more tolerant than the “Ladino” (i.e.,mestizo and white) population.
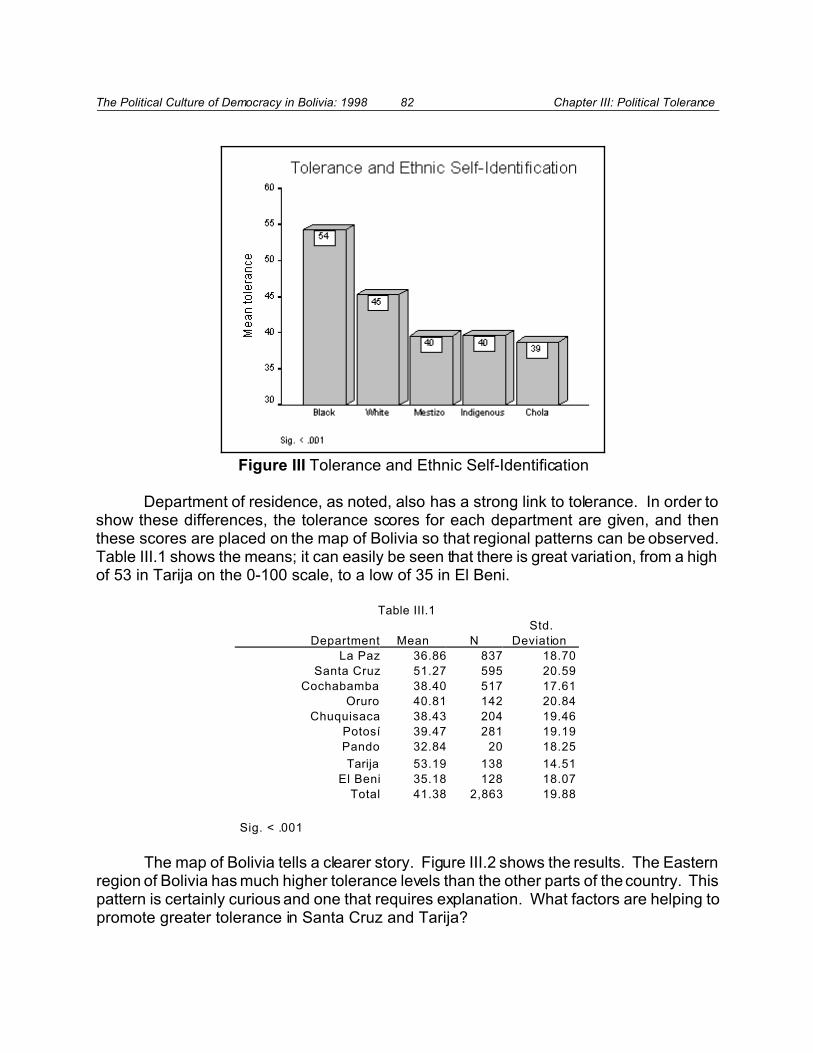
The Political Culture of Democracy in Bolivia: 1998 82 Chapter III: Political Tolerance
Figure III Tolerance and Ethnic Self-Identification
Department of residence, as noted, also has a strong link to tolerance. In order toshow these differences, the tolerance scores for each department are given, and thenthese scores are placed on the map of Bolivia so that regional patterns can be observed.Table III.1 shows the means; it can easily be seen that there is great variation, from a highof 53 in Tarija on the 0-100 scale, to a low of 35 in El Beni.
Table III.1
Department Mean N
Std.
Deviation
La Paz 36.86 837 18.70
Santa Cruz 51.27 595 20.59
Cochabamba 38.40 517 17.61
Oruro 40.81 142 20.84
Chuquisaca 38.43 204 19.46
Potosí 39.47 281 19.19
Pando 32.84 20 18.25
Tarija 53.19 138 14.51
El Beni 35.18 128 18.07
Total 41.38 2,863 19.88
Sig. < .001
The map of Bolivia tells a clearer story. Figure III.2 shows the results. The Easternregion of Bolivia has much higher tolerance levels than the other parts of the country. Thispattern is certainly curious and one that requires explanation. What factors are helping topromote greater tolerance in Santa Cruz and Tarija?

The Political Culture of Democracy in Bolivia: 1998 83 Chapter III: Political Tolerance
Figure III.5 Map of Bolivia: Variation in Political Tolerance by Department
Lighter shading = more tolerance

The Political Culture of Democracy in Bolivia: 1998 84 Chapter III: Political Tolerance
A response to that question suggests itself by thinking back about the impact ofethnic self-identification and tolerance. It was found that those who identified as “white”were more tolerant than those who identified as “indigenous” or “mestizo.” If thedistribution of the indigenous population were such that it was heavily concentrated in thetwo departments that had high intolerance levels, then this could explain the high level oftolerance found there. In order to answer that question, Table III.2 shows the level oftolerance for the largest ethnic groups (White, Mestizo and Indian) within each department.In Santa Cruz, where tolerance is high, it is high among the white population, but it is alsohigh among the mestizo and Indian populations. In La Paz, where tolerance is low, it is(especially) low among the white population. The overall pattern shows, therefore, thatethnicity is not primarily responsible for the departmental variation in tolerance levels.Thus, ethnicity and departmental residence are two factors that each separately play a rolein determining tolerance. Note that these results, as in other tables in this report, are forthe weighted sample. For that reason, very small sample sizes appear in places likePando, whereas in fact, the full 300 interviews were conducted there.
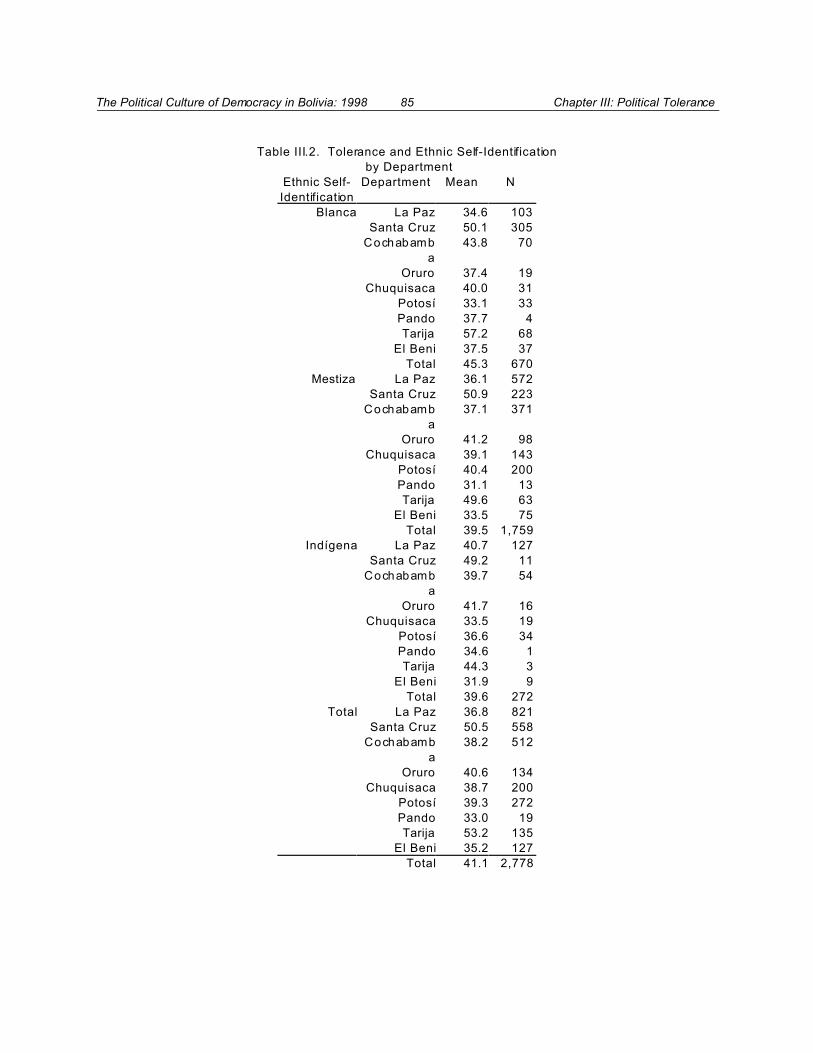
The Political Culture of Democracy in Bolivia: 1998 85 Chapter III: Political Tolerance
Table III.2. Tolerance and Ethnic Self-Identification
by Department
Ethnic Self-
Identification
Department Mean N
Blanca La Paz 34.6 103
Santa Cruz 50.1 305
Cochabamb
a
43.8 70
Oruro 37.4 19
Chuquisaca 40.0 31
Potosí 33.1 33
Pando 37.7 4
Tarija 57.2 68
El Beni 37.5 37
Total 45.3 670
Mestiza La Paz 36.1 572
Santa Cruz 50.9 223
Cochabamb
a
37.1 371
Oruro 41.2 98
Chuquisaca 39.1 143
Potosí 40.4 200
Pando 31.1 13
Tarija 49.6 63
El Beni 33.5 75
Total 39.5 1,759
Indígena La Paz 40.7 127
Santa Cruz 49.2 11
Cochabamb
a
39.7 54
Oruro 41.7 16
Chuquisaca 33.5 19
Potosí 36.6 34
Pando 34.6 1
Tarija 44.3 3
El Beni 31.9 9
Total 39.6 272
Total La Paz 36.8 821
Santa Cruz 50.5 558
Cochabamb
a
38.2 512
Oruro 40.6 134
Chuquisaca 38.7 200
Potosí 39.3 272
Pando 33.0 19
Tarija 53.2 135
El Beni 35.2 127
Total 41.1 2,778
The Political Culture of Democracy in Bolivia: 1998 86 Chapter III: Political Tolerance
51This framework was first presented in Mitchell A. Seligson and Ricardo CórdovaMacías, Perspectivas para una democracia estable en El Salvador (San Salvador: IDELA,1993). See also Mitchell A. Seligson and Ricardo Córdova M., El Salvador: De la Guerraa la Paz, una Cultura Política en Transición (San Salvador: IDELA y FUNDAUNGO, 1995).The Nicaragua study, based on the 1991 and 1995 data sets is found in Mitchell A.Seligson, Political Culture in Nicaragua: Transitions, 1991-1995. (Managua, Nicaragua:United States Agency for International Development, 1996). The discussion in this reportdraws directly on the explanatory material contained in the 1996 study.
52The scale ranges from 0-100, so the most natural cut-point is 50. In actuality,since the zero also counts as a valid value in the scale, there are 101 points to the scale,and the arithmetic division would be 50.5. In this and other studies we have used 50because it is more intuitive.
System Support and ToleranceThe theory behind this study of system support and political tolerance is that both
attitudes are needed for long-term democratic stability. Citizens must both believe in thelegitimacy of their political institutions and also be willing to tolerate the political rights ofothers. In such a system, there can be majority rule accompanying minority rights, acombination of attributes often viewed a quintessential definition of democracy.
In prior studies emerging from the University of Pittsburgh project, the relationshipbetween system support and tolerance has been explored in an effort to develop apredictive model of democratic stability. In this study, I draw on that earlier discussion inorder to remind the reader (or to present for the first time to those who have not seenthose studies) what these relationships are.51 Table III.3 represents all of the theoreticallypossible combinations of system support and tolerance when the two variables are dividedbetween high and low.52

The Political Culture of Democracy in Bolivia: 1998 87 Chapter III: Political Tolerance
53Robert Dahl, Polyarchy: Participation and Opposition. New Haven: YaleUniversity Press, 1971.
Table III.3Theoretical Relationship BetweenTolerance and System Support
in Institutionally Democratic Polities
Tolerance
System support
High Low
High Stable Democracy
AuthoritarianStability
Low UnstableDemocracy
Democracyat Risk
Let us review each cell, one-by-one. Political systems populated largely by citizenswho have high system support and high political tolerance are those political systems thatwould be predicted to be the most stable. This prediction is based on the logic that highsupport is needed in non-coercive environments for the system to be stable. If citizens donot support their political system, and they have the freedom to act, system change wouldappear to be the eventual inevitable outcome. Systems that are stable, however, will notnecessarily be democratic unless minority rights are assured. Such assurance could, ofcourse, come from constitutional guarantees, but unless citizens are willing to tolerate thecivil liberties of minorities, there will be little opportunity for those minorities to run for andwin elected office. Under those conditions, of course, majorities can always suppress therights of minorities. Systems that are both politically legitimate, as demonstrated bypositive system support and that have citizens who are reasonably tolerant of minorityrights, are likely to enjoy stable democracy.53
When system support remains high, but tolerance is low, then the system shouldremain stable (because of the high support), but democratic rule ultimately might be placedin jeopardy. Such systems would tend to move toward authoritarian (oligarchical) rule inwhich democratic rights would be restricted.
The Political Culture of Democracy in Bolivia: 1998 88 Chapter III: Political Tolerance
54Mitchell A. Seligson and John A. Booth, “Political Culture and Regime Type:Evidence from Nicaragua and Costa Rica,” Journal of Politics, Vol. 55, No. 3, August,1993, pp. 777-792. A different version appears as “Cultura política y democratización:vías alternas en Nicaragua y Costa Rica.” In Carlos Barba Solano, José Luis BarrosHorcasitas y Javier Hurtado, Transiciones a la democracia en Europa y América Latina.México: FLACSO y Universidad de Guadalajara, 1991, pp. 628-681. Also appears as“Paths to Democracy and the Political Culture of Costa Rica, Mexico and Nicaragua,” LarryDiamond, ed., Political Culture and Democracy in Developing Countries. Boulder: LynneReinner Publishers, 1994, pp. 99-130.
Low system support is the situation characterized by the lower two cells in the table,and should be directly linked to unstable situations. Instability, however, does notnecessarily translate into the ultimate reduction of civil liberties, since the instability couldserve to force the system to deepen its democracy, especially when the values tend towardpolitical tolerance. Hence, in the situation of low support and high tolerance, it is difficultto predict if the instability will result in greater democratization or a protracted period ofinstability characterized perhaps by considerable violence. On the other hand, in situationsof low support and low tolerance, democratic breakdown seems to be direction of theeventual outcome. One cannot, of course, on the basis of public opinion data alone, predicta breakdown, since so many other factors, including the role of elites, the position of themilitary and the support/opposition of international players, are crucial to this process. But,systems in which the mass public neither support the basic institutions of the nation, norsupport the rights of minorities, are vulnerable to democratic breakdown.
It is important to keep in mind two caveats that apply to this scheme. First, note thatthe relationships discussed here only apply to systems that are already institutionallydemocratic. That is, they are systems in which competitive, regular elections are held andwidespread participation is allowed. These same attitudes in authoritarian systems wouldhave entirely different implications. For example, low system support and high tolerancemight produce the breakdown of an authoritarian regime and its replacement by ademocracy. Second, the assumption being made is that over the long run, attitudes ofboth elites and the mass public make a difference in regime type. Attitudes and systemtype may remain incongruent for many years. Indeed, as Seligson and Booth have shownfor the case of Nicaragua, that incongruence might have eventually helped to bring aboutthe overthrow of the Somoza government. But the Nicaraguan case was one in which theextant system was authoritarian and repression had long been used to maintain anauthoritarian regime, perhaps in spite of the tolerant attitudes of its citizens.54
The Political Culture of Democracy in Bolivia: 1998 89 Chapter III: Political Tolerance
55If the variables were left in their original 0-100 format, the table would potentiallyhave 100 cells in each direction, making it impossible to read and interpret.
56It is important to note that the results presented here differ from those in someearlier presentations of the University of Pittsburgh Public Opinion Project. In many ofthose presentations the expanded scale of items was utilized, whereas here the focus ison the core list. In addition, in this study an algorithm is used for missing data (i.e., non-response) so as to minimize the number of missing cases in the overall scale. In thetolerance scale, when two or more of the four items are answered, the overall scale scoreis based on the valid responses. If fewer than two are answered, the case is scored asmissing. For the system support measure, a valid score is accepted when at least threeof the five questions are answered. As a result of these changes, the percentagesreported in the following tables vary somewhat from some earlier reports and publications.
57The total sample size represented in this chart = 2,791. This means that a totalof 187 of the 2,977 cases had missing data on either the tolerance or the system supportmeasure and were therefore deleted from this analysis.
Empirical Relationship Between Tolerance and System Support in Bolivia
It is now time to put together the two variables that have been the focus of thischapter by examining the joint distribution of the two variables. First, it should be notedthat system support and tolerance are positively associated with each other ( r = .13, sig.< .001). This means that those who are more tolerant are more supportive of the system.This is certainly an encouraging sign since it suggests that, at least in this case, all goodthings can go together. But the more profound question is to examine in detail how thetwo variables interrelate. To do this, both variables are dichotomized into "high" and"low."55 The overall index of tolerance was utilized, but the scale was divided into high andlow at the 50-point. System support is scaled in a similar way, and split at the 50-point todistinguish between high and low.56
The results for the Bolivia 1998 survey are shown in Table III.4.57 As can be seen,only about one-in-ten Bolivians are both supportive of their political system and expresspolitical tolerance. On the other hand, the largest cell by far is the democratic breakdowncell, in which nearly one half of all Bolivians fall. These are individuals with low systemsupport and low tolerance. Finally, between about a fifth and a quarter of Bolivians fall intothe “unstable democracy” or “authoritarian stability” cells.
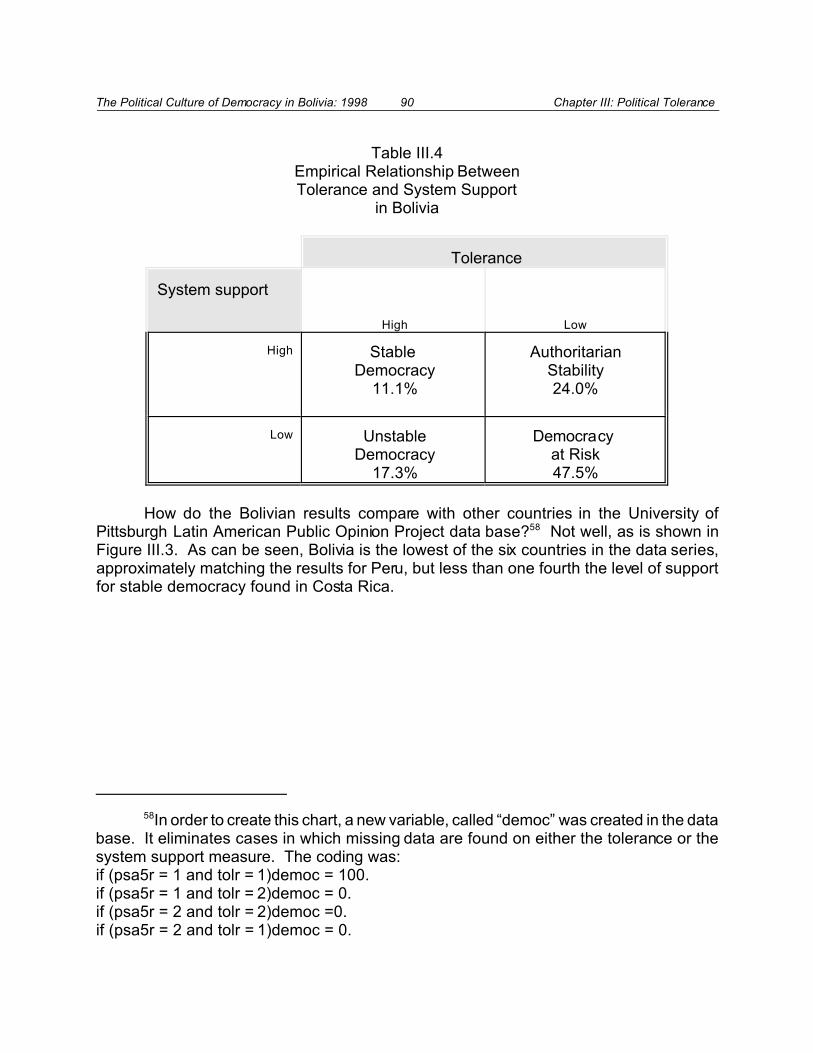
The Political Culture of Democracy in Bolivia: 1998 90 Chapter III: Political Tolerance
58In order to create this chart, a new variable, called “democ” was created in the database. It eliminates cases in which missing data are found on either the tolerance or thesystem support measure. The coding was:if (psa5r = 1 and tolr = 1)democ = 100.if (psa5r = 1 and tolr = 2)democ = 0.if (psa5r = 2 and tolr = 2)democ =0.if (psa5r = 2 and tolr = 1)democ = 0.
Table III.4Empirical Relationship BetweenTolerance and System Support
in Bolivia
Tolerance
System support
High Low
High Stable Democracy
11.1%
AuthoritarianStability24.0%
Low UnstableDemocracy
17.3%
Democracy at Risk47.5%
How do the Bolivian results compare with other countries in the University ofPittsburgh Latin American Public Opinion Project data base?58 Not well, as is shown inFigure III.3. As can be seen, Bolivia is the lowest of the six countries in the data series,approximately matching the results for Peru, but less than one fourth the level of supportfor stable democracy found in Costa Rica.
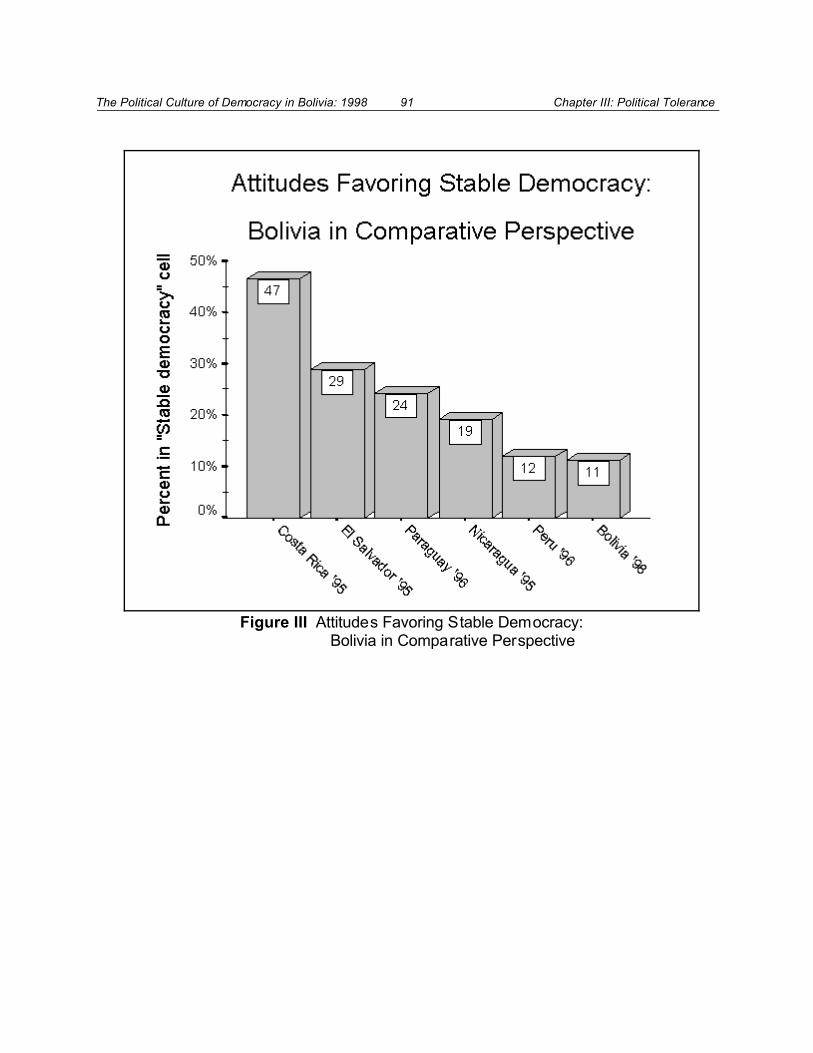
The Political Culture of Democracy in Bolivia: 1998 91 Chapter III: Political Tolerance
Figure III Attitudes Favoring Stable Democracy: Bolivia in Comparative Perspective
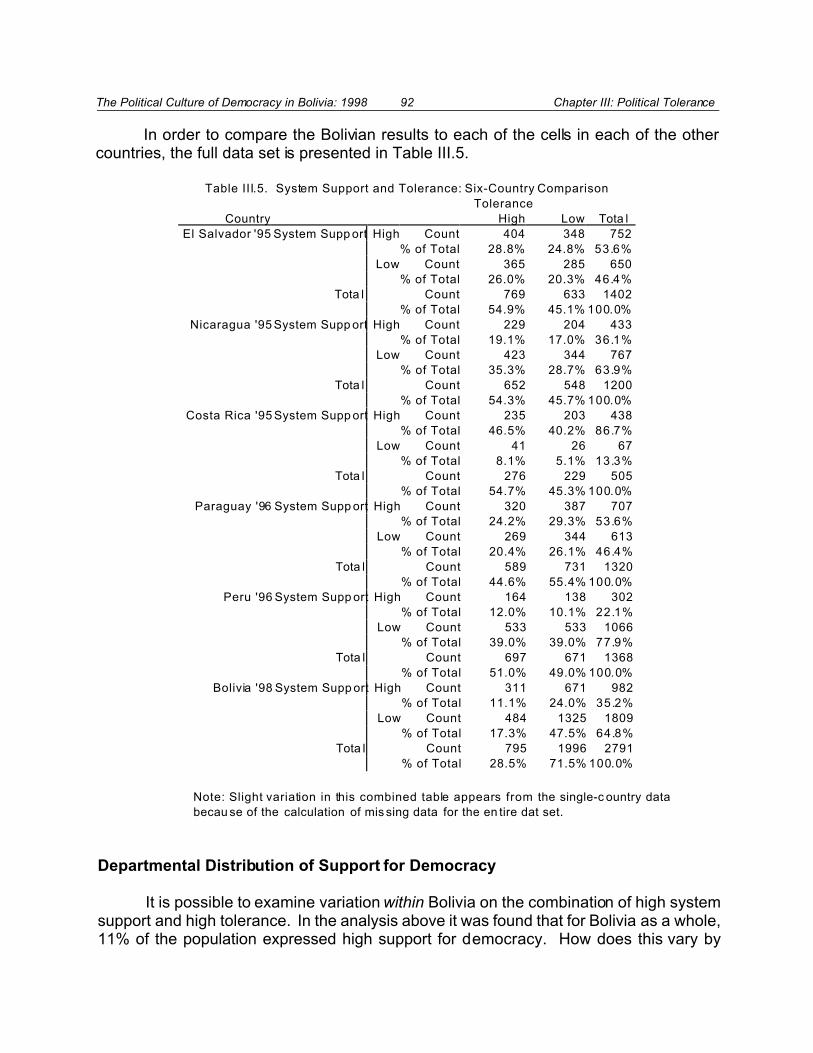
The Political Culture of Democracy in Bolivia: 1998 92 Chapter III: Political Tolerance
In order to compare the Bolivian results to each of the cells in each of the othercountries, the full data set is presented in Table III.5.
Table III.5. System Support and Tolerance: Six-Country Comparison
Tolerance
Country High Low Tota l
El Salvador '95 System Supp ort High Count 404 348 752
% of Total 28.8% 24.8% 53.6%
Low Count 365 285 650
% of Total 26.0% 20.3% 46.4%
Tota l Count 769 633 1402
% of Total 54.9% 45.1% 100.0%
Nicaragua '95 System Supp ort High Count 229 204 433
% of Total 19.1% 17.0% 36.1%
Low Count 423 344 767
% of Total 35.3% 28.7% 63.9%
Tota l Count 652 548 1200
% of Total 54.3% 45.7% 100.0%
Costa Rica '95 System Supp ort High Count 235 203 438
% of Total 46.5% 40.2% 86.7%
Low Count 41 26 67
% of Total 8.1% 5.1% 13.3%
Tota l Count 276 229 505
% of Total 54.7% 45.3% 100.0%
Paraguay '96 System Supp ort High Count 320 387 707
% of Total 24.2% 29.3% 53.6%
Low Count 269 344 613
% of Total 20.4% 26.1% 46.4%
Tota l Count 589 731 1320
% of Total 44.6% 55.4% 100.0%
Peru '96 System Supp ort High Count 164 138 302
% of Total 12.0% 10.1% 22.1%
Low Count 533 533 1066
% of Total 39.0% 39.0% 77.9%
Tota l Count 697 671 1368
% of Total 51.0% 49.0% 100.0%
Bolivia '98 System Supp ort High Count 311 671 982
% of Total 11.1% 24.0% 35.2%
Low Count 484 1325 1809
% of Total 17.3% 47.5% 64.8%
Tota l Count 795 1996 2791
% of Total 28.5% 71.5% 100.0%
Note: Slight variation in this combined table appears from the single-c ountry data
becau se of the calculation of mis sing data for the en tire dat set.
Departmental Distribution of Support for Democracy
It is possible to examine variation within Bolivia on the combination of high systemsupport and high tolerance. In the analysis above it was found that for Bolivia as a whole,11% of the population expressed high support for democracy. How does this vary by

The Political Culture of Democracy in Bolivia: 1998 93 Chapter III: Political Tolerance
59These departmental scores were computed by assigning to each respondent inthe study a value of 100 if their recoded system support and tolerance score was equal to1 in the above analysis, and 0 if their score was equal to 0.
60These clusters were determined by the Duncan post-hoc test for ANOVA results.
department?59 Figure III.3 shows the results. The departments cluster into four groups.60
La Paz and Pando make up the group with the lowest proportion of the population withsupport for democracy. The next group up is comprised of Oruro, Cochabamba andPotosí, which is in turn followed by Chuquisaca and El Beni. Finally, the most supportivegroup of departments is Tarija and Santa Cruz.
The national patterns are easier to see when this information is plotted on thenational map of Bolivia. Figure III.3 shows the results.
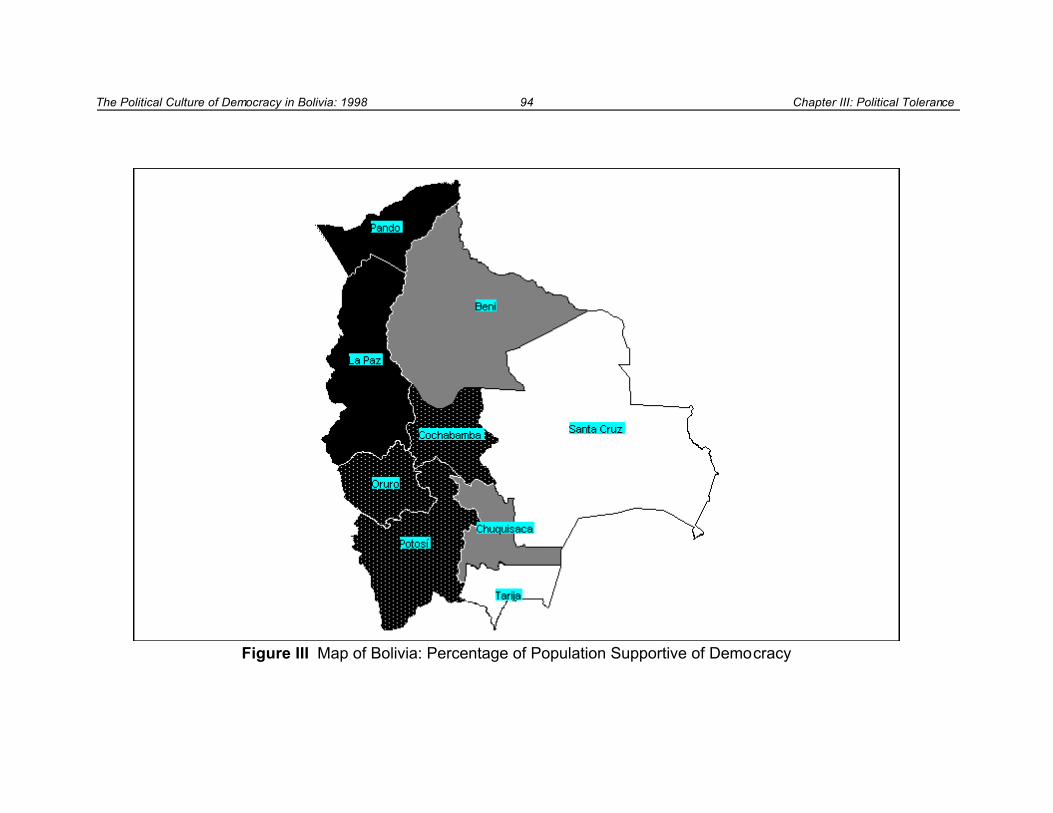
The Political Culture of Democracy in Bolivia: 1998 94 Chapter III: Political Tolerance
Figure III Map of Bolivia: Percentage of Population Supportive of Democracy

The Political Culture of Democracy in Bolivia: 1998 95 Chapter III: Political Tolerance
61Bob Altemeyer, The Authoritarian Specter. Cambridge: Harvard University Press,1996.
62Gerardo Marín and Barbara VanOss Marín, Research with Hispanic Populations(Newbury Park, California: Sage Publications, 1991).
63Two additional items formed this series, one dealing with homosexual rights andthe other dealing with supporters of the return of military rule. In Bolivia homosexual rightsare not popular with the majority of Bolivians, but since this item did not deal with a politicalgroup, per se, it was not appropriate to include in this series. The question on support forthe rights of those who favor the return of military rule was, indeed, political, but the itemitself is an odd one. Those who support the rights of those who wish to see the militarycome back to power, are those who are supporting the rights of an anti-democratic group.In Germany, for example, the Nazi Party is outlawed, and one cannot say that supportersof the rights of the Nazi Party are necessarily tolerant individuals, but may be right-wingers.In Bolivia, the same concern emerges for this item, and for that reason it was excludedfrom the new tolerance series.
Other Measures of Political ToleranceIn the previous chapter, the core series of political support was expanded to
measure support for a number of key institutions in Bolivia. The tolerance series discussedabove, which was used to compare to other countries, was also supplemented with avariety of additional measures.
In order to probe the issue of tolerance more deeply, a new series was added to thequestionnaire that was derived from the recent work of Bob Altemeyer.61 Those items arecalled the RWA (“right-wing authoritarianism) series near the end of the questionnaire.Unfortunately, because the format of the Altemeyer items requires an “agree-disagree”format, the series is inherently subject to what is known as “acquiescence response set,”or “yea-saying” which is the phenomenon that occurs when individuals of low socio-economic status agree with an item irrespective of its content. Considerable research hasshown that low-status Hispanic populations are like to be subject to acquiescenceresponse set.62 In examining the results of the RWA items, which were written so as toalternate between the “agree” response being an authoritarian response and an anti-authoritarian response, it was found that a number of those interviewed responded “agree”to both types of questions. The response set in Bolivia was strong enough to invalidate theuse of this series.
A second alternative series of tolerance items, derived from the Altemeyer work, butwhich was written in a “forced-choice” format was also included in the survey. These itemsgave each respondent two alternatives to chose from, one that reflected the authoritarianposition and the other that reflect the opposite. These four items can be found in thequestionnaire as the “Newtol1-4” items.63 The items were not susceptible to acquiesce
The Political Culture of Democracy in Bolivia: 1998 96 Chapter III: Political Tolerance
64There are also surveys from Central America from an earlier period, but these arenot analyzed here.
65Since each country in this comparison has a slightly different system of education,the groupings here are not precise, but are necessary for comparison purposes. Forexample, in Bolivia, primary education runs through 5th grade, whereas in Costa Rica itruns through the 6th. These differences, however, had no impact on the overallcomparisons since those were made with the unrecoded education levels, based on yearsof education completed.
response set because respondents could not reply “yes” to the question, but had to selectfrom among the two alternatives. The first four of these items were summed into anauthoritarianism scale, and this in turn was correlated with the tolerance measuredeveloped above. Two findings emerged. First, the two scales were positively associatedwith each other (Sig. < .001), as was expected. Second, the authoritarianism scale wasalso unrelated to education, a finding identical to the one that emerged with the originaltolerance item. In combination, these two findings help validate the tolerance scale usedin this study, and also add support to the conclusion that in Bolivia education does notseem to produce greater tolerance.
There is yet a third series of items that can be used to explore further the questionof tolerance in Bolivia. This series attempts to measure opposition to the suppression ofdemocratic liberties by the state. One drawback of the items, however, is that they maycapture opposition to state action of any kind, as well as state action to the suppressionof liberty. The items read:
Now I am going to read you some actions that the State can take. Howstrongly do you approve or disapprove, using the scale of 1-10,..
C3. Of a law that would prohibit public demonstrations?
C5. How strongly do you approve or disapprove that meetings be prohibitedof any group that might criticize the Bolivian political system?
C6. How strongly do you approve or disapprove that the Government censorpublicity of its political enemies?
In this scale, the tolerant end of the continuum is the low end, that is, disapproval of stateaction to suppress democratic liberties (the response of 1 means strong disapproval oflaws that restrict civil liberties). Recent comparable data exist for two other countries in thedata base, Paraguay and Costa Rica.64 Figure III.9 includes all three countries, andcompares the level of opposition to the suppression of democratic liberties by level ofeducation.65 Several conclusions emerge from this comparison. First, levels of politicaltolerance measured by this scale are lower in Bolivia and Paraguay than they are in Costa
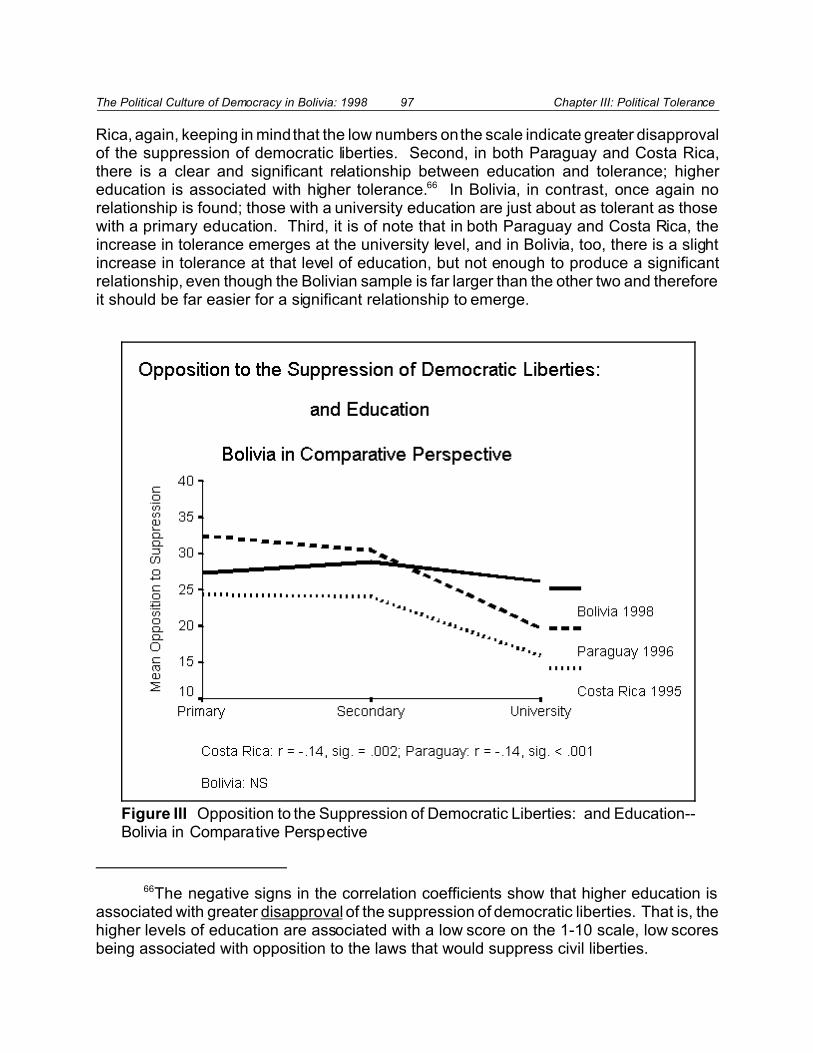
The Political Culture of Democracy in Bolivia: 1998 97 Chapter III: Political Tolerance
66The negative signs in the correlation coefficients show that higher education isassociated with greater disapproval of the suppression of democratic liberties. That is, thehigher levels of education are associated with a low score on the 1-10 scale, low scoresbeing associated with opposition to the laws that would suppress civil liberties.
Figure III Opposition to the Suppression of Democratic Liberties: and Education--Bolivia in Comparative Perspective
Rica, again, keeping in mind that the low numbers on the scale indicate greater disapprovalof the suppression of democratic liberties. Second, in both Paraguay and Costa Rica,there is a clear and significant relationship between education and tolerance; highereducation is associated with higher tolerance.66 In Bolivia, in contrast, once again norelationship is found; those with a university education are just about as tolerant as thosewith a primary education. Third, it is of note that in both Paraguay and Costa Rica, theincrease in tolerance emerges at the university level, and in Bolivia, too, there is a slightincrease in tolerance at that level of education, but not enough to produce a significantrelationship, even though the Bolivian sample is far larger than the other two and thereforeit should be far easier for a significant relationship to emerge.
The Political Culture of Democracy in Bolivia: 1998 98 Chapter III: Political Tolerance
This analysis of alternative measures of political tolerance increase our confidencein two basic findings of this chapter. First, political tolerance in Bolivia is low, and second,it does not increase with education.
ConclusionsPolitical tolerance, a key component of political culture, is especially low in Bolivia
when compared to other countries in Latin America. This, perhaps, is not surprising giventhe relatively low levels of education and economic development in the country, yet whathas been surprising and disturbing is that tolerance does not increase with education inBolivia. In other countries, increased education is closely linked to increased tolerance.
The model of stable democracy proposed here, one in which citizens ought to bothexpress support for their political system and be tolerant of the rights of political minorities,has produced very disturbing results. It was found that only 11.1% of the population hadthis combination of attitudes, the lowest of any country in our data base. Equally astroubling is that the percent of the population with values supportive of democracy is lowestin La Paz, the nation’s political nerve center.
In combination, the findings of this chapter suggest that Bolivia’s present-dayinstitutional democracy is not built on a solid foundation of a political culture supportive ofthat democracy. The 1998 survey was large enough and representative enough to be ableto make that statement with a high degree of certainty. The challenge, then, is to changeattitudes. In the chapters that follow, some key areas in which that might be done areexplored.
The Political Culture of Democracy in Bolivia: 1998 99 Chapter IV: Civil Society Participation
67See Juan J. Linz and Alfred Stepan, Problems of Democratic Transition andConsolidation: Southern Europe, South America and Post-Communist Europe (Baltimore,Md., Johns Hopkins University Press, 1996).
68Robert D. Putnam, Making Democracy Work: Civic Traditions in Modern Italy(Princeton, N.J.: Princeton University Press, 1993).
Chapter IV. Civil Society Participation
The rapid and dramatic transitions to democracy that have occurred throughout theworld since the 1980s have led many researchers to focus on civil society as a potentiallyvital element in the democracy puzzle.67 In Eastern Europe, the role that Solidarity playedin bringing down the old authoritarian communist order has been studied in detail, andmany argue that it was vital to the overthrow of the system. In Latin America, many havepointed to role of civil society in organizing the “No vote” in Chile, which resulted in thereplacement of Pinochet’s dictatorship with a competitive and economically dynamicdemocracy. In Argentina, Brazil, Guatemala and elsewhere human rights NGOs haveplayed a key role in the democratization process.
Dictatorships have long been infamous for suppressing and/or co-opting civil societyorganization. Citizens in such systems are deprived of their ability to provide collectiveexpression of their demands. Democracy, on the other hand, cultivates civil societyorganizations as a key element in the articulation of citizen demands.
In recent years political scientists, stimulated by Robert Putnam’s already classicwork, Making Democracy Work, have begun to take a more systematic look at the role ofcivil society in democracy.68 Putnam argues that the key to building democracies isthrough the development of what he has termed “social capital.” Countries with high levelsof social capital are countries in which citizens trust each other and trust their governments.This trust largely emerges from their active participation in civil society organizations.Putnam believes that the process of building social capital is a long one, but cannotprosper without an active civil society. It is for this reason that building stable democraciesin former dictatorships does not occur overnight.
How active is civil society participation in Bolivia? The data in the present studyallow us to answer that question with some precision. Numerous other studies of civilsociety merely count the number of organizations that exist in a given country or region,and presume that those counts reflect the level of activity of citizens. The democraticvalues survey conducted for this study allows a far more direct measure; the respondentswere asked about their participation in nine distinct forms of civil society organizations.The survey makes it possible not only to examine the levels of participation, but todetermine which Bolivians participate more and which less. In addition, the University of
The Political Culture of Democracy in Bolivia: 1998 100 Chapter IV: Civil Society Participation
Pittsburgh Public Opinion Project data base allows comparisons with other Latin Americancountries.
Levels of Participation
How active are Bolivians in various forms of civil society organizations? Figure IV.1shows the results for the entire sample. Participation in church and school-related groupsare by far the most popular in Bolivia, a finding that, as will be shown in a moment, issimilar for other countries in Latin America. These findings reflect the important role ofreligion in Bolivia as well as the prominence of the school in the lives of its citizens,especially for those who have children in school. What might surprise some readers,however, is the relatively high level of participation in community/neighborhooddevelopment groups (Juntas de mejoras, juntas vecinales). These organizations are farmore popular than professional associations, civic organizations (such as women’s groups,Lions Clubs, etc.), and labor unions. The OTB, or “Organización territorial de base,” is anew form of organization developed as part of the recently enacted citizen participationlaw. More will be said about participation in this form of organization in the chapter onmunicipal government.
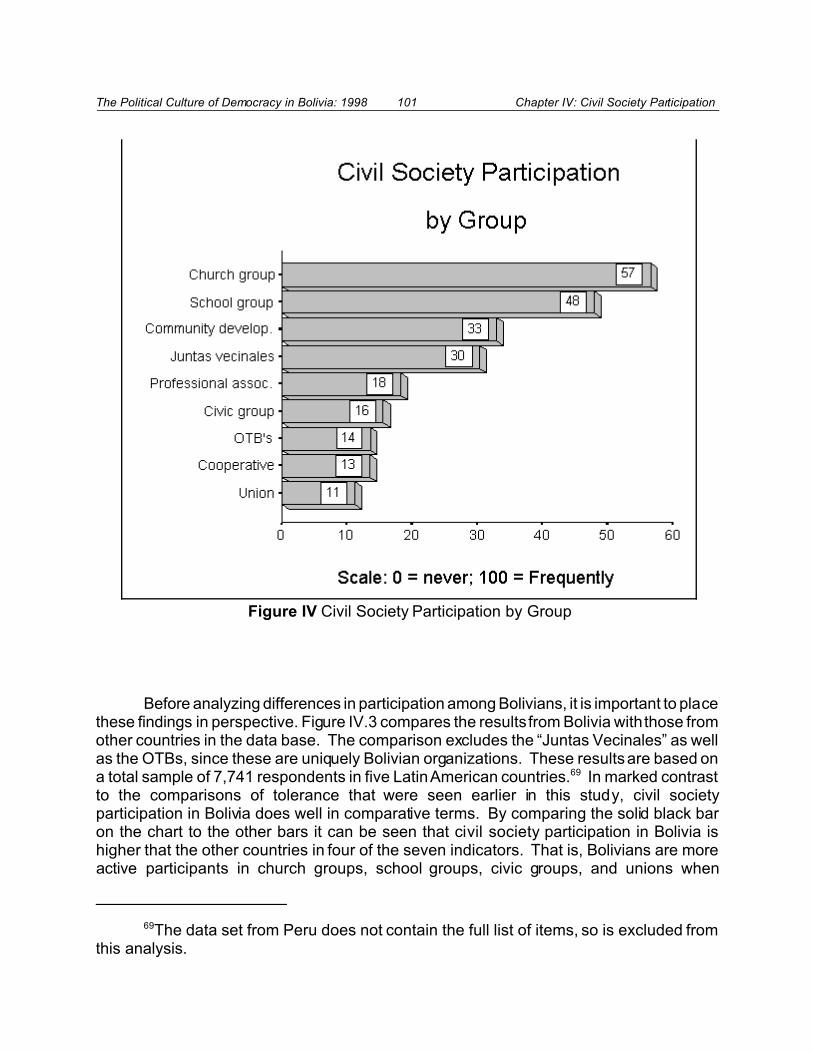
The Political Culture of Democracy in Bolivia: 1998 101 Chapter IV: Civil Society Participation
69The data set from Peru does not contain the full list of items, so is excluded fromthis analysis.
Figure IV Civil Society Participation by Group
Before analyzing differences in participation among Bolivians, it is important to placethese findings in perspective. Figure IV.3 compares the results from Bolivia with those fromother countries in the data base. The comparison excludes the “Juntas Vecinales” as wellas the OTBs, since these are uniquely Bolivian organizations. These results are based ona total sample of 7,741 respondents in five Latin American countries.69 In marked contrastto the comparisons of tolerance that were seen earlier in this study, civil societyparticipation in Bolivia does well in comparative terms. By comparing the solid black baron the chart to the other bars it can be seen that civil society participation in Bolivia ishigher that the other countries in four of the seven indicators. That is, Bolivians are moreactive participants in church groups, school groups, civic groups, and unions when

The Political Culture of Democracy in Bolivia: 1998 102 Chapter IV: Civil Society Participation
Figure IV Civil Society Participation: Bolivia in Comparative Perspective
compared to Costa Ricans, Salvadorans, Nicaraguans, and Paraguayans. In addition,Bolivia is far ahead of three of the other countries in community development organizationparticipation, only lagging behind Costa Rica. Similarly, it is second to Costa Rica inprofessional association participation, and second to Paraguay in cooperative organizationparticipation.
Determinants of Civil Society Participation
How do Bolivians differ in their level of civil society participation? When this studyhas examined differences within the population it has created an overall index of suchdemocratic values as tolerance and system support, and such an index will be utilized laterin this study. However, in order to analyze how Bolivians differ in civil society participation,it is best that each type of organization be analyzed separately so that key differences can
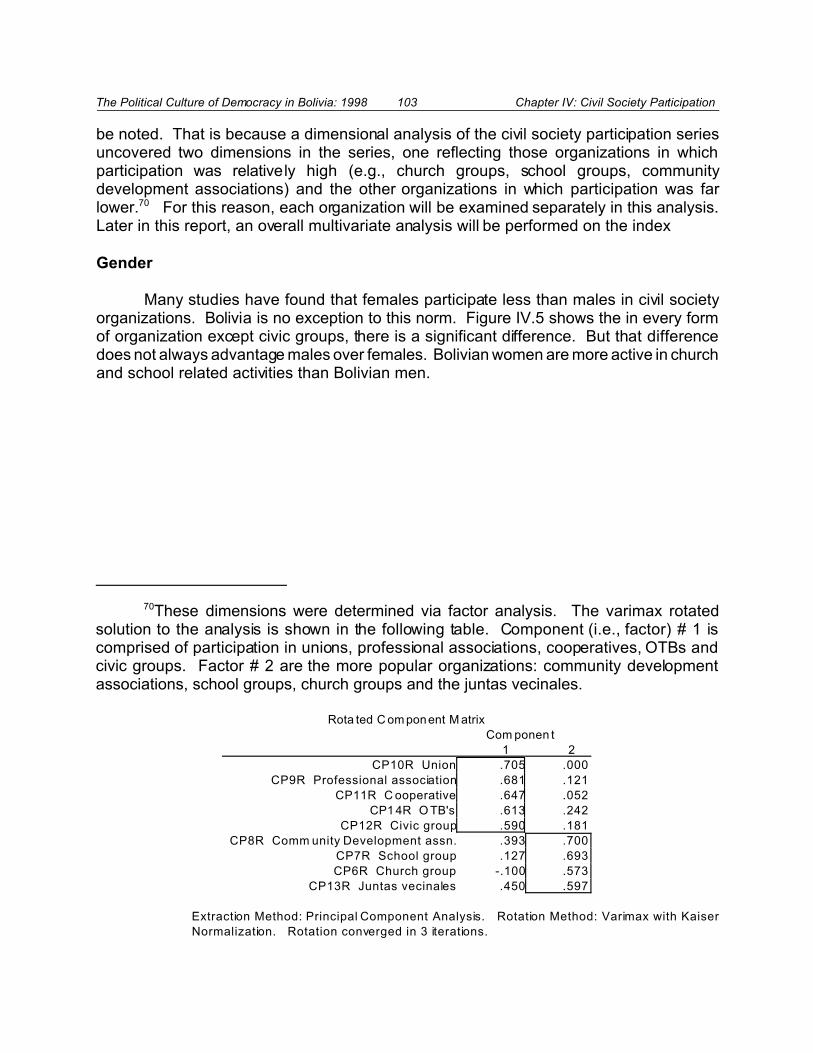
The Political Culture of Democracy in Bolivia: 1998 103 Chapter IV: Civil Society Participation
70These dimensions were determined via factor analysis. The varimax rotatedsolution to the analysis is shown in the following table. Component (i.e., factor) # 1 iscomprised of participation in unions, professional associations, cooperatives, OTBs andcivic groups. Factor # 2 are the more popular organizations: community developmentassociations, school groups, church groups and the juntas vecinales.
Rota ted C om ponent M atrix
Com ponen t
1 2
CP10R Union .705 .000
CP9R Professional association .681 .121
CP11R C ooperative .647 .052
CP1 4R O TB's .613 .242
CP12R Civic group .590 .181
CP8R Comm unity Development assn. .393 .700
CP7R School group .127 .693
CP6R Church group -.100 .573
CP13R Juntas vecinales .450 .597
Extraction Method: Principal Component Analysis. Rotation Method: Varimax with Kaiser
Normalization. Rotation converged in 3 iterations.
be noted. That is because a dimensional analysis of the civil society participation seriesuncovered two dimensions in the series, one reflecting those organizations in whichparticipation was relatively high (e.g., church groups, school groups, communitydevelopment associations) and the other organizations in which participation was farlower.70 For this reason, each organization will be examined separately in this analysis.Later in this report, an overall multivariate analysis will be performed on the index
Gender
Many studies have found that females participate less than males in civil societyorganizations. Bolivia is no exception to this norm. Figure IV.5 shows the in every formof organization except civic groups, there is a significant difference. But that differencedoes not always advantage males over females. Bolivian women are more active in churchand school related activities than Bolivian men.
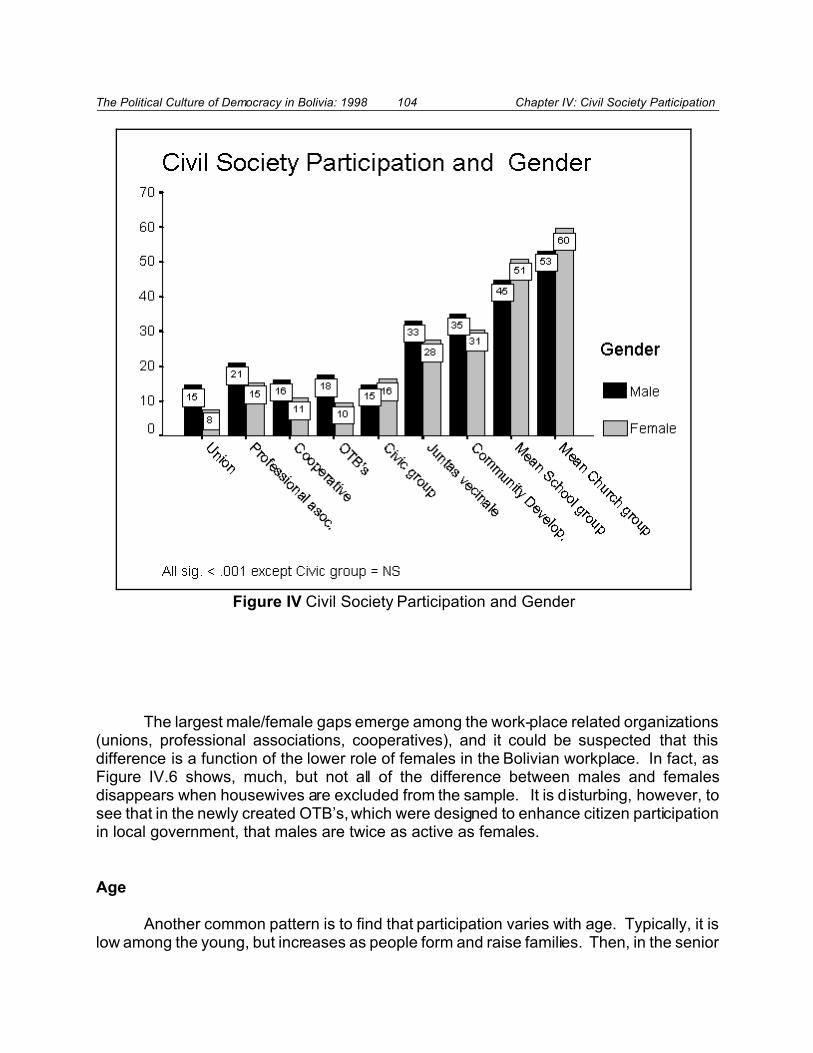
The Political Culture of Democracy in Bolivia: 1998 104 Chapter IV: Civil Society Participation
Figure IV Civil Society Participation and Gender
The largest male/female gaps emerge among the work-place related organizations(unions, professional associations, cooperatives), and it could be suspected that thisdifference is a function of the lower role of females in the Bolivian workplace. In fact, asFigure IV.6 shows, much, but not all of the difference between males and femalesdisappears when housewives are excluded from the sample. It is disturbing, however, tosee that in the newly created OTB’s, which were designed to enhance citizen participationin local government, that males are twice as active as females.
Age
Another common pattern is to find that participation varies with age. Typically, it islow among the young, but increases as people form and raise families. Then, in the senior
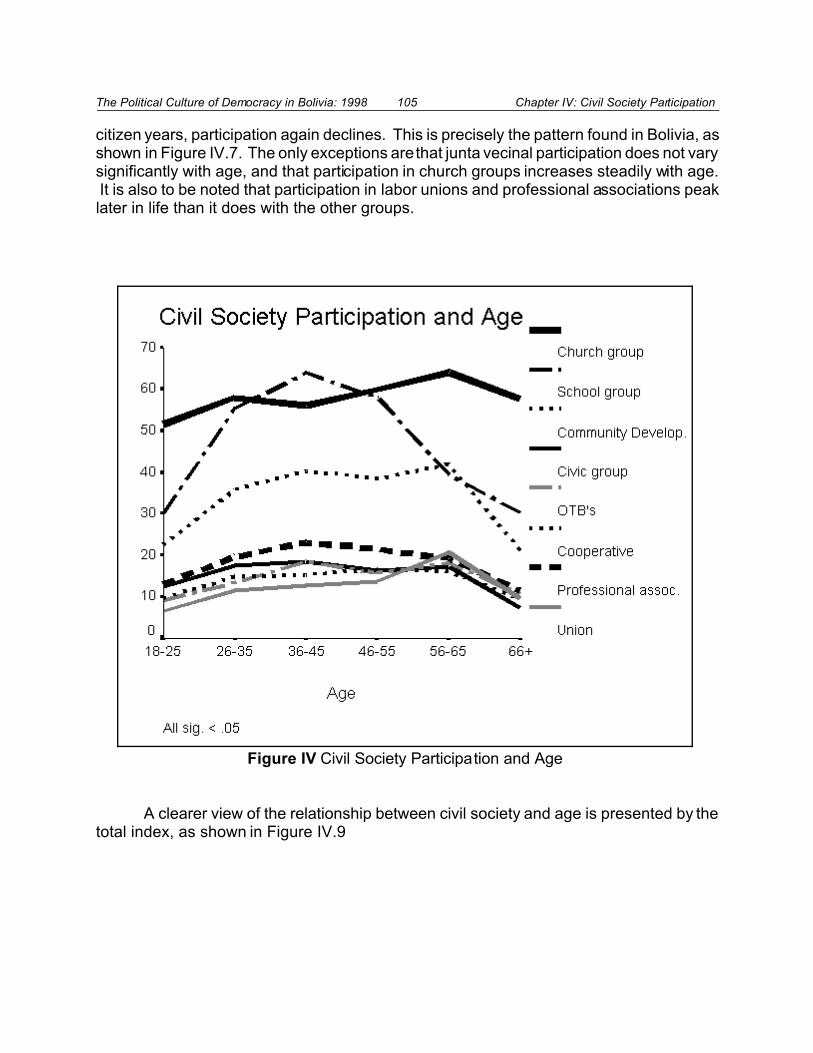
The Political Culture of Democracy in Bolivia: 1998 105 Chapter IV: Civil Society Participation
Figure IV Civil Society Participation and Age
citizen years, participation again declines. This is precisely the pattern found in Bolivia, asshown in Figure IV.7. The only exceptions are that junta vecinal participation does not varysignificantly with age, and that participation in church groups increases steadily with age. It is also to be noted that participation in labor unions and professional associations peaklater in life than it does with the other groups.
A clearer view of the relationship between civil society and age is presented by thetotal index, as shown in Figure IV.9

The Political Culture of Democracy in Bolivia: 1998 106 Chapter IV: Civil Society Participation
Figure IV
Size of Community
In Bolivia, most forms of civil society participation decline in the cities and increasein the countryside. Figure IV.11 shows the pattern, which is statistically significant for eachof the organizations. Professional association participation, however, peaks before themost remote portions of the country are reached, however.

The Political Culture of Democracy in Bolivia: 1998 107 Chapter IV: Civil Society Participation
Figure IV Civil Society Participation Size of Community
The overall pattern for the civil society combined index is shown in Figure IV.13.There it is clear that participation increases as the community becomes more rural.
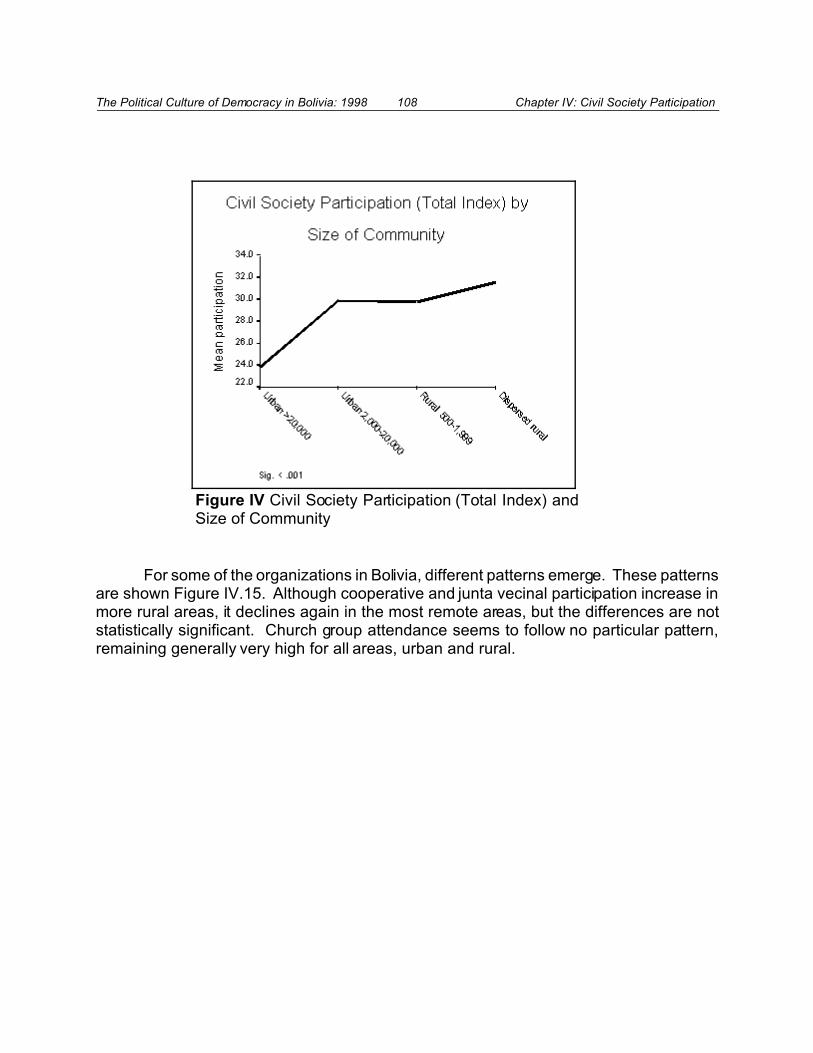
The Political Culture of Democracy in Bolivia: 1998 108 Chapter IV: Civil Society Participation
Figure IV Civil Society Participation (Total Index) andSize of Community
For some of the organizations in Bolivia, different patterns emerge. These patternsare shown Figure IV.15. Although cooperative and junta vecinal participation increase inmore rural areas, it declines again in the most remote areas, but the differences are notstatistically significant. Church group attendance seems to follow no particular pattern,remaining generally very high for all areas, urban and rural.
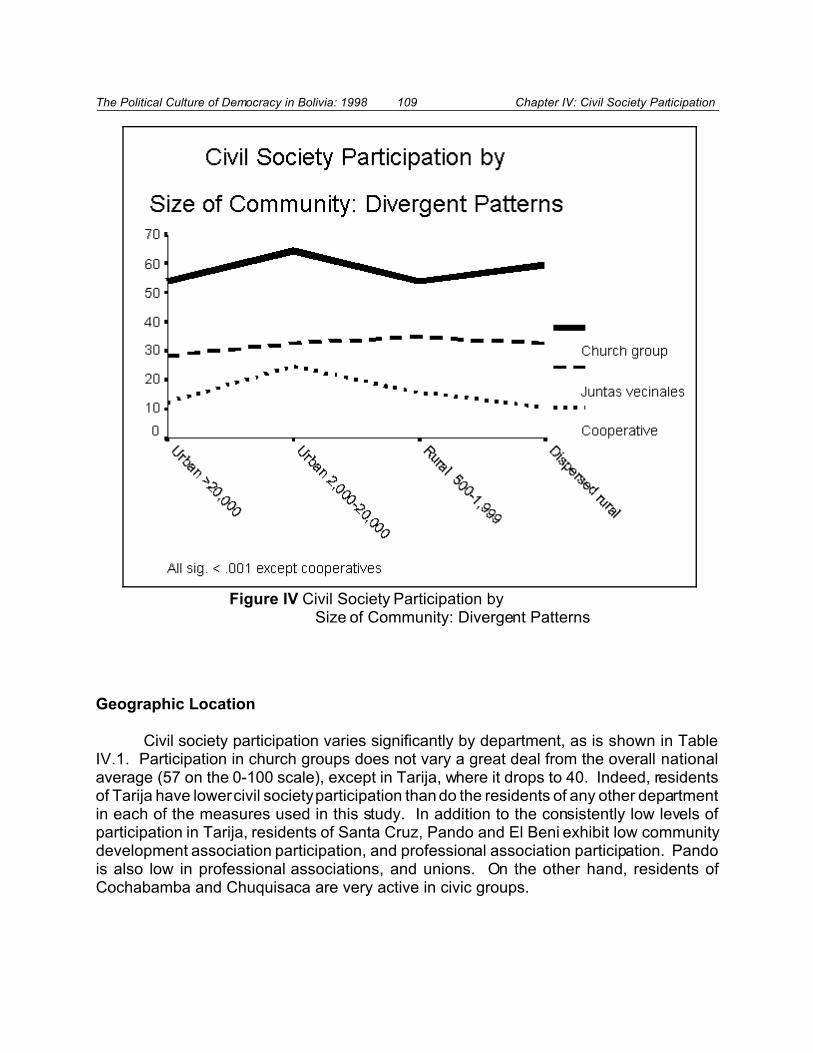
The Political Culture of Democracy in Bolivia: 1998 109 Chapter IV: Civil Society Participation
Figure IV Civil Society Participation by Size of Community: Divergent Patterns
Geographic Location
Civil society participation varies significantly by department, as is shown in TableIV.1. Participation in church groups does not vary a great deal from the overall nationalaverage (57 on the 0-100 scale), except in Tarija, where it drops to 40. Indeed, residentsof Tarija have lower civil society participation than do the residents of any other departmentin each of the measures used in this study. In addition to the consistently low levels ofparticipation in Tarija, residents of Santa Cruz, Pando and El Beni exhibit low communitydevelopment association participation, and professional association participation. Pandois also low in professional associations, and unions. On the other hand, residents ofCochabamba and Chuquisaca are very active in civic groups.

The Political Culture of Democracy in Bolivia: 1998 110 Chapter IV: Civil Society Participation
71If more than six of the nine items were missing, no score was assigned to thecase, but if six or fewer items were answered, the score assigned to the case was themean of the valid answers. The scale was reliable (Alpha = .75).
Table IV.1. Bolivian Participation in Civil Society by Department
Department
CP6
Church
group
CP7
School
group
CP8
Com mun ity
development
association
CP9
Professional
association
CP10
Union
CP11
Cooperative
CP12
Civic
group
La Paz 54 49 32 18 10 10 11
Santa Cruz 57 44 27 11 8 17 11
Cochabamba 60 48 41 27 18 21 28
Oruro 61 46 33 19 10 7 9
Chuquisaca 56 56 40 27 15 16 25
Potosí 57 55 39 22 12 11 15
Pando 61 48 27 9 8 5 13
Tarija 40 25 11 3 4 2 5
El Beni 69 53 29 12 10 11 19
Average 57 48 33 18 11 13 16
An overall index of civil society participation can be created to show nationalgeographic patterns by summing up each of the nine variables in this series and taking anaverage, based on the 0-100 scale utilized above.71 Most departments in Bolivia have asimilar level of overall civil society participation, except for Tarija, which is extremely lowcompared to the others, and Cochabamba and Chuquisaca, which have a relatively highlevel. These results are shown in Figure IV.16, which is a map of Bolivia.
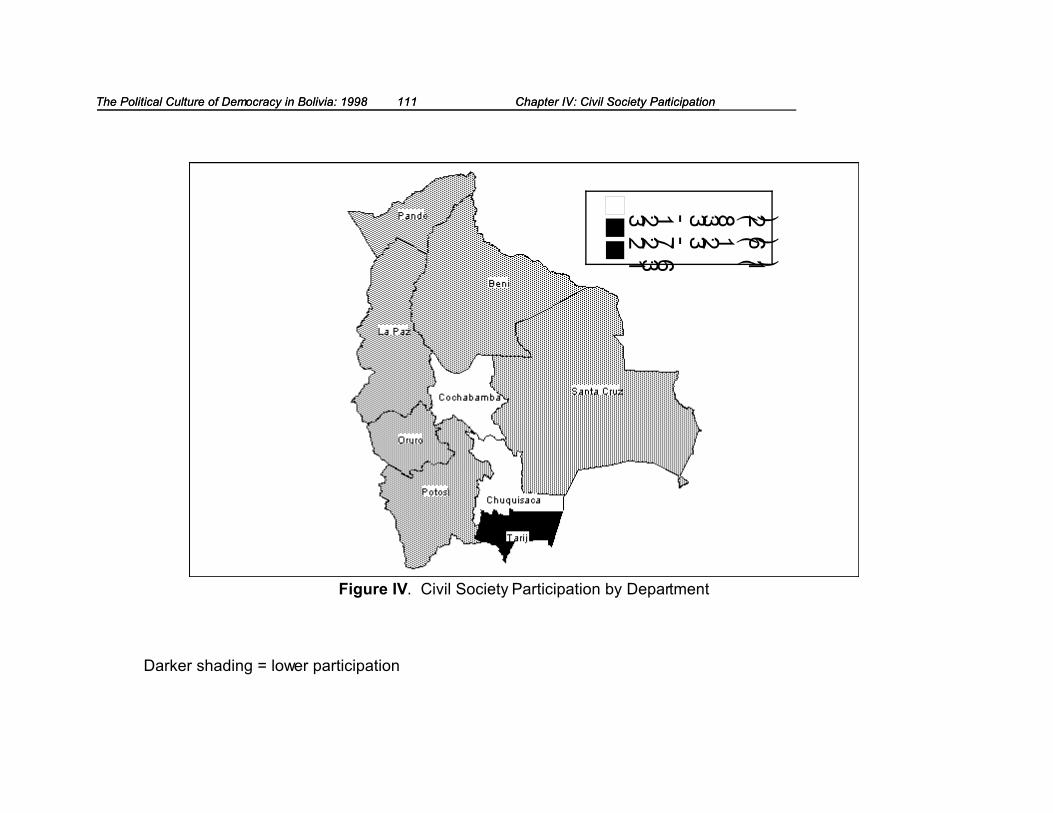
The Political Culture of Democracy in Bolivia: 1998 111 Chapter IV: Civil Society Participation The Political Culture of Democracy in Bolivia: 1998 111 Chapter IV: Civil Society Participation
Figure IV. Civil Society Participation by Department
Darker shading = lower participation
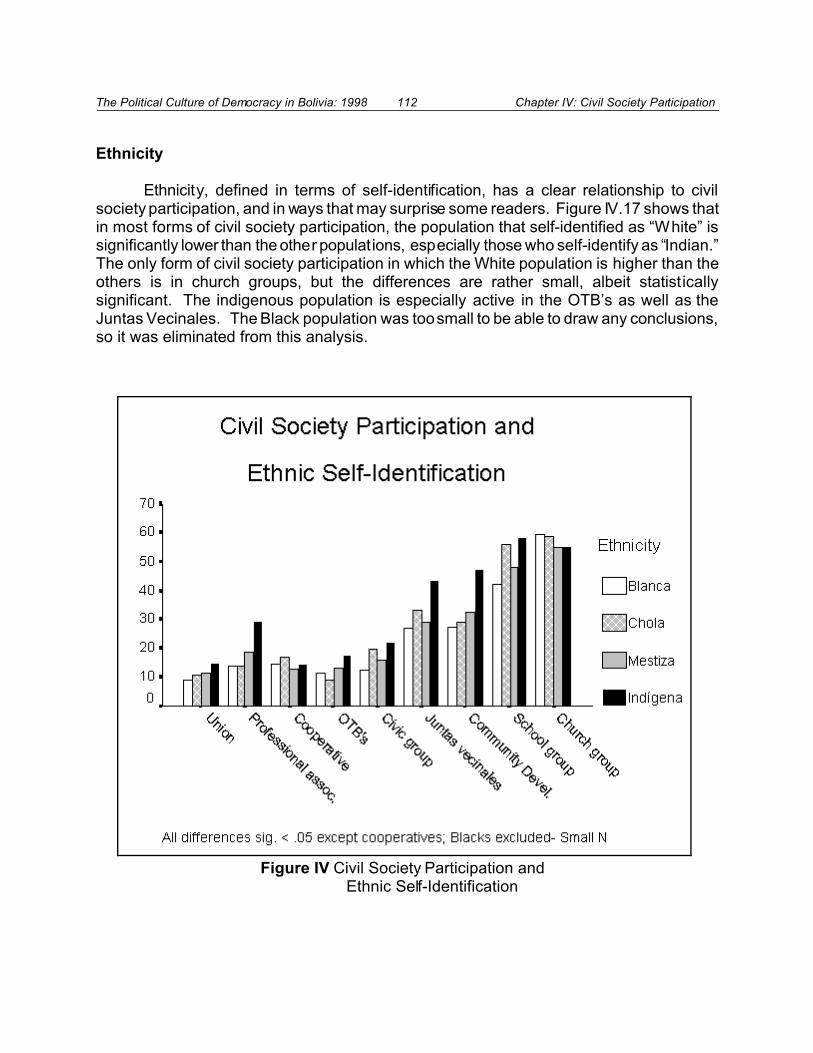
The Political Culture of Democracy in Bolivia: 1998 112 Chapter IV: Civil Society Participation
Figure IV Civil Society Participation and Ethnic Self-Identification
Ethnicity
Ethnicity, defined in terms of self-identification, has a clear relationship to civilsociety participation, and in ways that may surprise some readers. Figure IV.17 shows thatin most forms of civil society participation, the population that self-identified as “White” issignificantly lower than the other populations, especially those who self-identify as “Indian.”The only form of civil society participation in which the White population is higher than theothers is in church groups, but the differences are rather small, albeit statisticallysignificant. The indigenous population is especially active in the OTB’s as well as theJuntas Vecinales. The Black population was too small to be able to draw any conclusions,so it was eliminated from this analysis.

The Political Culture of Democracy in Bolivia: 1998 113 Chapter IV: Civil Society Participation
Figure IV Civil Society Participaiton and Indian/Western Dress
The above picture of the role of ethnicity in civil society participation is reinforcedby another measure of ethnicity: respondent dress. As noted earlier in this study,respondents were coded by the interviewers as either wearing Indian or Western clothing.This rough indication of ethnicity proved to associate well with the findings that theIndigenous population was more participant in many areas. Figure IV.19 shows theresults, in which those wearing Indian dress (according to the interviewers), weresignificantly more participant than other Bolivians in all organizations except cooperatives,OTB’s and church groups, where the differences were not significant.
Family Size
It has already been noted in the analysis of the relationship between age and civilsociety participation, that the youngest adult Bolivians exhibit lower levels of civil societyparticipation than those who are older. One reason for this, it was suggested, is that asindividuals go through the life cycle, they are more likely to form and raise families. Raising children frequently creates a number of felt-needs in people, including obtaininggood schools, safe streets, and access to health care, recreation facilities, church services,

The Political Culture of Democracy in Bolivia: 1998 114 Chapter IV: Civil Society Participation
Figure IV Civil Society Participation and Number of Children
etc. Parents can help to fulfill these needs by becoming active members of civil societyorganizations. The Bolivian data set shows a strong association between family size andcivil society participation, as is shown in Figure IV.21. For each of the nine distinct formsof civil society participation included in the survey, participation increased as the numberof children increased.
Demand-Making Participation
Citizens can actively participate in civil society without that activity spilling over intodemand-making of public officials. Yet, it is only when such demands are made is there adirect linkage between civil society and the state. For that reason it is important to see howthe comparatively high levels of civil society participate translate, or fail to translate, intodemand-making.

The Political Culture of Democracy in Bolivia: 1998 115 Chapter IV: Civil Society Participation
The survey included six questions regarding demand-making. We asked eachrespondent the following:
At times people and communities have problems that they cannot resolve bythemselves. Some try to resolve these problems asking for help from anofficial or government office. Have you sometimes asked help from:
CP1. The president of the country?CP2. A deputy?CP3. A mayor or town council member?CP3A. An indigenous authority (autoridad originaria)?CP3B. A member of the local vigilance committee?CP4. Any national or ministerial public official?
Frequency of Demand-Making
The frequency of demand-making in Bolivia is shown in Figure IV.23. It is notsurprising that contacting the president of the country to make a demand is the leastfrequent approach taken by Bolivians to help solve their local problems; only 3% have gonethis route. More surprising, especially now that half of Bolivian legislators are elected fromsingle-member districts, was that deputies were contacted by only 5% of the respondents.More than twice that percentage were in contact with other officials, with the highest beingnational officials.
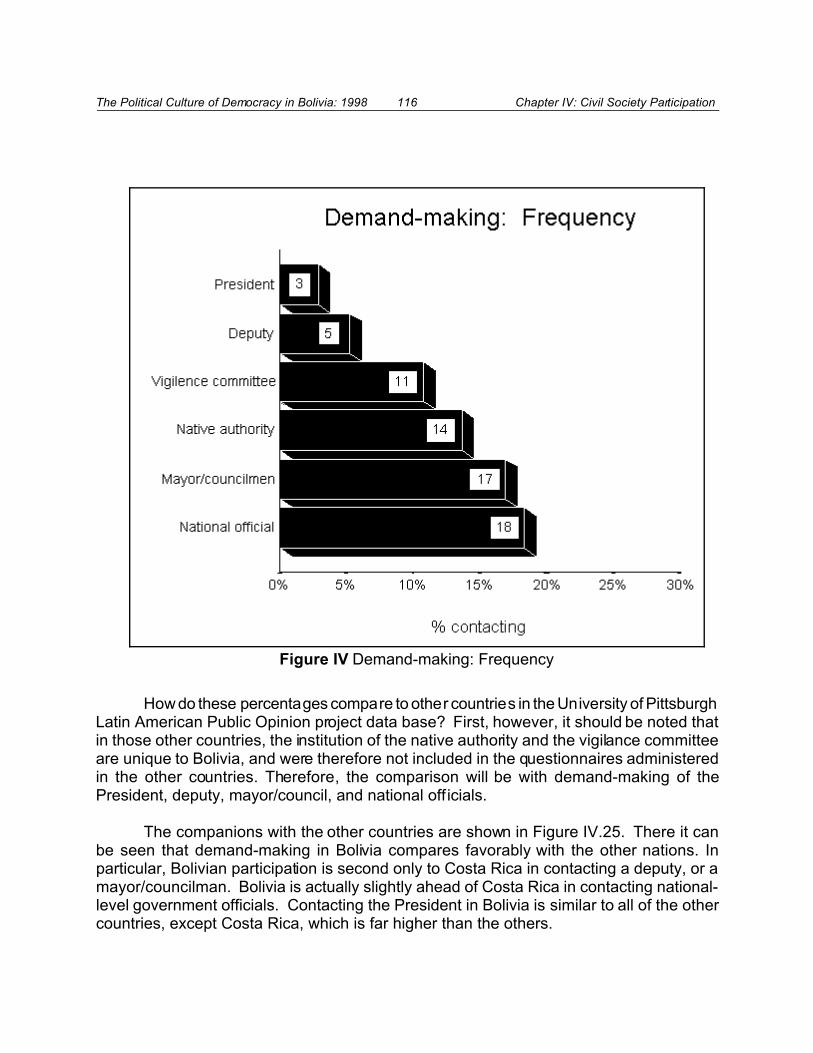
The Political Culture of Democracy in Bolivia: 1998 116 Chapter IV: Civil Society Participation
Figure IV Demand-making: Frequency
How do these percentages compare to other countries in the University of PittsburghLatin American Public Opinion project data base? First, however, it should be noted thatin those other countries, the institution of the native authority and the vigilance committeeare unique to Bolivia, and were therefore not included in the questionnaires administeredin the other countries. Therefore, the comparison will be with demand-making of thePresident, deputy, mayor/council, and national off icials.
The companions with the other countries are shown in Figure IV.25. There it canbe seen that demand-making in Bolivia compares favorably with the other nations. Inparticular, Bolivian participation is second only to Costa Rica in contacting a deputy, or amayor/councilman. Bolivia is actually slightly ahead of Costa Rica in contacting national-level government officials. Contacting the President in Bolivia is similar to all of the othercountries, except Costa Rica, which is far higher than the others.

The Political Culture of Democracy in Bolivia: 1998 117 Chapter IV: Civil Society Participation
Figure IV

The Political Culture of Democracy in Bolivia: 1998 118 Chapter IV: Civil Society Participation
Figure IV Civil Society Participation and Demand-Making
Determinants of Demand-MakingCivil Society Participaiton
There is a very close link between civil society participation and demand-making,as is shown in Figure IV.27. Fewer than five percent make demands among those whoseparticipation in civil society organizations is very low, compared to over 25 per cent whomake demands among those whose civil society participation is very high.
Gender
Gender differences in demand-making are marked and statistically significant. Theresults are shown in Figure IV.29. Men are far more likely to make demands then womenin Bolivia.
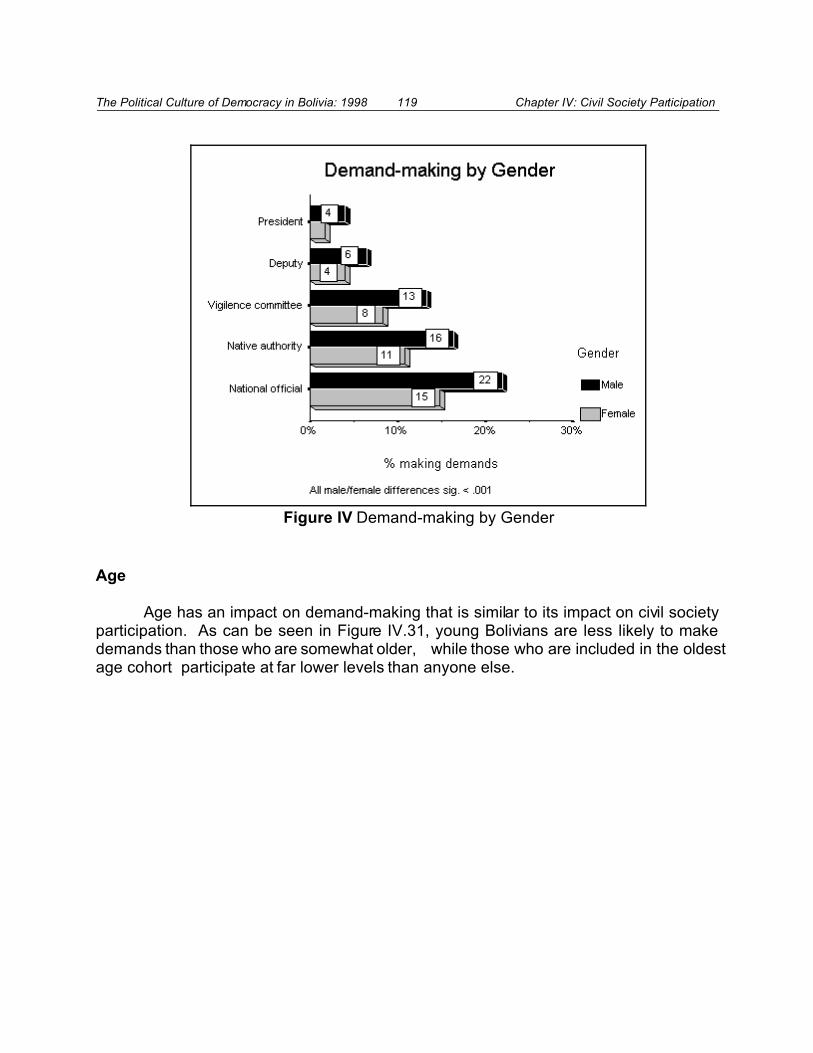
The Political Culture of Democracy in Bolivia: 1998 119 Chapter IV: Civil Society Participation
Figure IV Demand-making by Gender
Age
Age has an impact on demand-making that is similar to its impact on civil societyparticipation. As can be seen in Figure IV.31, young Bolivians are less likely to makedemands than those who are somewhat older, while those who are included in the oldestage cohort participate at far lower levels than anyone else.
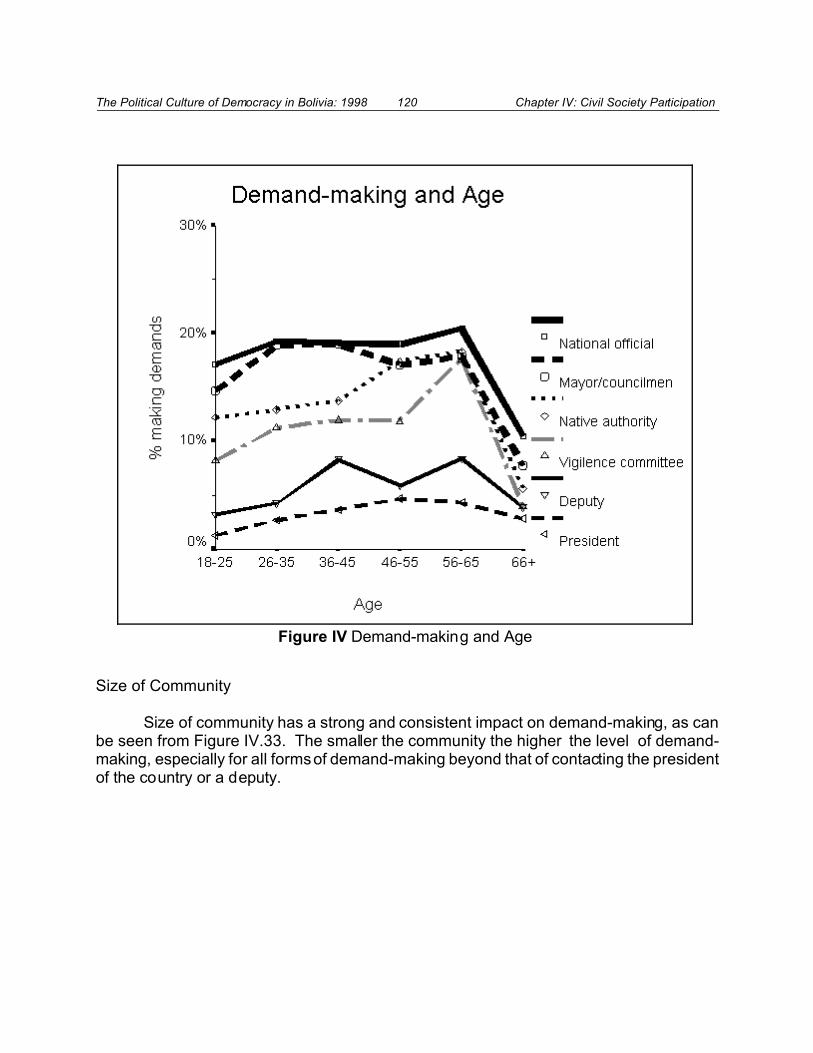
The Political Culture of Democracy in Bolivia: 1998 120 Chapter IV: Civil Society Participation
Figure IV Demand-making and Age
Size of Community
Size of community has a strong and consistent impact on demand-making, as canbe seen from Figure IV.33. The smaller the community the higher the level of demand-making, especially for all forms of demand-making beyond that of contacting the presidentof the country or a deputy.

The Political Culture of Democracy in Bolivia: 1998 121 Chapter IV: Civil Society Participation
Figure IV Demand-Making and Size of Community
Geographic Location
There is wide and statistically significant difference in the level of demand-makingin Bolivia. Table IV.2 shows the results for each of the variables being examined here. Forexample, contacts with the president, which average only 3% nation-wide, fall as low as1% in Santa Cruz and as high as 6% in Chuquisaca. However, since the sample size perdepartment is relatively small, we cannot be especially confident that these differencesrepresent real differences on this variable. More striking differences are found, however,in the other variables, where demand-making directed at deputies is reported by 15% ofthe respondents, while this form of civil society participation is undertaken by only 3% ofthose living in La Paz, Santa Cruz and Tarija. Overall, it is clear that demand-making isconsistently high in Chuquisaca, and consistently low in Santa Cruz and Tarija.
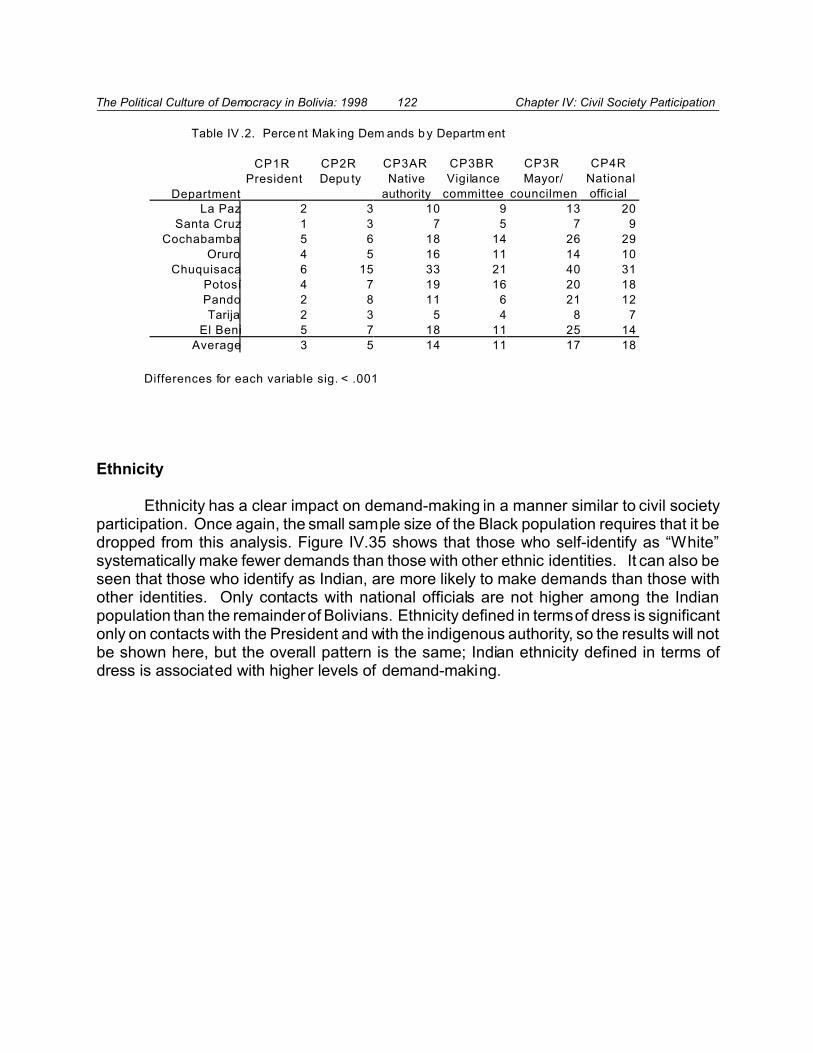
The Political Culture of Democracy in Bolivia: 1998 122 Chapter IV: Civil Society Participation
Table IV .2. Perce nt Mak ing Dem ands b y Departm ent
Department
CP1R
President
CP2R
Depu ty
CP3AR
Native
authority
CP3BR
Vigilance
committee
CP3R
Mayor/
councilmen
CP4R
National
offic ial
La Paz 2 3 10 9 13 20
Santa Cruz 1 3 7 5 7 9
Cochabamba 5 6 18 14 26 29
Oruro 4 5 16 11 14 10
Chuquisaca 6 15 33 21 40 31
Potosí 4 7 19 16 20 18
Pando 2 8 11 6 21 12
Tarija 2 3 5 4 8 7
El Beni 5 7 18 11 25 14
Average 3 5 14 11 17 18
Differences for each variable sig. < .001
Ethnicity
Ethnicity has a clear impact on demand-making in a manner similar to civil societyparticipation. Once again, the small sample size of the Black population requires that it bedropped from this analysis. Figure IV.35 shows that those who self-identify as “White”systematically make fewer demands than those with other ethnic identities. It can also beseen that those who identify as Indian, are more likely to make demands than those withother identities. Only contacts with national officials are not higher among the Indianpopulation than the remainder of Bolivians. Ethnicity defined in terms of dress is significantonly on contacts with the President and with the indigenous authority, so the results will notbe shown here, but the overall pattern is the same; Indian ethnicity defined in terms ofdress is associated with higher levels of demand-making.
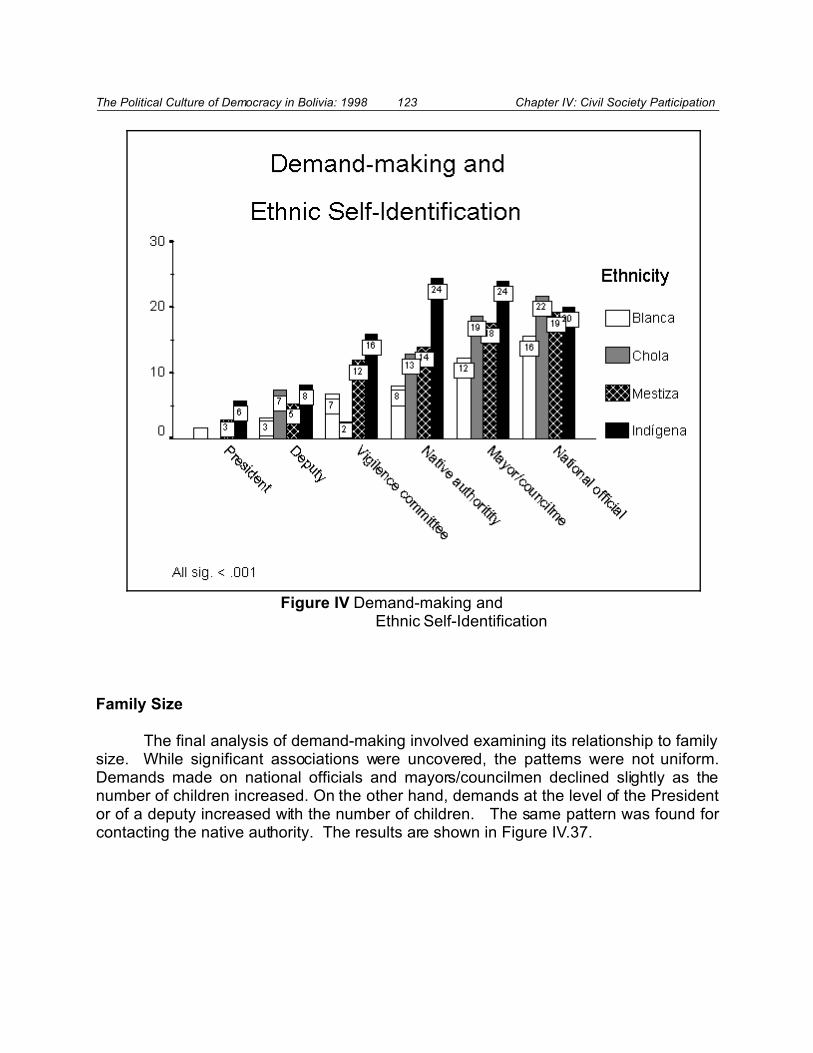
The Political Culture of Democracy in Bolivia: 1998 123 Chapter IV: Civil Society Participation
Figure IV Demand-making and Ethnic Self-Identification
Family Size
The final analysis of demand-making involved examining its relationship to familysize. While significant associations were uncovered, the patterns were not uniform.Demands made on national officials and mayors/councilmen declined slightly as thenumber of children increased. On the other hand, demands at the level of the Presidentor of a deputy increased with the number of children. The same pattern was found forcontacting the native authority. The results are shown in Figure IV.37.

The Political Culture of Democracy in Bolivia: 1998 124 Chapter IV: Civil Society Participation
Figure IV Demand-making and Children
Does Civil Society Participation Lead to Action?
Thus far this chapter has explored the levels of participation of Bolivians in variouscivil society organizations, and it has also explored demand-making. It has been found thatBolivian citizens are active in a broad range of civil society organizations and that demand-making, while only occurring among a minority of the population, is still fairly common. Itcould be argued, however, that participation in committees could be purely social events,and that citizens meet to have a good time, not to stimulate change in their communities.It could also be argued that demand-making is self-serving and is really a reflection of apopulation dependent on having others do things for them.
It is possible to test this suspicion by examining the linkages between “talk” and“action.” The survey not only asked about attendance in civil society organizations, but italso asked about individual work in resolving community problems. Is talk associated with
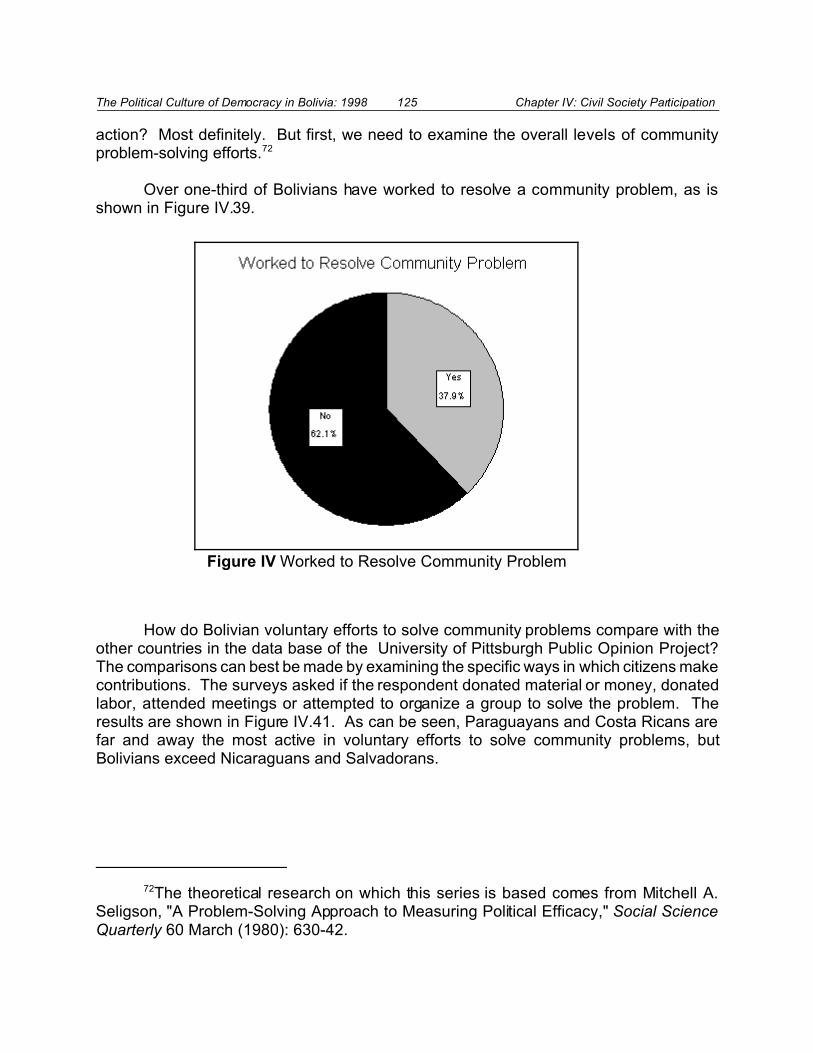
The Political Culture of Democracy in Bolivia: 1998 125 Chapter IV: Civil Society Participation
72The theoretical research on which this series is based comes from Mitchell A.Seligson, "A Problem-Solving Approach to Measuring Political Efficacy," Social ScienceQuarterly 60 March (1980): 630-42.
Figure IV Worked to Resolve Community Problem
action? Most definitely. But first, we need to examine the overall levels of communityproblem-solving efforts.72
Over one-third of Bolivians have worked to resolve a community problem, as isshown in Figure IV.39.
How do Bolivian voluntary efforts to solve community problems compare with theother countries in the data base of the University of Pittsburgh Public Opinion Project?The comparisons can best be made by examining the specific ways in which citizens makecontributions. The surveys asked if the respondent donated material or money, donatedlabor, attended meetings or attempted to organize a group to solve the problem. Theresults are shown in Figure IV.41. As can be seen, Paraguayans and Costa Ricans arefar and away the most active in voluntary efforts to solve community problems, butBolivians exceed Nicaraguans and Salvadorans.

The Political Culture of Democracy in Bolivia: 1998 126 Chapter IV: Civil Society Participation
Figure IV Personal Contributions to Solving Community Problems: Bolivia in Comparative Perspective
Now that Bolivia has been placed in comparative perspective, it is possible to returnto the question of the linkage between civil society participation and voluntarism. To dothis, the following set of charts examines each of the forms of civil society participationstudied above, and determines its relationship to the four forms of voluntarism justdescribed. As will be seen, the patterns for each civil society organization and its links tovoluntarism in solving community problems are very similar. Since each of the national-level organizations involved in civic participation has a particular interest in the links to itsown groups, one chart depicting the relationship will be shown for each type oforganizations. While this introduces some redundancy in the presentation, it also helpsto individualize the results. First, however, the overall relationship is shown in Figure IV.43.In this graph the relationship between overall civil society participation and the percentengaging in voluntaristic behavior is shown. The very strong relationship is evident; among
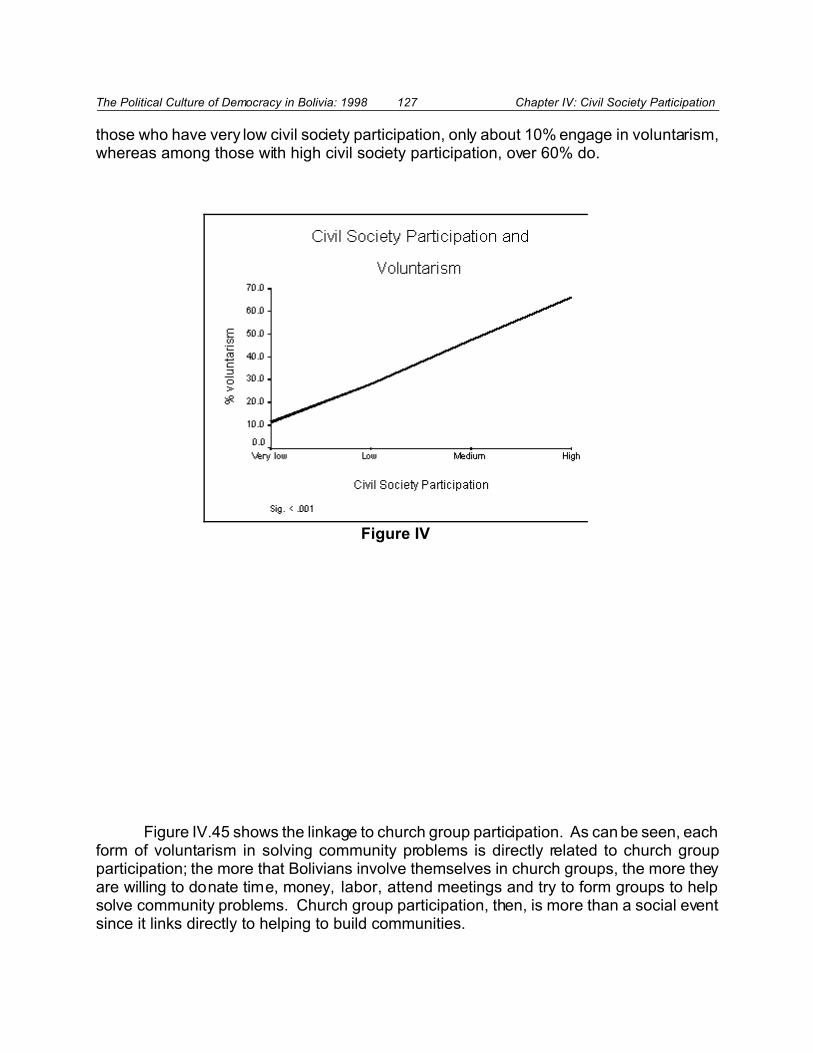
The Political Culture of Democracy in Bolivia: 1998 127 Chapter IV: Civil Society Participation
Figure IV
those who have very low civil society participation, only about 10% engage in voluntarism,whereas among those with high civil society participation, over 60% do.
Figure IV.45 shows the linkage to church group participation. As can be seen, eachform of voluntarism in solving community problems is directly related to church groupparticipation; the more that Bolivians involve themselves in church groups, the more theyare willing to donate time, money, labor, attend meetings and try to form groups to helpsolve community problems. Church group participation, then, is more than a social eventsince it links directly to helping to build communities.

The Political Culture of Democracy in Bolivia: 1998 128 Chapter IV: Civil Society Participation
Figure IV Church Participation and Voluntarism to Solve a Community Problem
An even sharper impact on voluntarism is found among those who attend school-related groups. Figure IV.47 shows that only 10-20% of those who never attend school-related group meetings actively attempt to solve community problems, whereas those whofrequently attend school meetings are two times more likely to be involved in voluntarism.

The Political Culture of Democracy in Bolivia: 1998 129 Chapter IV: Civil Society Participation
Figure IV School Group Participation and Voluntarism to Solve a Community Problem
A stronger impact still emerges from participation in community developmentassociations. Figure IV.49 shows, for example that only about 15% of those who neverparticipate in community development associations have donated their labor to solve acommunity problem, compared to over 40% voluntarism among those who frequentlyattend such meetings.
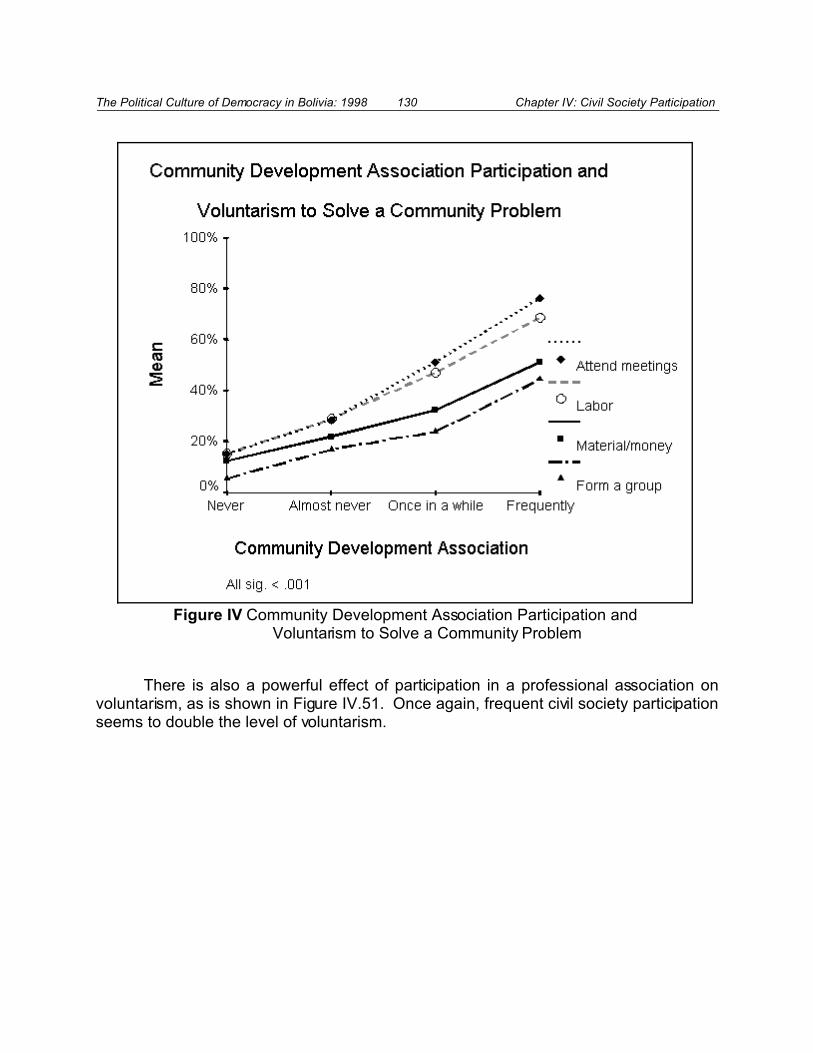
The Political Culture of Democracy in Bolivia: 1998 130 Chapter IV: Civil Society Participation
Figure IV Community Development Association Participation and Voluntarism to Solve a Community Problem
There is also a powerful effect of participation in a professional association onvoluntarism, as is shown in Figure IV.51. Once again, frequent civil society participationseems to double the level of voluntarism.

The Political Culture of Democracy in Bolivia: 1998 131 Chapter IV: Civil Society Participation
Figure IV Professional Association Participation and Voluntarism to Solve a Community Problem
Union organization participation is similarly linked to voluntarism to solve communityproblems, as is shown in Figure IV.53.

The Political Culture of Democracy in Bolivia: 1998 132 Chapter IV: Civil Society Participation
Figure IV Union Participation and Voluntarism to Solve a Community Problem
Active participation in cooperatives (e.g., savings and loan, agricultural, production,etc.), also links directly to voluntarism to solve community problems, as can be seen inFigure IV.55.
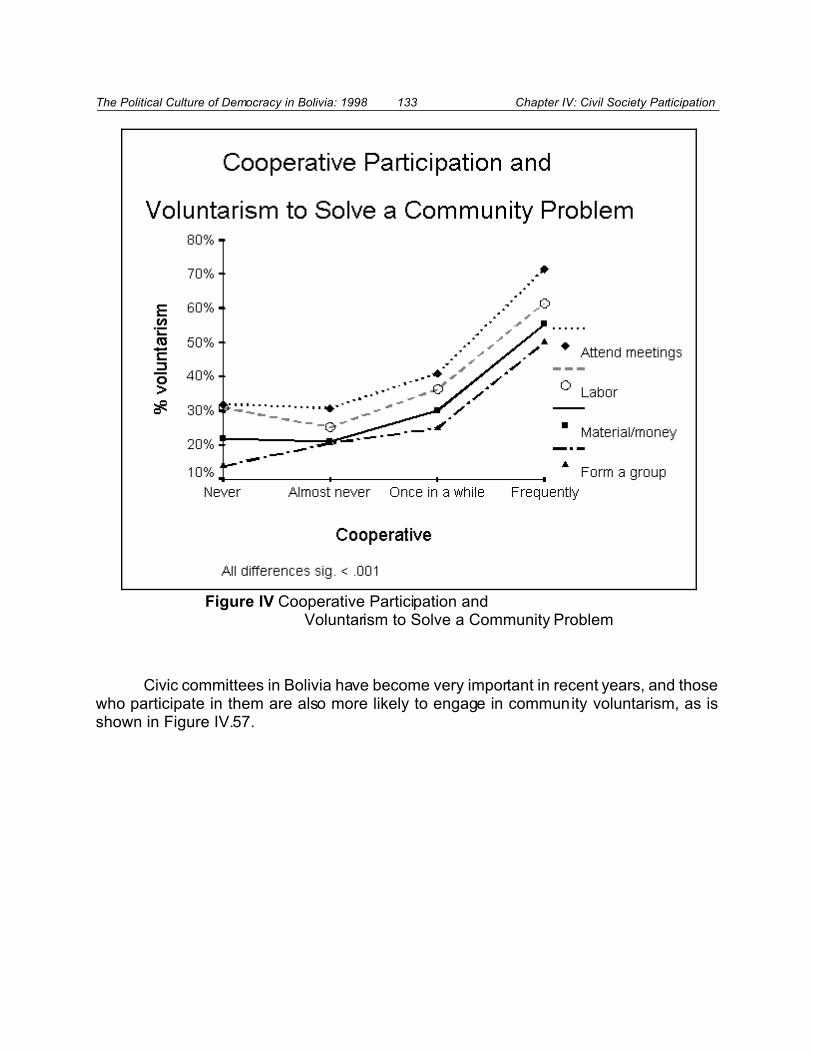
The Political Culture of Democracy in Bolivia: 1998 133 Chapter IV: Civil Society Participation
Figure IV Cooperative Participation and Voluntarism to Solve a Community Problem
Civic committees in Bolivia have become very important in recent years, and thosewho participate in them are also more likely to engage in community voluntarism, as isshown in Figure IV.57.
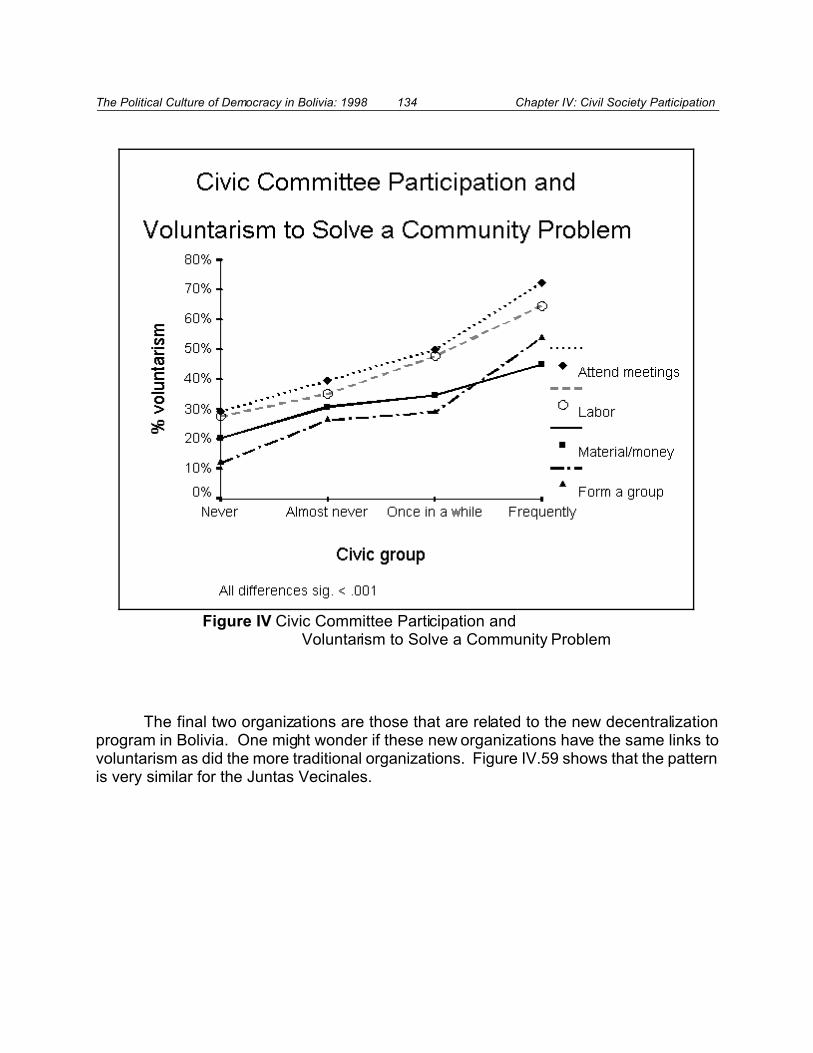
The Political Culture of Democracy in Bolivia: 1998 134 Chapter IV: Civil Society Participation
Figure IV Civic Committee Participation and Voluntarism to Solve a Community Problem
The final two organizations are those that are related to the new decentralizationprogram in Bolivia. One might wonder if these new organizations have the same links tovoluntarism as did the more traditional organizations. Figure IV.59 shows that the patternis very similar for the Juntas Vecinales.
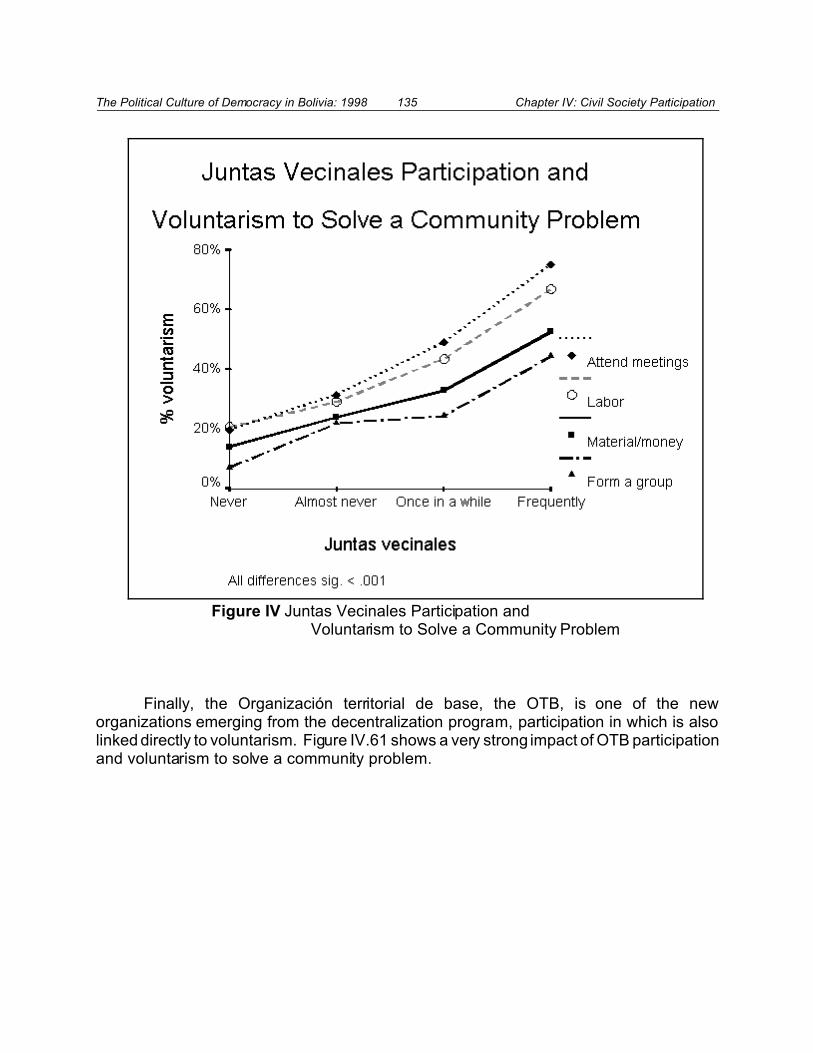
The Political Culture of Democracy in Bolivia: 1998 135 Chapter IV: Civil Society Participation
Figure IV Juntas Vecinales Participation and Voluntarism to Solve a Community Problem
Finally, the Organización territorial de base, the OTB, is one of the neworganizations emerging from the decentralization program, participation in which is alsolinked directly to voluntarism. Figure IV.61 shows a very strong impact of OTB participationand voluntarism to solve a community problem.
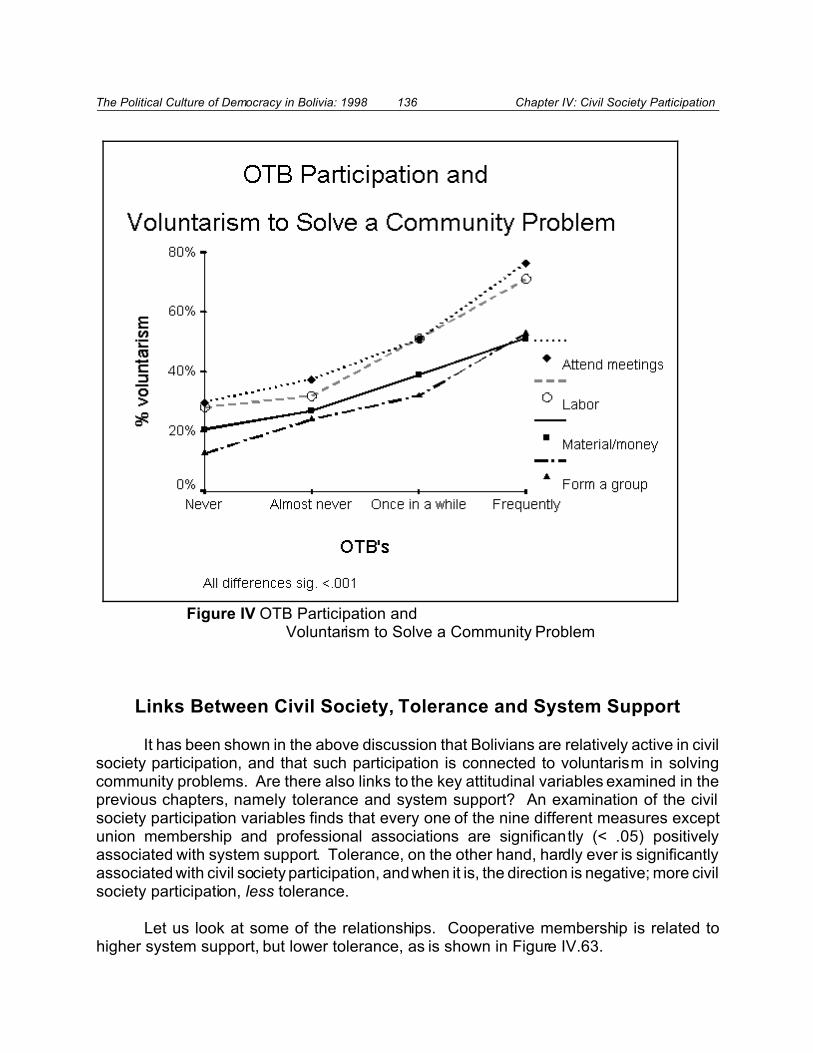
The Political Culture of Democracy in Bolivia: 1998 136 Chapter IV: Civil Society Participation
Figure IV OTB Participation and Voluntarism to Solve a Community Problem
Links Between Civil Society, Tolerance and System Support
It has been shown in the above discussion that Bolivians are relatively active in civilsociety participation, and that such participation is connected to voluntarism in solvingcommunity problems. Are there also links to the key attitudinal variables examined in theprevious chapters, namely tolerance and system support? An examination of the civilsociety participation variables finds that every one of the nine different measures exceptunion membership and professional associations are significantly (< .05) positivelyassociated with system support. Tolerance, on the other hand, hardly ever is significantlyassociated with civil society participation, and when it is, the direction is negative; more civilsociety participation, less tolerance.
Let us look at some of the relationships. Cooperative membership is related tohigher system support, but lower tolerance, as is shown in Figure IV.63.
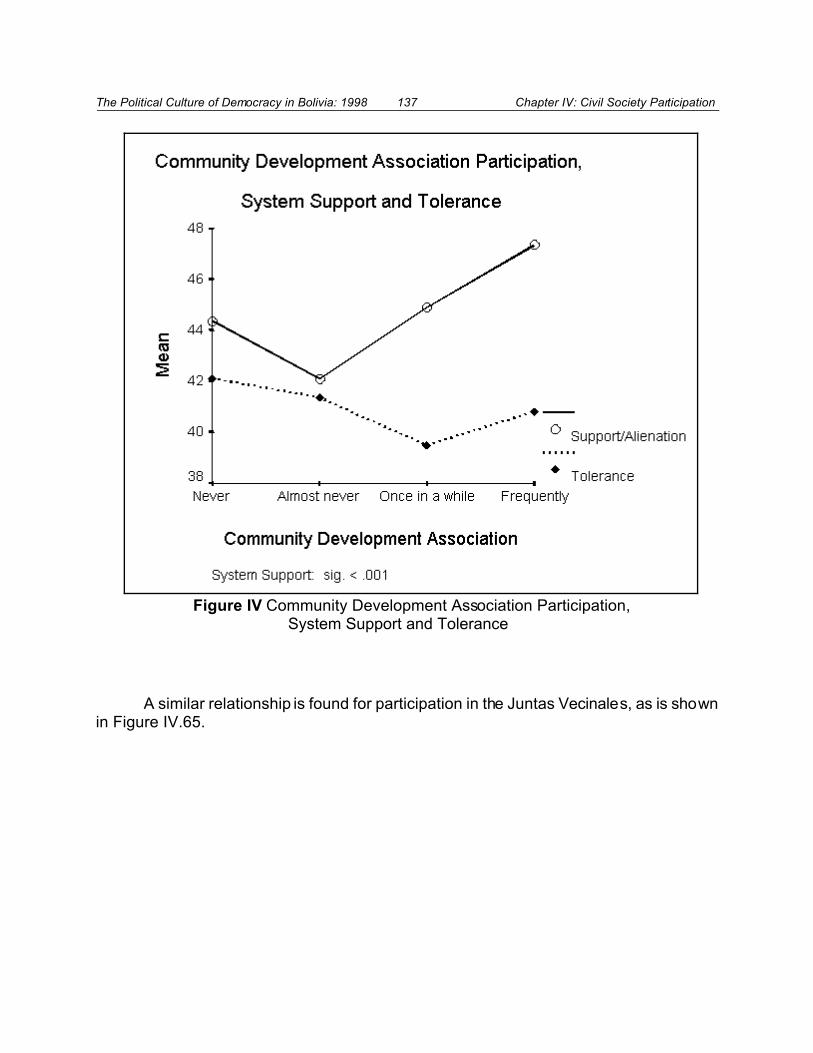
The Political Culture of Democracy in Bolivia: 1998 137 Chapter IV: Civil Society Participation
Figure IV Community Development Association Participation, System Support and Tolerance
A similar relationship is found for participation in the Juntas Vecinales, as is shownin Figure IV.65.
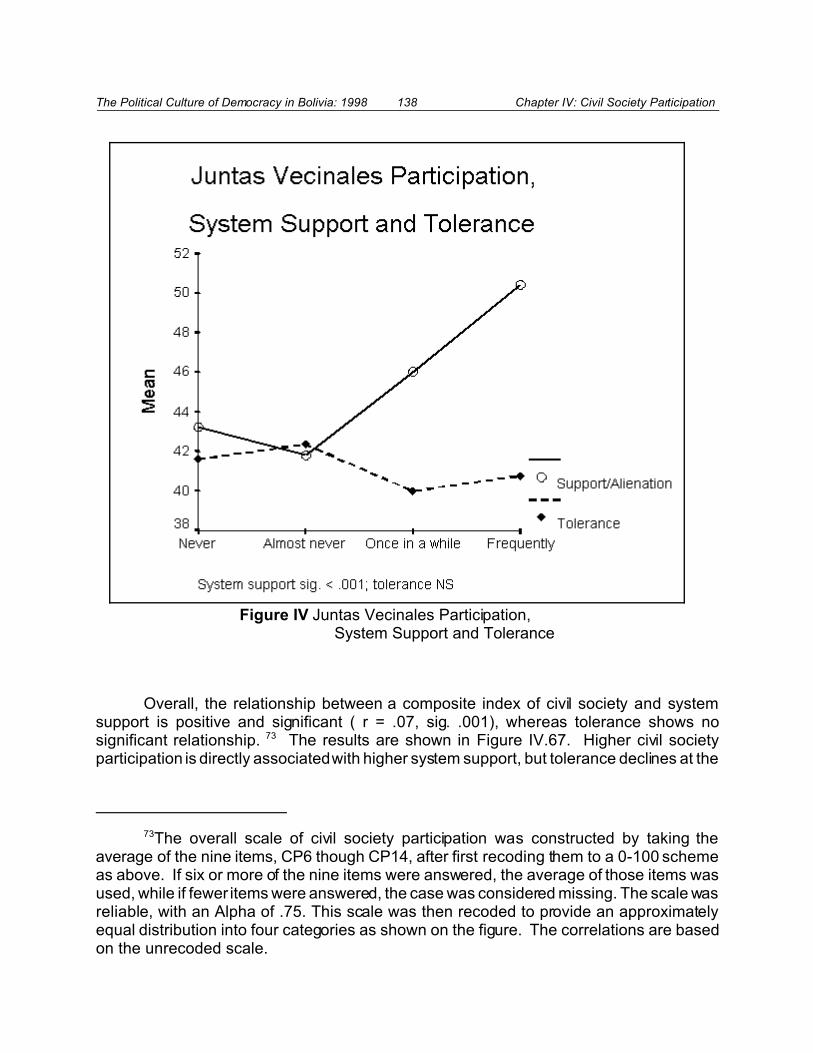
The Political Culture of Democracy in Bolivia: 1998 138 Chapter IV: Civil Society Participation
73The overall scale of civil society participation was constructed by taking theaverage of the nine items, CP6 though CP14, after first recoding them to a 0-100 schemeas above. If six or more of the nine items were answered, the average of those items wasused, while if fewer items were answered, the case was considered missing. The scale wasreliable, with an Alpha of .75. This scale was then recoded to provide an approximatelyequal distribution into four categories as shown on the figure. The correlations are basedon the unrecoded scale.
Figure IV Juntas Vecinales Participation, System Support and Tolerance
Overall, the relationship between a composite index of civil society and systemsupport is positive and significant ( r = .07, sig. .001), whereas tolerance shows nosignificant relationship. 73 The results are shown in Figure IV.67. Higher civil societyparticipation is directly associated with higher system support, but tolerance declines at the
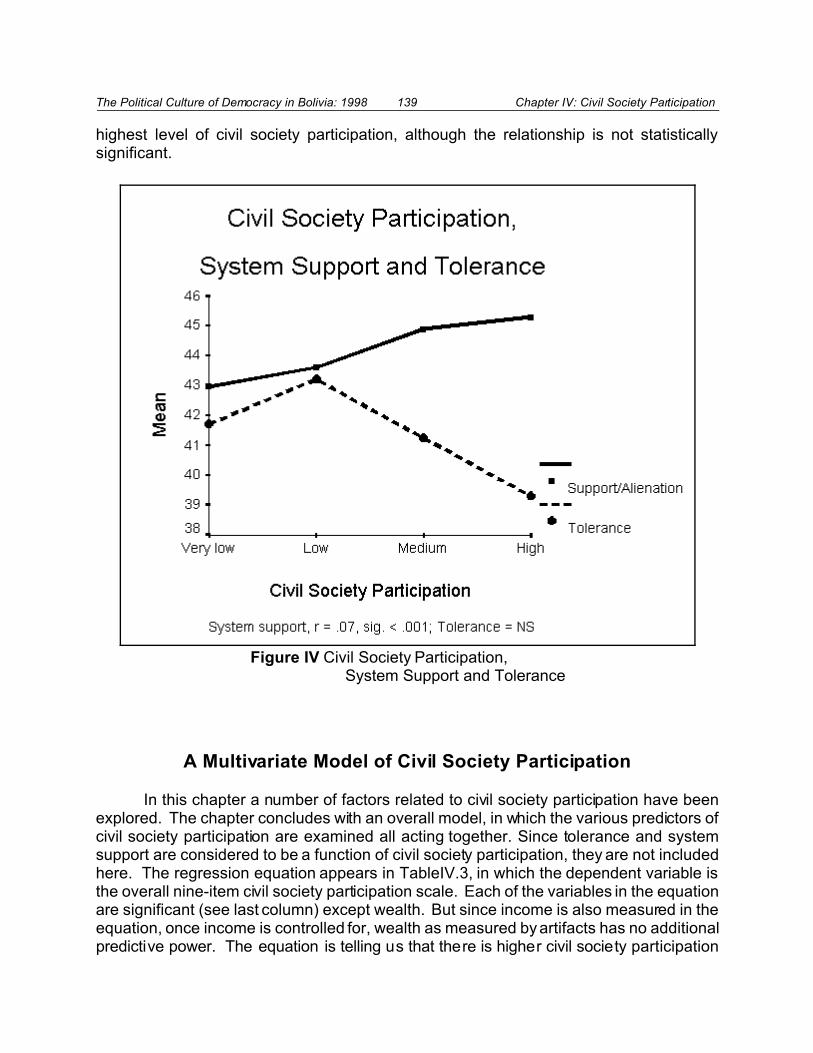
The Political Culture of Democracy in Bolivia: 1998 139 Chapter IV: Civil Society Participation
Figure IV Civil Society Participation, System Support and Tolerance
highest level of civil society participation, although the relationship is not statisticallysignificant.
A Multivariate Model of Civil Society Participation
In this chapter a number of factors related to civil society participation have beenexplored. The chapter concludes with an overall model, in which the various predictors ofcivil society participation are examined all acting together. Since tolerance and systemsupport are considered to be a function of civil society participation, they are not includedhere. The regression equation appears in TableIV.3, in which the dependent variable isthe overall nine-item civil society participation scale. Each of the variables in the equationare significant (see last column) except wealth. But since income is also measured in theequation, once income is controlled for, wealth as measured by artifacts has no additionalpredictive power. The equation is telling us that there is higher civil society participation

The Political Culture of Democracy in Bolivia: 1998 140 Chapter IV: Civil Society Participation
among Bolivians who live in rural areas, who are more highly educated, who have higherincomes, who are older, who have more children, who are less likely to be White or dressin Western clothes.
Tab le IV.3 . Pred ictors of Civ il Soc iety Pa rticipa tion O vera ll Sca le
Unstandardized
Coeffic ients
Standardized
Coeffic ients
t
Sig.
B Std.
Error
Beta
(Cons tant) 7.561 3.184 2.374 .018
UR Urban/rural 3.243 .322 .221 10.084 .000
ED Completed years of education .317 .100 .080 3.158 .002
INCOME Monthly income .572 .354 .037 1.615 .106
WEA LTH W ealth ( home artifacts) .115 .028 .105 4.143 .000
Q2 Age .073 .031 .056 2.364 .018
Q12 Number of children 1.551 .190 .200 8.169 .000
ETID Ethnicity 1.397 .366 .073 3.811 .000
VEST Indian dress? -2.943 1.244 -.049 -2.366 .018
R2 = .10, sig. < .001
ConclusionsBolivians are active participants in civil society organizations. That participation
could well serve as the basis to build a stronger political culture supportive of democracy.It is perhaps no coincidence that system support in Bolivia is higher in rural areas, preciselywhere civil society participation is highest. Although ethnicity defined in terms of self-identification does not distinguish Bolivians based on system support, it does based on civilsociety participation. Such participation is consistently low among the “white” population,and consistently high among the indigenous population.
Bolivians are not likely to contact their elected legislative representatives when theyhave demands to make, but they are far more likely to contact their municipal officials ornational government officials. This is a common pattern found in other Latin Americancountries, and can be considered a major weakness in democracy in the region. If Boliviais to consolidate its democracy, citizens need to hold elected officials accountable. Theycan do so, at a minimum, by contacting them and making demands on them. Perhaps theinitiation of the single-member district system will go a long way to achieving this goal, butthe system is too new to have yet had that effect.
It is also of note that Bolivian women are far less likely to make demands on thepolitical system than are men. This suggest an important gender issue that needs to beaddressed.
The Political Culture of Democracy in Bolivia: 1998 141 Chapter IV: Civil Society Participation
Civil society participation has been shown to have important links to democracy inBolivia. On the one hand, those who participate are not only more likely to make demands,they are significantly and consistently more likely to be willing to volunteer their own timeand resources to help solve local problems. Perhaps most importantly, those who areactive in civil society are consistently higher in system support than those who are inactive.This suggests the democratic stability in Bolivia could be built from the bottom up. Citizenscould be encouraged to participate in their local organizations, and in so doing couldincrease their level of confidence in the political system. Political tolerance, on the otherhand, does not increase with civil society participation. This suggests problems at thegrass roots that need to be addressed. In what ways are Bolivians participating in civilsociety that makes them no more willing to tolerate the rights of others? This is certainlyan important question for further research.

The Political Culture of Democracy in Bolivia: 1998 142 Chapter V: Citizens and Local Government
74A classic overview of the history of the centralization of state power is containedin Claudio Velíz, The Centralist Tradition in Latin America (Princeton, N. J.: PrincetonUniversity Press, 1980).
75For a description of the pre-reform system see R. Andrew Nickson, LocalGovernment in Latin America (Boulder, CO: Lynne Reinner Publishers, 1995), pp. 107-116.
76Nickson, op cit., pp. 114-115.
Chapter V. Citizens and Local Government
Latin America, perhaps more than any other area of the world, has had a verystrong tradition of centralization of state power. Local governments in unitary systems andstate governments in Latin America’s federal systems (i.e., Mexico, Brazil and Argentina)have all been subordinated to central government to an extreme degree.74 Students ofdemocratic theory have suggested that this centralization of state power has emerged asa major barrier to increased citizen participation and helps explain why democracy hastaken so long to take hold in Latin America.
Up until its recent reforms, Bolivia’s centralist tradition was perhaps even moreextreme than in other Latin American countries. One manifestation of the lack of localpolitical power was that the territorial jurisdiction of municipal government did not extendbeyond urban areas, thus leaving the rural population with no local government at allbeyond the indigenous, non-state sanctioned systems of local rule.75 It is not surprising,therefore, that local participation in government does not have a strong tradition in Bolivia.According to one well-respected study,
Citizen participation in Bolivian local government is noticeably weak incomparison with the rest of Latin America.... Institutionalized mechanismsfor citizen participation in local government are limited. Successiveadministrations have established their own ad hoc mechanisms, each ofwhich has become identified with a political party or a faction within the party.As a result, the opportunity for constructing independent and self-sustainingcitizen participation over the long term has been restricted.76
In spite of, or perhaps because of this extreme centralization of political power inBolivia, major reforms were undertaken in the 1990s. The two key reforms are theAdministrative Decentralization Law (1995) , which transfers a number of responsibilitiesfrom the national government to the departmental level, including the administration of allof the revenue generated within the department. The Popular Participation Law (1994)greatly expands the role of local government by dividing the entire national territory into 311

The Political Culture of Democracy in Bolivia: 1998 143 Chapter V: Citizens and Local Government
77Mitchell A. Seligson, Central Americans View Their Local Governments, Reportto USAID, Regional Office for Urban Development and Housing (RHUDO) (GuatemalaCity, Guatemala, 1994a).
78Actually, 499, since there was one missing case.
municipalities, thereby granting local government to the formerly excluded rural areas. Inaddition, 20% of the national tax revenues have been transferred to the municipalities ona per capita basis. These funds can be used by municipal governments to contract fortheir own health care and other services. The law also provides a mechanism by whichthousands of local community organizations can obtain legal status. Finally, each of the311 municipal governments is to have its own citizen oversight committee (Comité deVigilancia), which ultimately have the power to suspend municipal spending.
In this chapter, Bolivian attitudes toward and participation in local government willbe examined, and the factors that differentiate Bolivians on these dimensions will beexplored. Linkages between local participation and democratic values will also be studied.The series of questions on which this analysis is based was initially developed by theUniversity of Pittsburgh in 1994 in the context of a study of municipal participation inCentral America.77 Since then, some of the questionnaire items developed for that studyhave been incorporated into the Pittsburgh series of surveys in Latin America, allowingcomparisons with several countries. The questionnaire items (see appendix) include theNP series (level of participation), the SGL (satisfaction with local government) series, andthe LGL ( legitimacy of local government) series.
One feature of this chapter that differs from the others is that in this chapter ananalysis will be incorporated of the special municipal sample described in the methodologychapter of this work. It will be recalled that USAID has been attempting to support thedevelopment of democratization at the level of the municipality, and has established theDesarrollo Democrático, Participacíon Ciudadana (DDPC) program. Six municipalitieswere selected for inclusion in the current sample to provide baseline data for this program.A total of 100 respondents, 50 in urban areas and 50 in rural were interviewed in each ofthese municipalities. When the entire sample was designed, it was discovered that oneof the selected municipalities of the DDPC program also overlapped with the nationalsample, and in order not to increase the costs of the study, that municipality was used forboth purposes. In the prior chapters of this study, these 100 interviews were treated aspart of the national sample. In order not to alter the basic parameters of data presentedthus far, that procedure will be followed in this chapter as well. This means that the specialDDPC sample reported on here will be restricted to the 500 remaining interviews.78 Ofcourse, when additional studies of the DDPC municipalities are undertaken, all 600interviews are always available for analysis so that the 1998 baseline and future studiescan be fully compared.

The Political Culture of Democracy in Bolivia: 1998 144 Chapter V: Citizens and Local Government
79The responses were recoded into a 0, 100 format, so as to convert them into anoverall percentage of attending vs. non-attending.
80It would have been helpful if data were available comparing 1998 levels ofparticipation in municipal meetings with earlier studies. Unfortunately, a question onattendance at municipal meetings was not included in the 1996 study by the NationalSecretariat of Popular Participation. See Gonzalo Roja Ortuste and Luis VerdesotoCustode, La Participación Popular Como Reforma de la Política: Evidencias de unaCultura Democrática Boliviana (La Paz, Bolivia: Ministerio de Desarrollo Humano,Secretaría Nacional de Participación Popular, Unidad de Investigación y Análisis, 1997).Another 1996 study, this one focusing directly on the USAID municipal developmentprogram areas, also failed to include a question on participation in municipal governmentmeetings. See Desarrollo democrático participación ciudadana, Obstáculo eImpedimentos a la Participación Electoral: Un Estudio en Seis Municipios Intermedios (LaPaz, 1997).
Level of Participation
Perhaps the most basic parameter of this examination of local government is thelevel of citizen participation at municipal meetings. The question asked was:
Now we are going to talk about the municipal government of thismunicipality. Have you had the opportunity to attend a municipal session orother meeting convoked by the mayor’s office or municipal council during thelast 12 months? 1. Yes. 2. No.
It is of interest to include comparisons with countries in the University of Pittsburgh LatinAmerican Public Opinion Project data base.79 Figure V.1 shows that Bolivia is on the low-side when compared with other countries in the region. Only Nicaragua has a lower levelof municipal government participation. These findings suggest that even four years afterthe approval of the popular participation law, Bolivians are not especially active in localgovernment. It should be noted that although the law was passed in 1994, itsimplementation has taken place rather slowly, and still has not been fully implemented inall areas of the country.80 This may account for the low level participation. On the otherhand, participation may have been far lower prior to 1994.

The Political Culture of Democracy in Bolivia: 1998 145 Chapter V: Citizens and Local Government
81It is important to note that the DDPC project used different criteria to designate“urban” and “rural.” In that project, “urban” corresponds to the capital of the municipality(equivalent to the “county seat” in the United States), while “rural” were all other areas. Inthis data set, two of the urban DDPC areas (Pucarani and Curahuara de Carangas) arecapitals of their municipios, but they have populations in the range of 500-2,000, which inthe present study are classified as “compact rural.” Thus, if a cross-tabulation is runbetween the DDPC strata and the stratum variable for the present study, interviews inthese areas will appear as “urban DDPC” while also appearing as “compact rural” in thedemocratic values national sample.
Figure V Attendance at Municipal Meetings: Bolivia in Comparative Perspective
Gender
Males and females differ markedly in their levels of participation in municipalmeetings, with males systematically participating more. As is shown in Figure V.1, malesparticipate at a level over 75% higher than females in the national sample. The DDPCsample municipalities show higher levels of participation, especially in the urban areascompared to the rural, but the gender gap remains present, wide and statisticallysignificant.81
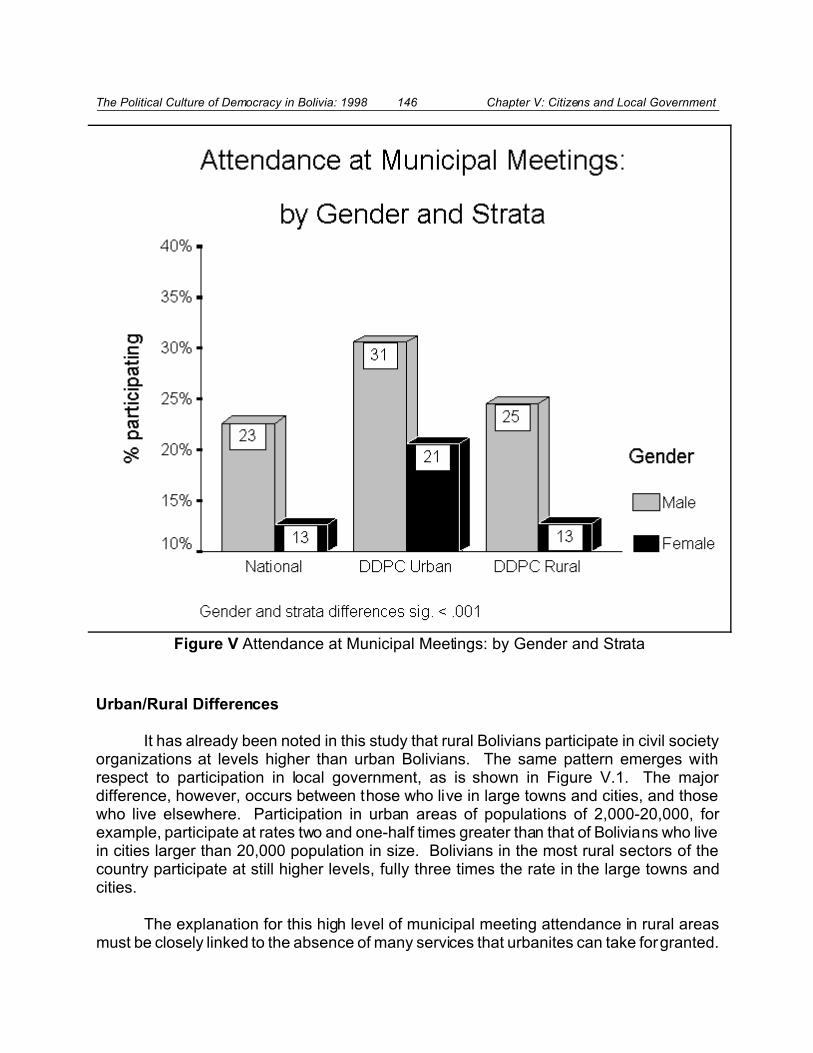
The Political Culture of Democracy in Bolivia: 1998 146 Chapter V: Citizens and Local Government
Figure V Attendance at Municipal Meetings: by Gender and Strata
Urban/Rural Differences
It has already been noted in this study that rural Bolivians participate in civil societyorganizations at levels higher than urban Bolivians. The same pattern emerges withrespect to participation in local government, as is shown in Figure V.1. The majordifference, however, occurs between those who live in large towns and cities, and thosewho live elsewhere. Participation in urban areas of populations of 2,000-20,000, forexample, participate at rates two and one-half times greater than that of Bolivians who livein cities larger than 20,000 population in size. Bolivians in the most rural sectors of thecountry participate at still higher levels, fully three times the rate in the large towns andcities.
The explanation for this high level of municipal meeting attendance in rural areasmust be closely linked to the absence of many services that urbanites can take for granted.
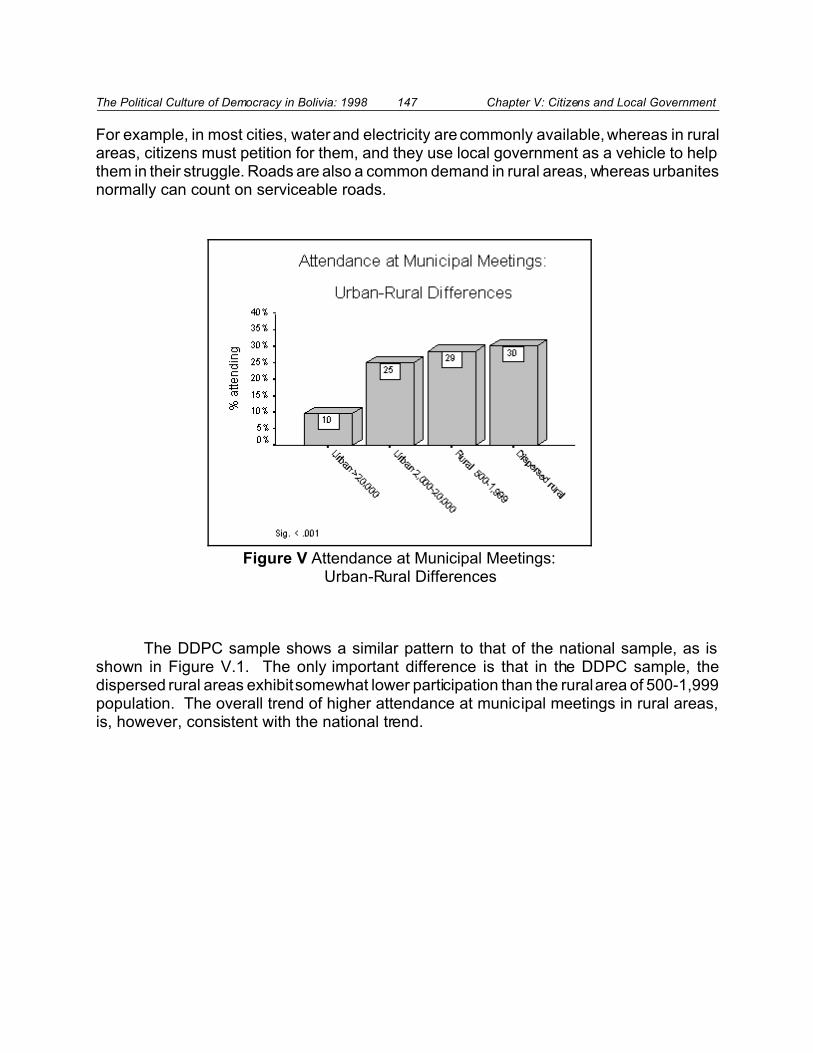
The Political Culture of Democracy in Bolivia: 1998 147 Chapter V: Citizens and Local Government
Figure V Attendance at Municipal Meetings: Urban-Rural Differences
For example, in most cities, water and electricity are commonly available, whereas in ruralareas, citizens must petition for them, and they use local government as a vehicle to helpthem in their struggle. Roads are also a common demand in rural areas, whereas urbanitesnormally can count on serviceable roads.
The DDPC sample shows a similar pattern to that of the national sample, as isshown in Figure V.1. The only important difference is that in the DDPC sample, thedispersed rural areas exhibit somewhat lower participation than the rural area of 500-1,999population. The overall trend of higher attendance at municipal meetings in rural areas,is, however, consistent with the national trend.
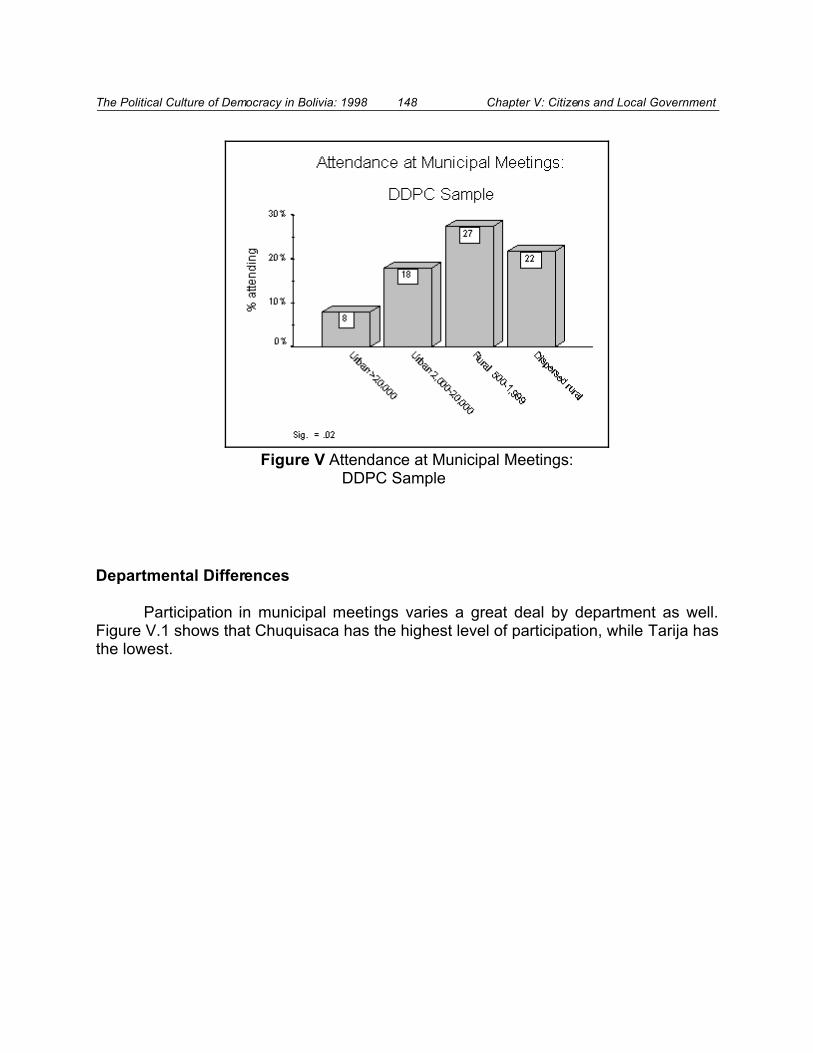
The Political Culture of Democracy in Bolivia: 1998 148 Chapter V: Citizens and Local Government
Figure V Attendance at Municipal Meetings: DDPC Sample
Departmental Differences
Participation in municipal meetings varies a great deal by department as well.Figure V.1 shows that Chuquisaca has the highest level of participation, while Tarija hasthe lowest.
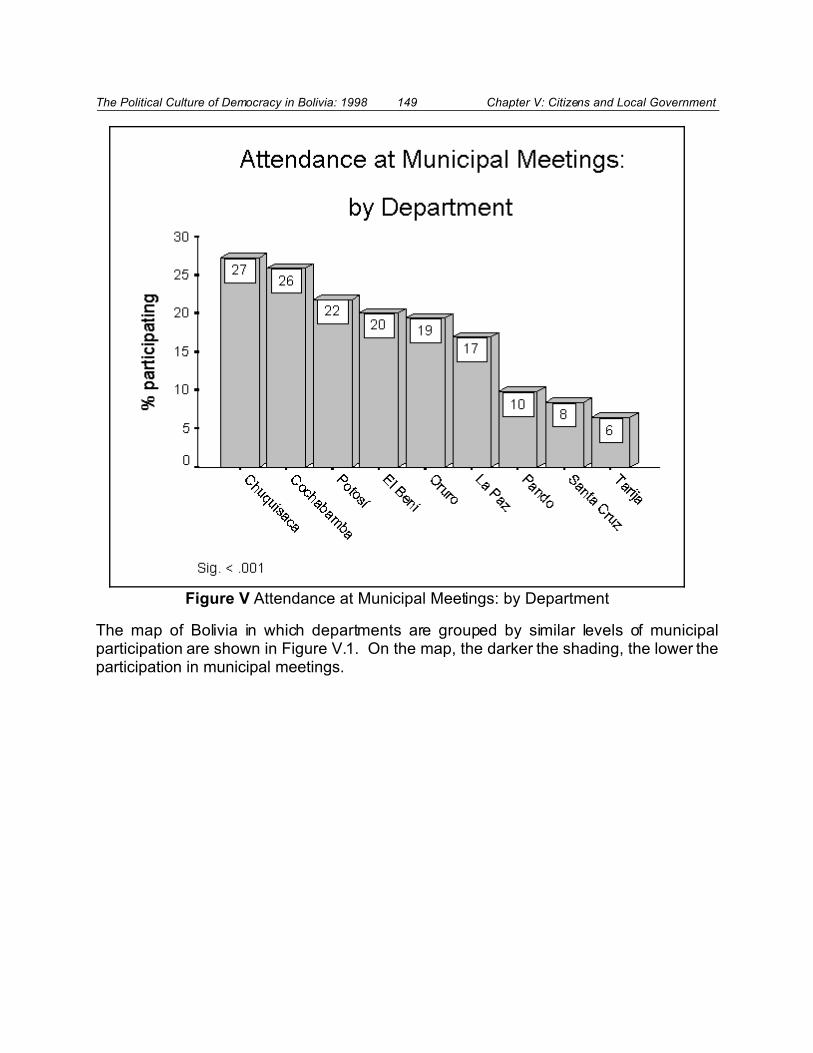
The Political Culture of Democracy in Bolivia: 1998 149 Chapter V: Citizens and Local Government
Figure V Attendance at Municipal Meetings: by Department
The map of Bolivia in which departments are grouped by similar levels of municipalparticipation are shown in Figure V.1. On the map, the darker the shading, the lower theparticipation in municipal meetings.
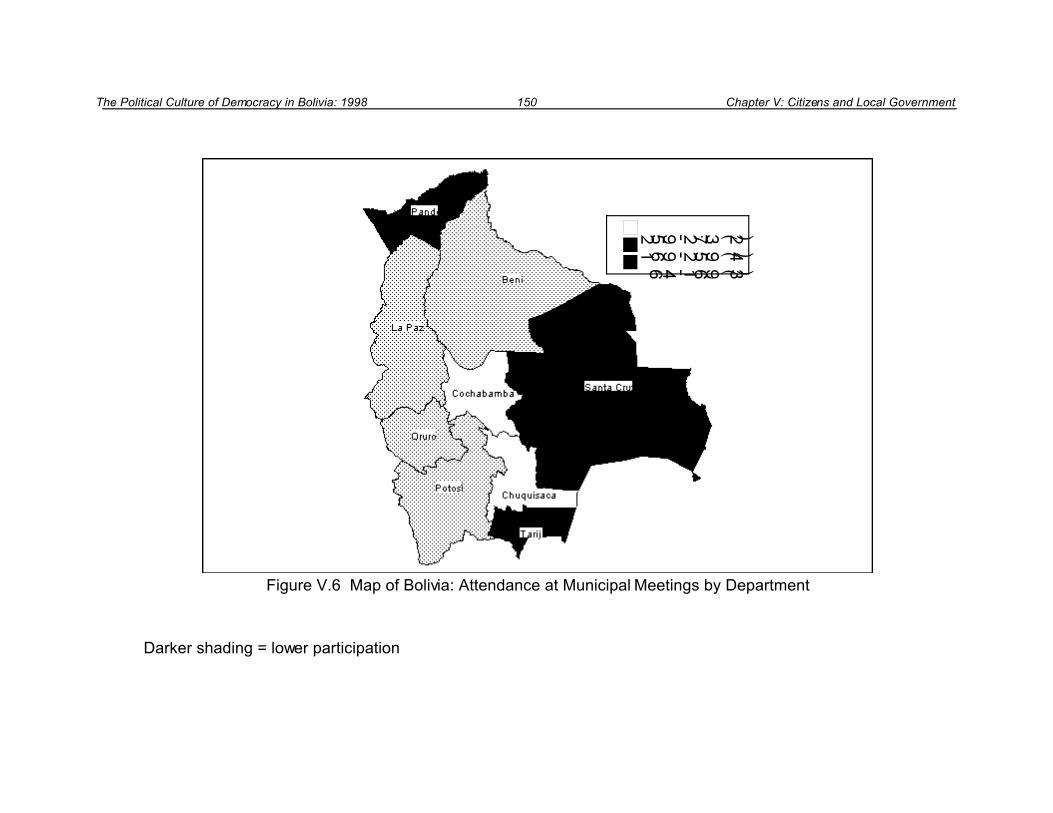
The Political Culture of Democracy in Bolivia: 1998 150 Chapter V: Citizens and Local Government
Figure V.6 Map of Bolivia: Attendance at Municipal Meetings by Department
Darker shading = lower participation

The Political Culture of Democracy in Bolivia: 1998 151 Chapter V: Citizens and Local Government The Political Culture of Democracy in Bolivia: 1998 151 Chapter V: Citizens and Local Government
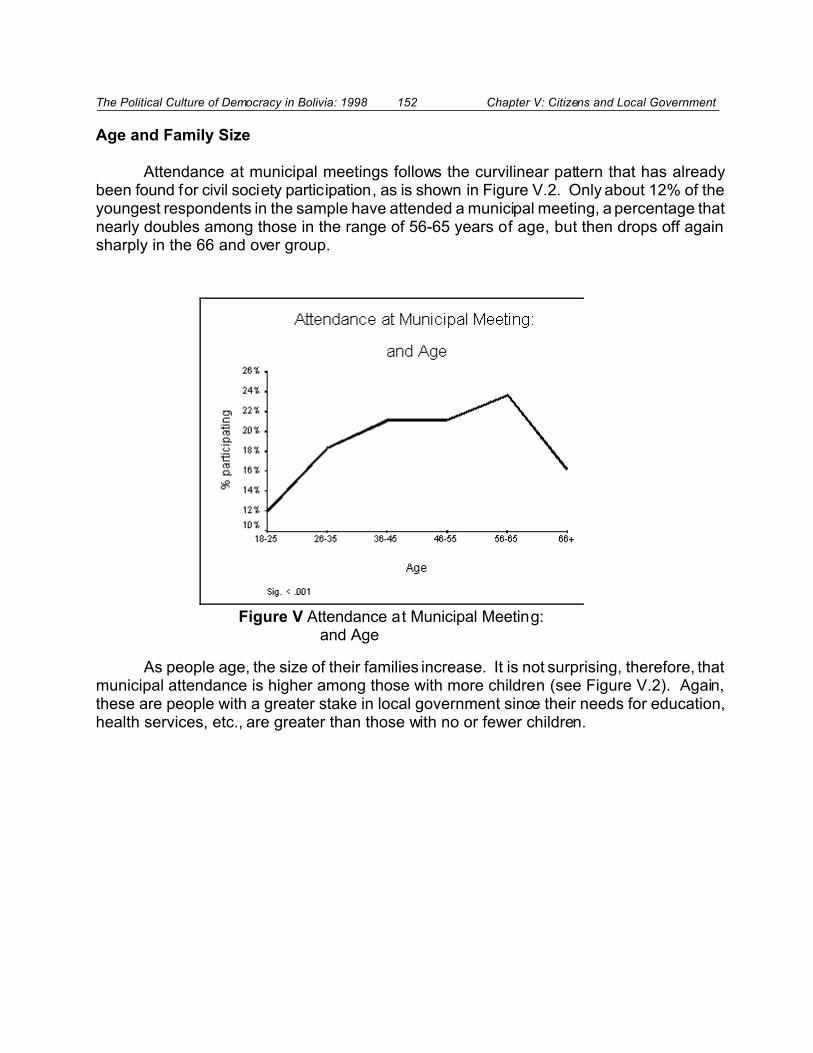
The Political Culture of Democracy in Bolivia: 1998 152 Chapter V: Citizens and Local Government
Figure V Attendance at Municipal Meeting: and Age
Age and Family Size
Attendance at municipal meetings follows the curvilinear pattern that has alreadybeen found for civil society participation, as is shown in Figure V.2. Only about 12% of theyoungest respondents in the sample have attended a municipal meeting, a percentage thatnearly doubles among those in the range of 56-65 years of age, but then drops off againsharply in the 66 and over group.
As people age, the size of their families increase. It is not surprising, therefore, thatmunicipal attendance is higher among those with more children (see Figure V.2). Again,these are people with a greater stake in local government since their needs for education,health services, etc., are greater than those with no or fewer children.
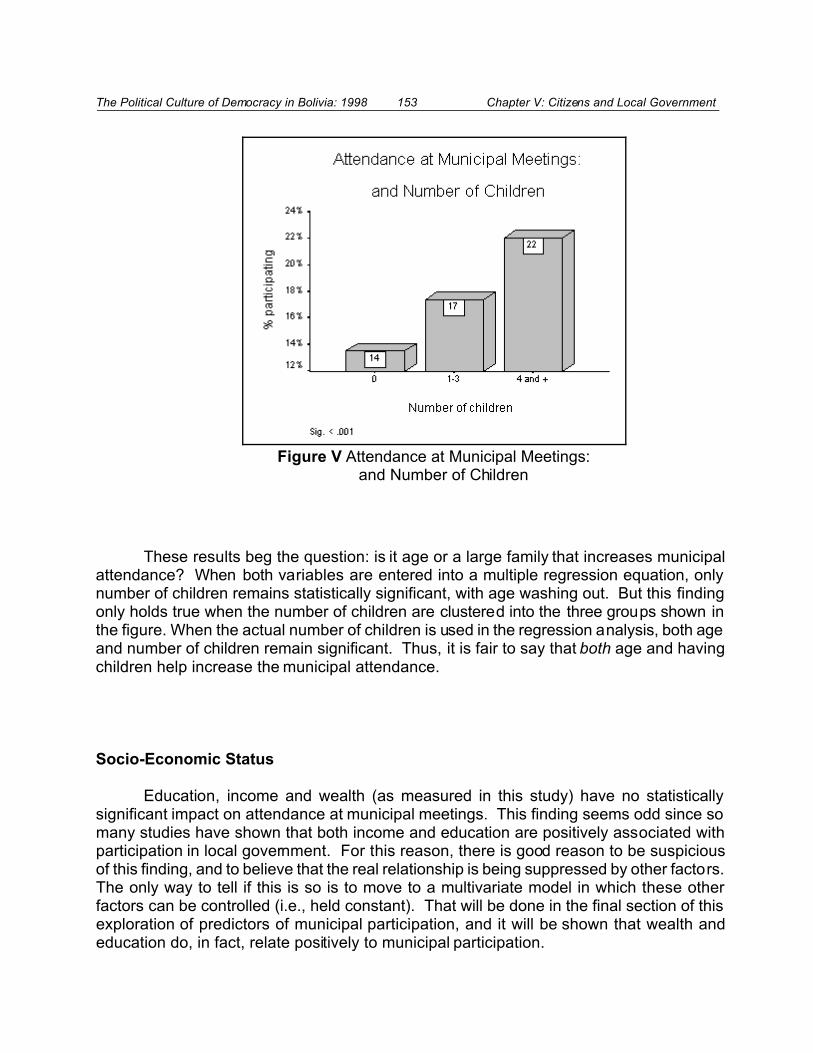
The Political Culture of Democracy in Bolivia: 1998 153 Chapter V: Citizens and Local Government
Figure V Attendance at Municipal Meetings: and Number of Children
These results beg the question: is it age or a large family that increases municipalattendance? When both variables are entered into a multiple regression equation, onlynumber of children remains statistically significant, with age washing out. But this findingonly holds true when the number of children are clustered into the three groups shown inthe figure. When the actual number of children is used in the regression analysis, both ageand number of children remain significant. Thus, it is fair to say that both age and havingchildren help increase the municipal attendance.
Socio-Economic Status
Education, income and wealth (as measured in this study) have no statisticallysignificant impact on attendance at municipal meetings. This finding seems odd since somany studies have shown that both income and education are positively associated withparticipation in local government. For this reason, there is good reason to be suspiciousof this finding, and to believe that the real relationship is being suppressed by other factors.The only way to tell if this is so is to move to a multivariate model in which these otherfactors can be controlled (i.e., held constant). That will be done in the final section of thisexploration of predictors of municipal participation, and it will be shown that wealth andeducation do, in fact, relate positively to municipal participation.
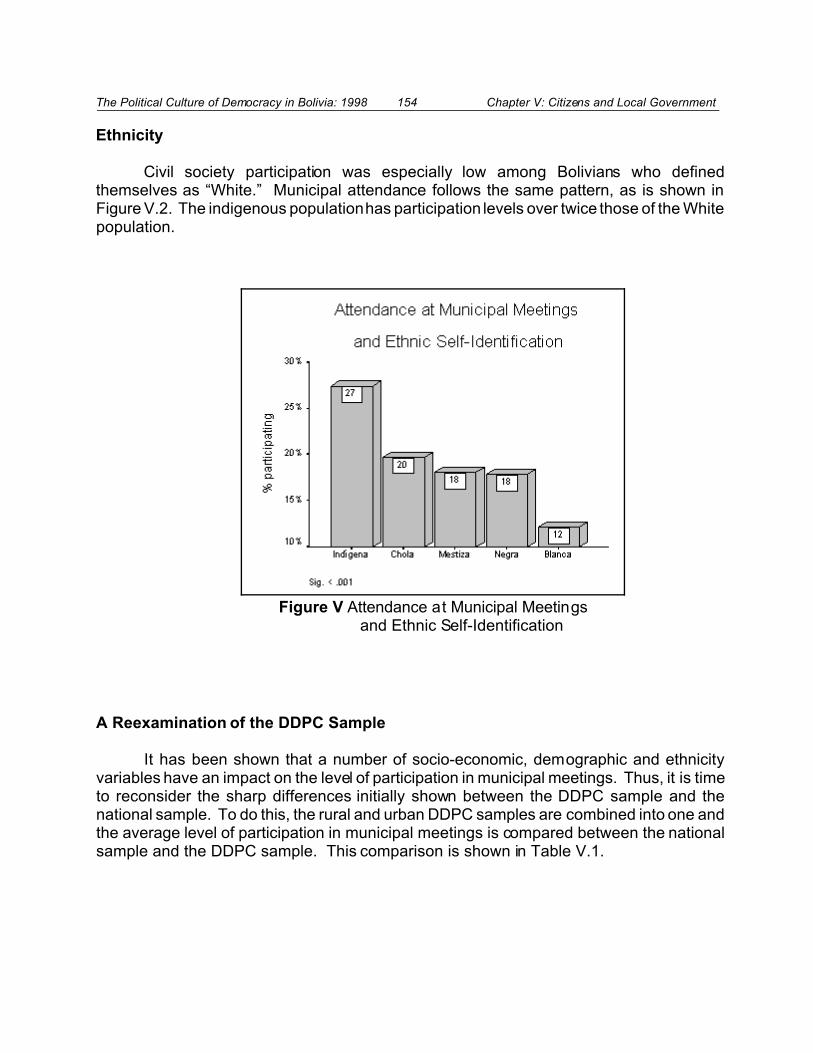
The Political Culture of Democracy in Bolivia: 1998 154 Chapter V: Citizens and Local Government
Figure V Attendance at Municipal Meetings and Ethnic Self-Identification
Ethnicity
Civil society participation was especially low among Bolivians who definedthemselves as “White.” Municipal attendance follows the same pattern, as is shown inFigure V.2. The indigenous population has participation levels over twice those of the Whitepopulation.
A Reexamination of the DDPC Sample
It has been shown that a number of socio-economic, demographic and ethnicityvariables have an impact on the level of participation in municipal meetings. Thus, it is timeto reconsider the sharp differences initially shown between the DDPC sample and thenational sample. To do this, the rural and urban DDPC samples are combined into one andthe average level of participation in municipal meetings is compared between the nationalsample and the DDPC sample. This comparison is shown in Table V.1.
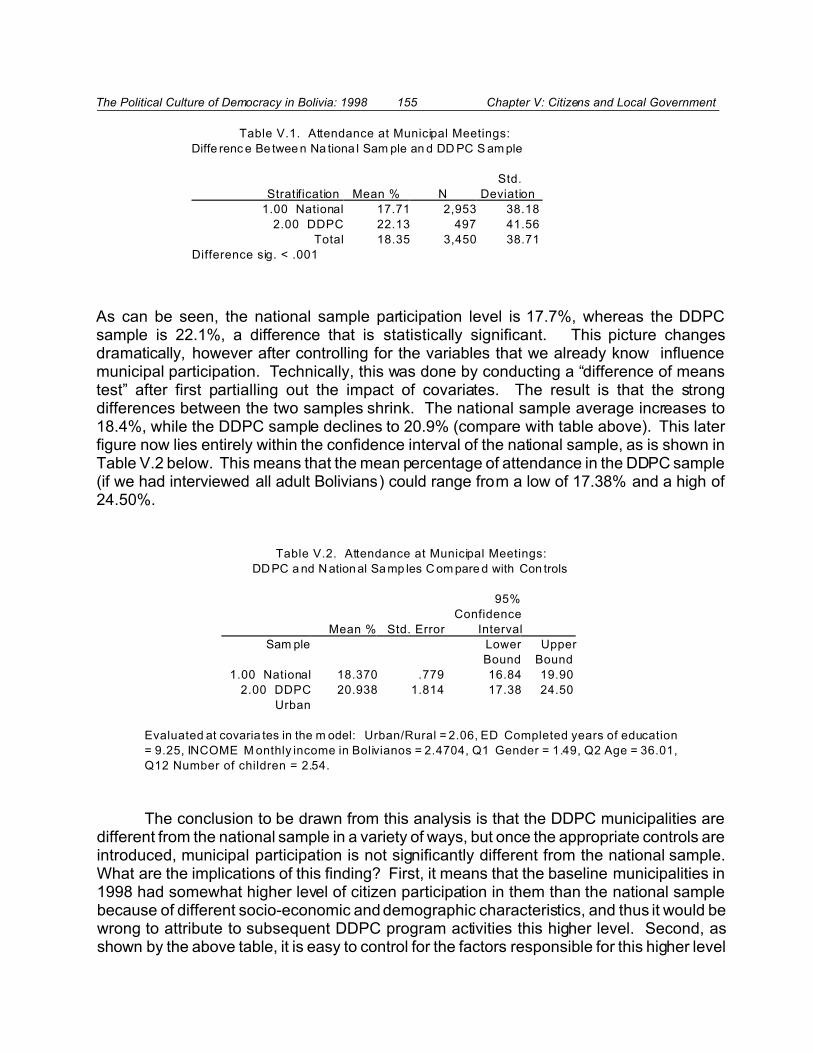
The Political Culture of Democracy in Bolivia: 1998 155 Chapter V: Citizens and Local Government
Table V.1. Attendance at Municipal Meetings:
Diffe renc e Be twee n Na tiona l Sam ple an d DD PC S am ple
Stratification Mean % N
Std.
Deviation
1.00 National 17.71 2,953 38.18
2.00 DDPC 22.13 497 41.56
Total 18.35 3,450 38.71
Difference sig. < .001
As can be seen, the national sample participation level is 17.7%, whereas the DDPCsample is 22.1%, a difference that is statistically significant. This picture changesdramatically, however after controlling for the variables that we already know influencemunicipal participation. Technically, this was done by conducting a “difference of meanstest” after first partialling out the impact of covariates. The result is that the strongdifferences between the two samples shrink. The national sample average increases to18.4%, while the DDPC sample declines to 20.9% (compare with table above). This laterfigure now lies entirely within the confidence interval of the national sample, as is shown inTable V.2 below. This means that the mean percentage of attendance in the DDPC sample(if we had interviewed all adult Bolivians) could range from a low of 17.38% and a high of24.50%.
Table V.2. Attendance at Municipal Meetings:
DDPC a nd N ational Samp les C om pare d with Con trols
Mean % Std. Error
95%
Confidence
Interval
Sam ple Lower
Bound
Upper
Bound
1.00 National 18.370 .779 16.84 19.90
2.00 DDPC
Urban
20.938 1.814 17.38 24.50
Evaluated at covaria tes in the m odel: Urban/Rural = 2.06, ED Completed years of education
= 9.25, INCOME M onthly income in Bolivianos = 2.4704, Q1 Gender = 1.49, Q2 Age = 36.01,
Q12 Number of children = 2.54.
The conclusion to be drawn from this analysis is that the DDPC municipalities aredifferent from the national sample in a variety of ways, but once the appropriate controls areintroduced, municipal participation is not significantly different from the national sample.What are the implications of this finding? First, it means that the baseline municipalities in1998 had somewhat higher level of citizen participation in them than the national samplebecause of different socio-economic and demographic characteristics, and thus it would bewrong to attribute to subsequent DDPC program activities this higher level. Second, asshown by the above table, it is easy to control for the factors responsible for this higher level

The Political Culture of Democracy in Bolivia: 1998 156 Chapter V: Citizens and Local Government
82Income measured in monthly income was significant when wealth was excludedfrom the equation, but wealth turned out to be a stronger predictor, so it was included andincome was dropped. As noted, both measure different aspects of a similar phenomenon.
83The ethnic self-identification variable was recoded as: 1= White, 2=Mestizo, Choloand Black, 3= Indígena.
of participation in the DDPC baseline municipalities and bring them into line with thenational parameters. Once those factors are controlled for, differences (increases or evendecreases in participation) can be attributed directly to the program rather than these othervariables. Third, comparisons of future DDPC surveys that would examine the impact ofthe program only make sense if comparisons can continue to be made with future nationalsamples. If, as is expected, DDPC areas increase their level of municipal participation,researchers would want to know if there has been a similar (or lower or even greater)increase elsewhere in Bolivia. For example, the Popular Participation law may serve tostimulate increased participation throughout Bolivia. The research question is do the DDPCareas get an extra boost as a result of the project or not?
A Multivariate Model of Participation in Municipal Meetings
It is now appropriate to examine the joint impact of each of the variables that havebeen explored above. Table V.3 shows the results of the multiple regression analysis.These results reconfirm most of the bi-variate findings shown above, but also now allow usto see the impact of education and wealth, when the other variables are held constant. Ascan be seen from the last column in the table, all of the predictors of municipal meetingattendance are statistically significant ( at .01 or better), and the overall model is significantat < .001. The results are telling us that those who participate more are Bolivians who livein more rural areas, who are male, who have higher levels of education, who are wealthier,82
who have more children, are older and are less like to be self-identified as “White.”83 Someof these findings might sound contradictory. For example, we know that the indigenouspopulation is poorer than the white population, yet Indians and richer Bolivians participatemore. In fact, what the regression equation is telling us is that even when holding constantfor wealth (as well as the other variables in the equation), Indians participate more thanWhites. Thus, the effect of wealth does not override the impact of ethnicity.
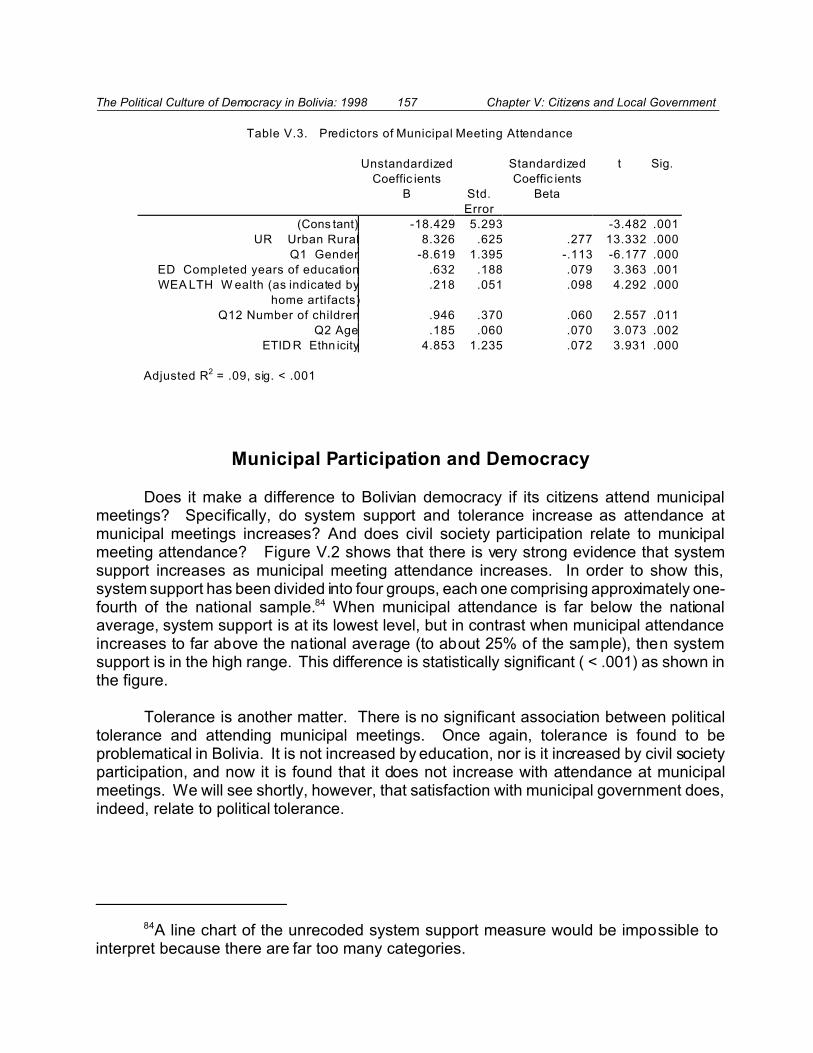
The Political Culture of Democracy in Bolivia: 1998 157 Chapter V: Citizens and Local Government
84A line chart of the unrecoded system support measure would be impossible tointerpret because there are far too many categories.
Table V.3. Predictors of Municipal Meeting Attendance
Unstandardized
Coeffic ients
Standardized
Coeffic ients
t Sig.
B Std.
Error
Beta
(Cons tant) -18.429 5.293 -3.482 .001
UR Urban Rural 8.326 .625 .277 13.332 .000
Q1 Gender -8.619 1.395 -.113 -6.177 .000
ED Completed years of education .632 .188 .079 3.363 .001
WEA LTH W ealth (as indicated by
home artifacts)
.218 .051 .098 4.292 .000
Q12 Number of children .946 .370 .060 2.557 .011
Q2 Age .185 .060 .070 3.073 .002
ETID R Ethn icity 4.853 1.235 .072 3.931 .000
Adjusted R2 = .09, sig. < .001
Municipal Participation and Democracy
Does it make a difference to Bolivian democracy if its citizens attend municipalmeetings? Specifically, do system support and tolerance increase as attendance atmunicipal meetings increases? And does civil society participation relate to municipalmeeting attendance? Figure V.2 shows that there is very strong evidence that systemsupport increases as municipal meeting attendance increases. In order to show this,system support has been divided into four groups, each one comprising approximately one-fourth of the national sample.84 When municipal attendance is far below the nationalaverage, system support is at its lowest level, but in contrast when municipal attendanceincreases to far above the national average (to about 25% of the sample), then systemsupport is in the high range. This difference is statistically significant ( < .001) as shown inthe figure.
Tolerance is another matter. There is no significant association between politicaltolerance and attending municipal meetings. Once again, tolerance is found to beproblematical in Bolivia. It is not increased by education, nor is it increased by civil societyparticipation, and now it is found that it does not increase with attendance at municipalmeetings. We will see shortly, however, that satisfaction with municipal government does,indeed, relate to political tolerance.

The Political Culture of Democracy in Bolivia: 1998 158 Chapter V: Citizens and Local Government
Figure V Attendance at Municipal Meetings and System Support
It can also be shown that civil society participation has direct and strong links tomunicipal meeting attendance. Figure V.2 shows that for those who are “high” on their levelof civil society participation, based upon the nine-organization series discussed in thechapter on civil society, participation in municipal meetings is 2.3 times higher than thenational average. It is reasonable to assume that participation at the local level, in grass-roots organizations, helps motivate Bolivians to take their concerns to government, as wellas to solve them using their own labor and money. Thus, civil society participation providesa triple benefit for democracy; on the one hand it increases local voluntarism, and on theother it increases contact with local government. On top of this, system support isincreased, although a regression analysis (not shown) reveals that the stronger impact onsystem support is local government attendance. Connections between these variables and
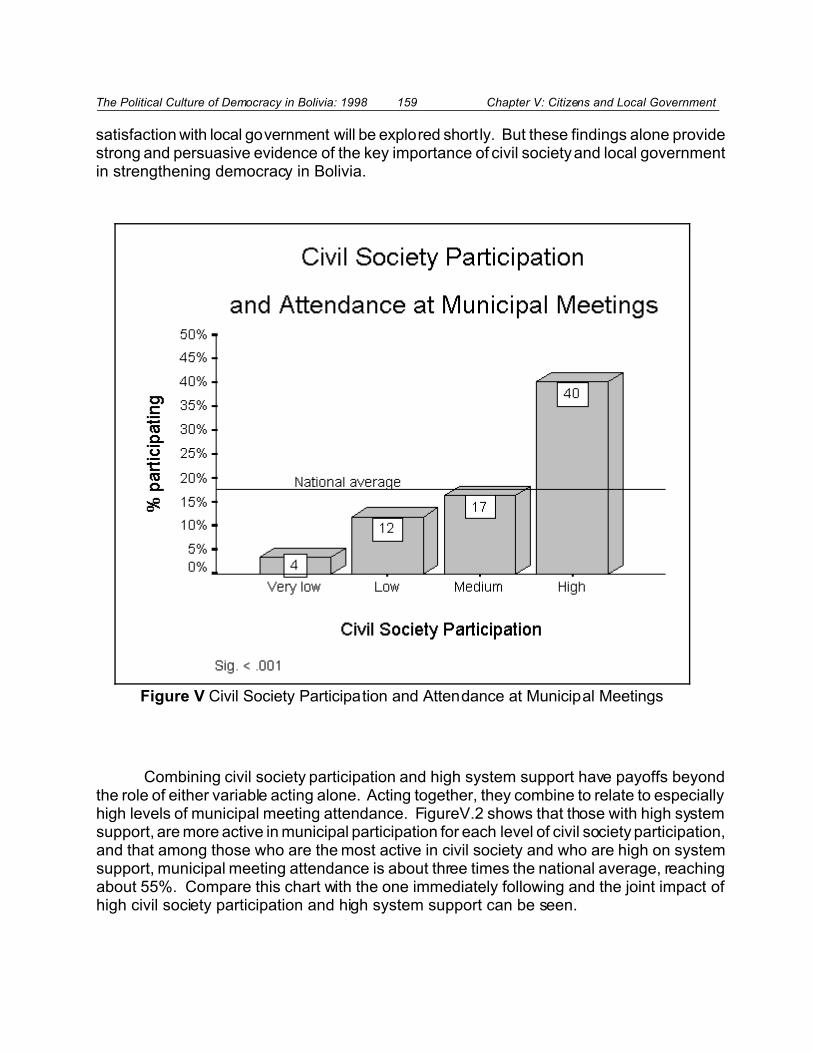
The Political Culture of Democracy in Bolivia: 1998 159 Chapter V: Citizens and Local Government
Figure V Civil Society Participation and Attendance at Municipal Meetings
satisfaction with local government will be explored shortly. But these findings alone providestrong and persuasive evidence of the key importance of civil society and local governmentin strengthening democracy in Bolivia.
Combining civil society participation and high system support have payoffs beyondthe role of either variable acting alone. Acting together, they combine to relate to especiallyhigh levels of municipal meeting attendance. FigureV.2 shows that those with high systemsupport, are more active in municipal participation for each level of civil society participation,and that among those who are the most active in civil society and who are high on systemsupport, municipal meeting attendance is about three times the national average, reachingabout 55%. Compare this chart with the one immediately following and the joint impact ofhigh civil society participation and high system support can be seen.

The Political Culture of Democracy in Bolivia: 1998 160 Chapter V: Citizens and Local Government
Figure V Attendance at Municipal Meetings, Civil Society Participation and System Support
The impact on municipal meeting attendance of the socio-economic anddemographic factors described earlier in this chapter can now be placed in the context ofcivil society participation. FigureV.2 shows the impact of place of residence. Participationin municipal meetings is low in urban areas, but for those who are active members of civilsociety, participation in municipal meetings is dramatically higher, as is shown on the right-hand side of the figure. For those with high levels of civil society participation and who liveoutside of the large urban areas, about half or more have attended a municipal meeting inthe last year.
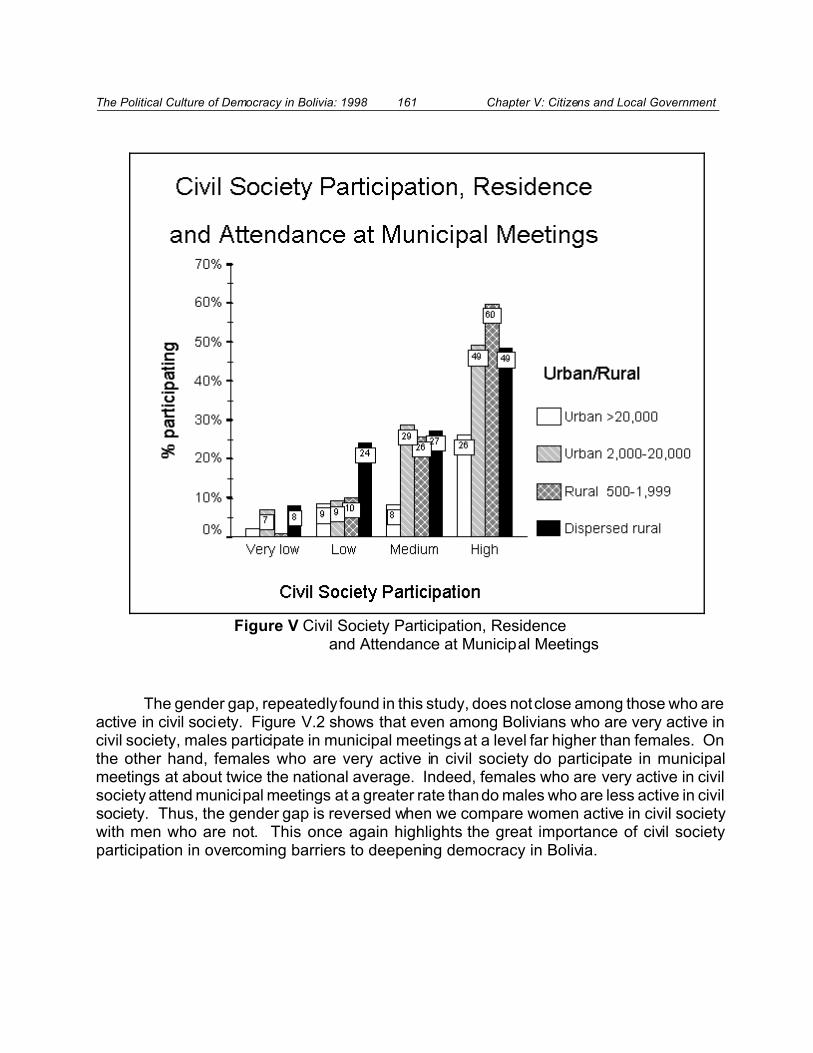
The Political Culture of Democracy in Bolivia: 1998 161 Chapter V: Citizens and Local Government
Figure V Civil Society Participation, Residence and Attendance at Municipal Meetings
The gender gap, repeatedly found in this study, does not close among those who areactive in civil society. Figure V.2 shows that even among Bolivians who are very active incivil society, males participate in municipal meetings at a level far higher than females. Onthe other hand, females who are very active in civil society do participate in municipalmeetings at about twice the national average. Indeed, females who are very active in civilsociety attend municipal meetings at a greater rate than do males who are less active in civilsociety. Thus, the gender gap is reversed when we compare women active in civil societywith men who are not. This once again highlights the great importance of civil societyparticipation in overcoming barriers to deepening democracy in Bolivia.
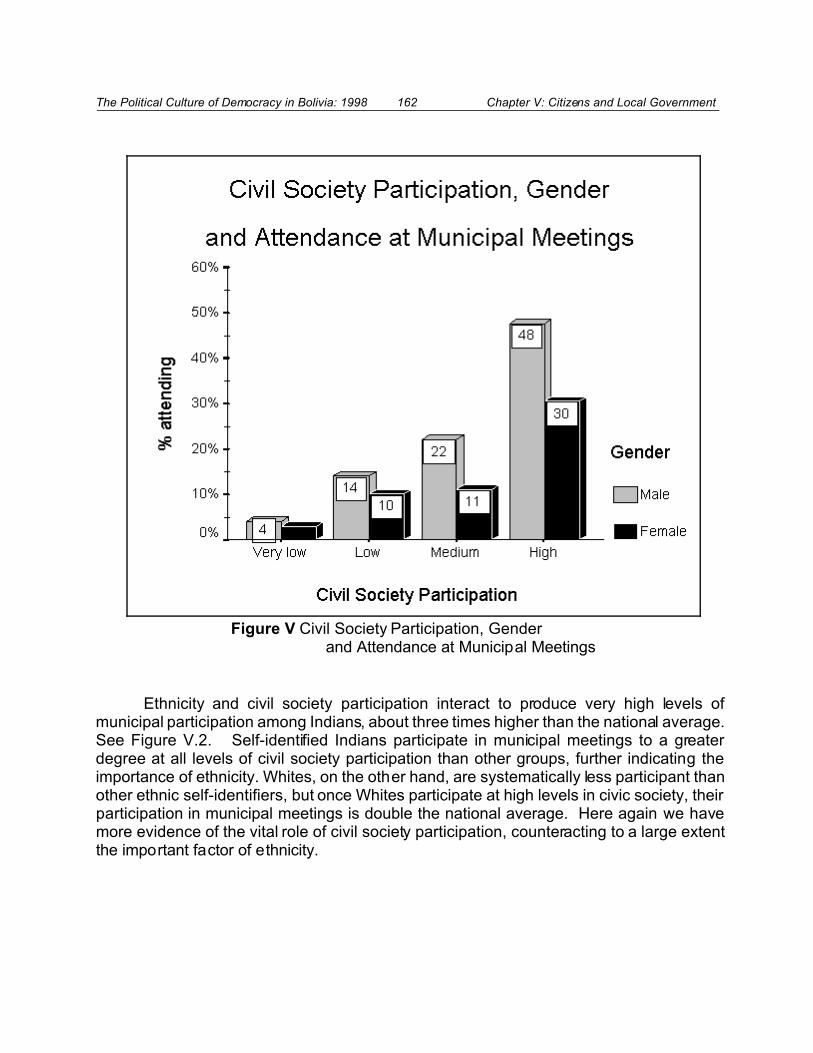
The Political Culture of Democracy in Bolivia: 1998 162 Chapter V: Citizens and Local Government
Figure V Civil Society Participation, Gender and Attendance at Municipal Meetings
Ethnicity and civil society participation interact to produce very high levels ofmunicipal participation among Indians, about three times higher than the national average.See Figure V.2. Self-identified Indians participate in municipal meetings to a greaterdegree at all levels of civil society participation than other groups, further indicating theimportance of ethnicity. Whites, on the other hand, are systematically less participant thanother ethnic self-identifiers, but once Whites participate at high levels in civic society, theirparticipation in municipal meetings is double the national average. Here again we havemore evidence of the vital role of civil society participation, counteracting to a large extentthe important factor of ethnicity.
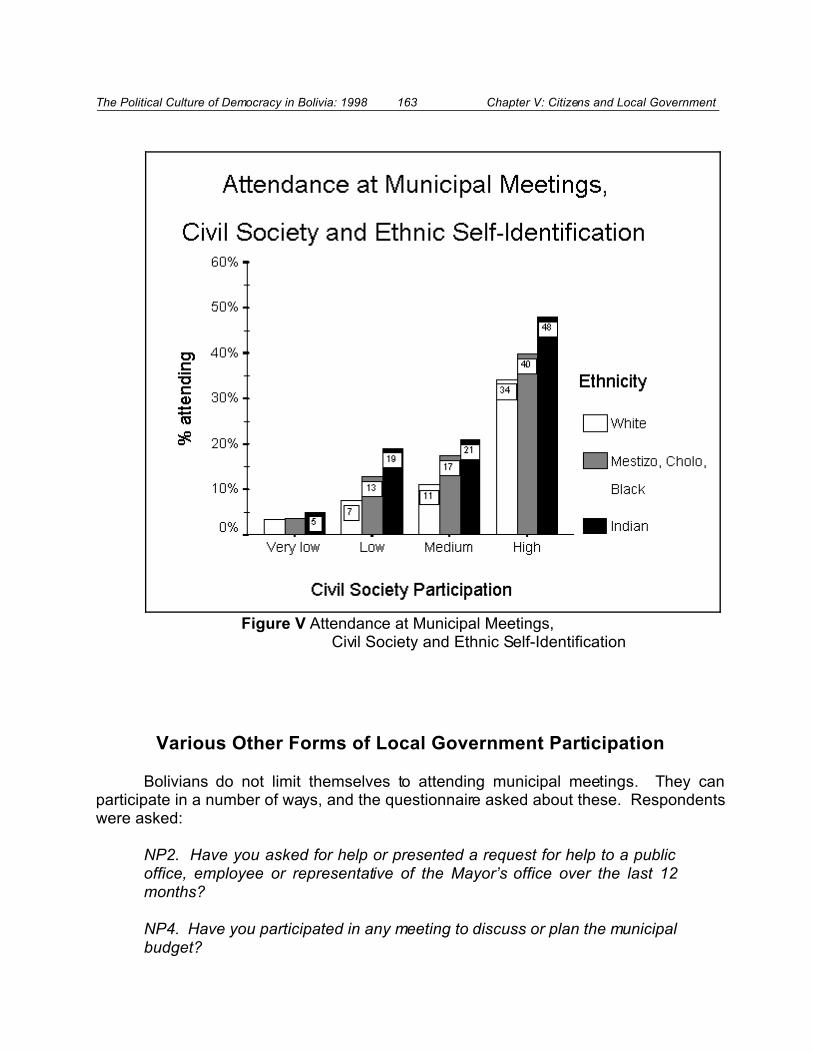
The Political Culture of Democracy in Bolivia: 1998 163 Chapter V: Citizens and Local Government
Figure V Attendance at Municipal Meetings, Civil Society and Ethnic Self-Identification
Various Other Forms of Local Government Participation
Bolivians do not limit themselves to attending municipal meetings. They canparticipate in a number of ways, and the questionnaire asked about these. Respondentswere asked:
NP2. Have you asked for help or presented a request for help to a publicoffice, employee or representative of the Mayor’s office over the last 12months?
NP4. Have you participated in any meeting to discuss or plan the municipalbudget?
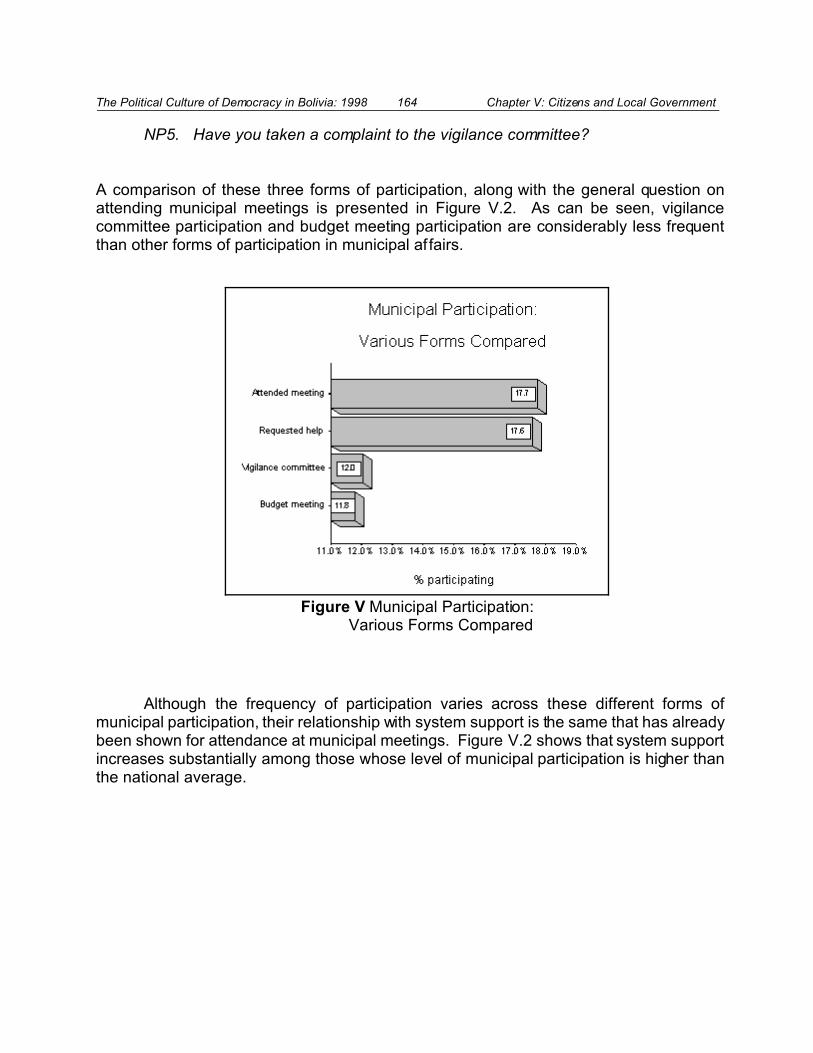
The Political Culture of Democracy in Bolivia: 1998 164 Chapter V: Citizens and Local Government
Figure V Municipal Participation:Various Forms Compared
NP5. Have you taken a complaint to the vigilance committee?
A comparison of these three forms of participation, along with the general question onattending municipal meetings is presented in Figure V.2. As can be seen, vigilancecommittee participation and budget meeting participation are considerably less frequentthan other forms of participation in municipal affairs.
Although the frequency of participation varies across these different forms ofmunicipal participation, their relationship with system support is the same that has alreadybeen shown for attendance at municipal meetings. Figure V.2 shows that system supportincreases substantially among those whose level of municipal participation is higher thanthe national average.
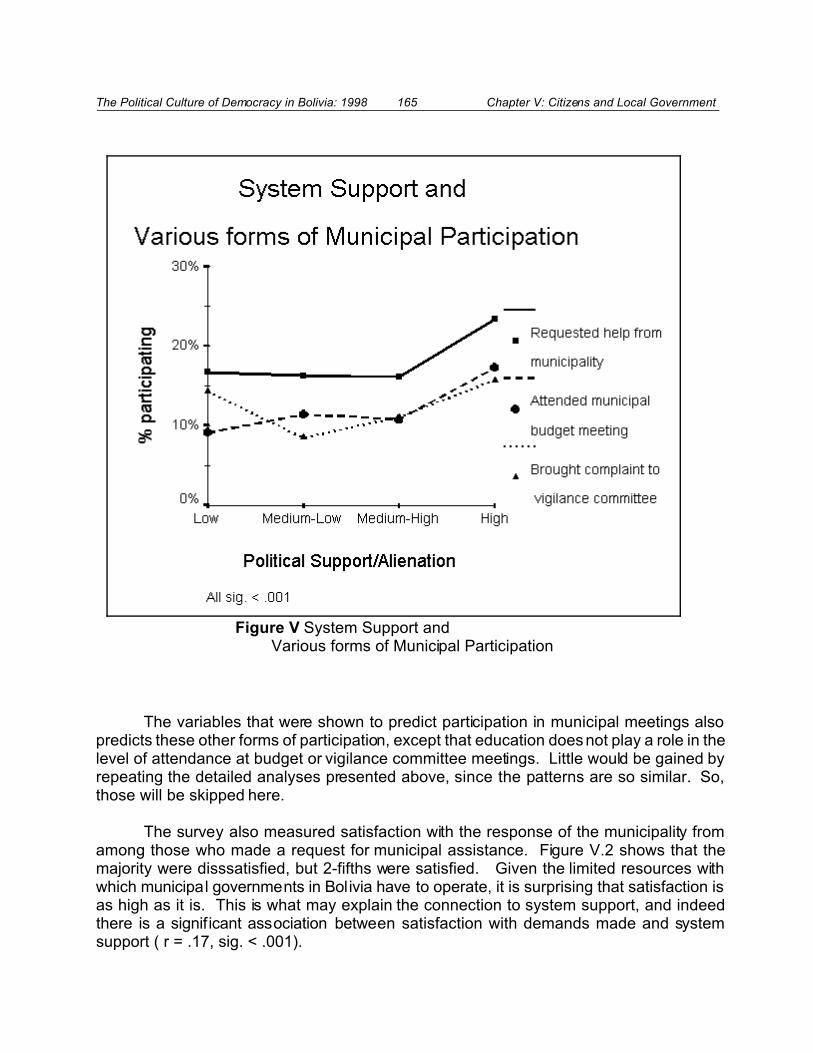
The Political Culture of Democracy in Bolivia: 1998 165 Chapter V: Citizens and Local Government
Figure V System Support and Various forms of Municipal Participation
The variables that were shown to predict participation in municipal meetings alsopredicts these other forms of participation, except that education does not play a role in thelevel of attendance at budget or vigilance committee meetings. Little would be gained byrepeating the detailed analyses presented above, since the patterns are so similar. So,those will be skipped here.
The survey also measured satisfaction with the response of the municipality fromamong those who made a request for municipal assistance. Figure V.2 shows that themajority were disssatisfied, but 2-fifths were satisfied. Given the limited resources withwhich municipal governments in Bolivia have to operate, it is surprising that satisfaction isas high as it is. This is what may explain the connection to system support, and indeedthere is a significant association between satisfaction with demands made and systemsupport ( r = .17, sig. < .001).

The Political Culture of Democracy in Bolivia: 1998 166 Chapter V: Citizens and Local Government
Figure V Satisfaction with response from municipality among those who made a demand
The close connection between system support and satisfaction with municipal
response to citizen demands is shown in Figure V.2. Among those with low system support,fewer than 30% were satisfied with the response of the municipality, whereas among thosewith high system support about 55% were satisfied. These findings suggest thatsatisfaction of citizen demands at the local level is vital to building support for the politicalsystem at the national level. Satisfaction of citizen demands depends, in part, on theavailability of resources (especially budgets), but it also depends upon the good will ofmunicipal officials. Absent budgets or absent good will, and citizen demands will beinvariably frustrated.
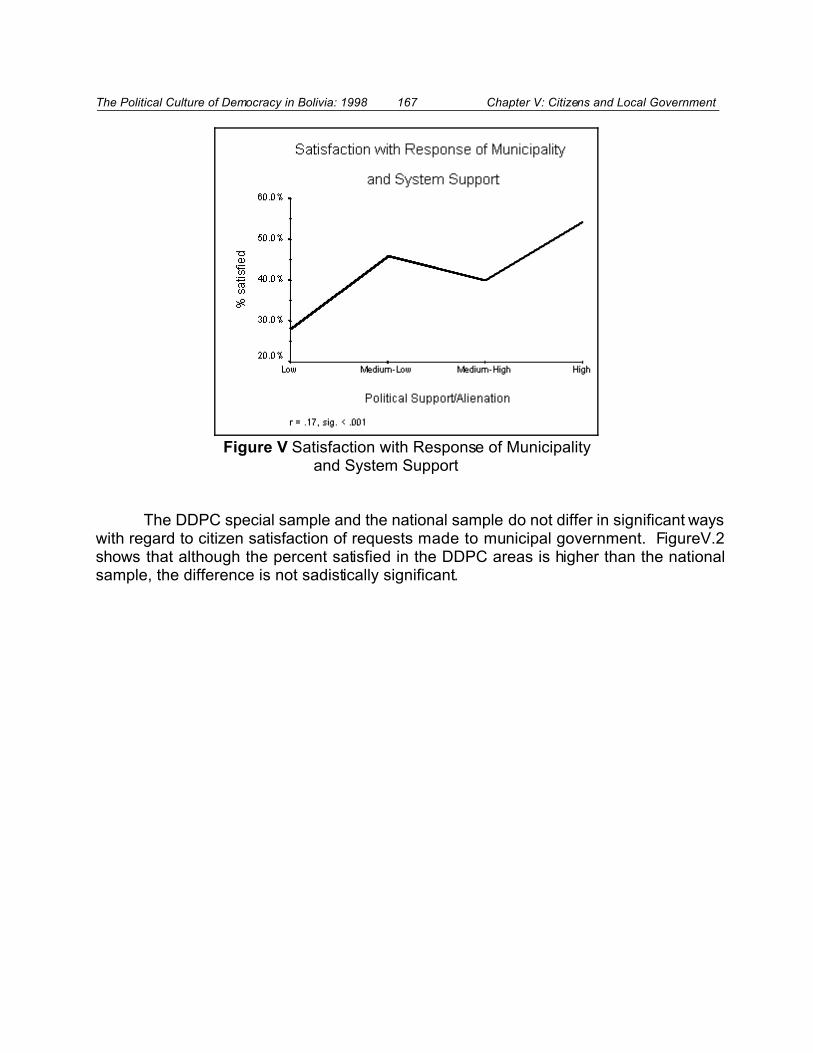
The Political Culture of Democracy in Bolivia: 1998 167 Chapter V: Citizens and Local Government
Figure V Satisfaction with Response of Municipality and System Support
The DDPC special sample and the national sample do not differ in significant wayswith regard to citizen satisfaction of requests made to municipal government. FigureV.2shows that although the percent satisfied in the DDPC areas is higher than the nationalsample, the difference is not sadistically significant.
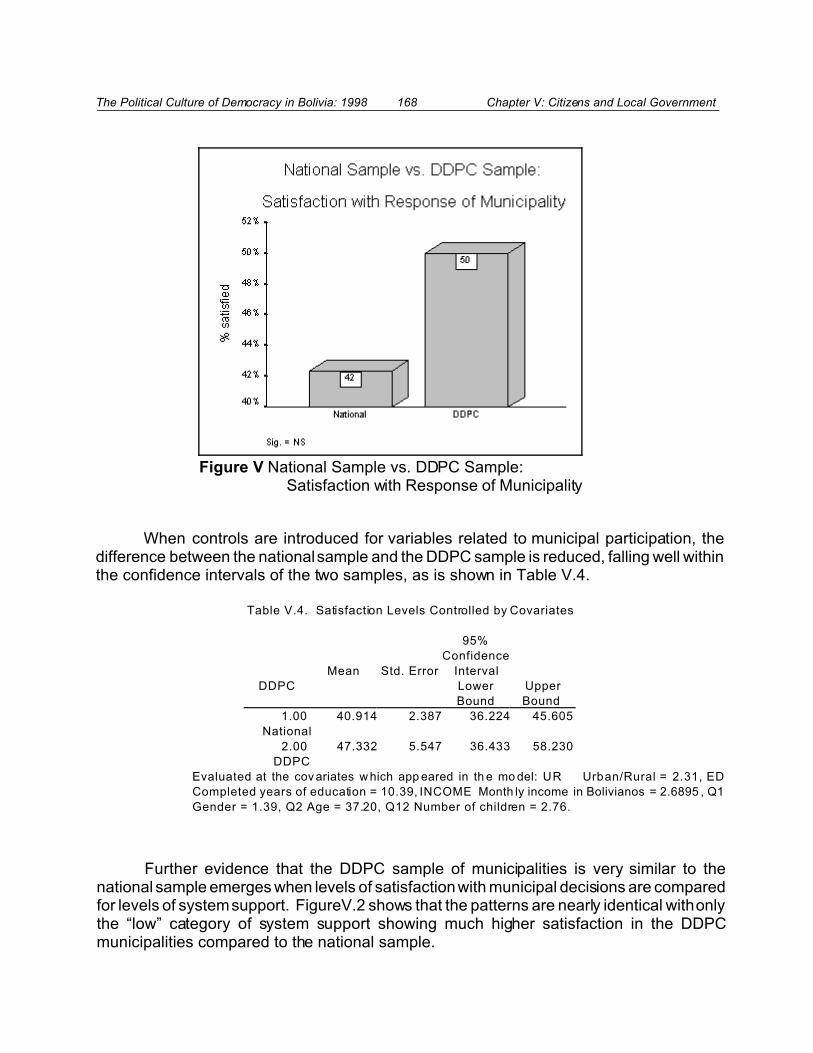
The Political Culture of Democracy in Bolivia: 1998 168 Chapter V: Citizens and Local Government
Figure V National Sample vs. DDPC Sample: Satisfaction with Response of Municipality
When controls are introduced for variables related to municipal participation, thedifference between the national sample and the DDPC sample is reduced, falling well withinthe confidence intervals of the two samples, as is shown in Table V.4.
Table V.4. Satisfaction Levels Controlled by Covariates
Mean Std. Error
95%
Confidence
Interval
DDPC Lower
Bound
Upper
Bound
1.00
National
40.914 2.387 36.224 45.605
2.00
DDPC
47.332 5.547 36.433 58.230
Evaluated at the cov ariates w hich app eared in th e mo del: UR Urban/Rural = 2.31, ED
Completed years of education = 10.39, INCOME Month ly income in Bolivianos = 2.6895 , Q1
Gender = 1.39, Q2 Age = 37.20, Q12 Number of children = 2.76.
Further evidence that the DDPC sample of municipalities is very similar to thenational sample emerges when levels of satisfaction with municipal decisions are comparedfor levels of system support. FigureV.2 shows that the patterns are nearly identical with onlythe “low” category of system support showing much higher satisfaction in the DDPCmunicipalities compared to the national sample.

The Political Culture of Democracy in Bolivia: 1998 169 Chapter V: Citizens and Local Government
85The item was coded as follows: Excellent = 100, Good = 75, Fair = 50, Poor = 25,Very poor = 0.
Figure V Satisfaction with Response of Municipality and System Support: National vs. DDPC
Satisfaction with Municipal Services
The initial series of items on participation in local government was followed by twoquestions regarding satisfaction with services. The items read:
SGL1. Would you say that the services that the mayor’s office is giving the peopleis excellent, good, fair, poor or very poor?
SGL2. How were you or your neighbors treated when they have gone to themunicipality to carry out a transaction. Did they treat you very well, well, fair, poorlyor very poorly?
Bolivia can be placed in comparative perspective by comparing the results of the first itemto the University of Pittsburgh Latin American Public Opinion Project data base.85 FigureV.2 shows that Bolivians express somewhat less satisfaction than in the other countries, butthe differences on the 0-100 scale are not great. The main difference emerges betweenBolivia on the low end and Paraguay on the high end, with the other differences within theconfidence interval. Nonetheless, the differences are statistically significant, and only goesto emphasize the point made at the beginning of this chapter, namely, that municipal

The Political Culture of Democracy in Bolivia: 1998 170 Chapter V: Citizens and Local Government
Figure V Satisfaction with Municipal Services: Bolivia in Comparative Perspective
government in Bolivia historically has been weak, and that the recent reforms have a longway to go before they can persuade the citizenry that things have really changed.
In each of the countries in the data base the evaluation of municipal governmentservices is directly linked to system support at the national level. Figure V.2 shows therelationship. Bolivia follows this Latin America-wide pattern. These results are a furtherindication of the importance of the effectiveness of local government; those municipalgovernments that manage to satisfy their constituents are those that are helping to promotethe legitimacy of the national system of government.
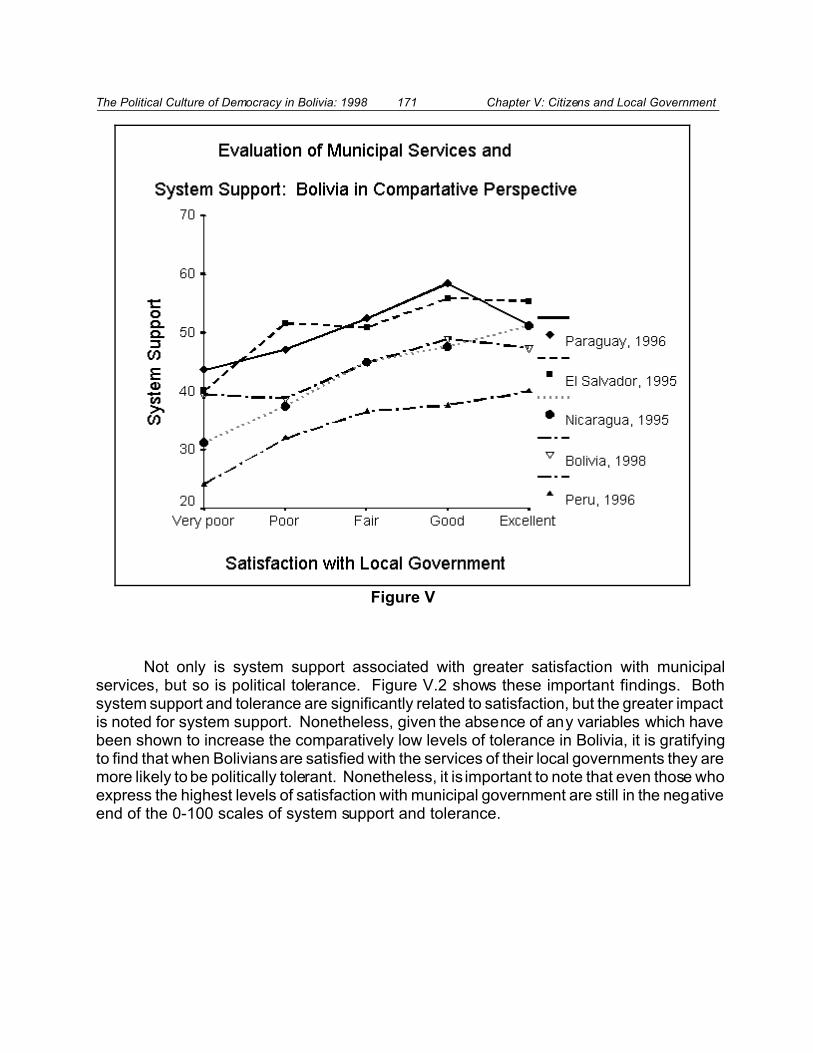
The Political Culture of Democracy in Bolivia: 1998 171 Chapter V: Citizens and Local Government
Figure V
Not only is system support associated with greater satisfaction with municipalservices, but so is political tolerance. Figure V.2 shows these important findings. Bothsystem support and tolerance are significantly related to satisfaction, but the greater impactis noted for system support. Nonetheless, given the absence of any variables which havebeen shown to increase the comparatively low levels of tolerance in Bolivia, it is gratifyingto find that when Bolivians are satisfied with the services of their local governments they aremore likely to be politically tolerant. Nonetheless, it is important to note that even those whoexpress the highest levels of satisfaction with municipal government are still in the negativeend of the 0-100 scales of system support and tolerance.
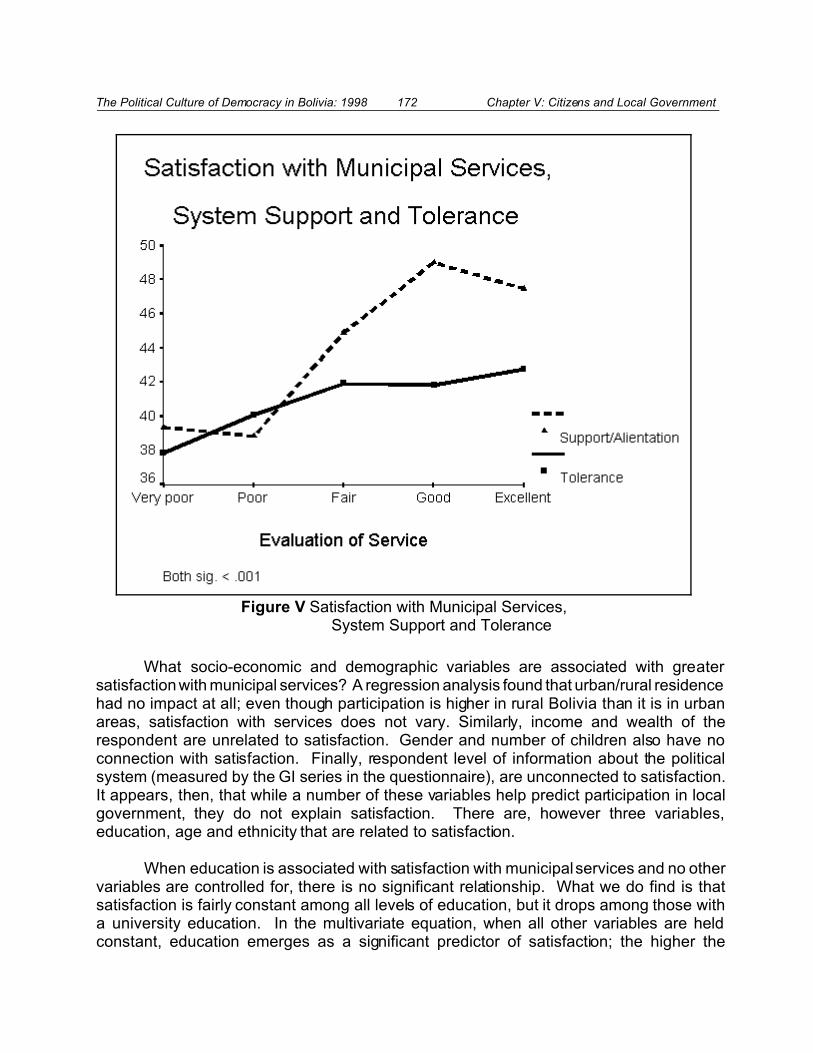
The Political Culture of Democracy in Bolivia: 1998 172 Chapter V: Citizens and Local Government
Figure V Satisfaction with Municipal Services, System Support and Tolerance
What socio-economic and demographic variables are associated with greatersatisfaction with municipal services? A regression analysis found that urban/rural residencehad no impact at all; even though participation is higher in rural Bolivia than it is in urbanareas, satisfaction with services does not vary. Similarly, income and wealth of therespondent are unrelated to satisfaction. Gender and number of children also have noconnection with satisfaction. Finally, respondent level of information about the politicalsystem (measured by the GI series in the questionnaire), are unconnected to satisfaction.It appears, then, that while a number of these variables help predict participation in localgovernment, they do not explain satisfaction. There are, however three variables,education, age and ethnicity that are related to satisfaction.
When education is associated with satisfaction with municipal services and no othervariables are controlled for, there is no significant relationship. What we do find is thatsatisfaction is fairly constant among all levels of education, but it drops among those witha university education. In the multivariate equation, when all other variables are heldconstant, education emerges as a significant predictor of satisfaction; the higher the
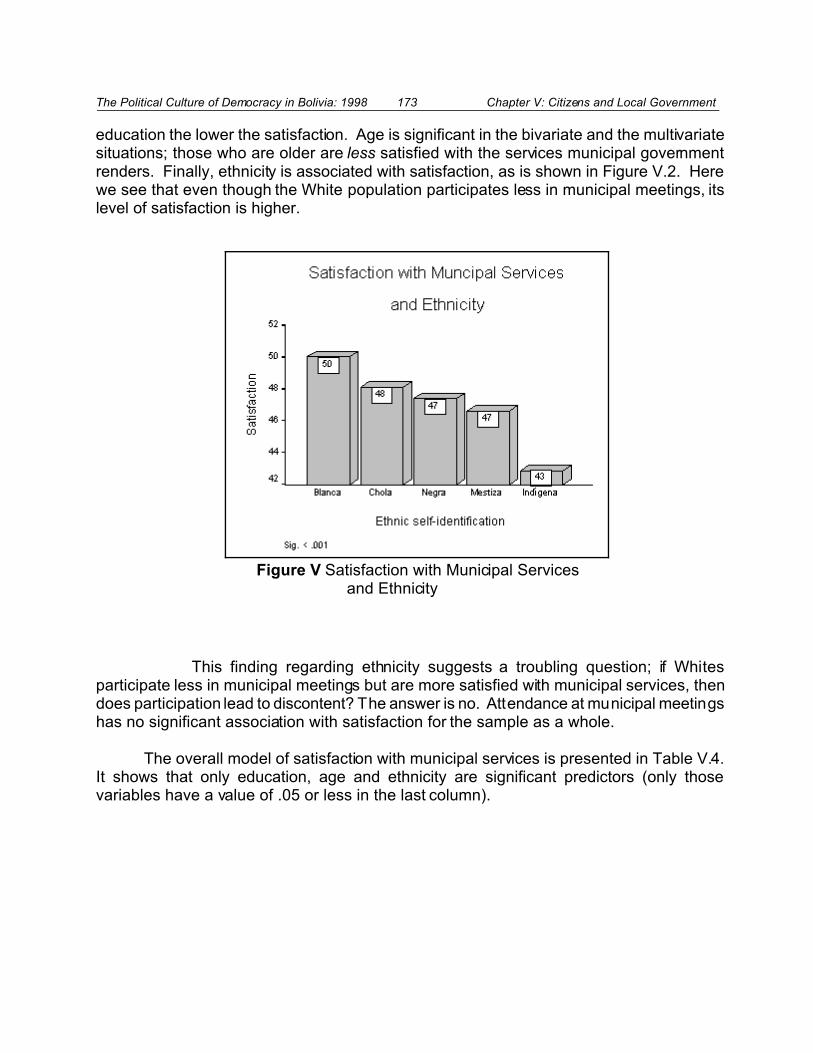
The Political Culture of Democracy in Bolivia: 1998 173 Chapter V: Citizens and Local Government
Figure V Satisfaction with Municipal Services and Ethnicity
education the lower the satisfaction. Age is significant in the bivariate and the multivariatesituations; those who are older are less satisfied with the services municipal governmentrenders. Finally, ethnicity is associated with satisfaction, as is shown in Figure V.2. Herewe see that even though the White population participates less in municipal meetings, itslevel of satisfaction is higher.
This finding regarding ethnicity suggests a troubling question; if Whitesparticipate less in municipal meetings but are more satisfied with municipal services, thendoes participation lead to discontent? The answer is no. Attendance at municipal meetingshas no significant association with satisfaction for the sample as a whole.
The overall model of satisfaction with municipal services is presented in Table V.4.It shows that only education, age and ethnicity are significant predictors (only thosevariables have a value of .05 or less in the last column).
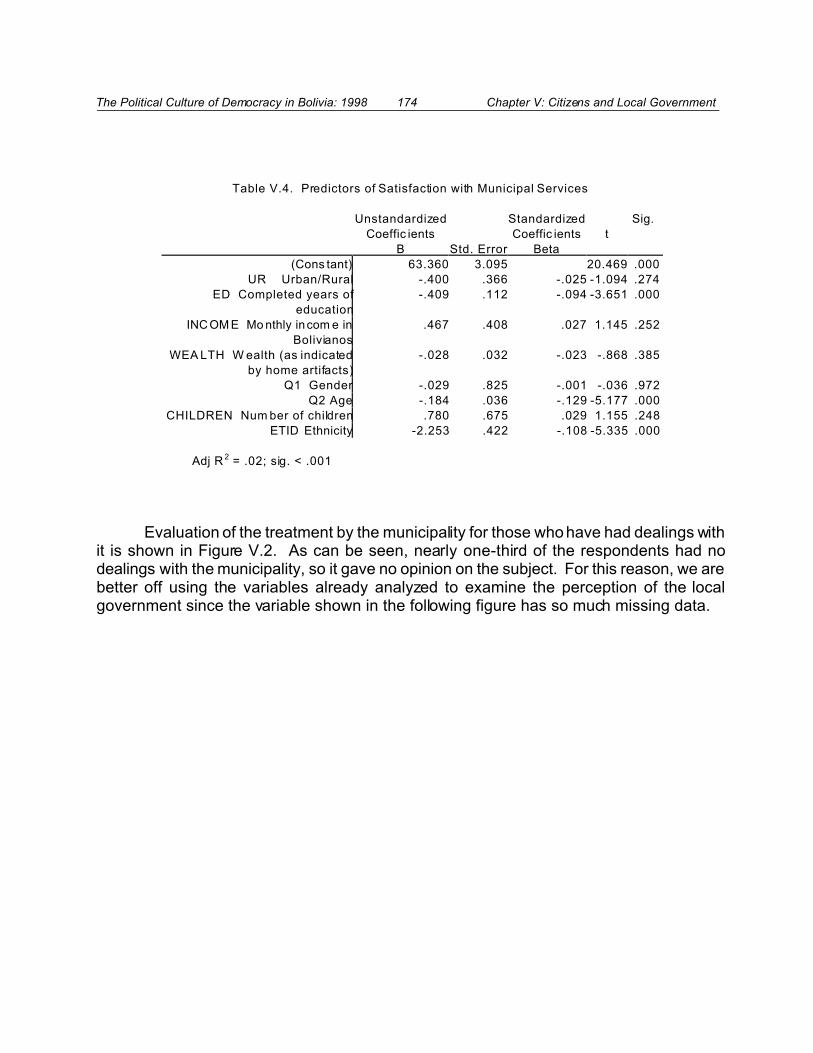
The Political Culture of Democracy in Bolivia: 1998 174 Chapter V: Citizens and Local Government
Table V.4. Predictors of Satisfaction with Municipal Services
Unstandardized
Coeffic ients
Standardized
Coeffic ients t
Sig.
B Std. Error Beta
(Cons tant) 63.360 3.095 20.469 .000
UR Urban/Rural -.400 .366 -.025 -1.094 .274
ED Completed years of
education
-.409 .112 -.094 -3.651 .000
INC OM E Mo nthly incom e in
Bolivianos
.467 .408 .027 1.145 .252
WEA LTH W ealth (as indicated
by home artifacts)
-.028 .032 -.023 -.868 .385
Q1 Gender -.029 .825 -.001 -.036 .972
Q2 Age -.184 .036 -.129 -5.177 .000
CHILDREN Num ber of children .780 .675 .029 1.155 .248
ETID Ethnicity -2.253 .422 -.108 -5.335 .000
Adj R 2 = .02; sig. < .001
Evaluation of the treatment by the municipality for those who have had dealings withit is shown in Figure V.2. As can be seen, nearly one-third of the respondents had nodealings with the municipality, so it gave no opinion on the subject. For this reason, we arebetter off using the variables already analyzed to examine the perception of the localgovernment since the variable shown in the following figure has so much missing data.

The Political Culture of Democracy in Bolivia: 1998 175 Chapter V: Citizens and Local Government
86Note that some of those who were interviewed said “none” and others said “all thesame.” These choices were noted but not read to respondent.
Figure V Treatment by Municipality
Legitimacy of Local Government
A series of four items was asked in an attempt to measure the legitimacy of localgovernment as an institution. Respondents were first asked:
LGL1. In your opinion, who has responded better to help resolve the problems ofthis community? The central government, the Congress, or the municipality?86
Figure V.2 shows that overwhelmingly Bolivians see their local governments as the bestsource for solving local problems.

The Political Culture of Democracy in Bolivia: 1998 176 Chapter V: Citizens and Local Government
Figure V Who resolves community problems best?
The second question to measure the legitimacy of local government read as follows:
LGL2. In your opinion, should more responsibility and more money be given to themunicipal government or should we let the central government assume moreresponsibility and more municipal services (e.g., water, waste, etc.).
Figure V.2 shows that the municipality was favored over the central government. Whenadded to those who qualified their support of municipal government by supporting a greaterrole for it only if it provided better services, nearly two-thirds of Bolivians want greatermunicipal control over local services.
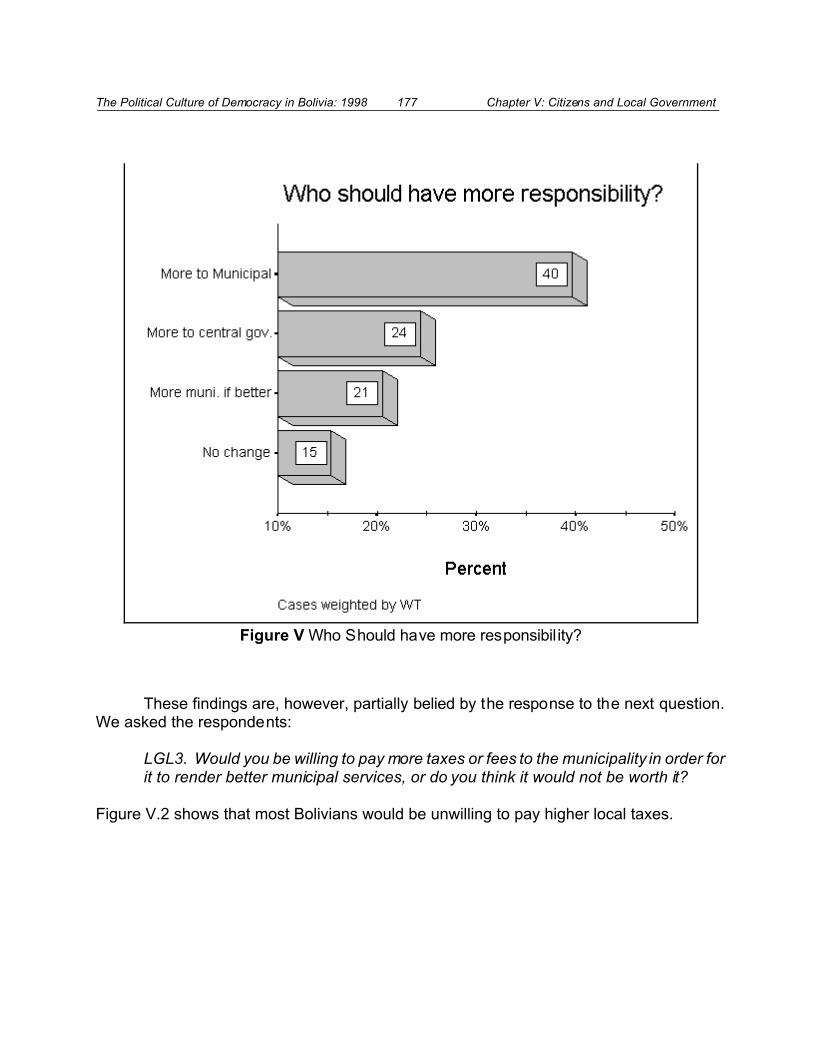
The Political Culture of Democracy in Bolivia: 1998 177 Chapter V: Citizens and Local Government
Figure V Who Should have more responsibil ity?
These findings are, however, partially belied by the response to the next question.We asked the respondents:
LGL3. Would you be willing to pay more taxes or fees to the municipality in order forit to render better municipal services, or do you think it would not be worth it?
Figure V.2 shows that most Bolivians would be unwilling to pay higher local taxes.

The Political Culture of Democracy in Bolivia: 1998 178 Chapter V: Citizens and Local Government
Figure V Willingness to Pay More Local Taxes for Better Services
The final item in the series attempted to measure responsiveness of the municipalityto citizen wishes. The question read:
LGL4. Do you think that the municipality responds to the what the people wantalmost always, the majority of the time, once in a while, almost never or never?
Figure V.2 shows that only a small percentage of Bolivians believe that the municipality isvery responsive to its citizens. Most feel that local government is responsive from time-to-time.

The Political Culture of Democracy in Bolivia: 1998 179 Chapter V: Citizens and Local Government
Figure V Responsiveness of Municipality
Conclusions
In this chapter important linkages have been found between civil society, localgovernment and democracy. Bolivians active in civil society are far more likely to participatein municipal government meetings. Those who attend municipal meetings, in turn, expressfar higher support for the political system at the national level than those who do not.Citizens who both have high levels of civil society participation and high system support, arethose most likely to attend municipal government meetings. Furthermore, satisfaction withthe responsiveness of municipal government is strongly linked to system support. As anadded bonus, those who are satisfied with municipal services are likely to be more tolerant.It would appear that these results suggest a true “virtuous circle” of activism in civil society,activism in local government and support for the institutions of the political system moregenerally. In contrast, a “vicious circle” of inactivism in civil society, local government andlow system support is also present in Bolivia, and it is the predominant pattern. Inquantitative terms, among Bolivian males who have high levels of civil society participation,48% attend municipal meetings, compared to only 4% who have very low civil societyparticipation.
The challenge, then, is to find out how to increase civil society participation and withit municipal government participation. This challenge is especially difficult, given thatmunicipal meeting attendance and satisfaction with municipal services in Bolivia is relativelylow compared to some other countries in Latin America, as the data base has shown. The

The Political Culture of Democracy in Bolivia: 1998 180 Chapter V: Citizens and Local Government
even greater challenge is one of gender and place of residence. Females are far less likelythan males to participate in municipal meetings, and we have already seen that they areless likely to participate in many (but not all) forms of civil society associations. Urban areasare especially low on municipal meeting attendance, and among those who self-identify as“White.” Nonetheless, the recent decentralization and popular participation laws providekey instruments to enable citizens with strong incentives to participate in their localorganizations and governments. Ways need to be found to capitalize on those importantreforms so that democracy can be strengthened in Bolivia.
The Political Culture of Democracy in Bolivia: 1998 181 Chapter VI: Administration of Justice
Chapter VI. Administration of Justice
Democracy has brought unprecedented freedom to Latin Americans in general, andBolivians in particular. But with freedom, comes responsibility, and unfortunately in anumber of countries some members of the society have taken advantage of their new-foundfreedoms to victimize others. Throughout Latin America one daily reads and hears aboutastronomical crime rates, and it may be a sad reality that in the minds of some LatinAmericans, crime and democracy go together. Of course, there was much crime undermilitary rule as well, but official crime, especially military crime, rarely was reported. Andhuman rights crimes became an everyday event in some countries in the region. However,much of the crime committed during the authoritarian period went unreported, whereasdemocracy has been accompanied by free press, TV and radio. It is not surprising,therefore, that democracy and criminality are being associated in the minds of somecitizens.
Crime, of course, is only one part of the equation. The other part is theadministration of justice; how the political system handles the problem of crime. Thischapter deals with both sides of the equation. It looks at the victims and it looks at howBolivians have been treated by the criminal justice system. The focus of the chapter will beon the questionnaire series of items AOJ1 through AOJ7.
Victimization in Bolivia
What proportion of our 1998 sample of adult Bolivians have been victims of a crime?To determine this, we asked two questions. First we asked:
AOJ3. During the last 12 months, have you been a victim of robbery orcrime?
We then asked:
AOJ3B. During the last 12 months, has some member of your family been avictim of robbery or crime?
The results are contained in Figure VI.1 As can be seen, 23% of the respondents havebeen a victim of crime within the past year, and 21% report that a family member has beenvictim. Since many surveys ask a combined question (respondent and family), thecombined results are also presented in the figure; one-third of respondents or their familymembers have been victims of crime within the past year.

The Political Culture of Democracy in Bolivia: 1998 182 Chapter VI: Administration of Justice
Figure VI Victimization in Bolivia: 1998
How does Bolivia compare with the rest of Latin America? One good approximationcan be obtained by looking at the 1996 Latinbarometer data set, which covers 17 mainlandLatin American countries. The question asked was: “Have you or someone in your familybeen assaulted, attacked, or victim of a crime in the last year?” This item, then, is similarto the combined results shown on the figure above (combining crimes against therespondent and crimes against the family of the respondent). The results are shown inFigure VI.3. It needs to be kept in mind that approximately two years separate theLatinbarometer data and the survey being analyzed here and crime rates may haveincreased or decreased since that time period. But, one might assume that they arerelatively similar. The Latinbarometer data match closely the current survey results inBolivia, and also show that crime in Bolivia is not nearly as great at it is in some of thecountries in the region. However, given the differences in sample design, and the width ofthe confidence interval for each sample, Bolivia’s level of self-reported victimization is quitesimilar to a broad range of countries, from Peru to Argentina (see figure). Bolivia’s samplein the Latinbarometer was especially small ( N = 772), and must be interpreted with caution.The confidence interval for the Bolivia sample ranges from 25% to 32%.

The Political Culture of Democracy in Bolivia: 1998 183 Chapter VI: Administration of Justice
Figure VI Victimization in Latin America: 1996
Impact of Victimization
Does being a victim of crime in Bolivia have an impact on one’s perception of thepolitical system? Specifically, do those who personally, or in their families, experience crimeexpress lower support for the political system? The answer is yes. Figure VI.5 shows thatvictims express significantly less support than non-victims. And we can be certain that it isthe crime that caused the lower system support rather than the other way around, sincecriminals could not possibly seek out victims on the basis of their system support. Thesefindings strongly suggest that when the political system is unable to control crime, itjeopardizes its own legit imacy. Furthermore, our measurement of victimization is limited tothe 12 months prior to the survey. It may well be that those who were victims at an earlierpoint in time, or who have been victims repeatedly would show an even lower level ofsystem support, but the survey does not give us this kind of data.

The Political Culture of Democracy in Bolivia: 1998 184 Chapter VI: Administration of Justice
87Robert D. Putnam, Making Democracy Work: Civic Traditions in Modern Italy(Princeton, N.J.: Princeton University Press, 1993); Ronald Inglehart, Modernization andPostmodernization: Cultural, Economic and Political Change in 43 Societies (Princeton,N. J.: Princeton University Press, 1997).
Figure VI Victimization and System Support
Being a crime victim also seems to affect Bolivians’ more general outlook on life.One key variable in the democracy literature is interpersonal trust. Scholars such as RobertPutnam and Ronald Inglehart have made a strong case that trust in individuals is anessential ingredient for democracies to function.87 Figure VI.7 shows that among those whoexpress the view that people in their community are very trustworthy, fewer than one quarterhave been victims of a crime (personally or in the family), whereas among those who saypeople are not at all trustworthy, about 40% have been victims of a crime.
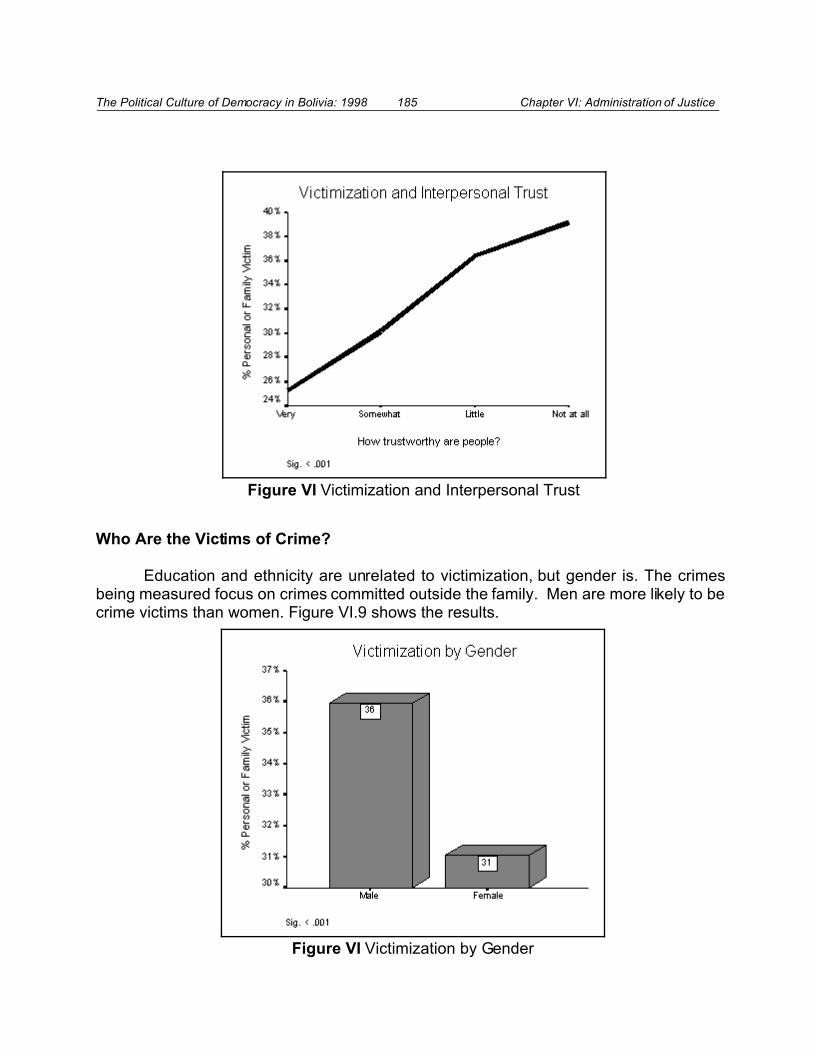
The Political Culture of Democracy in Bolivia: 1998 185 Chapter VI: Administration of Justice
Figure VI Victimization and Interpersonal Trust
Figure VI Victimization by Gender
Who Are the Victims of Crime?
Education and ethnicity are unrelated to victimization, but gender is. The crimesbeing measured focus on crimes committed outside the family. Men are more likely to becrime victims than women. Figure VI.9 shows the results.

The Political Culture of Democracy in Bolivia: 1998 186 Chapter VI: Administration of Justice
Figure VI Victimization and Age
Age also has an impact on victimization, with the young more likely to be victims thanthe old. Figure VI.11 shows that over 35% of the youngest Bolivians in the sample havebeen crime victims, whereas only one-quarter of those 65 and older have been. Thesharpest fall-off is in the oldest cohort.
It is not at all surprising that urbanites are more likely to be crime victims than ruralresidents. Figure VI.13 shows this pattern clearly.
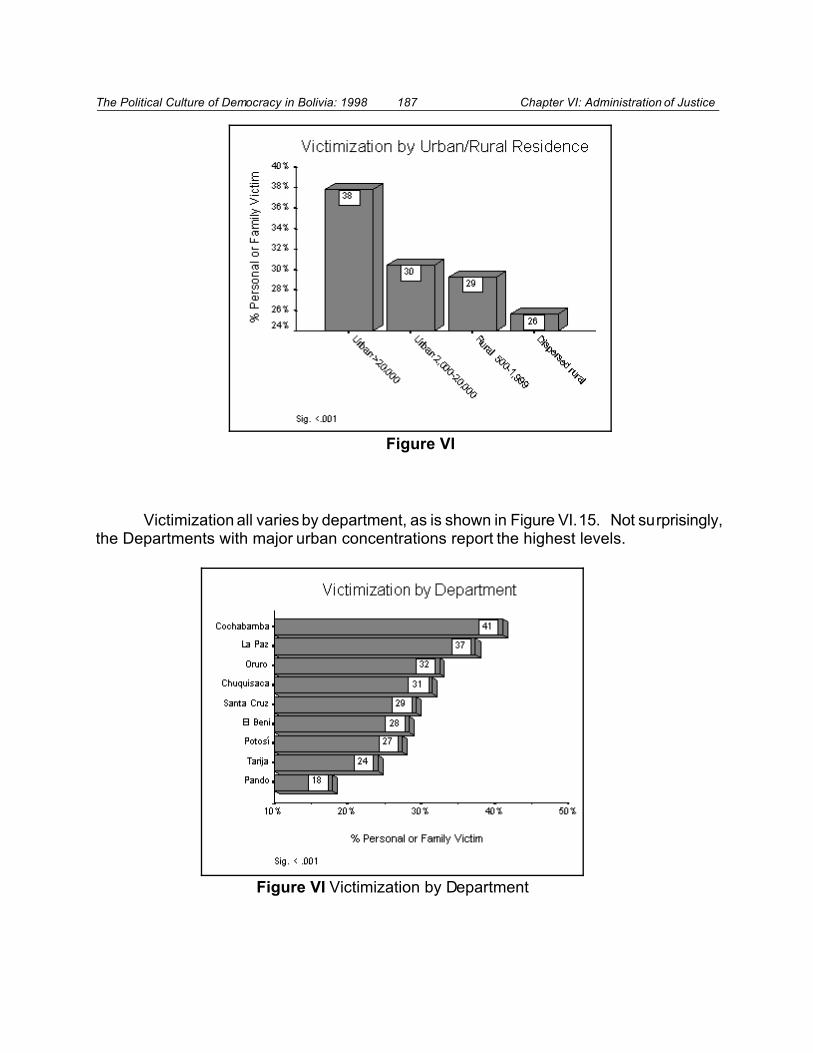
The Political Culture of Democracy in Bolivia: 1998 187 Chapter VI: Administration of Justice
Figure VI
Figure VI Victimization by Department
Victimization all varies by department, as is shown in Figure VI.15. Not surprisingly,the Departments with major urban concentrations report the highest levels.

The Political Culture of Democracy in Bolivia: 1998 188 Chapter VI: Administration of Justice
Figure VI Victimization and Wealth
Finally, wealth is associated with victimization. Wealthier Bolivians are more likelyto be victims than poorer Bolivians (see Figure VI.17) .
Views of the Justice System
Reporting Crime
Once citizens have become victims of a crime, what do they do about it? We askedthose who were victims if they reported the crime, and to which authority did they report it.Figure VI.19 shows that only a minority of victims reported the crime, and of those, mostreported it to the police.
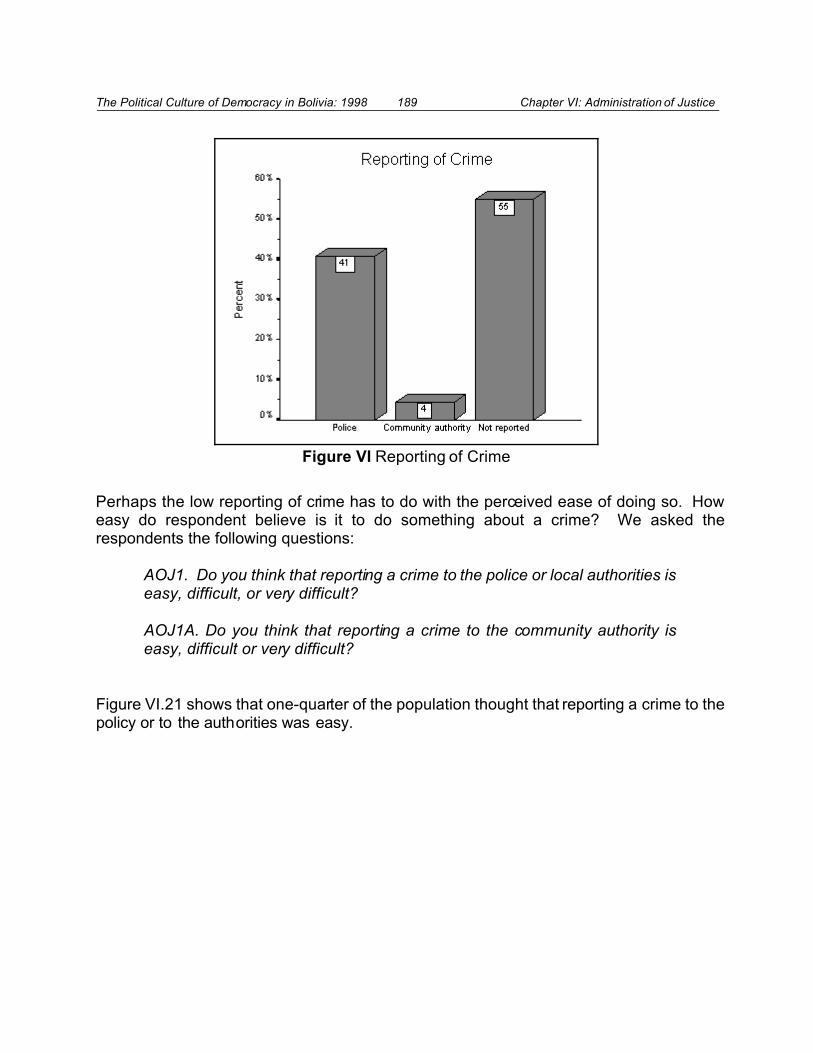
The Political Culture of Democracy in Bolivia: 1998 189 Chapter VI: Administration of Justice
Figure VI Reporting of Crime
Perhaps the low reporting of crime has to do with the perceived ease of doing so. Howeasy do respondent believe is it to do something about a crime? We asked therespondents the following questions:
AOJ1. Do you think that reporting a crime to the police or local authorities iseasy, difficult, or very difficult?
AOJ1A. Do you think that reporting a crime to the community authority iseasy, difficult or very difficult?
Figure VI.21 shows that one-quarter of the population thought that reporting a crime to thepolicy or to the authorities was easy.

The Political Culture of Democracy in Bolivia: 1998 190 Chapter VI: Administration of Justice
Figure VI Difficulty in Reporting Crimes to the Police or Authorities
Figure VI Difficulty in Reporting Crimes to the Local Authority
Bolivians believe that reporting a crime to the community authority was somewhat easier,as is shown in Figure VI.23.
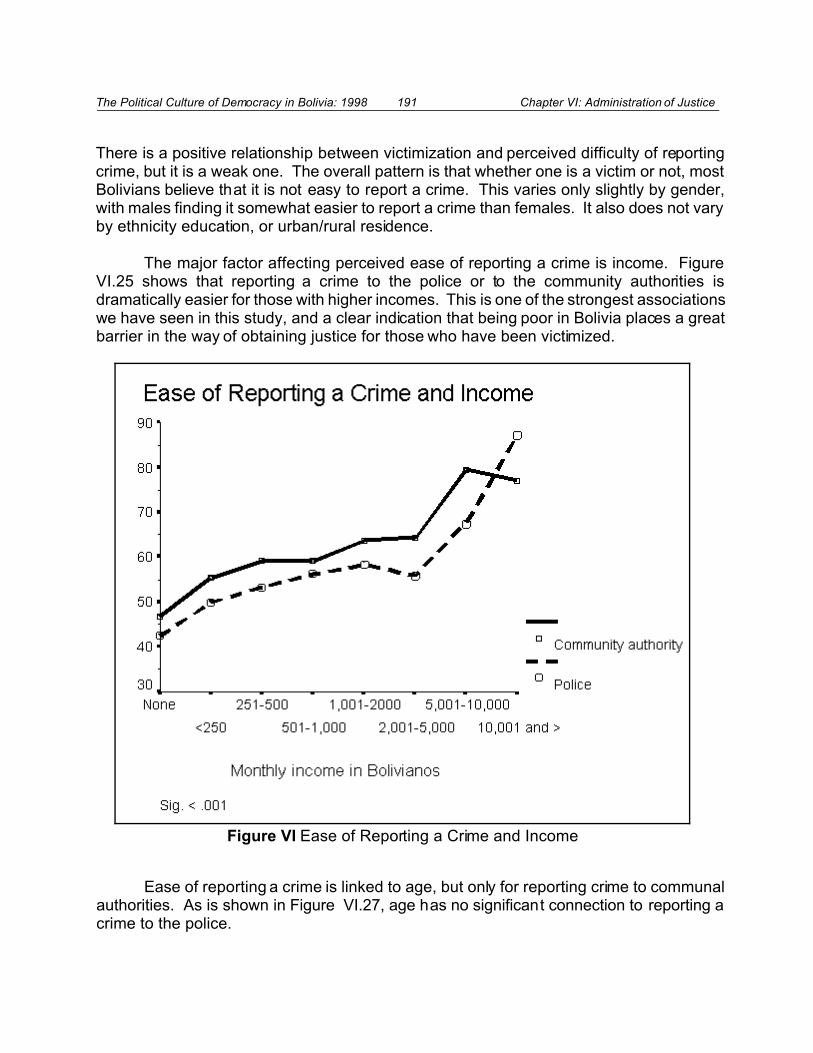
The Political Culture of Democracy in Bolivia: 1998 191 Chapter VI: Administration of Justice
Figure VI Ease of Reporting a Crime and Income
There is a positive relationship between victimization and perceived difficulty of reportingcrime, but it is a weak one. The overall pattern is that whether one is a victim or not, mostBolivians believe that it is not easy to report a crime. This varies only slightly by gender,with males finding it somewhat easier to report a crime than females. It also does not varyby ethnicity education, or urban/rural residence.
The major factor affecting perceived ease of reporting a crime is income. FigureVI.25 shows that reporting a crime to the police or to the community authorities isdramatically easier for those with higher incomes. This is one of the strongest associationswe have seen in this study, and a clear indication that being poor in Bolivia places a greatbarrier in the way of obtaining justice for those who have been victimized.
Ease of reporting a crime is linked to age, but only for reporting crime to communalauthorities. As is shown in Figure VI.27, age has no significant connection to reporting acrime to the police.
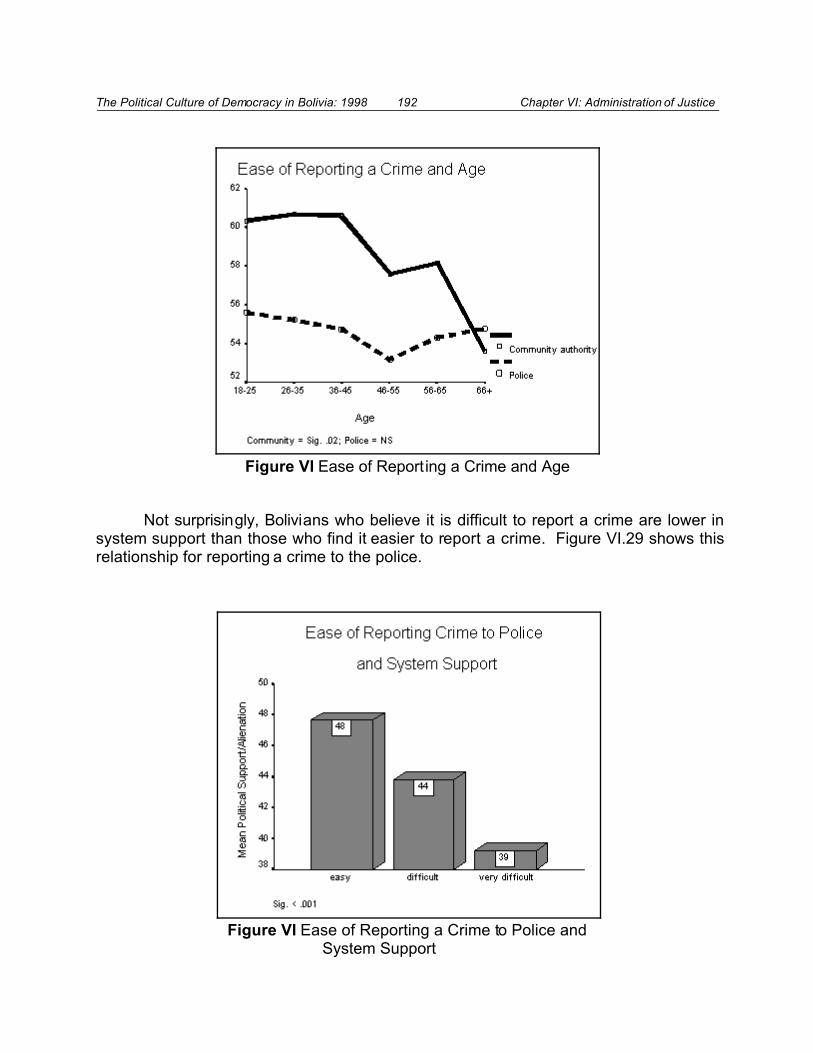
The Political Culture of Democracy in Bolivia: 1998 192 Chapter VI: Administration of Justice
Figure VI Ease of Reporting a Crime and Age
Figure VI Ease of Reporting a Crime to Police and System Support
Not surprisingly, Bolivians who believe it is difficult to report a crime are lower insystem support than those who find it easier to report a crime. Figure VI.29 shows thisrelationship for reporting a crime to the police.
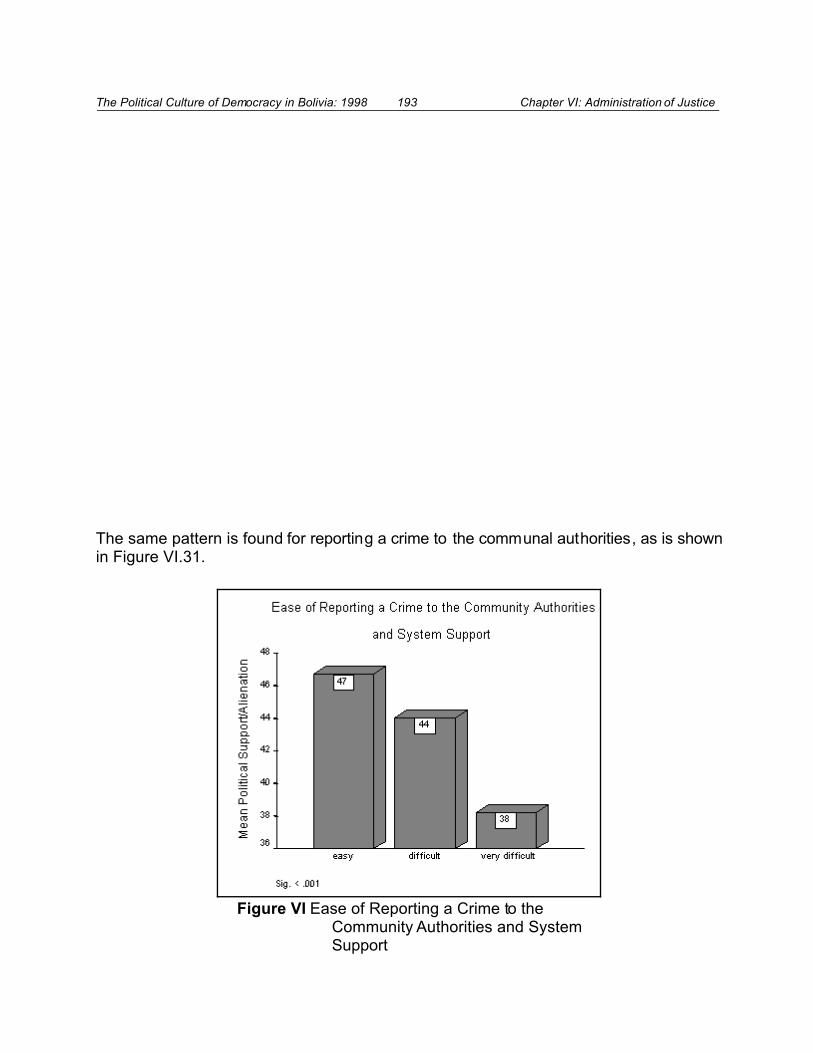
The Political Culture of Democracy in Bolivia: 1998 193 Chapter VI: Administration of Justice
Figure VI Ease of Reporting a Crime to the Community Authorities and System Support
The same pattern is found for reporting a crime to the communal authorities, as is shownin Figure VI.31.

The Political Culture of Democracy in Bolivia: 1998 194 Chapter VI: Administration of Justice
Figure VI Ease of Reporting Crimes: by Department
Reporting of crime varies by department. Figure VI.33 shows that in nearly all of thedepartments, ease of reporting to the community authorities is greater than to the police. Residents of the departments of Potosí, Cochabamba and La Paz report lower overall easeof reporting crimes than the other departments. In Pando and El Beni, the perceived easeof reporting crimes to the community authorities was especially high.
Satisfaction with the Authorities
The final series of questions in the administration of justice area measuredsatisfaction with the treatment respondents received by the police, the courts and the publicministry. Analysis of these items needs to be somewhat different from the others since herethe questions determined if the respondent had actually experienced any dealings withthese agencies, and if so, what was the level of satisfaction with the treatment.
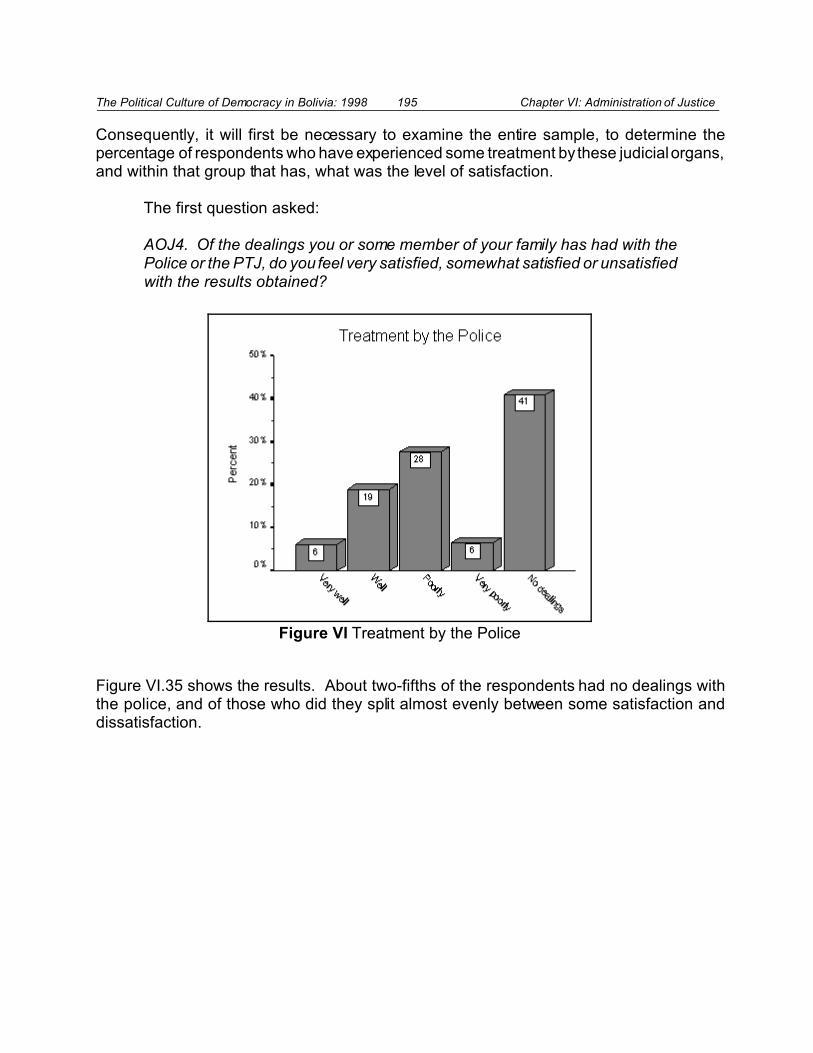
The Political Culture of Democracy in Bolivia: 1998 195 Chapter VI: Administration of Justice
Figure VI Treatment by the Police
Consequently, it will first be necessary to examine the entire sample, to determine thepercentage of respondents who have experienced some treatment by these judicial organs,and within that group that has, what was the level of satisfaction.
The first question asked:
AOJ4. Of the dealings you or some member of your family has had with thePolice or the PTJ, do you feel very satisfied, somewhat satisfied or unsatisfiedwith the results obtained?
Figure VI.35 shows the results. About two-fifths of the respondents had no dealings withthe police, and of those who did they split almost evenly between some satisfaction anddissatisfaction.
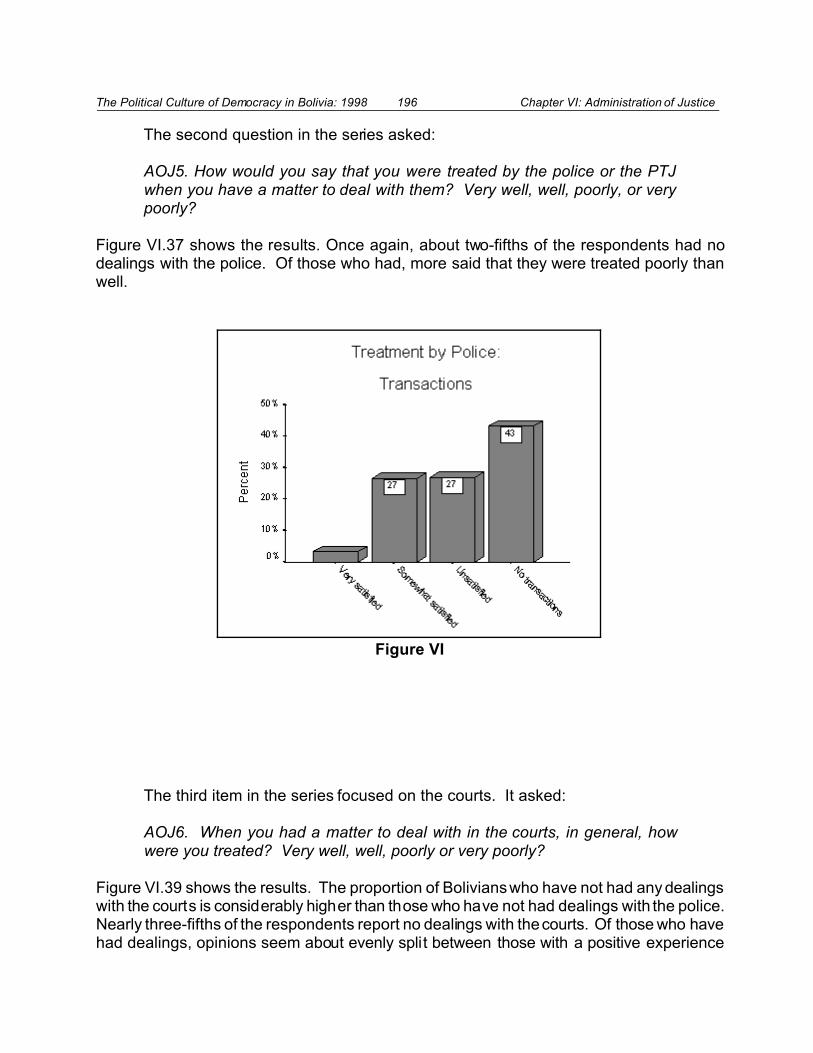
The Political Culture of Democracy in Bolivia: 1998 196 Chapter VI: Administration of Justice
Figure VI
The second question in the series asked:
AOJ5. How would you say that you were treated by the police or the PTJwhen you have a matter to deal with them? Very well, well, poorly, or verypoorly?
Figure VI.37 shows the results. Once again, about two-fifths of the respondents had nodealings with the police. Of those who had, more said that they were treated poorly thanwell.
The third item in the series focused on the courts. It asked:
AOJ6. When you had a matter to deal with in the courts, in general, howwere you treated? Very well, well, poorly or very poorly?
Figure VI.39 shows the results. The proportion of Bolivians who have not had any dealingswith the courts is considerably higher than those who have not had dealings with the police.Nearly three-fifths of the respondents report no dealings with the courts. Of those who havehad dealings, opinions seem about evenly split between those with a positive experience

The Political Culture of Democracy in Bolivia: 1998 197 Chapter VI: Administration of Justice
Figure VI
versus those with a negative experience. Thus, the opinions regarding the courts are morepositive than are the opinions regarding the police.
The final item in the series deals with the public ministry, the equivalent of theAttorney General’s Office in the United States. The question asked was:
AOJ7. When you had some matter to deal with in the Attorney General’sOffice or the Public Prosecutor, how were you treated? Very well, well, poorlyor very poorly?
Figure VI.41 shows the results. They are very similar to the prior question about the courts,with three-fifths having no dealings, and a nearly even split positive-negative for those whohad.
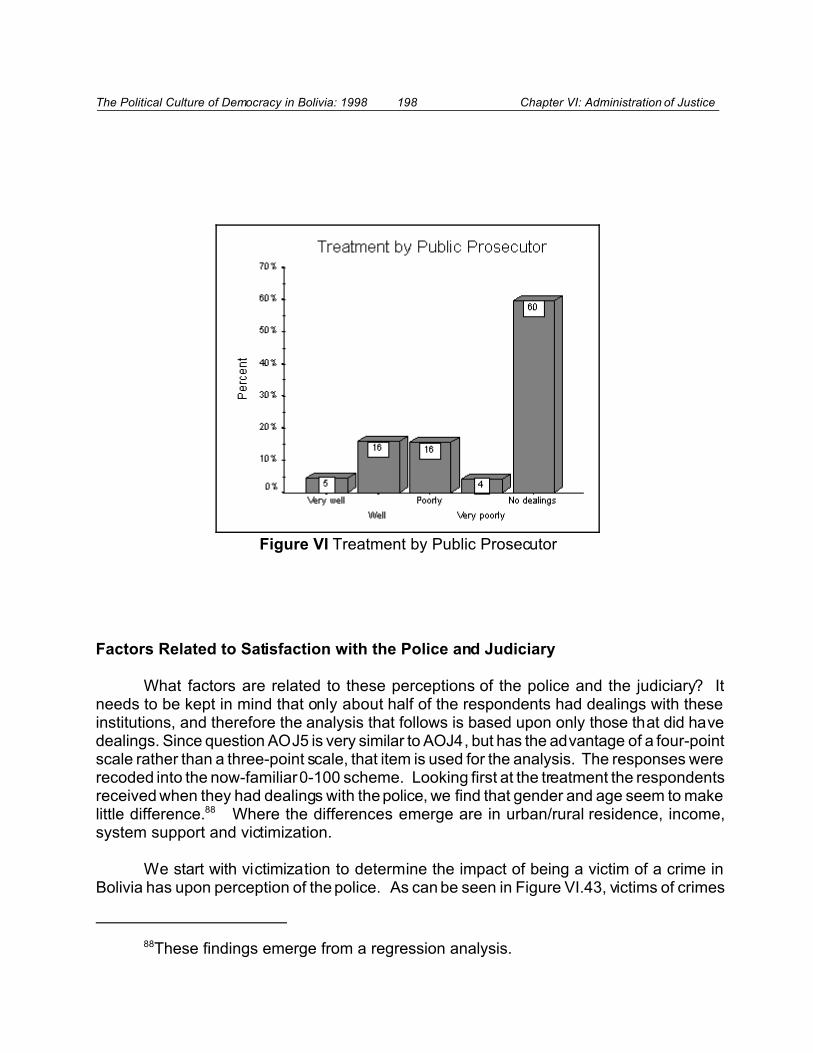
The Political Culture of Democracy in Bolivia: 1998 198 Chapter VI: Administration of Justice
88These findings emerge from a regression analysis.
Figure VI Treatment by Public Prosecutor
Factors Related to Satisfaction with the Police and Judiciary
What factors are related to these perceptions of the police and the judiciary? Itneeds to be kept in mind that only about half of the respondents had dealings with theseinstitutions, and therefore the analysis that follows is based upon only those that did havedealings. Since question AOJ5 is very similar to AOJ4, but has the advantage of a four-pointscale rather than a three-point scale, that item is used for the analysis. The responses wererecoded into the now-familiar 0-100 scheme. Looking first at the treatment the respondentsreceived when they had dealings with the police, we find that gender and age seem to makelittle difference.88 Where the differences emerge are in urban/rural residence, income,system support and victimization.
We start with victimization to determine the impact of being a victim of a crime inBolivia has upon perception of the police. As can be seen in Figure VI.43, victims of crimes
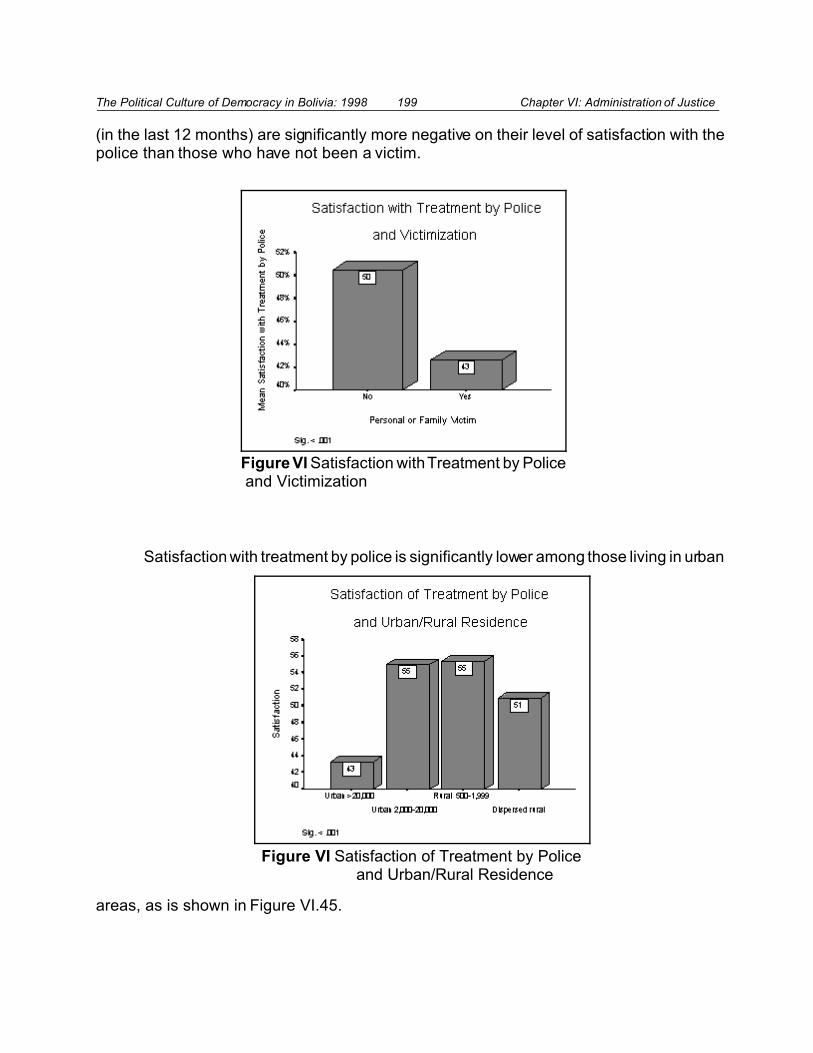
The Political Culture of Democracy in Bolivia: 1998 199 Chapter VI: Administration of Justice
Figure VI Satisfaction with Treatment by Police and Victimization
Figure VI Satisfaction of Treatment by Police and Urban/Rural Residence
(in the last 12 months) are significantly more negative on their level of satisfaction with thepolice than those who have not been a victim.
Satisfaction with treatment by police is significantly lower among those living in urban
areas, as is shown in Figure VI.45.
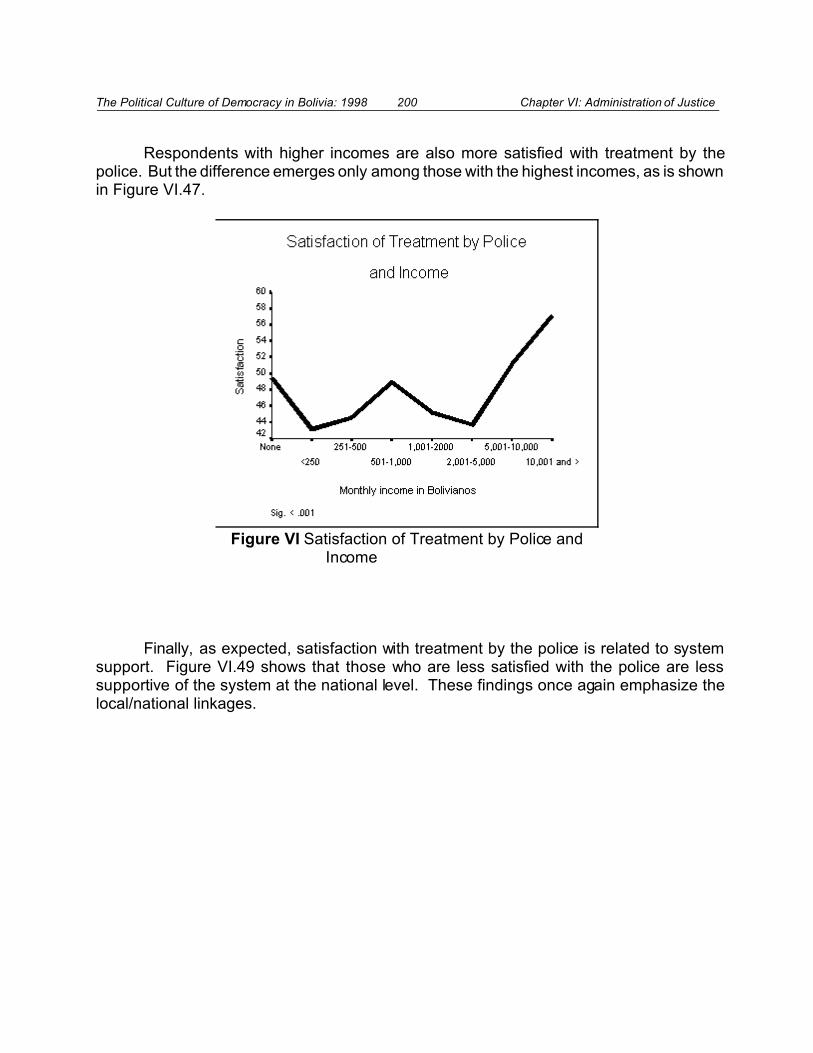
The Political Culture of Democracy in Bolivia: 1998 200 Chapter VI: Administration of Justice
Figure VI Satisfaction of Treatment by Police and Income
Respondents with higher incomes are also more satisfied with treatment by thepolice. But the difference emerges only among those with the highest incomes, as is shownin Figure VI.47.
Finally, as expected, satisfaction with treatment by the police is related to systemsupport. Figure VI.49 shows that those who are less satisfied with the police are lesssupportive of the system at the national level. These findings once again emphasize thelocal/national linkages.
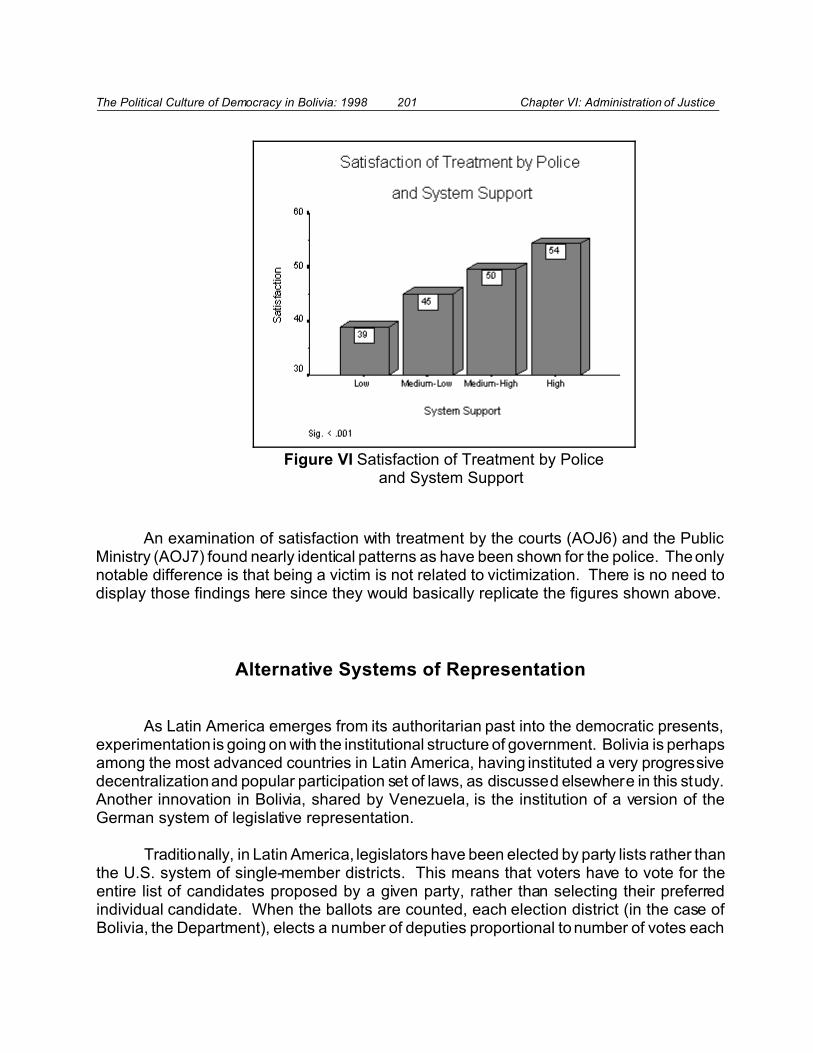
The Political Culture of Democracy in Bolivia: 1998 201 Chapter VI: Administration of Justice
Figure VI Satisfaction of Treatment by Police and System Support
An examination of satisfaction with treatment by the courts (AOJ6) and the PublicMinistry (AOJ7) found nearly identical patterns as have been shown for the police. The onlynotable difference is that being a victim is not related to victimization. There is no need todisplay those findings here since they would basically replicate the figures shown above.
Alternative Systems of Representation
As Latin America emerges from its authoritarian past into the democratic presents,experimentation is going on with the institutional structure of government. Bolivia is perhapsamong the most advanced countries in Latin America, having instituted a very progressivedecentralization and popular participation set of laws, as discussed elsewhere in this study.Another innovation in Bolivia, shared by Venezuela, is the institution of a version of theGerman system of legislative representation.
Traditionally, in Latin America, legislators have been elected by party lists rather thanthe U.S. system of single-member districts. This means that voters have to vote for theentire list of candidates proposed by a given party, rather than selecting their preferredindividual candidate. When the ballots are counted, each election district (in the case ofBolivia, the Department), elects a number of deputies proportional to number of votes each
The Political Culture of Democracy in Bolivia: 1998 202 Chapter VI: Administration of Justice
89In reality, the system is more complex than this, since there are different votingsystems for calculating how to determine proportionality. But for the sake of comparisonwith single-member districts, this explanation will suffice.
90See Mike Kulisheck “Legislators, Representation, and Democracy: An InstitutionalAnalysis of Deputy Responsiveness in Venezuela,” Ph.D. dissertation, University ofPittsburgh, 1998 (Mitchell A. Seligson and Bert Rockman, co-chairs).
91For an early study of possible formulas for implementing the system see Hugo SanMartín Arzabe, Sistemas electorales: adaptación del doble voto Alemán al caso Boliviano.La Paz: Fundación Milenio, 1993.
party received.89 In the single-member district system, one candidate is elected for eachdistrict, with voters expressing their choices not from a party list but from a list of individuals(who in turn normally have a party affiliation).
The presumed advantage of the single-member district system is that it can help toenhance accountability of legislators to voters. Voters can say: “I voted for you, so do whatI say.” In party list systems, however, the individual legislator has not been elected byconstituents, only his/her party has. Thus, single-member districts can, in theory, enhancelegislative-constituency relations.
In Germany after World War II, a mixed system was put in place. The party listsystem was augmented by a single member district system. The idea was to retain thetraditional system, with its proportional representation model, while enhancing accountabilitythrough a system of single-member districts. Venezuela was the first to adopt this systemin Latin America, and has now been followed by Bolivia. Very early studies in Venezuelahave shown some advantages to the new system.90 In Bolivia, only one election has beenheld using the dual system. Very little is known about its impact.91
In order to study this issue using the 1998 survey, respondents were asked thefollowing question:
VB7. In your opinion, who represents you better: 1) the multi-member districtdeputy from the party lists, or 2) the deputy from the single member list fromyour district?
The results of this question are shown in Figure VI.51. As can be seen, over two-fifths ofthe respondents had no opinion on this matter. Among those who did, however, they wereoverwhelmingly in favor of the single-member system. Less than 8% of Bolivians favor theparty list formula.

The Political Culture of Democracy in Bolivia: 1998 203 Chapter VI: Administration of Justice
Figure VI Which System Represents Better?
Since few Bolivians believe that they are better represented by the party list system,it is difficult to determine what factors in the study help explain this result. When surveyquestions produce overwhelming support for one position over another, most statisticalmodels cannot easily explain this outcome. A multiple regression analysis using the socio-economic, demographic factors explored in this study does not produce any significantdifferences. Urbanization also has little impact, and system support and tolerance shownow significant relationship. Variation within department exists, but is not dramatic, rangingfrom a low of 79 in Tarija to a high of 93 in Beni. Figure VI.53 shows the results.
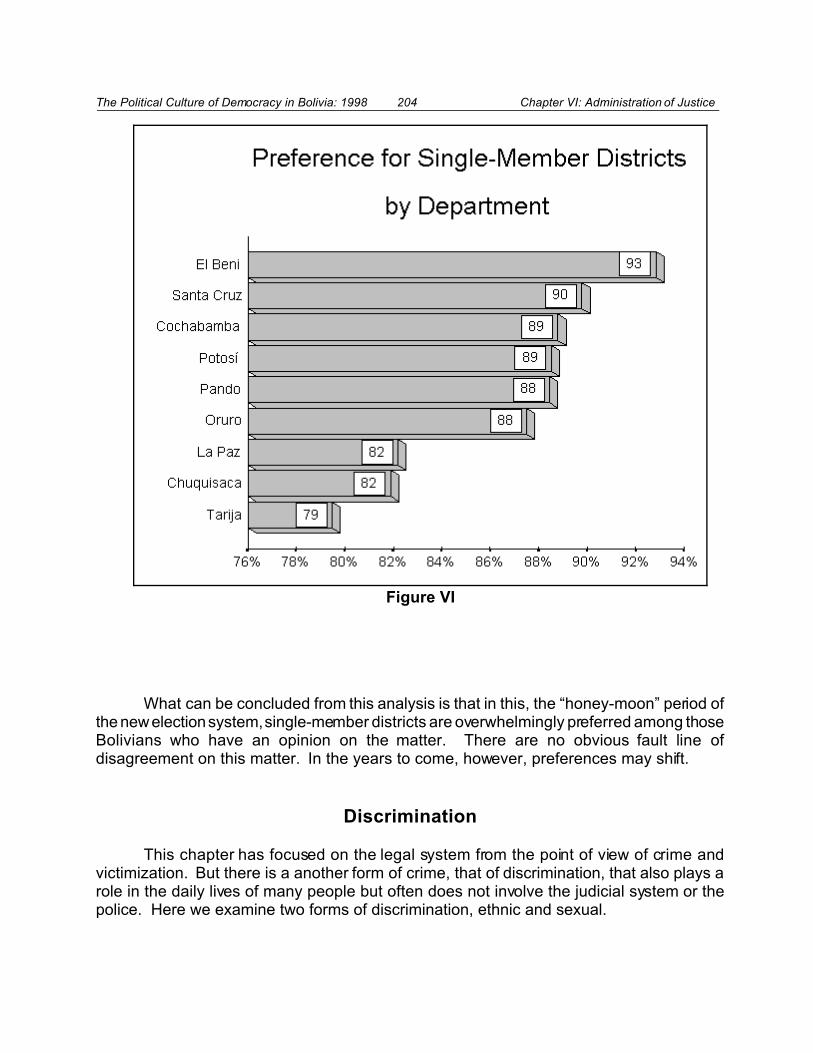
The Political Culture of Democracy in Bolivia: 1998 204 Chapter VI: Administration of Justice
Figure VI
What can be concluded from this analysis is that in this, the “honey-moon” period ofthe new election system, single-member districts are overwhelmingly preferred among thoseBolivians who have an opinion on the matter. There are no obvious fault line ofdisagreement on this matter. In the years to come, however, preferences may shift.
Discrimination
This chapter has focused on the legal system from the point of view of crime andvictimization. But there is a another form of crime, that of discrimination, that also plays arole in the daily lives of many people but often does not involve the judicial system or thepolice. Here we examine two forms of discrimination, ethnic and sexual.
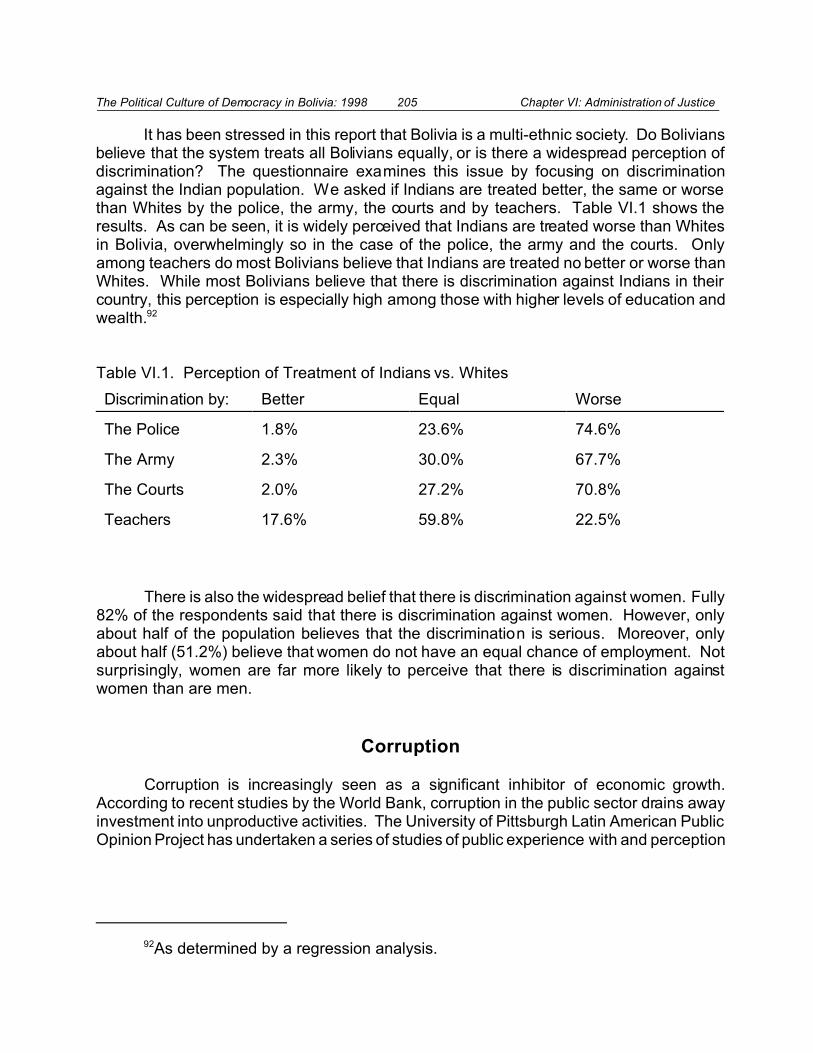
The Political Culture of Democracy in Bolivia: 1998 205 Chapter VI: Administration of Justice
92As determined by a regression analysis.
It has been stressed in this report that Bolivia is a multi-ethnic society. Do Boliviansbelieve that the system treats all Bolivians equally, or is there a widespread perception ofdiscrimination? The questionnaire examines this issue by focusing on discriminationagainst the Indian population. We asked if Indians are treated better, the same or worsethan Whites by the police, the army, the courts and by teachers. Table VI.1 shows theresults. As can be seen, it is widely perceived that Indians are treated worse than Whitesin Bolivia, overwhelmingly so in the case of the police, the army and the courts. Onlyamong teachers do most Bolivians believe that Indians are treated no better or worse thanWhites. While most Bolivians believe that there is discrimination against Indians in theircountry, this perception is especially high among those with higher levels of education andwealth.92
Table VI.1. Perception of Treatment of Indians vs. Whites
Discrimination by: Better Equal Worse
The Police 1.8% 23.6% 74.6%
The Army 2.3% 30.0% 67.7%
The Courts 2.0% 27.2% 70.8%
Teachers 17.6% 59.8% 22.5%
There is also the widespread belief that there is discrimination against women. Fully82% of the respondents said that there is discrimination against women. However, onlyabout half of the population believes that the discrimination is serious. Moreover, onlyabout half (51.2%) believe that women do not have an equal chance of employment. Notsurprisingly, women are far more likely to perceive that there is discrimination againstwomen than are men.
Corruption
Corruption is increasingly seen as a significant inhibitor of economic growth.According to recent studies by the World Bank, corruption in the public sector drains awayinvestment into unproductive activities. The University of Pittsburgh Latin American PublicOpinion Project has undertaken a series of studies of public experience with and perception
The Political Culture of Democracy in Bolivia: 1998 206 Chapter VI: Administration of Justice
93Mitchell A. Seligson, Nicaraguans Talk About Corruption: A Study of PublicOpinion, A Report to USAID, Nicaragua (Washington, D. C.: Casals and Associates, 1997).
of corruption.93 A small number of items developed for those studies was included in the1998 Bolivia survey. Figure VI.55 shows the comparative results for key items.Respondents were asked if they knew anyone who had been compelled to pay a bribe inthe courts anytime in the last two years. The first set of bars on the left in the chart showsthat Bolivians are less likely to have experienced this form of corruption. Respondents werealso asked if they had seen, in the last two years, someone paying a bribe to a publicemployee for any type of favor. On this item, Bolivians were more likely than in Paraguayor Nicaragua to have experienced this form of corruption, but the differences in absoluteterms are not great. The third set of bars refers to those who have actually had a publicemployee solicit a bribe from the respondent over the last two years. On this item, Bolivianshave had greater experience with bribery than in the Paraguay and even greater than inNicaragua. It should be added that Paraguay and Nicaragua are often singled out byorganizations such as Transparency International as being particularly corrupt. Since thislast item deals with actual experience, rather than indirect knowledge of corruption, it maybe the most direct measure of the level of day-to-day corruption in these three countries.Yet, Bolivians are less likely to say that they believe that public corruption is verygeneralized in their country, as the final set of bars demonstrates. Nonetheless, in all threecountries, the perception of widespread public corruption is evident, as this final set of barsdemonstrates. It may be that in Bolivia, the relatively high level of direct experience withcorruption has made citizens more tolerant of it, and that is what accounts for this last setof bars in the chart.

The Political Culture of Democracy in Bolivia: 1998 207 Chapter VI: Administration of Justice
Figure VI Corruption: Bolivia in Comparative Perspective
Conclusions
Bolivians are fortunate that the high levels of crime experienced in countries such asGuatemala and El Salvador have not emerged in their country. Nonetheless, about one-third of Bolivians have been affected by a crime within the year preceding the survey.Those who have been victims (personal or family) of a crime are less likely to be supportiveof the political system, and are far less likely to believe that people are trustworthy. Sincecriminals do not select their victims by their attitudes on these issues, we have to assumethat being a victim translates into attitudes negative for democratic stability. Moreover,young people are more likely to be victims of a crime than the old, perhaps a factor, as willbe shown in the next chapter, that influences their views on the desirability of a military coup
The Political Culture of Democracy in Bolivia: 1998 208 Chapter VI: Administration of Justice
d’etat. It is also not surprising that women, urbanities and the more wealthy are more likelyto be crime victims than men, rural dwellers and the less wealthy.
It is troubling that the majority of crimes go unreported in Bolivia, according to thesurvey data. This is perhaps a function of the fact that most Bolivians believe that it isdifficult to report crimes, suggesting that reforms may be needed in the way the policerespond to citizens. The poor find it especially difficult to report a crime, reinforcing the viewthat there may be socio-economic discrimination on the part of the police agencies inattending to citizen demands. The price to be paid is in citizen support for the politicalsystem; those who find it difficult to report crimes are far less supportive of the politicalsystem than those who report it easy to report crimes. These findings also hold forcommunity authorities, not only the police. Those who have been victims of crimes are lesssatisfied by their treatment by the police than those who have not, and satisfaction withtreatment by the police also increases with income, again an indication of a socio-economiceffect in police dealings with citizens. The more satisfied citizens are with their treatmentby the police, the more likely they are to support the political system.
Finally, this chapter has shown that Bolivians strongly prefer the single-memberdistrict system, believe that there is considerable discrimination against women and Indians,and are more likely than some other Latin Americans to have had personal experience withcorruption.
The Political Culture of Democracy in Bolivia: 1998 209 Chapter VII: Support for Anti-Democratic Measures
Chapter VII. Support for Anti-Democratic Measures
This study has focused on democratic values and behaviors. It would not becomplete, however, unless it were to take a look at the darker side of those values and howthey relate to democracy. This chapter examines the extent to which Bolivians would bewilling to support anti-democratic measures. First, it looks at support for what has been thequintessential mechanism for extinguishing democracy in Bolivia (and in much of LatinAmerica), the coup d’etat. This is followed by the willingness of the population to embarkupon violent political behaviors.
Support for Coup D’Etats
Bolivia has enjoyed constitutionally democratic rule for over a decade. Have Boliviansturned their backs on the coup d’etat as mechanism for resolving political conflict? In orderto determine if this is the case, the interviewers asked a module of questions (the JC items)that posed a series of hypothetical situations under which coups have occurred in the past.These items read:
Some people say that under certain circumstances a coup d’etat by themilitary, that is when the miliary takes power, could be justified. In youropinion, a coup d’etat by the miliary is justified or not justified....
JC1. If unemployment is very high?JC4. If there are many university student strikes?JC9. If there are a large number of strikes by unionized labor?JC 10. If employers cut the salaries of their employees a lot?
The Bolivian results are most clearly understood if placed within a Latin Americancomparative context, made possible by the University of Pittsburgh Latin American PublicOpinion Project. Figure VII.1 shows that the Bolivian results are similar to those in the othercountries in the data base. Over one-third of Nicaraguans would support a coup underconditions of high unemployment, whereas 29% of Bolivians and a slightly lower percentageof Paraguayans and Salvadorans responded in this way.

The Political Culture of Democracy in Bolivia: 1998 210 Chapter VII: Support for Anti-Democratic Measures
Figure VII High Unemployment as a Justification for aCoup: Bolivia in Comparative Perspective
Bolivia scores in the same range on the second question, the one asking if universitystudent strikes justify a coup. Figure VII.3 show the results. A slightly lower percentageof Bolivians would justify a coup under these circumstances, whereas over two-fifths ofNicaraguans would do so.
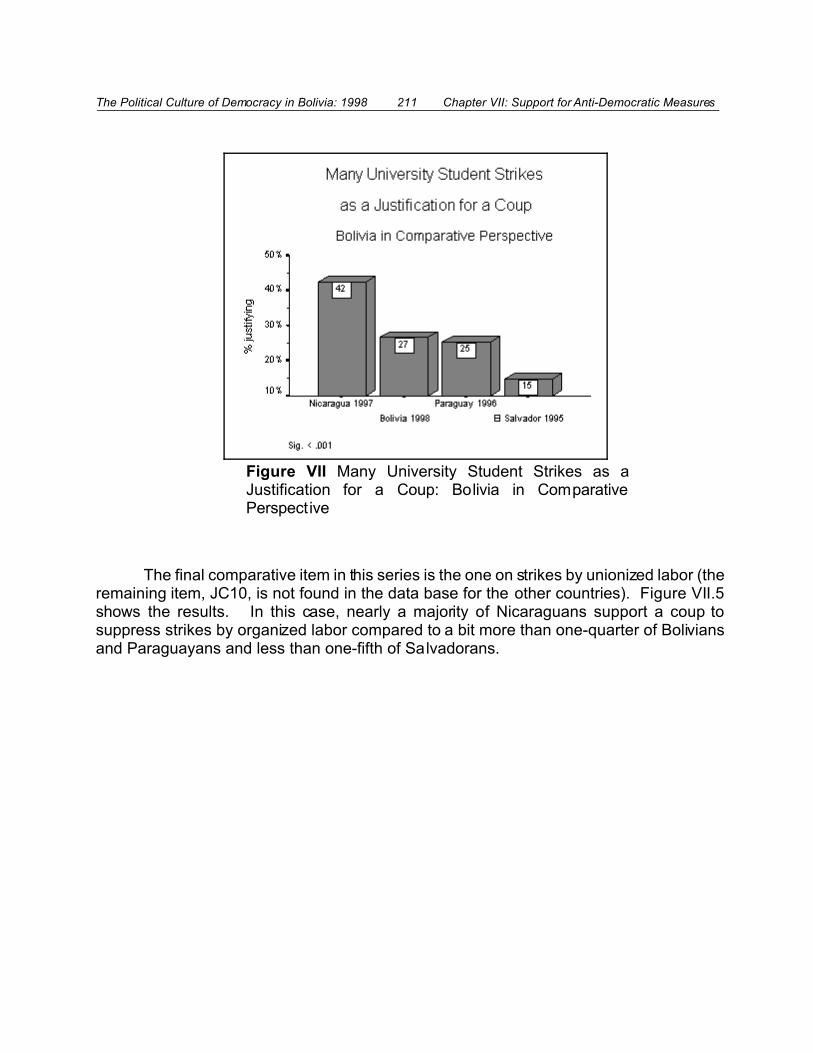
The Political Culture of Democracy in Bolivia: 1998 211 Chapter VII: Support for Anti-Democratic Measures
Figure VII Many University Student Strikes as aJustification for a Coup: Bolivia in ComparativePerspective
The final comparative item in this series is the one on strikes by unionized labor (theremaining item, JC10, is not found in the data base for the other countries). Figure VII.5shows the results. In this case, nearly a majority of Nicaraguans support a coup tosuppress strikes by organized labor compared to a bit more than one-quarter of Boliviansand Paraguayans and less than one-fifth of Salvadorans.
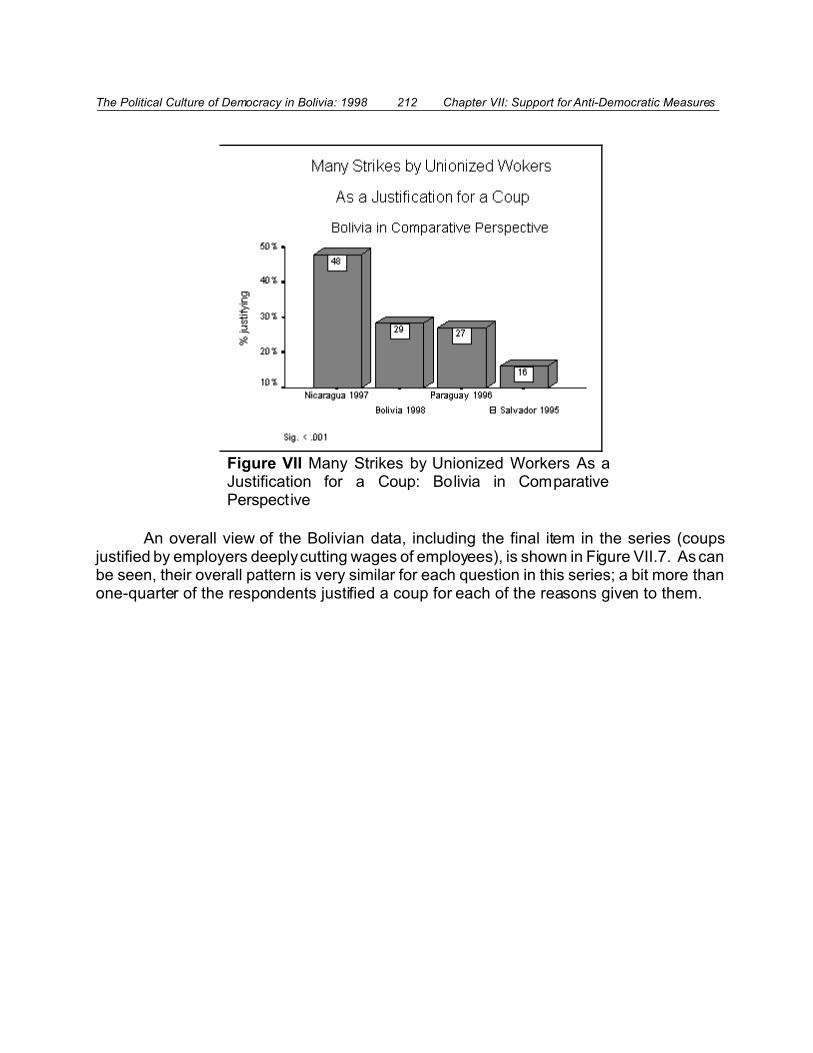
The Political Culture of Democracy in Bolivia: 1998 212 Chapter VII: Support for Anti-Democratic Measures
Figure VII Many Strikes by Unionized Workers As aJustification for a Coup: Bolivia in ComparativePerspective
An overall view of the Bolivian data, including the final item in the series (coupsjustified by employers deeply cutting wages of employees), is shown in Figure VII.7. As canbe seen, their overall pattern is very similar for each question in this series; a bit more thanone-quarter of the respondents justified a coup for each of the reasons given to them.

The Political Culture of Democracy in Bolivia: 1998 213 Chapter VII: Support for Anti-Democratic Measures
Figure VII Conditions that Might Justify a Coup
Who Supports a Coup?
Demographic factors
In order to determine what factors are relevant in determining which Bolivians aremore likely to support a coup and which ones would be less likely to do so, an overall indexof support for coups was constructed. The four items included in the series are the onesanalyzed above (i.e., JC1, JC4, JC9 and JC10). These items formed a very reliable scale(Standardized item Alpha = .84).
Unlike many of the analyses performed in prior chapters, support for coups is not inany way a function of education, ethnicity or urban/rural residents. Gender does have aweak relationship, however, but one that washes out in the multivariate analysis. FigureVII.9 shows that males are somewhat more supportive of coups than females.
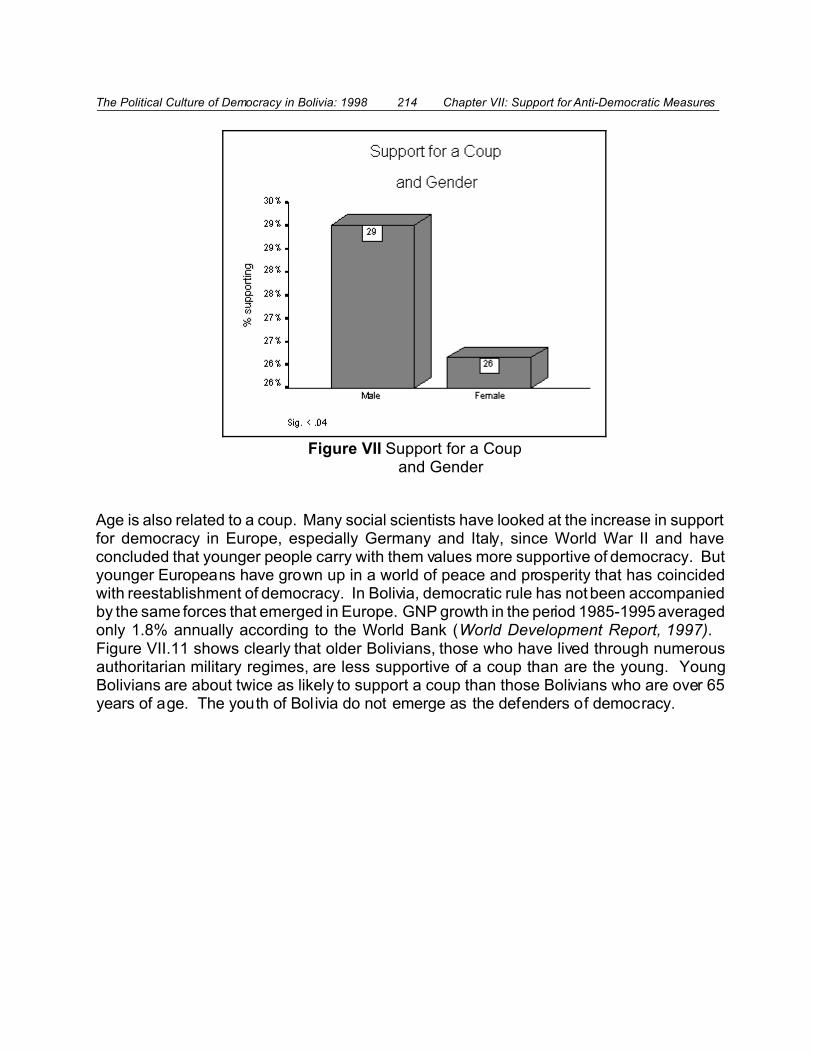
The Political Culture of Democracy in Bolivia: 1998 214 Chapter VII: Support for Anti-Democratic Measures
Figure VII Support for a Coup and Gender
Age is also related to a coup. Many social scientists have looked at the increase in supportfor democracy in Europe, especially Germany and Italy, since World War II and haveconcluded that younger people carry with them values more supportive of democracy. Butyounger Europeans have grown up in a world of peace and prosperity that has coincidedwith reestablishment of democracy. In Bolivia, democratic rule has not been accompaniedby the same forces that emerged in Europe. GNP growth in the period 1985-1995 averagedonly 1.8% annually according to the World Bank (World Development Report, 1997). Figure VII.11 shows clearly that older Bolivians, those who have lived through numerousauthoritarian military regimes, are less supportive of a coup than are the young. YoungBolivians are about twice as likely to support a coup than those Bolivians who are over 65years of age. The youth of Bolivia do not emerge as the defenders of democracy.
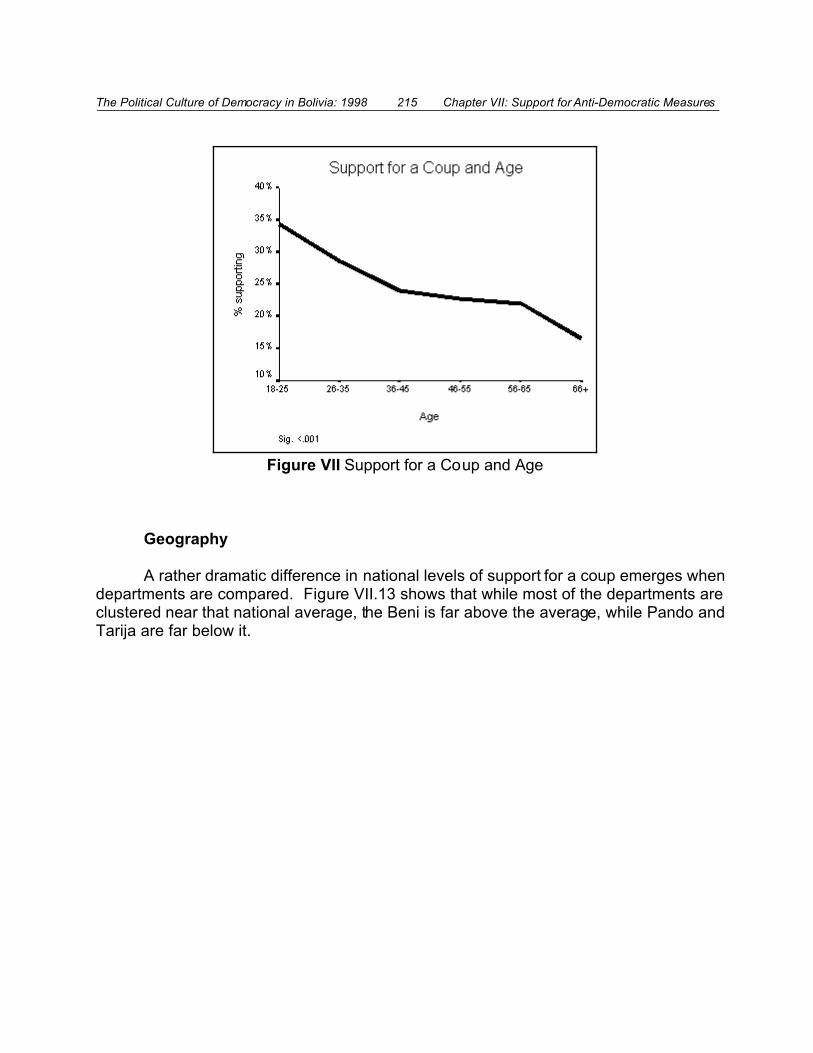
The Political Culture of Democracy in Bolivia: 1998 215 Chapter VII: Support for Anti-Democratic Measures
Figure VII Support for a Coup and Age
Geography
A rather dramatic difference in national levels of support for a coup emerges whendepartments are compared. Figure VII.13 shows that while most of the departments areclustered near that national average, the Beni is far above the average, while Pando andTarija are far below it.

The Political Culture of Democracy in Bolivia: 1998 216 Chapter VII: Support for Anti-Democratic Measures
Figure VII Support for a Coup by Department
Income
Income is also related to support for coups, with wealthier Bolivians expressing moresupport than poorer. Figure VII.15 shows that only less than one-quarter of the poorestBolivians would support a coup, whereas over one-third of those with the highest incomeswould do so.
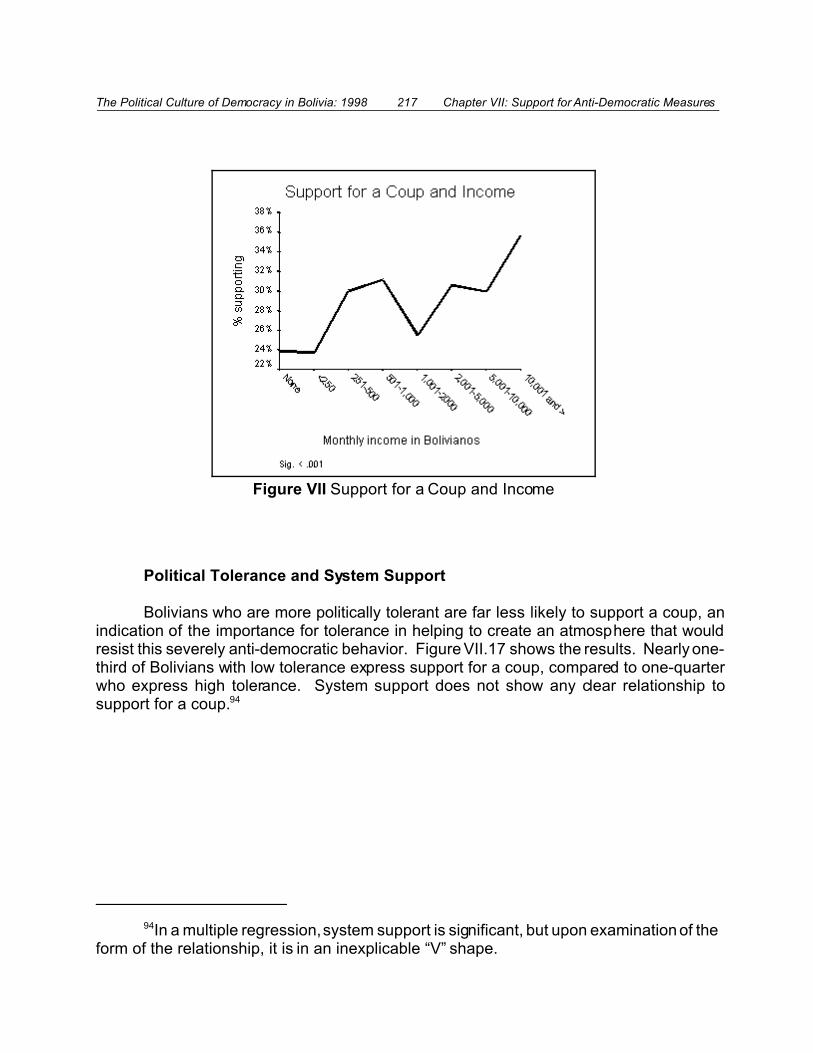
The Political Culture of Democracy in Bolivia: 1998 217 Chapter VII: Support for Anti-Democratic Measures
94In a multiple regression, system support is significant, but upon examination of theform of the relationship, it is in an inexplicable “V” shape.
Figure VII Support for a Coup and Income
Political Tolerance and System Support
Bolivians who are more politically tolerant are far less likely to support a coup, anindication of the importance for tolerance in helping to create an atmosphere that wouldresist this severely anti-democratic behavior. Figure VII.17 shows the results. Nearly one-third of Bolivians with low tolerance express support for a coup, compared to one-quarterwho express high tolerance. System support does not show any clear relationship tosupport for a coup.94

The Political Culture of Democracy in Bolivia: 1998 218 Chapter VII: Support for Anti-Democratic Measures
Figure VII Support for a Coup and Tolerance
Ethnicity and Ideology
Ethnicity has a relationship to support for a coup. As shown in Figure VII.19, BlackBolivians express stronger support for a coup than other groups. Yet, it must be kept inmind that the sample size of Blacks is very small. Mestizos have moderately higher supportfor a coup than Whites or Cholas.
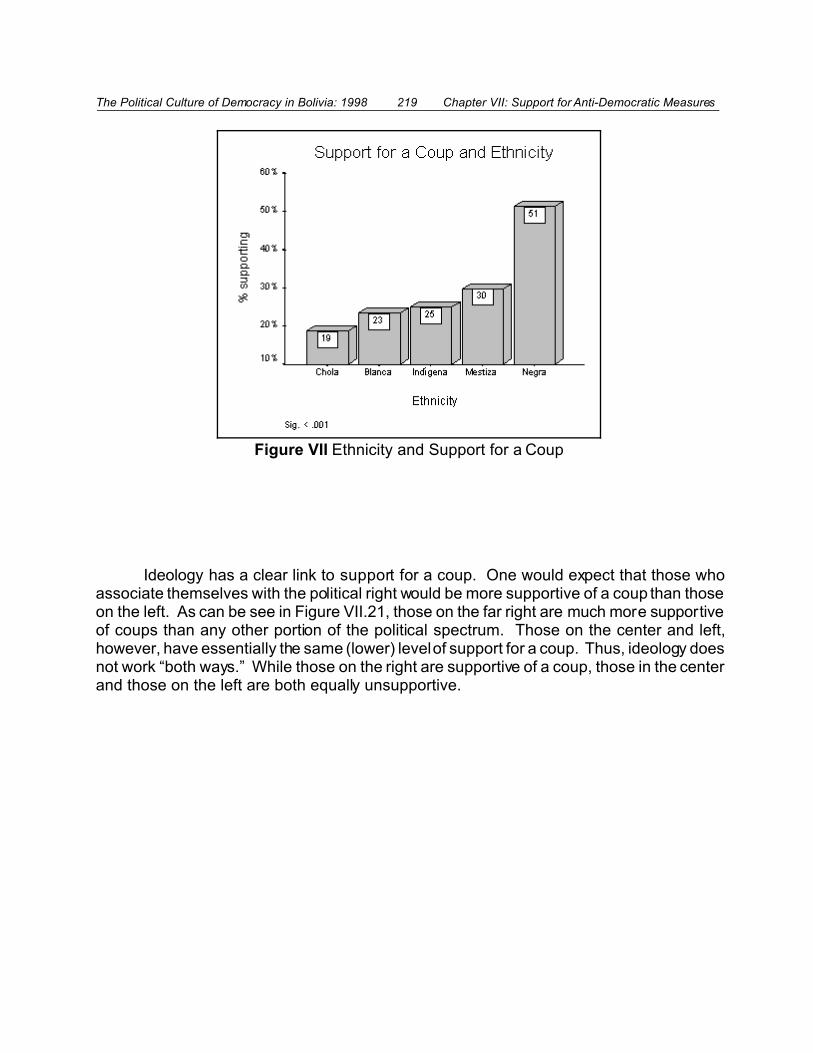
The Political Culture of Democracy in Bolivia: 1998 219 Chapter VII: Support for Anti-Democratic Measures
Figure VII Ethnicity and Support for a Coup
Ideology has a clear link to support for a coup. One would expect that those whoassociate themselves with the political right would be more supportive of a coup than thoseon the left. As can be see in Figure VII.21, those on the far right are much more supportiveof coups than any other portion of the political spectrum. Those on the center and left,however, have essentially the same (lower) level of support for a coup. Thus, ideology doesnot work “both ways.” While those on the right are supportive of a coup, those in the centerand those on the left are both equally unsupportive.
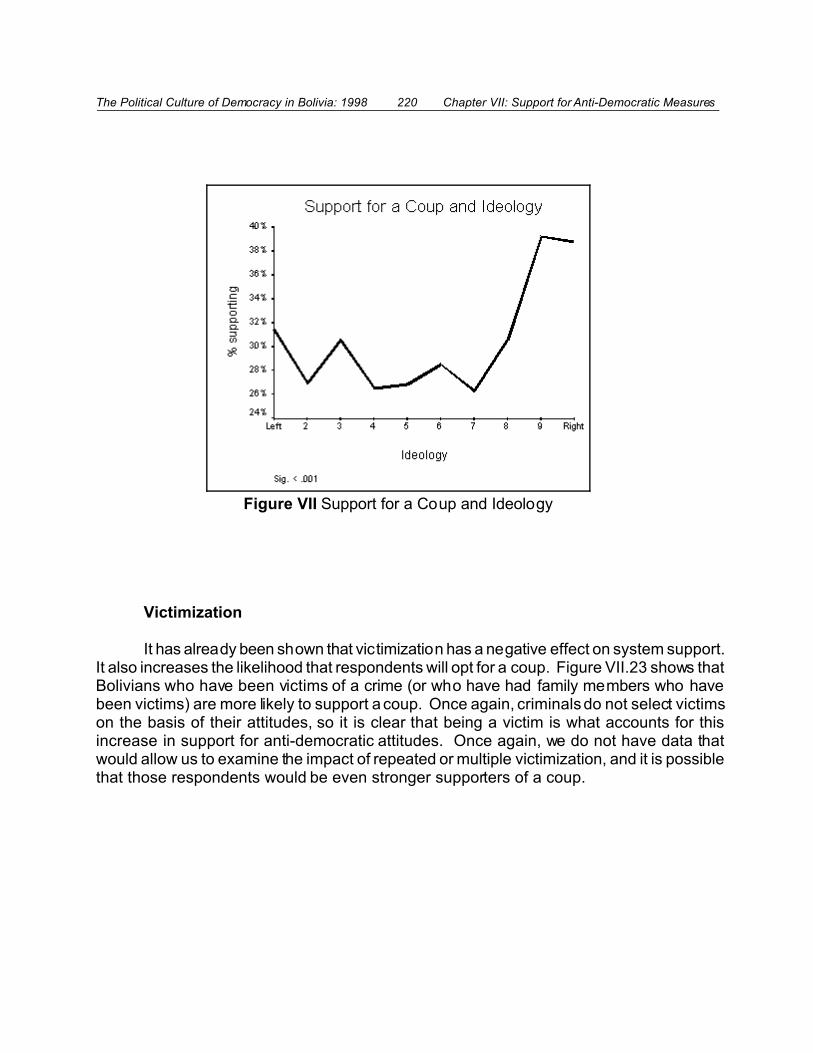
The Political Culture of Democracy in Bolivia: 1998 220 Chapter VII: Support for Anti-Democratic Measures
Figure VII Support for a Coup and Ideology
Victimization
It has already been shown that victimization has a negative effect on system support.It also increases the likelihood that respondents will opt for a coup. Figure VII.23 shows thatBolivians who have been victims of a crime (or who have had family members who havebeen victims) are more likely to support a coup. Once again, criminals do not select victimson the basis of their attitudes, so it is clear that being a victim is what accounts for thisincrease in support for anti-democratic attitudes. Once again, we do not have data thatwould allow us to examine the impact of repeated or multiple victimization, and it is possiblethat those respondents would be even stronger supporters of a coup.

The Political Culture of Democracy in Bolivia: 1998 221 Chapter VII: Support for Anti-Democratic Measures
Figure VII Support for a Coup and Victimization
Overall Model of Support for a Coup
The multiple regression is found in Table VII.1. Looking at the last column, we seethat gender is just above the level of signif icance, whereas age, tolerance, ideology andbeing a victim are significant predictors. On the other hand, the evaluation of governmentperformance and income fell to insignificance and were excluded from the model, while, asalready noted, education and urban/rural status have no significant impact on support fora coup.
Table VII.1. Multiple Regression of Support for a Coup
Unstandardized
Coeffic ients
Standardized
Coeffic ients t Sig.
B Std.
Error
Beta
(Cons tant) 41.473 3.982 10.416 .000
Q1 Gender -2.681 1.574 -.036 -1.703 .089
AGE -3.741 .560 -.142 -6.676 .000
TOL Tolerance -.128 .040 -.067 -3.156 .002
L1 Ideology .879 .374 .050 2.348 .019
TVICT IM Perso nal or Fam ily Victim .034 .017 .044 2.080 .038
Adj. R 2 = .03; Sig. < .001
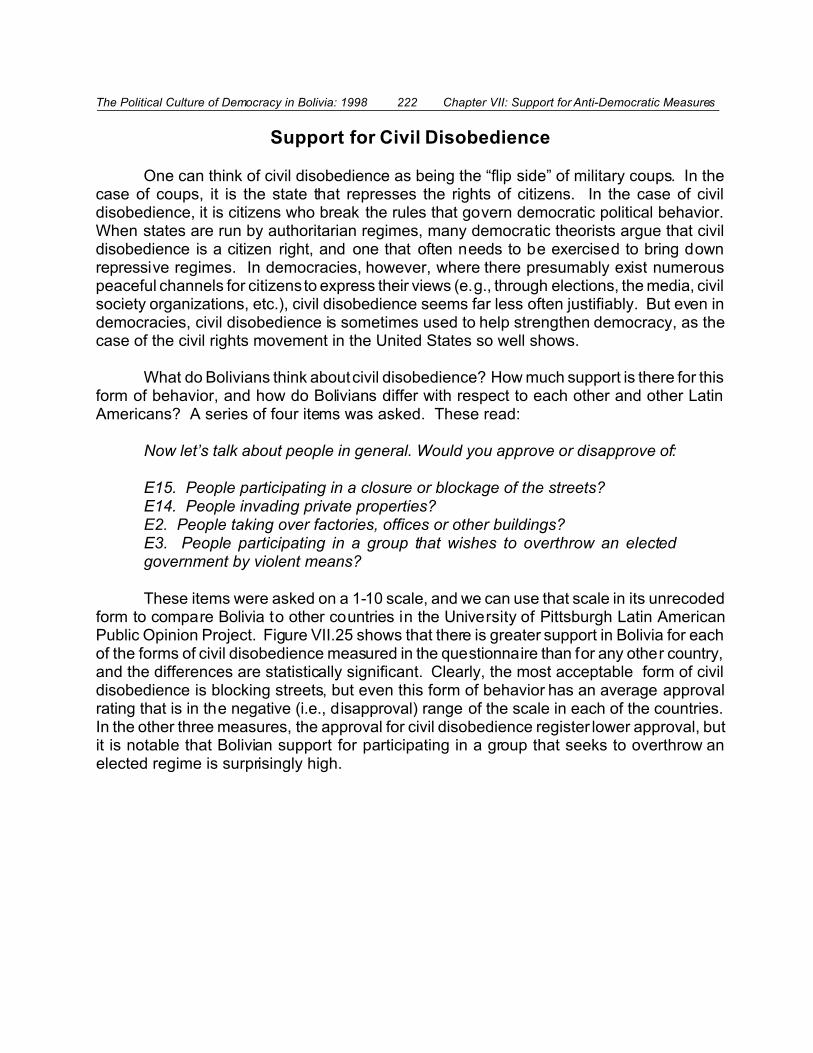
The Political Culture of Democracy in Bolivia: 1998 222 Chapter VII: Support for Anti-Democratic Measures
Support for Civil Disobedience
One can think of civil disobedience as being the “flip side” of military coups. In thecase of coups, it is the state that represses the rights of citizens. In the case of civildisobedience, it is citizens who break the rules that govern democratic political behavior.When states are run by authoritarian regimes, many democratic theorists argue that civildisobedience is a citizen right, and one that often needs to be exercised to bring downrepressive regimes. In democracies, however, where there presumably exist numerouspeaceful channels for citizens to express their views (e.g., through elections, the media, civilsociety organizations, etc.), civil disobedience seems far less often justifiably. But even indemocracies, civil disobedience is sometimes used to help strengthen democracy, as thecase of the civil rights movement in the United States so well shows.
What do Bolivians think about civil disobedience? How much support is there for thisform of behavior, and how do Bolivians differ with respect to each other and other LatinAmericans? A series of four items was asked. These read:
Now let’s talk about people in general. Would you approve or disapprove of:
E15. People participating in a closure or blockage of the streets?E14. People invading private properties?E2. People taking over factories, offices or other buildings?E3. People participating in a group that wishes to overthrow an electedgovernment by violent means?
These items were asked on a 1-10 scale, and we can use that scale in its unrecodedform to compare Bolivia to other countries in the University of Pittsburgh Latin AmericanPublic Opinion Project. Figure VII.25 shows that there is greater support in Bolivia for eachof the forms of civil disobedience measured in the questionnaire than for any other country,and the differences are statistically significant. Clearly, the most acceptable form of civildisobedience is blocking streets, but even this form of behavior has an average approvalrating that is in the negative (i.e., disapproval) range of the scale in each of the countries.In the other three measures, the approval for civil disobedience register lower approval, butit is notable that Bolivian support for participating in a group that seeks to overthrow anelected regime is surprisingly high.
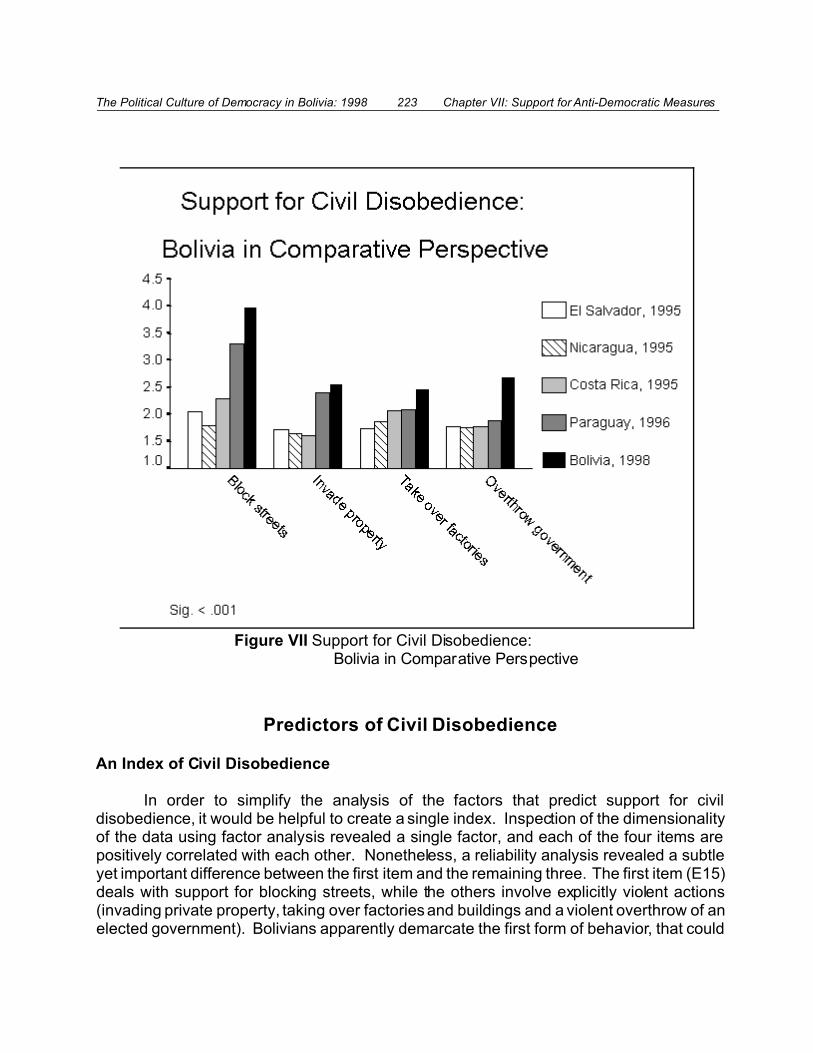
The Political Culture of Democracy in Bolivia: 1998 223 Chapter VII: Support for Anti-Democratic Measures
Figure VII Support for Civil Disobedience: Bolivia in Comparative Perspective
Predictors of Civil Disobedience
An Index of Civil Disobedience
In order to simplify the analysis of the factors that predict support for civildisobedience, it would be helpful to create a single index. Inspection of the dimensionalityof the data using factor analysis revealed a single factor, and each of the four items arepositively correlated with each other. Nonetheless, a reliability analysis revealed a subtleyet important difference between the first item and the remaining three. The first item (E15)deals with support for blocking streets, while the others involve explicitly violent actions(invading private property, taking over factories and buildings and a violent overthrow of anelected government). Bolivians apparently demarcate the first form of behavior, that could

The Political Culture of Democracy in Bolivia: 1998 224 Chapter VII: Support for Anti-Democratic Measures
involve a peaceful protest march, in the course of which streets could be blocked, and theother three forms of behavior.
The reliability analysis appears in Table VII.2. As can be seen, when item E15 isexcluded, the reliability increases (last column), whereas when any of the other items isexcluded, the reliability decreases. Analysis of the data shows clearly that approval ofblocking of streets is different from approval of the more violent forms of civil disobedience.
Table VII.2. Reliability of Civil Disobedience Items Scale Scale Corrected Mean Variance Item- Squared Alpha if Item if Item Total Multiple if Item Deleted Deleted Correlation Correlation Deleted
E15 7.6863 24.6217 .4367 .1949 .8464E14 9.1121 24.0741 .7256 .6403 .6921E2 9.1958 24.1835 .7209 .6511 .6946E3 8.9602 24.3366 .6075 .4034 .7441
Reliability Coefficients 4 itemsAlpha = .7956 Standardized item alpha = .8116
Socio-Economic and Demographic Factors
Ethnicity and urban/rural residence show no significant relationship to approval ofcivil disobedience in Bolivia, but the less-well educated are more likely to approve civildisobedience, in both its violent and non-violent forms. Figure VII.27 shows the results.The patterns are not particularly strong, but university educated Bolivians are the leastsupportive of civil disobedience.

The Political Culture of Democracy in Bolivia: 1998 225 Chapter VII: Support for Anti-Democratic Measures
Figure VII Approval of Civil Disobedience and Education
Income follows the same pattern as education. For both non-violent and violent civildisobedience, Bolivians with lower levels of income are more approving. Figure VII.29shows the results. The pattern is clearer, however, with the “block streets” variable than itis with the violence index.
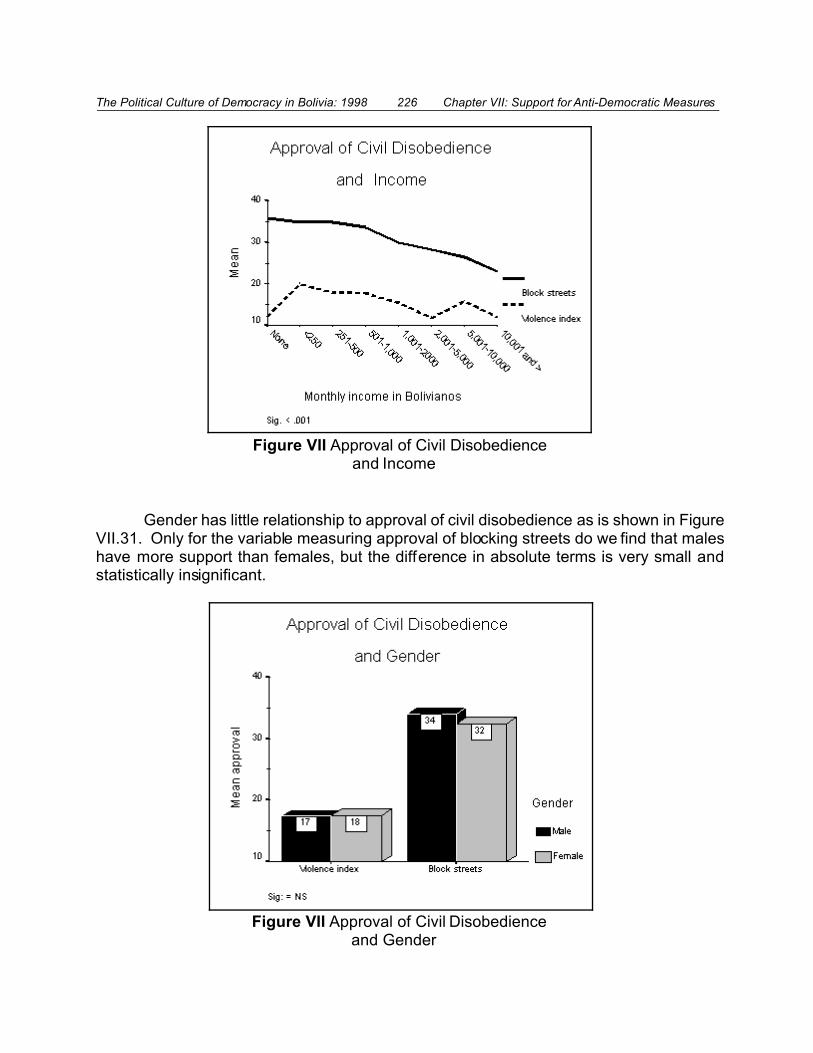
The Political Culture of Democracy in Bolivia: 1998 226 Chapter VII: Support for Anti-Democratic Measures
Figure VII Approval of Civil Disobedience and Gender
Figure VII Approval of Civil Disobedience and Income
Gender has little relationship to approval of civil disobedience as is shown in FigureVII.31. Only for the variable measuring approval of blocking streets do we find that maleshave more support than females, but the difference in absolute terms is very small andstatistically insignificant.
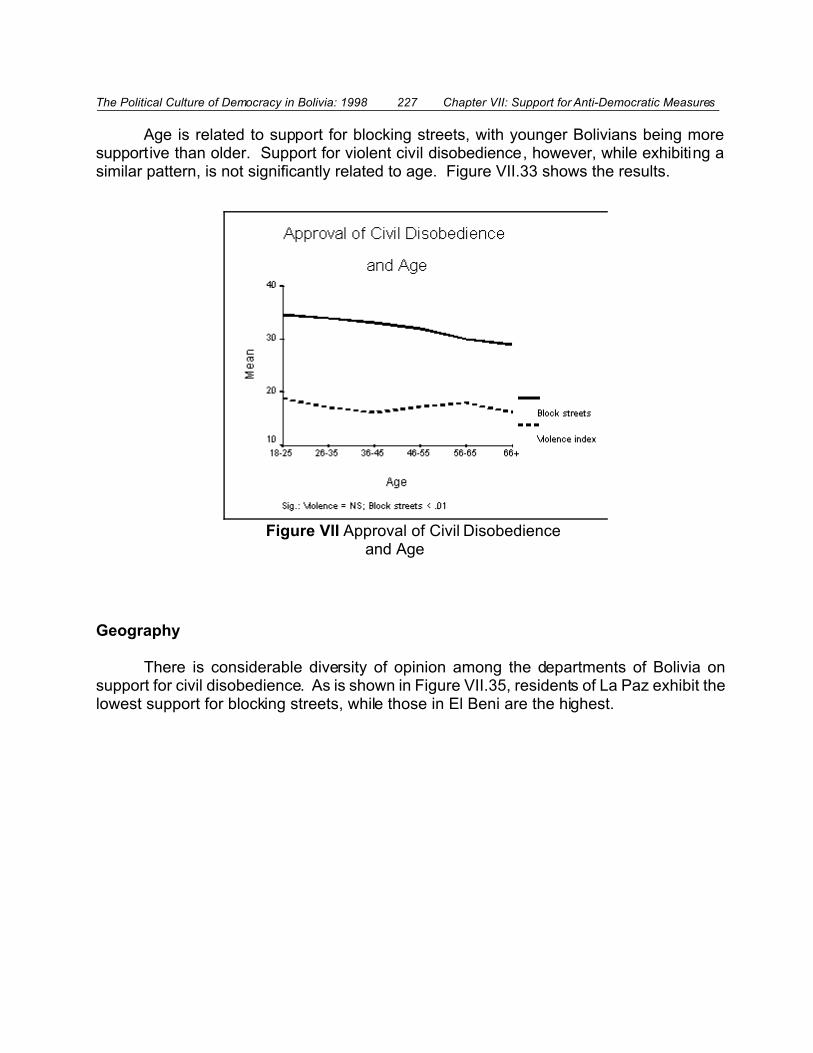
The Political Culture of Democracy in Bolivia: 1998 227 Chapter VII: Support for Anti-Democratic Measures
Figure VII Approval of Civil Disobedience and Age
Age is related to support for blocking streets, with younger Bolivians being moresupportive than older. Support for violent civil disobedience, however, while exhibiting asimilar pattern, is not significantly related to age. Figure VII.33 shows the results.
Geography
There is considerable diversity of opinion among the departments of Bolivia onsupport for civil disobedience. As is shown in Figure VII.35, residents of La Paz exhibit thelowest support for blocking streets, while those in El Beni are the highest.
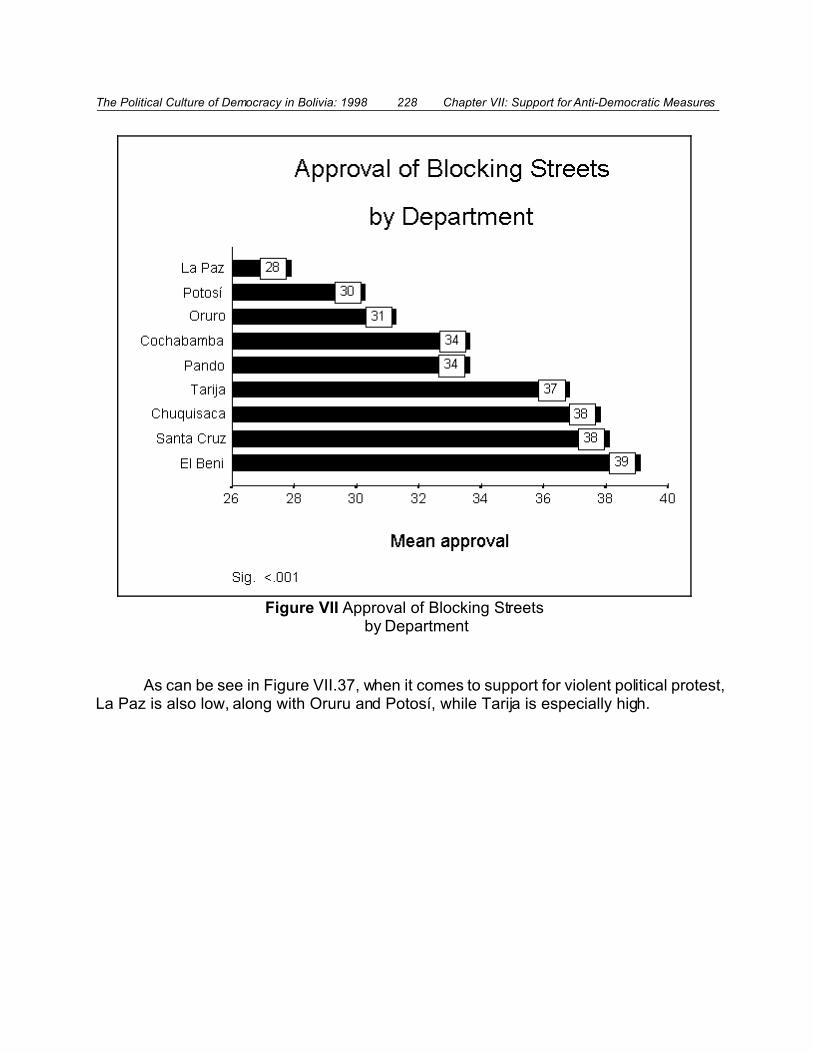
The Political Culture of Democracy in Bolivia: 1998 228 Chapter VII: Support for Anti-Democratic Measures
Figure VII Approval of Blocking Streets by Department
As can be see in Figure VII.37, when it comes to support for violent political protest,La Paz is also low, along with Oruru and Potosí, while Tarija is especially high.

The Political Culture of Democracy in Bolivia: 1998 229 Chapter VII: Support for Anti-Democratic Measures
Figure VII Approval of Violent Civil Protest by Department
Tolerance, System Support and Approval of Civil Disobedience
The analysis of the relationship between system support and approval of civildisobedience is complex, and only emerges clearly in the multivariate analysis that will beshown below. Tolerance, however, has the same, positive relationship to civil disobediencefor both violent and non-violent forms. This is to be expected, given that the tolerance itemsmeasure tolerance for the exercise of civil rights. It does not mean, however, that thosewho are tolerant would necessarily participate in these activities, only that they wouldapprove of others doing so. Once again, this highlights the importance of the multivariateanalysis.

The Political Culture of Democracy in Bolivia: 1998 230 Chapter VII: Support for Anti-Democratic Measures
Figure VII Approval of Civil Disobedience and Tolerance
The relationship between tolerance and approval of civil disobedience is shown inFigure VII.40. Both violent and non-violent means are more strongly approved by thosewho are more tolerant. As shown in the figure, among those who score highest intolerance, approval of blocking streets almost reaches the positive end of the 0-100continuum. It is also to be noted that approval of blocking streets is much greater thanapproval of violent forms of protest.
Ideology
Ideology (defined by a 10-point left-right scale), has no relationship to approval ofviolent forms of civil disobedience, as is shown in Figure VII.41. Approval of blocking ofstreets, however, is more strongly approved by the left than the center or right, except theextreme right also expresses higher approval. This suggests a frequent finding in thepolitical science literature that extreme ideological positions often exhibit similar attitudesand behaviors.

The Political Culture of Democracy in Bolivia: 1998 231 Chapter VII: Support for Anti-Democratic Measures
Figure VII Approval of Civil Disobedience and Ideology
Support for Coups and Approval of Civil Disobedience
It is now possible to examine the relationship between support for coups, studiedearlier in this chapter and support for civil disobedience. As noted at the outset, theseappear to be diametrically opposed forms of behavior. One associates coups with militaryoverthrow of civilian governments, which normally end up repressing civil liberties ofcitizens. Civil disobedience, in constrast, we think of as involving citizen protest againstrepressive acts of government. Thus, we would expect that those who support coupsshould not be approving of civil disobedience. In Bolivia, as we shall see in a moment, thisis not the case. Figure VII.43 shows a positive association between the overall index ofsupport for a coup and our two measures of approval of civil disobedience. These findingsare certainly troubling because they suggest indiscriminate support for violent means toresolve political disagreements.

The Political Culture of Democracy in Bolivia: 1998 232 Chapter VII: Support for Anti-Democratic Measures
Figure VII Approval of Civil Disobedience and Support for a Coup
More direct and dramatic evidence of this troubling pattern is found when item E3,approval of citizens participating in a group that wishes to overthrow an elected governmentby violent means, is examined alone, rather than as part of the violence index. FigureVII.45 shows the strong relationship between our respondents’ approval of citizenoverthrows of an elected government and military coups.

The Political Culture of Democracy in Bolivia: 1998 233 Chapter VII: Support for Anti-Democratic Measures
Figure VII Approval of Citizen Efforts to Overthrow an Elected Government and Support for a Coup
Overall Multivariate Models
The multivariate models of the factors predicting approval of civil disobedience aresimilar in most respects. Table VII.3 shows the pattern for blocking streets. As can beseen, more support for blocking streets is expressed by Bolivians who are younger, havelower incomes, are male, are on the left ideologically, have higher levels of politicaltolerance, and are more supportive of military coups. System support plays no role. Thestrongest predictors are tolerance and support for coups.
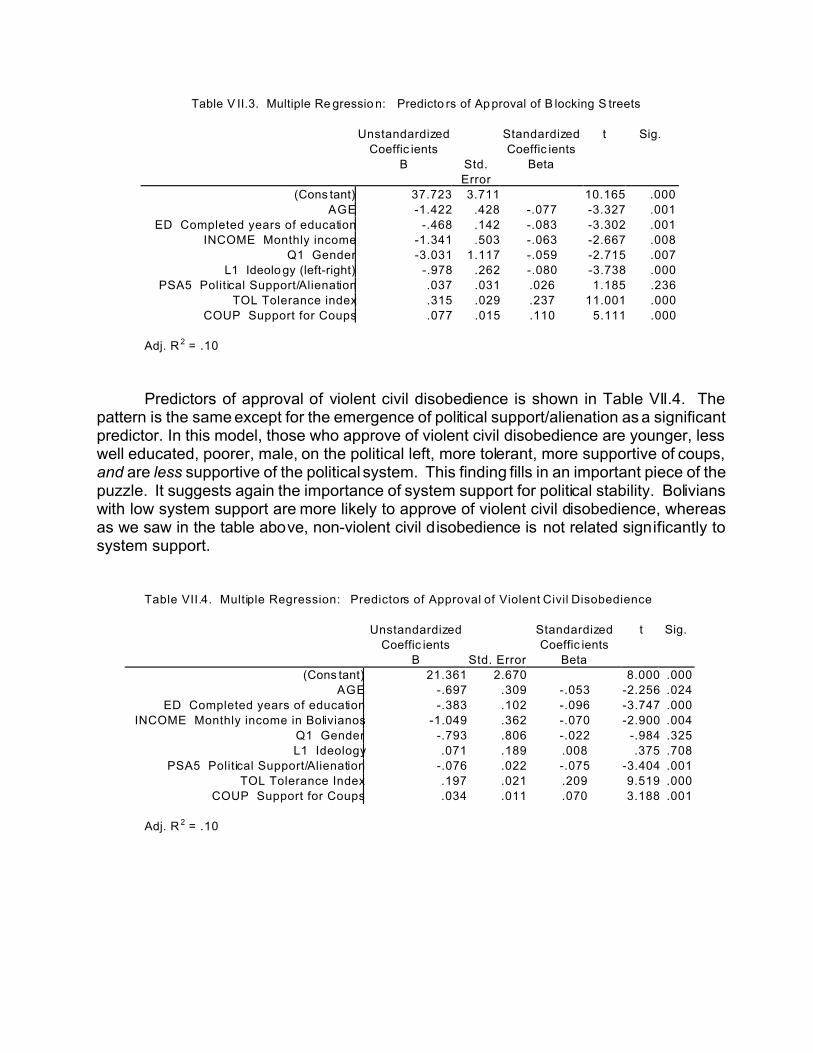
Table V II.3. Multiple Re gressio n: Predicto rs of Ap proval of B locking S treets
Unstandardized
Coeffic ients
Standardized
Coeffic ients
t Sig.
B Std.
Error
Beta
(Cons tant) 37.723 3.711 10.165 .000
AGE -1.422 .428 -.077 -3.327 .001
ED Completed years of education -.468 .142 -.083 -3.302 .001
INCOME Monthly income -1.341 .503 -.063 -2.667 .008
Q1 Gender -3.031 1.117 -.059 -2.715 .007
L1 Ideolo gy (left-right) -.978 .262 -.080 -3.738 .000
PSA5 Political Support/Alienation .037 .031 .026 1.185 .236
TOL Tolerance index .315 .029 .237 11.001 .000
COUP Support for Coups .077 .015 .110 5.111 .000
Adj. R 2 = .10
Predictors of approval of violent civil disobedience is shown in Table VII.4. Thepattern is the same except for the emergence of political support/alienation as a significantpredictor. In this model, those who approve of violent civil disobedience are younger, lesswell educated, poorer, male, on the political left, more tolerant, more supportive of coups,and are less supportive of the political system. This finding fills in an important piece of thepuzzle. It suggests again the importance of system support for political stability. Bolivianswith low system support are more likely to approve of violent civil disobedience, whereasas we saw in the table above, non-violent civil disobedience is not related significantly tosystem support.
Table VII.4. Multiple Regression: Predictors of Approval of Violent Civil Disobedience
Unstandardized
Coeffic ients
Standardized
Coeffic ients
t Sig.
B Std. Error Beta
(Cons tant) 21.361 2.670 8.000 .000
AGE -.697 .309 -.053 -2.256 .024
ED Completed years of education -.383 .102 -.096 -3.747 .000
INCOME Monthly income in Bolivianos -1.049 .362 -.070 -2.900 .004
Q1 Gender -.793 .806 -.022 -.984 .325
L1 Ideology .071 .189 .008 .375 .708
PSA5 Political Support/Alienation -.076 .022 -.075 -3.404 .001
TOL Tolerance Index .197 .021 .209 9.519 .000
COUP Support for Coups .034 .011 .070 3.188 .001
Adj. R 2 = .10
Conclusions
A little over one-quarter of the population of Bolivia would approve a coup d’etatunder conditions of high unemployment, student strikes, worker strikes and reduction inemployee wages. This is a proportion lower than in Nicaragua, but higher than in Paraguayand El Salvador. These results are not surprising, given Bolivia’s long history of militaryregimes and limited experience with democracy.
Coups are most strongly supported among the young and among the wealthiestcitizens. This suggests that the hope that the young (or the wealth) will emerge asdefenders of the democratic creed is misplaced, at least in Bolivia. Since the young arealso more likely to be victims of crime than the old, and crime victims more strongly supportcoups than those who have not been victims, it is important to consider the important effectsthat crime might have for democratic stability. Citizens who are more tolerant, however, arefar more likely to oppose a coup, so finding ways to increase political tolerance could helpincrease opposition to coups. Yet, the investigation conducted in this study found that inBolivia, tolerance does not increase with education or civil society participation. Only thosewho were more satisfied with municipal services were found to be more tolerant.
Bolivians were also found to be more supportive of civil disobedience than those ofother countries in Latin America. Not surprisingly, the more tolerant citizens were moresupportive of civil disobedience. But, what was most disturbing is that citizens who supportcivil disobedience are also more likely to support a coup, suggesting an indiscriminatesupport for violent forms of political behavior, either by the state or by its citizens. But, itwas encouraging to find that those who express higher system support (in the multivariatemodel) are far more likely to oppose violent acts of civil disobedience. This finding onceagain suggests the importance of system support for democratic stability.
236
Questionnaire:Spanish Version
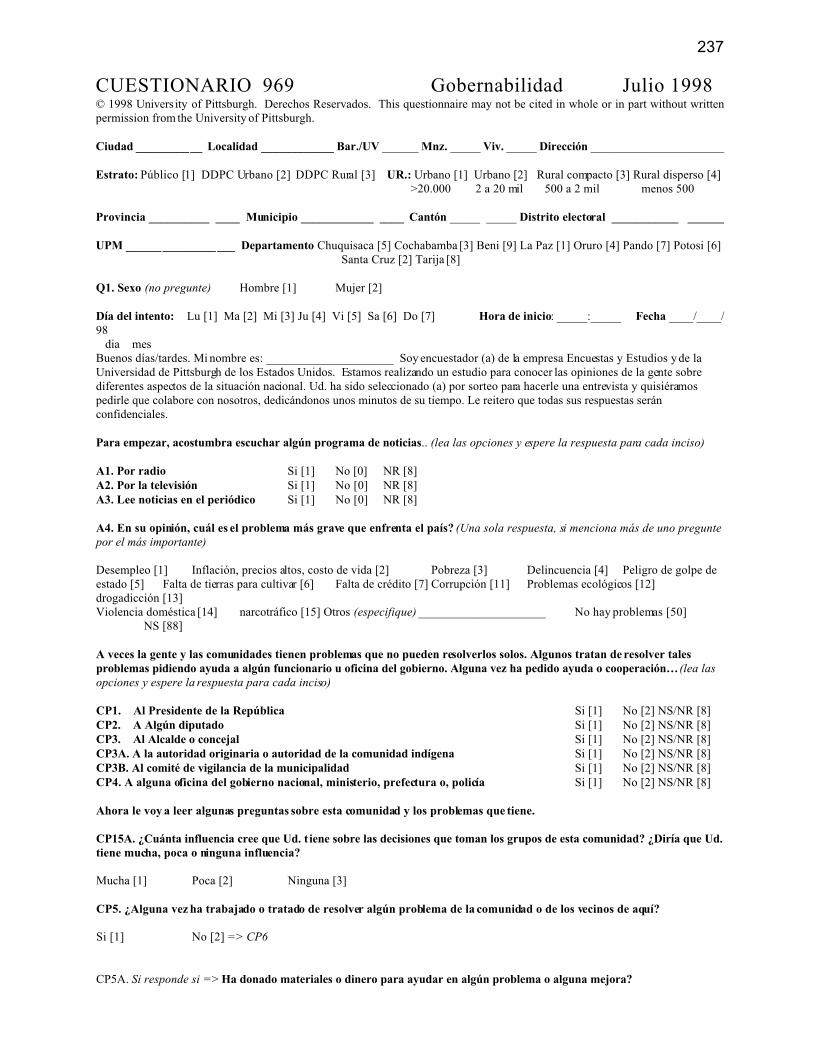
237
CUESTIONARIO 969 Gobernabilidad Julio 1998© 1998 Univers ity of Pittsburgh. Derechos Reservados. This questionnaire may not be cited in whole or in part without writtenpermission from the University of Pittsburgh.
Ciudad ___________ Localidad ____________ Bar./UV ______ Mnz. _____ Viv. _____ Dirección ______________________
Estrato: Público [1] DDPC Urbano [2] DDPC Rural [3] UR.: Urbano [1] Urbano [2] Rural compacto [3] Rural disperso [4] >20.000 2 a 20 mil 500 a 2 mil menos 500
Provincia __________ ____ Municipio ____________ ____ Cantón _____ _____ Distrito electoral ___________ ______
UPM __________________ Departamento Chuquisaca [5] Cochabamba [3] Beni [9] La Paz [1] Oruro [4] Pando [7] Potosi [6] Santa Cruz [2] Tarija [8]
Q1. Sexo (no pregunte) Hombre [1] Mujer [2]
Día del intento: Lu [1] Ma [2] Mi [3] Ju [4] Vi [5] Sa [6] Do [7] Hora de inicio: _____:_____ Fecha ____/____/98 dia mesBuenos días/tardes. Mi nombre es: _____________________ Soy encuestador (a) de la empresa Encuestas y Estudios y de laUniversidad de Pittsburgh de los Estados Unidos. Estamos realizando un estudio para conocer las opiniones de la gente sobrediferentes aspectos de la situación nacional. Ud. ha sido seleccionado (a) por sorteo para hacerle una entrevista y quisiéramospedirle que colabore con nosotros, dedicándonos unos minutos de su tiempo. Le reitero que todas sus respuestas seránconfidenciales. Para empezar, acostumbra escuchar algún programa de noticias.. (lea las opciones y espere la respuesta para cada inciso)
A1. Por radio Si [1] No [0] NR [8]A2. Por la televisión Si [1] No [0] NR [8]A3. Lee noticias en el periódico Si [1] No [0] NR [8]
A4. En su opinión, cuál es el problema más grave que enfrenta el país? (Una sola respuesta, si menciona más de uno preguntepor el más importante)
Desempleo [1] Inflación, precios altos, costo de vida [2] Pobreza [3] Delincuencia [4] Peligro de golpe deestado [5] Falta de tierras para cultivar [6] Falta de crédito [7] Corrupción [11] Problemas ecológicos [12]drogadicción [13]Violencia doméstica [14] narcotráfico [15] Otros (especifique) _____________________ No hay problemas [50]
NS [88]
A veces la gente y las comunidades tienen problemas que no pueden resolverlos solos. Algunos tratan de resolver talesproblemas pidiendo ayuda a algún funcionario u oficina del gobierno. Alguna vez ha pedido ayuda o cooperación… (lea lasopciones y espere la respuesta para cada inciso)
CP1. Al Presidente de la República Si [1] No [2] NS/NR [8]CP2. A Algún diputado Si [1] No [2] NS/NR [8]CP3. Al Alcalde o concejal Si [1] No [2] NS/NR [8]CP3A. A la autoridad originaria o autoridad de la comunidad indígena Si [1] No [2] NS/NR [8]CP3B. Al comité de vigilancia de la municipalidad Si [1] No [2] NS/NR [8]CP4. A alguna oficina del gobierno nacional, ministerio, prefectura o, policía Si [1] No [2] NS/NR [8]
Ahora le voy a leer algunas preguntas sobre esta comunidad y los problemas que tiene.
CP15A. ¿Cuánta influencia cree que Ud. t iene sobre las decisiones que toman los grupos de esta comunidad? ¿Diría que Ud.tiene mucha, poca o ninguna influencia?
Mucha [1] Poca [2] Ninguna [3]
CP5. ¿Alguna vez ha trabajado o tratado de resolver algún problema de la comunidad o de los vecinos de aquí?
Si [1] No [2] => CP6
CP5A. Si responde si => Ha donado materiales o dinero para ayudar en algún problema o alguna mejora?
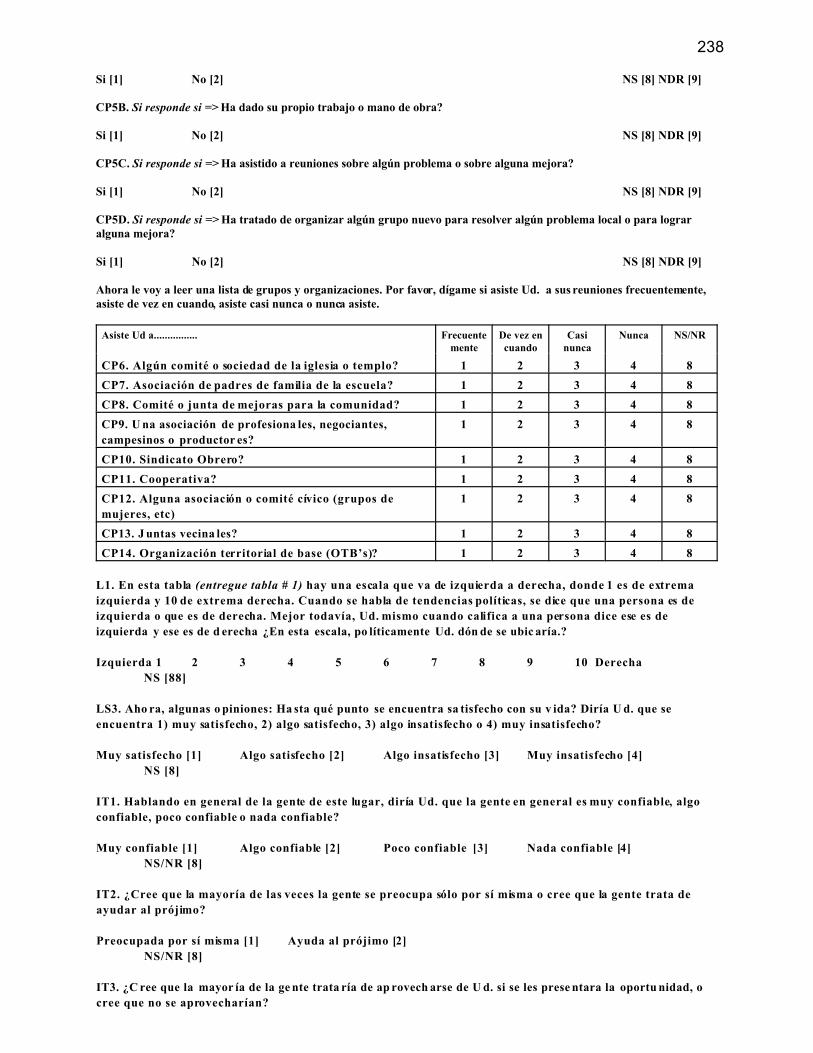
238
Si [1] No [2] NS [8] NDR [9]
CP5B. Si responde si => Ha dado su propio trabajo o mano de obra?
Si [1] No [2] NS [8] NDR [9]
CP5C. Si responde si => Ha asistido a reuniones sobre algún problema o sobre alguna mejora?
Si [1] No [2] NS [8] NDR [9]
CP5D. Si responde si => Ha tratado de organizar algún grupo nuevo para resolver algún problema local o para lograralguna mejora?
Si [1] No [2] NS [8] NDR [9]
Ahora le voy a leer una lista de grupos y organizaciones. Por favor, dígame si asiste Ud. a sus reuniones frecuentemente,asiste de vez en cuando, asiste casi nunca o nunca asiste.
Asiste Ud a................ Frecuentemente
De vez encuando
Casinunca
Nunca NS/NR
CP6. Algún comité o sociedad de la iglesia o templo? 1 2 3 4 8
CP7. Asociación de padres de familia de la escuela? 1 2 3 4 8
CP8. Comité o junta de mejoras para la comunidad? 1 2 3 4 8
CP9. U na asociación de profesiona les, negociantes,
campesinos o productor es?
1 2 3 4 8
CP10. Sindicato Obrero? 1 2 3 4 8
CP11. Cooperativa? 1 2 3 4 8
CP12. Alguna asociación o comité cívico (grupos de
mujeres, etc)
1 2 3 4 8
CP13. J untas vecina les? 1 2 3 4 8
CP14. Organización territorial de base (OTB’s)? 1 2 3 4 8
L1. En esta tabla (entregue tabla # 1) hay una escala que va de izquierda a derecha, donde 1 es de extrema
izquierda y 10 de extrema derecha. Cuando se habla de tendencias políticas, se dice que una persona es de
izquierda o que es de derecha. Mejor todavía, Ud. mismo cuando califica a una persona dice ese es de
izquierda y ese es de d erecha ¿En esta escala, po líticamente Ud. dón de se ubic aría.?
Izquierda 1 2 3 4 5 6 7 8 9 10 Derecha
NS [88]
LS3. Aho ra, algunas o piniones: Ha sta qué punto se encuentra sa tisfecho con su v ida? Diría U d. que se
encuentra 1) muy satisfecho, 2) algo satisfecho, 3) algo insatisfecho o 4) muy insatisfecho?
Muy satisfecho [1] Algo satisfecho [2] Algo insatisfecho [3] Muy insatisfecho [4]
NS [8]
IT1. Hablando en general de la gente de este lugar, diría Ud. que la gente en general es muy confiable, algo
confiable, poco confiable o nada confiable?
Muy confiable [1] Algo confiable [2] Poco confiable [3] Nada confiable [4]
NS/NR [8]
IT2. ¿Cree que la mayoría de las veces la gente se preocupa sólo por sí misma o cree que la gente trata de
ayudar al prójimo?
Preocupada por sí misma [1] Ayuda al prójimo [2]
NS/NR [8]
IT3. ¿C ree que la mayor ía de la ge nte trata ría de ap rovech arse de U d. si se les prese ntara la oportu nidad, o
cree que no se aprovecharían?

239
Si se aprovecharían [1] No se aprovecharían [2]
NS/NR [8]
CC12. En general. ¿Cómo le han tratado cuando ha tenido que ir a una oficina del gobierno?
Muy bien [1] Bien [2] Regular [3] Mal [4] Muy mal [5] NS [8] No trató con
oficinas del gobierno [9]
VB1. Ahora, vamos a hablar de las elecciones. ¿Estaba Ud. inscrito para votar en las elecciones pasadas?
Si [1] No [2] => pase a VB4
VB2 . Si estaba inscrito = >Votó Ud. en las elecciones pasadas (de junio de 1997)
Si [1] No [2] => pase a VB2B
NDR [9]
VB2 A. Si votó en las elecciones de 1997=> Por cuál partido o candidato votó para presidente? (No lea las
alternativas)
ADN (Banzer) [1] MNR (Durán) [2] MIR (Pas Z) [3] Condepa (Loza) [4] UCS (Kuljis) [5] Voto nulo, blanco [7]
Otro__________ NS / No recuerda, No responde [8] NDR [9]
VB2 ADIP . Si votó en las elecciones de 1997=> Por qué partido votó para diputado uninominal ? (No lea las
alternativas)
AND [1] MNR [2] MIR [3] Condepa [4] UCS [5] Voto nulo, blanco [7] Otro__________ NS / No recuerda/NR
[8] NDR [9]
VB2 B. Si no votó => Por qué no votó (No lea las a lternativas, a cepte un a sola resp uesta, la m ás impo rtante).
Enfermedad [1] Falta de transporte [2] Violencia, Falta de seguridad [3] No inscrito pero con edad [4]
Tener que trabajar [5] No cree en las elecciones [6] Perdió cédula electoral [7] No tiene edad [14]
Estaba fuera del país [15] Otro (especifique)________________ NS [88] NDR [99]
VB4 . Para todos => Por qué motivo piensa Ud. que algunas personas no pudieron votar en las pasadas
elecciones presidenciales de Junio de 1997? (No lea las alternativas, acepte una sola respuesta, la más
importa nte).
Enfermedad [1] Falta de transporte [2] Violencia, Falta de seguridad [3] No inscrito pero con edad [4]
Tener que trabajar [5] No cree en las elecciones [6] Perdió cédula electoral [7] No tiene edad [14]
Estaba fuera del país [15] Otro (especifique)________________ NS [88]
VB6. ¿Es Ud. miembro de algún partido político?
Si [1] No [2] NR [8]
VB7. En su opinión, quién le representa mejor 1) el diputado plurinominal de la lista de partidos, o 2) el
diputado uninominal de su distrito?
Partido [1] Uninominal [2] No sabe cual es cual [3] NS [8]
PP55. H ay persona s que trabaja n por algun o de los partido s o candidato s durante las ca mpañas electo rales.
Ha trab ajado U d. para algú n partido o ca ndidato en esta s elecciones o en las pa sadas?
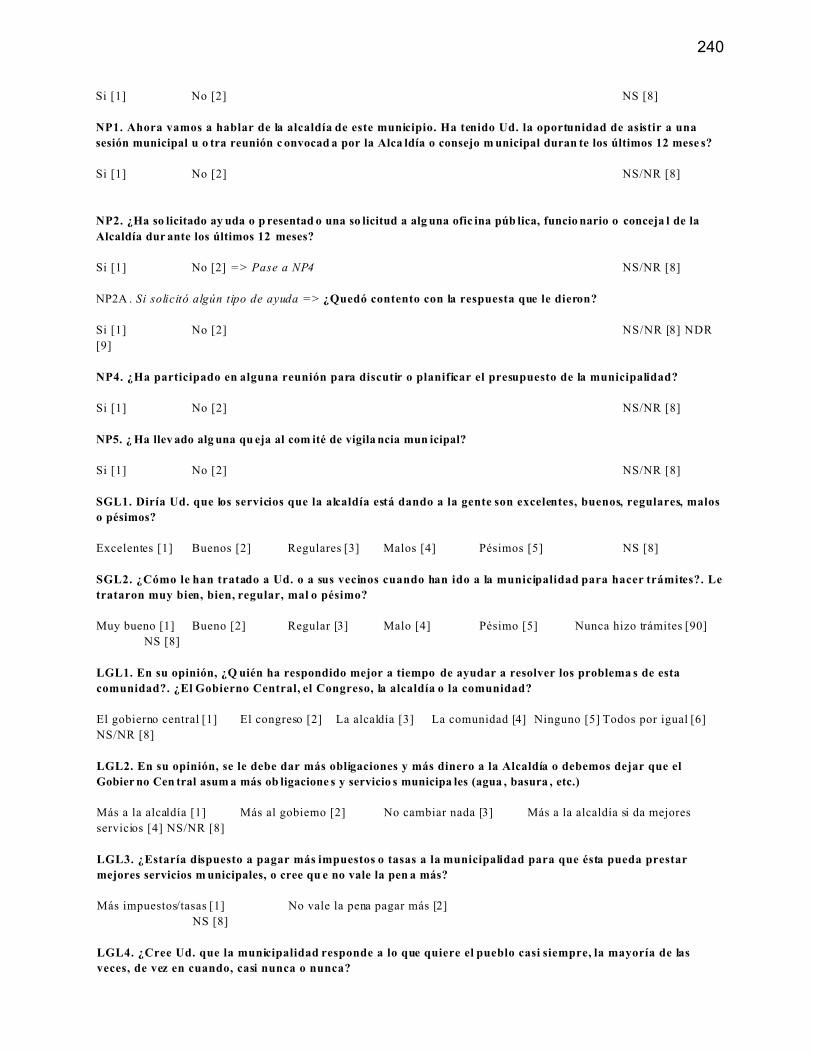
240
Si [1] No [2] NS [8]
NP1. Ahora vamos a hablar de la alcaldía de este municipio. Ha tenido Ud. la oportunidad de asistir a una
sesión municipal u o tra reunión c onvocad a por la Alca ldía o consejo m unicipal duran te los últimos 12 mese s?
Si [1] No [2] NS/NR [8]
NP2. ¿Ha so licitado ay uda o p resentad o una so licitud a alg una ofic ina púb lica, funcio nario o conceja l de la
Alcaldía dur ante los últimos 12 meses?
Si [1] No [2] => Pase a NP4 NS/NR [8]
NP2A . Si solicitó algún tipo de ayuda => ¿Quedó contento con la respuesta que le dieron?
Si [1] No [2] NS/NR [8] NDR
[9]
NP4. ¿Ha participado en alguna reunión para discutir o planificar el presupuesto de la municipalidad?
Si [1] No [2] NS/NR [8]
NP5. ¿ Ha llev ado alg una qu eja al com ité de vigila ncia mun icipal?
Si [1] No [2] NS/NR [8]
SGL1. Diría Ud. que los servicios que la alcaldía está dando a la gente son excelentes, buenos, regulares, malos
o pésimos?
Excelentes [1] Buenos [2] Regulares [3] Malos [4] Pésimos [5] NS [8]
SGL2. ¿Cómo le han tratado a Ud. o a sus vecinos cuando han ido a la municipalidad para hacer trámites?. Le
trataron muy bien, bien, regular, mal o pésimo?
Muy bueno [1] Bueno [2] Regular [3] Malo [4] Pésimo [5] Nunca hizo trámites [90]
NS [8]
LGL1. En su opinión, ¿Q uién ha respondido mejor a tiempo de ayudar a resolver los problema s de esta
comunidad?. ¿El Gobierno Central, el Congreso, la alcaldía o la comunidad?
El gobierno central [1] El congreso [2] La alcaldía [3] La comunidad [4] Ninguno [5] Todos por igual [6]
NS/NR [8]
LGL2. En su opinión, se le debe dar más obligaciones y más dinero a la Alcaldía o debemos dejar que el
Gobier no Cen tral asum a más ob ligacione s y servicio s municipa les (agua , basura , etc.)
Más a la alcaldía [1] Más al gobierno [2] No cambiar nada [3] Más a la alcaldía si da mejores
servicios [4] NS/NR [8]
LGL3. ¿Estaría dispuesto a pagar más impuestos o tasas a la municipalidad para que ésta pueda prestar
mejores servicios m unicipales, o cree qu e no vale la pen a más?
Más impuestos/tasas [1] No vale la pena pagar más [2]
NS [8]
LGL4. ¿Cree Ud. que la municipalidad responde a lo que quiere el pueblo casi siempre, la mayoría de las
veces, de vez en cuando, casi nunca o nunca?

241
casi siempre [1] la mayoría de las veces [2] de vez en cuando [3] casi nunca [4] nunca [5]
NS [8]
Algunas personas dicen que se justificaría, bajo ciertas circunstancias, un Golpe de Estado por los militares, es
decir cuando los militares toman el poder. En su opinión, un golpe de estado por los militares se justifica o no
se justifica… (lea los inciso s y espere la respuesta ).
JC1. Si el desempleo es muy alto? Se justifica [1] No se justifica [2]
NS/NR [8]
JC4. Si hay muchas hue lgas estudiantiles en las u niversidades? Se justifica [1] No se justifica [2]
NS/NR [8]
JC9. Si hay un gran nú mero de hu elgas por trab ajadores sind icalizados? Se justifica [1] No se justifica [2]
NS/NR [8]
JC10. Si los pa tronos acor tan mucho los sueldos de sus emp leados? Se justifica [1] No se justifica [2]
NS/NR [8]
JC15. A lgunas perso nas prefieren v ivir bajo una democrac ia porque pr otege los derec hos human os e
individuales, a pesar de que a veces pueda ser ineficiente y desordenada. Otros prefieren vivir bajo una
dictadura por su orden y eficiencia. Qué prefiere más Ud. una democracia o una dictadura?
Una democracia [1] Una dictadura [2] NS/NR [8]
BC15 . ¿Podrían o currir motivos p or los cuales justificaría U d. un golpe de estado que inte rrumpa el pr oceso
democrático Boliviano?
Si [1] No [2]
NS[8]
BC16. Considera Ud. que hay alguna razón por la cuál se justifique la violencia cometida por militantes
políticos?
Se justifica [1] No se justifica [2] NS [8]
Ahora (entregue tarjeta # 2 ) vamos a usar esta tarjeta.... Esta tarjeta contiene una escalera de 7 gradas, cada
una ind ica un pu ntaje qu e va de 1 que signific a nada , hasta 7 q ue significa mucho . Por ejem plo si yo le
pregunto:”hasta qué punto le gusta ver TV?”, si a Ud. no le gusta nada elegiría el puntaje de 1; si por el
contrario, le gusta mucho ver TV me diría el número 7. Si su opinión está entre nada y mucho, Ud. elegiría un
puntaje intermedio. Hagamos la prueba. “hasta qué punto le gusta ver TV?” léame el número por favor.
(ASEG URE SE QU E ENT IEND A) Usand o esta tar jeta ..................
EscaleraNada Mucho
NS/NR
B1. Hasta qué punto cree Ud. que los tribunales de justicia de
Bolivia garantizan un juicio justo?
1 2 3 4 5 6 7 8
B2. Hasta qué punto tiene respeto por las instituciones políticas
de Bolivia?
1 2 3 4 5 6 7 8
B3. Hasta qué punto cree Ud. que los derechos básicos del
ciudadano están bien protegidos por el sistema político
boliviano?
1 2 3 4 5 6 7 8
B4. Hasta qué punto se siente orgulloso de vivir bajo el sistema
político boliviano?
1 2 3 4 5 6 7 8
B6. Hasta qué punto piensa que se debe apoyar el sistema
político boliviano?
1 2 3 4 5 6 7 8
B30. Hasta qué punto tiene confianza en los partidos políticos 1 2 3 4 5 6 7 8
B11. Hasta qué punto tiene confianza en la Corte Nacional
Electora l?
1 2 3 4 5 6 7 8
B12. Hasta qué punto tiene confianza en el Ejército? 1 2 3 4 5 6 7 8
B13. Hasta qué punto tiene confianza en el Congreso? 1 2 3 4 5 6 7 8

242
B14. H asta qué punto tie ne confia nza en e l Gobier no Cen tral? 1 2 3 4 5 6 7 8
B15. Hasta qué punto tiene confianza en la Contraloría General
de la República?
1 2 3 4 5 6 7 8
B18. Hasta qué punto tiene confianza en la policía? 1 2 3 4 5 6 7 8
B20. Hasta qué punto tiene confianza en la Iglesia Católica? 1 2 3 4 5 6 7 8
B21. H asta qué pun to tiene confian za en los period istas? 1 2 3 4 5 6 7 8
B22. H asta qué punto tie ne confia nza en e l Gobier no M unicipal? 1 2 3 4 5 6 7 8
B22B. Hasta qué punto tiene confianza en la autoridad
originaria?
1 2 3 4 5 6 7 8
B22C . Hasta qué pun to tiene co nfianza en el comit é de vigila ncia
municipa l?
1 2 3 4 5 6 7 8
B22D. Hasta que punto tiene confianza en las Organizaciones
Territoriales de Base OTBs
1 2 3 4 5 6 7 8
B23. H asta qué pun to tiene confian za en los sindicato s? 1 2 3 4 5 6 7 8
B23A. Hasta qué punto tiene confianza en el Ministerio Público
o fiscales?
1 2 3 4 5 6 7 8
B23B. Hasta que punto tiene confianza en la defensoría pública? 1 2 3 4 5 6 7 8
B24 H asta qué punto c ree Ud . que las elec ciones fue ron libres , o
sea que la gente pudo votar por el candidato que prefería?
1 2 3 4 5 6 7 8
B25. Hasta qué punto cree Ud. que las elecciones fueron
limpias, o sea sin fraude?
1 2 3 4 5 6 7 8
B26. Hasta qué punto cree Ud. que el Gobierno Central
responde a las necesidades de la gente?
1 2 3 4 5 6 7 8
Ahor a vamo s a camb iar de tar jeta. (entregue tarjeta # 3 ). Esta nueva tarjeta tiene una escalera de 1 a 10
gradas, con el 1 indicando que Ud. desaprueba mucho y el 10 indicando que aprueba mucho. Las preguntas
que siguen son para saber su opinión sobre las diferentes ideas que tienen las personas que viven en Bolivia.
(Encue stador: N o olvide c ambia r de escala ).
EscaleraDesaprueba Aprueba
NS/NR
D1. Hay personas que solamente hablan mal de los
gobiern os bolivia nos, no so lo del Go bierno a ctual,
sino del sistema de gobierno boliviano. Con qué
firmeza aprueba o desaprueba Ud. el derecho de
votar de esas personas?. Por favor léame el número
SONDE E: Hasta qué punto?
1 2 3 4 5 6 7 8 9 10 88
D2. Pensando siempre en aquellas personas que
solamente hablan mal del sistema de gobierno
boliviano. Con qué firmeza aprueba o desaprueba el
que estas personas puedan llevar a cabo
manifestaciones pacíficas con el propósito de
expresar sus puntos de vista?
1 2 3 4 5 6 7 8 9 10 88
D3. Con qué firmeza aprueba o desaprueba que las
personas que sólo hablan mal del sistema de
gobierno boliviano les permitan postularse para
cargos públicos
1 2 3 4 5 6 7 8 9 10 88
D4. Pensando siempre en aquellas personas que
solamente hablan mal del sistema de gobierno
boliviano. ¿Con qué firmeza aprueba o desaprueba
que salgan en la televisión para hacer un discurso?
1 2 3 4 5 6 7 8 9 10 88
Dejemos de lado a las personas que hablan mal del sistema de gobierno boliviano. Hablemos ahora de todas las
personas en general. Hasta qué punto Ud. aprueba o desaprueba … (encuesta dor: preg unte inciso por inciso ).

243
EscalaDesaprueba Aprueba
NS/NR
E5. Que las personas participen en manifestaciones
permitidas por la ley?
1 2 3 4 5 6 7 8 9 10 88
E8. Que las personas participen en una organización o
grupo para tratar de resolver problemas de las
comunidad es?
1 2 3 4 5 6 7 8 9 10 88
E11. Que las personas trabajen en campañas
electorales para un partido político o candidato?
1 2 3 4 5 6 7 8 9 10 88
E15. Que las personas participen en un cierre o
bloqueo de las calles?
1 2 3 4 5 6 7 8 9 10 88
E14. Que las personas inva dan prop iedades priva das? 1 2 3 4 5 6 7 8 9 10 88
E2. Que las personas se apoderen de fábricas, oficinas
u otros edificios?
1 2 3 4 5 6 7 8 9 10 88
E3. Que las personas participen en un grupo que
quiera derrocar por medios violentos a un gobierno
elegido
1 2 3 4 5 6 7 8 9 10 88
Ahora vamos ha hablar de algunas acciones que el Estado puede tomar. Con qué firmeza aprobaría o
desaprobaría … (encuesta dor: preg unte inciso por inciso ).
EscalaDesaprueba Aprueba
NS/NR
C3. ¿Una ley que prohibiera las manifestaciones
públicas?
1 2 3 4 5 6 7 8 9 10 88
C5. ¿ Con qué firmeza aprobaría o desaprobaría que
se prohibiera reuniones de cualquier grupo que
critique el sistema político boliviano?
1 2 3 4 5 6 7 8 9 10 88
C6. ¿Con qué firmeza aprobaría o desaprobaría que el
Gobierno censure la propaganda de sus enemigos
políticos?
1 2 3 4 5 6 7 8 9 10 88
¿Con cuál de las siguientes afirmaciones está Ud. más de acuerdo?
NEWTOL 1. El Estado debería permitir: 1) una libertad de opinión ó 2) el Estado debería tener el derecho de
silenciar a aquellos que se oponen a los deseos de la gente.
Completa libertad [1] Silenciar [2] NS [8]
NEWTOL 2. El Estado debería tener el derecho 1) de detener a sus oponentes políticos sin necesidad de un
juicio si la situación así lo requiere o 2) nadie debería ser detenido sin juicio previo.
Derecho a detener [1] Nadie detenido [2] NS [8]
NEWTO L3. El Estado debería: 1) garantizar a todos el derecho a la protesta y manifestación pacífica ó 2) el
Estado deb ería tener dere cho a suprimir la s protestas de sus o ponentes po líticos.
Garantizar el derecho [1] Suprimir las protestas [2] NS [8]
NEWTOL 4. El Estado debería 1) tener el derecho de prohibir la expresión de opiniones falsas que puedan
dañar a nuestra nación ó 2) el Estado no debería tener el derecho de prohibir la expresión de cualquier idea,
incluso si tenemos que pagar un precio por ello.
Prohibir la expresión [1] No prohibir la expresión [2] NS [8]
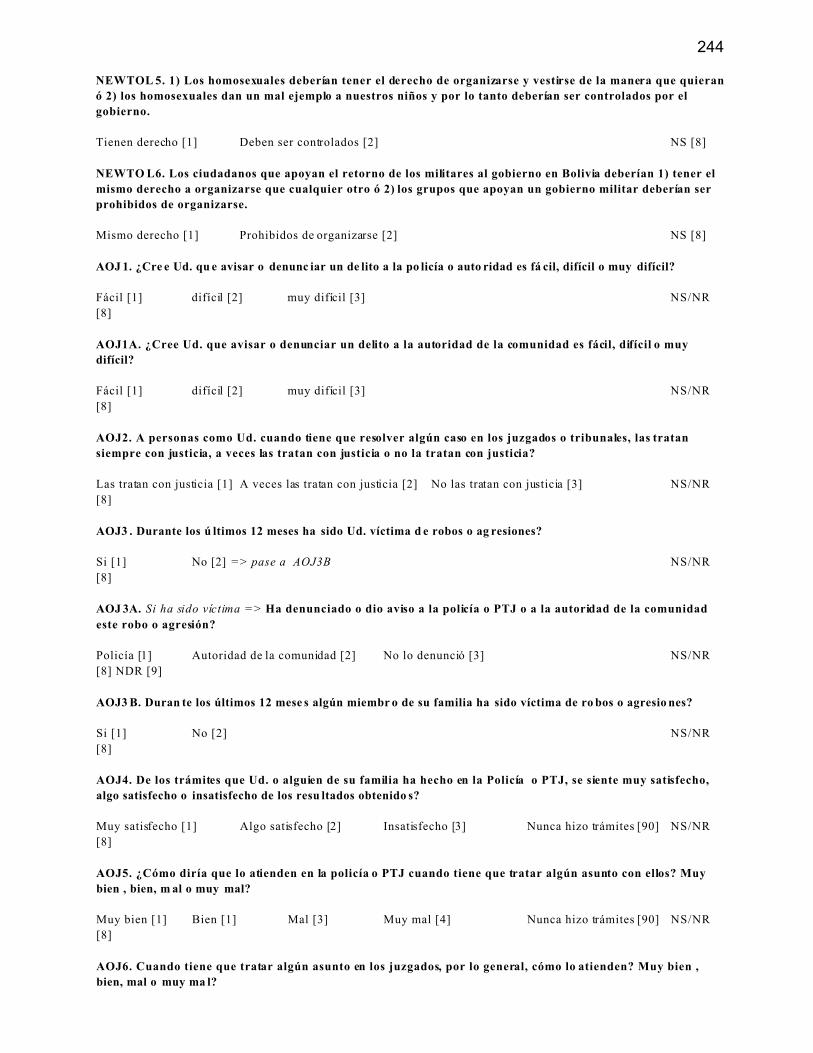
244
NEWTOL 5. 1) Los homosexuales deberían tener el derecho de organizarse y vestirse de la manera que quieran
ó 2) los homosexuales dan un mal ejemplo a nuestros niños y por lo tanto deberían ser controlados por el
gobierno.
Tienen derecho [1] Deben ser controlados [2] NS [8]
NEWTO L6. Los ciudadanos que apoyan el retorno de los militares al gobierno en Bolivia deberían 1) tener el
mismo derecho a organizarse que cualquier otro ó 2) los grupos que apoyan un gobierno militar deberían ser
prohibidos de organizarse.
Mismo derecho [1] Prohibidos de organizarse [2] NS [8]
AOJ 1. ¿Cre e Ud. qu e avisar o denunc iar un de lito a la po licía o auto ridad es fá cil, difícil o muy difícil?
Fácil [1] difícil [2] muy difícil [3] NS/NR
[8]
AOJ1A. ¿Cree Ud. que avisar o denunciar un delito a la autoridad de la comunidad es fácil, difícil o muy
difícil?
Fácil [1] difícil [2] muy difícil [3] NS/NR
[8]
AOJ2. A personas como Ud. cuando tiene que resolver algún caso en los juzgados o tribunales, las tratan
siempre con justicia, a veces las tratan con justicia o no la tratan con justicia?
Las tratan con justicia [1] A veces las tratan con justicia [2] No las tratan con justicia [3] NS/NR
[8]
AOJ3 . Durante los ú ltimos 12 meses ha sido Ud. víctima d e robos o ag resiones?
Si [1] No [2] => pase a AOJ3B NS/NR
[8]
AOJ 3A. Si ha sido víctima => Ha denunciado o dio aviso a la policía o PTJ o a la autoridad de la comunidad
este robo o agresión?
Policía [1] Autoridad de la comunidad [2] No lo denunció [3] NS/NR
[8] NDR [9]
AOJ3 B. Duran te los últimos 12 mese s algún miembr o de su familia ha sido víctima de ro bos o agresio nes?
Si [1] No [2] NS/NR
[8]
AOJ4. De los trámites que Ud. o alguien de su familia ha hecho en la Policía o PTJ, se siente muy satisfecho,
algo satisfecho o insatisfecho de los resu ltados obtenido s?
Muy satisfecho [1] Algo satisfecho [2] Insatisfecho [3] Nunca hizo trámites [90] NS/NR
[8]
AOJ5. ¿Cómo diría que lo atienden en la policía o PTJ cuando tiene que tratar algún asunto con ellos? Muy
bien , bien, m al o muy mal?
Muy bien [1] Bien [1] Mal [3] Muy mal [4] Nunca hizo trámites [90] NS/NR
[8]
AOJ6. Cuando tiene que tratar algún asunto en los juzgados, por lo general, cómo lo atienden? Muy bien ,
bien, mal o muy ma l?

245
Muy bien [1] Bien [1] Mal [3] Muy mal [4] Nunca hizo trámites [90] NS/NR
[8]
AOJ7. Cuando tiene que tratar algún asunto en las oficinas del Ministerio Público o fiscales, cómo lo atienden?
Mu y bien , bien , mal o mu y mal?
Muy bien [1] Bien [1] Mal [3] Muy mal [4] Nunca hizo trámites [90] NS/NR
[8]
Ahora queremos hablar de su experiencia personal con cosas que pasan en la vida…
EXPERIENCIAS PERSONALES No Si NS
EXC 1. Ha sid o acusa do dur ante los ú ltimos dos a ños por un agen te de polic ía
por una infracción que Ud. no cometió?
0 1 8
EXC2. Algú n agente de policía le pidió una coima (o soborno )? 0 1 8
EXC4. ¿Ha visto a alguien pagando una coima a un policía en los dos últimos
años?
0 1 8
EXC5. ¿Ha visto a alguien pagando una coima a un empleado público por
cualquier tipo d e favor en los d os últimos años?
0 1 8
EXC6. ¿Un empleado público le ha solicitado una coima en los últimos dos
años?
0 1 8
EXC11. Para tramitar algo en la municipalidad (como una licencia por
ejemplo) durante los dos últimos años. ¿Ha tenido que pagar alguna suma
además de lo exigido por la ley?
0 1 8
EXC12. Para tramitar algún préstamo u otra transacción en un banco. ¿Ha
tenido que pa gar alguna suma adem ás de lo correcto en los dos últimos añ os?
0 1 8
EXC13. En su trabajo, le han solicitado algún pago no correcto en los últimos
dos años?
0 1 8
EXC14. ¿Conoce a alguien que ha tenido que pagar una coima en la Corte en
los últimos dos año s?
0 1 8
EXC7. Teniendo en cuenta su experiencia o lo que ha oido mencionar, la corrupción de los funcionarios
públicos esta muy generalizada, generalizada, poco generalizada o nada generalizada?
Muy generalizada [1] Generalizada [2] Poco generalizada [3] Nada generalizada [4] NS/NR
[8]
Ahora le voy a nombrar varias instituciones públicas y privadas. Me interesa saber hasta qué punto cree Ud.
que los representantes en estas instituciones son honrados o corruptos. En una escala del 1 al 10 donde 1 quiere
decir muy corruptos y 10 quiere decir muy honrados, podría decirme hasta qué punto cree Ud. que son
honra dos o co rrupto s …. (lea inciso por inciso y espere la respuesta)
INSTITUCIONES GRADO DE CORRUPCIONMuy MuyCorruptos Honrados
NS
PC1. Los diputados 1 2 3 4 5 6 7 8 9 10 88
PC2. Los ministros 1 2 3 4 5 6 7 8 9 10 88
PC3. Los alcaldes 1 2 3 4 5 6 7 8 9 10 88
PC4. Los concejales 1 2 3 4 5 6 7 8 9 10 88
PC5. Los policías 1 2 3 4 5 6 7 8 9 10 88
PC7. Los maestros 1 2 3 4 5 6 7 8 9 10 88
PC8. Los catedráticos de las universidades 1 2 3 4 5 6 7 8 9 10 88
PC9. Los sacerdotes, cleros y pastores 1 2 3 4 5 6 7 8 9 10 88
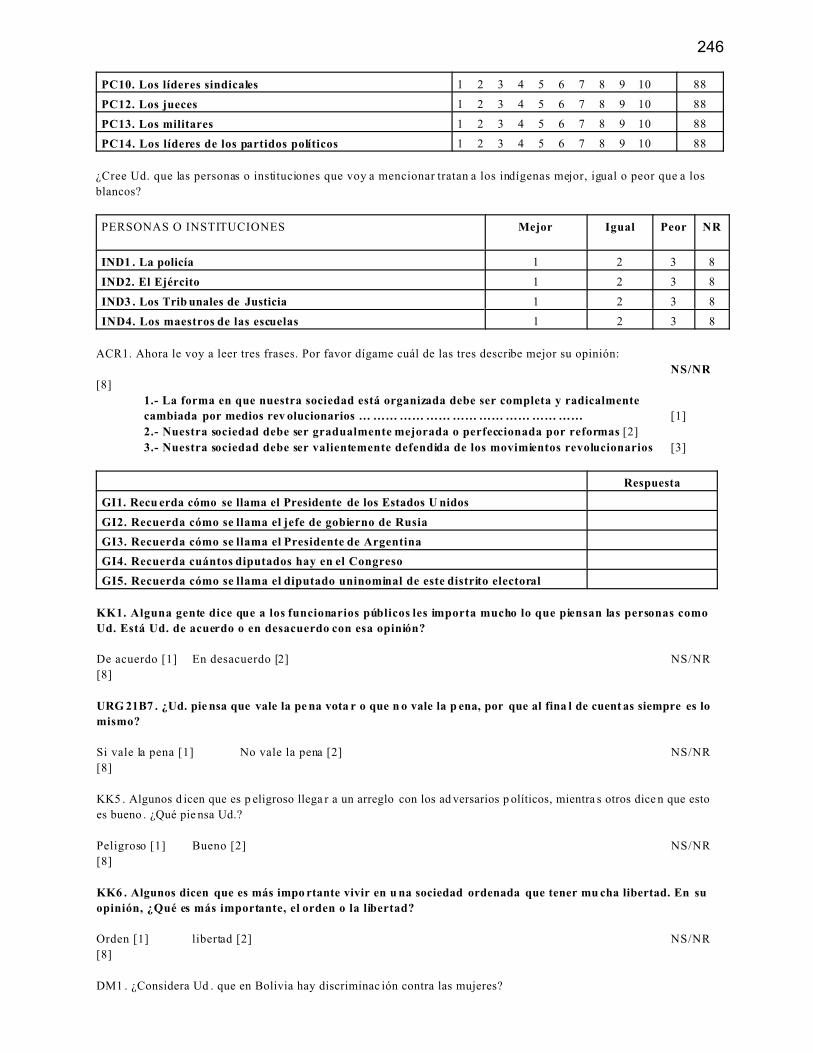
246
PC10. Los líderes sindicales 1 2 3 4 5 6 7 8 9 10 88
PC12. Los jueces 1 2 3 4 5 6 7 8 9 10 88
PC13. Los militares 1 2 3 4 5 6 7 8 9 10 88
PC14. Los líderes de los partidos políticos 1 2 3 4 5 6 7 8 9 10 88
¿Cree Ud. que las personas o instituciones que voy a mencionar tratan a los indígenas mejor, igual o peor que a los
blancos?
PERSONAS O INSTITUCIONES Mejor Igual Peor NR
IND1 . La policía 1 2 3 8
IND2. El Ejército 1 2 3 8
IND3 . Los Trib unales de Justicia 1 2 3 8
IND4. Los maestros de las escuelas 1 2 3 8
ACR1. Ahora le voy a leer tres frases. Por favor dígame cuál de las tres describe mejor su opinión:
NS/NR
[8]
1.- La forma en que nuestra sociedad está organizada debe ser completa y radicalmente
cambiada por medios rev olucionarios … …… …… …… …… …… …… …… …… [1]
2.- Nuestra sociedad debe ser gradualmente mejorada o perfeccionada por reformas [2]
3.- Nuestra sociedad debe ser valientemente defendida de los movimientos revolucionarios [3]
Respuesta
GI1. Recu erda cómo se llama el Presidente de los Estados U nidos
GI2. Recuerda cómo se llama el jefe de gobierno de Rusia
GI3. Recuerda cómo se llama el Presidente de Argentina
GI4. Recuerda cuántos diputados hay en el Congreso
GI5. Recuerda cómo se llama el diputado uninominal de este distrito electoral
KK1. Alguna gente dice que a los funcionarios públicos les importa mucho lo que piensan las personas como
Ud. Está Ud. de acuerdo o en desacuerdo con esa opinión?
De acuerdo [1] En desacuerdo [2] NS/NR
[8]
URG 21B7 . ¿Ud. pie nsa que vale la pe na vota r o que n o vale la p ena, por que al fina l de cuent as siempre es lo
mismo?
Si vale la pena [1] No vale la pena [2] NS/NR
[8]
KK5 . Algunos d icen que es p eligroso llega r a un arreglo con los ad versarios p olíticos, mientra s otros dice n que esto
es bueno . ¿Qué pie nsa Ud.?
Peligroso [1] Bueno [2] NS/NR
[8]
KK6 . Algunos dicen que es más impo rtante vivir en u na sociedad ordenada que tener mu cha libertad. En su
opinión, ¿Qué es más importante, el orden o la libertad?
Orden [1] libertad [2] NS/NR
[8]
DM1 . ¿Considera Ud . que en Bolivia hay discriminac ión contra las mujeres?

247
Si [1] No [2] => pase a DM3 NS/NR
[8]
DM 2. Si hay discriminación => Considera que la discriminació n contra las mu jeres es muy gra ve, grave, ma s o
menos grave o no muy grave?
Muy grave [1] Grave [2] Mas o menos grave [3] No muy grave [4] NS/NR
[8] NDR [9]
DM3. ¿Tienen las mujeres igualdad de oportunidades para conseguir empleo?
Si tienen [1] No tienen [2] NS/NR
[8]
DM 4. Según su ex periencia el prob lema más com ún de las mujer es en el trabajo e s… (lea las opc iones, an ote
una sola respuesta ,)
No les dan empleo si dicen que están embarazadas [1]Las enamoran los jefes (patrones) o compañeros [2]
Es mal vista por pedir permiso para atender a sus hijos [3] Les pagan menos que a los hombres [4]
Les cuesta mucho ascender a un mejor puesto [5] No tiene ningún problema [6] NS/NR
[8]
CHAUV1. En su opinión puede un ciudadano ser considerado un buen Boliviano si critica a su gobierno en un
periodo de c risis?
Si [1] No [2] NS/NR
[8]
CHA UV5. Si el pre sidente de otro p aís insulta públicame nte al nuestro, de beríamos tom ar medidas ra dicales o
agresivas para acallarlo, si o no?
Si [1] No [2] NS/NR
[8]
¿Estaría U d. de acuerdo o en desacue rdo con las sigu ientes afirmacion es?
Acuerdo Desacuerdo NS
NR
RWA1. Un grupo que tolera bastantes diferencias de opinión entre sus
propios miembros no puede durar mucho tiempo.
1 2 8
RWA2. En este mundo complicado, la única gente en la que podemos
confiar son nu estros gobern antes.
1 2 8
RWA3. Mis propios puntos de vista son generalmente tan válidos como
aquellos de nu estros gobern antes nacion ales.
1 2 8
RWA4. Los jóvenes de ahora deben ser controlados en lo que dicen
hasta que tengan la edad necesaria para saber lo que hablan.
1 2 8
RWA5. Es importante que un padre establezca su autoridad en la casa,
incluso si ello significa pegar a los niños de vez en cuando.
1 2 8
RWA6. La mejor manera que una organización crezca es si los
dirigentes escuch an los puntos d e vista de sus miemb ros.
1 2 8
RWA7. La gente debería tener la oportunidad de escuchar todas las
posiciones en un debate, incluso si alguna gente expresa punto s de vista
radicales.
1 2 8
RW A8. Lo s profeso res en nu estras escu elas debe rían enfa tizar la
disciplina p rimero, inc luso si ello sign ifica dedic ar meno s tiempo a la
enseñanza de las matemáticas o la historia.
1 2 8
RWA9. Los estudiantes universitarios deberían tener el derecho de
protestar y manifestarse, incluso si ello significa bloquear el tráfico y
1 2 8
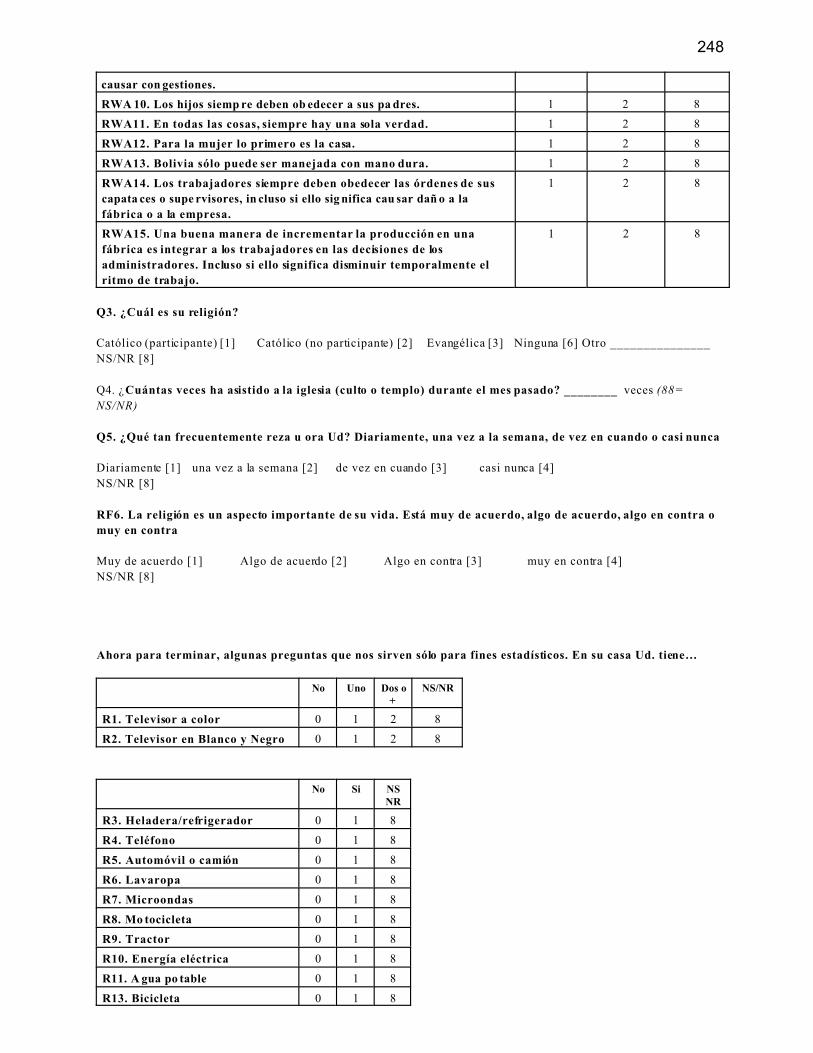
248
causar con gestiones.
RWA 10. Los hijos siemp re deben ob edecer a sus pa dres. 1 2 8
RWA11. En todas las cosas, siempre hay una sola verdad. 1 2 8
RWA12. Para la mujer lo primero es la casa. 1 2 8
RWA13. Bolivia sólo puede ser manejada con mano dura. 1 2 8
RWA14. Los trabajadores siempre deben obedecer las órdenes de sus
capata ces o supe rvisores, in cluso si ello sig nifica cau sar dañ o a la
fábrica o a la empresa.
1 2 8
RWA15. Una buena manera de incrementar la producción en una
fábrica es integrar a los trabajadores en las decisiones de los
administradores. Incluso si ello significa disminuir temporalmente el
ritmo de trabajo.
1 2 8
Q3. ¿Cuál es su religión?
Católico (participante) [1] Católico (no participante) [2] Evangélica [3] Ninguna [6] Otro _______________
NS/NR [8]
Q4. ¿Cuántas veces ha asistido a la iglesia (culto o templo) durante el mes pasado? ________ veces (88=
NS/NR)
Q5. ¿Qué tan frecuentemente reza u ora Ud? Diariamente, una vez a la semana, de vez en cuando o casi nunca
Diariamente [1] una vez a la semana [2] de vez en cuando [3] casi nunca [4]
NS/NR [8]
RF6. La religión es un aspecto importante de su vida. Está muy de acuerdo, algo de acuerdo, algo en contra o
muy en contra
Muy de acuerdo [1] Algo de acuerdo [2] Algo en contra [3] muy en contra [4]
NS/NR [8]
Ahora para terminar, algunas preguntas que nos sirven sólo para fines estadísticos. En su casa Ud. tiene…
No Uno Dos o+
NS/NR
R1. Televisor a color 0 1 2 8
R2. Televisor en Blanco y Negro 0 1 2 8
No Si NSNR
R3. Heladera/refrigerador 0 1 8
R4. Teléfono 0 1 8
R5. Automóvil o camión 0 1 8
R6. Lavaropa 0 1 8
R7. Microondas 0 1 8
R8. Mo tocicleta 0 1 8
R9. Tractor 0 1 8
R10. Energía eléctrica 0 1 8
R11. A gua po table 0 1 8
R13. Bicicleta 0 1 8

249
R14. Alcantarillado 0 1 8
R12. Anote si es posible, sin preguntar. Piso de la habitación
Tierra [1] Madera [2] Cemento, ladrillo, terrazo, baldosa [4] cerámica o mosaico [5] no se pudo ver
[90]
OCUP1. ¿En qué trabaja Ud. (Sondee para poder codificar entre las categorías abajo mencionadas. Si es
desocu pado (a ) anote su o cupac ión usua l)
1.- Auto Empleados 2- Empleados de Tiempo
Completo:
3.- Trabajadores de
tiempo parcial o s in
remuneración
Propietarios o socios de negocioso empresas grandes o medianas
1 Directivos superiores deempresas o negocios
6 Amas de Casa 12
Propietarios o socios de negocioso empresas chicas
2 Directivos intermedios deempresas o negocios
7 Estudiantes 13
Agricultores dueños o inquilinosde su tierra
3 Personal o empleados de Planta 8 Jubilados y Rentistas 14
ganaderos dueños de su ganado 4 Obreros 9 Trabajadores ocasionales 15
profesionales independientes 5 Campesinos empleados enfaenas agrícolas
10
Comerciantes y artesanosempleados
11
OCU P2. Sólo para agricultores dueños de tierra o inquilinos => Cuántas hec táreas de tierra es dueñ o o se
alquila? _______.___ (Use dec imales si es n ecesario).
DESOC1. Para todos => ¿Ha estado desocupado durante el último año?
Si [1] No [2] => Pase a ED Estudiante, Ama de casa,
Jubilado [9]
DESO C2. Si respond e Si =>¿Por c uántas sem anas duran te el último año n o ha tenido trab ajo? ____ __ sema nas
NDR [9]
ED. Cuál fue el último año de enseñanza que Ud. aprobó (encierre en un círculo el ultimo año que aprobó el
entrevistado(a))
- Ninguna : 0
- Básico: 1 - 2 - 3 - 4 - 5
- Intermedio: 6 - 7 - 8
- Medio: 9 - 10 - 11 y 12
- Técnica o Universidad : 13 - 14 - 15 - 16 - 17 - 18
Q2. Cuál es su edad en años cumplidos? _______ años
Q10. En c uál de los siguientes ran gos (muestre la tarjeta de in gresos) ubicaría el INGRESO TOTAL MENSUAL
de todas las perso nas de su hog ar?
Nada [0] Menos de 250 Bs. [1] De 251 a 500 Bs. [2] De 501 a 1000 Bs. [3] De 1001
a 2000 Bs. [4]
De 2001 a 5000 Bs. [5] De 5000 a 10.000 Bs. [6] De 10.001 a 20.000 Bs. [7] más de 20.001 [8]
NS/NR [88]
Q11. Cuá l es su estado civil (No lea la s alternativas)
Soltero [1] Casado [2] Unión libre, concubinato [3] Divorciado [4] Separado [5] Viudo [6]
NS/NR [8]
Q12. Cuá ntos hijos tiene Ud. __ __ hijos No tiene hijos [0]
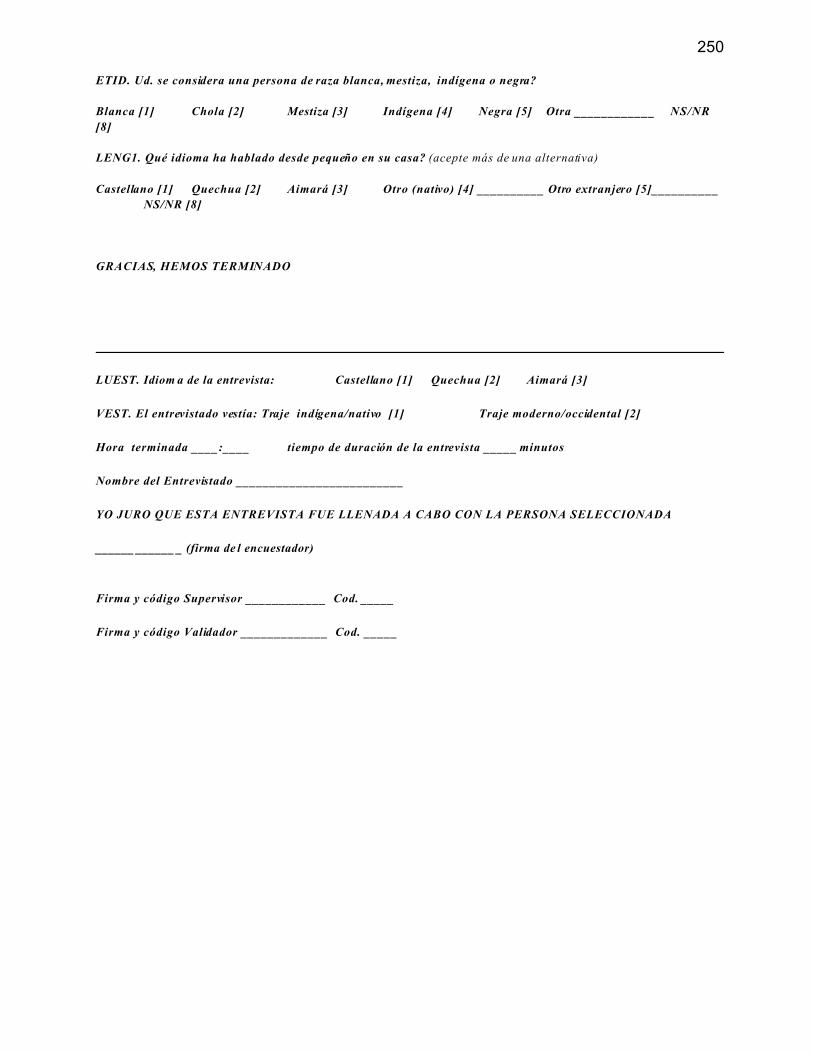
250
ETID. Ud. se considera una persona de raza blanca, mestiza, indígena o negra?
Blanca [1] Chola [2] Mestiza [3] Indígena [4] Negra [5] Otra ____________ NS/NR
[8]
LENG1. Qué idioma ha hablado desde pequeño en su casa? (acepte más de una alternativa)
Castellano [1] Quechua [2] Aimará [3] Otro (nativo) [4] __________ Otro extranjero [5]__________
NS/NR [8]
GRACIAS, HEMOS TERMINADO
LUEST. Idiom a de la entrevista: Castellano [1] Quechua [2] Aimará [3]
VEST. El entrevistado vestía: Traje indígena/nativo [1] Traje moderno/occidental [2]
Hora terminada ____:____ tiempo de duración de la entrevista _____ minutos
Nombre del Entrevistado _________________________
YO JURO QUE ESTA ENTREVISTA FUE LLENADA A CABO CON LA PERSONA SELECCIONADA
______ ______ _ (firma de l encuestador)
Firma y código Supervisor ____________ Cod. _____
Firma y código Validador _____________ Cod. _____

251
TARJET A # 1
Izquierda 1 2 3 4 5 6 7 8 9 10 Derecha
TARJETA # 27 Mucho
6
5
4
3
2
Nada 1

252
TARJETA # 3
10 Aprueba
9
8
7
6
5
4
3
2Desaprueba
1
TABLA DE INGRESOS50. Nada 51. Menos de 250 Bs. 52. De 251 a 500 Bs. 53. De 501 a 1000 Bs.54. De 1001 a 2000 Bs.55. De 2001 a 5000 Bs.56. De 5000 a 10.000 Bs.57. De 10.001 a 20.000 Bs.58. más de 20.001