the polish community in metro chicago - october 2004
TRANSCRIPT
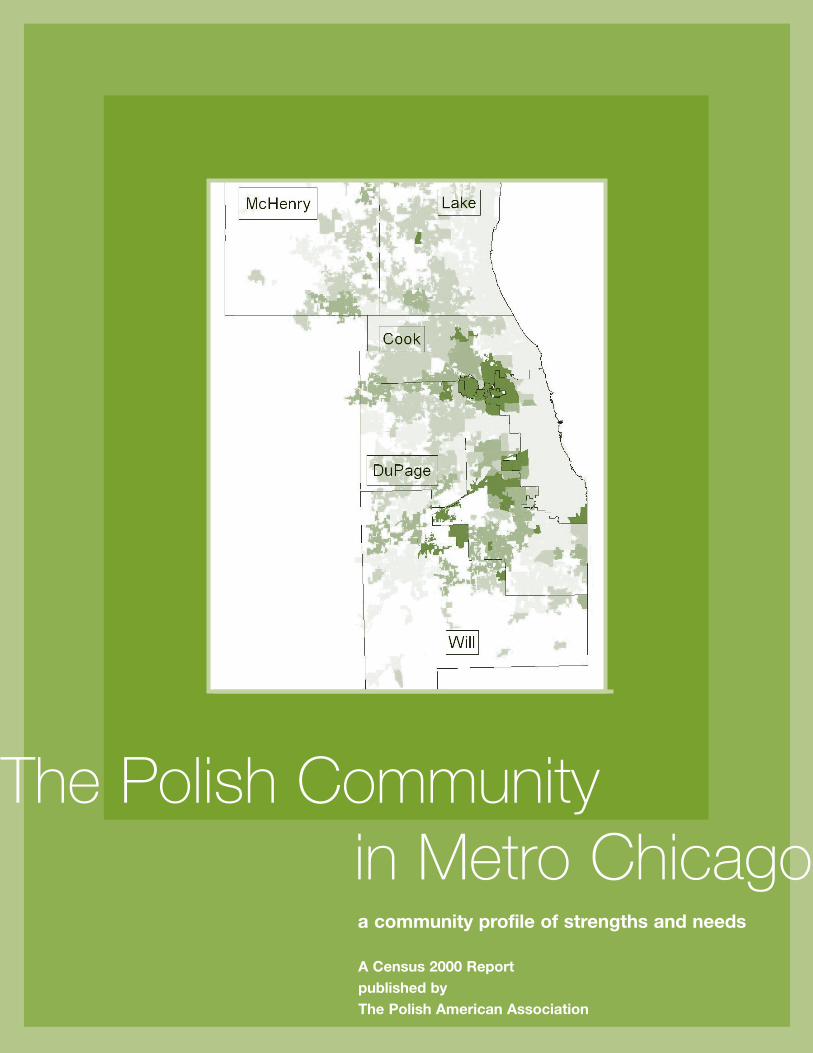
The Polish Community in Metro Chicago
A Census 2000 Report published by The Polish American Association
a community profile of strengths and needs
The Polish Community in Metro Chicago: a community profile of strengths and needs
A Census 2000 Report
Published by The Polish American Association
June 2004
This study was made possible by funds fromthe Illinois Department of Human Services.
This report was written by Rob Paral, who is Principal of Rob Paral and Associates anda Research Fellow with the AmericanImmigration Law Foundation.
Michael Norkewicz completed the dataprocessing of census information for this report.
Karen Popowski, Executive Director of thePolish American Association, prepared initialanalysis, charts and overview of the data.

Contents Summary 1
Polish Americans in Illinois 2
Where Do Polish Americans Live? 4
Low-Income Polish Americans 7
Immigrants 8
Needs of Polish Immigrants 12
Learning to Speak English 12
Becoming a U.S. Citizen 12
Social and Economic Status
of Polish Immigrants 13
Polish Elderly 16
Conclusion 17
Appendix 18
Statistical Snapshot of the Polish Community 18
Polish Population in
Illinois Congressional Districts 19
Polish Population in
Illinois State Senatorial Districts 20
Polish Population in
Illinois Legislative Districts 21
Maps
Polish Ancestry in Metro Chicago 5
Immigrants from Poland 10
1
T his report describes the Polish American populationof metropolitan Chicago using Census 2000 data
in terms of the size and key characteristics of thecommunity. The findings of this report include:
The Polish American Population
� In the year 2000 there were 933,000 persons of Polishancestry in the state of Illinois. Some 65 percent of allPoles live in the suburbs of Chicago, 23 percent live inChicago, and 12 percent live downstate.
� Overall, Polish Americans born in the U.S. haverelatively high levels of homeownership, education, and income. However, about 62,000 Polish Americansin the metro Chicago area are below 150 percent of thepoverty line. This is the equivalent of only $22,890 inannual income for a family of three.
Polish Immigrants
� Polish immigrants have been present in Chicago for well over a century. There were 25,726 Polishimmigrants in the metro area in 1890, and by 1920 the population reached 151,260.
� There are 139,000 Polish immigrants in the Chicagoarea, a level approaching the historical high of 165,000reached in 1930.
� Nearly one third or 29.9 percent of all Polishimmigrants in the United States live in the Chicagoarea.
� The Polish immigrant population in the city ofChicago, at nearly 70,000 persons, is the largest in the United States.
� Currently about 40 percent of all Polish immigrantsare U.S. citizens. This citizenship rate grows steadilythe longer that immigrants live here. Nearly 90 percentof metro Chicago Polish immigrants who have lived inthe U.S. since 1965 are citizens
Polish Elderly
� There are more than 106,000 elderly persons in thePolish community, with about one-third of them livingin the suburbs and two-thirds in Chicago. Some 83.8percent are native born.
� Some 15 percent of Polish elderly have incomesbelow 150 percent of the poverty level. For an elderlyperson living alone, this translates into $13,500 ofincome per year.
Summary
2
F ew groups embody the spirit and history of Chicagolike Polish Americans. Chicago’s Polish Americans
represent the great waves of immigration that havecome to America. The jobs that Polish Americanworkers have often held—such as employment infactories and small businesses—are highly representativeof Chicago. The Polish communities in “bungalow belt”neighborhoods often form the archetypal Chicagostreet. In the years following World War II, PolishAmericans made up a large part of the countless familiesmoving into Chicago’s suburbs especially southwestsuburbs such as Oak Lawn and Hickory Hills, westernsuburbs like Berwyn and Lyons and northwesternsuburbs like Norridge and Schiller Park.
Many Chicagoans today see new Polish immigrantsstriving to give their children a better life and can’t helpbut be reminded of their own parents and grandparents,regardless of their ancestry. Polish immigrants have keptalive traditions such as observing traditional Polishholidays, keeping various traditional customs at Easterand Christmas and devotion to their church.
Polish persons in the Chicago area have been residinghere for more than 100 years. Polish AmericanChicagoans helped build numerous neighborhoods inthe city and surrounding suburbs. Today’s Polishpopulation is found both in Chicago neighborhoods andin suburbs throughout the metropolitan region, insuburban Cook County and in the collar counties.
Polish immigrants are one of the few immigrant groupswho participated in large numbers in both the 1870-1920 and post-1965 waves of immigration. The arrivalof new immigrants has brought vitality and economicdevelopment to both city and suburban neighborhoods,and Polish immigrant workers play an important role inthe regional economy. The hard work and sacrifice ofimmigrants makes it possible for their children to gainan American education and further contribute to ournation.
In the year 2000 there were 933,000 persons of Polishancestry in the state of Illinois, constituting the secondlargest Polish population in the United States.1 Inpercentage terms, Illinois is the fourth most Polish statein the U.S., with some 7.0 percent of all Illinoisresidents reporting Polish ancestry.2 In metropolitanChicago, Polish Americans represent 9.0 percent ofChicago-areas residents, or almost one in ten persons.
The Chicago area has a large Polish Americanpopulation of 821,000 persons. These include bothrecent immigrants and persons whose grandparents orgreat-parents emigrated from Poland to Chicago.
Census data from the first half of the 1990s tell us thesize of the Polish “foreign stock,” i.e., persons whoeither were born in Poland or who had at least oneparent born in Poland. These are first- and second-generation Polish Americans.
In 1930 there were close to half a million or 471,000Polish foreign stock persons in Illinois. The statewidenumber of Polish foreign born declined during themiddle of the twentieth century as immigration fellsteadily, following severe immigration restrictionsinstituted in the 1920s. By 1970 the number of Polishforeign stock fell to 299,000. In Chicago, the foreignstock population similarly declined during the 1930-1970 period.
The foreign stock population does not include third-and fourth-generation Polish Americans, and thus itexcludes many Polish Americans. In 1980, however, theCensus Bureau began to enumerate persons reportingPolish ancestry. This included persons with a Polishancestor regardless of when that ancestor came to theU.S. By this measurement, the Polish ancestrypopulation in Illinois peaked at 963,000 persons in1990, a number that fell somewhat to 933,000 PolishAmericans living in Illinois in the year 2000. InChicago, the Polish foreign stock population peaked in1980, at 301,000, rather than in 1990 as for the state.
Polish Americans in Illinois
1 The largest Polish American population is in New York State. 2 Other major centers include nearby Michigan, which is 7.9 percent Polish, Wisconsin, at 7.7 percent Polish, and Connecticut, 7.1 percent.

3
This reflects the shift of Polish population fromChicago to other parts of the state in the last fewdecades.
The foreign stock and ancestry data show a shift overthe 1930-2000 period from Chicago as the center ofPolish population to a majority of Polish Americans inIllinois living outside the city. In the 1930-1950 period,more than 80 percent of Polish foreign stock individualsresided in Chicago, but by 1970 the Chicago portionhad fallen to 64 percent. By 2000, Polish ancestry datashows that only about a quarter of persons of Polishancestry reside in Chicago.
The Polish Population: An Historical View
Foreign Stock
Illinois Chicago
1930 470,832 401,316
1940 422,500 359,984
1950 384,361 315,504
1960 358,916 258,657
1970 299,316 191,955
Polish Ancestry
Illinois Chicago
1980 892,009 301,551
1990 962,827 261,899
2000 932,996 210,421

4
T oday the majority of Poles in Illinois reside in thesuburban portion of metro Chicago, where 65
percent of all Poles or 610,127 persons live. Nearly onequarter live in Chicago, home to 210,421 persons ofPolish ancestry. Slightly more than one of ten or 12percent of Illinois Poles live in the downstate area.
In counties of the metro Chicago area, Poles are mostnumerous in Cook County where 530,645 reside.DuPage County has a Polish population of 110,425persons, followed by Will County (61,235), LakeCounty (57,249), McHenry (32,974) and Kane (28,020).Persons of Polish ancestry form the highest percentageof the population in McHenry County, which is 12.7percent Polish. Poles are more than 12 percent of thepopulation in DuPage and Will Counties.
The Polish population fell slightly in Illinois over the1990s, by 3.1 percent, with declines of 19.7 percent inChicago and 8.0 percent in suburban Cook County. Atthe same time, the number of Polish Americans grew ineach of the collar counties of metro Chicago, by 55.0percent in Will County, for example, and by 46.4percent in McHenry County.
One hundred years ago the center of the Polishcommunity in Chicago was near the intersection ofMilwaukee, Ashland, and North Avenues on the city’sNorthwest Side. The Polish community on the city’snorth side moved in a northwest direction. Today thereremains a hub of new immigrants still located alongMilwaukee Avenue in an area bounded by Milwaukee,Central Park and Belmont. This neighborhood isknown in the community as “Jackowo” and is centeredaround St. Hyacinth church. A flourishing area of Polishsettlement and commerce is found further west, aroundBelmont and Central Avenues. The largest Polishcommunity area in Chicago is in Portage Park on thecity’s northwest side, bounded roughly by Lawrence andBelmont Avenues on the north and south, and CiceroAvenue and Nagle on the east and west. Some 20,854persons of Polish origin live in Portage Park.Immediately to the west of that area is the Dunningneighborhood, home to 15,216 Polish Americans. ThePolish American Association has its main office andLearning Center located in the heart of Portage Park.
The south side of Chicago has been home to manyPoles for much of Chicago’s history. Polish immigrantsat the beginning of the Twentieth Century could befound in the Lower West Side (Pilsen) area, and belowthe south branch of the Chicago River in communityareas near the Union StockYards such as Bridgeport,McKinly Park, and Back of the Yards (New City). Todaya substantial Polish community resides along ArcherAvenue on the city’s southwest side in the GarfieldRidge area, home to 12,578 Polish persons. GarfieldRidge is located north of 59th Street and west of Cicero Avenue. A satellite office of the Polish American Association is located in Garfield Ridge on Archer Avenue.
In the suburbs, the largest Polish populations are inNaperville (13,936 persons) Schaumburg (11,109) andArlington Heights (11,001). Substantial Polishpopulations are also found in suburbs in north CookCounty such as Park Ridge, Palatine and Niles, and insouthwestern Cook including Tinley Park, Orland Park,Burbank and Lemont.
Where Do Polish Americans Live?
Polish Americans in Metro Chicago
1990 2000 # Change % Change
Illinois 962,827 932,996 -29,831 -3.1%
Metro Chicago 853,742 820,548 -33,194 -3.9%
Cook County 610,027 530,645 -79,382 -13.0%
Chicago 261,899 210,421 -51,478 -19.7%
Cook (suburban) 348,128 320,224 -27,904 -8.0%
DuPage 105,565 110,425 4,860 4.6%
Kane 21,552 28,020 6,468 30.0%
Lake 54,580 57,249 2,669 4.9%
McHenry 22,519 32,974 10,455 46.4%
Will 39,499 61,235 21,736 55.0%
Distribution of Polish Americans in Illinois, 2000
12% Downstate112,448 23% in Chicago
210,421
65% in Suburbs 6 County area610,127
5
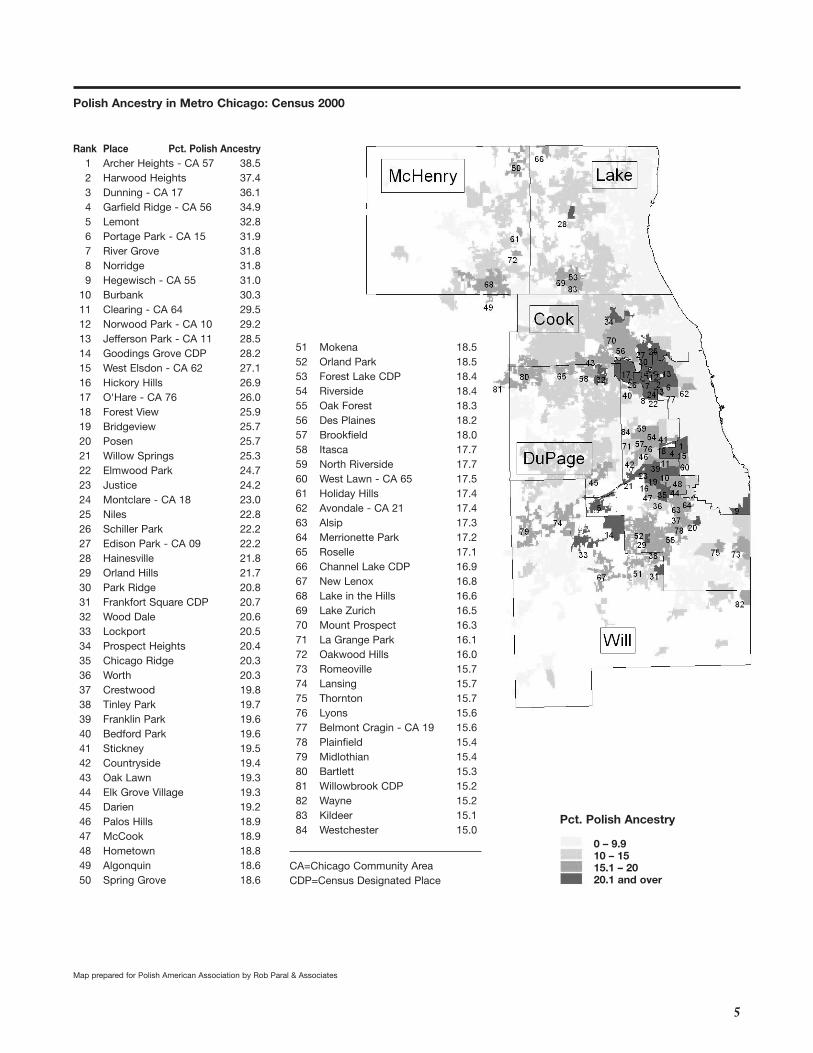
Polish Ancestry in Metro Chicago: Census 2000
Rank Place Pct. Polish Ancestry1 Archer Heights - CA 57 38.52 Harwood Heights 37.43 Dunning - CA 17 36.14 Garfield Ridge - CA 56 34.95 Lemont 32.86 Portage Park - CA 15 31.97 River Grove 31.88 Norridge 31.89 Hegewisch - CA 55 31.0
10 Burbank 30.311 Clearing - CA 64 29.512 Norwood Park - CA 10 29.213 Jefferson Park - CA 11 28.514 Goodings Grove CDP 28.215 West Elsdon - CA 62 27.116 Hickory Hills 26.917 O'Hare - CA 76 26.018 Forest View 25.919 Bridgeview 25.720 Posen 25.721 Willow Springs 25.322 Elmwood Park 24.723 Justice 24.224 Montclare - CA 18 23.025 Niles 22.826 Schiller Park 22.227 Edison Park - CA 09 22.228 Hainesville 21.829 Orland Hills 21.730 Park Ridge 20.831 Frankfort Square CDP 20.732 Wood Dale 20.633 Lockport 20.534 Prospect Heights 20.435 Chicago Ridge 20.336 Worth 20.337 Crestwood 19.838 Tinley Park 19.739 Franklin Park 19.640 Bedford Park 19.641 Stickney 19.542 Countryside 19.443 Oak Lawn 19.344 Elk Grove Village 19.345 Darien 19.246 Palos Hills 18.947 McCook 18.948 Hometown 18.849 Algonquin 18.650 Spring Grove 18.6
51 Mokena 18.552 Orland Park 18.553 Forest Lake CDP 18.454 Riverside 18.455 Oak Forest 18.356 Des Plaines 18.257 Brookfield 18.058 Itasca 17.759 North Riverside 17.760 West Lawn - CA 65 17.561 Holiday Hills 17.462 Avondale - CA 21 17.463 Alsip 17.364 Merrionette Park 17.265 Roselle 17.166 Channel Lake CDP 16.967 New Lenox 16.868 Lake in the Hills 16.669 Lake Zurich 16.570 Mount Prospect 16.371 La Grange Park 16.172 Oakwood Hills 16.073 Romeoville 15.774 Lansing 15.775 Thornton 15.776 Lyons 15.677 Belmont Cragin - CA 19 15.678 Plainfield 15.479 Midlothian 15.480 Bartlett 15.381 Willowbrook CDP 15.282 Wayne 15.283 Kildeer 15.184 Westchester 15.0
CA=Chicago Community AreaCDP=Census Designated Place
Map prepared for Polish American Association by Rob Paral & Associates
Pct. Polish Ancestry
0 – 9.910 – 1515.1 – 2020.1 and over

6
Top Fifty Places and Chicago Community Areas for Polish Ancestry Persons: Census 2000
Chicago city 210,421Portage Park - CA 15 20,854Dunning - CA 17 15,216Naperville city 13,936Garfield Ridge - CA 56 12,578Belmont Cragin - CA 19 12,219Schaumburg village 11,109Arlington Heights village 11,001Norwood Park - CA 10 11,000Des Plaines city 10,703Oak Lawn village 10,667Tinley Park village 9,540Orland Park village 9,430Mount Prospect village 9,216Burbank city 8,427West Town - CA 24 8,326Joliet city 8,153Park Ridge city 7,855Palatine village 7,846Avondale - CA 21 7,500Lake View - CA 06 7,438Jefferson Park - CA 11 7,372Downers Grove village 7,247Niles village 6,880Elk Grove Village village 6,725Hoffman Estates village 6,721Aurora city 6,644Clearing - CA 64 6,585Berwyn city 6,480Irving Park - CA 16 6,392Elmwood Park village 6,270Elgin city 5,910Elmhurst city 5,677Bartlett village 5,619Bolingbrook village 5,515Lincoln Park - CA 07 5,432Buffalo Grove village 5,428Streamwood village 5,371Oak Forest city 5,116West Lawn - CA 65 5,102Carol Stream village 5,034Calumet City city 4,964Logan Square - CA 22 4,917Archer Heights - CA 57 4,867Goodings Grove CDP 4,825Near North Side - CA 08 4,752Norridge village 4,673Addison village 4,645Wheaton city 4,622Lombard village 4,591
CA=Chicago Community AreaCDP=Census Designated Place
In many ways the Polish community is an Americansuccess story. Polish Americans born in the U.S. havehigh rates of homeownership, levels of income thatclosely match those of the general White population,and high levels of education. More than 88 percent ofnative-born Polish persons in the Chicago area havecompleted a high school education compared to about80 percent of persons who have no Polish ancestry.About 32 percent of native-born Poles have completedcollege, compared to about 30 percent of the non-Polishpopulation. The median income of native-born PolishAmericans is $57,600 compared to $50,800 for othergroups. The rate of homeownership among native-bornPoles, at 79.3 percent, is higher than for the remainderof the population, 64.6 percent.
The success of many Polish Americans is due to manyfactors. Some Polish Americans are descendants ofimmigrants who came to the Chicago area in the 1880sor earlier. These persons have lived in the Chicagoregion for well over 100 years and have been able toparticipate in the substantial economic growth that tookplace over the last century. Other Polish Americans arerecent immigrants who have come to the U.S. to secureeconomic and political freedoms unavailable to them intheir country of birth. As with previous arrivals, modernPolish immigrants are often highly motivated to succeedin a land that offers so many opportunities. Regardlessof where Polish Americans were born, however, or whatgeneration they are a part of, the community as a wholeis marked by adherence to American values of hardwork, beliefs in education and saving for the future, and religious faith.
7
T he fact that U.S.-born Polish Americans, many of whom are third, fourth and even fifth generation
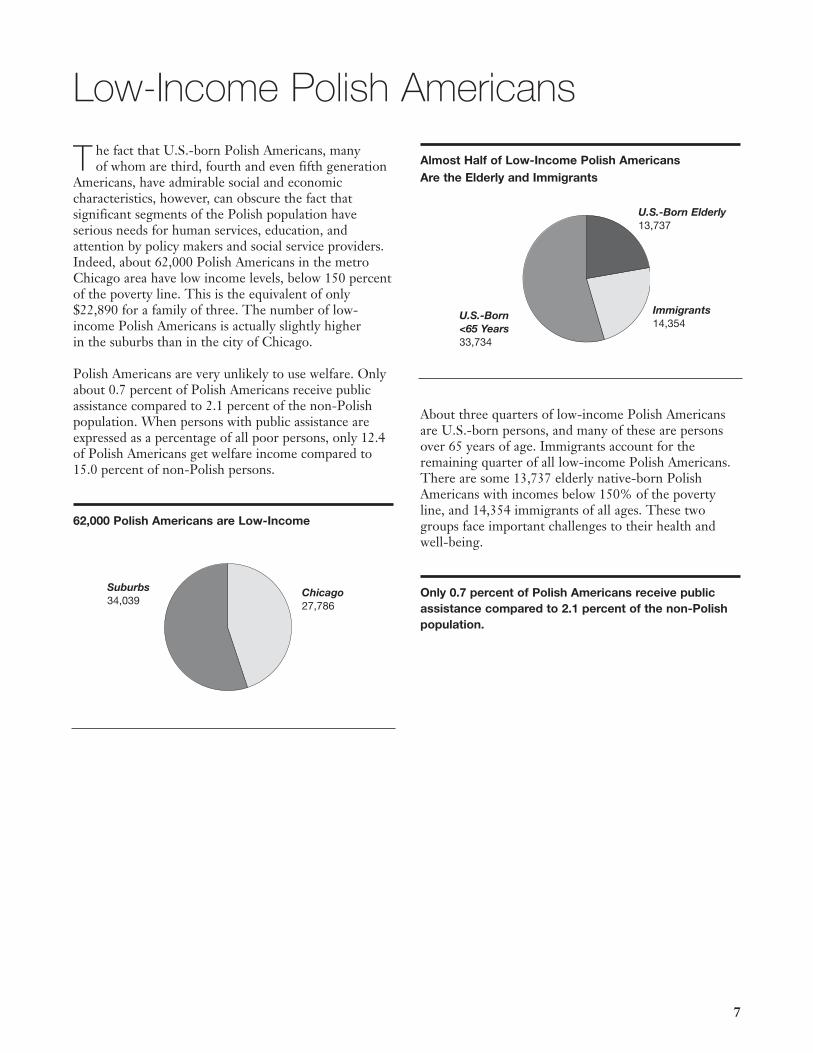
Americans, have admirable social and economiccharacteristics, however, can obscure the fact thatsignificant segments of the Polish population haveserious needs for human services, education, andattention by policy makers and social service providers.Indeed, about 62,000 Polish Americans in the metroChicago area have low income levels, below 150 percentof the poverty line. This is the equivalent of only$22,890 for a family of three. The number of low-income Polish Americans is actually slightly higher in the suburbs than in the city of Chicago.
Polish Americans are very unlikely to use welfare. Onlyabout 0.7 percent of Polish Americans receive publicassistance compared to 2.1 percent of the non-Polishpopulation. When persons with public assistance areexpressed as a percentage of all poor persons, only 12.4of Polish Americans get welfare income compared to15.0 percent of non-Polish persons.
About three quarters of low-income Polish Americansare U.S.-born persons, and many of these are personsover 65 years of age. Immigrants account for theremaining quarter of all low-income Polish Americans.There are some 13,737 elderly native-born PolishAmericans with incomes below 150% of the povertyline, and 14,354 immigrants of all ages. These twogroups face important challenges to their health andwell-being.
Low-Income Polish Americans
Only 0.7 percent of Polish Americans receive public assistance compared to 2.1 percent of the non-Polishpopulation.
62,000 Polish Americans are Low-Income
Chicago27,786
Suburbs34,039
Almost Half of Low-Income Polish AmericansAre the Elderly and Immigrants
U.S.-Born Elderly13,737
U.S.-Born <65 Years33,734
Immigrants14,354

8
I mmigration from Poland to Chicago is more than acentury old. There were 25,726 Polish immigrants
living in metro Chicago already in 1890, and by 1920the Polish immigrant population reached 151,260. Thedecades prior to the 1920s were a period of relativelyopen immigration to the United States, and theycoincided with pressures for Poles to emigrate. Theselatter pressures included decreasing amounts of landsavailable for tillage, economic dislocation such as thedecline of cottage industries during industrialization,fewer opportunities for rural dwellers, and militaryconscription. In Europe, American steamship companiesactively promoted emigration to America, promisingland and economic opportunity and political freedom,while the United States economy was producingnumerous jobs during much of the era.
Federal legislation passed in 1921 and 1924 put an endto the era of almost unlimited European immigration to America, as quotas were imposed on Europeanimmigrants that severely restricted all immigration butespecially immigration from eastern and southernEurope. Thus Polish immigration to Chicago and theUnited States diminished sharply after 1930, reaching a sixty-year low in 1980.
In 1965 the United States ended its system of national-origin quotas and instituted a new immigration systembased on the principle of family reunification, with
higher quotas available for individual nations. Thiscoincided with political and economic upheaval inPoland that spurred many Poles to move to the U.S.and Chicago. During the years in which Poland was aSocialist state, many Poles left their nation becomingrefugees or seeking political asylum in the U.S. Otherswere able to avail themselves of family-based visas.
Beginning in 1990, the U.S. Congress initiated aprogram of “diversity visas.” These were visas set asidefor countries that were deemed to be at a disadvantageunder the family reunification system, which favoredgroups with relatively larger numbers of immigrantsalready in the U.S. The Polish community was amongthe primary beneficiaries of this diversity visa program,in part due to organizing efforts by groups including thePolish American Association, who assisted Polishimmigrants in the U.S. in filing applications for lovedones back in Poland.
As a result of Polish immigrants getting diversity visas,the early 1990s was a period when persons from Polandwere the number one legal immigrant group arriving inIllinois. This contributed to a Polish foreign-bornpopulation of nearly 139,000 persons in the Chicagoarea in 2000, a level that is not far from the historicalhigh of 165,000 reached in 1930.
As a result of the large scale, recent immigration, mostPolish immigrants in metro Chicago are recent arrivals,having come to the U.S. in the last ten years. Of theapproximately 139,000 Polish immigrants in the region,about 68,000 came to the U.S. after 1990.
Immigrants
Polish Immigrants in Metro Chicago: 1890-2000
1890 1900 1920 1930 1940 1950 1970 1980 1990 2000
●
●
●●
●
●
● ●●
●
25,726
62,971
164,725
131,971
105,656
69,42662,434
78,802
137,670
151,260
Nearly one third of Polish immigrants in the U.S. live in the Chicago area.

9
Metropolitan Chicago ranks second only to metro NewYork City in the number of Polish immigrants. Amongcities, however, Chicago’s Polish immigrant population,at nearly 70,000 is the largest in the United States.Nearly one third or 29.9 percent of all Polishimmigrants in the United States live in the Chicagoarea. About one in six Polish Americans in the metroarea is an immigrant, but the percentage is much higherin Chicago, where nearly a third of Polish Americansare foreign born.
The Polish immigrants in the Chicago area haveresidential patterns that in many ways parallel those ofthe U.S.-born Polish ancestry population. That is, largecommunities are found on the northwest and southwestsides of Chicago, and in suburban communities thatborder those parts of Chicago. Polish immigrants,however, are much more likely than most otherimmigrant groups to live in Chicago. In the 1990s about75 percent of new Polish immigrants to metro Chicagomoved to the city of Chicago, compared to, for example,only 25 percent of immigrants from India.
About 12,894 Polish immigrants live in Portage Parkand 8,387 are in Dunning. Important Polish immigrantpopulations may be found in the suburbs of Burbankwith 2,904 Polish immigrants in 2000 and ElmwoodPark with 2,747. Some 2,634 Polish immigrants live inDes Plaines.
Top Fifty Places and Chicago Community Areasfor Polish Foreign Born Persons, 2000
Chicago city 69,501Portage Park - CA 15 12,894Dunning - CA 17 8,387Belmont Cragin - CA 19 7,878Avondale - CA 21 4,740Garfield Ridge - CA 56 4,329Jefferson Park - CA 11 3,106Burbank city 2,904West Town - CA 24 2,852Elmwood Park village 2,747Archer Heights - CA 57 2,707Norwood Park - CA 10 2,669Des Plaines city 2,634Niles village 2,239Irving Park - CA 16 2,115Norridge village 1,986West Elsdon - CA 62 1,978Mount Prospect village 1,956O'Hare - CA 76 1,850Montclare - CA 18 1,786River Grove village 1,655West Lawn - CA 65 1,624Harwood Heights village 1,549Clearing - CA 64 1,514Franklin Park village 1,444Park Ridge city 1,408Schiller Park village 1,390Arlington Heights village 1,375Prospect Heights city 1,362Oak Lawn village 1,300Schaumburg village 1,261Addison village 1,171Justice village 1,168Logan Square - CA 22 1,120Palatine village 1,058Bridgeview village 918Glenview village 841Wood Dale city 822Streamwood village 810Berwyn city 795Skokie village 794Wheeling village 792Hoffman Estates village 781Brighton Park - CA 58 684Elk Grove Village village 664Hickory Hills city 659Morton Grove village 653Hanover Park village 624Palos Hills city 572Hermosa - CA 20 564
CA=Chicago Community Area
About 75 percent of new Polish immigrants to metroChicago moved to the city of Chicago.
Polish Immigrants by Period of Arrival in Metro Chicago
36,90133,791
67,878
1990-20001980-1989Pre-1980

10
Immigrants from Poland: Census 2000
1 Portage Park - CA 15 12,894 2 Dunning - CA 17 8,387 3 Belmont Cragin - CA 19 7,878 4 Avondale - CA 21 4,740 5 Garfield Ridge - CA 56 4,329 6 Jefferson Park - CA 11 3,106 7 Burbank 2,904 8 West Town - CA 24 2,852 9 Elmwood Park 2,747
10 Archer Heights - CA 57 2,707 11 Norwood Park - CA 10 2,669 12 Des Plaines 2,634 13 Niles 2,239 14 Irving Park - CA 16 2,115 15 Norridge 1,986 16 West Elsdon - CA 62 1,978 17 Mount Prospect 1,956 18 O'Hare - CA 76 1,850 19 Montclare - CA 18 1,786 20 River Grove 1,655 21 West Lawn - CA 65 1,624 22 Harwood Heights 1,549 23 Clearing - CA 64 1,514 24 Franklin Park 1,444 25 Park Ridge 1,408 26 Schiller Park 1,390 27 Arlington Heights 1,375 28 Prospect Heights 1,362 29 Oak Lawn 1,300 30 Schaumburg 1,261 31 Addison 1,171 32 Justice 1,168 33 Logan Square - CA 22 1,120 34 Palatine 1,058 35 Bridgeview 918 36 Glenview 841 37 Wood Dale 822 38 Streamwood 810 39 Berwyn 795 40 Skokie 794 41 Wheeling 792 42 Hoffman Estates 781 43 Brighton Park - CA 58 684 44 Elk Grove Village 664 45 Hickory Hills 659 46 Morton Grove 653 47 Hanover Park 624 48 Palos Hills 572 49 Hermosa - CA 20 564 50 Lemont 554 51 Edgewater - CA 77 551 52 Albany Park - CA 14 514 53 West Ridge - CA 02 506 54 Bartlett 502
CA=Chicago Community Area
Number of Polish Immigrants
0 – 199200 – 500501 – 1500Over 1500
Map prepared for Polish American Association by Rob Paral & Associates

11
Polish Speakers Compared to City Populations: Census 2000
Change in Polish Immigrant Population: 1990–2000
65,479
64,808
67,518
68,586
70,074
74,239
76,031
81,860
85,616
86,309
87,901
94,487
106,221
111,454
112,936
128,358
142,990
150,115
156,383
181,677
Palatine
Bloomington
Champaign
Schaumburg
Suburban Cook Polish speakers
Evanston
Arlington Heights
Decatur
Cicero
Chicago Polish speakers
Waukegan
Elgin
Joliet
Springfield
Peoria
Naperville
Aurora
Rockford
Cook County Polish speakers
Metro area Polish speakers
Metropolitan Chicago has a population ofapproximately 182,000 persons who speak Polish
at home. This number exceeds the 139,000Polish immigrants because many U.S.-born
children have Polish immigrant parents whomaintain their native language at home. To
place the size of the Polish-speakingpopulation in perspective, the 182,000
Polish speakers in metro Chicago are apopulation larger than Rockford, the
second-largest city in Illinois, andlarger than other Illinois cities
and towns includingAurora, Naperville or
Peoria.
2000 1990 Change Pct change
Metro Chicago 138,570 83,130 55,440 66.7%Chicago 69,501 52,669 16,832 32.0%Suburban 69,069 30,461 38,608 126.7%
Portage Park - CA 15 12,894 6,262 6,632 105.9%Dunning - CA 17 8,387 2,412 5,975 247.7%Garfield Ridge - CA 56 4,329 1,692 2,637 155.9%Elmwood Park 2,747 452 2,295 507.7%Burbank 2,904 708 2,196 310.2%Des Plaines 2,634 767 1,867 243.4%Jefferson Park - CA 11 3,106 1,473 1,633 110.9%O'Hare - CA 76 1,850 478 1,372 287.0%River Grove 1,655 345 1,310 379.7%Norridge 1,986 709 1,277 180.1%Mount Prospect 1,956 685 1,271 185.5%Franklin Park 1,444 317 1,127 355.5%Prospect Heights 1,362 240 1,122 467.5%Montclare - CA 18 1,786 672 1,114 165.8%Clearing - CA 64 1,514 428 1,086 253.7%Schiller Park 1,390 341 1,049 307.6%Justice 1,168 144 1,024 711.1%Harwood Heights 1,549 567 982 173.2%Niles 2,239 1,272 967 76.0%
Archer Heights - CA 57 2,707 1,809 898 49.6%Schaumburg 1,261 411 850 206.8%Palatine 1,058 210 848 403.8%West Lawn - CA 65 1,624 786 838 106.6%Addison 1,171 445 726 163.1%Oak Lawn 1,300 595 705 118.5%Arlington Heights 1,375 711 664 93.4%Glenview 841 197 644 326.9%Bridgeview 918 280 638 227.9%Park Ridge 1,408 797 611 76.7%Wood Dale 822 264 558 211.4%Elk Grove Village 664 112 552 492.9%Streamwood 810 270 540 200.0%Hickory Hills 659 146 513 351.4%Cicero 319 870 (551) -63.3%Gage Park - CA 63 215 863 (648) -75.1%West Ridge - CA 02 506 1,188 (682) -57.4%Logan Square - CA 22 1,120 2,052 (932) -45.4%Brighton Park - CA 58 684 2,323 (1,639) -70.6%Avondale - CA 21 4,740 7,022 (2,282) -32.5%
CA=Chicago Community Area
2000 1990 Change Pct change
12
Learning to Speak English
L earning to speak English well is one of the mostimportant accomplishments for Polish immigrants.
English fluency opens doors at the workplace, allowingjob seekers to earn higher incomes and more effectivelyemploy their talents, and English ability permitsimmigrants to participate civically and socially byutilizing the English-language news and entertainmentmedia. Persons who do not speak English face restrictedopportunities at work and in their neighborhood.
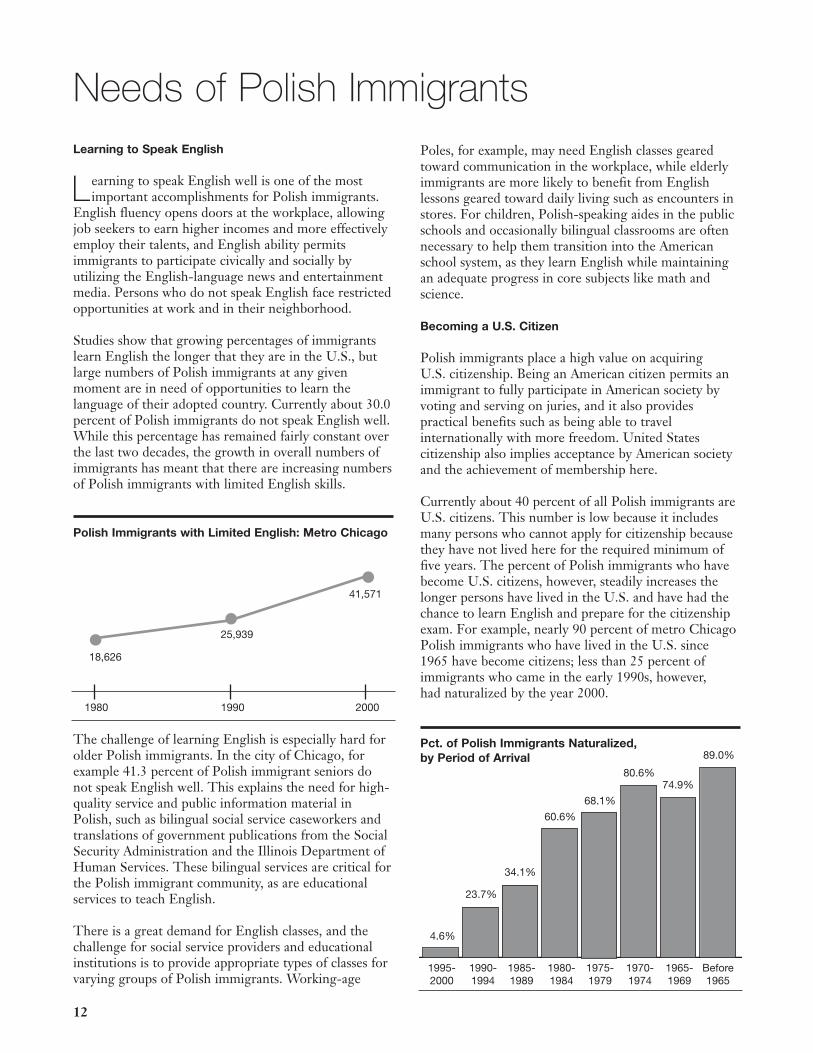
Studies show that growing percentages of immigrantslearn English the longer that they are in the U.S., butlarge numbers of Polish immigrants at any givenmoment are in need of opportunities to learn thelanguage of their adopted country. Currently about 30.0percent of Polish immigrants do not speak English well.While this percentage has remained fairly constant overthe last two decades, the growth in overall numbers ofimmigrants has meant that there are increasing numbersof Polish immigrants with limited English skills.
The challenge of learning English is especially hard forolder Polish immigrants. In the city of Chicago, forexample 41.3 percent of Polish immigrant seniors donot speak English well. This explains the need for high-quality service and public information material inPolish, such as bilingual social service caseworkers andtranslations of government publications from the SocialSecurity Administration and the Illinois Department ofHuman Services. These bilingual services are critical forthe Polish immigrant community, as are educationalservices to teach English.
There is a great demand for English classes, and thechallenge for social service providers and educationalinstitutions is to provide appropriate types of classes forvarying groups of Polish immigrants. Working-age
Poles, for example, may need English classes gearedtoward communication in the workplace, while elderlyimmigrants are more likely to benefit from Englishlessons geared toward daily living such as encounters instores. For children, Polish-speaking aides in the publicschools and occasionally bilingual classrooms are oftennecessary to help them transition into the Americanschool system, as they learn English while maintainingan adequate progress in core subjects like math andscience.
Becoming a U.S. Citizen
Polish immigrants place a high value on acquiring U.S. citizenship. Being an American citizen permits animmigrant to fully participate in American society byvoting and serving on juries, and it also providespractical benefits such as being able to travelinternationally with more freedom. United Statescitizenship also implies acceptance by American societyand the achievement of membership here.
Currently about 40 percent of all Polish immigrants areU.S. citizens. This number is low because it includesmany persons who cannot apply for citizenship becausethey have not lived here for the required minimum offive years. The percent of Polish immigrants who havebecome U.S. citizens, however, steadily increases thelonger persons have lived in the U.S. and have had thechance to learn English and prepare for the citizenshipexam. For example, nearly 90 percent of metro ChicagoPolish immigrants who have lived in the U.S. since 1965 have become citizens; less than 25 percent ofimmigrants who came in the early 1990s, however, had naturalized by the year 2000.
Needs of Polish Immigrants
Polish Immigrants with Limited English: Metro Chicago
●
●
●
18,626
1980 1990 2000
25,939
41,571
Pct. of Polish Immigrants Naturalized, by Period of Arrival
1995-2000
4.6%
23.7%
34.1%
60.6%
68.1%
80.6%74.9%
89.0%
1990-1994
1985-1989
1980-1984
1975-1979
1970-1974
1965-1969
Before1965

13
The process of acquiring U.S. citizenship canunfortunately be challenging and time consuming forimmigrants as well as costly. Naturalization applicantsmust take a test with the U.S. Department of HomelandSecurity to demonstrate that they understand key areasof U.S. history and civics. Their application forms mustbe carefully prepared because erroneous information onthe citizenship form can have serious consequences. Thecitizenship process can be lengthy due to processingbacklogs at the Department of Homeland Security.
To get through the citizenship process, Polishimmigrants typically take many hours of classes inEnglish, and U.S. history and civics. The PolishAmerican Association provides these classes, as well asqualified immigration counselors who help immigrantswith eligibility information and with filling out theirnaturalization application.
Social and Economic Status of Polish Immigrants
Polish immigrants are neither the wealthiest nor poorestof the immigrant groups in metropolitan Chicago.Indeed, they tend to rank in the middle of the largeimmigrant groups in their social and economic status.To situate Polish immigrants in the context of theforeign-born community in metro Chicago, it is helpfulto compare them to two other large groups, Mexicansand Indians. Mexicans (with 574,000 immigrants in theChicago area), Poles (139,000) and Indians (79,000) arethe three largest groups in the region, and together theycomprise 56 percent of all immigrants.
In terms of high school education, the metropolitanaverage for immigrants having a diploma is 62 percent.Mexican immigrants are situated at one extreme, with34 percent of them having graduated from high school.At the other extreme, 88 percent of Indian immigrantshave a high school education, a rate that is higher thanthat of the native born. In comparison, Polishimmigrants are relatively in the middle of these twogroups, with 69 percent having a high school education.A similar pattern is seen in the case of college education.Some 16 percent of Polish immigrants have graduatedfrom college compared to 3 percent of Mexicanimmigrants and 66 percent of Indian immigrants.
Education and Income of Major Immigrant Groupsin Metro Chicago: Census 2000
MedianPct. With Pct. With Household
HS Degree BA Degree Income
Native Born 80% 30% $50,800
All Immigrants 62% 25% $46,000
Mexicans 34% 3% $42,000
Poles 69% 16% $44,000
Indians 88% 66% $65,000
These disparities in educational level reflect thediversity of modern immigration, in which differentimmigrant groups come from countries with widelyvarying levels of social and economic development. The disparities can also mask the needs of Polishimmigrants, who are not among the poorest immigrantsbut who nevertheless have substantial numbers ofpersons with low levels of education, given the overalllarge size of the Polish immigrant community.
In terms of their economic situation, Polish immigrantshave income levels that are below the average forimmigrants. While the median household income levelfor immigrants in the Chicago area is $46,000, the levelfor Polish immigrants is $44,000, an amount close tothat of Mexicans, and substantially lower than Indians,who have a median household income of $65,000.
Income levels reflect various factors including averagefamily size, age, and others, but insight into the modestPolish economic standing is seen in the types of jobsthey have. Almost 28 percent of Polish immigrantworkers hold jobs in an area labeled by the CensusBureau as “construction, extraction and maintenance.”Poles are particularly found in construction jobs. Thesejobs are not among the lowest paid in the region, evenwhile they pay less than management and professionaloccupations. Construction jobs typically pay higher thanthe $6 to $9 an hour wages common in the lowest levelsof occupations. Many of these relatively poorly paid jobsare found in a category referred to as “production,transportation and material moving.” Almost 43 percentof Mexican immigrants hold these jobs. If Polishimmigrants are not usually found in the least-paidpositions, few of them hold management andprofessional jobs that generally offer the highestincome. Only 15.8 percent of Polish immigrants are

14
in management and professional jobs. In contrast, 57.2 percent of immigrants from India are in theseoccupations.
Polish immigrants tend to have different social andeconomic levels depending on whether they live inChicago or its suburbs. The percentage of Polishimmigrants without a high school education, forexample, is 37.1 percent in Chicago but 23.9 percent inthe suburbs. Some 12.9 percent of foreign-born Poles inChicago have incomes below 150 percent of the povertylevel, versus 7.0 in the suburbs. Thus the social andeconomic needs of Poles are sharper in the city.
Polish Immigrants in Chicago and Suburbs
37.1%
No HS Diploma <150% of Poverty Level
Chicago
Suburbs
23.9%
13.4%
7.0%

15
1980 1990 2000
DemographicsNumber of Polish born 63,140 81,312 138,570 % of total population 0.9% 1.1% 1.7%% of total foreign born 8.5% 9.3% 9.7%
% increase in past 10 years n/a 28.8% 70.4%Number increase in past 10 years n/a 18,172 57,258
% under 18 3.3% 5.9% 8.8%Number under 18 2,084 4,797 12,194
% 18-64 years 63.3% 73.7% 78.0%Number 18-64 years 39,968 59,927 108,085 % 65 years and over 33.4% 20.4% 13.2%Number 65 and over 21,089 16,588 18,291
ResidenceChicago 43,338 52,669 69,501 Suburban 19,802 30,461 69,069
Immigration Number entered in past 10 years 14,880 35,697 67,878 Number entered in past 20 years n/a 50,577 103,575
Homeownership% homeowners 65.2% 66.1% 70.5%Number of homeowners 41,167 53,747 97,692
Education and Language Ability% speak English less than well 29.5% 31.9% 30.0%Number speak English less than well 18,626 25,939 41,571
% high school graduate or higher 37.3% 61.0% 69.3%Number high school graduate or higher 23,551 49,600 96,029
% bachelor degree or higher 7.7% 12.1% 16.0%Number bachelor degree or higher 4,862 9,839 22,171
Economic% persons with public assistance 2.8% 2.0% 0.9%Number persons with public assistance 1,768 1,626 1,247
% below poverty level 8.4% 10.9% 6.5%Number below poverty level 5,304 8,863 9,007
Source: The Metro Chicago Immigration Fact Book
Demographic, Social, Economic Characteristics of the Chicago Metropolitan Area: 1980-2000Population Group: Born in Poland
16
T he Polish American population has long roots in themetro Chicago area, and many Polish persons were
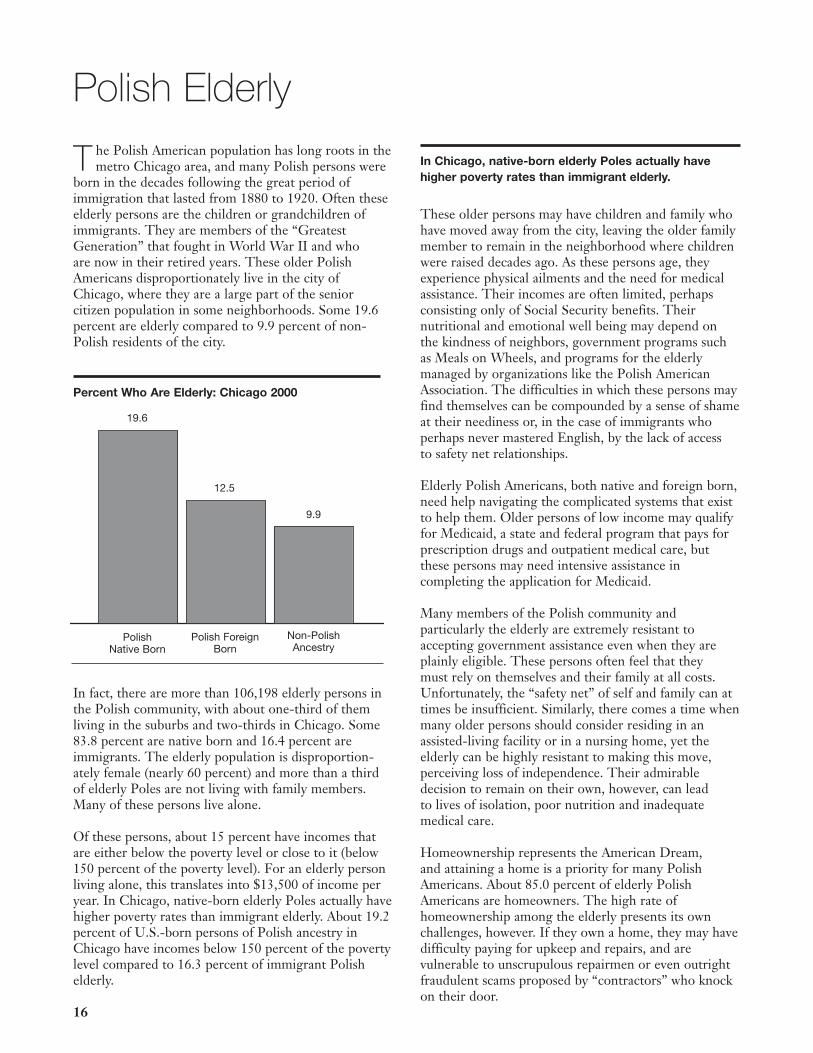
born in the decades following the great period ofimmigration that lasted from 1880 to 1920. Often theseelderly persons are the children or grandchildren ofimmigrants. They are members of the “GreatestGeneration” that fought in World War II and who are now in their retired years. These older PolishAmericans disproportionately live in the city of Chicago, where they are a large part of the seniorcitizen population in some neighborhoods. Some 19.6percent are elderly compared to 9.9 percent of non-Polish residents of the city.
In fact, there are more than 106,198 elderly persons inthe Polish community, with about one-third of themliving in the suburbs and two-thirds in Chicago. Some83.8 percent are native born and 16.4 percent areimmigrants. The elderly population is disproportion-ately female (nearly 60 percent) and more than a thirdof elderly Poles are not living with family members.Many of these persons live alone.
Of these persons, about 15 percent have incomes thatare either below the poverty level or close to it (below150 percent of the poverty level). For an elderly personliving alone, this translates into $13,500 of income peryear. In Chicago, native-born elderly Poles actually havehigher poverty rates than immigrant elderly. About 19.2percent of U.S.-born persons of Polish ancestry inChicago have incomes below 150 percent of the povertylevel compared to 16.3 percent of immigrant Polishelderly.
These older persons may have children and family whohave moved away from the city, leaving the older familymember to remain in the neighborhood where childrenwere raised decades ago. As these persons age, theyexperience physical ailments and the need for medicalassistance. Their incomes are often limited, perhapsconsisting only of Social Security benefits. Theirnutritional and emotional well being may depend on the kindness of neighbors, government programs suchas Meals on Wheels, and programs for the elderlymanaged by organizations like the Polish AmericanAssociation. The difficulties in which these persons mayfind themselves can be compounded by a sense of shameat their neediness or, in the case of immigrants whoperhaps never mastered English, by the lack of access to safety net relationships.
Elderly Polish Americans, both native and foreign born,need help navigating the complicated systems that existto help them. Older persons of low income may qualifyfor Medicaid, a state and federal program that pays forprescription drugs and outpatient medical care, butthese persons may need intensive assistance incompleting the application for Medicaid.
Many members of the Polish community andparticularly the elderly are extremely resistant toaccepting government assistance even when they areplainly eligible. These persons often feel that they must rely on themselves and their family at all costs.Unfortunately, the “safety net” of self and family can attimes be insufficient. Similarly, there comes a time whenmany older persons should consider residing in anassisted-living facility or in a nursing home, yet theelderly can be highly resistant to making this move,perceiving loss of independence. Their admirabledecision to remain on their own, however, can lead to lives of isolation, poor nutrition and inadequatemedical care.
Homeownership represents the American Dream, and attaining a home is a priority for many PolishAmericans. About 85.0 percent of elderly PolishAmericans are homeowners. The high rate ofhomeownership among the elderly presents its ownchallenges, however. If they own a home, they may havedifficulty paying for upkeep and repairs, and arevulnerable to unscrupulous repairmen or even outrightfraudulent scams proposed by “contractors” who knockon their door.
Polish Elderly
In Chicago, native-born elderly Poles actually have higher poverty rates than immigrant elderly.
Percent Who Are Elderly: Chicago 2000
19.6
12.5
9.9
Non-PolishAncestry
Polish ForeignBorn
Polish Native Born

17
T he Polish community has been a part of the fabric oflife in metropolitan Chicago for well over a century,
and today one of ten Chicagoans traces their ancestry toPoland. The fact that Polish identity is shared by somany Chicagoans along with the substantial overalleconomic and social integration of Polish Americans canobscure the fact that there is substantial need for socialand human services within key sectors of the Polishpopulation such as immigrants and the elderly. Achallenge for the general public, Polish Americans,policymakers and others is to not lose sight of the largenumbers of Polish Americans who require services inthe areas such as adult education, citizenshippreparation and entitlement benefits as well as Polishlanguage information and services. This challenge ismade more difficult by the increasing dispersion of
Polish Americans away from traditional populationcenters in the city, where Poles were once concentrated,into suburban areas throughout the region. Thisdiffusion of Polish Americans leads to diminishedopportunities to elect members of the community topublic office, and thus there are fewer Polish electedofficials today than there were a few years ago. Thismeans that advocates for the Polish population mustwork in collaboration with other ethnic groups to secure attention to the community’s needs. Thisincludes reaching out to leaders in a variety of settingsand geographies and educating them about the Polishpopulation. The continued immigration of persons from Poland and the graying of the Polish Americanpopulation will make continued advocacy on behalf of these populations a necessity.
Conclusion

18
Statistical Snapshot of the Polish Community
12,419,293 Total population in Illinois
932,996 Polish ancestry in Illinois
139,710 Polish foreign born in Illinois
7.5% Percent of Illinois population of Polish ancestry
15.0% Percent of Polish population who were born in Poland
185,749 Persons who speak Polish at home
2,917,215 Total population in Chicago
210,421 Polish ancestry in Chicago
7.2% Percent of Chicago residents of Polish ancestry
23% Percent of Chicago's white population of Polish ancestry
5,285,504 Total population in Chicago suburban area
610,127 Polish ancestry in suburbs
11.8% Percent of suburban residents of Polish ancestry
16% Percent of suburban white population of Polish ancestry
68,442 Polish foreign born living in Chicago
49% Percent of Polish foreign born who live in Chicago
10.6% Percent of all foreign born living in Chicago who are Polish
65,309 Polish foreign born living in suburbs
46.7% Percent of Polish foreign born living in suburbs
9.2% Percent of all foreign born living in suburbs who are Polish
67,878 Polish immigrants entering in past 10 years
70.4% Percent increase in past 10 years
103,575 Polish immigrants entering in past 20 years
41,571 Polish born who speak English poorly or not at all
30% Percent of Polish foreign born with limited English
83,142 Polish immigrants who are noncitizens
60% Percent of Polish immigrants who are noncitizens
49,048 Polish native born who are low income (below 150% of poverty)
12,777 Polish foreign born who are low income (below 150% poverty)
Appendix

19
Polish Population in Illinois Congressional Districts, 2000
Congressional U.S. Representative Total Polish Polish Born in Speak District population ancestry ancestry as Poland Polish
pct.of totalpopulation
1 Bobby Rush 654,203 34,020 5.2% 1,075 2,509
2 Jesse Jackson, Jr. 654,078 32,886 5.0% 1,104 3,242
3 William Lipinski 653,292 114,835 17.6% 22,931 32,054
4 Luis Gutierrez 653,654 35,891 5.5% 10,948 14,842
5 Rahm Emanuel 654,116 111,747 17.1% 47,643 55,873
6 Henry Hyde 654,549 84,601 12.9% 11,025 14,429
7 Danny Davis 653,521 20,152 3.1% 2,446 3,265
8 Philip Crane 652,805 76,919 11.8% 5,771 8,090
9 Janice Schakowsky 653,117 67,684 10.4% 18,453 22,761
10 Mark Kirk 654,062 63,292 9.7% 8,935 11,649
11 Jerry Weller 653,861 52,368 8.0% 729 1,821
12 Jerry Costello 653,456 15,720 2.4% 109 463
13 Judy Biggert 652,879 93,254 14.3% 4,833 8,407
14 Dennis Hastert 654,031 42,491 6.5% 1,126 2,081
15 Timothy Johnson 653,618 14,293 2.2% 249 490
16 Donald Manzullo 653,467 38,670 5.9% 1,836 2,765
17 Lane Evans 653,531 9,589 1.5% 110 204
18 Ray LaHood 653,426 11,731 1.8% 246 393
19 John Shimkus 653,627 12,853 2.0% 141 411
Total Illinois 12,419,293 932,996 7.5% 139,710 185,749
20
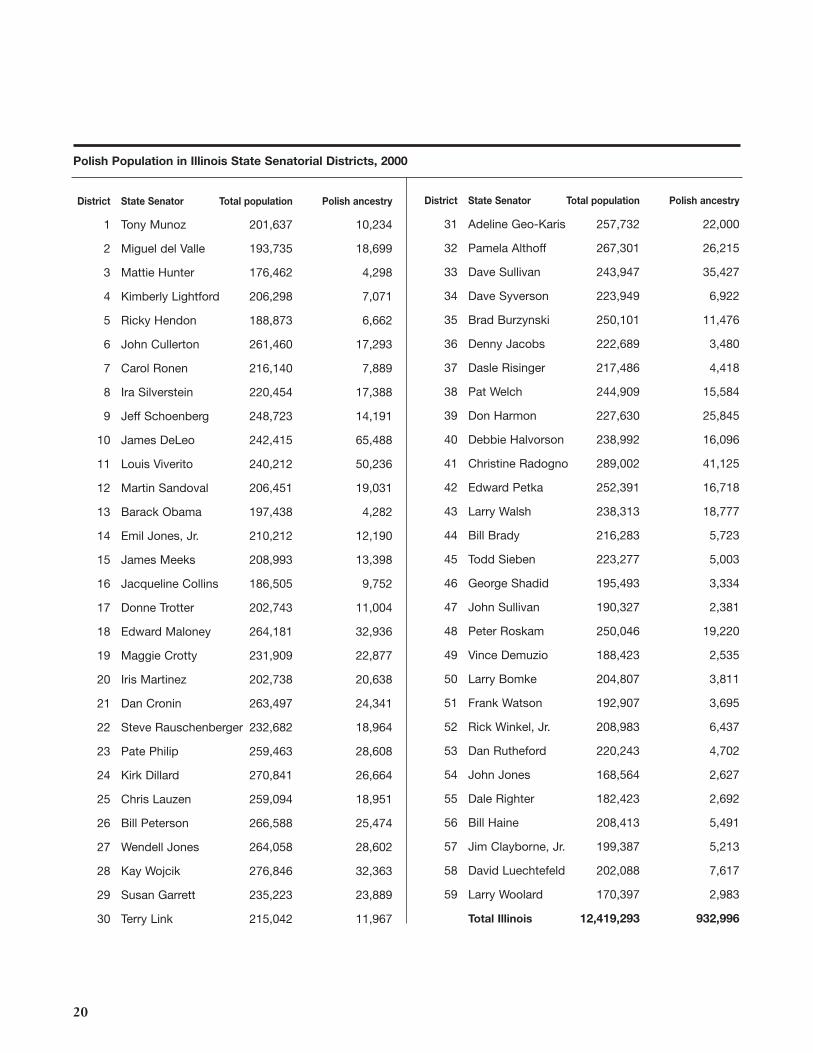
District State Senator Total population Polish ancestry
1 Tony Munoz 201,637 10,234
2 Miguel del Valle 193,735 18,699
3 Mattie Hunter 176,462 4,298
4 Kimberly Lightford 206,298 7,071
5 Ricky Hendon 188,873 6,662
6 John Cullerton 261,460 17,293
7 Carol Ronen 216,140 7,889
8 Ira Silverstein 220,454 17,388
9 Jeff Schoenberg 248,723 14,191
10 James DeLeo 242,415 65,488
11 Louis Viverito 240,212 50,236
12 Martin Sandoval 206,451 19,031
13 Barack Obama 197,438 4,282
14 Emil Jones, Jr. 210,212 12,190
15 James Meeks 208,993 13,398
16 Jacqueline Collins 186,505 9,752
17 Donne Trotter 202,743 11,004
18 Edward Maloney 264,181 32,936
19 Maggie Crotty 231,909 22,877
20 Iris Martinez 202,738 20,638
21 Dan Cronin 263,497 24,341
22 Steve Rauschenberger 232,682 18,964
23 Pate Philip 259,463 28,608
24 Kirk Dillard 270,841 26,664
25 Chris Lauzen 259,094 18,951
26 Bill Peterson 266,588 25,474
27 Wendell Jones 264,058 28,602
28 Kay Wojcik 276,846 32,363
29 Susan Garrett 235,223 23,889
30 Terry Link 215,042 11,967
Polish Population in Illinois State Senatorial Districts, 2000
31 Adeline Geo-Karis 257,732 22,000
32 Pamela Althoff 267,301 26,215
33 Dave Sullivan 243,947 35,427
34 Dave Syverson 223,949 6,922
35 Brad Burzynski 250,101 11,476
36 Denny Jacobs 222,689 3,480
37 Dasle Risinger 217,486 4,418
38 Pat Welch 244,909 15,584
39 Don Harmon 227,630 25,845
40 Debbie Halvorson 238,992 16,096
41 Christine Radogno 289,002 41,125
42 Edward Petka 252,391 16,718
43 Larry Walsh 238,313 18,777
44 Bill Brady 216,283 5,723
45 Todd Sieben 223,277 5,003
46 George Shadid 195,493 3,334
47 John Sullivan 190,327 2,381
48 Peter Roskam 250,046 19,220
49 Vince Demuzio 188,423 2,535
50 Larry Bomke 204,807 3,811
51 Frank Watson 192,907 3,695
52 Rick Winkel, Jr. 208,983 6,437
53 Dan Rutheford 220,243 4,702
54 John Jones 168,564 2,627
55 Dale Righter 182,423 2,692
56 Bill Haine 208,413 5,491
57 Jim Clayborne, Jr. 199,387 5,213
58 David Luechtefeld 202,088 7,617
59 Larry Woolard 170,397 2,983
Total Illinois 12,419,293 932,996
District State Senator Total population Polish ancestry

21
1 Susana Mendoza 99,096 4,9632 Edward J. Acevedo 102,541 5,271 3 William Delgado 98,652 12,551 4 Cynthia Soto 95,083 6,148 5 Kenneth Dunkin 87,135 2,513 6 Patricia Bailey 89,327 1,785 7 Karen A. Yarbrough 102,579 3,061 8 Calvin L. Giles 103,719 4,010 9 Arthur L. Turner 94,604 2,034
10 Annazette Collins 94,269 4,628 11 John A. Fritchey 130,239 8,598 12 Sara Feigenholtz 131,221 8,695 13 Larry McKeon 107,167 3,974 14 Harry Osterman 108,973 3,915 15 Ralph C. Capparelli 119,498 11,901 16 Lou Lang 100,956 5,487 17 Elizabeth Coulson 126,781 8,480 18 Julie Hamos 121,942 5,711 19 Joseph M. Lyons 121,326 34,063 20 Michael P. McAuliffe 121,089 31,425 21 Robert S. Molaro 119,903 24,405 22 Michael J. Madigan 120,309 25,831 23 Daniel J. Burke 103,329 13,118 24 Frank Aguilar 103,122 5,913 25 Barbara Flynn Currie 97,700 1,717 26 Lovana Jones 99,738 2,565 27 Monique D. Davis 105,031 5,727 28 Robert Rita 105,181 6,463 29 David E. Miller 103,633 7,110 30 William Davis 105,360 6,288 31 Mary E. Flowers 98,705 7,424 32 Charles G. Morrow III 87,800 2,328 33 Marlow H. Colvin 97,363 4,097 34 Constance A. Howard 105,380 6,907 35 Kevin Carey Joyce 134,369 16,535 36 James D. Brosnahan 129,812 16,401 37 Kevin A. McCarthy 122,349 17,681 38 Robin Kelly 109,560 5,196 39 Maria Antonia Berrios 100,882 11,318 40 Richard T. Bradley 101,856 9,320 41 Robert A. Biggins 135,517 13,552 42 Sandra M. Pihos 127,980 10,789 43 Ruth Munson 103,183 5,570 44 Terry R. Parke 129,499 13,394 45 Carole Pankau 129,498 12,625 46 Lee A. Daniels 129,965 15,983 47 Patricia R. Bellock 134,661 14,663 48 James H. Meyer 136,180 12,001 49 Timothy L. Schmitz 128,264 11,018 50 Patricia Reid Lindner 130,830 7,933 51 Ed Sullivan Jr. 135,442 12,741 52 Mark H. Beaubien Jr. 131,146 12,733 53 Sidney H. Mathias 130,634 15,592 54 Suzanne Bassi 133,424 13,010 55 John J. Millner 135,353 14,300 56 Paul D. Froehlich 141,493 18,063 57 Elaine Nekritz 114,218 15,861 58 Karen May 121,005 8,028 59 Kathleen A. Ryg 116,849 9,470 60 Eddie Washington 98,193 2,497
Polish Population in Illinois Legislative Districts, 2000
61 JoAnn D. Osmond 126,603 10,269 62 Robert W. Churchill 131,129 11,731 63 Jack D. Franks 124,156 10,587 64 Rosemary Kurtz 143,145 15,628 65 Rosemary Mulligan 115,575 19,431 66 Carolyn H. Krause 128,372 15,996 67 Charles E. Jefferson 106,441 2,809 68 Dave Winters 117,508 4,113 69 Ronald A. Wait 133,116 6,351 70 David A. Wirsing 116,985 5,125 71 Mike Boland 115,554 1,842 72 Joel Brunsvold 107,135 1,638 73 David R. Leitch 115,621 2,427 74 Donald L. Moffitt 101,865 1,991 75 Mary K. O'Brien 128,390 6,250 76 Frank J. Mautino 116,519 9,334 77 Angelo Saviano 120,242 21,287 78 Deborah L. Graham 107,388 4,558 79 John Philip Novak 114,365 6,418 80 George Scully Jr. 124,627 9,678 81 Renee Kosel 153,075 22,327 82 Eileen Lyons 135,927 18,798 83 Linda Chapa LaVia 105,374 2,305 84 Tom Cross 147,017 14,413 85 Brent Hassert 126,993 12,716 86 Jack McGuire 111,320 6,061 87 Bill Mitchell 109,010 1,854 88 Dan Brady 107,273 3,869 89 Jim Sacia 111,154 2,700 90 Jerry L. Mitchell 112,123 2,303 91 Michael K. Smith 93,105 1,409 92 Ricca Slone 102,388 1,925 93 Art Tenhouse 91,747 759 94 Richard P. Myers 98,580 1,622 95 Randall M. Hultgren 128,744 9,248 96 Joe Dunn 121,302 9,972 97 Jim Watson 94,974 920 98 Gary Hannig 93,449 1,615 99 Raymond Poe 105,286 1,866
100 Rich Brauer 99,521 1,945 101 Robert F. Flider 86,366 1,390 102 Ron Stephens 106,541 2,305 103 Naomi D. Jakobsson 113,267 4,334 104 William B. Black 95,716 2,103 105 Shane Cultra 108,875 2,426 106 Keith P. Sommer 111,368 2,276 107 Kurt M. Granberg 86,717 1,884 108 Charles A. Hartke 81,847 743 109 Roger L. Eddy 85,973 814 110 Chapin Rose 96,450 1,878 111 Steve Davis 99,081 1,463 112 Jay C. Hoffman 109,332 4,028 113 Thomas Holbrook 103,342 3,512 114 Wyvetter H. Younge 96,045 1,701 115 Mike Bost 99,072 4,625 116 Dan Reitz 103,016 2,992 117 Gary Forby 90,711 2,152 118 Brandon W. Phelps 79,686 831
Total Illinois 12,419,293 932,996
District State Representative Total population Polish ancestry District State Representative Total population Polish ancestry

Our Mission: The mission of the Polish American Association,a human service agency, is to serve the diverse needs of thePolish community in the Chicago metro area by providingresources for changing lives, with emphasis on assistingimmigrants.
Since 1922, the Polish American Association (PAA) has beencommitted to serving Chicagoland’s Polish community andothers in need. PAA is the nation’s only human servicesorganization providing a comprehensive range of bilingual andbicultural programs and services to the Polish community in the areas of social services, education, employment, immigrantservices, outreach and advocacy.
Contributing to the vitality of Chicago’s communities, Polish American Association is a place of help, hope andempowerment for families and individuals adjusting to a newlife in the U.S. Each month, on average, more than 3500 peoplecome to our offices seeking help from our 30 programs andservices. PAA has helped thousands in the Polish communitylearn English, find jobs and become U.S. citizens. In addition,the professional staff at PAA helps victims of domestic violenceand their families, the homeless, seniors, youth, needy families,and those wanting to free themselves of addictions.
The people and programs of the Polish American Associationserve as resources for changing lives, and together they haveopened the doors to a new life for thousands of immigrants.
Main Office Learning Center3834 N. Cicero Ave. 3815 N. Cicero AveChicago, IL 60641 Chicago, IL 60641(773) 282-8206 (773) 282-1122
Southwest Office To learn more about PAA,6276 W. Archer Ave. we invite you to visitChicago, IL 60638 www.polish.org(773)767-7773
Polish American AssociationResources for Changing Lives