the phillips machine (moniac) - university of …eprints.hud.ac.uk/26730/1/2111.pdf · the phillips...
TRANSCRIPT

The Phillips Machine (MONIAC) Ryan Phelan Email: [email protected] Abstract The Phillips Machine, or Monetary National Income Analogue Computer (MONIAC), is a hydraulic representation of cash flow within the UK economy in the early 20th century. It represents the circular flow of income (New Zealand Institute of Economic Research, 2015), shown by the economic equation Aggregate Demand = Consumer Expenditure + Investment + Government Spending + (Exports – Imports), or Y = C + I + G + (X – M), which is an important equation in determining the national output of an economy (Pettinger, 2008). Though no longer in use, of the 14 that were built, the majority were originally restricted to military and government use owing to their effectiveness in determining economic policy. This paper describes an implementation of an emulation of this machine that satisfies, or mostly satisfies, almost all of the requirements specified in the ISO/IEC 25010 software quality assurance standard and would be suitable for deployment to support A-Level Economics teaching. With further work it would also become suitable as part of a museum display of a Phillips Machine. Keywords: Phillips Machine; MONIAC; William Phillips; analogue computer; hydraulics; emulator; economics; Keynesianism; circular flow.

Introduction The problem Analogue computers are not often seen in modern times. This is because digital computers such as PCs have become more readily available and many tasks which would have previously been handled analogously are now handled digitally. Older analogue machines, while no longer widely used, can still be potentially useful. The main goal of this research was to reproduce the Phillips Machine as a piece of software with as many of the original features as possible. In addition, the software produced aims to be an effective educational tool in teaching economics. Audience and users As the software produced has an educational focus, it is aimed primarily at Economics students and teachers. In order to accommodate both parties, a number of aspects of the user interface (UI) and simulation design needed to be designed with these audiences in mind. The teaching level of this software is Economics A-Level and so the descriptions and information throughout are geared towards 16–21-year-old students. Although the software is also intended to be used by tutors, their usage will be different to that of the students, and will primarily take the form of classroom demonstrations. In addition to this audience there is the possibility of gearing a second version of the software towards museums. This is, however, beyond the scope of this paper. The aim of the research was to produce an emulator of the Phillips Machine that satisfied the following requirements.
• The simulation must be visually similar to the original machine, i.e. something must flow around a set of pipes determined by the original machine.
• The simulation must be correct, i.e. cash must flow in the right direction, cash must not flow outside of pipes and gates must correctly adjust flow. It does not have to be ‘to scale’.
• Highlighting areas of the simulation should give detailed information on what the user is observing.
• The program should give background information on the machine and how it works.
• Information within the program should be accurate, relevant and to A-Level standard.
• The simulation must be interactive, i.e. changing settings must directly influence it.
• The simulation should be set up at the time of execution and calculated at runtime (as opposed to being predetermined) to allow the user to manipulate it while it runs.
• Charts generated by the program must be accurate with respect to the current simulation.
• The program and its UI should be intuitive enough to allow a user to use the program with minimal guidance.
• The program should be considered robust and not easily broken. • The program must be tested and quality must be assured.
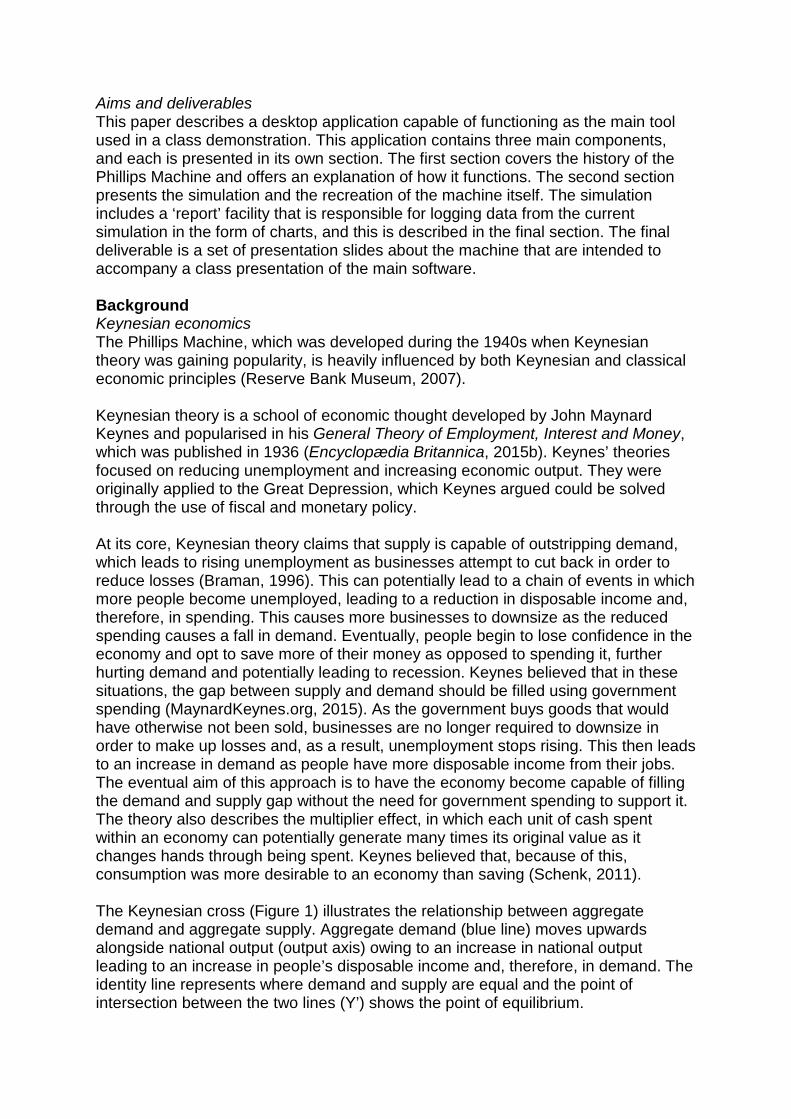
Aims and deliverables This paper describes a desktop application capable of functioning as the main tool used in a class demonstration. This application contains three main components, and each is presented in its own section. The first section covers the history of the Phillips Machine and offers an explanation of how it functions. The second section presents the simulation and the recreation of the machine itself. The simulation includes a ‘report’ facility that is responsible for logging data from the current simulation in the form of charts, and this is described in the final section. The final deliverable is a set of presentation slides about the machine that are intended to accompany a class presentation of the main software. Background Keynesian economics The Phillips Machine, which was developed during the 1940s when Keynesian theory was gaining popularity, is heavily influenced by both Keynesian and classical economic principles (Reserve Bank Museum, 2007). Keynesian theory is a school of economic thought developed by John Maynard Keynes and popularised in his General Theory of Employment, Interest and Money, which was published in 1936 (Encyclopædia Britannica, 2015b). Keynes’ theories focused on reducing unemployment and increasing economic output. They were originally applied to the Great Depression, which Keynes argued could be solved through the use of fiscal and monetary policy. At its core, Keynesian theory claims that supply is capable of outstripping demand, which leads to rising unemployment as businesses attempt to cut back in order to reduce losses (Braman, 1996). This can potentially lead to a chain of events in which more people become unemployed, leading to a reduction in disposable income and, therefore, in spending. This causes more businesses to downsize as the reduced spending causes a fall in demand. Eventually, people begin to lose confidence in the economy and opt to save more of their money as opposed to spending it, further hurting demand and potentially leading to recession. Keynes believed that in these situations, the gap between supply and demand should be filled using government spending (MaynardKeynes.org, 2015). As the government buys goods that would have otherwise not been sold, businesses are no longer required to downsize in order to make up losses and, as a result, unemployment stops rising. This then leads to an increase in demand as people have more disposable income from their jobs. The eventual aim of this approach is to have the economy become capable of filling the demand and supply gap without the need for government spending to support it. The theory also describes the multiplier effect, in which each unit of cash spent within an economy can potentially generate many times its original value as it changes hands through being spent. Keynes believed that, because of this, consumption was more desirable to an economy than saving (Schenk, 2011). The Keynesian cross (Figure 1) illustrates the relationship between aggregate demand and aggregate supply. Aggregate demand (blue line) moves upwards alongside national output (output axis) owing to an increase in national output leading to an increase in people’s disposable income and, therefore, in demand. The identity line represents where demand and supply are equal and the point of intersection between the two lines (Y’) shows the point of equilibrium.
Figure 1: The Keynesian Cross (Tatenkopf, 2009) used under a CC BY-SA 3.0 Licence Prior to Keynesian theory, classical economics worked on the assumption that supply creates its own demand, as held in Say’s Law (Library of Economics and Liberty, 2008), though whether this was actually claimed by Jean-Baptiste Say is often contested. It also claimed that the level of demand for a good was dependent on the price for that good. When demand was lower than supply, this was due to the prices of goods being too high, and by lowering them, an equilibrium could eventually be formed (Rohlf, 1998). In this way, it was also believed that unemployment could be reduced through lowering wages, which would give businesses a larger budget to hire more staff. After the theory was published in 1936, Keynesian economics became the standard for over 40 years before falling out of favour in the 1980s and 1990s (The Economist, 2013). Despite this, modernised Keynesian economics were applied during the economic crisis of the late 2000s in the form of the fiscal stimulus package used by a number of governments to combat the crisis. Analogue computers The Phillips Machine is an example of an analogue computer, which is evidenced in its alternative name, the Monetary National Income Analogue Computer (MONIAC). An analogue computer is a device that attempts to solve problems through the use of ‘continuously variable physical quantities such as electrical potential, fluid pressure, or mechanical motion’ (Encyclopædia Britannica, 2015a). Examples of milestone modern analogue computers include the Kelvin tide predictor of 1872, a computer capable of predicting harbour tide patterns for up to a year (Science Museum, 2015),

and Vannevar Bush’s differential analyser, a machine capable of solving differential equations (The-Crankshaft Publishing, 2015). Hydraulic machines such as the Phillips Machine use water as their means of computation. During the second half of the 20th century, analogue machines such as the Phillips Machine were used less as they were replaced with digital machines capable of more complicated calculations at a lower cost. Ng and Wright (2007) observed:
The field has grown markedly since the MONIAC’s time, taking advantage of enormous advances in computing power, and comparably large reductions in the price of computers. Over this period, computers made the transition from what we might call the ‘white-coated scientist/engineer’ world represented by the MONIAC – a mechanical hands-on environment in which the coat was a practical garb protecting the operator from grease and water splashes – to everyday desktop appliances present, in some form, in virtually every business and household.
Despite this, the Phillips Machine arguably fulfils a role that is still relevant today. The machine provides an easy to understand visual representation of how the different factors of an economy interact on a large scale. This is something that is important for Economics students to understand, and not something that can be easily understood through textbooks. Phillips Machine Understanding the story behind the Phillips Machine is crucial to the completion of this paper as the machine is complicated, and recreating even a subset of the features requires an intimate understanding of its inner workings. Furthermore, to capture what made the machine a success, it is important to understand what the original goals of the machine were, who it was aimed at and who built it. The Phillips Machine was created by William Phillips, an economist from New Zealand who would later be considered one of the 20th century’s most important economists. According to the Reserve Bank Museum (2007), he is most commonly credited with popularising the relationship between inflation and unemployment, shown through the Phillips Curve. The machine was unveiled for the first time in 1949 at the London School of Economics and, according to the New Zealand Institute of Economic Research (2015), the version shown had been constructed at a cost of £400, or over £12,000 today, and at least partially from salvaged materials.

Figure 2: London Science Museum (Wichary, 2006) used under a CC BY 2.0 Licence The machine makes use of a complicated piping and measurement system to accurately simulate and chart the cash flow. As can be seen in Figure 2, and simplified in Figure 3, the machine works by pumping water (cash) into a series of pipes and tanks (sectors of the economy) that flow from top to bottom (income to output), before being recycled back to the top. Along the way there are numerous paths the water can take, depending on factors such as how much water is in each tank and the condition of the gates blocking the pipes. Gates are manipulated through a complex series of strings, each set through a number of customisable

settings on the machine that represent different economic factors, such as interest and exchange rates. Each of these settings is linked to multiple gates, which means that a minor change in one of these settings affects the machine as a whole. As Swade (1995) observed,
The strength of [the] model is in the interactivity of economic factors. Rates of taxation, investment and levels of foreign trade can be altered by setting valves and sluices. More subtly, stocks (represented by the level of water in a tank) control flows elsewhere in the system by automatically altering settings of the valves.
The machine is also capable of plotting standard economic charts such as supply–demand diagrams based on the current simulation.
Figure 3: Simple machine diagram The basic flow of the Phillips Machine can be simplified as follows.
• Cash enters the economy through the income pipe and begins to flow into the economy.
• The cash is taxed depending on the rate of tax set by the government. • People may choose to save their cash in banks, again causing it to split from
the main flow. This is largely dependent on interest rates.

• Cash that is not taxed or saved is spent by the people in the form of consumption and from here:
o taxed cash re-enters the economy through government expenditure; o saved cash re-enters the economy as investment; o cash is either spent internally or on imports; therefore, cash that is not
spent on imports is domestic expenditure; o cash spend on imports may either be lost to other countries, or
reclaimed through exports to other countries; money not regained through a positive import/export balance becomes a leak, with the rest returning to the central flow.
• All of the cash remaining in the central flow is stored as the economy’s active balance, where it eventually re-enters the economy as income.
Figure 4: Bill Phillips at the LSE (The London School of Economics and Political Science, 1949) (listed with ‘no known copyright restrictions’). The design of the machine has seen a number of changes since the original that was demonstrated by Phillips to the London School of Economics (see Figure 4). While the original was mostly colourless, this was changed for future machines. In most models of the machine, to make the machine easier to understand the main path through the machine is coloured in blue, while alternative paths are coloured differently. This is usually yellow for taxes and government expenditure, orange for savings and investment, and green for imports and exports. This colouring choice can clearly be seen on Figure 5. In comparing different models, such as those in Figures 4, 5 and 6, a number of small changes can be seen. Firstly, in some models the government expenditure and investment pipes are linked before they flow back into consumption. This does not affect the model as a whole, as all of the money being taxed and invested is still worked back into the economy. This is likely to be something that was trimmed as part of the simplification process for the newer models. In addition, the machine is mirrored in some models, such as the one in Figure 5, causing the income pipe to be on the right and each of the pipes swapped. This difference is also cosmetic and does not affect the model in any way. Overall,

although there is not much difference between the later models, it can clearly be seen that the aesthetic design has changed drastically since the original shown in Figure 4.
Figure 5: MONIAC Computer (Tai, 2008) Related work A web-based version of the Phillips Machine (MONIAC, in this instance, see Figure 6) made using Flash is available through New Zealand’s Reserve Bank Museum website (Reserve Bank Museum, 2015). The design of the machine is simplified in a number of ways. Firstly, the machine is stripped down as the pulleys and strings are removed. Secondly, it represents the water through the use of animations which imply water movement, as opposed to having water flow through the machine more literally. This web-based version is aimed at people who wish to learn more about the Phillips Machine but do not necessarily have a background in economics. For this reason, it presents its information as simply as possible through tooltips that appear on highlighted parts of the machine. It could be argued that due to this simplification, the Reserve Bank Museum's implementation does not necessarily overshadow the aims of this research.

Figure 6: The MONIAC Web Application (Reserve Bank Museum, 2015) The machine produced for this paper is aimed at people who have, or who are studying to gain, a good understanding of economics. So while the simplified layout used in the Reserve Bank’s implementation was an influence, the current simulation aimed to be more sophisticated, particularly in the area of water flow. However, one way in which this research was influenced by the Reserve Bank’s implementation of the machine was through its effective use of tooltips. Each area of the diagram that is highlighted gives a relevant, to the point, and accurate explanation of what is occurring in that area, which was something deemed to be useful from an educational standpoint. The product Overview The software produced by this research is a standalone desktop application that functions as a virtual implementation of the Phillips Machine. It is programmed in C# with Windows Presentation Foundation (WPF) for graphical user interface (GUI) development and is made up of three main components, information, simulation and reporting, each split into its own separate tab. The simulation itself makes use of the SharpDX.Toolkit graphics library, which allows graphics to be hosted inside a window. This runs in the background, regardless of the tab selected, to allow a user to view up-to-date charts in the report section. For this reason, and for the sake of consistency, the side panel can be seen on all pages where the user is able to customise factors of the current simulation.

Figure 7: Phillips Machine software ‘Home’ page The home page has an article-style layout as it is informative in nature (Figure 7). The page presents a small amount of background information, in addition to some usage information for the machine, which aims to make the machine less confusing to a new user. As the software is meant to be used in a classroom setting, it is expected that the majority of information relating to the machine will be provided by the tutor, and so this page is kept simple. The simulation tab hosts the simulation and is considered to be the software’s main page. The design of the simulation attempts to emulate the look of the original machines as much as possible, while also trying to look clear and simple in order to avoid confusing the students. As such, all mechanical parts of the machine, such as strings and weights, have been removed. The main path through the machine is coloured light blue, while each of the alternative paths have their own colours, again to make it easier to understand. This design is most heavily influenced by the machine on display at the Reserve Bank in New Zealand, as shown in Figure 5. In terms of functionality, the simulation is manipulated using the sliders on the side panel. Each slider corresponds to one of the gates, which are indicated by light-blue bars in some of the pipes on the machine. Some more generalised ‘Run Settings’ are also available to help a user to achieve specifically desired behaviour. Each of the tanks and pipes has a label that can be highlighted to show a tooltip, which replaces the Monetary National Income Analogue Computer text to the left of the simulation. These tooltips give a unit figure of how much cash is in the highlighted area, in addition to a description of the pipe or tank and related economic concepts.

Figure 8: Phillips Machine software ‘Report’ page The report tab contains a chart that shows the distribution of cash in the current simulation, updated every second (Figure 8). The chart aims to reinforce learning by allowing a student to view the workings of the machine from a different and more direct angle. Users are able to interact with the simulation using the sliders as they would on the simulation page. Potential improvements Although the software satisfies the basic requirements of the research, there are a number of areas of the design that have been identified as weaknesses and that could potentially be improved. One of the key principles of this implementation is simplicity, as it is believed that a simple program will be more useful and less frustrating for students. Therefore, where possible, the software tries to create a clear UI by hiding irrelevant information without negatively impacting the software’s usefulness. This is arguably achieved on the simulation page, where the complicated Phillips Machine is represented in a comparatively straightforward way and where minimal information is shown at all times. However, this is arguably not the case on the home page, which appears overly cluttered, particularly in terms of the article design. In addition, although the side panel is important to the simulation and reporting pages, this is not the case on the home page, where it serves only to make the design convoluted. A user visiting the home page for the first time may become confused by the sliders on the side panel if they were not aware of what the machine was. Therefore, one way in which the software could be improved would be through the removal of the side panel on the home page, improving the layout to make the information more spread, and improving the aesthetic, which is important to new users. Another area in which the software could be improved is in its reporting. Currently, the only metric that is logged and updated by the simulation is the units of cash within a given area. This means that only one chart is available to the reporting section, namely the distribution of cash throughout the machine. Potential

improvements could be to include more charts, such as a demand and supply log or a comparison of the effects of a change in one of the factors against the areas of the economy. Currently, the flow through the machine is not realistic, being modelled as a number of discrete spheres (as seen in Figure 9) rather than as a true liquid with the appropriate hydrodynamic properties and behaviour. Although this does not detract from the accuracy of the simulation, it does reduce its realism. It would be an improvement to include proper hydrodynamic flow in the model. Some preliminary work has already been done on this.
Figure 9: Phillips Machine software ‘Simulation’ page Potential applications While the key application of this product is as a classroom teaching tool, it potentially has other uses within education and learning. The original Phillips Machines are exhibited in several museums around the world and they are usually accompanied by a video or diagram explaining how they work. This tool could be converted to work on a touch-based museum computer, where it could fulfil a similar role to these videos or diagrams. To do so, it would need support for multiple languages and touch controls, which would not require a substantial rewrite. Another potential application of the software could be to produce a web-based implementation which would allow it to be hosted on a webpage similar to that shown in Figure 7. This would make it significantly more accessible to students, as an installer would not be required and it would allow students using search engines to stumble upon it. Compared to adapting the software for museum use, this would require a larger rewrite because C#, WPF and SharpDX are all not compatible with web development, making the conversion a potentially difficult process.

Evaluation The product In order to determine the success of the research, it is important to consider the original requirements. Meeting these requirements could potentially be seen as a success at the most basic level, while failure to meet them would indicate problems in the way the research was managed. In evaluating these requirements, it is clear that this paper has succeeded in what it set out to achieve at the most basic level. All of the original requirements have been met and, in the case of machine interactivity and real-time calculation, the machine went a step beyond what was originally specified. Furthermore, the information provided by the emulator has been checked against the AQA exam specification and so the product can be said to be relevant to its target audience. Although the product meets these requirements, this does not necessarily guarantee that it is a high-quality piece of software. Evaluating the quality of the software can be achieved through comparing the software against the quality assurance characteristics specified by a quality assurance standard such as the ISO/IEC 25010 standard (International Organization for Standardization, 2015). Overall, the software meets or partially meets the majority of characteristics defined by the standard and, therefore, the software quality is at least partially assured. However, in failing to meet the security characteristic, which requires external verification, the software would be unlikely to meet the standard if it was formally submitted. Therefore, additional work would be needed if the software were to be submitted to a museum. Conclusion Analogue computers have largely been replaced by digital computers, as a result of the latter’s simplicity, power and efficiency. Despite this, certain machines, such as the Phillips Machine, offer a visual representation that is arguably still useful today from an educational standpoint. This does not mean that the machine is quite as useful today, however, as some concepts, such as the Keynesian economics, on which it is based, have evolved significantly since the 1950s, and the modern economy is a much more global entity than it was in the past. It would be difficult to determine what a modern-day Phillips Machine would have to look like in order to represent current factors. This paper aims to reproduce the Phillips Machine with a subset of its original features, and not as an accurate representation of the modern economy. Future research Moving forward, the research could aim to appeal more to museums, which would be achieved by improving the program security and implementing museum-specific features, such as multi-language and touch support. The home page would also need to be redesigned to make it more aesthetically pleasing to a museum audience. To improve the maintainability of the software, the deprecated SharpDX.Toolkit will need to be replaced with an alternative. Finally, the simulation could be continually tweaked to improve the quality of the simulation, as certain areas, such as the government budget, tend to fluctuate too much.

References Braman, C. (1996). The Theories of John Maynard Keynes. Retrieved from http://www.chuckbraman.com/theories-of-john-maynard-keynes.html Encyclopædia Britannica. (2015a). Analog Computer. Retrieved from http://www.britannica.com/technology/analog-computer Encyclopædia Britannica. (2015b). Keynesian economics. Retrieved from http://www.britannica.com/topic/Keynesian-economics International Organization for Standardization. (2015). ISO/IEC 25010. Retrieved from http://iso25000.com/index.php/en/iso-25000-standards/iso-25010?limit=3&limitstart=0 Library of Economics and Liberty. (2008). Jean-Baptiste Say. The Concise Encyclopedia of Economics. Retrieved from http://www.econlib.org/library/Enc/bios/Say.html London School of Economics and Political Science. (1949, August 17). Professor A. W. H. (Bill) Phillips with Phillips Machine c1958–67 [Photograph]. Retrieved from https://www.flickr.com/photos/lselibrary/3833724890/in/photostream/ MaynardKeynes.org. (2015). Keynesian Economics in a Nutshell. Retrieved from http://www.maynardkeynes.org/maynard-keynes-economics.html New Zealand Institute of Economic Research (NZIER). (2015). Moniac machine. Retrieved from http://nzier.org.nz/about/monia-machine/ Ng, T., & Wright, M. (2007, December). Introducing the MONIAC: an early and innovative economic model. Reserve Bank of New Zealand: Bulletin, 70(4). Retrieved from http://www.rbnz.govt.nz/research_and_publications/reserve_bank_bulletin/2007/2007dec70_4ngwright.pdf Pettinger, T. (2008, January 31). AD = C + I + G + X – M [Web log post]. Retrieved from http://www.economicshelp.org/blog/245/readers-questions/ad-c-i-g-x-m/ Reserve Bank Museum. (2007, September 03). A. W. H. (Bill) Phillips, MBE and The MONIAC. Retrieved from http://www.rbnz.govt.nz/research_and_publications/fact_sheets_and_guides/3121411.pdf Reserve Bank Museum. (2015). The MONIAC. Retrieved from http://www.rbnzmuseum.govt.nz/activities/moniac/introduction.aspx Rohlf, W. D. (1998). Keynes and the Classical Economists: The Early Debate on Policy Activism. In Introduction to Economic Reasoning (4th ed.). New York: Pearson Education. Retrieved from http://wps.aw.com/wps/media/objects/11/11640/rohlf_keynes_and_classical.pdf

Schenk, R. (2011). Paradox of Thrift. Retrieved from http://ingrimayne.com/econ/Keynes/Paradox.html Science Museum. (2015). Kelvin's first tide-predicting machine, 1872. Retrieved from http://www.sciencemuseum.org.uk/objects/oceanography/1876-1129.aspx Swade, D. (1995). The Phillips Economic Computer. Computer Resurrection – The Bulletin of the Computer Conservation Society, 12. Retrieved from http://www.cs.man.ac.uk/CCS/res/res12.htm#e Tai, K. (2008, April 11). MONIAC Computer [Photograph]. Retrieved from https://commons.wikimedia.org/wiki/File:MONIAC.jpg Tatenkopf. (2009, August 31). Keynesian Cross [Graph]. Retrieved from Wikimedia: https://commons.wikimedia.org/wiki/File:Keynesian-cross.svg The Economist. (2013, November 26). A Keynes for all seasons. Retrieved from http://www.economist.com/blogs/freeexchange/2013/11/economic-history-2 The-Crankshaft Publishing. (2015). Differential analyzer (Inventions). Retrieved from http://what-when-how.com/inventions/differential-analyzer-inventions/ Wichary, M. (2006, August 11). London Science Museum by Marcin Wichary [Photograph]. Retrieved https://commons.wikimedia.org/wiki/File:London_Science_Museum_by_Marcin_Wichary_-_When_money_flows_like_water,_pt._3_%282289252123%29.jpg
http://dx.doi.org/10.5920/fields.2016.2124
Article copyright: © 2016 Ryan Phelan. This work is licensed under a Creative Commons Attribution 4.0 International License