the philippine construction industry - squarespace · the philippine construction industry ... the...
TRANSCRIPT

1
The Philippine Construction Industry
I. Overview of the Macroeconomy and the Construction Industry
a. Key Macroeconomic Indicators
Figure 1: GDP year-on-year Growth Rates
Source: National Statistical Coordination Board
The global economic conditions heavily influence the performance of Philippine economy. In 2009, global economy declined by 2.2%, as a result of economic and financial crises in US and Euro countries, which was also the main culprit for low exports demand and weak consumer and business confidence. While the Philippine economy avoided a negative growth rate, it nevertheless posted a dismal GDP growth rate of 1.1% in 2009.
Global economy bounced back faster-than-expected by 5% in 2010 as the series of economic
stimulus pumped by the government around the world somehow enabled to reverse the negative growth rates in 2009. Renewed confidence among the investors and consumers also propelled the economy back to positive growth territory. As expected, the Philippine economy also accelerated faster and increased by 7.6% in 2010, the highest in post-Marcos era. Given recovery in the global economy and renewed confidence, Philippine exports and investments reversed its negative growth rates in 2009 to 21% and 31.6% respectively in 2010. In terms of production side, industry sector reestablished itself as the main growth driver by posting an 11.6% growth rate in 2010.
Of course, another factor for the very high GDP growth rate in 2010 is that the economy was
coming from a very low value in 2009 or the so-called base effect. Nevertheless, the Philippine economy showed that as long as exports & investments and industry sector (which are global economy-dependent) sustain positive growth rates, it can also continue to post a 7%-level of growth.
5.2%
6.6%
4.2%
1.1%
7.6%
4.9%
3.4%
0.0%
1.0%
2.0%
3.0%
4.0%
5.0%
6.0%
7.0%
8.0%
2006 2007 2008 2009 2010 1Q:2011 2Q:2011
GDP Growth Rate
Global Financial Crisis

2
Figure 2: Key Macroeconomic Rates
Source: Bangko Sentral ng Pilipinas
Despite a faster growth in the 2010 economy, key macroeconomic rates were kept in check. First,
inflation rate managed to increase slightly only from 3.2% in 2009 to 3.8% in 2010. Second, the short-term interest rate (as measured by 91-day Treasury bill rates) even decreased from 4.2% in 2009 to 3.5% in 2010. Finally, due to higher investments, export receipts, and remittances from Overseas Filipinos Workers (OFWs), the peso-dollar rate appreciated from P/$47.6 to P/$45.1 in 2010. This combination of key macroeconomic rates further testified to a very strong Philippine economy in 2010.
Overall, it was a very bright economy for the Philippines in 2010 as indicated by faster GDP growth
rate and stable/supportive inflation, short-term interest, and peso-dollar rates.
Indicator 1Q:2011 2011 2012
GDP growth rate 4.9% 4.7% 5.1% Note: Projections for 2011 and 2012 are averages of the projections of IMF, ADB, and World Bank
With major risks in the global economy, however, the Philippine economy may have a difficult time
sustaining its 2010 growth rate. Recently, commodity prices in the global market have been increasing due to higher demand from emerging Asian economies (e.g. China) and supply disruptions in oil producing countries and tsunami that hit Japan. The increasing global trend in commodity prices will add pressure to the domestic inflation rate to increase. If domestic prices increases higher than expected, this can slow down growth in the economy. Also, the political unrest in Middle East and North African (MENA) countries can undermine confidence among investors and consumers, which can further slow down domestic economy if they lead to lower investments.
The Philippine economy recorded a modest growth rate of 4.9% in first quarter of 2011 as domestic
consumption and investment were able to sustain its growth. The recovery in agricultural sector also contributed to a modest GDP growth rate. Coming from high election related expenditures last year, the domestic economy continued to decelerate, resulting in a 3.4% growth rate in the second quarter of 2011. The International Monetary Fund (IMF), Asian Development Bank (ADB), and World Bank (WB) projected
38.0
40.0
42.0
44.0
46.0
48.0
50.0
52.0
0.0%
1.0%
2.0%
3.0%
4.0%
5.0%
6.0%
7.0%
8.0%
9.0%
10.0%
2006 2007 2008 2009 2010 1Q:2011 2Q:2011
Peso-Dollar rate Inflation rate 91-day T-bill

3
the Philippine economy to grow on an average by 4.7% in 2011 and 5.1% in 2012. These three institutions see the Philippine economy to slow down from its 2010 growth rate given the risks previously mentioned.
The Philippine government, however, is sticking with its 7-8% GDP growth rate from 2011 to 2016.
This projection hinges on the implementation of Public-Private Partnership (PPP) Projects under the Aquino administration and other fiscal and monetary policies conducive for high-level GDP growth.
b. Construction Industry Performance
There are two ways to understand “construction” in the Philippine economy. First, as an industry, construction sector includes “activities of establishments primarily engaged in the putting up of buildings and structures and other land improvements; secondary activities such as the provision of technical/engineering services and the manufacture of construction materials undertaken by horizontally integrated construction firms; and informal construction activities like repair and maintenance and own-account construction.”
Construction as an investment or capital formation, on the other hand, is classified either as a private and public construction. In particular, “all construction owned by the government and government corporations are classified as public construction; while all other construction activities are classified as private.”
i. Share of Construction industry to the Gross Domestic Product
Figure 3: Construction Output (in million PHP) and share to total GDP
Source: National Statistical Coordination Board
From 2006 to 2010, the share of construction industry to total GDP has been steadily increasing, a
testament to the importance of this industry in sustaining growth in the domestic economy. During this
five-year period, construction contributed an average of 5.2% to GDP. If the construction industry’s
-
50,000
100,000
150,000
200,000
250,000
300,000
350,000
0.0%
1.0%
2.0%
3.0%
4.0%
5.0%
6.0%
7.0%
2006 2007 2008 2009 2010 1Q:2011 2Q:2011
Construction output Construction-to-GDP ratio

4
contribution to the GDP through job generation, higher investments, and more dollar earnings would be
counted, the percentage would have been much higher.
In the same period, the construction industry posted an average growth rate of 10.5%, outgrowing
GDP growth rate, which only averaged 4.9%. After slowing down in 2008 and 2009 (mainly because of
lackluster performance of global and domestic economies), construction industry has bounced back
remarkably in 2010 with a growth rate of 14.3%. Note that in 2010, total investments (as measured by
Gross Capital Formation or GCF) reached P1,184 billion, an increase of 32% from 2009. As more
investments entered the economy, the construction industry also increased its output.
ii. Construction Industry Contribution to Investments
Figure 4: Gross Value Added in Construction (in billion PHP)
Source: National Statistical Coordination Board
The Gross Valued Added (GVA) in Construction shows an increasing trend from 2006-2010, which
further indicates the importance construction industry plays in the economy. Private constructions account
for a greater share, mainly sourced from higher number of residential units and commercial buildings.
Public constructions, on the other hand, are primarily sourced from infrastructure projects of the
government.
0.0
10.0
20.0
30.0
40.0
50.0
60.0
70.0
80.0
90.0
0.0
20.0
40.0
60.0
80.0
100.0
120.0
140.0
160.0
2006 2007 2008 2009 2010
Public Private GVA Construction

5
iii. Contribution to Employment
Figure 5: Employment in the Construction Industry (in thousands)
Source: Bureau of Labor and Employment Statistics
Construction industry continues to provide a significant level of employment in the domestic
economy. After a lower level in 2009, construction industry employment increased by 14.0% and reached
an almost 2 million jobs in 2010, representing 5.3% of the total employment in the economy. This level has
been maintained so far during the first half of 2011. Strong demand for construction industry, which leads
to more construction activities, leads to increase in construction employment also.
Overall, while the overall output of construction industry has increased 14.3% and reached P326
billion in 2010, there was a decline in two key indicators of industry performance due to increasing cost of
materials and labor and lingering effects of bad weather conditions (e.g. strong typhoons). Both total
number of building permits approved and residential building construction started have decreased in 2010.
For some cases such as in ARMM, construction activities were lower in 2010 due to problems in peace and
order situation.
According to a report published by Bangko Sentral ng Pilipinas (BSP), total number of building
permits approved decreased by 13.8% from 122,039 in 2009 to 105,239 in 2010. The number of residential
building construction started, on the other hand, decreased by 16.7% from 95,940 in 2009 to 79,934 in
2010.
4.6%
4.7%
4.8%
4.9%
5.0%
5.1%
5.2%
5.3%
5.4%
5.5%
1,500
1,600
1,700
1,800
1,900
2,000
2006 2007 2008 2009 2010 2011
Number of employees Share to total

6
II. Updates/Issues related to the construction industry in Philippines
a. Building and Construction Material Cost Indices
Table 1: Wholesale Price Index of Construction Materials
Item 2006 2007 2008 2009 2010
All items 5.9 4.9 9.2 0.5 2.6
Carpentry Materials 2.8 0.8 7.6 3.3 0.7
Electrical Materials 11.5 8.6 9 3.2 4.3
Masonry Materials 5.1 4.7 7.1 4.2 1.5
Painting Materials and related compounds 6.9 6.2 6.1 4.1 2.1
Plumbing Materials 4.9 4.7 5.2 2 2.4
Tinsmithry Materials 1.1 -0.3 1.9 2.6 4.5
Miscellaneous Construction Materials 4.2 9.9 33.8 -24.5 2.9 Source: National Statistical Office
On the average, prices of construction materials increased by 2.6% in 2010. Significant price hikes
were recorded for Tinsmithry Materials (4.5%), Electrical Materials (4.3%), and Plumbing Materials (2.4%). Higher prices of commodities (e.g. steel and copper) in the world market were a major factor for the increase in the prices of construction materials.
During the first half of 2011, the prices of construction materials continue to show an increasing
trend; but starting last May, prices were slowing down already. The increase in the prices, however, can be attributed to strong demand for construction industry in the first half of 2011.
Table 2: Price of Construction Materials (in USD)
CONSTRUCTION MATERIALS JAN 2011
FEB 2011
MAR 2011
APR 2011
MAY 2011
JUNE 2011
JULY 2011
AUG 2011
Hollow Blocks
Width #101 mm (4") 0.23 0.23 0.23 0.23 .23 .23 .23 .23
#152 mm (6") 0.28 0.28 0.28 0.28 .28 .28 .28 .28
Common Wire Nails
50mm (2")
Hudson 1.28 1.28 1.28 1.28 1.28 1.27 1.27 1.27
Pentagon 1.26 1.26 1.26 1.26 1.26 1.25 1.25 1.25
Sterling
1.28 1.28 1.28 1.27 1.27 1.27
Steel world 1.40 1.40 1.40 1.40 1.40 1.39 1.39 1.39
100mm (4")
Hudson 1.28 1.28 1.28 1.28 1.28 1.27 1.27 1.27
Pentagon 1.26 1.26 1.26 1.26 1.26 1.25 1.25 1.25
Steelworth 1.40 1.40 1.40 1.05 1.05 1.39 1.39 1.39
Tansu 1.05 1.05 1.05 1.40 1.40 1.04 1.04 1.04

7
Steel Wire (Alambre)
Gauge 16
Cathay Pacific 1.63 1.63 1.74 1.74 1.74 1.74 1.74 1.74
Pentagon 1.35 1.40 1.51 1.40 1.40 1.39 1.39 1.39
Sterling
1.40 1.40 1.40 1.39 1.39 1.39
Gauge 18
Cathay Pacific 1.74 1.74 1.81 1.81 1.81 1.81 1.81 1.81
GI Sheet (Corrugated) per foot
0.4mm with Z125 (Gauge 26)
Apo 1.21 1.21 1.19 1.21 1.18 1.18 1.18
Steel Bars
10 mm
Cathay Pacific 3.02 3.07 2.67
3.24 3.24
Continental 2.98 3.02 3.02 3.02 3.01 3.19
Maxima
3.05 3.05
12 mm
Cathay Pacific 4.30 4.42 4.42
4.63 4.63
Maxima
4.42 4.42
Continental 4.19 4.42 4.42 4.42 4.63
ELECTRICAL SUPPLIES
Tubular Fluorescent Lamp
GE (20 watts) 1.16 1.16 1.16 1.16 1.16 1.16 1.16 1.16
Philips (20 watts) 1.51 1.40 1.51 1.40 1.40 1.39 1.39 1.39
Incandescent Lamp
GE (25 watts) 0.58 0.58 0.58 0.58 0.58 0.58 0.58 0.58
Philips (25 watts) 0.58 0.58 0.58 0.58 0.58 0.58 0.58 0.58
Starter
Eagle 0.35 0.35 0.35 0.35 0.42 0.42
Firefly 0.35 0.35 0.35 0.35 0.35 0.35 0.35 0.35
Philips
0.19 0.19 0.19 0.19 0.19 0.19
Snaptumbler Switch
Eagle 1.98 1.40 1.40 1.51 1.50 1.50 1.50
Firefly
0.81
Fuse
Eagle 0.42 0.47 0.47 0.47 0.46 0.46 0.42
Ballast
GE 3.72 3.26 3.26
3.70 3.70 3.70
Cement , 4KG Per Bag (Type 1P)
` Excel 4.77 4.77
4.51 4.51
Republic 4.77 4.53 4.77 4.77 4.28 4.28
Rizal 4.77 4.77 4.77
4.51 4.51
Source: Department of Trade and Industry
8
b. Labor / Human Resource (including Safety and Health)
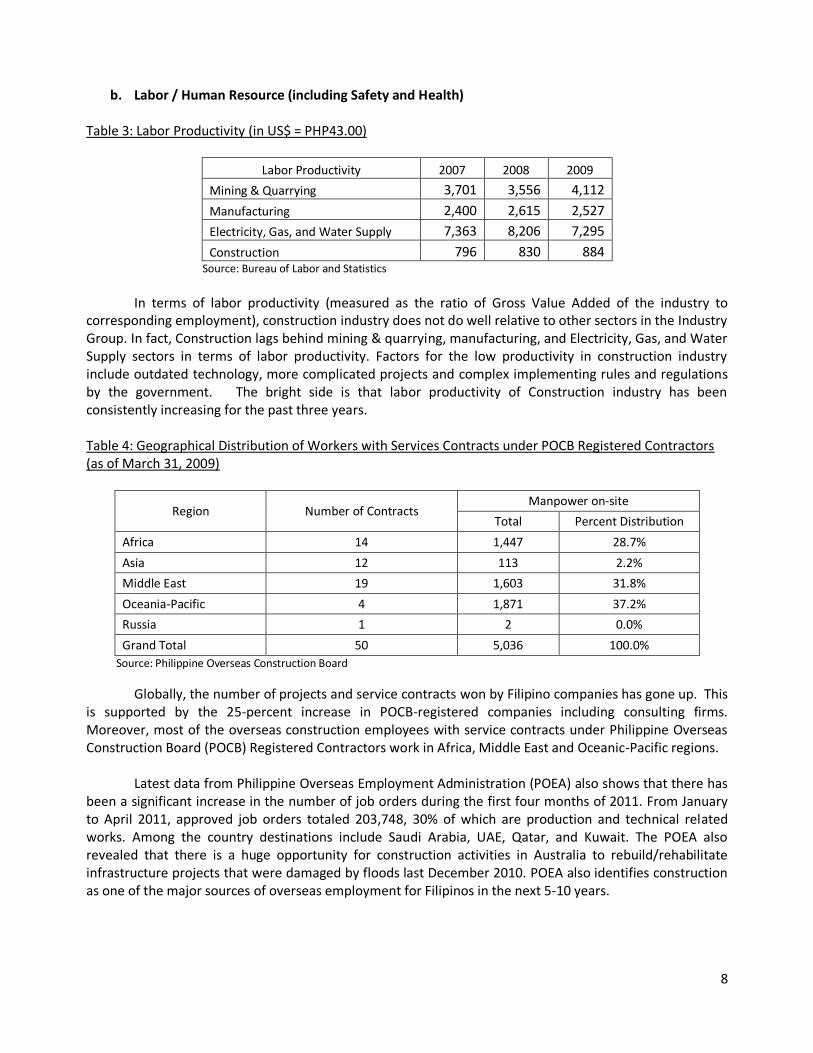
Table 3: Labor Productivity (in US$ = PHP43.00)
Labor Productivity 2007 2008 2009
Mining & Quarrying 3,701 3,556 4,112
Manufacturing 2,400 2,615 2,527
Electricity, Gas, and Water Supply 7,363 8,206 7,295
Construction 796 830 884 Source: Bureau of Labor and Statistics
In terms of labor productivity (measured as the ratio of Gross Value Added of the industry to
corresponding employment), construction industry does not do well relative to other sectors in the Industry Group. In fact, Construction lags behind mining & quarrying, manufacturing, and Electricity, Gas, and Water Supply sectors in terms of labor productivity. Factors for the low productivity in construction industry include outdated technology, more complicated projects and complex implementing rules and regulations by the government. The bright side is that labor productivity of Construction industry has been consistently increasing for the past three years.
Table 4: Geographical Distribution of Workers with Services Contracts under POCB Registered Contractors (as of March 31, 2009)
Region Number of Contracts Manpower on-site
Total Percent Distribution
Africa 14 1,447 28.7%
Asia 12 113 2.2%
Middle East 19 1,603 31.8%
Oceania-Pacific 4 1,871 37.2%
Russia 1 2 0.0%
Grand Total 50 5,036 100.0%
Source: Philippine Overseas Construction Board
Globally, the number of projects and service contracts won by Filipino companies has gone up. This is supported by the 25-percent increase in POCB-registered companies including consulting firms. Moreover, most of the overseas construction employees with service contracts under Philippine Overseas Construction Board (POCB) Registered Contractors work in Africa, Middle East and Oceanic-Pacific regions.
Latest data from Philippine Overseas Employment Administration (POEA) also shows that there has
been a significant increase in the number of job orders during the first four months of 2011. From January to April 2011, approved job orders totaled 203,748, 30% of which are production and technical related works. Among the country destinations include Saudi Arabia, UAE, Qatar, and Kuwait. The POEA also revealed that there is a huge opportunity for construction activities in Australia to rebuild/rehabilitate infrastructure projects that were damaged by floods last December 2010. POEA also identifies construction as one of the major sources of overseas employment for Filipinos in the next 5-10 years.
9
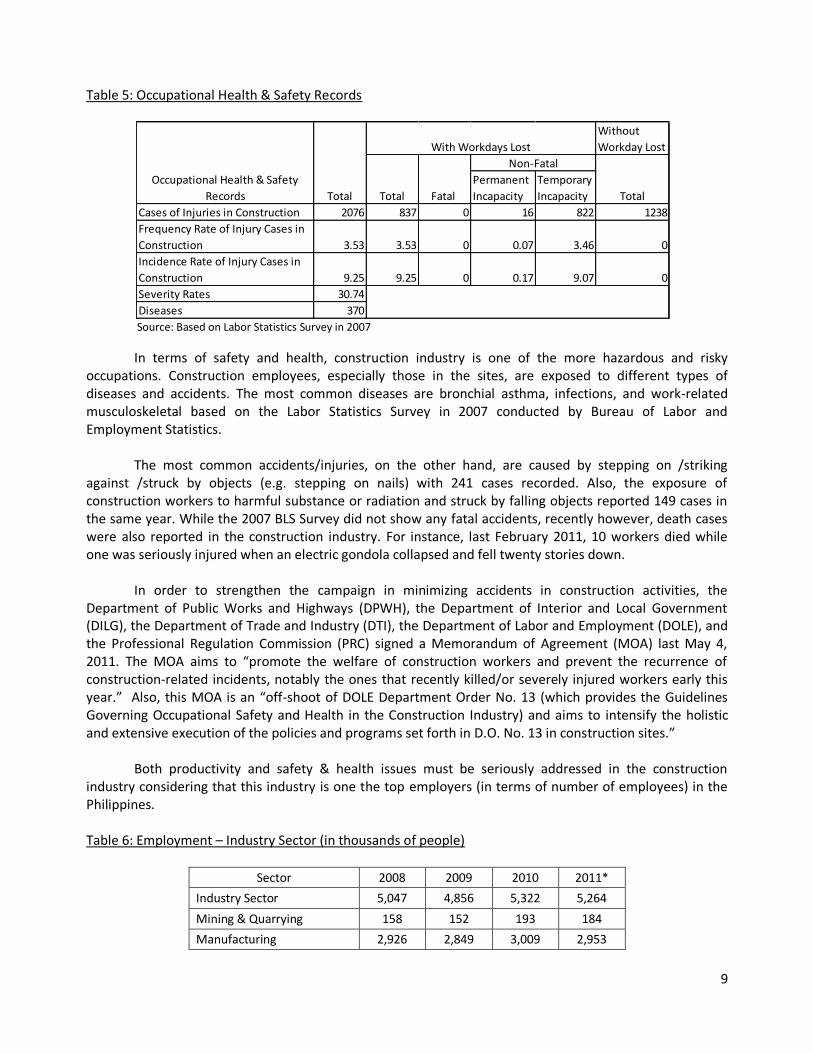
Table 5: Occupational Health & Safety Records
Source: Based on Labor Statistics Survey in 2007
In terms of safety and health, construction industry is one of the more hazardous and risky occupations. Construction employees, especially those in the sites, are exposed to different types of diseases and accidents. The most common diseases are bronchial asthma, infections, and work-related musculoskeletal based on the Labor Statistics Survey in 2007 conducted by Bureau of Labor and Employment Statistics.
The most common accidents/injuries, on the other hand, are caused by stepping on /striking
against /struck by objects (e.g. stepping on nails) with 241 cases recorded. Also, the exposure of construction workers to harmful substance or radiation and struck by falling objects reported 149 cases in the same year. While the 2007 BLS Survey did not show any fatal accidents, recently however, death cases were also reported in the construction industry. For instance, last February 2011, 10 workers died while one was seriously injured when an electric gondola collapsed and fell twenty stories down.
In order to strengthen the campaign in minimizing accidents in construction activities, the
Department of Public Works and Highways (DPWH), the Department of Interior and Local Government (DILG), the Department of Trade and Industry (DTI), the Department of Labor and Employment (DOLE), and the Professional Regulation Commission (PRC) signed a Memorandum of Agreement (MOA) last May 4, 2011. The MOA aims to “promote the welfare of construction workers and prevent the recurrence of construction-related incidents, notably the ones that recently killed/or severely injured workers early this year.” Also, this MOA is an “off-shoot of DOLE Department Order No. 13 (which provides the Guidelines Governing Occupational Safety and Health in the Construction Industry) and aims to intensify the holistic and extensive execution of the policies and programs set forth in D.O. No. 13 in construction sites.”
Both productivity and safety & health issues must be seriously addressed in the construction
industry considering that this industry is one the top employers (in terms of number of employees) in the Philippines. Table 6: Employment – Industry Sector (in thousands of people)
Sector 2008 2009 2010 2011*
Industry Sector 5,047 4,856 5,322 5,264
Mining & Quarrying 158 152 193 184
Manufacturing 2,926 2,849 3,009 2,953
Without
Workday Lost
Permanent
Incapacity
Temporary
Incapacity
Cases of Injuries in Construction 2076 837 0 16 822 1238
Frequency Rate of Injury Cases in
Construction 3.53 3.53 0 0.07 3.46 0
Incidence Rate of Injury Cases in
Construction 9.25 9.25 0 0.17 9.07 0
Severity Rates 30.74
Diseases 370
Occupational Health & Safety
Records
Source: Based on Labor Statistics Survey in 2007
With Workdays Lost
Non-Fatal
Total Fatal TotalTotal

10
Electricity, Gas, and Water 130 134 157 131
Construction 1,833 1,721 1,963 1,966
*preliminary
Source: Bureau of Labor and Employment Statistics
The construction industry employs an average of 1.8 million workers from 2008 to 2011, second
only to manufacturing industry. For the entire economy, construction industry lands on the top 5 industries in terms of total number of workers. As the table also shows, after a decrease in 2009, employment in construction industry increased again in 2010 and 2011. With bright outlook for construction industry for the next few years, this number is set to increase further. This should encourage more both the regulators and companies to give emphasis on the safety and health of construction employees. Table 7: Average Daily Basic Pay – Industry Sector (in US$ = PHP43.00)
Average Daily Basic Pay (in $ = P43) 2008 2009 2010
Mining & Quarrying 5.6 5.6 5.7
Manufacturing 6.7 7.0 7.2
Electricity, Gas, and Water Supply 10.6 10.8 11.2
Construction 6.2 6.4 6.6 Source: Bureau of Labor and Employment Statistics
On contrary, construction industry has one of the lowest average daily basic pay in the non-
agricultural sector. The average daily basic pay of construction industry from 2008-2010 is $6.4 (P276.10), slightly higher than that of Mining & Quarrying, which is at $5.6 (P242.40).
Table 8: Professionals in the Construction Industry (as of 2009)
Professionals in Construction Industry
Construction Industry No. of Employees
Total 1,721,000
Professionals 327,000
civil engineers 35%
mechanical engineers 22%
electrical engineers 14%
electronic engineers 14%
architects 7%
geodetic engineers 3%
master plumbers 2%
others 3%
Source: 2007 Labor Statistics Survey
The construction industry in the Philippines has generated millions of jobs for domestic and
overseas workers and professionals. The five (5) sectors of construction service industry: Site Preparation, General Engineering Construction, Building Installations, Other Building Completion Activities, and Renting of Construction or Demolition Equipment with Operators, have mostly provided source of livelihood to some engineers and other professionals.
11
c. Construction Contracts
According to the Department of Public Works and Highways (DPWH), in the manner prescribed by Republic Act 9184, otherwise known as the “Government Procurement Reform Act,” and its implementing rules and regulations, for each construction contract under normal or ordinary conditions, the following plans shall be prepared in accordance with guidelines and standards adopted by the Procuring Entity / LGU concerned, incorporating at least the following:
i. Site development plan; ii. Plans and profile sheet; iii. Typical sections and details; iv. Drainage details where applicable; v. Structural plans at appropriate scales indicating all details necessary in order that the complete
structure can be set out and constructed; and vi. Other details which may be required by the head of the agency / LCE.
In addition, based from the Manual of Procedures for the Procurement of Infrastructure Projects
made by DPWH, the bidding documents should clearly state the type of contract to be entered into and contain the proposed contract provisions appropriate therefore. The most common types of contracts provide for payments on the basis of a lump sum, unit price, or combinations thereof.
A typical construction contract between the owner and the contractor include the following items:
i. General Conditions of project ii. Duration of project iii. Amount of project iv. Variation orders (e.g. changes from original plans) v. Liquidated damages (e.g. delays) vi. Scope of Work
The size and scope of individual contracts will depend on the magnitude, nature, and location of
the project, for example:
i. For projects requiring a variety of goods and works, separate contracts may be awarded for the supply and/or installation of different items of equipment and plant (“plant” refers to installed equipment, as in a production facility) and for the works.
ii. For a project requiring similar but separate items of equipment or works, bids may be invited under alternative contract options that would attract the interest of both small and large firms, which could be allowed, at their option, to bid for individual contracts (slices) or for a group of similar contracts (package). All bids and combinations of bids should be received by the same deadline and opened and evaluated simultaneously so as to determine the bid or combination of bids offering the lowest calculated cost to the procuring entity / LGU.
iii. In certain cases, the procuring entity / LGU may require a turnkey contract under which the
design and engineering, the supply and installation of equipment, and the construction of a complete facility or works are provided under one (1) contract. Alternatively, the procuring entity / LGU may remain responsible for the design and engineering, and invite bids for a single responsibility contract for the supply and installation of all goods and works required for the
12
project component. Also acceptable where appropriate are contracts such as, but not limited to:
design and build;
design, build and operate;
design, build and lease; and
Management contract.
Currently, the DPWH is finalizing the mechanism for long-term maintenance contracts by the private sector (for a period of 5-10 years) in road and bridge construction. The contracts will now be performance-based to improve the quality of roads and to lower program costs. Basic to the concept of performance-based contracting is to adopt contracting specifications and procedures permitting the contractor to devise the most efficient and effective way to perform the work. This offers complete accountability on the part of the contractor (i.e. transfers performance risk to the contractor). Expected benefits of this way of contracting are as follows:
i. Encourages and promotes contractors to be innovative and find cost effective ways of delivering services
ii. Results in better prices and performance iii. Maximizes competition and innovation iv. Lowers ongoing expenses v. Achieves cost savings vi. Expects contractors to control costs vii. Creates better value and enhanced performance viii. Gives the contractor more flexibility to achieve the desired results ix. Shifts risk to contractors so they are responsible for achieving the objectives x. Provides incentives to improve contractor performance and ties contractor compensation to
achievement xi. Provides financial incentives for efficient use of resources xii. Rewards good performance
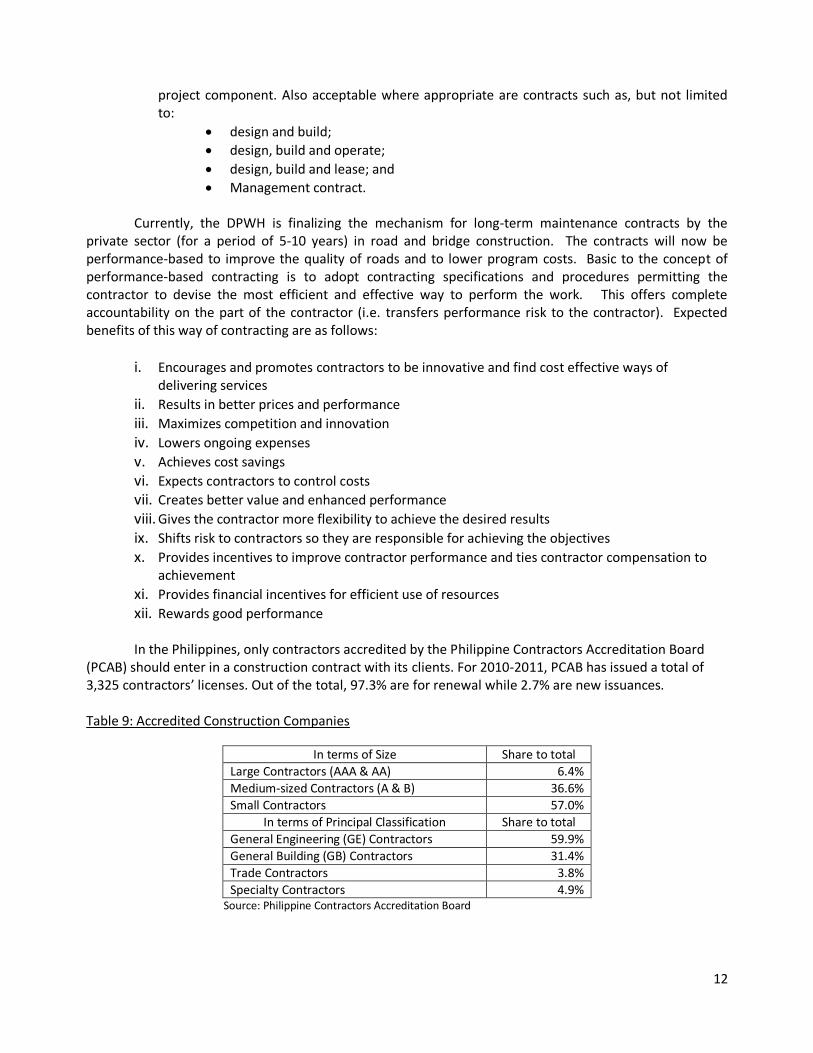
In the Philippines, only contractors accredited by the Philippine Contractors Accreditation Board
(PCAB) should enter in a construction contract with its clients. For 2010-2011, PCAB has issued a total of 3,325 contractors’ licenses. Out of the total, 97.3% are for renewal while 2.7% are new issuances.
Table 9: Accredited Construction Companies
In terms of Size Share to total
Large Contractors (AAA & AA) 6.4%
Medium-sized Contractors (A & B) 36.6%
Small Contractors 57.0%
In terms of Principal Classification Share to total
General Engineering (GE) Contractors 59.9%
General Building (GB) Contractors 31.4%
Trade Contractors 3.8%
Specialty Contractors 4.9% Source: Philippine Contractors Accreditation Board

13
Also, the PCAB has issued special licenses to 21 foreign contractors, 95.2% or 20 of which are large contractors and 4.8% or only 1 is a medium-sized contractor. In terms of nationality, majority of which were Japanese (10), followed by Chinese (4), and Korean (3) firms, while the remaining were Thai (1), Australian (1), Austrian (1) and Malaysian (1).
d. Practices
Aside from crafting bidding documents, the procuring entity / LGU observes the following practices to ensure successful procurement:
i. All prospective bidders should be provided the same information, and should be assured of
equal opportunities to obtain additional information on a timely basis.
ii. Procuring Entities should provide reasonable access to project sites for visits by prospective bidders.
iii. For works, particularly for those requiring refurbishing existing works, a pre-bid conference
may be arranged whereby potential bidders may meet with the Procuring Entity’s representatives to seek clarifications (in person or online).
iv. Any additional information, clarification, correction of errors, or modifications of bidding
documents should be sent to each recipient of the original bidding documents in sufficient time before the deadline for receipt of bids to enable bidders to take appropriate actions. If necessary, the deadline should be extended.
III. Outlook
Recently, the prospect for global economic growth was not that bright given the earthquake and tsunami that hit Japan, political turmoil in MENA countries, dismal performance of the US economy, and the lingering debt crisis in Euro. Even if the prospects for developed western economies are not good at this point, emerging and developing countries especially in Asia would continue to record modest growth rates in 2011 and 2012. The IMF projects a 6-7% from 2011 to 2016 for emerging and developing economies which include China.
As such, global demand for construction industry can continue to have positive growth rates driven
by the sustained growth rate in emerging and developing economies. Growth in the construction industry in Middle East will also be sustained. For instance, construction of 12 mega or industrial cities in Saudi Arabia is expected to take place through 2024.
For the local construction industry, with expected aggressive spending from private sector
(residential condominiums and commercial buildings) and the government (infrastructure projects), construction industry is set to sustain its growth rate in the next three years. While prices of construction materials have shown an increasing trend in 2010 and early 2011, they have been decreasing lately. It can be also the case that the increase in the prices was attributed to the strong demand for construction activities.
A 10-11% growth rate in the next three years for construction industry can be expected. The major
factors that can help the industry achieve this level of growth rate are the continued growth in key sectors such as BPO, tourism, and mining, Overseas Filipino Workers (OFWs) remittances, sustained growth in OFW
14
remittances, and the implementation of Public Private Partnership (PPP) or big-ticket projects by the Aquino Administration.
i. Tourism Industry From January-April 2011, inbound visitors to the Philippines have increased by 13.3% from 1.2
million to 1.3 arrivals in 2011. Most of the arrivals came from East Asia region. On the other hand, based on 2009 Household Survey on Domestic Visitors (NSO and DOT), there are 22.8 million domestic travelers in the Philippines.
In 2010, total foreign tourist arrivals were at a record-high of 3.52 million. DOT sets a target of 3.74
million tourist arrivals in 2011. With 1.3 million arrivals already recorded in first 4 months of 2011, this target will likely be achieved. Moreover, the DOT aims to increase foreign tourist arrivals to 6 million by 2016.
Higher foreign tourist arrivals and increase in the number of domestic travelers can lead to
construction of additional resorts, hotels, and even condominiums for those who want to stay a little longer in the Philippines. Increase in number of travelers can also lead to construction of additional airports and improvement of existing ones. Also, due to the Republic Act of 9593 or Tourism Act of 2009, roads that are not classified as national but lead to tourism sites, airports, and seaports can be now included in the budget of DPWH. As such, we can expect an increase in construction of “tourism roads” during the Aquino Administration.
ii. Business Process Outsourcing (BPO)
According to Export Development Council (EDC) and BPAP, the BPO industry is expected to grow by 18% in 2011 and 20% in 2012 after posting a growth rate of 26.9% to reach US$8.9 billion revenues in 2009. The major driver of BPO industry is the IT-BPO sector (i.e. information technology-business process outsourcing), which has been growing at an average rate of 30% for the past years. Moreover, the Contact Center Association of the Philippines (CCAP) also believes that a 15%-20% growth rate 2011 target for BOP industry is achievable.
Expansion of BPO companies both in and outside Metro Manila can lead to additional construction
of commercial buildings. This will be a huge opportunity for the construction industry to increase its output to meet the demand of still growing BPO industry.
iii. Mining Industry
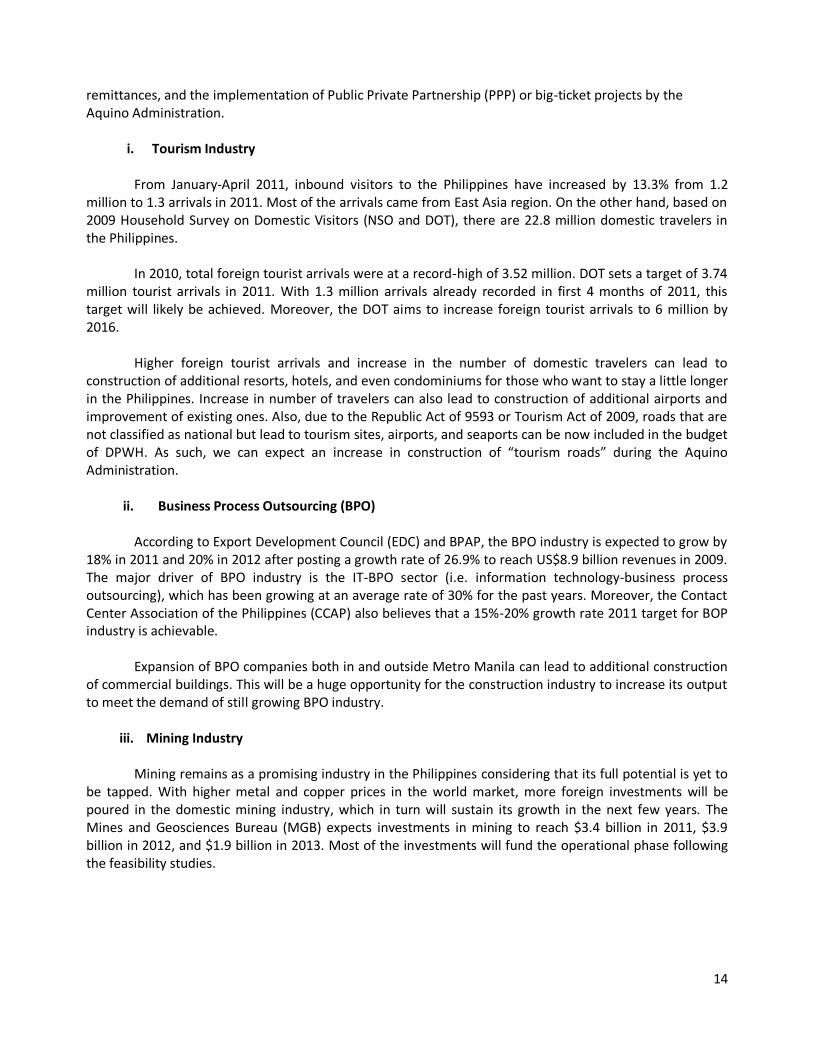
Mining remains as a promising industry in the Philippines considering that its full potential is yet to
be tapped. With higher metal and copper prices in the world market, more foreign investments will be poured in the domestic mining industry, which in turn will sustain its growth in the next few years. The Mines and Geosciences Bureau (MGB) expects investments in mining to reach $3.4 billion in 2011, $3.9 billion in 2012, and $1.9 billion in 2013. Most of the investments will fund the operational phase following the feasibility studies.
15
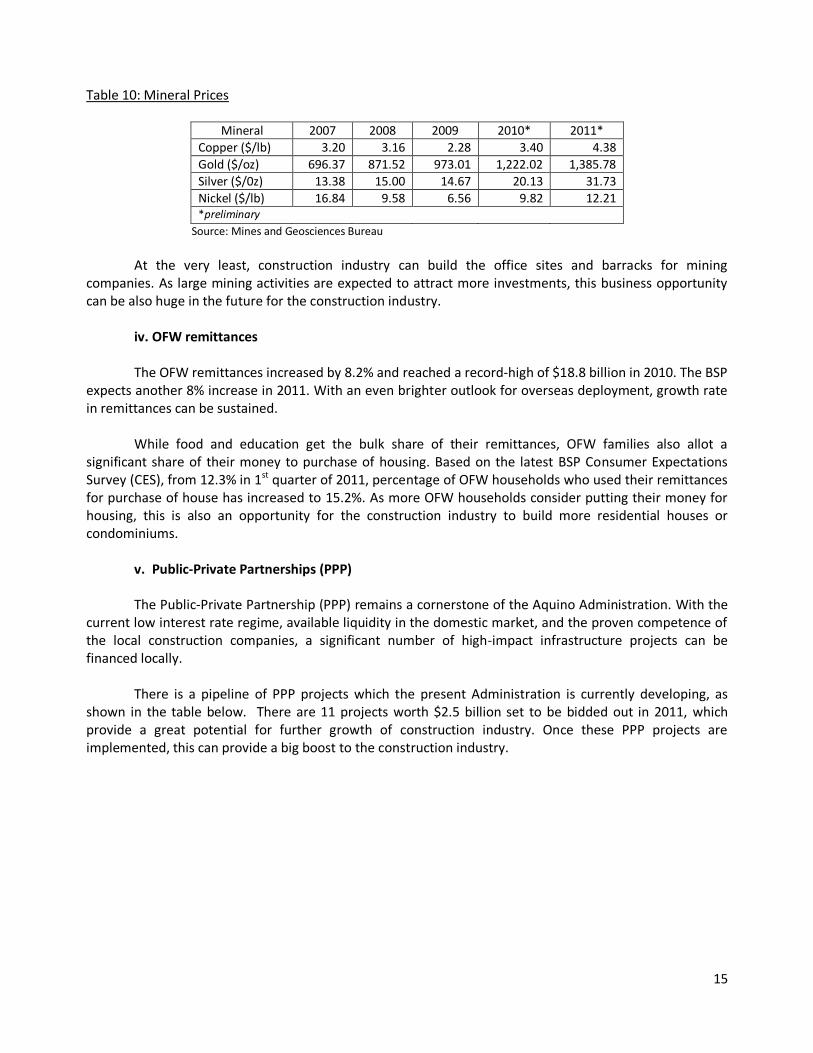
Table 10: Mineral Prices
Mineral 2007 2008 2009 2010* 2011*
Copper ($/lb) 3.20 3.16 2.28 3.40 4.38
Gold ($/oz) 696.37 871.52 973.01 1,222.02 1,385.78
Silver ($/0z) 13.38 15.00 14.67 20.13 31.73
Nickel ($/lb) 16.84 9.58 6.56 9.82 12.21 *preliminary
Source: Mines and Geosciences Bureau
At the very least, construction industry can build the office sites and barracks for mining
companies. As large mining activities are expected to attract more investments, this business opportunity can be also huge in the future for the construction industry.
iv. OFW remittances
The OFW remittances increased by 8.2% and reached a record-high of $18.8 billion in 2010. The BSP
expects another 8% increase in 2011. With an even brighter outlook for overseas deployment, growth rate in remittances can be sustained.
While food and education get the bulk share of their remittances, OFW families also allot a
significant share of their money to purchase of housing. Based on the latest BSP Consumer Expectations Survey (CES), from 12.3% in 1st quarter of 2011, percentage of OFW households who used their remittances for purchase of house has increased to 15.2%. As more OFW households consider putting their money for housing, this is also an opportunity for the construction industry to build more residential houses or condominiums.
v. Public-Private Partnerships (PPP) The Public-Private Partnership (PPP) remains a cornerstone of the Aquino Administration. With the
current low interest rate regime, available liquidity in the domestic market, and the proven competence of the local construction companies, a significant number of high-impact infrastructure projects can be financed locally.
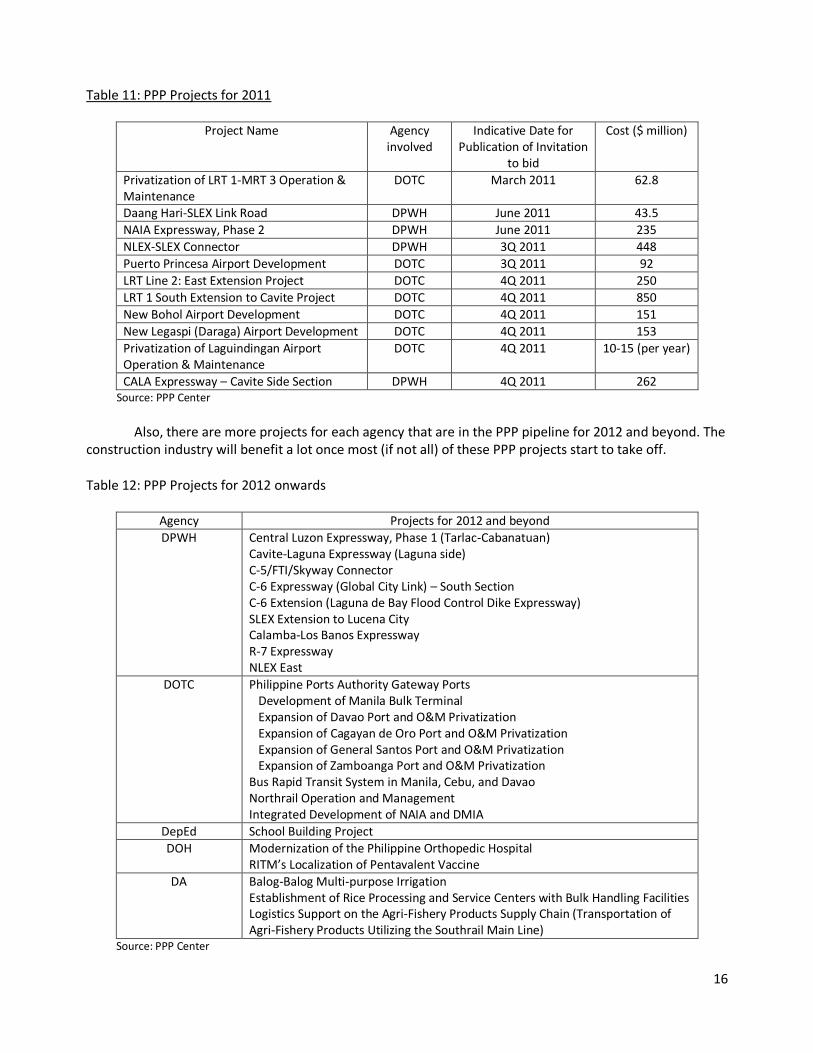
There is a pipeline of PPP projects which the present Administration is currently developing, as
shown in the table below. There are 11 projects worth $2.5 billion set to be bidded out in 2011, which provide a great potential for further growth of construction industry. Once these PPP projects are implemented, this can provide a big boost to the construction industry.
16
Table 11: PPP Projects for 2011
Project Name Agency involved
Indicative Date for Publication of Invitation
to bid
Cost ($ million)
Privatization of LRT 1-MRT 3 Operation & Maintenance
DOTC March 2011 62.8
Daang Hari-SLEX Link Road DPWH June 2011 43.5
NAIA Expressway, Phase 2 DPWH June 2011 235
NLEX-SLEX Connector DPWH 3Q 2011 448
Puerto Princesa Airport Development DOTC 3Q 2011 92
LRT Line 2: East Extension Project DOTC 4Q 2011 250
LRT 1 South Extension to Cavite Project DOTC 4Q 2011 850
New Bohol Airport Development DOTC 4Q 2011 151
New Legaspi (Daraga) Airport Development DOTC 4Q 2011 153
Privatization of Laguindingan Airport Operation & Maintenance
DOTC 4Q 2011 10-15 (per year)
CALA Expressway – Cavite Side Section DPWH 4Q 2011 262 Source: PPP Center
Also, there are more projects for each agency that are in the PPP pipeline for 2012 and beyond. The
construction industry will benefit a lot once most (if not all) of these PPP projects start to take off. Table 12: PPP Projects for 2012 onwards
Agency Projects for 2012 and beyond
DPWH Central Luzon Expressway, Phase 1 (Tarlac-Cabanatuan) Cavite-Laguna Expressway (Laguna side) C-5/FTI/Skyway Connector C-6 Expressway (Global City Link) – South Section C-6 Extension (Laguna de Bay Flood Control Dike Expressway) SLEX Extension to Lucena City Calamba-Los Banos Expressway R-7 Expressway NLEX East
DOTC Philippine Ports Authority Gateway Ports Development of Manila Bulk Terminal Expansion of Davao Port and O&M Privatization Expansion of Cagayan de Oro Port and O&M Privatization Expansion of General Santos Port and O&M Privatization Expansion of Zamboanga Port and O&M Privatization Bus Rapid Transit System in Manila, Cebu, and Davao Northrail Operation and Management Integrated Development of NAIA and DMIA
DepEd School Building Project
DOH Modernization of the Philippine Orthopedic Hospital RITM’s Localization of Pentavalent Vaccine
DA Balog-Balog Multi-purpose Irrigation Establishment of Rice Processing and Service Centers with Bulk Handling Facilities Logistics Support on the Agri-Fishery Products Supply Chain (Transportation of Agri-Fishery Products Utilizing the Southrail Main Line)
Source: PPP Center