the performance of state charter schools in georgia, 2016/17
TRANSCRIPT

State Charter Schools Performance Evaluation, 2016/17
The Performance of State Charter Schools in Georgia, 2016/17
By Tim R. Sass, Ph.D.
Distinguished University Professor Department of Economics
Andrew Young School of Policy Studies Georgia State University
March 20, 2018

State Charter Schools Performance Evaluation, 2016/17
Table of Contents
Executive Summary ....................................................................................................................... 3
I. Introduction and Background .................................................................................................... 7
II. Results – All State Charters ..................................................................................................... 14
A. Value-Added and Student Growth Model Estimates .................................................................... 14
B. Summary of Findings .............................................................................................................................. 15
III. Results – Individual School Summaries ................................................................................ 31
Atlanta Heights Charter School ................................................................................................................... 32
Brookhaven Innovation Academy.............................................................................................................. 44
Cherokee Charter Academy .......................................................................................................................... 47
Cirrus Academy Charter ................................................................................................................................. 59
Coweta Charter Academy .............................................................................................................................. 62
DuBois Integrity Academy ............................................................................................................................ 74
Foothills Education Charter High School ................................................................................................ 83
Fulton Leadership Academy ......................................................................................................................... 89
Georgia Connections Academy ................................................................................................................. 104
Georgia Cyber Academy .............................................................................................................................. 110
Georgia School for Innovation and the Classics ................................................................................ 116
Graduation Achievement Charter High School (Formerly Provost Academy) ..................... 122
International Charter School of Atlanta ............................................................................................... 128
Ivy Preparatory Academy at Gwinnett ................................................................................................. 134
Ivy Preparatory Academy at Kirkwood for Girls .............................................................................. 143
Liberty Tech Charter School ...................................................................................................................... 155
Mountain Education Center ....................................................................................................................... 158
Odyssey School ............................................................................................................................................... 164
Pataula Charter Academy ........................................................................................................................... 176
Scintilla Charter Academy .......................................................................................................................... 196
Southwest Georgia STEM Charter ........................................................................................................... 205
Statesboro STEAM College, Careers, Arts & Technology Academy (formerly Charter
Conservatory for Liberal Arts & Technology (CCAT)) .................................................................... 206
Utopian Academy for the Arts .................................................................................................................. 220
IV. References ............................................................................................................................ 229

State Charter Schools Performance Evaluation, 2016/17
2
Appendix: Value Added Model Approach ................................................................................... 231
A. Value-Added Model Specification and Estimation .................................................................... 231
B. Value-Added Model Estimates .......................................................................................................... 235

State Charter Schools Performance Evaluation, 2016/17
3
Executive Summary
A total of 23 state charter schools operated in Georgia during the 2016/17 school year. For four of the schools, Brookhaven Innovation Academy, Cirrus Academy Charter, Liberty Tech Charter School and Southwest Georgia STEM Charter, 2016/17 was the first year of operation. Five of the schools, DuBois Integrity Academy, Foothills Education Charter High School, Georgia School for Innovation and the Classics, International Charter School of Atlanta and Scintilla Charter Academy, began operations in the 2015/16 school year. Thus, this report documents the performance of 23 state charter schools in 2016/17, the performance of 19 of those schools in 2015/16 and the performance of 14 of the currently operating schools in 2014/15.
Two test-based measures of school performance are employed, value-added and mean student growth percentiles. The value-added measure is the result of a two-step process. In the first step, the difference between a student’s actual score and their predicted score (which is based on their observable characteristics) is computed, then these differences are averaged across all tested students in a school. In the second step, adjustments to a school’s score are made to account for the differences in the population of students it serves. The student-growth-percentile approach ranks each student’s performance relative to that of other students with the same or similar test score history, and then averages these rankings across all tested students in a school. Each school’s performance on these two metrics is compared to all other schools in the state and to other schools in the district or districts it serves (if the service area is not statewide). Relative school performance is reported for each subject-area or course exam taken by at least 15 students in a school, as well as for the cross-subject average of English Language Arts (ELA) and Math end-of-course exams.
Key findings are:
State charter schools are diverse and many provide learning environments that differ from those of traditional public schools. State charter schools vary along multiple dimensions, including grade levels, student demographics, instructional mode (face-to-face or virtual), curricular focus and geographic area served.
• Grade Levels
o A plurality of state charters (9 of 23) serve a combination of elementary (K-5) and
middle grades (6-8).
o Four serve only elementary grades.
o Two serve only middle school grades.
o Three serve only high school grades (9-12).
o Three schools serve elementary, middle and at least some high school grades.
o The remaining two schools serve both middle and high school grades.
• Student Demographics
o Three of the 23 schools are single-gender schools.
o At six schools, African-American enrollment is 90 percent or more.
o For two schools, the majority of students are directly certified, a proxy for
economically disadvantaged that is defined as living in households receiving SNAP or
TANF benefits, or are classified as homeless or migrants.
State Charter Schools Performance Evaluation, 2016/17
4
o One school has over twenty percent of its students classified as gifted, while nine
schools report less than one percent of their students as gifted.
• Instructional Mode
o Three of the 23 schools provide fully online course offerings.
o The remaining 20 schools offer primarily face-to-face instruction.
• Geographic Area Served
o Eight of the 23 schools accept students from a single school district only.
o Four schools offer enrollment to students in multiple school districts.
o The three fully-online virtual schools and eight of the “brick-and-mortar” schools
allow students from throughout the state to attend.
More than one quarter of state charter schools serving elementary grades perform at a level that one can say with 95 percent confidence is above the average public elementary school in the state with a similar student population.
• Sixteen state charter schools serve elementary grades.
• For four schools, the cross-subject average performance is above the state average for all
elementary schools at a level that is statistically significant.
• For five schools, the cross-subject average performance is not distinguishable from the
state average for all elementary schools in terms of statistical significance.
• For six schools, the cross-subject average performance is below the state average for all
elementary schools at a level that is statistically significant.
• One school tested fewer than 15 students; therefore, its performance information cannot
be reported.
More than one third of state charter schools serving elementary grades within a defined attendance zone perform at a level at which one can be at least 95 percent certain they are performing better than the average of all elementary schools in their district(s).
• Of the 16 state charters serving elementary grades, eight have a non-statewide, defined
attendance zone that includes one or more districts. For three of the eight, the cross-
subject ELA and Math performance is above that of the average elementary school in their
relevant district(s) at a level that is statistically significant.
• For four schools, the cross-subject average performance is not distinguishable from the
average of all elementary schools in their relevant district(s) in terms of statistical
significance.
• For one non-statewide charter school, the cross-subject average performance is below
that of the average elementary school in its relevant district(s) at a level that is statistically
significant.
More than half of state charter schools serving middle grades perform below the average public middle school in the state with a similar student population at a level that is statistically significant.
• Sixteen state charter schools serve middle grades.

State Charter Schools Performance Evaluation, 2016/17
5
• For two schools, their cross-subject average performance is above the state average for
all middle schools at a level that is statistically significant.
• In five state charter schools, their cross-subject average performance is indistinguishable
from the state average for all middle schools in terms of statistical significance.
• For nine state charter schools, their cross-subject average performance is statistically
below the state average for all middle schools at a level that is statistically significant.
Only one state charter school serving middle grades within a defined attendance zone performed at a level that is clearly better than the average of all middle schools in their relevant district(s).
• Ten state charter schools that serve middle grades have a non-statewide attendance zone
that includes one or more school districts.
• One of the ten school’s cross-subject ELA and Math performance is higher than the
average middle school in its relevant district(s) at a level that is statistically significant.
• For four of the ten non-statewide schools, the cross-subject average performance is
indistinguishable from the average middle school in their district(s) in terms of statistical
significance.
• For five of the ten non-statewide schools, the cross-subject average performance is below
the average middle school in their district(s) at a level that is statistically significant.
The performance of state charter schools serving high school grades is uneven when compared to the average public high school in the state.
• Eight state charter schools serve grades 9-12.
• In five schools, their individual test-school performance is higher than the state average
of all high schools in at least one subject and that difference is statistically significant.
• For seven schools, their individual test-school performance is indistinguishable from the
state average of all high schools in at least one subject.
• In five schools, their individual test-school performance is below the state average of all
high schools in at least one subject and that difference is statistically significant.
• Across the 54 test-school combinations:
o the test-school performance was indistinguishable from the state average in 26 cases;
o the test-school performance was below the state average in 18 cases and that
difference is statistically significant; and,
o the test-school performance was above the state average in 10 cases, with the
difference being statistically significant.
• Small sample sizes at some of the tested schools, in part, contribute to their results being
indistinguishable from the state.
For the majority of subjects at the high school level, most state charters with non-statewide attendance zones perform at a level that is indistinguishable from the average high school in their district(s).

State Charter Schools Performance Evaluation, 2016/17
6
• Of the eight state charter schools that serve high schools grades, three are non-statewide
and serve students in one or more school districts, representing 19 subject school
combinations.
• For one school, its performance is indistinguishable from the district average in four of six
subjects.
• In another school, its performance is indistinguishable from the district average in three
of eight subjects.
• For the third school, its performance is indistinguishable from the district average in five
of five subjects.

State Charter Schools Performance Evaluation, 2016/17
7
I. Introduction and Background
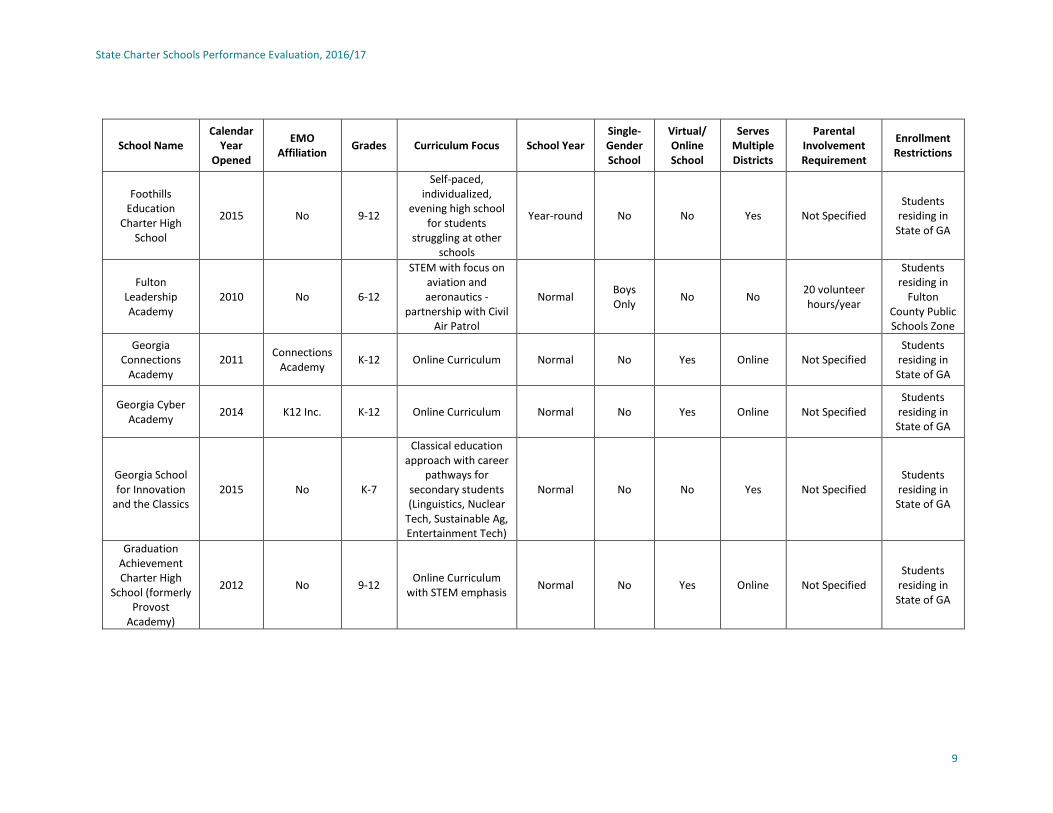
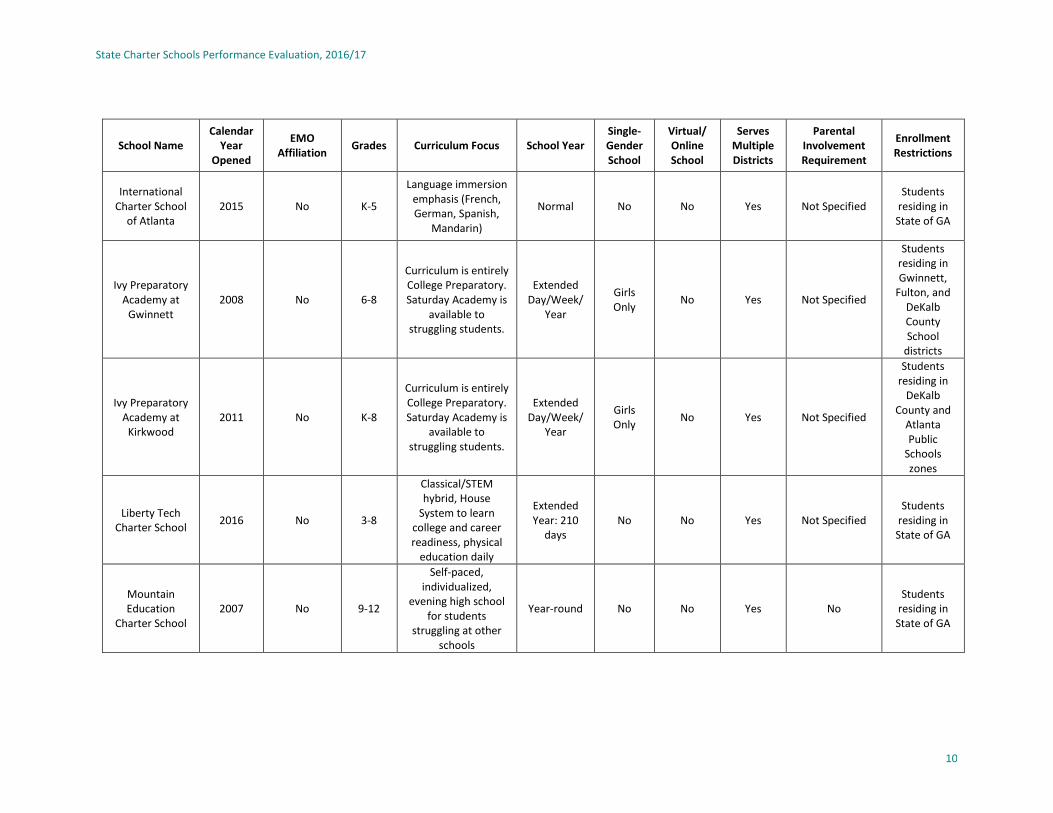
Twenty-three state charter schools operated in Georgia during the 2016/17 school year. Even though the current State Charter Schools Commission (SCSC) has only been in operation since 2013, a number of the state charter schools began operation well before 2013. Some were originally formed as state chartered special schools or were initially chartered by the original Georgia Charter Schools Commission, which was declared unconstitutional by the Georgia Supreme Court.1 Table 1 summarizes information about the 23 schools that operated during the 2016/17 school year, including when the school opened, whether it is affiliated with an education management organization (EMO), grades served, curricular model, school calendar, delivery model (virtual vs. physical classrooms), attendance zone, and any special enrollment requirements (e.g., parental participation requirements or gender restrictions). The 23 schools are quite diverse in their structure, mission, and service area. For example, three of the 23 state charter schools are virtual schools, and many of the state charter schools target traditionally underserved populations. Three of the schools are single-gender schools. Less than half of state charter schools (8 of 23) serve students in a single school district, while the others either serve students from multiple school districts or the entire state.
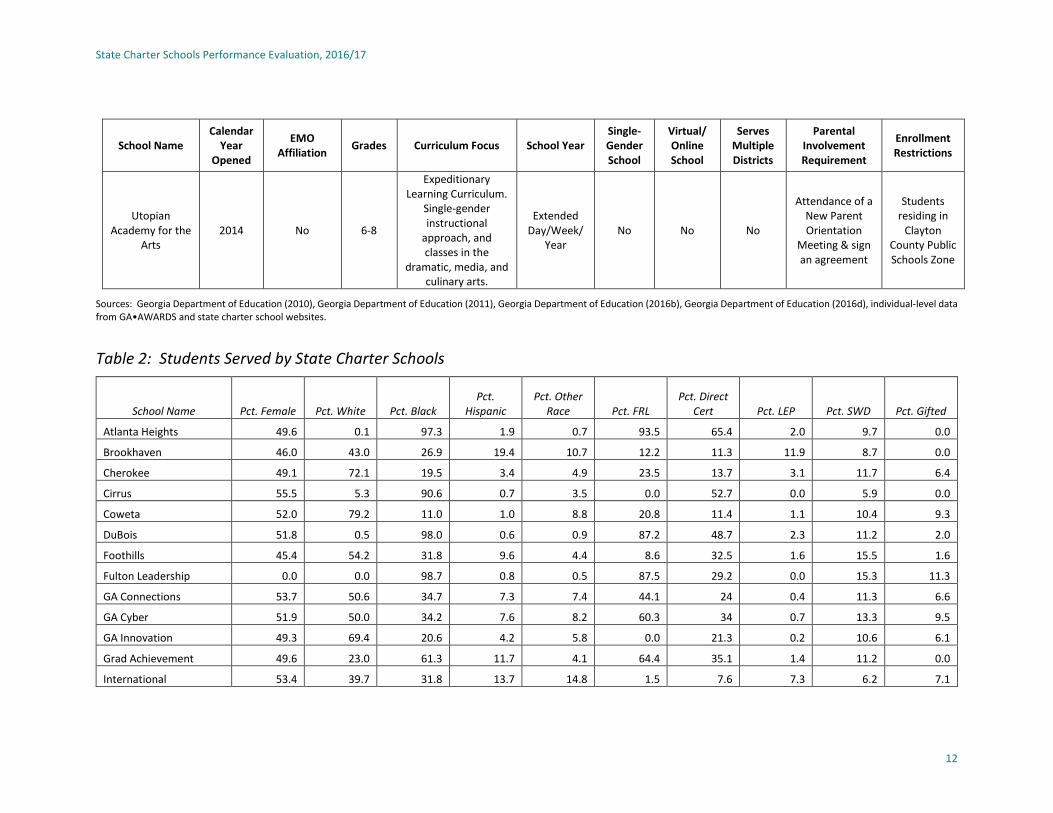
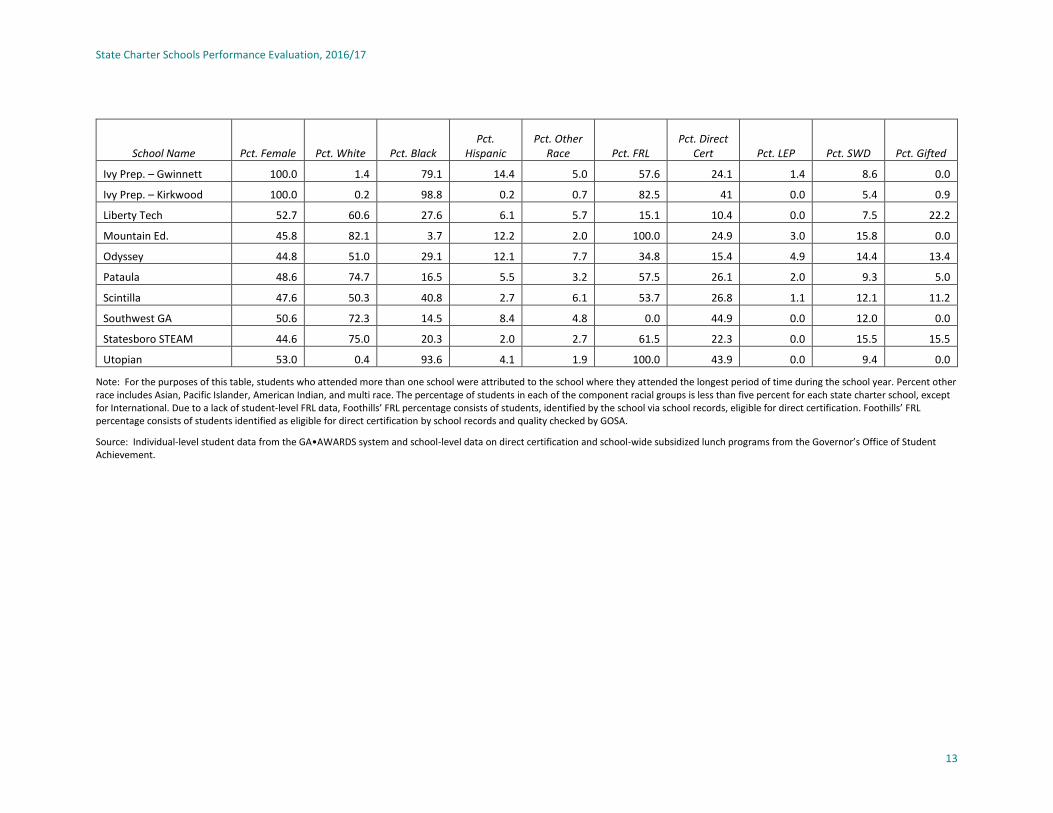
The state charter schools also vary considerably in the populations of students they serve, as illustrated in Table 2. Six of the 23 schools have student bodies consisting of 90 percent or more African-American students. In contrast, three have student populations in which 75 percent or more of the students are non-Hispanic whites. There is considerable diversity in proportions of Limited English Proficiency (LEP) students, students eligible for Free/Reduced-Price Lunch (FRL), Direct Certification Students, Students with Disabilities (SWD), and gifted students as well.2
1Details on the history of charter schools in general and more specifically state chartered schools, are contained in Georgia Department of Education (2012). 2The school-level FRL percentage is computed from individual-level data. If an individual student attended a school that participates in provision 2 of the Special Assistance Alternatives (SAS) or the Community Eligibility Provision (CEP), as provided by the Georgia Department of Education’s School Nutrition Program, then the student is classified as FRL, no matter what his original individual designation. In general, Direct Certification refers to students who either live in a family unit receiving SNAP benefits, live in a family unit receiving TANF benefits, are identified as homeless, are in foster care, or are migrant. For the 2016/17 school year, data on foster care were delayed, so the direct certification percentage reported for the current year exclude students in foster care who do not meet any of the other criteria for direct certification. Since the income thresholds for SNAP and TANF benefits are lower than for free/reduced-price lunch, the direct certification percentage is generally lower than the FRL percentage in most schools. There are five SCSC schools where this is not the case, three of which have no students reported as FRL, suggesting the school either does not participate in the nutrition program or did not report FRL eligibility at the student level.

State Charter Schools Performance Evaluation, 2016/17
8
Table 1: General Characteristics of State Charter Schools
School Name Calendar
Year Opened
EMO Affiliation
Grades Curriculum Focus School Year Single-Gender School
Virtual/ Online School
Serves Multiple Districts
Parental Involvement Requirement
Enrollment Restrictions
Atlanta Heights 2010 National Heritage
Academies K-8 None Normal No No No Not Specified
Students residing in
Atlanta Public
Schools Zone
Brookhaven Innovation Academy
2016 No K-6
Compass Learning: cross-curricula, STEM-focused; project-based
K-8 coding curriculum
Extended Day/Year
No No Yes Not Specified Students
residing in State of GA
Cherokee Charter
Academy 2011
Charter Schools USA
K-8 None Normal No No No
20 hours volunteer/year
for one child, 30 hours/year for more than one
child
Students residing in Cherokee
County Public Schools Zone
Cirrus Academy Charter
2016 No K-8 STEM + Arts Normal No No Yes Not Specified Students
residing in State of GA
Coweta Charter Academy
2010 Charter
Schools USA K-8 None Normal No No No
20 hours volunteer/year
for one child, 30 hours/year for more than one
child
Students residing in
Coweta County Public Schools Zone
DuBois Integrity Academy
2015 No K-5 GA Common core
standards with STEM and Arts integration
Normal No No No 30 volunteer hours/year
Students residing in
Clayton County Public Schools Zone
State Charter Schools Performance Evaluation, 2016/17
9
School Name Calendar
Year Opened
EMO Affiliation
Grades Curriculum Focus School Year Single-Gender School
Virtual/ Online School
Serves Multiple Districts
Parental Involvement Requirement
Enrollment Restrictions
Foothills Education
Charter High School
2015 No 9-12
Self-paced, individualized,
evening high school for students
struggling at other schools
Year-round No No Yes Not Specified Students
residing in State of GA
Fulton Leadership Academy
2010 No 6-12
STEM with focus on aviation and aeronautics -
partnership with Civil Air Patrol
Normal Boys Only
No No 20 volunteer hours/year
Students residing in
Fulton County Public Schools Zone
Georgia Connections
Academy 2011
Connections Academy
K-12 Online Curriculum Normal No Yes Online Not Specified Students
residing in State of GA
Georgia Cyber Academy
2014 K12 Inc. K-12 Online Curriculum Normal No Yes Online Not Specified Students
residing in State of GA
Georgia School for Innovation
and the Classics 2015 No K-7
Classical education approach with career
pathways for secondary students (Linguistics, Nuclear
Tech, Sustainable Ag, Entertainment Tech)
Normal No No Yes Not Specified Students
residing in State of GA
Graduation Achievement Charter High
School (formerly Provost
Academy)
2012 No 9-12 Online Curriculum
with STEM emphasis Normal No Yes Online Not Specified
Students residing in State of GA
State Charter Schools Performance Evaluation, 2016/17
10
School Name Calendar
Year Opened
EMO Affiliation
Grades Curriculum Focus School Year Single-Gender School
Virtual/ Online School
Serves Multiple Districts
Parental Involvement Requirement
Enrollment Restrictions
International Charter School
of Atlanta 2015 No K-5
Language immersion emphasis (French, German, Spanish,
Mandarin)
Normal No No Yes Not Specified Students
residing in State of GA
Ivy Preparatory Academy at
Gwinnett 2008 No 6-8
Curriculum is entirely College Preparatory. Saturday Academy is
available to struggling students.
Extended Day/Week/
Year
Girls Only
No Yes Not Specified
Students residing in Gwinnett,
Fulton, and DeKalb County School
districts
Ivy Preparatory Academy at
Kirkwood 2011 No K-8
Curriculum is entirely College Preparatory. Saturday Academy is
available to struggling students.
Extended Day/Week/
Year
Girls Only
No Yes Not Specified
Students residing in
DeKalb County and
Atlanta Public
Schools zones
Liberty Tech Charter School
2016 No 3-8
Classical/STEM hybrid, House
System to learn college and career readiness, physical
education daily
Extended Year: 210
days No No Yes Not Specified
Students residing in State of GA
Mountain Education
Charter School 2007 No 9-12
Self-paced, individualized,
evening high school for students
struggling at other schools
Year-round No No Yes No Students
residing in State of GA

State Charter Schools Performance Evaluation, 2016/17
11
School Name Calendar
Year Opened
EMO Affiliation
Grades Curriculum Focus School Year Single-Gender School
Virtual/ Online School
Serves Multiple Districts
Parental Involvement Requirement
Enrollment Restrictions
Odyssey School 2004 No K-8
Multi-age classrooms - students grouped
by skill level/Looping:
students remain with teacher two years
Normal No No No 18 hours per
academic year
Students residing in
Coweta County Public Schools Zone
Pataula Charter Academy
2010 No K-12
Expeditionary Learning: project
based lectures and curriculum
delivery/Looping: students remain with teacher for two years
Normal No No Yes Not Specified
Students residing in
Baker, Calhoun,
Clay, Early, Randolph
Public School districts
Scintilla Charter Academy
2015 No K-5
Project-based learning with
emphasis on service learning
Normal No No Yes 20 volunteer hours/year
Students residing in Lowndes
County and Valdosta City
School districts
Southwest Georgia STEM
Charter 2016 No K-5
Interdisciplinary, place-based paired
with STEM Normal No No Yes Not Specified
Students residing in State of GA
Statesboro STEAM College, Careers, Arts &
Technology Academy (CCAT)
2002 No 6-12 Multi-age classrooms
- students grouped by skill level
Year-round No No No 1 Hour of
Service/week
Students residing in
Bulloch County Public Schools Zone
State Charter Schools Performance Evaluation, 2016/17
12
School Name Calendar
Year Opened
EMO Affiliation
Grades Curriculum Focus School Year Single-Gender School
Virtual/ Online School
Serves Multiple Districts
Parental Involvement Requirement
Enrollment Restrictions
Utopian Academy for the
Arts 2014 No 6-8
Expeditionary Learning Curriculum.
Single-gender instructional
approach, and classes in the
dramatic, media, and culinary arts.
Extended Day/Week/
Year No No No
Attendance of a New Parent Orientation
Meeting & sign an agreement
Students residing in
Clayton County Public Schools Zone
Sources: Georgia Department of Education (2010), Georgia Department of Education (2011), Georgia Department of Education (2016b), Georgia Department of Education (2016d), individual-level data from GA•AWARDS and state charter school websites.
Table 2: Students Served by State Charter Schools
School Name Pct. Female Pct. White Pct. Black Pct.
Hispanic Pct. Other
Race Pct. FRL Pct. Direct
Cert Pct. LEP Pct. SWD Pct. Gifted
Atlanta Heights 49.6 0.1 97.3 1.9 0.7 93.5 65.4 2.0 9.7 0.0
Brookhaven 46.0 43.0 26.9 19.4 10.7 12.2 11.3 11.9 8.7 0.0
Cherokee 49.1 72.1 19.5 3.4 4.9 23.5 13.7 3.1 11.7 6.4
Cirrus 55.5 5.3 90.6 0.7 3.5 0.0 52.7 0.0 5.9 0.0
Coweta 52.0 79.2 11.0 1.0 8.8 20.8 11.4 1.1 10.4 9.3
DuBois 51.8 0.5 98.0 0.6 0.9 87.2 48.7 2.3 11.2 2.0
Foothills 45.4 54.2 31.8 9.6 4.4 8.6 32.5 1.6 15.5 1.6
Fulton Leadership 0.0 0.0 98.7 0.8 0.5 87.5 29.2 0.0 15.3 11.3
GA Connections 53.7 50.6 34.7 7.3 7.4 44.1 24 0.4 11.3 6.6
GA Cyber 51.9 50.0 34.2 7.6 8.2 60.3 34 0.7 13.3 9.5
GA Innovation 49.3 69.4 20.6 4.2 5.8 0.0 21.3 0.2 10.6 6.1
Grad Achievement 49.6 23.0 61.3 11.7 4.1 64.4 35.1 1.4 11.2 0.0
International 53.4 39.7 31.8 13.7 14.8 1.5 7.6 7.3 6.2 7.1
State Charter Schools Performance Evaluation, 2016/17
13
School Name Pct. Female Pct. White Pct. Black Pct.
Hispanic Pct. Other
Race Pct. FRL Pct. Direct
Cert Pct. LEP Pct. SWD Pct. Gifted
Ivy Prep. – Gwinnett 100.0 1.4 79.1 14.4 5.0 57.6 24.1 1.4 8.6 0.0
Ivy Prep. – Kirkwood 100.0 0.2 98.8 0.2 0.7 82.5 41 0.0 5.4 0.9
Liberty Tech 52.7 60.6 27.6 6.1 5.7 15.1 10.4 0.0 7.5 22.2
Mountain Ed. 45.8 82.1 3.7 12.2 2.0 100.0 24.9 3.0 15.8 0.0
Odyssey 44.8 51.0 29.1 12.1 7.7 34.8 15.4 4.9 14.4 13.4
Pataula 48.6 74.7 16.5 5.5 3.2 57.5 26.1 2.0 9.3 5.0
Scintilla 47.6 50.3 40.8 2.7 6.1 53.7 26.8 1.1 12.1 11.2
Southwest GA 50.6 72.3 14.5 8.4 4.8 0.0 44.9 0.0 12.0 0.0
Statesboro STEAM 44.6 75.0 20.3 2.0 2.7 61.5 22.3 0.0 15.5 15.5
Utopian 53.0 0.4 93.6 4.1 1.9 100.0 43.9 0.0 9.4 0.0
Note: For the purposes of this table, students who attended more than one school were attributed to the school where they attended the longest period of time during the school year. Percent other race includes Asian, Pacific Islander, American Indian, and multi race. The percentage of students in each of the component racial groups is less than five percent for each state charter school, except for International. Due to a lack of student-level FRL data, Foothills’ FRL percentage consists of students, identified by the school via school records, eligible for direct certification. Foothills’ FRL percentage consists of students identified as eligible for direct certification by school records and quality checked by GOSA.
Source: Individual-level student data from the GA•AWARDS system and school-level data on direct certification and school-wide subsidized lunch programs from the Governor’s Office of Student Achievement.

State Charter Schools Performance Evaluation, 2016/17
14
II. Results – All State Charters
A. Value-Added and Student Growth Model Estimates
There are two methods employed by states to evaluate the impact of schools on student achievement, value-added models and student growth percentile models. Each method has advantages and disadvantages relative to the other. The value-added approach compares the actual test score of each student to the score that is predicted for that student based on their prior-year scores and observable characteristics. In contrast, the student growth percentile method compares the current test scores of students with those of other students who had the same or similar history of past test scores. Differences in the observable characteristics are not explicitly taken into account in the student growth percentile method. Details of the value-added estimation are provided in Appendix. A thorough explanation of the student growth percentile model and how it compares to the value-added model are provided in Georgia Department of Education (2017). This report presents school performance estimates based on both approaches.
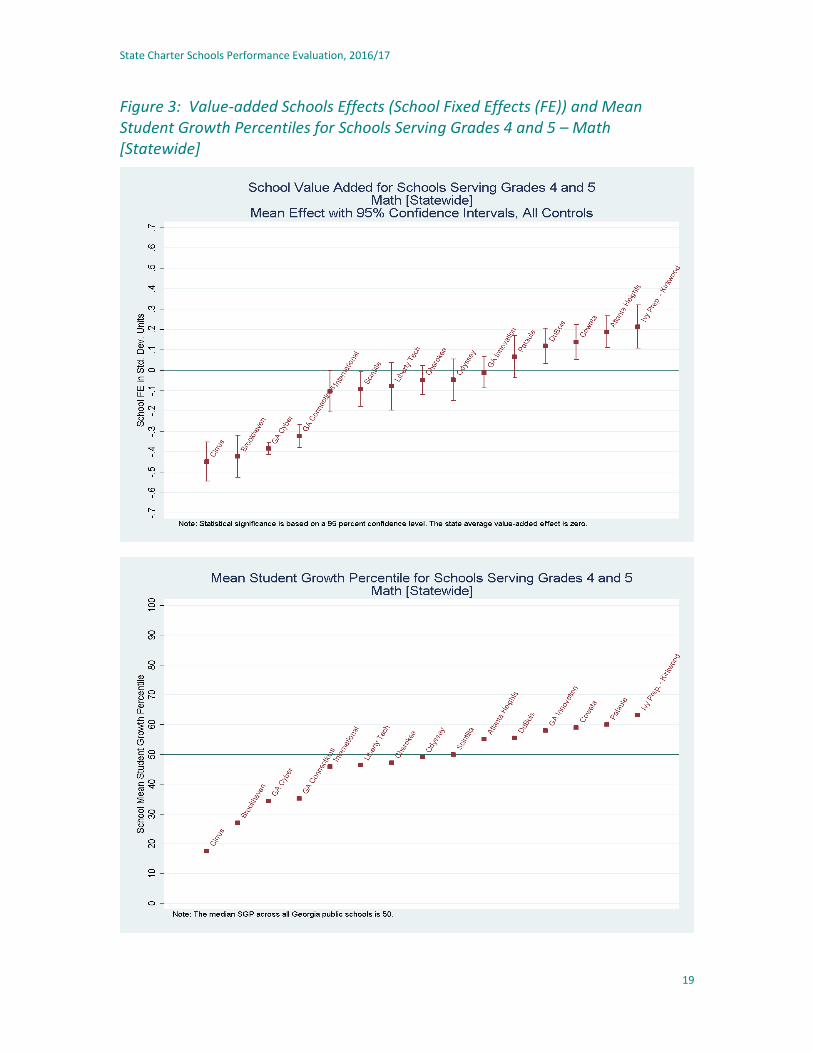
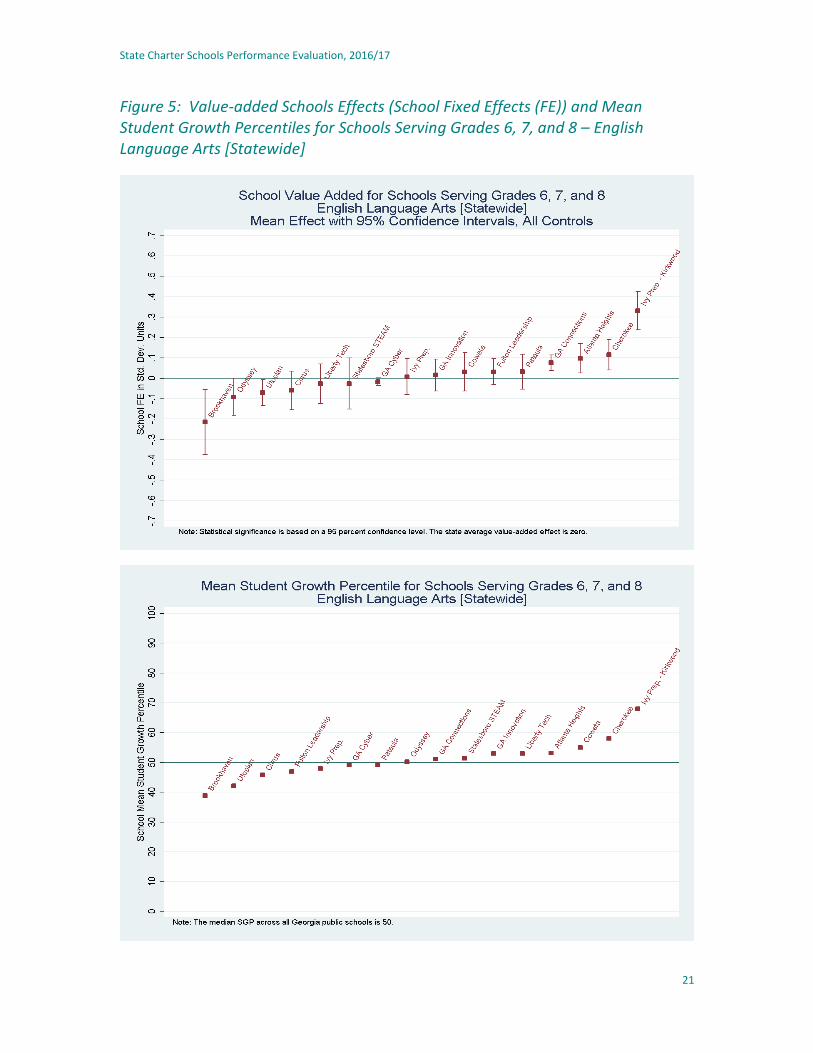
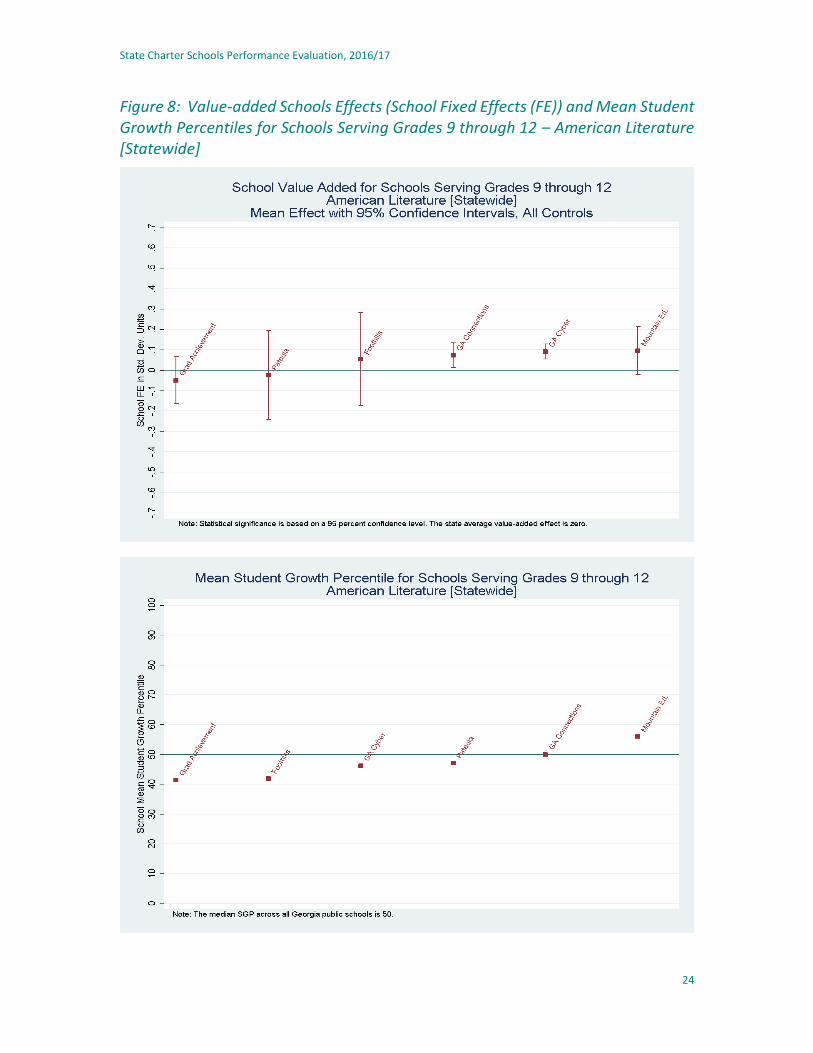
By construction, the average school (weighted by numbers of students) at a given grade grouping (elementary, middle or high school) in Georgia has a school effect of zero in the value-added model (controlling for individual and school-level student characteristics). The performance of each school in a given grade grouping is measured relative to this weighted average. Thus, a positive estimated value for an elementary school’s effect indicates that students attending that school experience greater growth in achievement than do students with the same observable characteristics at schools serving similar student populations. Negative values do not mean that the achievement of the school’s students fell during the year. Instead, a negative school effect indicates the gap between that school’s contribution to student achievement and the contribution of the average school serving a similar student population (measured in standard deviation units). For example, a value of -0.10 means that a school’s effect on student achievement is 0.10 standard deviations below that of the average of all schools in the state, where each school’s contribution is based on their student’s performance controlling for both individual-level student characteristics and prior test scores as well as school-level characteristics. In the same way, a value of 0.10 means that a school’s effect is 0.10 standard deviations above the average of all schools in the state, where each school is being compared to schools serving observationally similar student bodies. To put this in perspective, reducing class size in elementary grades by seven students is associated with a 0.10 to 0.20 standard deviation increase in student achievement (Whitehurst & Chingos (2011)) and the difference in the effectiveness of a first-year teacher and one with three years of experience is about 0.07 standard deviations (Dee & Wyckoff (2015)).
The value-added effects for schools are statistical estimates and carry some degree of uncertainty. Along with the estimated effects, the value-added model generates a measure of the uncertainty of each school’s effect, the estimated standard error. The estimated standard errors can be used to develop confidence intervals around each school’s estimated impact on student achievement. With a confidence interval of approximately plus-or-minus two standard errors, one can be 95 percent confident that the true school effect lies in that range. Thus, for example, if a school’s estimated effect is 0.50 and the standard error is 0.10, one can be 95 percent confident that the true effect lies in the range of 0.30 to 0.70. This information can then be used to determine how confident we are that a given school’s performance is above, below, or equal to the average school. The standard errors and confidence intervals will generally be smaller the larger the number of students per school. The estimated school effect on achievement will vary

State Charter Schools Performance Evaluation, 2016/17
15
with the performance of individual students. In a small school, random events like a student having a poor night’s sleep or getting “lucky” in his/her guesses on an exam will have a larger impact on the school’s overall effect, creating more uncertainty in the true school effect; whereas in a large school, such random events will tend to cancel out. Thus, for example, the Georgia Cyber Academy, which has the largest enrollment of any state charter school, correspondingly tends to have the smallest confidence interval.
Student growth percentiles measure where a student is in the distribution of current achievement relative to students with the same prior-year test score (or history of test scores). Thus, by definition, a score of 50 for a student indicates that about half of students with the same test score last year did better this year and about half did worse. School-level averages of student growth percentiles are reported below. The statewide school-level mean of SGPs is approximately equal to the statewide student median of 50, which provides a benchmark for comparing scores across schools.3 Unlike the value-added model, the student growth percentiles produced from Georgia’s student growth model do not include standard errors or confidence intervals.4 Without this information, one cannot quantify the likelihood that two schools with different mean SGPs are, in fact, different. Put differently, without this measure of precision, we cannot judge one school as superior to another based on SGPs alone.
For both the value-added and student growth models, separate estimates are presented for different grade groupings and for different subjects. In addition, an estimated effect on average performance across all subjects in each grade grouping is produced. Thus, for example, a charter serving grades K-8 receives two value-added scores in Math, one for its impact on Math achievement of students in elementary grades (grades 4 and 5) and another for its impact on students in middle grades (grades 6-8).
B. Summary of Findings
A total of 14 figures are presented. For both elementary grades and middle grades, there are three figures: one for Math, one for English language arts (ELA), and another for the cross-subject average of Math and ELA. Within each of these six figures is a graph depicting
3 For 2013/14, the Georgia Department of Education (GaDOE) computed student growth percentiles in two different ways. In the “cohort SGP” approach, statistical models are updated annually so that the median student receives a SGP of 50 each year. This means that the baseline is reset each year and (as with value-added measures), it is not possible to measure a general increase in student achievement gains across all students. In attempt to capture general changes over time in teacher effectiveness, the GaDOE also computed a “baseline-referenced SGP.” As the name implies, the baseline-referenced SGP uses the same model each year which was developed using a baseline cohort of students. This results in SGPs relative to the baseline cohort and, therefore, allows for the possibility of universal improvement in performance over time. However, as a consequence, the median baseline-referenced SGP does not necessarily equal 50. In 2013/14, cohort-referenced SGPs were used for EOCTs in math, but baseline-referenced SGPs were used for the CRCTs and all non-math EOCTs. Due to the adoption of the new Milestones exams, in 2014/15, only cohort-referenced SGPs were computed. See McCaffrey, Castellano and Lockwood (2014). 4 It is possible to compute standard errors for student growth percentiles, but there is no single accepted methodology for doing so and most state accountability systems that utilize student growth percentiles, including Georgia’s, do not report standard errors at this time. For a discussion of standard errors in the student growth model, see Doran, Swanlund and Lemke (2012) and American Institutes for Research (2012).

State Charter Schools Performance Evaluation, 2016/17
16
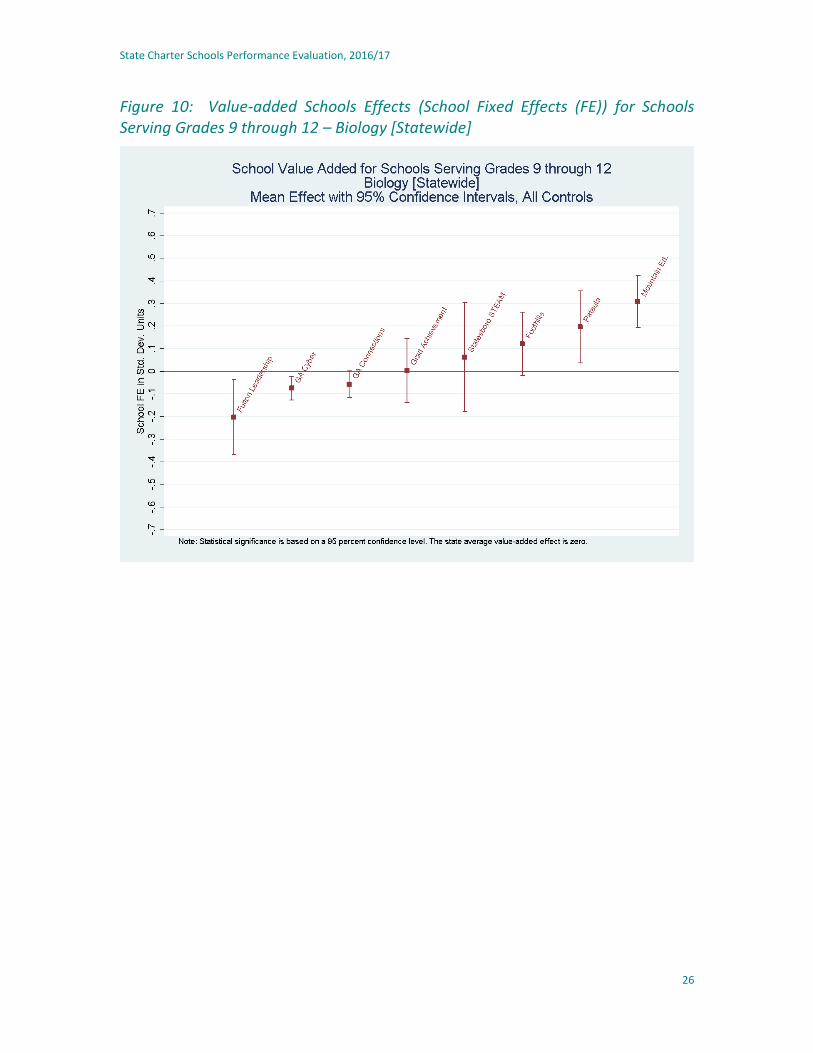
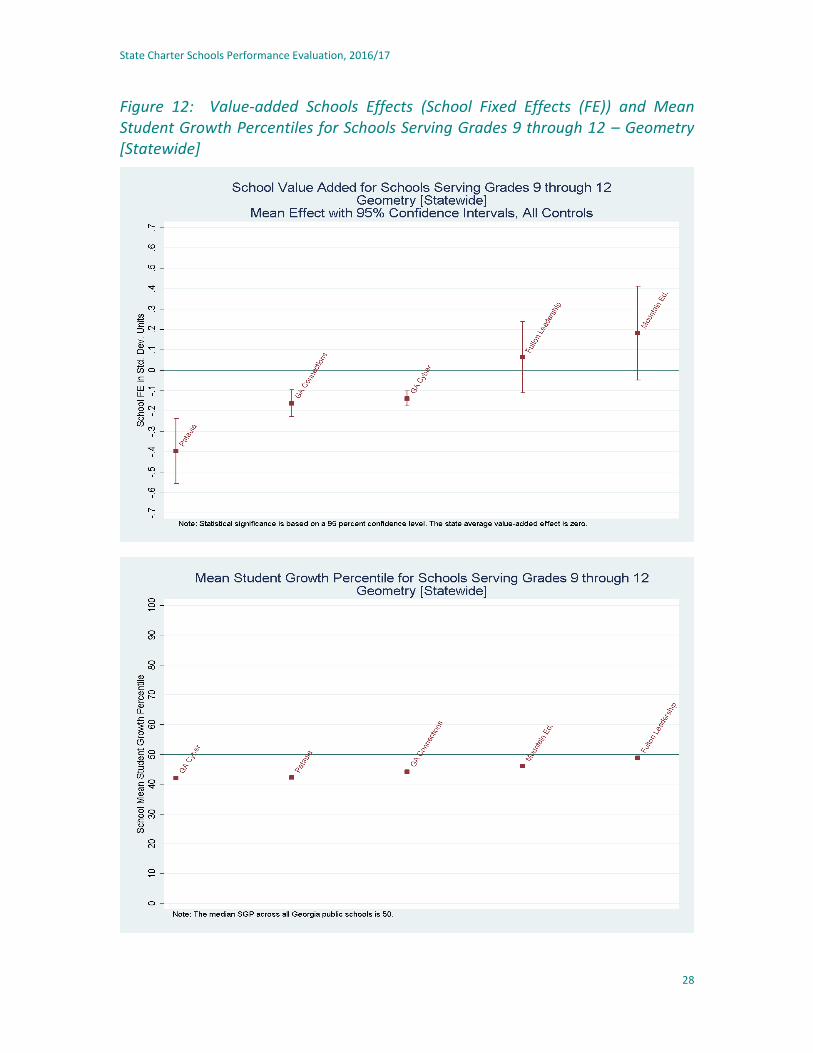
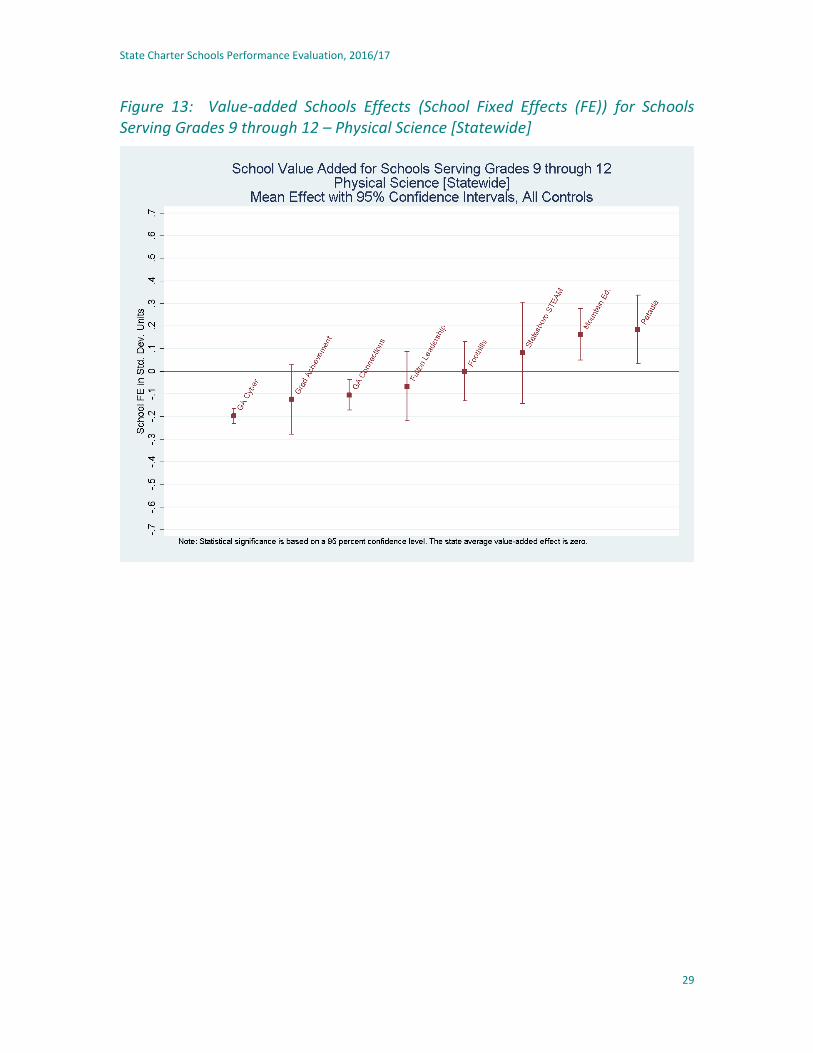
performance based on school value-added and another representing school-average student growth percentiles. In past years, up to five subject-specific scores were reported for elementary and middle grades, but reading-specific tests were dropped in 2015/16 and science and social studies tests were no longer given in consecutive grades in 2016/17. At the high school level, there are eight figures depicting school performance derived from student scores on end-of-course exams in 9th-Grade Literature, American Literature, Algebra 1, Biology, Economics, Geometry, Physical Science and U.S. History. 5 Among these courses, student growth percentiles are only available for 9th-Grade Literature, American Literature, Algebra 1 and Geometry.6
Based on value-added, the most common result was that state charters perform at a level that is not statistically different from the average of schools with similar student populations in Georgia. This is true in 6 of the 12 grade group/subject combinations: elementary ELA, middle school ELA, 9th Grade Literature, American Literature, Biology, and Physical Science. In five areas, the majority of state charters perform statistically worse than schools serving similar student populations: elementary Math, middle school Math, Algebra 1, Economics, and Geometry. In one area, U.S. History, half of the schools performed at a level that was not statistically different than the state, while half performed below the state. In none of the twelve areas was it most common for the state charters to outperform the state average. For both the elementary and middle school cross-subject averages, a plurality of state charter schools performed worse than the state average. The variation in effectiveness across subject areas could be due to a variety of factors, including teacher quality and instructional methods, which may vary across schools.7
The comparisons with state averages provide an overall picture of state charter school performance. More relevant are comparisons between individual state charter schools and other schools (both traditional public schools and local charters) in the geographic areas they serve. Following the 14 figures that combine results for all state charters, Section III presents individual school summaries as well as graphs comparing each school’s results with schools in the district it serves (where applicable).
5 Two other end-of-course exams were administered in 2016/17, Coordinate Algebra and Analytic Geometry. Estimates for these two tests are not reported because none of the 23 current SCSC schools had a sufficient number of students (15 or more) taking the exam to yield reliable VAM estimates. 6 The GaDOE chose to only compute student growth percentiles for end-of-course exams in math and ELA. 7 Cross-subject averages are not calculated because the grades at which exams are given vary across schools and the mix of exams for which there are sufficient numbers of test-takers may vary as well.

State Charter Schools Performance Evaluation, 2016/17
17
Figure 1: Value-added Schools Effects (School Fixed Effects (FE)) and Mean Student Growth Percentiles for Schools Serving Grades 4 and 5 – Average Across All Subjects [Statewide]

State Charter Schools Performance Evaluation, 2016/17
18
Figure 2: Value-added Schools Effects (School Fixed Effects (FE)) and Mean Student Growth Percentiles for Schools Serving Grades 4 and 5 – English Language Arts [Statewide]
State Charter Schools Performance Evaluation, 2016/17
19
Figure 3: Value-added Schools Effects (School Fixed Effects (FE)) and Mean Student Growth Percentiles for Schools Serving Grades 4 and 5 – Math [Statewide]

State Charter Schools Performance Evaluation, 2016/17
20
Figure 4: Value-added Schools Effects (School Fixed Effects (FE)) and Mean Student Growth Percentiles for Schools Serving Grades 6, 7, and 8 – Average Across All Subjects [Statewide]
State Charter Schools Performance Evaluation, 2016/17
21
Figure 5: Value-added Schools Effects (School Fixed Effects (FE)) and Mean Student Growth Percentiles for Schools Serving Grades 6, 7, and 8 – English Language Arts [Statewide]

State Charter Schools Performance Evaluation, 2016/17
22
Figure 6: Value-added Schools Effects (School Fixed Effects (FE)) and Mean Student Growth Percentiles for Schools Serving Grades 6, 7, and 8 – Mathematics [Statewide]

State Charter Schools Performance Evaluation, 2016/17
23
Figure 7: Value-added Schools Effects (School Fixed Effects (FE)) and Mean Student Growth Percentiles for Schools Serving Grades 9 through 12 – 9th Grade Literature [Statewide]
State Charter Schools Performance Evaluation, 2016/17
24
Figure 8: Value-added Schools Effects (School Fixed Effects (FE)) and Mean Student Growth Percentiles for Schools Serving Grades 9 through 12 – American Literature [Statewide]

State Charter Schools Performance Evaluation, 2016/17
25
Figure 9: Value-added Schools Effects (School Fixed Effects (FE)) and Mean Student Growth Percentiles for Schools Serving Grades 9 through 12 – Algebra 1 [Statewide]
State Charter Schools Performance Evaluation, 2016/17
26
Figure 10: Value-added Schools Effects (School Fixed Effects (FE)) for Schools Serving Grades 9 through 12 – Biology [Statewide]

State Charter Schools Performance Evaluation, 2016/17
27
Figure 11: Value-added Schools Effects (School Fixed Effects (FE)) for Schools Serving Grades 9 through 12 – Economics [Statewide]
State Charter Schools Performance Evaluation, 2016/17
28
Figure 12: Value-added Schools Effects (School Fixed Effects (FE)) and Mean Student Growth Percentiles for Schools Serving Grades 9 through 12 – Geometry [Statewide]
State Charter Schools Performance Evaluation, 2016/17
29
Figure 13: Value-added Schools Effects (School Fixed Effects (FE)) for Schools Serving Grades 9 through 12 – Physical Science [Statewide]

State Charter Schools Performance Evaluation, 2016/17
30
Figure 14: Value-added Schools Effects (School Fixed Effects (FE)) for Schools Serving Grades 9 through 12 – U.S. History [Statewide]
State Charter Schools Performance Evaluation, 2016/17
31
III. Results – Individual School Summaries The following tables summarize both state and district comparisons of performance for
each state charter school. Two estimates of school performance are reported, one based on the value-added model and the other derived from the student growth model. The value-added model includes a multitude of all available individual-level student characteristics (plus prior-year test scores) and the school-level percentages of students with disabilities, limited English proficiency students, and students who are “directly certified” as controls. One criticism of value-added models is they set different expectations for different students based on observable demographic characteristics. To gauge the impact of reducing or eliminating the set of demographic controls, two other value-added models were estimated. One alternative specification excludes individual student race/ethnicity and the other includes only individual-level lagged test scores and the school-level controls. Estimates from these two alternatives are presented in the Appendix. The student growth model yields individual student growth percentiles which are then averaged across students in a school to produce a mean student growth percentile measure of school performance.
For both the value-added and student growth percentile measures, a state percentile and a district rank are presented. The state percentile represents the proportion of schools in the state with a lower estimated school effect. Thus, for example, a state percentile of 60 means that 60 percent of schools in the relevant grade group rank below the school. District ranks represent the position of a school relative to other schools in the same district offering the same grade group. For example, a ranking of “25 out of 40” indicates that 24 schools from the relevant district have higher scores and 15 have lower scores. Schools with a statewide attendance zone have no district rank or district comparison.
For state charters with a less-than-statewide attendance zone, it is possible to compare their performance to traditional public schools and locally-approved charters in the same area. For nearly all state charter students, the relevant public school option is a school in the same district as the district served by their current school. Put differently, a within-district comparison shows how students would likely fare if a state charter were to close and a student then attended the average-performing school in the same district or multi-district area.
For both the value-added and student growth metrics, a comparison between a school’s performance in 2016/17 and its performance in 2014/15 and 2015/16 is provided. Estimates for all three years are based on the same general two-step value-added approach. The estimates for 2014/15 that were reported in the 2014/15 State Charter Schools Performance Reports use a one-step value-added modeling procedure and thus differ from the estimates reported here. Further, as noted above, due to data limitations, the construction of the direct certification measure in 2016/17 differs from that used in prior years.
Each school summary report is structured as follows:
• Key Findings • General Characteristics • School Demographics • Value-Added and SGP Results Summary by Grade Level and Subject • Comparison of Summary Results from 2014/15 through 2016/17 • Comparison of School Impact (for non-statewide schools only)

State Charter Schools Performance Evaluation, 2016/17
Atlanta Heights Charter School
32
Atlanta Heights Charter School
Key Findings
• The value-added estimate of the school’s impact on a student’s average achievement across all subjects is 0.0980 in elementary grades and 0.0898 in middle grades.
• Atlanta Heights Charter School’s impact on student achievement is statistically higher than the state average in elementary grades and middle grades, but not statistically different than the district in elementary or middle grades.
• Atlanta Heights Charter School’s 2016/17 performance in elementary and middle grades is generally similar to its performance in 2015/16.
• The school’s contribution to student achievement is: o above the district and state average in elementary school Math; o above the state average in middle school ELA and middle school Math, but indistinguishable from the district average; and o indistinguishable from the district and state average in elementary school ELA.
General Characteristics
School Name Calendar
Year Opened
EMO Affiliation
Grades Curriculum Focus School Year Single-Gender School
Virtual/ Online School
Serves Multiple Districts
Parental Involvement Requirement
Enrollment Restrictions
Atlanta Heights 2010 National Heritage
Academies K-8 None Normal No No No Not Specified
Students residing in
Atlanta Public
Schools Zone
Students Served
School Name Pct. Female Pct. White Pct. Black Pct.
Hispanic Pct. Other
Race Pct. FRL Pct. Direct
Cert Pct. LEP Pct. SWD Pct. Gifted
Atlanta Heights 49.6 0.1 97.3 1.9 0.7 93.5 65.4 2.0 9.7 0.0

State Charter Schools Performance Evaluation, 2016/17
Atlanta Heights Charter School
33
Value-Added and SGP Results Summary by Grade Level and Subject
Overall School Effect: 0.0980 Elementary / 0.0898 Middle Average Overall School Effect in District: 0.0517 Elementary / 0.0380 Middle Atlanta Heights’s contribution to an elementary and middle school student’s average achievement across ELA and Math is higher than the state average, but indistinguishable from its district. It is important to note that averaging achievement scores across subjects masks any variation in school performance between subject areas. As a result, the table below also includes the school’s effect on student achievement in each subject area.
Value-Added (Controls for Student Demographics and Prior Test Scores)
Student Growth Percentiles (Controls only for Prior Test Scores)
Grade Level and Subject School Effect
State Percentile (higher is
better)
Statistically Different from
State Average?
District Rank (lower is better)
District Average
Statistically Different from
District Average?
School Mean of Individual
SGPs
State Percentile (higher is
better)
District Rank (lower is better)
Elementary
ELA 0.0068 52 No 30 of 58 0.0202 No 50 49 20 of 58
Math 0.1884 92 Higher 18 of 58 0.0836 Higher 55 72 18 of 58
All-Subject Average 0.0980 83 Higher 20 of 58 0.0517 No 53 64 19 of 58
Middle
ELA 0.0975 88 Higher 4 of 22 0.0423 No 53 77 3 of 22
Math 0.0867 77 Higher 8 of 22 0.0364 No 49 43 12 of 22
All-Subject Average 0.0898 85 Higher 6 of 22 0.0380 No 51 56 7 of 22
High
9th Grade Literature
American Literature
Algebra 1
Biology
Economics

State Charter Schools Performance Evaluation, 2016/17
Atlanta Heights Charter School
34
Value-Added (Controls for Student Demographics and Prior Test Scores)
Student Growth Percentiles (Controls only for Prior Test Scores)
Grade Level and Subject School Effect
State Percentile (higher is
better)
Statistically Different from
State Average?
District Rank (lower is better)
District Average
Statistically Different from
District Average?
School Mean of Individual
SGPs
State Percentile (higher is
better)
District Rank (lower is better)
Geometry
Physical Science
U.S. History
Note: Statistical significance is based on a 95 percent confidence level. The state average value-added effect is zero. The district average represents the simple average of the school effects of all schools in the relevant district or set of districts. Schools with a statewide attendance zone are compared to the state average and, thus, have no comparison district.
Comparison of 2016/17, 2015/16, and 2014/15 Value-Added and SGP Summary Results
Atlanta Height’s performance in middle and elementary grades has been relatively constant over the last three years. Performance in elementary ELA, elementary Math, middle school ELA, and middle school Math is similar to performance in the 2015/16 school year.
Value-Added
(Controls for Student Demographics and Prior Test Scores)
2014/15 2015/16 2016/17*
Grade Level and Subject
School Effect
Statistically Different
from State Average?
District Average
Statistically Different
from District Average?
School Effect
Statistically Different
from State Average?
District Average
Statistically Different
from District Average?
School Effect
Statistically Different
from State Average?
District Average
Statistically Different
from District Average?
Elementary
ELA 0.0127 No 0.1071 Lower -0.0657 No 0.0601 Lower 0.0068 No 0.0202 No
Math 0.1523 Higher 0.0481 Higher 0.1940 Higher 0.0270 Higher 0.1884 Higher 0.0836 Higher
Science -0.0968 Lower -0.0075 Lower -0.0107 No -0.0056 No
Social Studies -0.0013 No 0.0270 No -0.0607 No 0.0219 No
All-Subject Average 0.0173 No 0.0437 No 0.0145 No 0.0257 No 0.0980 Higher 0.0517 No

State Charter Schools Performance Evaluation, 2016/17
Atlanta Heights Charter School
35
Value-Added
(Controls for Student Demographics and Prior Test Scores)
2014/15 2015/16 2016/17*
Grade Level and Subject
School Effect
Statistically Different
from State Average?
District Average
Statistically Different
from District Average?
School Effect
Statistically Different
from State Average?
District Average
Statistically Different
from District Average?
School Effect
Statistically Different
from State Average?
District Average
Statistically Different
from District Average?
Middle
ELA 0.1581 Higher 0.0989 No 0.1038 Higher 0.0352 No 0.0975 Higher 0.0423 No
Math 0.0080 No 0.0505 No 0.1963 Higher -0.0090 Higher 0.0867 Higher 0.0364 No
Science 0.0520 No 0.0072 No -0.0269 No -0.0590 No
Social Studies -0.0910 Lower 0.0313 Lower -0.0611 No -0.0187 No
All-Subject Average 0.0332 No 0.0473 No 0.0489 No -0.0165 Higher 0.0898 Higher 0.0380 No
High
9th Grade Literature
American Literature
Analytic Geometry
Algebra 1
Biology
Coordinate Algebra
Economics
Geometry
Physical Science
U.S. History
Note: Statistical significance is based on a 95 percent confidence level. The state average value-added effect is zero. The district average represents the simple average of the school effects of all schools in the relevant district or set of districts. Schools with a statewide attendance zone are compared to the state average and, thus, have no comparison district.
*For 2016/17 the school-level measure of "Direct Certification" employed in the value-added calculations differs from the measure employed in prior years. Direct Certification represents students who either live in a family unit receiving SNAP benefits, live in family unit receiving TANF benefits, are identified as homeless, are in foster care or are migrant. Due to data limitations, students in foster care were not included in the direct certification tally in 2016/17.

State Charter Schools Performance Evaluation, 2016/17
Atlanta Heights Charter School
36
Student Growth Percentiles
(Controls only for Prior Test Scores)
2014/15 2015/16 2016/17
Grade Level and Subject School Mean of
Individual SGPs
State Percentile (higher is
better)
District Rank (lower
is better)
School Mean of
Individual SGPs
State Percentile (higher is
better)
District Rank (lower
is better)
School Mean of
Individual SGPs
State Percentile (higher is
better)
District Rank (lower
is better)
Elementary
ELA 46 29 49 of 58 40 6 56 of 58 50 49 20 of 58
Math 53 63 17 of 58 51 55 21 of 58 55 72 18 of 58
Science 41 12 49 of 58 47 38 25 of 58
Social Studies 40 12 39 of 58 35 6 51 of 58
All-Subject Average 45 21 40 of 58 43 18 42 of 58 53 64 19 of 58
Middle
ELA 54 80 11 of 25 48 36 15 of 24 53 77 3 of 22
Math 45 23 15 of 25 56 82 3 of 24 49 43 12 of 22
Science 47 32 15 of 25 46 30 9 of 24
Social Studies 50 46 12 of 25 47 36 13 of 24
All-Subject Average 49 42 11 of 25 49 50 5 of 24 51 56 7 of 22
High
9th Grade Literature
American Literature
Analytic Geometry
Algebra 1
Biology
Coordinate Algebra
Economics
Geometry
Physical Science

State Charter Schools Performance Evaluation, 2016/17
Atlanta Heights Charter School
37
Student Growth Percentiles
(Controls only for Prior Test Scores)
2014/15 2015/16 2016/17
Grade Level and Subject School Mean of
Individual SGPs
State Percentile (higher is
better)
District Rank (lower
is better)
School Mean of
Individual SGPs
State Percentile (higher is
better)
District Rank (lower
is better)
School Mean of
Individual SGPs
State Percentile (higher is
better)
District Rank (lower
is better)
U.S. History
Note: Schools with a statewide attendance zone are compared to the state average and, thus, have no comparison district.

State Charter Schools Performance Evaluation, 2016/17
Atlanta Heights Charter School
38
Comparison of School Impact
Subject Area: All-Subject Elementary Average State Charter: Atlanta Heights Comparison District: Atlanta Public Schools

State Charter Schools Performance Evaluation, 2016/17
Atlanta Heights Charter School
39
Subject Area: Elementary ELA State Charter: Atlanta Heights Comparison District: Atlanta Public Schools

State Charter Schools Performance Evaluation, 2016/17
Atlanta Heights Charter School
40
Subject Area: Elementary Mathematics State Charter: Atlanta Heights Comparison District: Atlanta Public Schools

State Charter Schools Performance Evaluation, 2016/17
Atlanta Heights Charter School
41
Subject Area: All-Subject Middle Average State Charter: Atlanta Heights Comparison District: Atlanta Public Schools

State Charter Schools Performance Evaluation, 2016/17
Atlanta Heights Charter School
42
Subject Area: Middle ELA State Charter: Atlanta Heights Comparison District: Atlanta Public Schools

State Charter Schools Performance Evaluation, 2016/17
Atlanta Heights Charter School
43
Subject Area: Middle Math State Charter: Atlanta Heights Comparison District: Atlanta Public Schools

State Charter Schools Performance Evaluation, 2016/17
Brookhaven Innovation Academy
44
Brookhaven Innovation Academy
Key Findings
• The value-added estimate of the school’s impact on a student’s average achievement across all subjects is -0.2535 in elementary grades and -0.2517 in middle grades.
• Brookhaven Innovation Academy’s impact on student achievement is statistically below the state average in elementary grades and middle grades.
• Brookhaven Innovation Academy’s first year in operation is 2016/17, so it is not possible to make year-to-year performance
assessments.
• The school’s contribution to student achievement is: o below the state average in elementary Math, middle school Math, and middle school ELA; and o indistinguishable from the state average in elementary ELA.
General Characteristics
School Name Calendar
Year Opened
EMO Affiliation
Grades Curriculum Focus School Year Single-Gender School
Virtual/ Online School
Serves Multiple Districts
Parental Involvement Requirement
Enrollment Restrictions
Brookhaven Innovation Academy
2016 No K-6
Compass Learning: cross-curricula, STEM-focused; project-based
K-8 coding curriculum
Extended Day/Year
No No Yes Not Specified Students
residing in State of GA
Students Served
School Name Pct. Female Pct. White Pct. Black Pct.
Hispanic Pct. Other
Race Pct. FRL Pct. Direct
Cert Pct. LEP Pct. SWD Pct. Gifted
Brookhaven 46.0 43.0 26.9 19.4 10.7 12.2 11.3 11.9 8.7 0.0

State Charter Schools Performance Evaluation, 2016/17
Brookhaven Innovation Academy
45
Value-Added and SGP Results Summary by Grade Level and Subject
Overall School Effect: -0.2535 Elementary / -0.2517 Middle Brookhaven Innovation Academy’s contribution to an elementary student’s average achievement across ELA and Math is statistically below the average elementary school in the state. Similarly, its contribution to a middle school student’s average achievement across ELA and Math is statistically below the average middle school in the state. It is important to note that averaging achievement scores across subjects masks any variation in school performance between subject areas. As a result, the table below also includes the school’s effect on student achievement in each subject area.
Value-Added (Controls for Student Demographics and Prior Test Scores)
Student Growth Percentiles (Controls only for Prior Test Scores)
Grade Level and Subject School Effect
State Percentile (higher is
better)
Statistically Different from
State Average?
District Rank (lower is better)
District Average
Statistically Different from
District Average?
School Mean of Individual
SGPs
State Percentile (higher is
better)
District Rank (lower is better)
Elementary
ELA -0.0849 17 No 43 13
Math -0.4218 1 Lower 27 1
All-Subject Average -0.2535 1 Lower 35 1
Middle
ELA -0.2142 1 Lower 39 2
Math -0.2744 2 Lower 34 2
All-Subject Average -0.2517 1 Lower 36 1
High
9th Grade Literature
American Literature
Algebra 1
Biology

State Charter Schools Performance Evaluation, 2016/17
Brookhaven Innovation Academy
46
Value-Added (Controls for Student Demographics and Prior Test Scores)
Student Growth Percentiles (Controls only for Prior Test Scores)
Grade Level and Subject School Effect
State Percentile (higher is
better)
Statistically Different from
State Average?
District Rank (lower is better)
District Average
Statistically Different from
District Average?
School Mean of Individual
SGPs
State Percentile (higher is
better)
District Rank (lower is better)
Economics
Geometry
Physical Science
U.S. History
Note: Statistical significance is based on a 95 percent confidence level. The state average value-added effect is zero. The district average represents the simple average of the school effects of all schools in the relevant district or set of districts. Schools with a statewide attendance zone are compared to the state average and, thus, have no comparison district.
Comparison of 2016/17, 2015/16, and 2014/15 Value-Added and SGP Summary Results
Brookhaven Innovation Academy’s first year in operation is 2016/17, so it is not possible to make year-to-year performance assessments.

State Charter Schools Performance Evaluation, 2016/17
47 Cherokee Charter Academy
Cherokee Charter Academy
Key Findings
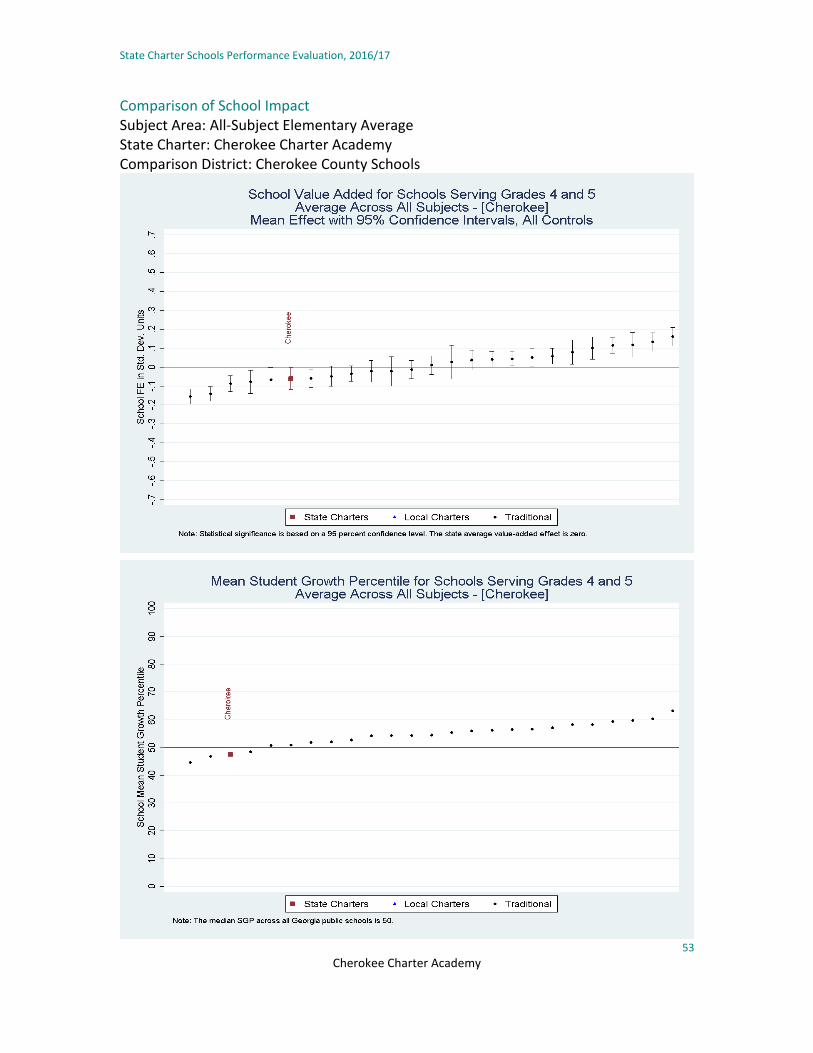
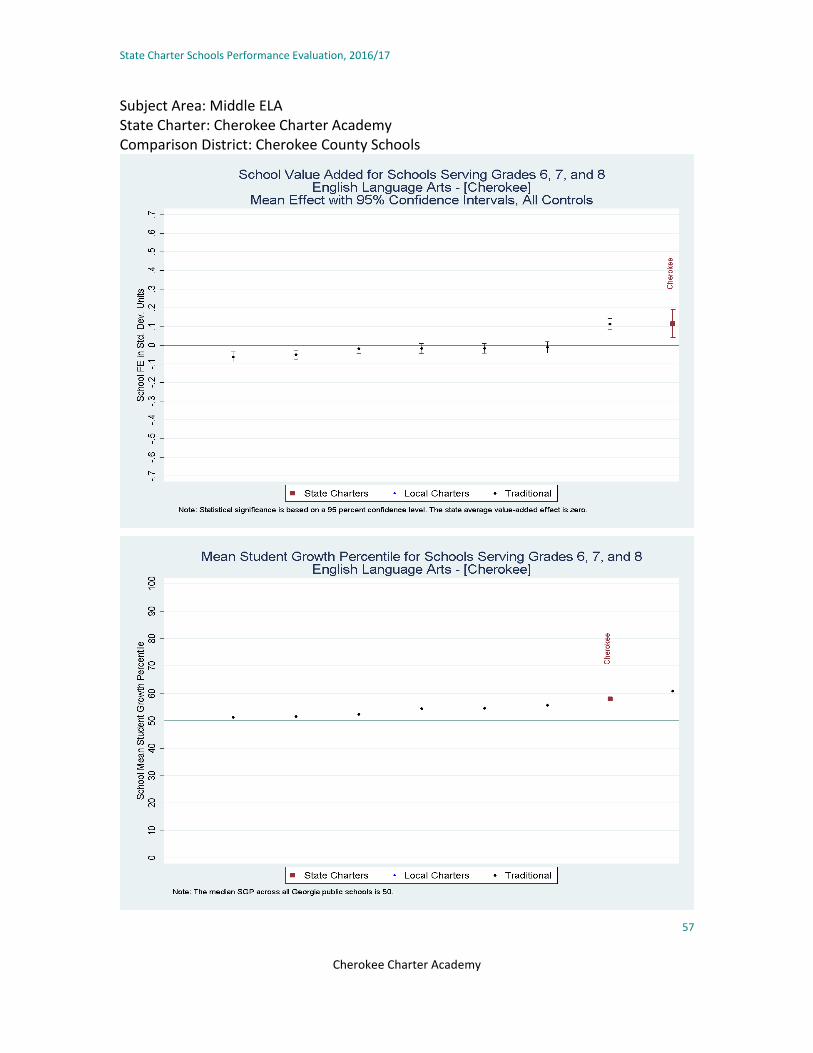
• The value-added estimate of the school’s impact on a student’s average achievement across all subjects is -0.0602 in elementary grades and 0.0016 in middle grades.
• Cherokee Charter Academy’s performance is not statistically different from state and district averages in middle school grades, but is below the state average and district average in elementary grades.
• Cherokee Charter Academy’s achievement in 2016/17 is generally similar to its performance in 2014/15 and 2015/16. The 2016/17 middle school ELA and elementary Math performance improved relative to 2015/16, but elementary ELA declined.
• The school’s contribution to student achievement is: o lower than the state average in elementary ELA and middle school Math, but indistinguishable from the district average; o indistinguishable from the state average in elementary Math, but below the district average; and o higher than the state and district averages in middle grade ELA.
General Characteristics
School Name Calendar
Year Opened
EMO Affiliation
Grades Curriculum Focus School Year Single-Gender School
Virtual/ Online School
Serves Multiple Districts
Parental Involvement Requirement
Enrollment Restrictions
Cherokee Charter
Academy 2011
Charter Schools
USA K-8 None Normal No No No
20 hours volunteer/year
for one child, 30 hours/year for more than one
child
Students residing in Cherokee
County Public Schools Zone
Students Served
School Name Pct. Female Pct. White Pct. Black Pct.
Hispanic Pct. Other
Race Pct. FRL Pct. Direct
Cert Pct. LEP Pct. SWD Pct. Gifted
Cherokee 49.1 72.1 19.5 3.4 4.9 23.5 13.7 3.1 11.7 6.4

State Charter Schools Performance Evaluation, 2016/17
Cherokee Charter Academy
48
Value-Added and SGP Results Summary by Grade Level and Subject
Overall School Effect: -0.0602 Elementary / 0.0016 Middle Average Overall School Effect in District: 0.0080 Elementary / -0.0253 Middle Cherokee Charter Academy’s contribution to an elementary student’s average achievement across Math and ELA is lower than that of the average elementary school in the state and district. Its contribution to a middle school student’s cross-subject average achievement is not statistically different from the average middle school in the state and district. It is important to note that averaging achievement scores across subjects masks any variation in school performance between subject areas. As a result, the table below also includes the school’s effect on student achievement in each subject area.
Value-Added (Controls for Student Demographics and Prior Test Scores)
Student Growth Percentiles (Controls only for Prior Test Scores)
Grade Level and Subject
School Effect
State Percentile (higher is better)
Statistically Different from State Average?
District Rank
(lower is better)
District Average
Statistically Different from
District Average?
School Mean of Individual SGPs
State Percentile (higher is better)
District Rank
(lower is better)
Elementary
ELA -0.0756 19 Lower 19 of 25 -0.0354 No 48 34 22 of 25
Math -0.0480 35 No 21 of 25 0.0509 Lower 47 37 23 of 25
All-Subject Average -0.0602 25 Lower 20 of 25 0.0080 Lower 47 33 23 of 25
Middle
ELA 0.1154 92 Higher 1 of 8 0.0066 Higher 58 94 2 of 8
Math -0.0953 21 Lower 7 of 8 -0.0528 No 51 57 5 of 8
All-Subject Average 0.0016 50 No 3 of 8 -0.0253 No 54 78 3 of 8
High
9th Grade Literature
American Literature

State Charter Schools Performance Evaluation, 2016/17
Cherokee Charter Academy
49
Value-Added (Controls for Student Demographics and Prior Test Scores)
Student Growth Percentiles (Controls only for Prior Test Scores)
Grade Level and Subject
School Effect
State Percentile (higher is better)
Statistically Different from State Average?
District Rank
(lower is better)
District Average
Statistically Different from
District Average?
School Mean of Individual SGPs
State Percentile (higher is better)
District Rank
(lower is better)
Algebra 1
Biology
Economics
Geometry
Physical Science
U.S. History
Note: Statistical significance is based on a 95 percent confidence level. The state average value-added effect is zero. The district average represents the simple average of the school effects of all schools in the relevant district or set of districts. Schools with a statewide attendance zone are compared to the state average and, thus, have no comparison district.

State Charter Schools Performance Evaluation, 2016/17
Cherokee Charter Academy
50
Comparison of 2016/17, 2015/16, and 2014/15 Value-Added and SGP Summary Results
Cherokee Charter Academy’s overall performance in elementary grades has been relatively constant over time. The 2016/17 middle school ELA and elementary Math performance improved relative to 2015/16, but elementary ELA declined.
Value-Added
(Controls for Student Demographics and Prior Test Scores)
2014/15 2015/16 2016/17*
Grade Level and Subject
School Effect
Statistically Different
from State Average?
District Average
Statistically Different
from District Average?
School Effect
Statistically Different
from State Average?
District Average
Statistically Different
from District Average?
School Effect
Statistically Different
from State Average?
District Average
Statistically Different
from District Average?
Elementary
ELA 0.0050 No -0.0971 Higher 0.0021 No -0.0189 No -0.0756 Lower -0.0354 No
Math -0.1566 Lower 0.0061 Lower -0.0826 Lower 0.0354 Lower -0.0480 No 0.0509 Lower
Science -0.0813 Lower -0.0178 No 0.0006 No 0.0342 No
Social Studies -0.1065 Lower -0.0433 No 0.0787 Higher 0.0275 No
All-Subject Average -0.0779 Lower -0.0375 No -0.0009 No 0.0189 No -0.0602 Lower 0.0080 Lower
Middle
ELA 0.0984 Higher 0.0040 Higher -0.0969 Lower 0.0439 Lower 0.1154 Higher 0.0066 Higher
Math -0.0221 No 0.0249 No -0.2120 Lower -0.0093 Lower -0.0953 Lower -0.0528 No
Science 0.0325 No -0.0564 Higher -0.0727 No -0.0409 No
Social Studies 0.0210 No -0.0770 Higher 0.0014 No 0.0222 No
All-Subject Average 0.0298 No -0.0238 Higher -0.1008 Lower 0.0049 Lower 0.0016 No -0.0253 No
High
9th Grade Literature
American Literature
Analytic Geometry
Algebra 1

State Charter Schools Performance Evaluation, 2016/17
Cherokee Charter Academy
51
Value-Added
(Controls for Student Demographics and Prior Test Scores)
2014/15 2015/16 2016/17*
Grade Level and Subject
School Effect
Statistically Different
from State Average?
District Average
Statistically Different
from District Average?
School Effect
Statistically Different
from State Average?
District Average
Statistically Different
from District Average?
School Effect
Statistically Different
from State Average?
District Average
Statistically Different
from District Average?
Biology
Coordinate Algebra
Economics
Geometry
Physical Science
U.S. History
Note: Statistical significance is based on a 95 percent confidence level. The state average value-added effect is zero. The district average represents the simple average of the school effects of all schools in the relevant district or set of districts. Schools with a statewide attendance zone are compared to the state average and, thus, have no comparison district.
*For 2016/17 the school-level measure of "Direct Certification" employed in the value-added calculations differs from the measure employed in prior years. Direct Certification represents students who either live in a family unit receiving SNAP benefits, live in family unit receiving TANF benefits, are identified as homeless, are in foster care or are migrant. Due to data limitations, students in foster care were not included in the direct certification tally in 2016/17.
Student Growth Percentiles
(Controls only for Prior Test Scores)
2014/15 2015/16 2016/17
Grade Level and Subject
School Mean of Individual
SGPs
State Percentile (higher is better)
District Rank (lower
is better)
School Mean of Individual
SGPs
State Percentile (higher is better)
District Rank (lower
is better)
School Mean of Individual
SGPs
State Percentile (higher is better)
District Rank (lower
is better)
Elementary
ELA 50 51 4 of 25 53 72 10 of 25 48 34 22 of 25
Math 47 40 22 of 25 50 51 22 of 25 47 37 23 of 25

State Charter Schools Performance Evaluation, 2016/17
Cherokee Charter Academy
52
Student Growth Percentiles
(Controls only for Prior Test Scores)
2014/15 2015/16 2016/17
Grade Level and Subject
School Mean of Individual
SGPs
State Percentile (higher is better)
District Rank (lower
is better)
School Mean of Individual
SGPs
State Percentile (higher is better)
District Rank (lower
is better)
School Mean of Individual
SGPs
State Percentile (higher is better)
District Rank (lower
is better)
Science 47 35 19 of 25 52 59 19 of 25
Social Studies 45 30 20 of 25 57 77 13 of 25
All-Subject Average 47 34 20 of 25 53 67 17 of 25 47 33 23 of 25
Middle
ELA 53 76 3 of 13 45 22 12 of 12 58 94 2 of 8
Math 55 74 8 of 13 47 40 12 of 12 51 57 5 of 8
Science 51 61 6 of 13 48 41 10 of 12
Social Studies 49 45 9 of 13 54 76 8 of 12
All-Subject Average 52 69 5 of 13 48 42 11 of 12 54 78 3 of 8
High
9th Grade Literature
American Literature
Analytic Geometry
Algebra 1
Biology
Coordinate Algebra
Economics
Geometry
Physical Science
U.S. History
Note: Schools with a statewide attendance zone are compared to the state average and, thus, have no comparison district.
State Charter Schools Performance Evaluation, 2016/17
53 Cherokee Charter Academy
Comparison of School Impact Subject Area: All-Subject Elementary Average State Charter: Cherokee Charter Academy Comparison District: Cherokee County Schools

State Charter Schools Performance Evaluation, 2016/17
Cherokee Charter Academy
54
Subject Area: Elementary ELA
State Charter: Cherokee Charter Academy Comparison District: Cherokee County Schools

State Charter Schools Performance Evaluation, 2016/17
Cherokee Charter Academy
55
Subject Area: Elementary Mathematics State Charter: Cherokee Charter Academy Comparison District: Cherokee County Schools

State Charter Schools Performance Evaluation, 2016/17
Cherokee Charter Academy
56
Subject Area: All-Subject Middle Average State Charter: Cherokee Charter Academy Comparison District: Cherokee County Schools
State Charter Schools Performance Evaluation, 2016/17
Cherokee Charter Academy
57
Subject Area: Middle ELA
State Charter: Cherokee Charter Academy Comparison District: Cherokee County Schools

State Charter Schools Performance Evaluation, 2016/17
Cherokee Charter Academy
58
Subject Area: Middle Mathematics State Charter: Cherokee Charter Academy Comparison District: Cherokee County Schools
State Charter Schools Performance Evaluation, 2016/17
59 Cirrus Academy Charter
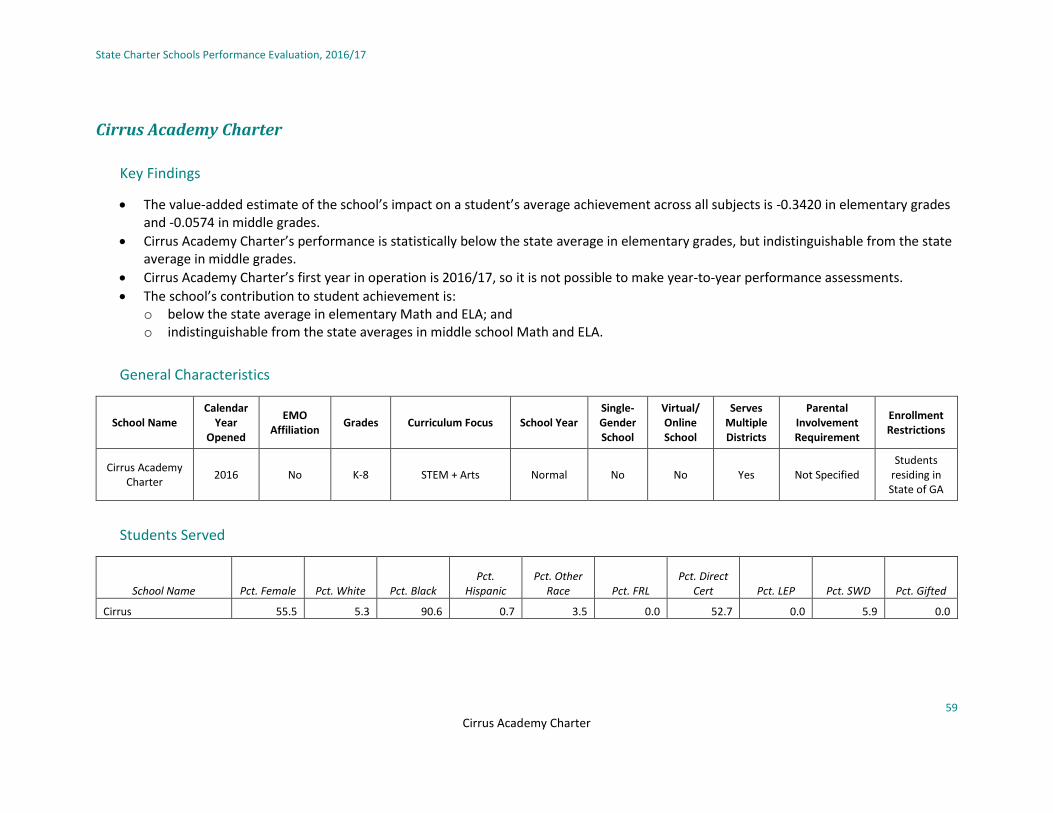
Cirrus Academy Charter
Key Findings
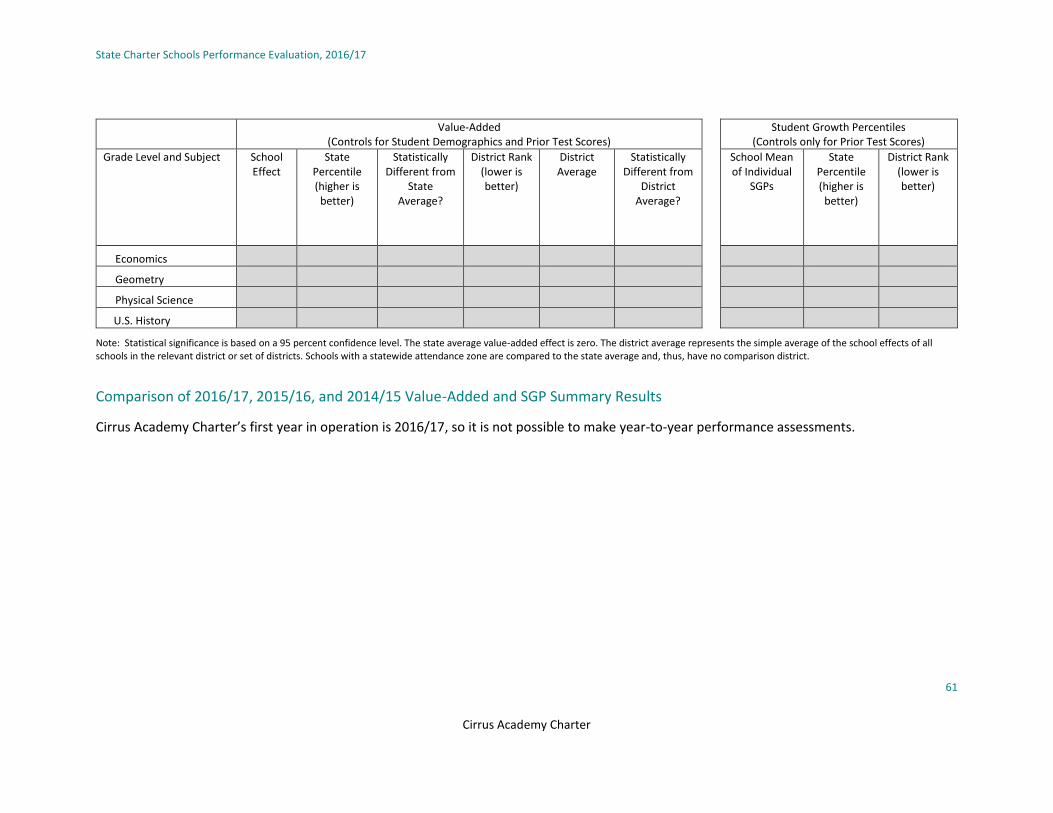
• The value-added estimate of the school’s impact on a student’s average achievement across all subjects is -0.3420 in elementary grades and -0.0574 in middle grades.
• Cirrus Academy Charter’s performance is statistically below the state average in elementary grades, but indistinguishable from the state average in middle grades.
• Cirrus Academy Charter’s first year in operation is 2016/17, so it is not possible to make year-to-year performance assessments.
• The school’s contribution to student achievement is: o below the state average in elementary Math and ELA; and o indistinguishable from the state averages in middle school Math and ELA.
General Characteristics
School Name Calendar
Year Opened
EMO Affiliation
Grades Curriculum Focus School Year Single-Gender School
Virtual/ Online School
Serves Multiple Districts
Parental Involvement Requirement
Enrollment Restrictions
Cirrus Academy Charter
2016 No K-8 STEM + Arts Normal No No Yes Not Specified Students
residing in State of GA
Students Served
School Name Pct. Female Pct. White Pct. Black Pct.
Hispanic Pct. Other
Race Pct. FRL Pct. Direct
Cert Pct. LEP Pct. SWD Pct. Gifted
Cirrus 55.5 5.3 90.6 0.7 3.5 0.0 52.7 0.0 5.9 0.0

State Charter Schools Performance Evaluation, 2016/17
Cirrus Academy Charter
60
Value-Added and SGP Results Summary by Grade Level and Subject
Overall School Effect: -0.3420 Elementary / -0.0574 Middle Cirrus Academy Charter’s contribution to an elementary student’s average achievement across ELA and Math is statistically below the average elementary school in the state. Its contribution to a middle school student’s cross-subject average achievement is indistinguishable from the average middle school in the state. It is important to note that averaging achievement scores across subjects masks any variation in school performance between subject areas. As a result, the table below also includes the school’s effect on student achievement in each subject area.
Value-Added (Controls for Student Demographics and Prior Test Scores)
Student Growth Percentiles (Controls only for Prior Test Scores)
Grade Level and Subject School Effect
State Percentile (higher is
better)
Statistically Different from
State Average?
District Rank (lower is better)
District Average
Statistically Different from
District Average?
School Mean of Individual
SGPs
State Percentile (higher is
better)
District Rank (lower is better)
Elementary
ELA -0.2369 2 Lower 37 2
Math -0.4479 1 Lower 18 1
All-Subject Average -0.3420 1 Lower 27 1
Middle
ELA -0.0599 20 No 46 20
Math -0.0292 39 No 46 30
All-Subject Average -0.0574 25 No 46 23
High
9th Grade Literature
American Literature
Algebra 1
Biology
State Charter Schools Performance Evaluation, 2016/17
Cirrus Academy Charter
61
Value-Added (Controls for Student Demographics and Prior Test Scores)
Student Growth Percentiles (Controls only for Prior Test Scores)
Grade Level and Subject School Effect
State Percentile (higher is
better)
Statistically Different from
State Average?
District Rank (lower is better)
District Average
Statistically Different from
District Average?
School Mean of Individual
SGPs
State Percentile (higher is
better)
District Rank (lower is better)
Economics
Geometry
Physical Science
U.S. History
Note: Statistical significance is based on a 95 percent confidence level. The state average value-added effect is zero. The district average represents the simple average of the school effects of all schools in the relevant district or set of districts. Schools with a statewide attendance zone are compared to the state average and, thus, have no comparison district.
Comparison of 2016/17, 2015/16, and 2014/15 Value-Added and SGP Summary Results
Cirrus Academy Charter’s first year in operation is 2016/17, so it is not possible to make year-to-year performance assessments.

State Charter Schools Performance Evaluation, 2016/17
62 Coweta Charter Academy
Coweta Charter Academy
Key Findings
• The value-added estimate of the school’s impact on student achievement across all subjects is 0.1592 in elementary grades and -0.1071 in middle grades.
• Coweta Charter Academy’s performance is higher than the state and district average elementary school, but below both the state and district average middle school.
• Coweta Charter Academy’s performance in elementary grades in 2016/17 is generally improved relative to performance in 2015/16 and 2014/15. In both 2014/15 and 2015/16, its performance in elementary ELA and Math was indistinguishable from the district averages, whereas in 2016/17, it was above the district average. For middle school Math, its overall performance was below the state and district average for all three years. For middle school ELA, the school’s performance was indistinguishable from the state and district average for all three years.
• The school’s contribution to student achievement is: o higher than the state and district average in elementary Math and ELA; o below the state and district average in middle school Math; and o indistinguishable from the state and district averages in middle school ELA.
General Characteristics
School Name Calendar
Year Opened
EMO Affiliation
Grades Curriculum Focus School Year Single-Gender School
Virtual/ Online School
Serves Multiple Districts
Parental Involvement Requirement
Enrollment Restrictions
Coweta Charter Academy
2010 Charter Schools
USA K-8 None Normal No No No
20 hours volunteer/year for
one child, 30 hours/year for more than one
child
Students residing in
Coweta County Public Schools
Zone
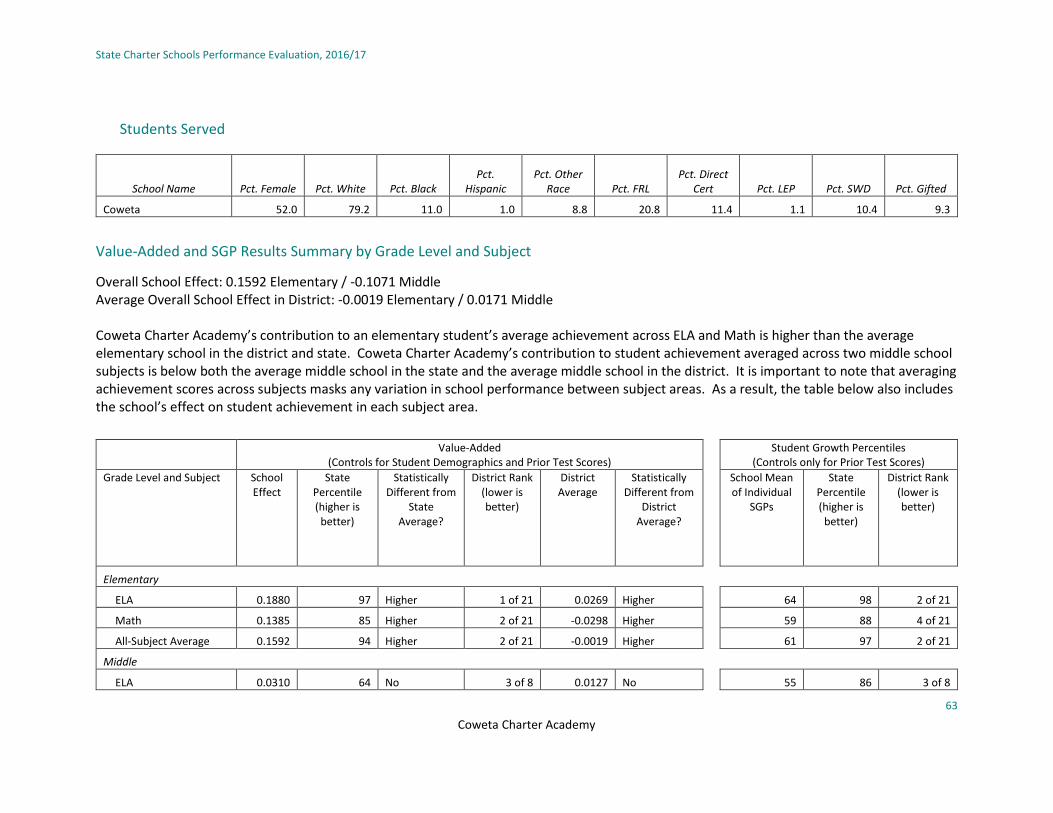
State Charter Schools Performance Evaluation, 2016/17
Coweta Charter Academy
63
Students Served
School Name Pct. Female Pct. White Pct. Black Pct.
Hispanic Pct. Other
Race Pct. FRL Pct. Direct
Cert Pct. LEP Pct. SWD Pct. Gifted
Coweta 52.0 79.2 11.0 1.0 8.8 20.8 11.4 1.1 10.4 9.3
Value-Added and SGP Results Summary by Grade Level and Subject
Overall School Effect: 0.1592 Elementary / -0.1071 Middle Average Overall School Effect in District: -0.0019 Elementary / 0.0171 Middle Coweta Charter Academy’s contribution to an elementary student’s average achievement across ELA and Math is higher than the average elementary school in the district and state. Coweta Charter Academy’s contribution to student achievement averaged across two middle school subjects is below both the average middle school in the state and the average middle school in the district. It is important to note that averaging achievement scores across subjects masks any variation in school performance between subject areas. As a result, the table below also includes the school’s effect on student achievement in each subject area.
Value-Added (Controls for Student Demographics and Prior Test Scores)
Student Growth Percentiles (Controls only for Prior Test Scores)
Grade Level and Subject School Effect
State Percentile (higher is
better)
Statistically Different from
State Average?
District Rank (lower is better)
District Average
Statistically Different from
District Average?
School Mean of Individual
SGPs
State Percentile (higher is
better)
District Rank (lower is better)
Elementary
ELA 0.1880 97 Higher 1 of 21 0.0269 Higher 64 98 2 of 21
Math 0.1385 85 Higher 2 of 21 -0.0298 Higher 59 88 4 of 21
All-Subject Average 0.1592 94 Higher 2 of 21 -0.0019 Higher 61 97 2 of 21
Middle
ELA 0.0310 64 No 3 of 8 0.0127 No 55 86 3 of 8

State Charter Schools Performance Evaluation, 2016/17
Coweta Charter Academy
64
Value-Added (Controls for Student Demographics and Prior Test Scores)
Student Growth Percentiles (Controls only for Prior Test Scores)
Grade Level and Subject School Effect
State Percentile (higher is
better)
Statistically Different from
State Average?
District Rank (lower is better)
District Average
Statistically Different from
District Average?
School Mean of Individual
SGPs
State Percentile (higher is
better)
District Rank (lower is better)
Math -0.2521 3 Lower 8 of 8 0.0098 Lower 45 24 8 of 8
All-Subject Average -0.1071 9 Lower 7 of 8 0.0171 Lower 50 49 8 of 8
High
9th Grade Literature
American Literature
Algebra 1
Biology
Economics
Geometry
Physical Science
U.S. History
Note: Statistical significance is based on a 95 percent confidence level. The state average value-added effect is zero. The district average represents the simple average of the school effects of all schools in the relevant district or set of districts. Schools with a statewide attendance zone are compared to the state average and, thus, have no comparison district and, thus, have no comparison district.

State Charter Schools Performance Evaluation, 2016/17
Coweta Charter Academy
65
Comparison of 2016/17, 2015/16, and 2014/15 Value-Added and SGP Summary Results
Coweta Charter Academy’s performance in elementary grades in 2016/17 is generally improved relative to performance in 2015/16 and 2014/15. In both 2014/15 and 2015/16, its performance in elementary ELA and Math was indistinguishable from the district averages, whereas in 2016/17, it was above the district average. For middle school Math, its overall performance was below the state and district average for all three years. For middle school ELA, the school’s performance was indistinguishable from the state and district average for all three years.
Value-Added
(Controls for Student Demographics and Prior Test Scores)
2014/15 2015/16 2016/17*
Grade Level and Subject
School Effect
Statistically Different
from State Average?
District Average
Statistically Different
from District Average?
School Effect
Statistically Different
from State Average?
District Average
Statistically Different
from District Average?
School Effect
Statistically Different
from State Average?
District Average
Statistically Different
from District Average?
Elementary
ELA -0.0005 No -0.0544 No -0.0512 No -0.1095 No 0.1880 Higher 0.0269 Higher
Math -0.2083 Lower -0.0398 Lower 0.0035 No -0.0390 No 0.1385 Higher -0.0298 Higher
Science -0.1280 Lower -0.0534 No -0.0516 No -0.0415 No
Social Studies -0.0352 No -0.0541 No -0.1826 Lower -0.0862 Lower
All-Subject Average -0.0962 Lower -0.0510 No -0.0648 Lower -0.0683 No 0.1592 Higher -0.0019 Higher
Middle
ELA -0.0022 No 0.0138 No 0.0553 No -0.0045 No 0.0310 No 0.0127 No
Math -0.2750 Lower -0.0108 Lower -0.1312 Lower 0.0093 Lower -0.2521 Lower 0.0098 Lower
Science -0.3651 Lower -0.0797 Lower -0.2514 Lower -0.0917 Lower
Social Studies -0.3483 Lower -0.0532 Lower -0.1116 Lower -0.0645 No
All-Subject Average -0.2350 Lower -0.0267 Lower -0.0921 Lower -0.0209 Lower -0.1071 Lower 0.0171 Lower
High
9th Grade Literature
American Literature
Analytic Geometry

State Charter Schools Performance Evaluation, 2016/17
Coweta Charter Academy
66
Value-Added
(Controls for Student Demographics and Prior Test Scores)
2014/15 2015/16 2016/17*
Grade Level and Subject
School Effect
Statistically Different
from State Average?
District Average
Statistically Different
from District Average?
School Effect
Statistically Different
from State Average?
District Average
Statistically Different
from District Average?
School Effect
Statistically Different
from State Average?
District Average
Statistically Different
from District Average?
Algebra 1
Biology
Coordinate Algebra
Economics
Geometry
Physical Science
U.S. History
Note: Statistical significance is based on a 95 percent confidence level. The state average value-added effect is zero. The district average represents the simple average of the school effects of all schools in the relevant district or set of districts. Schools with a statewide attendance zone are compared to the state average and, thus, have no comparison district.
*For 2016/17 the school-level measure of "Direct Certification" employed in the value-added calculations differs from the measure employed in prior years. Direct Certification represents students who either live in a family unit receiving SNAP benefits, live in family unit receiving TANF benefits, are identified as homeless, are in foster care or are migrant. Due to data limitations, students in foster care were not included in the direct certification tally in 2016/17.
Student Growth Percentiles
(Controls only for Prior Test Scores)
2014/15 2015/16 2016/17
Grade Level and Subject School Mean of
Individual SGPs
State Percentile (higher is
better)
District Rank (lower
is better)
School Mean of
Individual SGPs
State Percentile (higher is
better)
District Rank (lower
is better)
School Mean of
Individual SGPs
State Percentile (higher is
better)
District Rank (lower
is better)
Elementary
ELA 55 76 2 of 21 47 33 9 of 21 64 98 2 of 21
Math 43 23 18 of 21 52 58 8 of 21 59 88 4 of 21
Science 45 28 17 of 21 47 34 15 of 21

State Charter Schools Performance Evaluation, 2016/17
Coweta Charter Academy
67
Student Growth Percentiles
(Controls only for Prior Test Scores)
2014/15 2015/16 2016/17
Grade Level and Subject School Mean of
Individual SGPs
State Percentile (higher is
better)
District Rank (lower
is better)
School Mean of
Individual SGPs
State Percentile (higher is
better)
District Rank (lower
is better)
School Mean of
Individual SGPs
State Percentile (higher is
better)
District Rank (lower
is better)
Social Studies 50 47 10 of 21 46 34 14 of 21
All-Subject Average 48 35 14 of 21 48 40 12 of 21 61 97 2 of 21
Middle
ELA 49 47 7 of 8 50 52 5 of 8 55 86 3 of 8
Math 41 11 8 of 8 47 40 8 of 8 45 24 8 of 8
Science 29 2 8 of 8 36 5 8 of 8
Social Studies 36 7 8 of 8 50 50 4 of 8
All-Subject Average 39 4 8 of 8 46 27 8 of 8 50 49 8 of 8
High
9th Grade Literature
American Literature
Analytic Geometry
Algebra 1
Biology
Coordinate Algebra
Economics
Geometry
Physical Science
U.S. History
Note: Schools with a statewide attendance zone are compared to the state average and, thus, have no comparison district.

State Charter Schools Performance Evaluation, 2016/17
68 Coweta Charter Academy
Comparison of School Impact Subject Area: All-Subject Elementary Average State Charter: Coweta Charter Academy Comparison District: Coweta County Public Schools

State Charter Schools Performance Evaluation, 2016/17
Coweta Charter Academy
69
Subject Area: Elementary ELA State Charter: Coweta Charter Academy Comparison District: Coweta County Public Schools

State Charter Schools Performance Evaluation, 2016/17
Coweta Charter Academy
70
Subject Area: Elementary Mathematics State Charter: Coweta Charter Academy Comparison District: Coweta County Public Schools

State Charter Schools Performance Evaluation, 2016/17
Coweta Charter Academy
71
Subject Area: All-Subject Middle Average
State Charter: Coweta Charter Academy Comparison District: Coweta County Public Schools

State Charter Schools Performance Evaluation, 2016/17
Coweta Charter Academy
72
Subject Area: Middle ELA State Charter: Coweta Charter Academy Comparison District: Coweta County Public Schools

State Charter Schools Performance Evaluation, 2016/17
Coweta Charter Academy
73
Subject Area: Middle Mathematics State Charter: Coweta Charter Academy Comparison District: Coweta County Public Schools

State Charter Schools Performance Evaluation, 2016/17
74 DuBois Integrity Academy
DuBois Integrity Academy
Key Findings
• The value-added estimate of the school’s impact on a student’s average achievement across all subjects is 0.1768 in elementary grades.
• DuBois Integrity Academy’s performance is above the state and district averages in elementary grades.
• DuBois Integrity Academy’s performance in elementary ELA and Math in 2016/17 is improved relative to performance in 2015/16. In both elementary Math and ELA, the school effect rose and is now statistically higher than the state average in both subjects.
• The school’s contribution to student achievement in 2016/17 is: o above the state and district average in elementary ELA; and o above the state but indistinguishable from the district average in elementary Math.
General Characteristics
School Name Calendar
Year Opened
EMO Affiliation
Grades Curriculum Focus School Year Single-Gender School
Virtual/ Online School
Serves Multiple Districts
Parental Involvement Requirement
Enrollment Restrictions
DuBois Integrity Academy
2015 No K-5 GA Common core
standards with STEM and Arts integration
Normal No No No 30 volunteer hours/year
Students residing in
Clayton County Public Schools Zone
Students Served
School Name Pct. Female Pct. White Pct. Black Pct.
Hispanic Pct. Other
Race Pct. FRL Pct. Direct
Cert Pct. LEP Pct. SWD Pct. Gifted
DuBois 51.8 0.5 98.0 0.6 0.9 87.2 48.7 2.3 11.2 2.0

State Charter Schools Performance Evaluation, 2016/17
DuBois Integrity Academy
75
Value-Added and SGP Results Summary by Grade Level and Subject
Overall School Effect: 0.1768 Elementary Average Overall School Effect in District: 0.0763 Elementary DuBois Integrity Academy’s contribution to an elementary student’s average achievement across ELA and Math is above that of the average elementary school in the state and district. It is important to note that averaging achievement scores across subjects masks any variation in school performance between subject areas. As a result, the table below also includes the school’s effect on student achievement in each subject area.
Value-Added (Controls for Student Demographics and Prior Test Scores)
Student Growth Percentiles (Controls only for Prior Test Scores)
Grade Level and Subject School Effect
State Percentile (higher is
better)
Statistically Different from
State Average?
District Rank (lower
is better)
District Average
Statistically Different from
District Average?
School Mean of Individual
SGPs
State Percentile (higher is
better)
District Rank (lower is better)
Elementary
ELA 0.2346 98 Higher 1 of 36 0.0850 Higher 59 93 2 of 36
Math 0.1187 81 Higher 11 of 36 0.0668 No 56 74 16 of 36
All-Subject Average 0.1768 96 Higher 2 of 36 0.0763 Higher 57 89 5 of 36
Middle
ELA
Math
All-Subject Average
High
9th Grade Literature
American Literature
Algebra 1
Biology
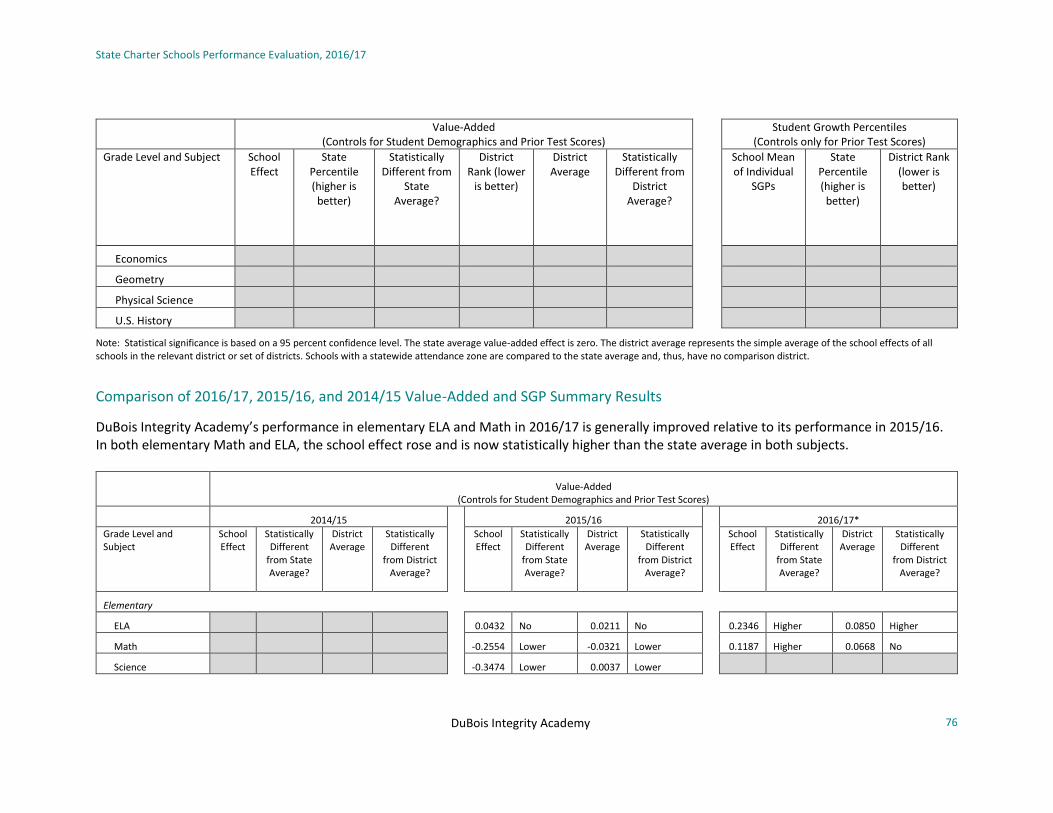
State Charter Schools Performance Evaluation, 2016/17
DuBois Integrity Academy
76
Value-Added (Controls for Student Demographics and Prior Test Scores)
Student Growth Percentiles (Controls only for Prior Test Scores)
Grade Level and Subject School Effect
State Percentile (higher is
better)
Statistically Different from
State Average?
District Rank (lower
is better)
District Average
Statistically Different from
District Average?
School Mean of Individual
SGPs
State Percentile (higher is
better)
District Rank (lower is better)
Economics
Geometry
Physical Science
U.S. History
Note: Statistical significance is based on a 95 percent confidence level. The state average value-added effect is zero. The district average represents the simple average of the school effects of all schools in the relevant district or set of districts. Schools with a statewide attendance zone are compared to the state average and, thus, have no comparison district.
Comparison of 2016/17, 2015/16, and 2014/15 Value-Added and SGP Summary Results
DuBois Integrity Academy’s performance in elementary ELA and Math in 2016/17 is generally improved relative to its performance in 2015/16. In both elementary Math and ELA, the school effect rose and is now statistically higher than the state average in both subjects.
Value-Added
(Controls for Student Demographics and Prior Test Scores)
2014/15 2015/16 2016/17*
Grade Level and Subject
School Effect
Statistically Different
from State Average?
District Average
Statistically Different
from District Average?
School Effect
Statistically Different
from State Average?
District Average
Statistically Different
from District Average?
School Effect
Statistically Different
from State Average?
District Average
Statistically Different
from District Average?
Elementary
ELA 0.0432 No 0.0211 No 0.2346 Higher 0.0850 Higher
Math -0.2554 Lower -0.0321 Lower 0.1187 Higher 0.0668 No
Science -0.3474 Lower 0.0037 Lower
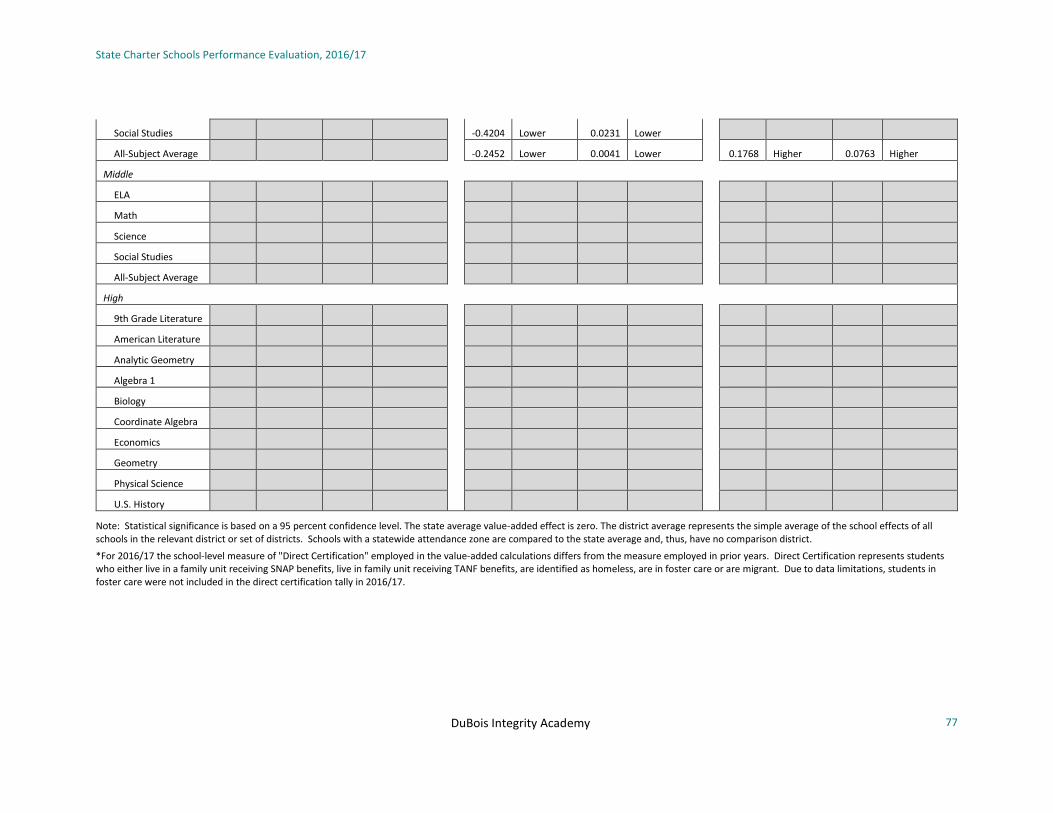
State Charter Schools Performance Evaluation, 2016/17
DuBois Integrity Academy
77
Social Studies -0.4204 Lower 0.0231 Lower
All-Subject Average -0.2452 Lower 0.0041 Lower 0.1768 Higher 0.0763 Higher
Middle
ELA
Math
Science
Social Studies
All-Subject Average
High
9th Grade Literature
American Literature
Analytic Geometry
Algebra 1
Biology
Coordinate Algebra
Economics
Geometry
Physical Science
U.S. History
Note: Statistical significance is based on a 95 percent confidence level. The state average value-added effect is zero. The district average represents the simple average of the school effects of all schools in the relevant district or set of districts. Schools with a statewide attendance zone are compared to the state average and, thus, have no comparison district.
*For 2016/17 the school-level measure of "Direct Certification" employed in the value-added calculations differs from the measure employed in prior years. Direct Certification represents students who either live in a family unit receiving SNAP benefits, live in family unit receiving TANF benefits, are identified as homeless, are in foster care or are migrant. Due to data limitations, students in foster care were not included in the direct certification tally in 2016/17.

State Charter Schools Performance Evaluation, 2016/17
DuBois Integrity Academy
78
Student Growth Percentiles
(Controls only for Prior Test Scores)
2014/15 2015/16 2016/17
Grade Level and Subject School Mean of
Individual SGPs
State Percentile (higher is
better)
District Rank (lower
is better)
School Mean of
Individual SGPs
State Percentile (higher is
better)
District Rank (lower
is better)
School Mean of
Individual SGPs
State Percentile (higher is
better)
District Rank (lower
is better)
Elementary
ELA 46 30 25 of 36 59 93 2 of 36
Math 26 1 36 of 36 56 74 16 of 36
Science 25 1 36 of 36
Social Studies 24 1 36 of 36
All-Subject Average 30 1 36 of 36 57 89 5 of 36
Middle
ELA
Math
Science
Social Studies
All-Subject Average
High
9th Grade Literature
American Literature
Analytic Geometry
Algebra 1
Biology
Coordinate Algebra
Economics
Geometry
Physical Science
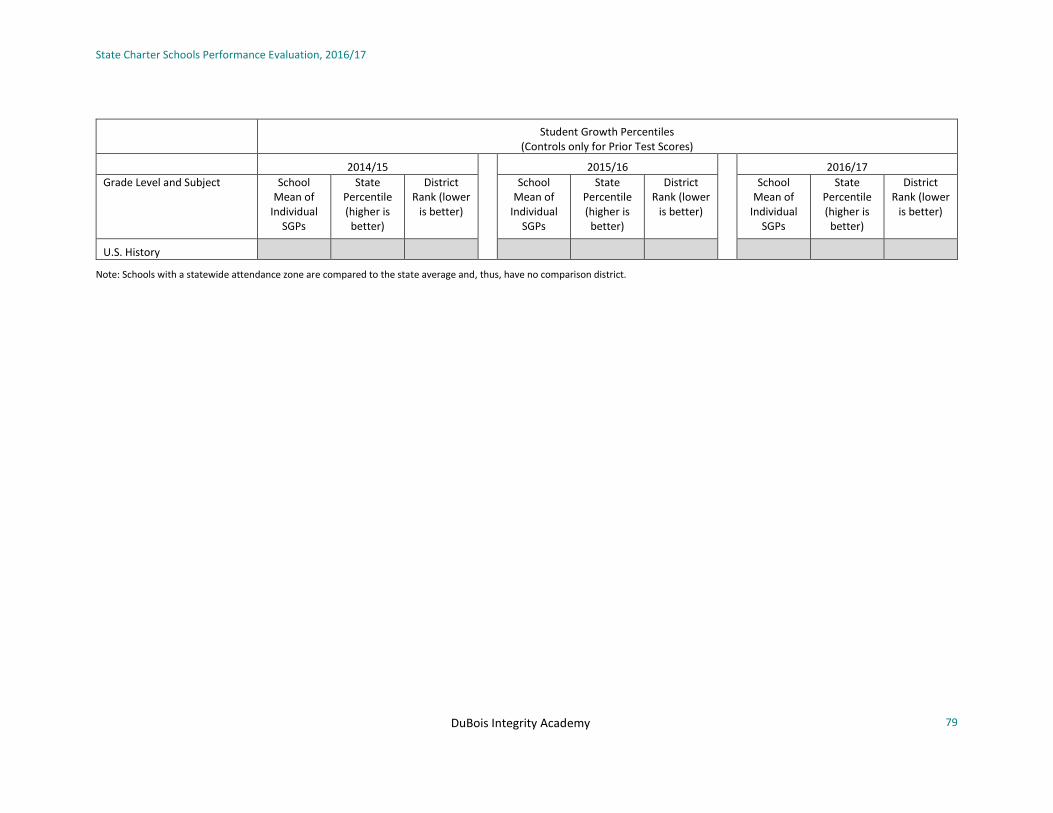
State Charter Schools Performance Evaluation, 2016/17
DuBois Integrity Academy
79
Student Growth Percentiles
(Controls only for Prior Test Scores)
2014/15 2015/16 2016/17
Grade Level and Subject School Mean of
Individual SGPs
State Percentile (higher is
better)
District Rank (lower
is better)
School Mean of
Individual SGPs
State Percentile (higher is
better)
District Rank (lower
is better)
School Mean of
Individual SGPs
State Percentile (higher is
better)
District Rank (lower
is better)
U.S. History
Note: Schools with a statewide attendance zone are compared to the state average and, thus, have no comparison district.

State Charter Schools Performance Evaluation, 2016/17
80 DuBois Integrity Academy
Comparison of School Impact Subject Area: All-Subject Elementary Average State Charter: DuBois Integrity Academy Comparison District: Clayton County

State Charter Schools Performance Evaluation, 2016/17
DuBois Integrity Academy
81
Subject Area: Elementary ELA
State Charter: DuBois Integrity Academy Comparison District: Clayton County

State Charter Schools Performance Evaluation, 2016/17
DuBois Integrity Academy
82
Subject Area: Elementary Mathematics State Charter: DuBois Integrity Academy Comparison District: Clayton County
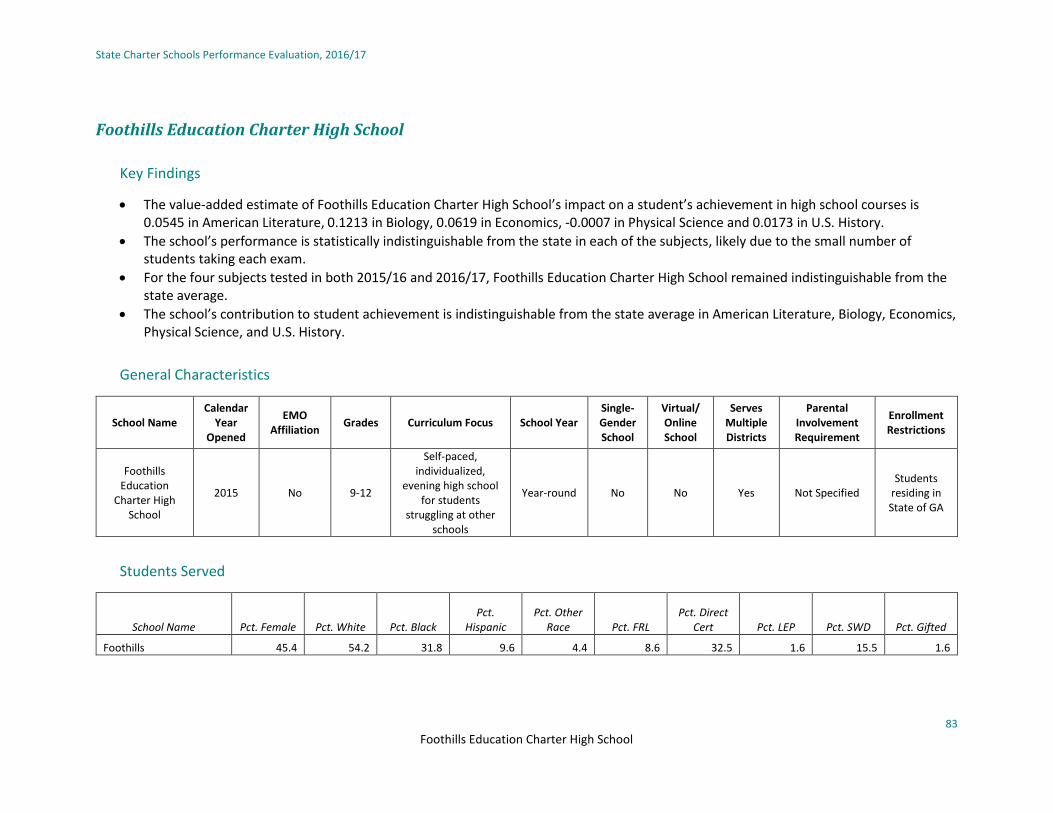
State Charter Schools Performance Evaluation, 2016/17
83 Foothills Education Charter High School
Foothills Education Charter High School
Key Findings
• The value-added estimate of Foothills Education Charter High School’s impact on a student’s achievement in high school courses is 0.0545 in American Literature, 0.1213 in Biology, 0.0619 in Economics, -0.0007 in Physical Science and 0.0173 in U.S. History.
• The school’s performance is statistically indistinguishable from the state in each of the subjects, likely due to the small number of students taking each exam.
• For the four subjects tested in both 2015/16 and 2016/17, Foothills Education Charter High School remained indistinguishable from the state average.
• The school’s contribution to student achievement is indistinguishable from the state average in American Literature, Biology, Economics, Physical Science, and U.S. History.
General Characteristics
School Name Calendar
Year Opened
EMO Affiliation
Grades Curriculum Focus School Year Single-Gender School
Virtual/ Online School
Serves Multiple Districts
Parental Involvement Requirement
Enrollment Restrictions
Foothills Education
Charter High School
2015 No 9-12
Self-paced, individualized,
evening high school for students
struggling at other schools
Year-round No No Yes Not Specified Students
residing in State of GA
Students Served
School Name Pct. Female Pct. White Pct. Black Pct.
Hispanic Pct. Other
Race Pct. FRL Pct. Direct
Cert Pct. LEP Pct. SWD Pct. Gifted
Foothills 45.4 54.2 31.8 9.6 4.4 8.6 32.5 1.6 15.5 1.6

State Charter Schools Performance Evaluation, 2016/17
Foothills Education Charter High School
84
Value-Added and SGP Results Summary by Grade Level and Subject
Overall School Effect: 0.0545 American Literature / 0.1213 Biology / 0.0619 Economics / -0.0007 Physical Science / 0.0173 U.S. History
In each of the five measured subjects, Foothills Education Charter High School’s contribution to a high school student’s achievement is not statistically different from the average high school in the state.
Value-Added
(Controls for Student Demographics and Prior Test Scores)
Student Growth Percentiles (Controls only for Prior Test Scores)
Grade Level and Subject School Effect
State Percentile (higher is
better)
Statistically Different from
State Average?
District Rank (lower is better)
District Average
Statistically Different from
District Average?
School Mean of Individual
SGPs
State Percentile (higher is
better)
District Rank (lower is better)
Elementary
ELA
Math
All-Subject Average
Middle
ELA
Math
All-Subject Average
High
9th Grade Literature
American Literature 0.0545 65 No 42 15
Algebra 1
Biology 0.1213 80 No
Economics 0.0619 66 No
Geometry

State Charter Schools Performance Evaluation, 2016/17
Foothills Education Charter High School
85
Value-Added (Controls for Student Demographics and Prior Test Scores)
Student Growth Percentiles (Controls only for Prior Test Scores)
Grade Level and Subject School Effect
State Percentile (higher is
better)
Statistically Different from
State Average?
District Rank (lower is better)
District Average
Statistically Different from
District Average?
School Mean of Individual
SGPs
State Percentile (higher is
better)
District Rank (lower is better)
Physical Science -0.0007 52 No
U.S. History 0.0173 56 No
Note: Statistical significance is based on a 95 percent confidence level. The state average value-added effect is zero. The district average represents the simple average of the school effects of all schools in the relevant district or set of districts. Schools with a statewide attendance zone are compared to the state average and, thus, have no comparison district.
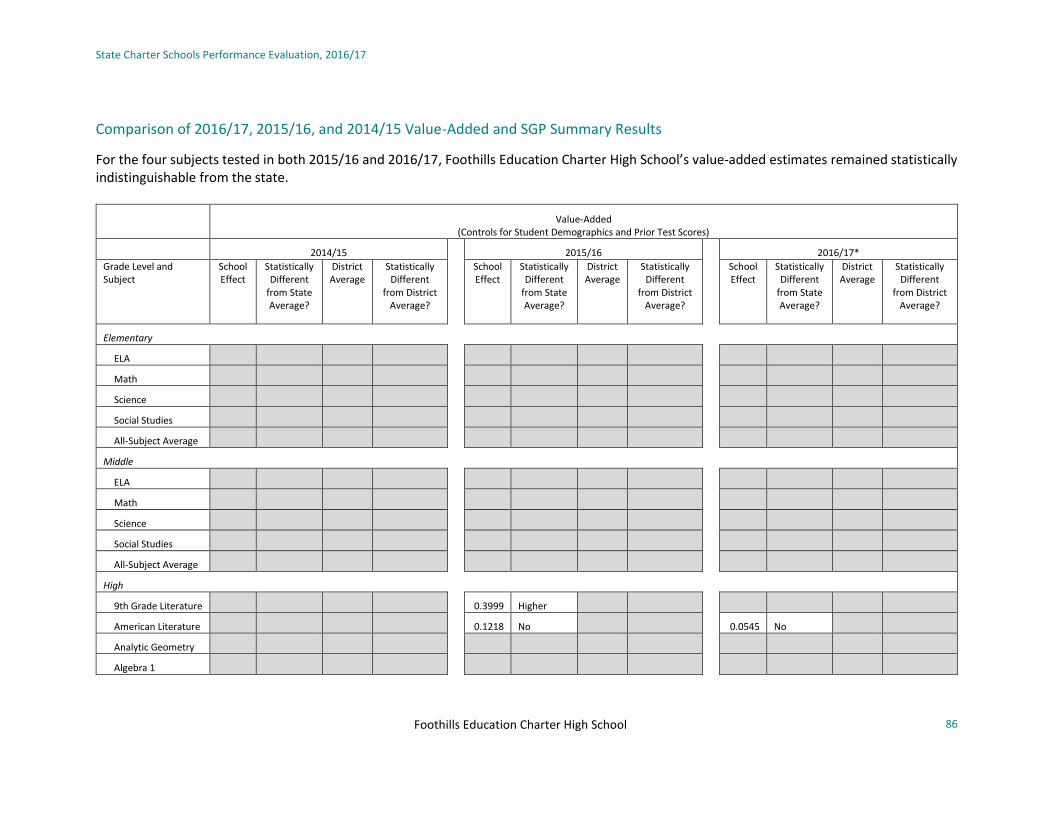
State Charter Schools Performance Evaluation, 2016/17
Foothills Education Charter High School
86
Comparison of 2016/17, 2015/16, and 2014/15 Value-Added and SGP Summary Results
For the four subjects tested in both 2015/16 and 2016/17, Foothills Education Charter High School’s value-added estimates remained statistically indistinguishable from the state.
Value-Added
(Controls for Student Demographics and Prior Test Scores)
2014/15 2015/16 2016/17*
Grade Level and Subject
School Effect
Statistically Different
from State Average?
District Average
Statistically Different
from District Average?
School Effect
Statistically Different
from State Average?
District Average
Statistically Different
from District Average?
School Effect
Statistically Different
from State Average?
District Average
Statistically Different
from District Average?
Elementary
ELA
Math
Science
Social Studies
All-Subject Average
Middle
ELA
Math
Science
Social Studies
All-Subject Average
High
9th Grade Literature 0.3999 Higher
American Literature 0.1218 No 0.0545 No
Analytic Geometry
Algebra 1
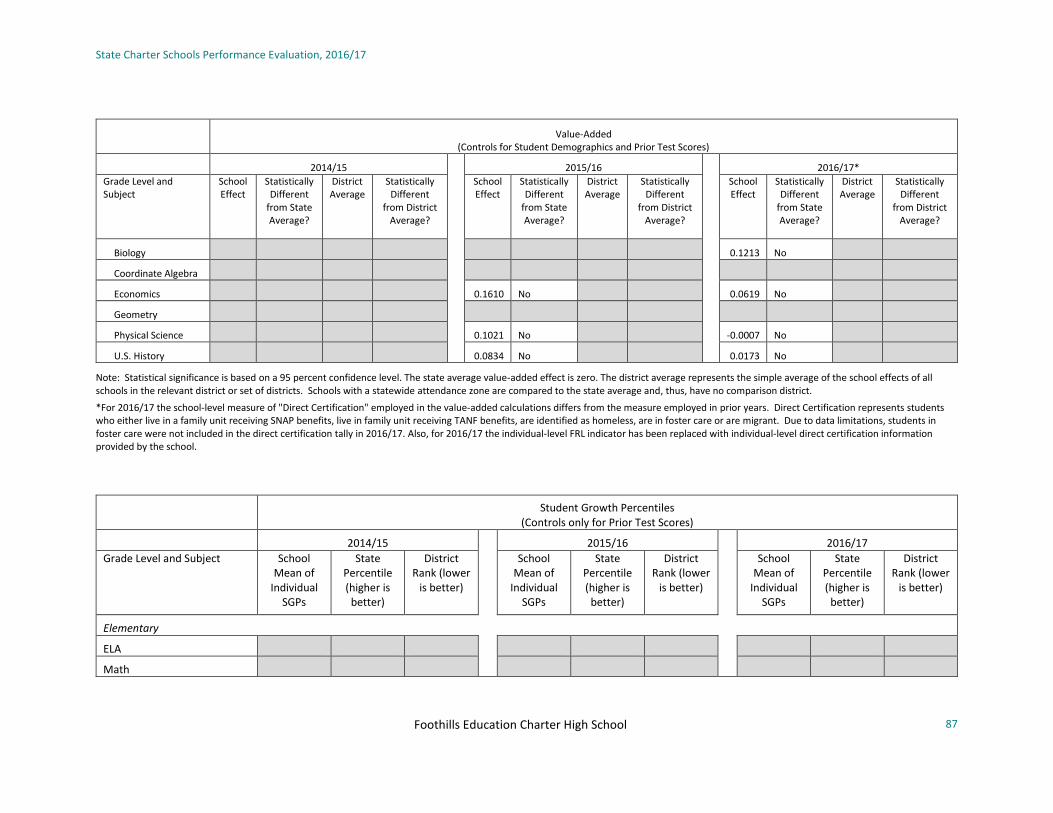
State Charter Schools Performance Evaluation, 2016/17
Foothills Education Charter High School
87
Value-Added
(Controls for Student Demographics and Prior Test Scores)
2014/15 2015/16 2016/17*
Grade Level and Subject
School Effect
Statistically Different
from State Average?
District Average
Statistically Different
from District Average?
School Effect
Statistically Different
from State Average?
District Average
Statistically Different
from District Average?
School Effect
Statistically Different
from State Average?
District Average
Statistically Different
from District Average?
Biology 0.1213 No
Coordinate Algebra
Economics 0.1610 No 0.0619 No
Geometry
Physical Science 0.1021 No -0.0007 No
U.S. History 0.0834 No 0.0173 No
Note: Statistical significance is based on a 95 percent confidence level. The state average value-added effect is zero. The district average represents the simple average of the school effects of all schools in the relevant district or set of districts. Schools with a statewide attendance zone are compared to the state average and, thus, have no comparison district.
*For 2016/17 the school-level measure of "Direct Certification" employed in the value-added calculations differs from the measure employed in prior years. Direct Certification represents students who either live in a family unit receiving SNAP benefits, live in family unit receiving TANF benefits, are identified as homeless, are in foster care or are migrant. Due to data limitations, students in foster care were not included in the direct certification tally in 2016/17. Also, for 2016/17 the individual-level FRL indicator has been replaced with individual-level direct certification information provided by the school.
Student Growth Percentiles
(Controls only for Prior Test Scores)
2014/15 2015/16 2016/17
Grade Level and Subject School Mean of
Individual SGPs
State Percentile (higher is
better)
District Rank (lower
is better)
School Mean of
Individual SGPs
State Percentile (higher is
better)
District Rank (lower
is better)
School Mean of
Individual SGPs
State Percentile (higher is
better)
District Rank (lower
is better)
Elementary
ELA
Math
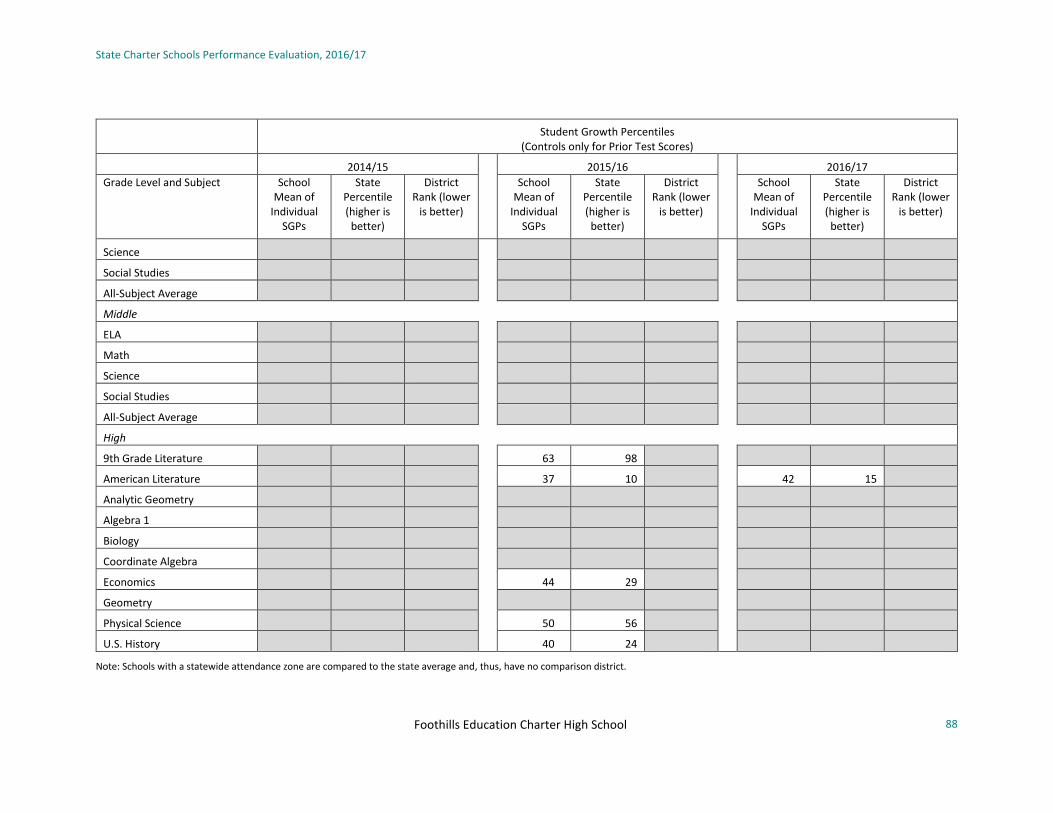
State Charter Schools Performance Evaluation, 2016/17
Foothills Education Charter High School
88
Student Growth Percentiles
(Controls only for Prior Test Scores)
2014/15 2015/16 2016/17
Grade Level and Subject School Mean of
Individual SGPs
State Percentile (higher is
better)
District Rank (lower
is better)
School Mean of
Individual SGPs
State Percentile (higher is
better)
District Rank (lower
is better)
School Mean of
Individual SGPs
State Percentile (higher is
better)
District Rank (lower
is better)
Science
Social Studies
All-Subject Average
Middle
ELA
Math
Science
Social Studies
All-Subject Average
High
9th Grade Literature 63 98
American Literature 37 10 42 15
Analytic Geometry
Algebra 1
Biology
Coordinate Algebra
Economics 44 29
Geometry
Physical Science 50 56
U.S. History 40 24
Note: Schools with a statewide attendance zone are compared to the state average and, thus, have no comparison district.

State Charter Schools Performance Evaluation, 2016/17
89 Fulton Leadership Academy
Fulton Leadership Academy
Key Findings
• The value-added estimate of Fulton Leadership Academy’s impact on a student’s average achievement across all subjects in middle school is -0.0086.
• Fulton Leadership Academy’s performance is not statistically different from the state or district averages for middle schools. The school’s contribution to student achievement in high school is mixed: 9th Grade Literature, Algebra 1, Geometry, and Physical Science are indistinguishable from both state and district averages, whereas performance in Biology and Economics are below the state and district averages.
• Fulton Leadership Academy’s performance in middle school Math and ELA for 2016/17 was consistent with 2015/16 but below 2014/15. Though middle school Math performance was higher than the district average in 2015/16, that is not the case in 2016/17 because the district’s performance improved. At the high school level, performance is also similar relative to prior years. However, Physical Science, which was last tested in 2014/15, did see some improvement in the 2016/17 school year.
• The school’s contribution to student achievement is: o below the state and district average in Biology and Economics; and o indistinguishable from the state and district average in middle school ELA and Math, as well as 9th Grade Literature, Algebra 1,
Geometry, and Physical Science.
General Characteristics
School Name Calendar
Year Opened
EMO Affiliation
Grades Curriculum Focus School Year Single-Gender School
Virtual/ Online School
Serves Multiple Districts
Parental Involvement Requirement
Enrollment Restrictions
Fulton Leadership Academy
2010 No 6-12
STEM with focus on aviation and aeronautics -
partnership with Civil Air Patrol
Normal Boys Only
No No 20 volunteer hours/year
Students residing in
Fulton County Public Schools Zone

State Charter Schools Performance Evaluation, 2016/17
Fulton Leadership Academy
90
Students Served
School Name Pct. Female Pct. White Pct. Black Pct.
Hispanic Pct. Other
Race Pct. FRL Pct. Direct
Cert Pct. LEP Pct. SWD Pct. Gifted
Fulton Leadership 0.0 0.0 98.7 0.8 0.5 87.5 29.2 0.0 15.3 11.3
Value-Added and SGP Results Summary by Grade Level and Subject
Overall School Effect: -0.0086 Middle/ -0.0883 9th Grade Literature/ 0.0235 Algebra 1/ -0.2034 Biology/ -0.3605 Economics/ 0.0639 Geometry/ -0.0662 Physical Science Average Overall School Effect in District: -0.0286 Middle/ 0.0344 9th Grade Literature/ 0.0655 Algebra 1/ 0.0112 Biology/ -0.0454 Economics/
0.0570 Geometry/ 0.0223 Physical Science Fulton Leadership Academy’s contribution to a middle school student’s cross-subject average achievement is indistinguishable from that of the average middle school in the state and district. It is important to note that averaging achievement scores across subjects masks any variation in school performance between subject areas. As a result, the table below also includes the school’s effect on student achievement in each subject area.
In four of six high school tested subjects, Fulton Leadership Academy’s contribution to a student’s achievement is not statistically different from the average high school in the district and the average high school in the state. In two of the six subjects, Biology and Economics, the school’s contribution to a student’s achievement is lower than that of the district and the state.
Value-Added (Controls for Student Demographics and Prior Test Scores)
Student Growth Percentiles (Controls only for Prior Test Scores)
Grade Level and Subject School Effect
State Percentile (higher is
better)
Statistically Different from
State Average?
District Rank (lower is better)
District Average
Statistically Different from
District Average?
School Mean of Individual
SGPs
State Percentile (higher is
better)
District Rank (lower is better)
Elementary
ELA

State Charter Schools Performance Evaluation, 2016/17
Fulton Leadership Academy
91
Value-Added (Controls for Student Demographics and Prior Test Scores)
Student Growth Percentiles (Controls only for Prior Test Scores)
Grade Level and Subject School Effect
State Percentile (higher is
better)
Statistically Different from
State Average?
District Rank (lower is better)
District Average
Statistically Different from
District Average?
School Mean of Individual
SGPs
State Percentile (higher is
better)
District Rank (lower is better)
Math
All-Subject Average
Middle
ELA 0.0315 65 No 8 of 27 -0.0084 No 47 26 18 of 27
Math -0.0226 42 No 10 of 27 -0.0511 No 48 39 10 of 27
All-Subject Average -0.0086 46 No 10 of 27 -0.0286 No 47 33 14 of 27
High
9th Grade Literature -0.0883 21 No 17 of 17 0.0344 No 47 31 13 of 17
American Literature
Algebra 1 0.0235 57 No 11 of 18 0.0655 No 47 35 12 of 18
Biology -0.2034 11 Lower 18 of 19 0.0112 Lower
Economics -0.3605 7 Lower 19 of 19 -0.0454 Lower
Geometry 0.0639 65 No 9 of 19 0.0570 No 49 47 13 of 19
Physical Science -0.0662 36 No 13 of 17 0.0223 No
U.S. History
Note: Statistical significance is based on a 95 percent confidence level. The state average value-added effect is zero. The district average represents the simple average of the school effects of all schools in the relevant district or set of districts. Schools with a statewide attendance zone are compared to the state average and, thus, have no comparison district.

State Charter Schools Performance Evaluation, 2016/17
Fulton Leadership Academy
92
Comparison of 2016/17, 2015/16, and 2014/15 Value-Added and SGP Summary Results
Fulton Leadership Academy’s performance in middle school Math and ELA for 2016/17 was consistent with 2015/16 but below 2014/15. Though middle school Math performance was higher than the district average in 2015/16, that is not the case in 2016/17 because the district’s performance improved. At the high school level, performance is also similar relative to prior years. However, Physical Science, which was last tested in 2014/15, did see some improvement in the 2016/17 school year.
Value-Added
(Controls for Student Demographics and Prior Test Scores)
2014/15 2015/16 2016/17*
Grade Level and Subject
School Effect
Statistically Different
from State Average?
District Average
Statistically Different
from District Average?
School Effect
Statistically Different
from State Average?
District Average
Statistically Different
from District Average?
School Effect
Statistically Different
from State Average?
District Average
Statistically Different
from District Average?
Elementary
ELA
Math
Science
Social Studies
All-Subject Average
Middle
ELA 0.1078 Higher 0.0158 Higher -0.0323 No 0.0040 No 0.0315 No -0.0084 No
Math 0.1223 Higher -0.0467 Higher -0.0212 No -0.0960 Higher -0.0226 No -0.0511 No
Science -0.1318 Lower -0.0708 No -0.0068 No -0.0448 No
Social Studies 0.0504 No -0.0606 Higher 0.0491 No -0.0772 Higher
All-Subject Average 0.0450 No -0.0382 Higher 0.0039 No -0.0497 Higher -0.0086 No -0.0286 No
High
9th Grade Literature 0.1483 No -0.0724 Higher 0.0208 No 0.0172 No -0.0883 No 0.0344 No
American Literature 0.1086 No -0.0725 No -0.0711 No 0.0090 No
Analytic Geometry 0.0038 No -0.0039 No 0.0617 No 0.0617 No

State Charter Schools Performance Evaluation, 2016/17
Fulton Leadership Academy
93
Value-Added
(Controls for Student Demographics and Prior Test Scores)
2014/15 2015/16 2016/17*
Grade Level and Subject
School Effect
Statistically Different
from State Average?
District Average
Statistically Different
from District Average?
School Effect
Statistically Different
from State Average?
District Average
Statistically Different
from District Average?
School Effect
Statistically Different
from State Average?
District Average
Statistically Different
from District Average?
Algebra 1 0.1094 No 0.0367 No 0.0235 No 0.0655 No
Biology -0.0518 No -0.0391 No -0.1581 Lower 0.0195 Lower -0.2034 Lower 0.0112 Lower
Coordinate Algebra 0.3858 Higher -0.0403 Higher
Economics -0.3605 Lower -0.0454 Lower
Geometry 0.0639 No 0.0570 No
Physical Science -0.2307 Lower -0.0895 No -0.0662 No 0.0223 No
U.S. History -0.5930 Lower -0.0450 Lower -0.2693 Lower -0.0410 Lower
Note: Statistical significance is based on a 95 percent confidence level. The state average value-added effect is zero. The district average represents the simple average of the school effects of all schools in the relevant district or set of districts. Schools with a statewide attendance zone are compared to the state average and, thus, have no comparison district.
*For 2016/17 the school-level measure of "Direct Certification" employed in the value-added calculations differs from the measure employed in prior years. Direct Certification represents students who either live in a family unit receiving SNAP benefits, live in family unit receiving TANF benefits, are identified as homeless, are in foster care or are migrant. Due to data limitations, students in foster care were not included in the direct certification tally in 2016/17.
Student Growth Percentiles
(Controls only for Prior Test Scores)
2014/15 2015/16 2016/17
Grade Level and Subject School Mean of
Individual SGPs
State Percentile (higher is
better)
District Rank (lower
is better)
School Mean of
Individual SGPs
State Percentile (higher is
better)
District Rank (lower
is better)
School Mean of
Individual SGPs
State Percentile (higher is
better)
District Rank (lower
is better)
Elementary
ELA
Math

State Charter Schools Performance Evaluation, 2016/17
Fulton Leadership Academy
94
Student Growth Percentiles
(Controls only for Prior Test Scores)
2014/15 2015/16 2016/17
Grade Level and Subject School Mean of
Individual SGPs
State Percentile (higher is
better)
District Rank (lower
is better)
School Mean of
Individual SGPs
State Percentile (higher is
better)
District Rank (lower
is better)
School Mean of
Individual SGPs
State Percentile (higher is
better)
District Rank (lower
is better)
Science
Social Studies
All-Subject Average
Middle
ELA 45 18 21 of 24 39 4 25 of 26 47 26 18 of 27
Math 55 73 7 of 24 42 21 14 of 26 48 39 10 of 27
Science 43 20 17 of 24 50 54 11 of 26
Social Studies 53 63 10 of 24 52 63 6 of 26
All-Subject Average 49 42 13 of 24 46 27 18 of 26 47 33 14 of 27
High
9th Grade Literature 46 32 10 of 19 40 10 16 of 18 47 31 13 of 17
American Literature 46 32 13 of 20 47 41 12 of 19
Analytic Geometry 43 20 10 of 20 50 55 1 of 1
Algebra 1 44 34 14 of 18 47 35 12 of 18
Biology 47 40 13 of 20 46 38 12 of 19
Coordinate Algebra 74 99 1 of 19
Economics
Geometry 49 47 13 of 19
Physical Science 34 6 17 of 18
U.S. History 24 1 20 of 20 45 35 12 of 19
Note: Schools with a statewide attendance zone are compared to the state average and, thus, have no comparison district.

State Charter Schools Performance Evaluation, 2016/17
95 Fulton Leadership Academy
Comparison of School Impact Subject Area: All-Subject Middle Average State Charter: Fulton Leadership Academy Comparison District: Fulton County Public Schools

State Charter Schools Performance Evaluation, 2016/17
Fulton Leadership Academy
96
Subject Area: Middle ELA State Charter: Fulton Leadership Academy Comparison District: Fulton County Public Schools

State Charter Schools Performance Evaluation, 2016/17
Fulton Leadership Academy
97
Subject Area: Middle Mathematics State Charter: Fulton Leadership Academy Comparison District: Fulton County Public Schools
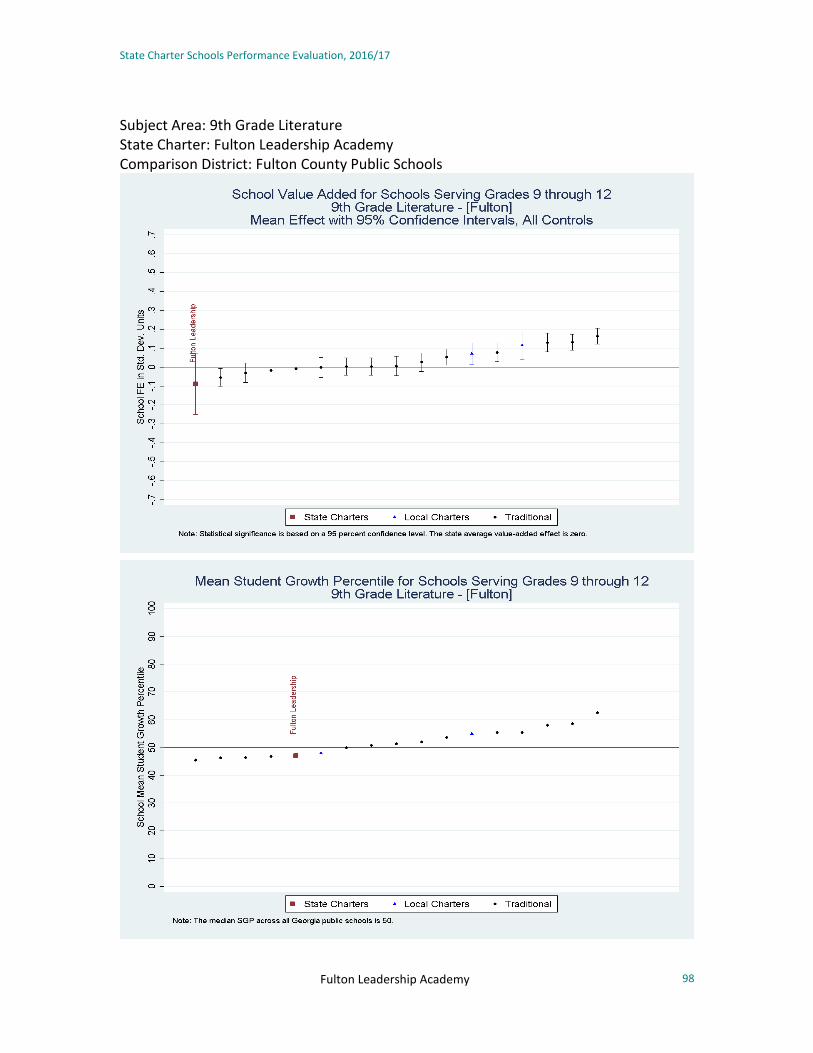
State Charter Schools Performance Evaluation, 2016/17
Fulton Leadership Academy
98
Subject Area: 9th Grade Literature State Charter: Fulton Leadership Academy Comparison District: Fulton County Public Schools
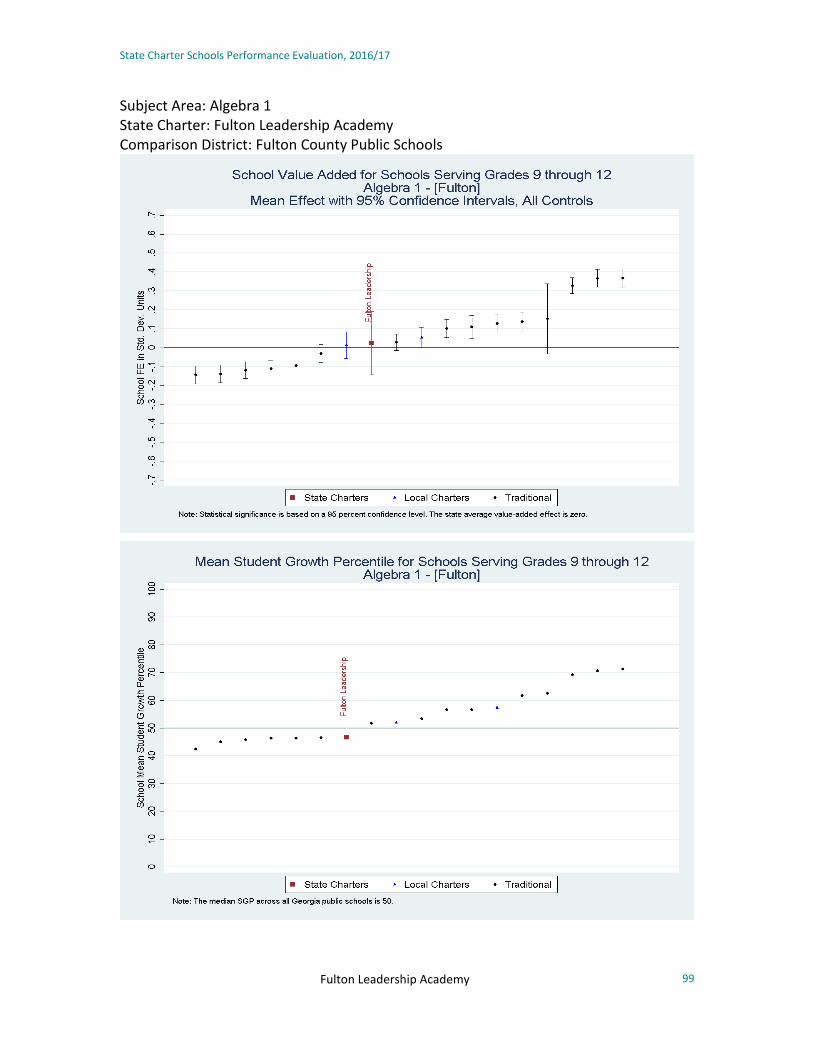
State Charter Schools Performance Evaluation, 2016/17
Fulton Leadership Academy
99
Subject Area: Algebra 1 State Charter: Fulton Leadership Academy Comparison District: Fulton County Public Schools

State Charter Schools Performance Evaluation, 2016/17
Fulton Leadership Academy
100
Subject Area: Biology State Charter: Fulton Leadership Academy Comparison District: Fulton County Public Schools

State Charter Schools Performance Evaluation, 2016/17
Fulton Leadership Academy
101
Subject Area: Economics State Charter: Fulton Leadership Academy Comparison District: Fulton County Public Schools

State Charter Schools Performance Evaluation, 2016/17
Fulton Leadership Academy
102
Subject Area: Geometry State Charter: Fulton Leadership Academy Comparison District: Fulton County Public Schools

State Charter Schools Performance Evaluation, 2016/17
Fulton Leadership Academy
103
Subject Area: Physical Science State Charter: Fulton Leadership Academy Comparison District: Fulton County Public Schools

State Charter Schools Performance Evaluation, 2016/17
104 Georgia Connections Academy
Georgia Connections Academy
Key Findings
• The value-added estimate of Georgia Connections Academy’s impact on a student’s average achievement across all subjects is -0.1898 in elementary grades and -0.1086 in middle grades.
• Georgia Connection Academy’s estimated contribution to student achievement in courses where end-of-course exams are administered are as follows: 0.1714 in 9th Grade Literature, 0.0731 in American Literature, -0.1410 in Algebra 1, -0.0573 in Biology, -0.1517 in Economics, -0.1616 in Geometry, -0.1045 in Physical Science, and -0.2930 in U.S. History.
• Georgia Connections Academy’s performance is below the state average in both elementary and middle grades. The school’s estimated contribution to student achievement exceeds the state average in 9th Grade Literature and American Literature, but is below the state average in Algebra 1, Economics, Geometry, Physical Science, and U.S. History. It is indistinguishable from the state average in Biology. Because the school serves students throughout the state, it does not have a district comparison group.
• Georgia Connections Academy’s performance in elementary ELA, elementary Math, middle school ELA, and middle school Math has been consistent across the three years. Similarly, at the high school level, performance has been consistent over time. Performance has tended to be higher than the state in 9th Grade Literature and American Literature. In other subjects, performance has either been indistinguishable from the state or below the state.
• The school’s contribution to student achievement is: o above the state average in middle school ELA, 9th Grade Literature, and American Literature; o below the state average in elementary Math, middle school Math, Algebra 1, Economics, Geometry, Physical Science and U.S.
History; and o indistinguishable from the state average in elementary ELA and Biology.
General Characteristics
School Name Calendar
Year Opened
EMO Affiliation
Grades Curriculum Focus School Year Single-Gender School
Virtual/ Online School
Serves Multiple Districts
Parental Involvement Requirement
Enrollment Restrictions
Georgia Connections
Academy 2011
Connections Academy
K-12 Online Curriculum Normal No Yes Online Not Specified Students
residing in State of GA

State Charter Schools Performance Evaluation, 2016/17
Georgia Connections Academy
105
Students Served
School Name Pct. Female Pct. White Pct. Black Pct.
Hispanic Pct. Other
Race Pct. FRL Pct. Direct
Cert Pct. LEP Pct. SWD Pct. Gifted
GA Connections 53.7 50.6 34.7 7.3 7.4 44.1 24 0.4 11.3 6.6
Value-Added and SGP Results Summary by Grade Level and Subject
Overall School Effect: -0.1898 Elementary / -0.1086 Middle/ 0.1714 9th Grade Literature/ 0.0731 American Literature/ -0.1410 Algebra 1/ -0.0573 Biology/ -0.1517 Economics/ -0.1616 Geometry/ -0.1045 Physical Science/ -0.2930 U.S. History
Georgia Connections Academy’s contribution to an elementary student’s average achievement across ELA and Math is lower than that of the average elementary school in the state, and its contribution to a middle school student’s cross-subject average achievement is also lower than that of the average middle school in the state. It is important to note that averaging achievement scores across subjects masks any variation in school performance between subject areas. As a result, the table below also includes the school’s effect on student achievement in each subject area.
In high school, Georgia Connections outperformed the average school in the state in 9th Grade Literature and American Literature, but performed below the state average in Algebra 1, Economics, Geometry, Physical Science, and U.S. History. Performance was indistinguishable from the state average in Biology.
Value-Added (Controls for Student Demographics and Prior Test Scores)
Student Growth Percentiles (Controls only for Prior Test Scores)
Grade Level and Subject School Effect
State Percentile (higher is better)
Statistically Different
from State Average?
District Rank
(lower is better)
District Average
Statistically Different
from District Average?
School Mean of Individual
SGPs
State Percentile (higher is
better)
District Rank
(lower is better)
Elementary
ELA -0.0562 26 No 46 23
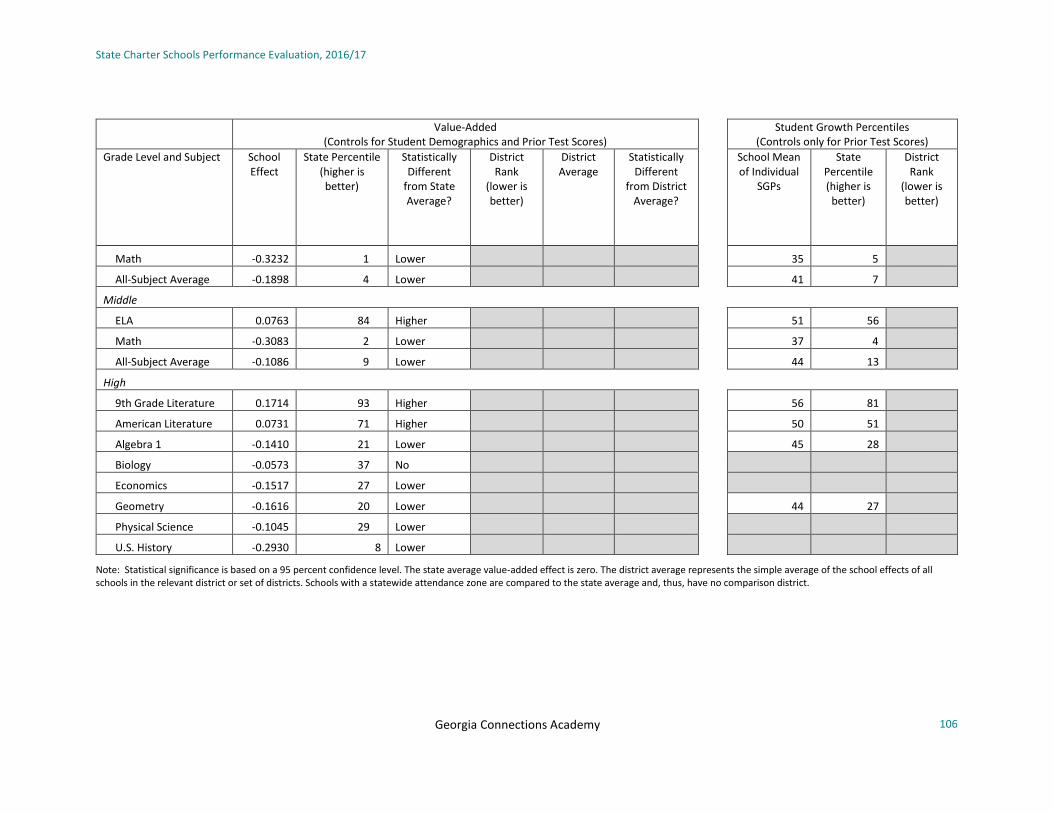
State Charter Schools Performance Evaluation, 2016/17
Georgia Connections Academy
106
Value-Added (Controls for Student Demographics and Prior Test Scores)
Student Growth Percentiles (Controls only for Prior Test Scores)
Grade Level and Subject School Effect
State Percentile (higher is better)
Statistically Different
from State Average?
District Rank
(lower is better)
District Average
Statistically Different
from District Average?
School Mean of Individual
SGPs
State Percentile (higher is
better)
District Rank
(lower is better)
Math -0.3232 1 Lower 35 5
All-Subject Average -0.1898 4 Lower 41 7
Middle
ELA 0.0763 84 Higher 51 56
Math -0.3083 2 Lower 37 4
All-Subject Average -0.1086 9 Lower 44 13
High
9th Grade Literature 0.1714 93 Higher 56 81
American Literature 0.0731 71 Higher 50 51
Algebra 1 -0.1410 21 Lower 45 28
Biology -0.0573 37 No
Economics -0.1517 27 Lower
Geometry -0.1616 20 Lower 44 27
Physical Science -0.1045 29 Lower
U.S. History -0.2930 8 Lower
Note: Statistical significance is based on a 95 percent confidence level. The state average value-added effect is zero. The district average represents the simple average of the school effects of all schools in the relevant district or set of districts. Schools with a statewide attendance zone are compared to the state average and, thus, have no comparison district.

State Charter Schools Performance Evaluation, 2016/17
Georgia Connections Academy
107
Comparison of 2016/17, 2015/16, and 2014/15 Value-Added and SGP Summary Results
Georgia Connections Academy’s performance in elementary ELA, elementary Math, middle school ELA, and middle school Math has been consistent across the three years. At the high school level, its performance has been mixed each year. Performance has tended to be higher than the state in 9th Grade Literature and American Literature. In other subjects, performance has either been indistinguishable from the state or below the state.
Value-Added (Controls for Student Demographics and Prior Test Scores)
2014/15 2015/16 2016/17*
Grade Level and Subject
School Effect
Statistically Different
from State Average?
District Average
Statistically Different
from District Average?
School Effect
Statistically Different
from State Average?
District Average
Statistically Different
from District Average?
School Effect
Statistically Different
from State Average?
District Average
Statistically Different
from District Average?
Elementary
ELA -0.0568 No 0.0467 No -0.0562 No
Math -0.2349 Lower -0.2548 Lower -0.3232 Lower
Science -0.0632 No -0.0400 No
Social Studies -0.1670 Lower -0.2075 Lower
All-Subject Average -0.1289 Lower -0.1140 Lower -0.1898 Lower
Middle
ELA 0.0776 Higher 0.1242 Higher 0.0763 Higher
Math -0.1768 Lower -0.2552 Lower -0.3083 Lower
Science -0.0144 No -0.0369 No
Social Studies -0.2190 Lower -0.2003 Lower
All-Subject Average -0.0727 Lower -0.0827 Lower -0.1086 Lower
High
9th Grade Literature 0.1201 Higher 0.2357 Higher 0.1714 Higher
American Literature 0.0963 Higher 0.1316 Higher 0.0731 Higher
Analytic Geometry -0.0337 No

State Charter Schools Performance Evaluation, 2016/17
Georgia Connections Academy
108
Value-Added
(Controls for Student Demographics and Prior Test Scores)
2014/15 2015/16 2016/17*
Grade Level and Subject
School Effect
Statistically Different
from State Average?
District Average
Statistically Different
from District Average?
School Effect
Statistically Different
from State Average?
District Average
Statistically Different
from District Average?
School Effect
Statistically Different
from State Average?
District Average
Statistically Different
from District Average?
Algebra 1 -0.0593 Lower -0.1410 Lower
Biology 0.0291 No -0.0064 No -0.0573 No
Coordinate Algebra 0.0295 No
Economics -0.1466 Lower -0.4659 Lower -0.1517 Lower
Geometry -0.0346 No -0.1616 Lower
Physical Science -0.1806 Lower -0.1483 Lower -0.1045 Lower
U.S. History -0.3918 Lower -0.2694 Lower -0.2930 Lower
Note: Statistical significance is based on a 95 percent confidence level. The state average value-added effect is zero. The district average represents the simple average of the school effects of all schools in the relevant district or set of districts. Schools with a statewide attendance zone are compared to the state average and, thus, have no comparison district.
*For 2016/17 the school-level measure of "Direct Certification" employed in the value-added calculations differs from the measure employed in prior years. Direct Certification represents students who either live in a family unit receiving SNAP benefits, live in family unit receiving TANF benefits, are identified as homeless, are in foster care or are migrant. Due to data limitations, students in foster care were not included in the direct certification tally in 2016/17.
Student Growth Percentiles
(Controls only for Prior Test Scores)
2014/15 2015/16 2016/17
Grade Level and Subject School Mean of
Individual SGPs
State Percentile (higher is
better)
District Rank (lower
is better)
School Mean of
Individual SGPs
State Percentile (higher is
better)
District Rank (lower
is better)
School Mean of
Individual SGPs
State Percentile (higher is
better)
District Rank (lower
is better)
Elementary
ELA 39 5 48 39 46 23
Math 42 20 40 16 35 5

State Charter Schools Performance Evaluation, 2016/17
Georgia Connections Academy
109
Student Growth Percentiles
(Controls only for Prior Test Scores)
2014/15 2015/16 2016/17
Grade Level and Subject School Mean of
Individual SGPs
State Percentile (higher is
better)
District Rank (lower
is better)
School Mean of
Individual SGPs
State Percentile (higher is
better)
District Rank (lower
is better)
School Mean of
Individual SGPs
State Percentile (higher is
better)
District Rank (lower
is better)
Science 44 19 42 15
Social Studies 46 32 46 33
All-Subject Average 42 11 44 20 41 7
Middle
ELA 46 23 50 52 51 56
Math 41 12 38 11 37 4
Science 45 25 43 19
Social Studies 43 19 41 15
All-Subject Average 44 15 43 15 44 13
High
9th Grade Literature 49 42 55 79 56 81
American Literature 49 47 51 61 50 51
Analytic Geometry 51 60
Algebra 1 46 40 45 28
Biology 48 45 48 47
Coordinate Algebra 54 67
Economics 53 61 40 20
Geometry 43 36 44 27
Physical Science 38 12 37 12
U.S. History 32 7 39 20
Note: Schools with a statewide attendance zone are compared to the state average and, thus, have no comparison district.
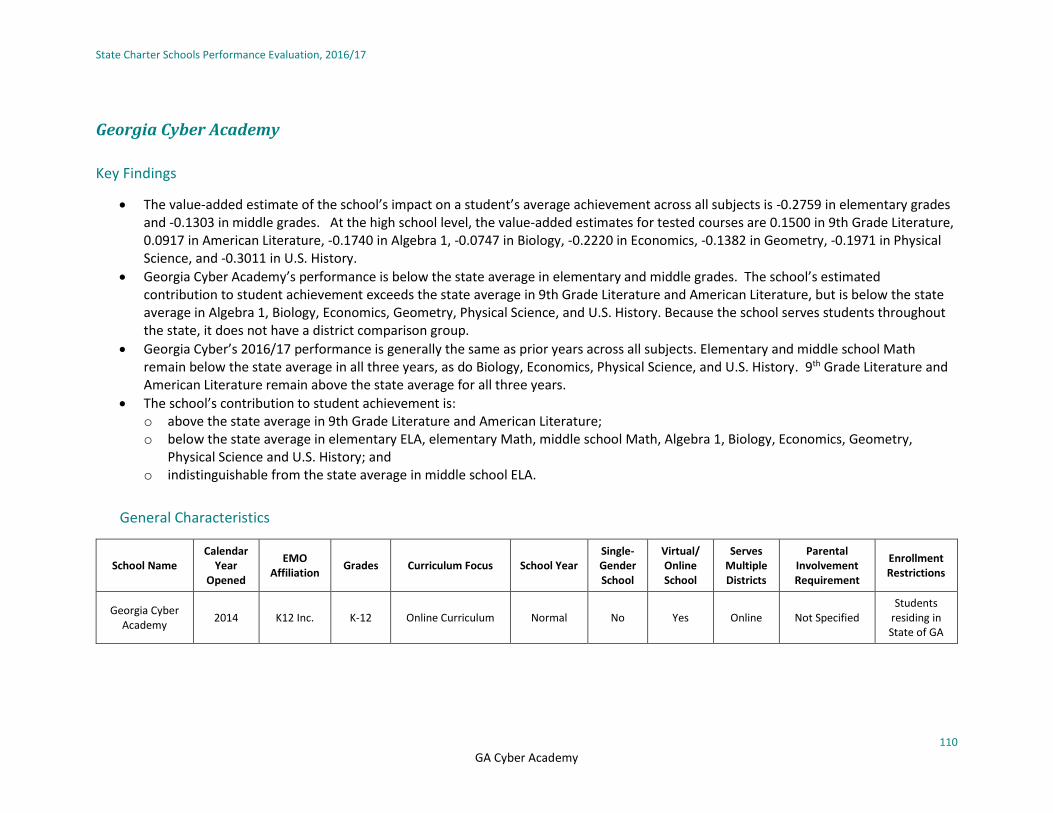
State Charter Schools Performance Evaluation, 2016/17
110 GA Cyber Academy
Georgia Cyber Academy
Key Findings
• The value-added estimate of the school’s impact on a student’s average achievement across all subjects is -0.2759 in elementary grades and -0.1303 in middle grades. At the high school level, the value-added estimates for tested courses are 0.1500 in 9th Grade Literature, 0.0917 in American Literature, -0.1740 in Algebra 1, -0.0747 in Biology, -0.2220 in Economics, -0.1382 in Geometry, -0.1971 in Physical Science, and -0.3011 in U.S. History.
• Georgia Cyber Academy’s performance is below the state average in elementary and middle grades. The school’s estimated contribution to student achievement exceeds the state average in 9th Grade Literature and American Literature, but is below the state average in Algebra 1, Biology, Economics, Geometry, Physical Science, and U.S. History. Because the school serves students throughout the state, it does not have a district comparison group.
• Georgia Cyber’s 2016/17 performance is generally the same as prior years across all subjects. Elementary and middle school Math remain below the state average in all three years, as do Biology, Economics, Physical Science, and U.S. History. 9th Grade Literature and American Literature remain above the state average for all three years.
• The school’s contribution to student achievement is: o above the state average in 9th Grade Literature and American Literature; o below the state average in elementary ELA, elementary Math, middle school Math, Algebra 1, Biology, Economics, Geometry,
Physical Science and U.S. History; and o indistinguishable from the state average in middle school ELA.
General Characteristics
School Name Calendar
Year Opened
EMO Affiliation
Grades Curriculum Focus School Year Single-Gender School
Virtual/ Online School
Serves Multiple Districts
Parental Involvement Requirement
Enrollment Restrictions
Georgia Cyber Academy
2014 K12 Inc. K-12 Online Curriculum Normal No Yes Online Not Specified Students
residing in State of GA

State Charter Schools Performance Evaluation, 2016/17
Georgia Cyber Academy
111
Students Served
School Name Pct. Female Pct. White Pct. Black Pct.
Hispanic Pct. Other
Race Pct. FRL Pct. Direct
Cert Pct. LEP Pct. SWD Pct. Gifted
GA Cyber 51.9 50.0 34.2 7.6 8.2 60.3 34 0.7 13.3 9.5
Value-Added and SGP Results Summary by Grade Level and Subject
Overall School Effect: -0.2759 Elementary / -0.1303 Middle/ 0.1500 9th Grade Literature/ 0.0917 American Literature/ -0.1740 Algebra 1/ -0.0747 Biology/ -0.2220 Economics/ -0.1382 Geometry/ -0.1971 Physical Science/ -0.3011 U.S. History
Georgia Cyber’s contribution to an elementary student’s average achievement across ELA and Math is lower than that of the average elementary school in the state, and its contribution to a middle school student’s cross-subject average achievement is also lower than that of the average middle school in the state. It is important to note that averaging achievement scores across subjects masks any variation in school performance between subject areas. As a result, the table below also includes the school’s effect on student achievement in each subject area.
In high school, Georgia Cyber outperformed the state average in 9th Grade Literature and American Literature, but performed below the state average in Algebra 1, Biology, Economics, Geometry, Physical Science, and U.S. History.
Value-Added (Controls for Student Demographics and Prior Test Scores)
Student Growth Percentiles (Controls only for Prior Test Scores)
Grade Level and Subject School Effect
State Percentile (higher is better)
Statistically Different from State Average?
District Rank (lower is better)
District Average
Statistically Different from
District Average?
School Mean of Individual
SGPs
State Percentile (higher is
better)
District Rank (lower is better)
Elementary
ELA -0.1621 6 Lower 44 16
Math -0.3842 1 Lower 34 4
All-Subject Average -0.2759 1 Lower 39 5
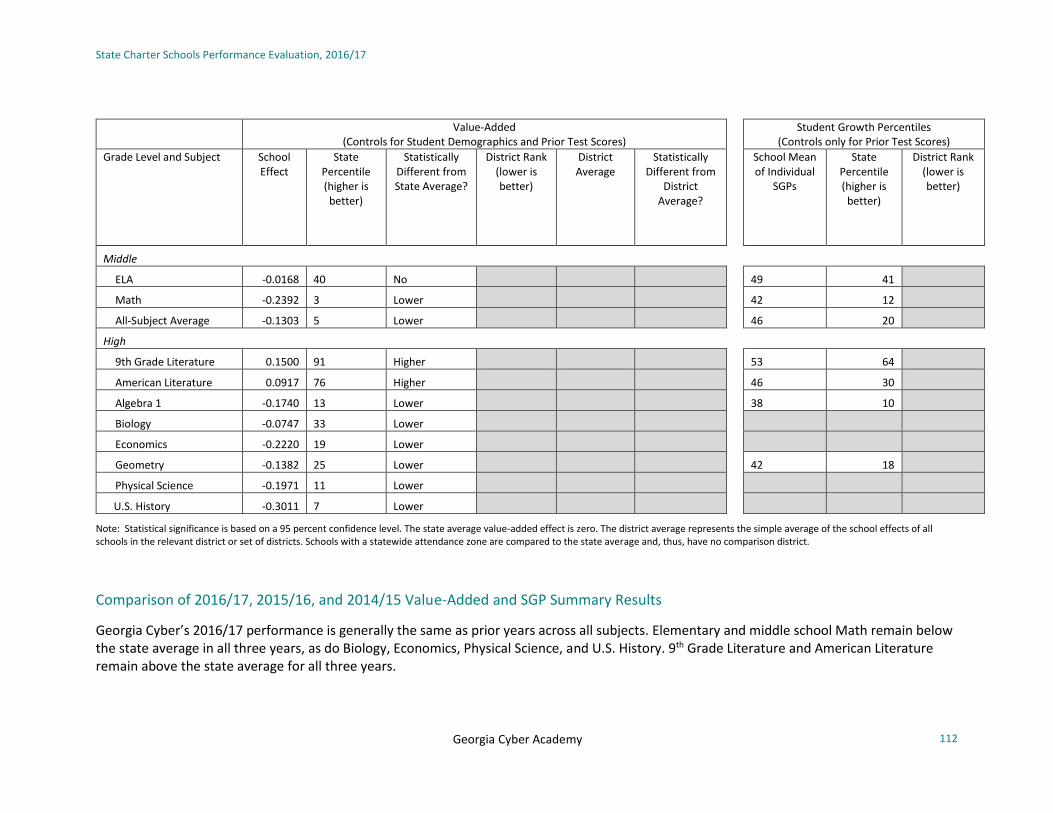
State Charter Schools Performance Evaluation, 2016/17
Georgia Cyber Academy
112
Value-Added (Controls for Student Demographics and Prior Test Scores)
Student Growth Percentiles (Controls only for Prior Test Scores)
Grade Level and Subject School Effect
State Percentile (higher is better)
Statistically Different from State Average?
District Rank (lower is better)
District Average
Statistically Different from
District Average?
School Mean of Individual
SGPs
State Percentile (higher is
better)
District Rank (lower is better)
Middle
ELA -0.0168 40 No 49 41
Math -0.2392 3 Lower 42 12
All-Subject Average -0.1303 5 Lower 46 20
High
9th Grade Literature 0.1500 91 Higher 53 64
American Literature 0.0917 76 Higher 46 30
Algebra 1 -0.1740 13 Lower 38 10
Biology -0.0747 33 Lower
Economics -0.2220 19 Lower
Geometry -0.1382 25 Lower 42 18
Physical Science -0.1971 11 Lower
U.S. History -0.3011 7 Lower
Note: Statistical significance is based on a 95 percent confidence level. The state average value-added effect is zero. The district average represents the simple average of the school effects of all schools in the relevant district or set of districts. Schools with a statewide attendance zone are compared to the state average and, thus, have no comparison district.
Comparison of 2016/17, 2015/16, and 2014/15 Value-Added and SGP Summary Results
Georgia Cyber’s 2016/17 performance is generally the same as prior years across all subjects. Elementary and middle school Math remain below the state average in all three years, as do Biology, Economics, Physical Science, and U.S. History. 9th Grade Literature and American Literature remain above the state average for all three years.

State Charter Schools Performance Evaluation, 2016/17
Georgia Cyber Academy
113
Value-Added
(Controls for Student Demographics and Prior Test Scores)
2014/15 2015/16 2016/17*
Grade Level and Subject
School Effect
Statistically Different
from State Average?
District Average
Statistically Different
from District Average?
School Effect
Statistically Different
from State Average?
District Average
Statistically Different
from District Average?
School Effect
Statistically Different
from State Average?
District Average
Statistically Different
from District Average?
Elementary
ELA -0.0441 Lower -0.0992 Lower -0.1621 Lower
Math -0.1211 Lower -0.2910 Lower -0.3842 Lower
Science -0.0669 Lower -0.0553 Lower
Social Studies -0.1755 Lower -0.2033 Lower
All-Subject Average -0.1051 Lower -0.1598 Lower -0.2759 Lower
Middle
ELA -0.0355 Lower 0.0052 No -0.0168 No
Math -0.1212 Lower -0.1848 Lower -0.2392 Lower
Science -0.0576 Lower -0.0272 Lower
Social Studies -0.2333 Lower -0.2302 Lower
All-Subject Average -0.1100 Lower -0.1084 Lower -0.1303 Lower
High
9th Grade Literature 0.1483 Higher 0.0619 Higher 0.1500 Higher
American Literature 0.1835 Higher 0.1949 Higher 0.0917 Higher
Analytic Geometry -0.1083 Lower -0.1428 Lower
Algebra 1 -0.1354 Lower -0.1740 Lower
Biology -0.1641 Lower -0.2194 Lower -0.0747 Lower
Coordinate Algebra 0.0100 No
Economics -0.0789 Lower -0.2020 Lower -0.2220 Lower
Geometry -0.1382 Lower
Physical Science -0.1607 Lower -0.2391 Lower -0.1971 Lower

State Charter Schools Performance Evaluation, 2016/17
Georgia Cyber Academy
114
Value-Added
(Controls for Student Demographics and Prior Test Scores)
2014/15 2015/16 2016/17*
Grade Level and Subject
School Effect
Statistically Different
from State Average?
District Average
Statistically Different
from District Average?
School Effect
Statistically Different
from State Average?
District Average
Statistically Different
from District Average?
School Effect
Statistically Different
from State Average?
District Average
Statistically Different
from District Average?
U.S. History -0.3006 Lower -0.3372 Lower -0.3011 Lower
Note: Statistical significance is based on a 95 percent confidence level. The state average value-added effect is zero. The district average represents the simple average of the school effects of all schools in the relevant district or set of districts. Schools with a statewide attendance zone are compared to the state average and, thus, have no comparison district.
*For 2016/17 the school-level measure of "Direct Certification" employed in the value-added calculations differs from the measure employed in prior years. Direct Certification represents students who either live in a family unit receiving SNAP benefits, live in family unit receiving TANF benefits, are identified as homeless, are in foster care or are migrant. Due to data limitations, students in foster care were not included in the direct certification tally in 2016/17.
Student Growth Percentiles
(Controls only for Prior Test Scores)
2014/15 2015/16 2016/17
Grade Level and Subject School Mean of
Individual SGPs
State Percentile (higher is
better)
District Rank (lower
is better)
School Mean of
Individual SGPs
State Percentile (higher is
better)
District Rank (lower
is better)
School Mean of
Individual SGPs
State Percentile (higher is
better)
District Rank (lower
is better)
Elementary
ELA 43 14 42 10 44 16
Math 43 24 36 8 34 4
Science 44 21 44 23
Social Studies 48 39 45 28
All-Subject Average 44 18 42 12 39 5
Middle
ELA 44 12 45 22 49 41
Math 48 38 42 20 42 12

State Charter Schools Performance Evaluation, 2016/17
Georgia Cyber Academy
115
Student Growth Percentiles
(Controls only for Prior Test Scores)
2014/15 2015/16 2016/17
Grade Level and Subject School Mean of
Individual SGPs
State Percentile (higher is
better)
District Rank (lower
is better)
School Mean of
Individual SGPs
State Percentile (higher is
better)
District Rank (lower
is better)
School Mean of
Individual SGPs
State Percentile (higher is
better)
District Rank (lower
is better)
Science 46 30 46 28
Social Studies 44 22 40 12
All-Subject Average 45 22 43 15 46 20
High
9th Grade Literature 51 56 49 44 53 64
American Literature 54 69 50 53 46 30
Analytic Geometry 48 44 41 20
Algebra 1 39 16 38 10
Biology 35 7 35 8
Coordinate Algebra 51 52
Economics 53 59 49 50
Geometry 42 18
Physical Science 43 25 37 12
U.S. History 35 12 33 9
Note: Schools with a statewide attendance zone are compared to the state average and, thus, have no comparison district.

State Charter Schools Performance Evaluation, 2016/17
Georgia School for Innovation and the Classics
116
Georgia School for Innovation and the Classics
Key Findings
• Georgia School for Innovation and the Classics’ estimated value-added impact on a student’s average achievement across all subjects is -0.0421 in elementary grades and -0.0235 in middle grades.
• The school’s performance is indistinguishable from the state average in both elementary and middle grades. Because the school serves students throughout the state, it does not have a district comparison group.
• Georgia School for Innovation and the Classics’ performance in 2016/17 is generally improved from its performance in 2015/16. Last year, the school’s performance was below the state in elementary ELA, elementary Math, and middle school Math. This year, its performance is indistinguishable in all tested subjects.
• The school’s contribution to student achievement is: o indistinguishable from the state average in elementary ELA, elementary Math, middle school ELA and middle school Math.
General Characteristics
School Name Calendar
Year Opened
EMO Affiliation
Grades Curriculum Focus School Year
Single-Gender School
Virtual/ Online School
Serves Multiple Districts
Parental Involvement Requirement
Enrollment Restrictions
Georgia School for Innovation and the
Classics 2015 No K-7
Classical education approach with career
pathways for secondary students (Linguistics, Nuclear
Tech, Sustainable Ag, Entertainment Tech)
Normal No No Yes Not Specified Students residing
in State of GA

State Charter Schools Performance Evaluation, 2016/17
Georgia School for Innovation and the Classics
117
Students Served
School Name Pct. Female Pct. White Pct. Black Pct.
Hispanic Pct. Other
Race Pct. FRL Pct. Direct
Cert Pct. LEP Pct. SWD Pct. Gifted
GA Innovation 49.3 69.4 20.6 4.2 5.8 0.0 21.3 0.2 10.6 6.1
Value-Added and SGP Results Summary by Grade Level and Subject
Overall School Effect: -0.0421 Elementary / -0.0235 Middle
Georgia School for Innovation and the Classics’ contribution to an elementary student’s average achievement across ELA and Math is indistinguishable from that of the average elementary school in the state. The school’s contribution to a middle school student’s cross-subject average achievement is also indistinguishable from that of the average middle school in the state. It is important to note that averaging achievement scores across subjects masks any variation in school performance between subject areas. As a result, the table below also includes the school’s effect on student achievement in each subject area.
Value-Added (Controls for Student Demographics and Prior Test Scores)
Student Growth Percentiles (Controls only for Prior Test Scores)
Grade Level and Subject School Effect
State Percentile (higher is
better)
Statistically Different from
State Average?
District Rank (lower is better)
District Average
Statistically Different from
District Average?
School Mean of Individual
SGPs
State Percentile (higher is better)
District Rank (lower is better)
Elementary
ELA -0.0720 20 No 52 63
Math -0.0106 46 No 58 83
All-Subject Average -0.0421 33 No 55 79
Middle
ELA 0.0155 57 No 53 75
Math -0.0298 39 No 54 68

State Charter Schools Performance Evaluation, 2016/17
Georgia School for Innovation and the Classics
118
Value-Added (Controls for Student Demographics and Prior Test Scores)
Student Growth Percentiles (Controls only for Prior Test Scores)
Grade Level and Subject School Effect
State Percentile (higher is
better)
Statistically Different from
State Average?
District Rank (lower is better)
District Average
Statistically Different from
District Average?
School Mean of Individual
SGPs
State Percentile (higher is better)
District Rank (lower is better)
All-Subject Average -0.0235 40 No 53 72
High
9th Grade Literature
American Literature
Algebra 1
Biology
Economics
Geometry
Physical Science
U.S. History
Note: Statistical significance is based on a 95 percent confidence level. The state average value-added effect is zero. The district average represents the simple average of the school effects of all schools in the relevant district or set of districts. Schools with a statewide attendance zone are compared to the state average and, thus, have no comparison district.
Comparison of 2016/17, 2015/16, and 2014/15 Value-Added and SGP Summary Results
Georgia School for Innovation and the Classics’ performance in 2016/17 is generally improved from its performance in 2015/16. Last year, the school was below the state in elementary ELA, elementary Math, and middle school Math. This year, it is indistinguishable in all tested subjects.
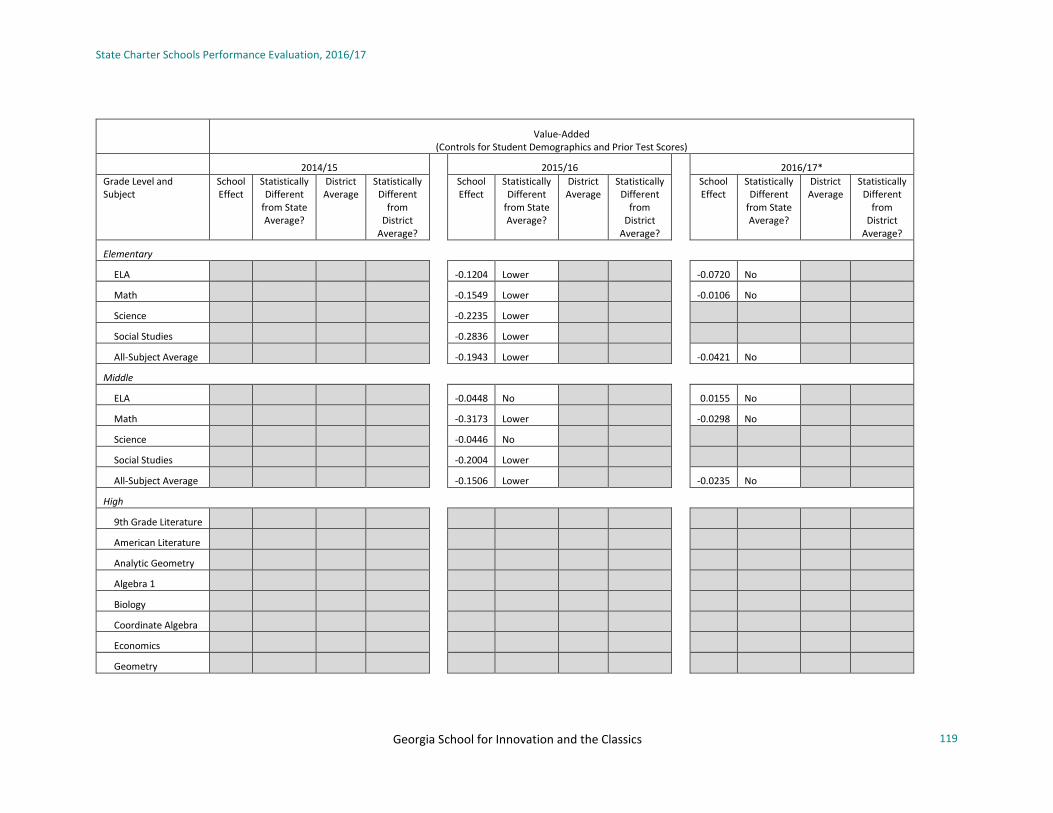
State Charter Schools Performance Evaluation, 2016/17
Georgia School for Innovation and the Classics
119
Value-Added
(Controls for Student Demographics and Prior Test Scores)
2014/15 2015/16 2016/17*
Grade Level and Subject
School Effect
Statistically Different
from State Average?
District Average
Statistically Different
from District
Average?
School Effect
Statistically Different
from State Average?
District Average
Statistically Different
from District
Average?
School Effect
Statistically Different
from State Average?
District Average
Statistically Different
from District
Average?
Elementary
ELA -0.1204 Lower -0.0720 No
Math -0.1549 Lower -0.0106 No
Science -0.2235 Lower
Social Studies -0.2836 Lower
All-Subject Average -0.1943 Lower -0.0421 No
Middle
ELA -0.0448 No 0.0155 No
Math -0.3173 Lower -0.0298 No
Science -0.0446 No
Social Studies -0.2004 Lower
All-Subject Average -0.1506 Lower -0.0235 No
High
9th Grade Literature
American Literature
Analytic Geometry
Algebra 1
Biology
Coordinate Algebra
Economics
Geometry

State Charter Schools Performance Evaluation, 2016/17
Georgia School for Innovation and the Classics
120
Value-Added
(Controls for Student Demographics and Prior Test Scores)
2014/15 2015/16 2016/17*
Grade Level and Subject
School Effect
Statistically Different
from State Average?
District Average
Statistically Different
from District
Average?
School Effect
Statistically Different
from State Average?
District Average
Statistically Different
from District
Average?
School Effect
Statistically Different
from State Average?
District Average
Statistically Different
from District
Average?
Physical Science
U.S. History
Note: Statistical significance is based on a 95 percent confidence level. The state average value-added effect is zero. The district average represents the simple average of the school effects of all schools in the relevant district or set of districts. Schools with a statewide attendance zone are compared to the state average and, thus, have no comparison district.
*For 2016/17 the school-level measure of "Direct Certification" employed in the value-added calculations differs from the measure employed in prior years. Direct Certification represents students who either live in a family unit receiving SNAP benefits, live in family unit receiving TANF benefits, are identified as homeless, are in foster care or are migrant. Due to data limitations, students in foster care were not included in the direct certification tally in 2016/17.
Student Growth Percentiles
(Controls only for Prior Test Scores)
2014/15 2015/16 2016/17
Grade Level and Subject School Mean of
Individual SGPs
State Percentile (higher is
better)
District Rank (lower
is better)
School Mean of
Individual SGPs
State Percentile (higher is
better)
District Rank (lower
is better)
School Mean of
Individual SGPs
State Percentile (higher is
better)
District Rank (lower
is better)
Elementary
ELA 47 34 52 63
Math 43 25 58 83
Science 41 12
Social Studies 42 19
All-Subject Average 43 17 55 79
Middle
ELA 49 48 53 75
Math 34 5 54 68

State Charter Schools Performance Evaluation, 2016/17
Georgia School for Innovation and the Classics
121
Student Growth Percentiles
(Controls only for Prior Test Scores)
2014/15 2015/16 2016/17
Grade Level and Subject School Mean of
Individual SGPs
State Percentile (higher is
better)
District Rank (lower
is better)
School Mean of
Individual SGPs
State Percentile (higher is
better)
District Rank (lower
is better)
School Mean of
Individual SGPs
State Percentile (higher is
better)
District Rank (lower
is better)
Science 48 40
Social Studies 45 26
All-Subject Average 44 17 53 72
High
9th Grade Literature
American Literature
Analytic Geometry
Algebra 1
Biology
Coordinate Algebra
Economics
Geometry
Physical Science
U.S. History
Note: Schools with a statewide attendance zone are compared to the state average and, thus, have no comparison district.

State Charter Schools Performance Evaluation, 2016/17
Graduation Achievement Charter High School (formerly Provost Academy)
122
Graduation Achievement Charter High School (Formerly Provost Academy)
Key Findings
• Graduation Achievement Charter High School’s estimated contribution to student achievement in courses where end-of-course exams are given were -0.2473 in 9th Grade Literature, -0.0499 in American Literature, 0.0038 in Biology, -0.2289 in Economics, -0.1238 in Physical Science, and -0.2403 in U.S. History.
• In half of the tested subjects, Graduation Achievement Charter High School’s performance is indistinguishable from the performance of the average high school in the state. However, its performance is relatively weak in 9th Grade Literature, Economics, and U.S. History. Because the school serves students throughout the state, it does not have a district comparison group.
• Graduation Achievement Charter High School’s performance in 2016/17 is generally similar to its performance in 2015/16. The school showed improvement in Physical Science, but declined substantially in 9th Grade Literature.
• The school’s contribution to student achievement is: o below the state average in 9th Grade Literature, Economics, and U.S. History; and o indistinguishable from the state average in American Literature, Biology, and Physical Science.
General Characteristics
School Name Calendar
Year Opened
EMO Affiliation
Grades Curriculum Focus School Year
Single-Gender School
Virtual/ Online School
Serves Multiple Districts
Parental Involvement Requirement
Enrollment Restrictions
Graduation Achievement Charter
High School (formerly Provost
Academy)
2012 No 9-12 Online Curriculum
with STEM emphasis Normal No Yes Online Not Specified
Students residing in State of GA

State Charter Schools Performance Evaluation, 2016/17
Graduation Achievement Charter High School (formerly Provost Academy)
123
Students Served
School Name Pct. Female Pct. White Pct. Black Pct.
Hispanic Pct. Other
Race Pct. FRL Pct. Direct
Cert Pct. LEP Pct. SWD Pct. Gifted
Grad Achievement 49.6 23.0 61.3 11.7 4.1 64.4 35.1 1.4 11.2 0.0
Value-Added and SGP Results Summary by Grade Level and Subject
Overall School Effect: -0.2473 9th Grade Literature/ -0.0499 American Literature/ 0.0038 Biology/ -0.2289 Economics/ -0.1238 Physical Science/ -0.2403 U.S. History
Graduation Achievement Charter High School’s contribution to a high school student’s achievement is not statistically different from the average high school in the state in three of six subjects. Graduation Achievement Charter High School performed comparably to the average high school in the state in American Literature, Biology, and Physical Science. Its performance was below the state average in 9th Grade Literature, Economics, and U.S. History.
Value-Added (Controls for Student Demographics and Prior Test Scores)
Student Growth Percentiles (Controls only for Prior Test Scores)
Grade Level and Subject School Effect
State Percentile (higher is
better)
Statistically Different
from State Average?
District Rank (lower
is better)
District Average
Statistically Different from
District Average?
School Mean of Individual
SGPs
State Percentile (higher is
better)
District Rank (lower
is better)
Elementary
ELA
Math
All-Subject Average
Middle
ELA

State Charter Schools Performance Evaluation, 2016/17
Graduation Achievement Charter High School (formerly Provost Academy)
124
Value-Added (Controls for Student Demographics and Prior Test Scores)
Student Growth Percentiles (Controls only for Prior Test Scores)
Grade Level and Subject School Effect
State Percentile (higher is
better)
Statistically Different
from State Average?
District Rank (lower
is better)
District Average
Statistically Different from
District Average?
School Mean of Individual
SGPs
State Percentile (higher is
better)
District Rank (lower
is better)
Math
All-Subject Average
High
9th Grade Literature -0.2473 3 Lower 38 2
American Literature -0.0499 35 No 41 12
Algebra 1
Biology 0.0038 54 No
Economics -0.2289 18 Lower
Geometry
Physical Science -0.1238 27 No
U.S. History -0.2403 15 Lower
Note: Statistical significance is based on a 95 percent confidence level. The state average value-added effect is zero. The district average represents the simple average of the school effects of all schools in the relevant district or set of districts. Schools with a statewide attendance zone are compared to the state average and, thus, have no comparison district.

State Charter Schools Performance Evaluation, 2016/17
Graduation Achievement Charter High School (formerly Provost Academy)
125
Comparison of 2016/17, 2015/16, and 2014/15 Value-Added and SGP Summary Results
Graduation Achievement Charter High School’s performance in 2016/17 is generally similar to its performance in 2015/16. The school showed improvement in Physical Science, but declined substantially in 9th Grade Literature.
Value-Added (Controls for Student Demographics and Prior Test Scores)
2014/15 2015/16 2016/17*
Grade Level and Subject
School Effect
Statistically Different
from State Average?
District Average
Statistically Different
from District Average?
School Effect
Statistically Different
from State Average?
District Average
Statistically Different
from District Average?
School Effect
Statistically Different
from State Average?
District Average
Statistically Different
from District Average?
Elementary
ELA
Math
Science
Social Studies
All-Subject Average
Middle
ELA
Math
Science
Social Studies
All-Subject Average
High
9th Grade Literature 0.0032 No 0.0974 No -0.2473 Lower
American Literature -0.0686 No 0.0280 No -0.0499 No
Analytic Geometry -0.2296 Lower -0.1475 No
Algebra 1

State Charter Schools Performance Evaluation, 2016/17
Graduation Achievement Charter High School (formerly Provost Academy)
126
Value-Added
(Controls for Student Demographics and Prior Test Scores)
2014/15 2015/16 2016/17*
Grade Level and Subject
School Effect
Statistically Different
from State Average?
District Average
Statistically Different
from District Average?
School Effect
Statistically Different
from State Average?
District Average
Statistically Different
from District Average?
School Effect
Statistically Different
from State Average?
District Average
Statistically Different
from District Average?
Biology -0.1219 Lower -0.0459 No 0.0038 No
Coordinate Algebra -0.1857 Lower -0.0509 No
Economics -0.3231 Lower -0.3216 Lower -0.2289 Lower
Geometry
Physical Science -0.1848 Lower -0.1834 Lower -0.1238 No
U.S. History -0.3879 Lower -0.2978 Lower -0.2403 Lower
Note: Statistical significance is based on a 95 percent confidence level. The state average value-added effect is zero. The district average represents the simple average of the school effects of all schools in the relevant district or set of districts. Schools with a statewide attendance zone are compared to the state average and, thus, have no comparison district.
*For 2016/17 the school-level measure of "Direct Certification" employed in the value-added calculations differs from the measure employed in prior years. Direct Certification represents students who either live in a family unit receiving SNAP benefits, live in family unit receiving TANF benefits, are identified as homeless, are in foster care or are migrant. Due to data limitations, students in foster care were not included in the direct certification tally in 2016/17.
Student Growth Percentiles
(Controls only for Prior Test Scores)
2014/15 2015/16 2016/17
Grade Level and Subject School Mean of
Individual SGPs
State Percentile (higher is
better)
District Rank (lower
is better)
School Mean of
Individual SGPs
State Percentile (higher is
better)
District Rank (lower
is better)
School Mean of
Individual SGPs
State Percentile (higher is
better)
District Rank (lower
is better)
Elementary
ELA
Math
Science
Social Studies

State Charter Schools Performance Evaluation, 2016/17
Graduation Achievement Charter High School (formerly Provost Academy)
127
Student Growth Percentiles
(Controls only for Prior Test Scores)
2014/15 2015/16 2016/17
Grade Level and Subject School Mean of
Individual SGPs
State Percentile (higher is
better)
District Rank (lower
is better)
School Mean of
Individual SGPs
State Percentile (higher is
better)
District Rank (lower
is better)
School Mean of
Individual SGPs
State Percentile (higher is
better)
District Rank (lower
is better)
All-Subject Average
Middle
ELA
Math
Science
Social Studies
All-Subject Average
High
9th Grade Literature 44 24 56 83 38 2
American Literature 43 20 47 42 41 12
Analytic Geometry 38 9 39 14
Algebra 1
Biology 38 10 48 50
Coordinate Algebra 40 12 37 19
Economics 35 7 38 16
Geometry
Physical Science 39 14 34 7
U.S. History 29 3 40 24
Note: Schools with a statewide attendance zone are compared to the state average and, thus, have no comparison district.

State Charter Schools Performance Evaluation, 2016/17
128 International Charter School of Atlanta
International Charter School of Atlanta
Key Findings
• The value-added estimate of International Charter School of Atlanta’s impact on a student’s average achievement in Math and ELA is -0.0327 in elementary grades.
• International Charter School of Atlanta’s performance is not statistically different from the state in elementary ELA, but is below the state in elementary Math. Because the school serves students throughout the state, it does not have a district comparison group.
• International Charter School’s performance in 2016/17 is generally consistent with the 2015/16 school year. The school declined slightly in elementary Math, moving from being indistinguishable from the state to below the state.
• The school’s contribution to student achievement is: o below the state average in elementary Math; and o indistinguishable from the state average in elementary ELA.
General Characteristics
School Name Calendar
Year Opened
EMO Affiliation
Grades Curriculum Focus School Year
Single-Gender School
Virtual/ Online School
Serves Multiple Districts
Parental Involvement Requirement
Enrollment Restrictions
International Charter School of Atlanta
2015 No K-5
Language immersion emphasis (French, German, Spanish,
Mandarin)
Normal No No Yes Not Specified Students residing
in State of GA
Students Served
School Name Pct. Female Pct. White Pct. Black Pct.
Hispanic Pct. Other
Race Pct. FRL Pct. Direct
Cert Pct. LEP Pct. SWD Pct. Gifted
International 53.4 39.7 31.8 13.7 14.8 1.5 7.6 7.3 6.2 7.1
About half of the “other race” students (6.7 percent of the total) are Asian.

State Charter Schools Performance Evaluation, 2016/17
International Charter School of Atlanta
129
Value-Added and SGP Results Summary by Grade Level and Subject
Overall School Effect: -0.0327 Elementary
International Charter School of Atlanta’s contribution to an elementary school student’s achievement is not statistically different from the average elementary school in the state. The school’s estimated contribution to student achievement is not statistically different from the state in elementary ELA, but is below the state in elementary Math.
Value-Added (Controls for Student Demographics and Prior Test Scores)
Student Growth Percentiles (Controls only for Prior Test Scores)
Grade Level and Subject School Effect
State Percentile (higher is
better)
Statistically Different from
State Average?
District Rank (lower is better)
District Average
Statistically Different from
District Average?
School Mean of Individual
SGPs
State Percentile (higher is better)
District Rank (lower is better)
Elementary
ELA 0.0377 64 No 50 48
Math -0.1034 21 Lower 46 32
All-Subject Average -0.0327 36 No 48 35
Middle
ELA
Math
All-Subject Average
High
9th Grade Literature
American Literature
Algebra 1
Biology
Economics
Geometry

State Charter Schools Performance Evaluation, 2016/17
International Charter School of Atlanta
130
Value-Added (Controls for Student Demographics and Prior Test Scores)
Student Growth Percentiles (Controls only for Prior Test Scores)
Grade Level and Subject School Effect
State Percentile (higher is
better)
Statistically Different from
State Average?
District Rank (lower is better)
District Average
Statistically Different from
District Average?
School Mean of Individual
SGPs
State Percentile (higher is better)
District Rank (lower is better)
Physical Science
U.S. History
Note: Statistical significance is based on a 95 percent confidence level. The state average value-added effect is zero. The district average represents the simple average of the school effects of all schools in the relevant district or set of districts. Schools with a statewide attendance zone are compared to the state average and, thus, have no comparison district.
Comparison of 2016/17, 2015/16, and 2014/15 Value-Added and SGP Summary Results
International Charter School’s performance in 2016/17 is generally consistent with the 2015/16 school year. The school declined slightly in elementary Math, moving from being indistinguishable from the state to below the state.
Value-Added
(Controls for Student Demographics and Prior Test Scores)
2014/15 2015/16 2016/17*
Grade Level and Subject
School Effect
Statistically Different
from State Average?
District Average
Statistically Different
from District Average?
School Effect
Statistically Different
from State Average?
District Average
Statistically Different
from District Average?
School Effect
Statistically Different
from State Average?
District Average
Statistically Different
from District Average?
Elementary
ELA -0.0028 No 0.0377 No
Math -0.0854 No -0.1034 Lower
Science -0.0433 No
Social Studies -0.0407 No
All-Subject Average -0.0434 No -0.0327 No

State Charter Schools Performance Evaluation, 2016/17
International Charter School of Atlanta
131
Value-Added
(Controls for Student Demographics and Prior Test Scores)
2014/15 2015/16 2016/17*
Grade Level and Subject
School Effect
Statistically Different
from State Average?
District Average
Statistically Different
from District Average?
School Effect
Statistically Different
from State Average?
District Average
Statistically Different
from District Average?
School Effect
Statistically Different
from State Average?
District Average
Statistically Different
from District Average?
Middle
ELA
Math
Science
Social Studies
All-Subject Average
High
9th Grade Literature
American Literature
Analytic Geometry
Algebra 1
Biology
Coordinate Algebra
Economics
Geometry
Physical Science
U.S. History
Note: Statistical significance is based on a 95 percent confidence level. The state average value-added effect is zero. The district average represents the simple average of the school effects of all schools in the relevant district or set of districts. Schools with a statewide attendance zone are compared to the state average and, thus, have no comparison district.
*For 2016/17 the school-level measure of "Direct Certification" employed in the value-added calculations differs from the measure employed in prior years. Direct Certification represents students who either live in a family unit receiving SNAP benefits, live in family unit receiving TANF benefits, are identified as homeless, are in foster care or are migrant. Due to data limitations, students in foster care were not included in the direct certification tally in 2016/17.

State Charter Schools Performance Evaluation, 2016/17
International Charter School of Atlanta
132
Student Growth Percentiles
(Controls only for Prior Test Scores)
2014/15 2015/16 2016/17
Grade Level and Subject School Mean of
Individual SGPs
State Percentile (higher is
better)
District Rank (lower
is better)
School Mean of
Individual SGPs
State Percentile (higher is
better)
District Rank (lower
is better)
School Mean of
Individual SGPs
State Percentile (higher is
better)
District Rank (lower
is better)
Elementary
ELA 48 41 50 48
Math 43 24 46 32
Science 48 41
Social Studies 50 53
All-Subject Average 47 37 48 35
Middle
ELA
Math
Science
Social Studies
All-Subject Average
High
9th Grade Literature
American Literature
Analytic Geometry
Algebra 1
Biology
Coordinate Algebra
Economics
Geometry
Physical Science

State Charter Schools Performance Evaluation, 2016/17
International Charter School of Atlanta
133
Student Growth Percentiles
(Controls only for Prior Test Scores)
2014/15 2015/16 2016/17
Grade Level and Subject School Mean of
Individual SGPs
State Percentile (higher is
better)
District Rank (lower
is better)
School Mean of
Individual SGPs
State Percentile (higher is
better)
District Rank (lower
is better)
School Mean of
Individual SGPs
State Percentile (higher is
better)
District Rank (lower
is better)
U.S. History
Note: Schools with a statewide attendance zone are compared to the state average and, thus, have no comparison district.

State Charter Schools Performance Evaluation, 2016/17
134 Ivy Preparatory Academy at Gwinnett
Ivy Preparatory Academy at Gwinnett
Key Findings
• The value-added estimate of Ivy Preparatory Academy at Gwinnett’s impact on a student’s average achievement across all subjects is -0.0899 in middle grades.
• Ivy Preparatory Academy at Gwinnett’s performance is lower than the average middle school in the state and in the district.
• Ivy Preparatory Academy at Gwinnett’s performance in 2016/2017 was consistent with its performance in 2015/16 and worse than its performance in 2014/15.
• The school’s contribution to student achievement is: o below the district and state averages in middle school Math; and o indistinguishable from the district and state averages in middle school ELA.
General Characteristics
School Name Calendar
Year Opened
EMO Affiliation
Grades Curriculum Focus School Year
Single-Gender School
Virtual/ Online School
Serves Multiple Districts
Parental Involvement Requirement
Enrollment Restrictions
Ivy Preparatory Academy at
Gwinnett 2008 No 6-8
Curriculum is entirely College
Preparatory. Saturday Academy is
available to struggling students.
Extended Day/Week/
Year
Girls Only
No Yes Not Specified
Students residing in Gwinnett, Fulton, and
DeKalb County School districts
Students Served
School Name Pct. Female Pct. White Pct. Black Pct.
Hispanic Pct. Other
Race Pct. FRL Pct. Direct
Cert Pct. LEP Pct. SWD Pct. Gifted
Ivy Prep. – Gwinnett 100.0 1.4 79.1 14.4 5.0 57.6 24.1 1.4 8.6 0.0
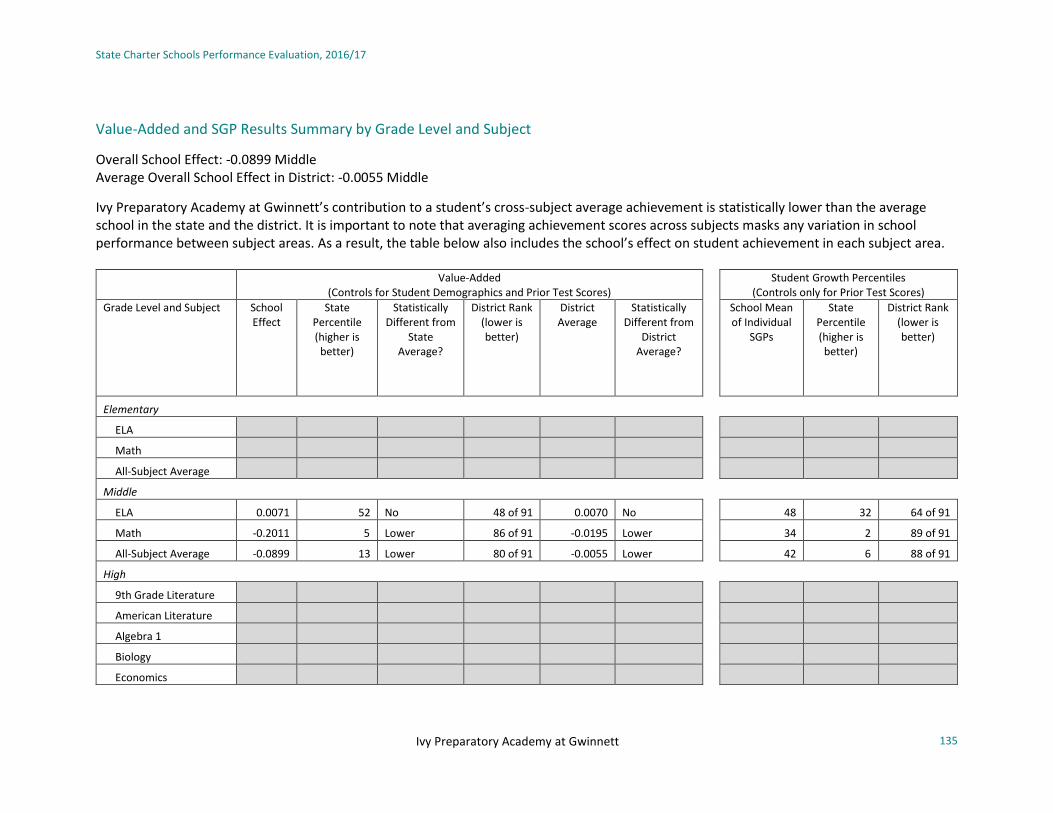
State Charter Schools Performance Evaluation, 2016/17
Ivy Preparatory Academy at Gwinnett
135
Value-Added and SGP Results Summary by Grade Level and Subject
Overall School Effect: -0.0899 Middle Average Overall School Effect in District: -0.0055 Middle Ivy Preparatory Academy at Gwinnett’s contribution to a student’s cross-subject average achievement is statistically lower than the average school in the state and the district. It is important to note that averaging achievement scores across subjects masks any variation in school performance between subject areas. As a result, the table below also includes the school’s effect on student achievement in each subject area.
Value-Added (Controls for Student Demographics and Prior Test Scores)
Student Growth Percentiles (Controls only for Prior Test Scores)
Grade Level and Subject School Effect
State Percentile (higher is
better)
Statistically Different from
State Average?
District Rank (lower is better)
District Average
Statistically Different from
District Average?
School Mean of Individual
SGPs
State Percentile (higher is better)
District Rank (lower is better)
Elementary
ELA
Math
All-Subject Average
Middle
ELA 0.0071 52 No 48 of 91 0.0070 No 48 32 64 of 91
Math -0.2011 5 Lower 86 of 91 -0.0195 Lower 34 2 89 of 91
All-Subject Average -0.0899 13 Lower 80 of 91 -0.0055 Lower 42 6 88 of 91
High
9th Grade Literature
American Literature
Algebra 1
Biology
Economics

State Charter Schools Performance Evaluation, 2016/17
Ivy Preparatory Academy at Gwinnett
136
Value-Added (Controls for Student Demographics and Prior Test Scores)
Student Growth Percentiles (Controls only for Prior Test Scores)
Grade Level and Subject School Effect
State Percentile (higher is
better)
Statistically Different from
State Average?
District Rank (lower is better)
District Average
Statistically Different from
District Average?
School Mean of Individual
SGPs
State Percentile (higher is better)
District Rank (lower is better)
Geometry
Physical Science
U.S. History
Note: Statistical significance is based on a 95 percent confidence level. The state average value-added effect is zero. The district average represents the simple average of the school effects of all schools in the relevant district or set of districts. Schools with a statewide attendance zone are compared to the state average and, thus, have no comparison district.
Comparison of 2016/17, 2015/16, and 2014/15 Value-Added and SGP Summary Results
Ivy Preparatory Academy at Gwinnett’s performance in 2016/17 was consistent with its performance in 2015/16 and worse than its performance in 2014/15. In particular, 2016/17 middle school Math performance was worse than 2014/15 performance.
Value-Added
(Controls for Student Demographics and Prior Test Scores)
2014/15 2015/16 2016/17*
Grade Level and Subject
School Effect
Statistically Different
from State Average?
District Average
Statistically Different
from District Average?
School Effect
Statistically Different
from State Average?
District Average
Statistically Different
from District Average?
School Effect
Statistically Different
from State Average?
District Average
Statistically Different
from District Average?
Elementary
ELA
Math
Science
Social Studies

State Charter Schools Performance Evaluation, 2016/17
Ivy Preparatory Academy at Gwinnett
137
Value-Added
(Controls for Student Demographics and Prior Test Scores)
2014/15 2015/16 2016/17*
Grade Level and Subject
School Effect
Statistically Different
from State Average?
District Average
Statistically Different
from District Average?
School Effect
Statistically Different
from State Average?
District Average
Statistically Different
from District Average?
School Effect
Statistically Different
from State Average?
District Average
Statistically Different
from District Average?
All-Subject Average
Middle
ELA -0.0434 No -0.0324 No -0.0567 No 0.0117 No 0.0071 No 0.0070 No
Math 0.0857 Higher -0.0114 Higher -0.2074 Lower -0.0419 Lower -0.2011 Lower -0.0195 Lower
Science -0.0814 Lower -0.0301 No -0.2024 Lower -0.0103 Lower
Social Studies 0.0400 No -0.0201 No -0.0098 No -0.0168 No
All-Subject Average 0.0060 No -0.0267 No -0.1074 Lower -0.0187 Lower -0.0899 Lower -0.0055 Lower
High
9th Grade Literature 0.2814 Higher -0.0427 Higher
American Literature
Analytic Geometry
Algebra 1
Biology -0.2535 Lower 0.0181 Lower
Coordinate Algebra 0.0800 No -0.0646 No
Economics
Geometry
Physical Science
U.S. History
Note: Statistical significance is based on a 95 percent confidence level. The state average value-added effect is zero. The district average represents the simple average of the school effects of all schools in the relevant district or set of districts. Schools with a statewide attendance zone are compared to the state average and, thus, have no comparison district.
*For 2016/17 the school-level measure of "Direct Certification" employed in the value-added calculations differs from the measure employed in prior years. Direct Certification represents students who either live in a family unit receiving SNAP benefits, live in family unit receiving TANF benefits, are identified as homeless, are in foster care or are migrant. Due to data limitations, students in foster care were not included in the direct certification tally in 2016/17.

State Charter Schools Performance Evaluation, 2016/17
Ivy Preparatory Academy at Gwinnett
138
Student Growth Percentiles
(Controls only for Prior Test Scores)
2014/15 2015/16 2016/17
Grade Level and Subject School Mean of
Individual SGPs
State Percentile (higher is
better)
District Rank (lower
is better)
School Mean of
Individual SGPs
State Percentile (higher is
better)
District Rank (lower
is better)
School Mean of
Individual SGPs
State Percentile (higher is
better)
District Rank (lower
is better)
Elementary
ELA
Math
Science
Social Studies
All-Subject Average
Middle
ELA 52 65 12 of 32 49 43 57 of 88 48 32 64 of 91
Math 53 67 11 of 32 34 4 86 of 88 34 2 89 of 91
Science 44 20 28 of 33 39 8 83 of 87
Social Studies 48 37 26 of 33 48 39 56 of 88
All-Subject Average 49 43 22 of 33 42 12 76 of 88 42 6 88 of 91
High
9th Grade Literature 63 93 1 of 22
American Literature
Analytic Geometry
Algebra 1
Biology 34 5 22 of 23
Coordinate Algebra 50 50 6 of 21
Economics
Geometry

State Charter Schools Performance Evaluation, 2016/17
Ivy Preparatory Academy at Gwinnett
139
Student Growth Percentiles
(Controls only for Prior Test Scores)
2014/15 2015/16 2016/17
Grade Level and Subject School Mean of
Individual SGPs
State Percentile (higher is
better)
District Rank (lower
is better)
School Mean of
Individual SGPs
State Percentile (higher is
better)
District Rank (lower
is better)
School Mean of
Individual SGPs
State Percentile (higher is
better)
District Rank (lower
is better)
Physical Science
U.S. History
Note: Schools with a statewide attendance zone are compared to the state average and, thus, have no comparison district.
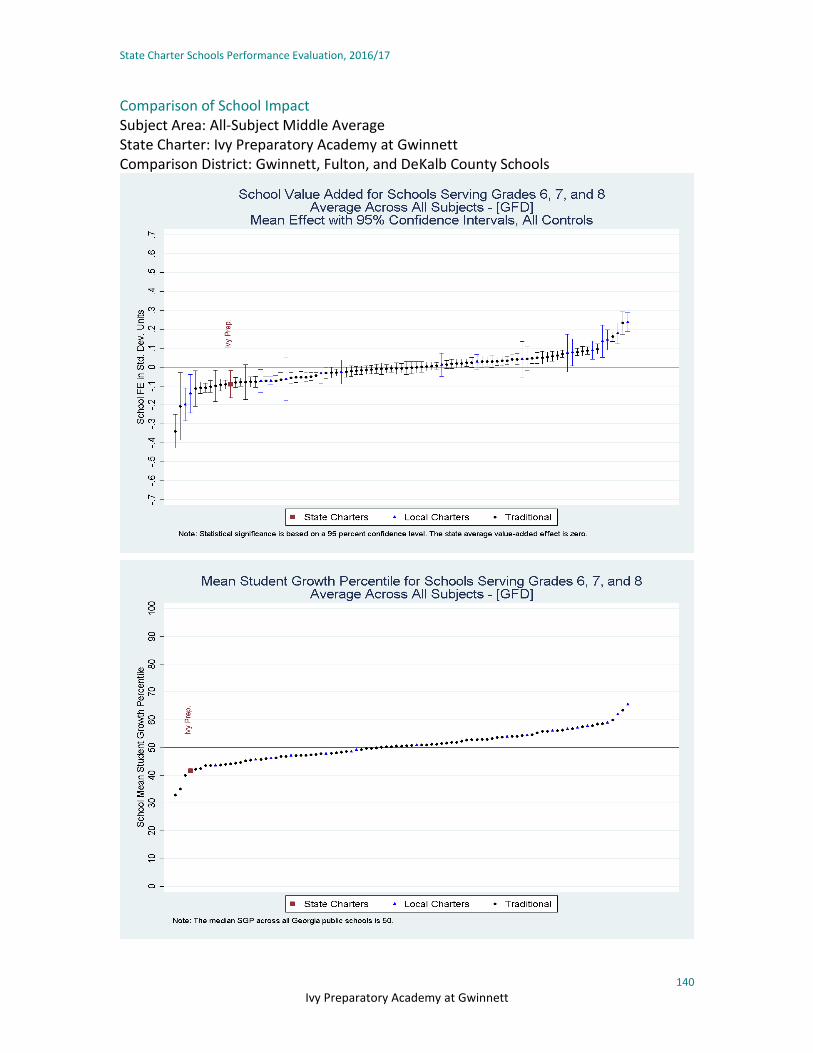
State Charter Schools Performance Evaluation, 2016/17
140 Ivy Preparatory Academy at Gwinnett
Comparison of School Impact Subject Area: All-Subject Middle Average State Charter: Ivy Preparatory Academy at Gwinnett Comparison District: Gwinnett, Fulton, and DeKalb County Schools

State Charter Schools Performance Evaluation, 2016/17
Ivy Preparatory Academy at Gwinnett
141
Subject Area: Middle ELA
State Charter: Ivy Preparatory Academy at Gwinnett Comparison District: Gwinnett, Fulton, and DeKalb County Schools
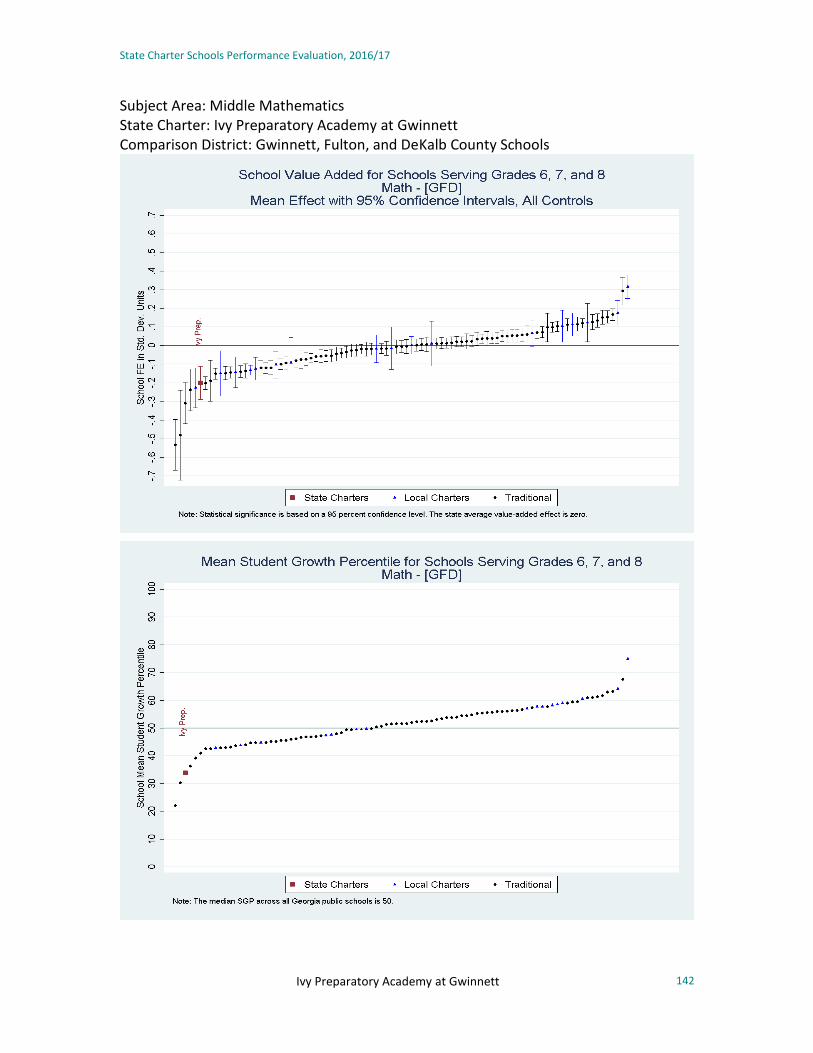
State Charter Schools Performance Evaluation, 2016/17
Ivy Preparatory Academy at Gwinnett
142
Subject Area: Middle Mathematics State Charter: Ivy Preparatory Academy at Gwinnett Comparison District: Gwinnett, Fulton, and DeKalb County Schools

State Charter Schools Performance Evaluation, 2016/17
143 Ivy Preparatory Academy at Kirkwood for Girls
Ivy Preparatory Academy at Kirkwood for Girls
Key Findings
• The value-added estimate of Ivy Preparatory Academy at Kirkwood for Girls’ impact on a student’s average achievement across all subjects is 0.2872 in elementary grades and 0.2055 in middle grades.
• The school’s performance is above the state and district averages in elementary school and middle school.
• Ivy Preparatory Academy at Kirkwood for Girls’ elementary school and middle school performance in 2016/17 improved from its performance in 2015/16 and 2014/15. In all tested subjects, the school was above the state and district averages, which has not been the case in the past.
• The school’s contribution to student achievement is: o above the district and state average in elementary ELA, elementary Math, middle school ELA and middle school Math.
General Characteristics
School Name Calendar
Year Opened
EMO Affiliation
Grades Curriculum Focus School Year
Single-Gender School
Virtual/ Online School
Serves Multiple Districts
Parental Involvement Requirement
Enrollment Restrictions
Ivy Preparatory Academy at
Kirkwood 2011 No K-8
Curriculum is entirely College
Preparatory. Saturday Academy is
available to struggling students.
Extended Day/Week/
Year
Girls Only
No Yes Not Specified
Students residing in DeKalb County
and Atlanta Public Schools
zones
Students Served
School Name Pct. Female Pct. White Pct. Black Pct.
Hispanic Pct. Other
Race Pct. FRL Pct. Direct
Cert Pct. LEP Pct. SWD Pct. Gifted
Ivy Prep. – Kirkwood 100.0 0.2 98.8 0.2 0.7 82.5 41 0.0 5.4 0.9

State Charter Schools Performance Evaluation, 2016/17
Ivy Preparatory Academy at Kirkwood for Girls
144
Value-Added and SGP Results Summary by Grade Level and Subject Overall School Effect: 0.2872 Elementary / 0.2055 Middle Average Overall School Effect in District: 0.0160 Elementary / 0.0156 Middle Ivy Preparatory Academy at Kirkwood for Girls’ contribution to an elementary student’s cross-subject average achievement is above that of the average elementary school in the state and district. Its contribution to a middle school student’s cross-subject average achievement is also above the average middle school in the state and district. It is important to note that averaging achievement scores across subjects masks any variation in school performance between subject areas. As a result, the table below also includes the school’s effect on student achievement in each subject area.
Value-Added
(Controls for Student Demographics and Prior Test Scores)
Student Growth Percentiles (Controls only for Prior Test Scores)
Grade Level and Subject School Effect
State Percentile (higher is
better)
Statistically Different from
State Average?
District Rank (lower is better)
District Average
Statistically Different from
District Average?
School Mean of Individual
SGPs
State Percentile (higher is better)
District Rank (lower is better)
Elementary
ELA 0.3597 99 Higher 1 of 141 0.0131 Higher 64 99 2 of 141
Math 0.2142 95 Higher 13 of 141 0.0184 Higher 63 95 11 of 141
All-Subject Average 0.2872 99 Higher 2 of 141 0.0160 Higher 64 99 2 of 141
Middle
ELA 0.3313 99 Higher 1 of 53 0.0205 Higher 68 99 1 of 53
Math 0.1151 84 Higher 10 of 53 0.0002 Higher 56 78 11 of 53
All-Subject Average 0.2055 98 Higher 3 of 53 0.0156 Higher 62 98 3 of 53
High
9th Grade Literature
American Literature
Algebra 1
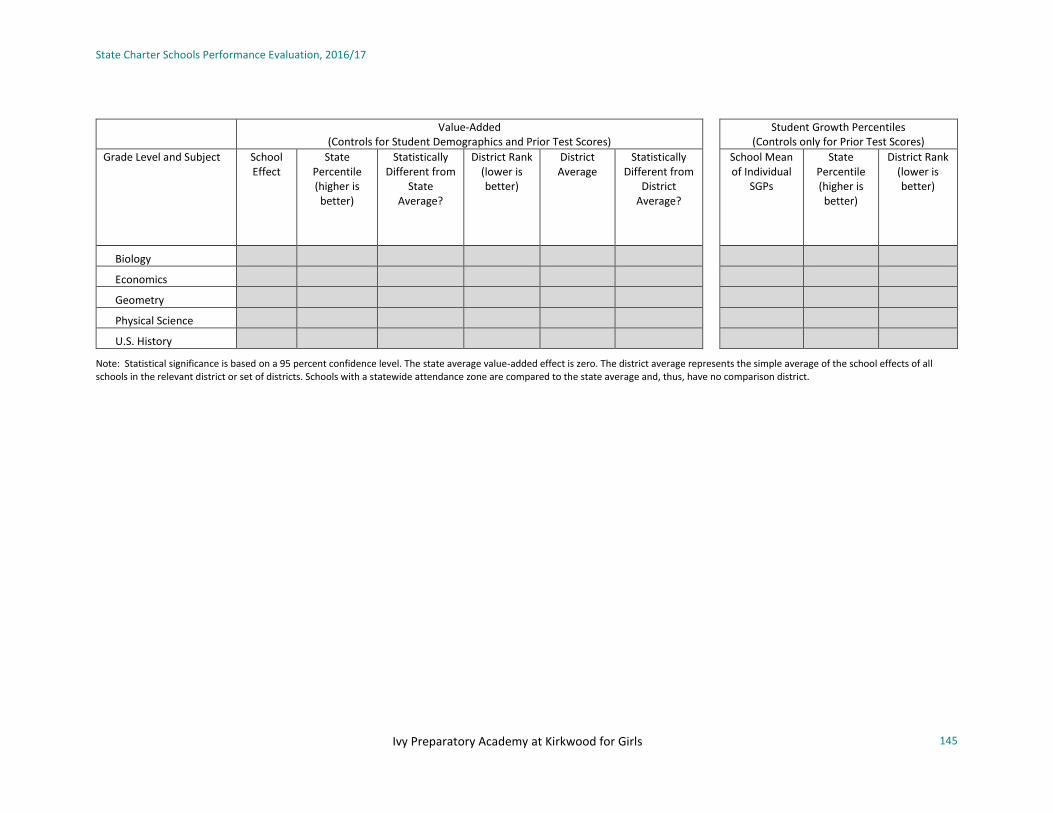
State Charter Schools Performance Evaluation, 2016/17
Ivy Preparatory Academy at Kirkwood for Girls
145
Value-Added (Controls for Student Demographics and Prior Test Scores)
Student Growth Percentiles (Controls only for Prior Test Scores)
Grade Level and Subject School Effect
State Percentile (higher is
better)
Statistically Different from
State Average?
District Rank (lower is better)
District Average
Statistically Different from
District Average?
School Mean of Individual
SGPs
State Percentile (higher is better)
District Rank (lower is better)
Biology
Economics
Geometry
Physical Science
U.S. History
Note: Statistical significance is based on a 95 percent confidence level. The state average value-added effect is zero. The district average represents the simple average of the school effects of all schools in the relevant district or set of districts. Schools with a statewide attendance zone are compared to the state average and, thus, have no comparison district.

State Charter Schools Performance Evaluation, 2016/17
Ivy Preparatory Academy at Kirkwood for Girls
146
Comparison of 2016/17, 2015/16, and 2014/15 Value-Added and SGP Summary Results
Ivy Preparatory Academy at Kirkwood for Girls’ elementary performance in 2016/17 improved from its performance in 2015/16 and 2014/15. In all tested subjects, the school was above the state and district, which has not been the case in the past.
Value-Added (Controls for Student Demographics and Prior Test Scores)
2014/15 2015/16 2016/17*
Grade Level and Subject
School Effect
Statistically Different
from State Average?
District Average
Statistically Different
from District Average?
School Effect
Statistically Different
from State Average?
District Average
Statistically Different
from District Average?
School Effect
Statistically Different
from State Average?
District Average
Statistically Different
from District Average?
Elementary
ELA -0.3434 Lower 0.0681 Lower -0.1359 Lower 0.0630 Lower 0.3597 Higher 0.0131 Higher
Math -0.1331 Lower -0.0211 No -0.1934 Lower -0.0255 Lower 0.2142 Higher 0.0184 Higher
Science -0.2244 Lower -0.0068 Lower -0.1294 Lower -0.0188 No
Social Studies -0.3904 Lower -0.0509 Lower -0.3285 Lower -0.0565 Lower
All-Subject Average -0.2712 Lower -0.0019 Lower -0.1969 Lower -0.0096 Lower 0.2872 Higher 0.0160 Higher
Middle
ELA 0.1090 Higher 0.0510 No 0.1073 Higher 0.0216 No 0.3313 Higher 0.0205 Higher
Math -0.0506 No -0.0206 No -0.1281 Lower -0.0441 No 0.1151 Higher 0.0002 Higher
Science -0.1913 Lower 0.0019 Lower -0.0608 No -0.0429 No
Social Studies 0.2084 Higher 0.0185 Higher 0.2542 Higher -0.0503 Higher
All-Subject Average 0.0196 No 0.0150 No 0.0405 No -0.0252 No 0.2055 Higher 0.0156 Higher
High
9th Grade Literature
American Literature
Analytic Geometry
Algebra 1

State Charter Schools Performance Evaluation, 2016/17
Ivy Preparatory Academy at Kirkwood for Girls
147
Value-Added
(Controls for Student Demographics and Prior Test Scores)
2014/15 2015/16 2016/17*
Grade Level and Subject
School Effect
Statistically Different
from State Average?
District Average
Statistically Different
from District Average?
School Effect
Statistically Different
from State Average?
District Average
Statistically Different
from District Average?
School Effect
Statistically Different
from State Average?
District Average
Statistically Different
from District Average?
Biology
Coordinate Algebra
Economics
Geometry
Physical Science
U.S. History
Note: Statistical significance is based on a 95 percent confidence level. The state average value-added effect is zero. The district average represents the simple average of the school effects of all schools in the relevant district or set of districts. Schools with a statewide attendance zone are compared to the state average and, thus, have no comparison district.
*For 2016/17 the school-level measure of "Direct Certification" employed in the value-added calculations differs from the measure employed in prior years. Direct Certification represents students who either live in a family unit receiving SNAP benefits, live in family unit receiving TANF benefits, are identified as homeless, are in foster care or are migrant. Due to data limitations, students in foster care were not included in the direct certification tally in 2016/17.
Student Growth Percentiles
(Controls only for Prior Test Scores)
2014/15 2015/16 2016/17
Grade Level and Subject School Mean of
Individual SGPs
State Percentile (higher is
better)
District Rank (lower
is better)
School Mean of
Individual SGPs
State Percentile (higher is
better)
District Rank (lower
is better)
School Mean of
Individual SGPs
State Percentile (higher is
better)
District Rank (lower
is better)
Elementary
ELA 31 1 85 of 85 39 4 137 of 139 64 99 2 of 141
Math 38 11 77 of 85 33 4 134 of 139 63 95 11 of 141
Science 32 2 84 of 85 35 2 134 of 139

State Charter Schools Performance Evaluation, 2016/17
Ivy Preparatory Academy at Kirkwood for Girls
148
Student Growth Percentiles
(Controls only for Prior Test Scores)
2014/15 2015/16 2016/17
Grade Level and Subject School Mean of
Individual SGPs
State Percentile (higher is
better)
District Rank (lower
is better)
School Mean of
Individual SGPs
State Percentile (higher is
better)
District Rank (lower
is better)
School Mean of
Individual SGPs
State Percentile (higher is
better)
District Rank (lower
is better)
Social Studies 27 1 84 of 85 23 1 139 of 139
All-Subject Average 32 1 85 of 85 32 1 139 of 139 64 99 2 of 141
Middle
ELA 55 86 12 of 33 59 96 3 of 54 68 99 1 of 53
Math 47 33 22 of 33 44 27 25 of 54 56 78 11 of 53
Science 40 11 31 of 33 49 46 21 of 54
Social Studies 60 89 7 of 33 67 98 2 of 54
All-Subject Average 50 55 17 of 33 55 83 7 of 54 62 98 3 of 53
High
9th Grade Literature
American Literature
Analytic Geometry
Algebra 1
Biology
Coordinate Algebra
Economics
Geometry
Physical Science
U.S. History
Note: Schools with a statewide attendance zone are compared to the state average and, thus, have no comparison district.

State Charter Schools Performance Evaluation, 2016/17
149 Ivy Preparatory Academy at Kirkwood for Girls
Comparison of School Impact Subject Area: All-Subject Elementary Average State Charter: Ivy Preparatory Academy at Kirkwood for Girls Comparison District: DeKalb County and Atlanta Public Schools

State Charter Schools Performance Evaluation, 2016/17
Ivy Preparatory Academy at Kirkwood for Girls 150
Subject Area: Elementary ELA
State Charter: Ivy Preparatory Academy at Kirkwood for Girls Comparison District: DeKalb County and Atlanta Public Schools

State Charter Schools Performance Evaluation, 2016/17
Ivy Preparatory Academy at Kirkwood for Girls 151
Subject Area: Elementary Mathematics State Charter: Ivy Preparatory Academy at Kirkwood for Girls Comparison District: DeKalb County and Atlanta Public Schools

State Charter Schools Performance Evaluation, 2016/17
Ivy Preparatory Academy at Kirkwood for Girls 152
Subject Area: All-Subject Middle Average State Charter: Ivy Preparatory Academy at Kirkwood for Girls Comparison District: DeKalb County and Atlanta Public Schools

State Charter Schools Performance Evaluation, 2016/17
Ivy Preparatory Academy at Kirkwood for Girls 153
Subject Area: Middle ELA
State Charter: Ivy Preparatory Academy at Kirkwood for Girls Comparison District: DeKalb County and Atlanta Public Schools
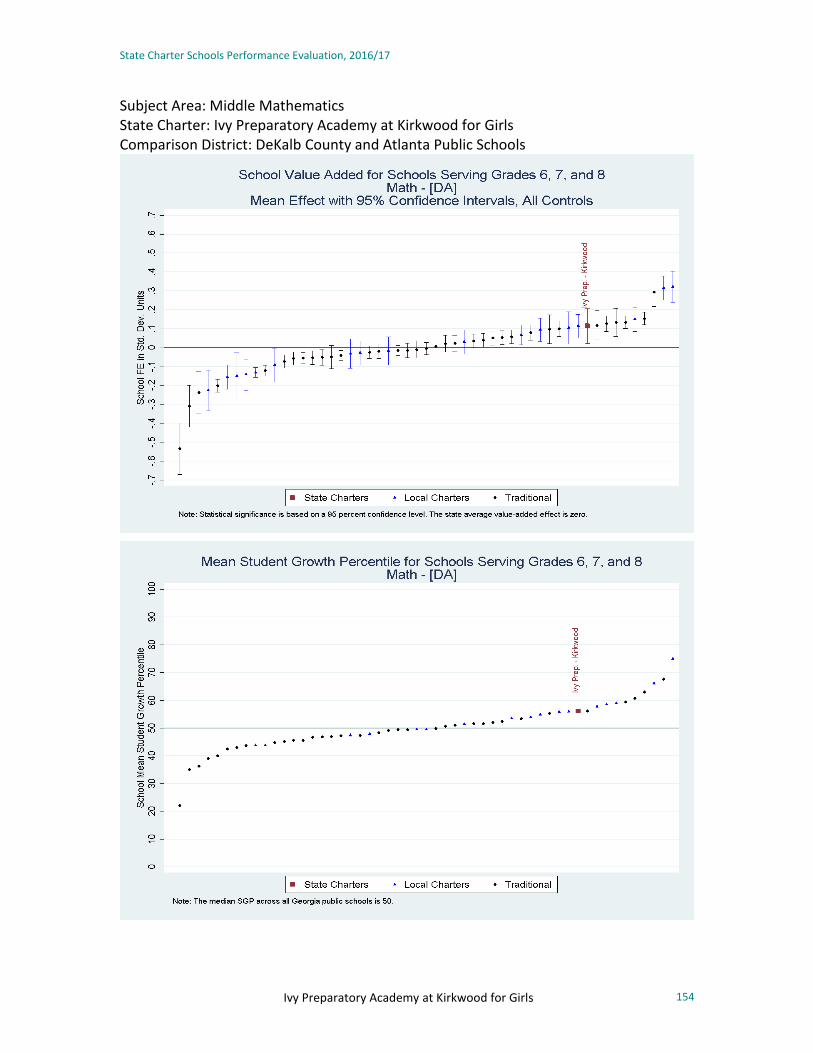
State Charter Schools Performance Evaluation, 2016/17
Ivy Preparatory Academy at Kirkwood for Girls 154
Subject Area: Middle Mathematics State Charter: Ivy Preparatory Academy at Kirkwood for Girls Comparison District: DeKalb County and Atlanta Public Schools

State Charter Schools Performance Evaluation, 2016/17
155 Liberty Tech Charter School
Liberty Tech Charter School
Key Findings
• The value-added estimate of Liberty Tech Charter School’s impact on a student’s average achievement across all subjects is -0.0686 in elementary grades and -0.0854 in middle grades.
• The school’s performance is indistinguishable from the state average in elementary school and below the state average in middle school. Because the school serves students throughout the state, it does not have a district comparison group.
• Liberty Tech’s first year in operation is 2016/17, so it is not possible to make year-to-year performance assessments.
• The school’s contribution to student achievement is: o below the state average in middle school Math; and o indistinguishable from the state average in elementary ELA, elementary Math, and middle school ELA.
General Characteristics
School Name Calendar
Year Opened
EMO Affiliation
Grades Curriculum Focus School Year
Single-Gender School
Virtual/ Online School
Serves Multiple Districts
Parental Involvement Requirement
Enrollment Restrictions
Liberty Tech Charter School
2016 No 3-8
Classical/STEM hybrid, House
System to learn college and career readiness, physical
education daily
Extended Year: 210
days No No Yes Not Specified
Students residing in State of GA
Students Served
School Name Pct. Female Pct. White Pct. Black Pct.
Hispanic Pct. Other
Race Pct. FRL Pct. Direct
Cert Pct. LEP Pct. SWD Pct. Gifted
Liberty Tech 52.7 60.6 27.6 6.1 5.7 15.1 10.4 0.0 7.5 22.2
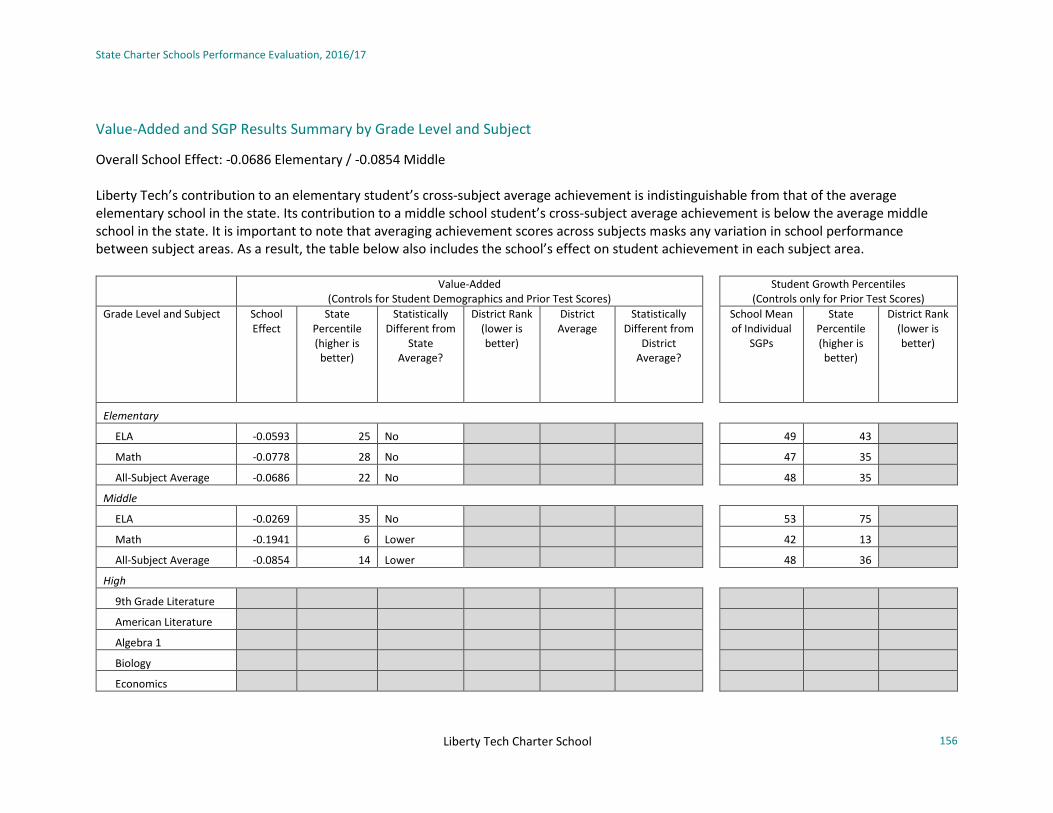
State Charter Schools Performance Evaluation, 2016/17
Liberty Tech Charter School
156
Value-Added and SGP Results Summary by Grade Level and Subject
Overall School Effect: -0.0686 Elementary / -0.0854 Middle Liberty Tech’s contribution to an elementary student’s cross-subject average achievement is indistinguishable from that of the average elementary school in the state. Its contribution to a middle school student’s cross-subject average achievement is below the average middle school in the state. It is important to note that averaging achievement scores across subjects masks any variation in school performance between subject areas. As a result, the table below also includes the school’s effect on student achievement in each subject area.
Value-Added
(Controls for Student Demographics and Prior Test Scores)
Student Growth Percentiles (Controls only for Prior Test Scores)
Grade Level and Subject School Effect
State Percentile (higher is
better)
Statistically Different from
State Average?
District Rank (lower is better)
District Average
Statistically Different from
District Average?
School Mean of Individual
SGPs
State Percentile (higher is better)
District Rank (lower is better)
Elementary
ELA -0.0593 25 No 49 43
Math -0.0778 28 No 47 35
All-Subject Average -0.0686 22 No 48 35
Middle
ELA -0.0269 35 No 53 75
Math -0.1941 6 Lower 42 13
All-Subject Average -0.0854 14 Lower 48 36
High
9th Grade Literature
American Literature
Algebra 1
Biology
Economics

State Charter Schools Performance Evaluation, 2016/17
Liberty Tech Charter School
157
Value-Added (Controls for Student Demographics and Prior Test Scores)
Student Growth Percentiles (Controls only for Prior Test Scores)
Grade Level and Subject School Effect
State Percentile (higher is
better)
Statistically Different from
State Average?
District Rank (lower is better)
District Average
Statistically Different from
District Average?
School Mean of Individual
SGPs
State Percentile (higher is better)
District Rank (lower is better)
Geometry
Physical Science
U.S. History
Note: Statistical significance is based on a 95 percent confidence level. The state average value-added effect is zero. The district average represents the simple average of the school effects of all schools in the relevant district or set of districts. Schools with a statewide attendance zone are compared to the state average and, thus, have no comparison district.
Comparison of 2016/17, 2015/16, and 2014/15 Value-Added and SGP Summary Results Liberty Tech’s first year in operation is 2016/17, so it is not possible to make year-to-year performance assessments.

State Charter Schools Performance Evaluation, 2016/17
158 Mountain Education Center
Mountain Education Center
Key Findings
• Mountain Education Center’s estimated contribution to student achievement in courses tested with end-of-course exams are 0.0295 in 9th Grade Literature, 0.0957 in American Literature, 0.2461 in Algebra 1, 0.3085 in Biology, -0.0289 in Economics, 0.1825 in Geometry, 0.1629 in Physical Science, and 0.0939 in U.S. History.
• Mountain Education Center’s contribution to student achievement exceeds the state average in Algebra 1, Biology, and Physical Science. Other tested subjects are indistinguishable from the state. Because the school serves students throughout the state, it does not have a district comparison group.
• Compared to 2015/16, Mountain Education Center saw a general improvement in its performance in 2016/17. While only one tested subject was higher than the state in 2015/16, three were higher in 2016/17.
• The school’s contribution to student achievement is: o above the state average in Algebra 1, Biology, and Physical Science; and o indistinguishable from the state average in 9th Grade Literature, American Literature, Economics, Geometry, and U.S. History.
General Characteristics
School Name Calendar
Year Opened
EMO Affiliation
Grades Curriculum Focus School Year
Single-Gender School
Virtual/ Online School
Serves Multiple Districts
Parental Involvement Requirement
Enrollment Restrictions
Mountain Education Charter School
2007 No 9-12
Self-paced, individualized,
evening high school for students
struggling at other schools
Year-round
No No Yes No Students residing
in State of GA

State Charter Schools Performance Evaluation, 2016/17
Mountain Education Center 159
Students Served
School Name Pct. Female Pct. White Pct. Black Pct.
Hispanic Pct. Other
Race Pct. FRL Pct. Direct
Cert Pct. LEP Pct. SWD Pct. Gifted
Mountain Ed. 45.8 82.1 3.7 12.2 2.0 100.0 24.9 3.0 15.8 0.0
Value-Added and SGP Results Summary by Grade Level and Subject
Overall School Effect: 0.0295 9th Grade Literature/ 0.0957 American Literature/ 0.2461 Algebra 1/ 0.3085 Biology/ -0.0289 Economics/ 0.1825 Geometry/ 0.1629 Physical Science/ 0.0939 U.S. History
Mountain Education Center’s contribution to student achievement is greater than the state average in Algebra 1, Biology, and Physical Science. Other tested subjects are indistinguishable from the state.
Value-Added (Controls for Student Demographics and Prior Test Scores)
Student Growth Percentiles (Controls only for Prior Test Scores)
Grade Level and Subject School Effect
State Percentile (higher is
better)
Statistically Different from
State Average?
District Rank (lower is better)
District Average
Statistically Different from
District Average?
School Mean of Individual
SGPs
State Percentile (higher is better)
District Rank (lower is better)
Elementary
ELA
Math
All-Subject Average
Middle
ELA
Math
All-Subject Average

State Charter Schools Performance Evaluation, 2016/17
Mountain Education Center 160
Value-Added (Controls for Student Demographics and Prior Test Scores)
Student Growth Percentiles (Controls only for Prior Test Scores)
Grade Level and Subject School Effect
State Percentile (higher is
better)
Statistically Different from
State Average?
District Rank (lower is better)
District Average
Statistically Different from
District Average?
School Mean of Individual
SGPs
State Percentile (higher is better)
District Rank (lower is better)
High
9th Grade Literature 0.0295 58 No 56 80
American Literature 0.0957 77 No 56 83
Algebra 1 0.2461 92 Higher 55 69
Biology 0.3085 96 Higher
Economics -0.0289 48 No
Geometry 0.1825 86 No 46 33
Physical Science 0.1629 83 Higher
U.S. History 0.0939 69 No
Note: Statistical significance is based on a 95 percent confidence level. The state average value-added effect is zero. The district average represents the simple average of the school effects of all
schools in the relevant district or set of districts. Schools with a statewide attendance zone are compared to the state average and, thus, have no comparison district.
Comparison of 2016/17, 2015/16, and 2014/15 Value-Added and SGP Summary Results
Mountain Education Center’s performance has fluctuated over time. In 2014/15, its performance exceeded state averages in four subjects and was not statistically different from the state average in the other four. In 2015/16, however, performance generally declined. Its performance was above the state average in only one EOC test subject and indistinguishable from the state average in the other seven. In 2016/17, performance generally improved and the school was higher than the state average in three out of eight subjects.

State Charter Schools Performance Evaluation, 2016/17
Mountain Education Center 161
Value-Added
(Controls for Student Demographics and Prior Test Scores)
2014/15 2015/16 2016/17*
Grade Level and Subject
School Effect
Statistically Different
from State Average?
District Average
Statistically Different
from District Average?
School Effect
Statistically Different
from State Average?
District Average
Statistically Different
from District Average?
School Effect
Statistically Different
from State Average?
District Average
Statistically Different
from District Average?
Elementary
ELA
Math
Science
Social Studies
All-Subject Average
Middle
ELA
Math
Science
Social Studies
All-Subject Average
High
9th Grade Literature 0.2107 Higher 0.1000 No 0.0295 No
American Literature -0.0020 No 0.0275 No 0.0957 No
Analytic Geometry 0.1695 No 0.1492 Higher
Algebra 1 0.2461 Higher
Biology 0.2353 Higher -0.0578 No 0.3085 Higher
Coordinate Algebra 0.2720 Higher 0.0797 No
Economics 0.1343 Higher 0.0717 No -0.0289 No
Geometry 0.1825 No
Physical Science 0.0578 No -0.0102 No 0.1629 Higher
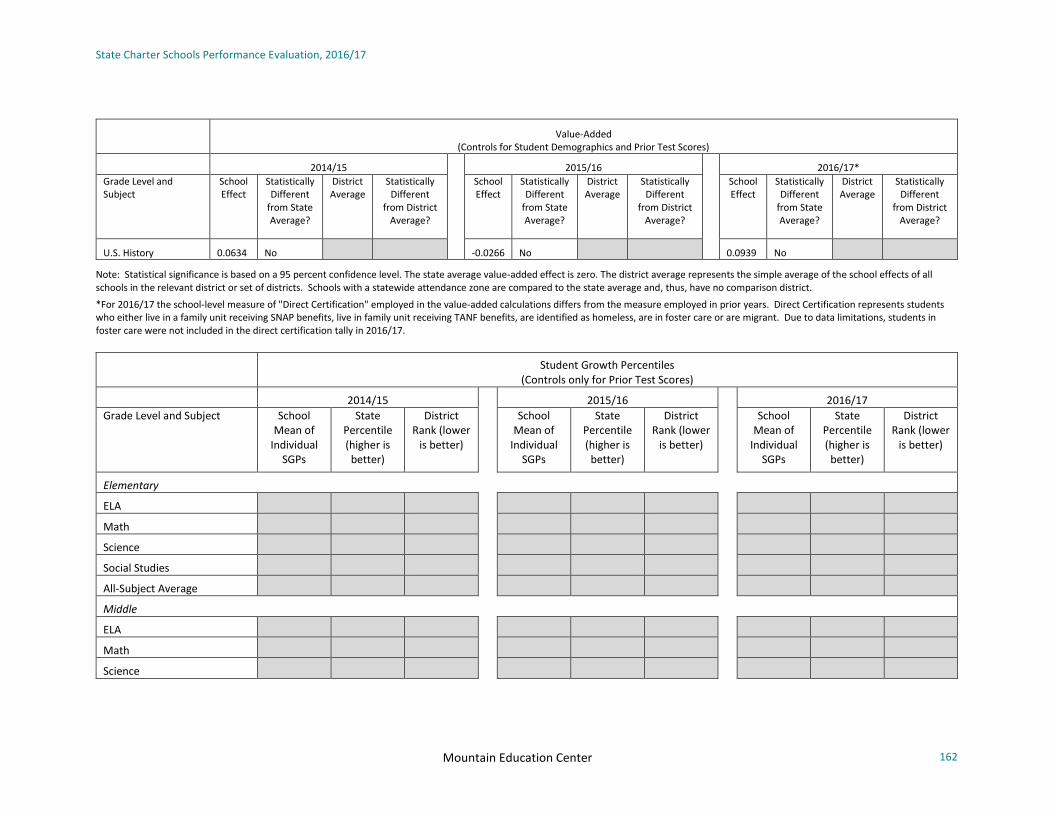
State Charter Schools Performance Evaluation, 2016/17
Mountain Education Center 162
Value-Added
(Controls for Student Demographics and Prior Test Scores)
2014/15 2015/16 2016/17*
Grade Level and Subject
School Effect
Statistically Different
from State Average?
District Average
Statistically Different
from District Average?
School Effect
Statistically Different
from State Average?
District Average
Statistically Different
from District Average?
School Effect
Statistically Different
from State Average?
District Average
Statistically Different
from District Average?
U.S. History 0.0634 No -0.0266 No 0.0939 No
Note: Statistical significance is based on a 95 percent confidence level. The state average value-added effect is zero. The district average represents the simple average of the school effects of all schools in the relevant district or set of districts. Schools with a statewide attendance zone are compared to the state average and, thus, have no comparison district.
*For 2016/17 the school-level measure of "Direct Certification" employed in the value-added calculations differs from the measure employed in prior years. Direct Certification represents students who either live in a family unit receiving SNAP benefits, live in family unit receiving TANF benefits, are identified as homeless, are in foster care or are migrant. Due to data limitations, students in foster care were not included in the direct certification tally in 2016/17.
Student Growth Percentiles
(Controls only for Prior Test Scores)
2014/15 2015/16 2016/17
Grade Level and Subject School Mean of
Individual SGPs
State Percentile (higher is
better)
District Rank (lower
is better)
School Mean of
Individual SGPs
State Percentile (higher is
better)
District Rank (lower
is better)
School Mean of
Individual SGPs
State Percentile (higher is
better)
District Rank (lower
is better)
Elementary
ELA
Math
Science
Social Studies
All-Subject Average
Middle
ELA
Math
Science

State Charter Schools Performance Evaluation, 2016/17
Mountain Education Center 163
Student Growth Percentiles
(Controls only for Prior Test Scores)
2014/15 2015/16 2016/17
Grade Level and Subject School Mean of
Individual SGPs
State Percentile (higher is
better)
District Rank (lower
is better)
School Mean of
Individual SGPs
State Percentile (higher is
better)
District Rank (lower
is better)
School Mean of
Individual SGPs
State Percentile (higher is
better)
District Rank (lower
is better)
Social Studies
All-Subject Average
High
9th Grade Literature 65 97 55 81 56 80
American Literature 50 51 43 25 56 83
Analytic Geometry 60 90 59 84
Algebra 1 55 69
Biology 64 91 52 63
Coordinate Algebra 66 97 60 81
Economics 59 82 47 42
Geometry 46 33
Physical Science 58 86 40 22
U.S. History 48 46 41 26
Note: Schools with a statewide attendance zone are compared to the state average and, thus, have no comparison district.

State Charter Schools Performance Evaluation, 2016/17
164 Odyssey School
Odyssey School
Key Findings
• The value-added estimate of the school’s impact on a student’s average achievement across all subjects is -0.0137 in elementary grades and -0.1230 in middle grades.
• Odyssey School’s performance is indistinguishable from the state and district averages in elementary school, but below the state and district averages in middle school.
• Compared to 2015/16, Odyssey School saw similar performance in elementary ELA and Math but declined in middle school ELA and Math. Compared to 2014/15, performance in elementary Math was improved, but performance in middle school ELA and middle school Math declined.
• The school’s contribution to student achievement is: o below the state and district average in middle school ELA and middle school Math; and o indistinguishable from the state and district average in elementary ELA and elementary Math.
General Characteristics
School Name Calendar
Year Opened
EMO Affiliation
Grades Curriculum Focus School Year
Single-Gender School
Virtual/ Online School
Serves Multiple Districts
Parental Involvement Requirement
Enrollment Restrictions
Odyssey School 2004 No K-8
Multi-age classrooms - students grouped
by skill level/Looping:
students remain with teacher two years
Normal No No No 18 hours per
academic year
Students residing in Coweta County
Public Schools Zone
Students Served
School Name Pct. Female Pct. White Pct. Black Pct.
Hispanic Pct. Other
Race Pct. FRL Pct. Direct
Cert Pct. LEP Pct. SWD Pct. Gifted
Odyssey 44.8 51.0 29.1 12.1 7.7 34.8 15.4 4.9 14.4 13.4

State Charter Schools Performance Evaluation, 2016/17
Odyssey School
165
Value-Added and SGP Results Summary by Grade Level and Subject
Overall School Effect: -0.0137 Elementary / -0.1230 Middle Average Overall School Effect in District: -0.0019 Elementary / 0.0171 Middle
Odyssey School’s contribution to an elementary student’s average achievement across ELA and Math is indistinguishable from the average elementary school in the state or district. The contribution to a middle school student’s average achievement is below the average middle school in the state and district. It is important to note that averaging achievement scores across subjects masks any variation in school performance between subject areas. As a result, the table below also includes the school’s effect on student achievement in each subject area.
Value-Added (Controls for Student Demographics and Prior Test Scores)
Student Growth Percentiles (Controls only for Prior Test Scores)
Grade Level and Subject School Effect
State Percentile (higher is
better)
Statistically Different from
State Average?
District Rank (lower is better)
District Average
Statistically Different from
District Average?
School Mean of Individual
SGPs
State Percentile (higher is better)
District Rank (lower is better)
Elementary
ELA 0.0195 57 No 13 of 21 0.0269 No 54 74 10 of 21
Math -0.0470 36 No 11 of 21 -0.0298 No 49 45 10 of 21
All-Subject Average -0.0137 43 No 9 of 21 -0.0019 No 52 58 10 of 21
Middle
ELA -0.0921 10 Lower 8 of 8 0.0127 Lower 50 53 7 of 8
Math -0.1597 9 Lower 7 of 8 0.0098 Lower 51 55 7 of 8
All-Subject Average -0.1230 6 Lower 8 of 8 0.0171 Lower 51 54 7 of 8
High
9th Grade Literature
American Literature
Algebra 1
Biology
Economics

State Charter Schools Performance Evaluation, 2016/17
Odyssey School
166
Value-Added (Controls for Student Demographics and Prior Test Scores)
Student Growth Percentiles (Controls only for Prior Test Scores)
Grade Level and Subject School Effect
State Percentile (higher is
better)
Statistically Different from
State Average?
District Rank (lower is better)
District Average
Statistically Different from
District Average?
School Mean of Individual
SGPs
State Percentile (higher is better)
District Rank (lower is better)
Geometry
Physical Science
U.S. History
Note: Statistical significance is based on a 95 percent confidence level. The state average value-added effect is zero. The district average represents the simple average of the school effects of all schools in the relevant district or set of districts. Schools with a statewide attendance zone are compared to the state average and, thus, have no comparison district.
Comparison of 2016/17, 2015/16, and 2014/15 Value-Added and SGP Summary Results
Compared to 2015/16, Odyssey School saw similar performance in elementary ELA and Math, but declined in middle school ELA and Math. Compared to 2014/15, performance in elementary Math was improved, but performance in middle school ELA and Math declined.
Value-Added (Controls for Student Demographics and Prior Test Scores)
2014/15 2015/16 2016/17*
Grade Level and Subject
School Effect
Statistically Different
from State Average?
District Average
Statistically Different
from District Average?
School Effect
Statistically Different
from State Average?
District Average
Statistically Different
from District Average?
School Effect
Statistically Different
from State Average?
District Average
Statistically Different
from District Average?
Elementary
ELA -0.0749 No -0.0544 No 0.0535 No -0.1095 Higher 0.0195 No 0.0269 No
Math -0.3483 Lower -0.0398 Lower -0.0414 No -0.0390 No -0.0470 No -0.0298 No
Science 0.1369 Higher -0.0534 Higher -0.0049 No -0.0415 No
Social Studies -0.0389 No -0.0541 No -0.2258 Lower -0.0862 Lower
All-Subject Average -0.0793 No -0.0510 No -0.0548 No -0.0683 No -0.0137 No -0.0019 No

State Charter Schools Performance Evaluation, 2016/17
Odyssey School
167
Value-Added
(Controls for Student Demographics and Prior Test Scores)
2014/15 2015/16 2016/17*
Grade Level and Subject
School Effect
Statistically Different
from State Average?
District Average
Statistically Different
from District Average?
School Effect
Statistically Different
from State Average?
District Average
Statistically Different
from District Average?
School Effect
Statistically Different
from State Average?
District Average
Statistically Different
from District Average?
Middle
ELA 0.0086 No 0.0138 No 0.1301 Higher -0.0045 Higher -0.0921 Lower 0.0127 Lower
Math 0.0721 No -0.0108 No 0.0561 No 0.0093 No -0.1597 Lower 0.0098 Lower
Science -0.1552 Lower -0.0797 No -0.1686 Lower -0.0917 No
Social Studies -0.1902 Lower -0.0532 Lower -0.2330 Lower -0.0645 Lower
All-Subject Average -0.0585 No -0.0267 No -0.0395 No -0.0209 No -0.1230 Lower 0.0171 Lower
High
9th Grade Literature
American Literature
Analytic Geometry
Algebra 1
Biology
Coordinate Algebra
Economics
Geometry
Physical Science
U.S. History
Note: Statistical significance is based on a 95 percent confidence level. The state average value-added effect is zero. The district average represents the simple average of the school effects of all schools in the relevant district or set of districts. Schools with a statewide attendance zone are compared to the state average and, thus, have no comparison district.
*For 2016/17 the school-level measure of "Direct Certification" employed in the value-added calculations differs from the measure employed in prior years. Direct Certification represents students who either live in a family unit receiving SNAP benefits, live in family unit receiving TANF benefits, are identified as homeless, are in foster care or are migrant. Due to data limitations, students in foster care were not included in the direct certification tally in 2016/17.

State Charter Schools Performance Evaluation, 2016/17
Odyssey School
168
Student Growth Percentiles
(Controls only for Prior Test Scores)
2014/15 2015/16 2016/17
Grade Level and Subject School Mean of
Individual SGPs
State Percentile (higher is
better)
District Rank (lower
is better)
School Mean of
Individual SGPs
State Percentile (higher is
better)
District Rank (lower
is better)
School Mean of
Individual SGPs
State Percentile (higher is
better)
District Rank (lower
is better)
Elementary
ELA 48 37 9 of 21 54 79 1 of 21 54 74 10 of 21
Math 39 12 20 of 21 55 69 5 of 21 49 45 10 of 21
Science 57 81 1 of 21 54 70 6 of 21
Social Studies 52 59 8 of 21 48 41 10 of 21
All-Subject Average 49 42 13 of 21 53 66 3 of 21 52 58 10 of 21
Middle
ELA 48 41 8 of 8 60 97 2 of 8 50 53 7 of 8
Math 62 94 1 of 8 64 96 1 of 8 51 55 7 of 8
Science 40 11 7 of 8 43 18 7 of 8
Social Studies 39 10 7 of 8 42 16 8 of 8
All-Subject Average 47 30 7 of 8 52 70 4 of 8 51 54 7 of 8
High
9th Grade Literature
American Literature
Analytic Geometry
Algebra 1
Biology
Coordinate Algebra
Economics
Geometry

State Charter Schools Performance Evaluation, 2016/17
Odyssey School
169
Student Growth Percentiles
(Controls only for Prior Test Scores)
2014/15 2015/16 2016/17
Grade Level and Subject School Mean of
Individual SGPs
State Percentile (higher is
better)
District Rank (lower
is better)
School Mean of
Individual SGPs
State Percentile (higher is
better)
District Rank (lower
is better)
School Mean of
Individual SGPs
State Percentile (higher is
better)
District Rank (lower
is better)
Physical Science
U.S. History
Note: Schools with a statewide attendance zone are compared to the state average and, thus, have no comparison district.

State Charter Schools Performance Evaluation, 2016/17
170 Odyssey School
Comparison of School Impact Subject Area: All-Subject Elementary Average State Charter: Odyssey School Comparison District: Coweta County Public Schools

State Charter Schools Performance Evaluation, 2016/17
Odyssey School
171
Subject Area: Elementary ELA State Charter: Odyssey School Comparison District: Coweta County Public Schools
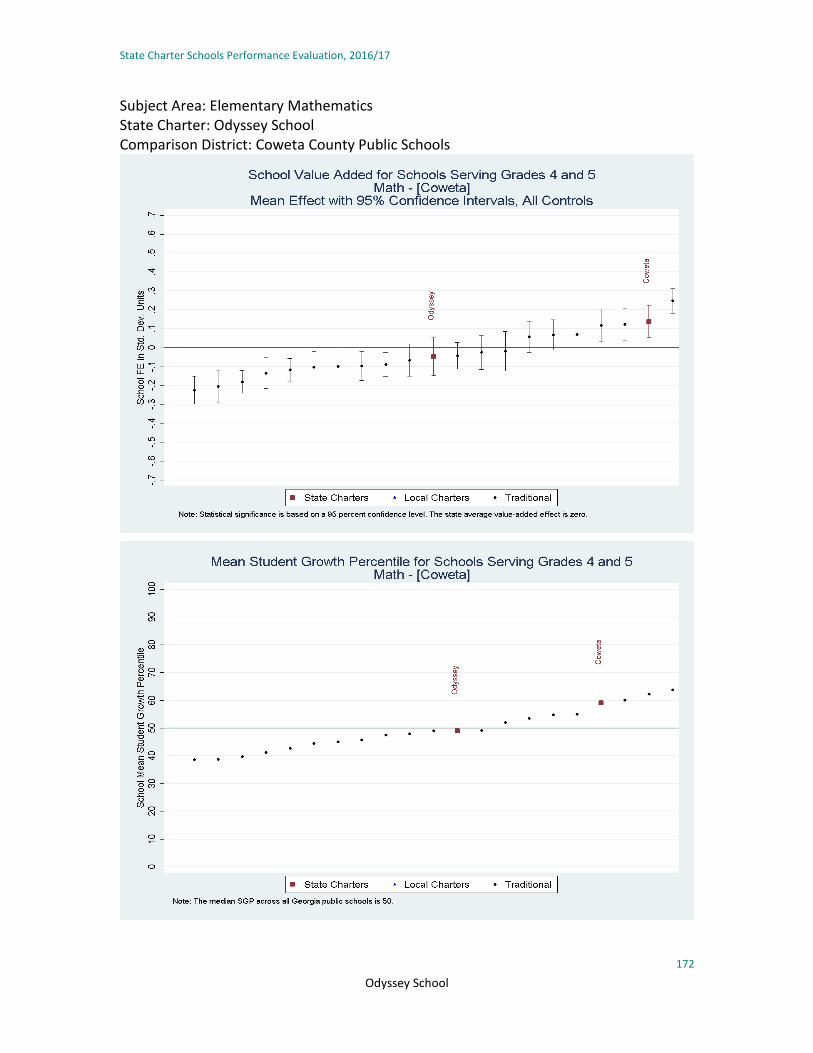
State Charter Schools Performance Evaluation, 2016/17
Odyssey School
172
Subject Area: Elementary Mathematics State Charter: Odyssey School Comparison District: Coweta County Public Schools

State Charter Schools Performance Evaluation, 2016/17
Odyssey School
173
Subject Area: All-Subject Middle Average
State Charter: Odyssey School Comparison District: Coweta County Public Schools

State Charter Schools Performance Evaluation, 2016/17
Odyssey School
174
Subject Area: Middle ELA State Charter: Odyssey School Comparison District: Coweta County Public Schools

State Charter Schools Performance Evaluation, 2016/17
Odyssey School
175
Subject Area: Middle Mathematics State Charter: Odyssey School Comparison District: Coweta County Public Schools

State Charter Schools Performance Evaluation, 2016/17
176 Pataula Charter Academy
Pataula Charter Academy
Key Findings
• The value-added estimate of the school’s impact on a student’s average achievement across all subjects is 0.0283 in elementary grades and -0.0405 in middle grades.
• Pataula Charter Academy’s contribution to student achievement in courses where end-of-course exams are given are 0.1212 in 9th Grade Literature, -0.0237 in American Literature, -0.2951 in Algebra 1, 0.1962 in Biology, -0.0921 in Economics, -0.3958 in Geometry, 0.1849 in Physical Science, and -0.0674 in U.S. History.
• Pataula Charter Academy’s performance is statistically indistinguishable from the state and district averages in both elementary and middle school. At the high school level, the value-added estimates in Biology and Physical Science are above the state and district averages, while Algebra 1 and Geometry are below the state and district averages.
• Pataula Charter Academy’s performance in elementary ELA declined from the 2015/16 school year. Performance in elementary Math, middle school ELA, and middle school Math was consistent with the prior year. Relative to 2014/15, the performance in 2016/17 was worse in both middle school subjects and the same in both elementary subjects. Performance at the high school level was generally similar to the past, but Physical Science and U.S. History both showed improvement.
• The school’s contribution to student achievement is: o above the state and district averages in Biology and Physical Science; o below the state and district average in middle school Math, Algebra 1, and Geometry; o indistinguishable from the state average but higher than the district in elementary Math and 9th Grade Literature; and o indistinguishable from the state and district average in elementary ELA, middle school ELA, American Literature, Economics, and U.S.
History.

State Charter Schools Performance Evaluation, 2016/17
Pataula Charter Academy
177
General Characteristics
School Name Calendar
Year Opened
EMO Affiliation
Grades Curriculum Focus School Year
Single-Gender School
Virtual/ Online School
Serves Multiple Districts
Parental Involvement Requirement
Enrollment Restrictions
Pataula Charter Academy
2010 No K-12
Expeditionary Learning: project based lectures
and curriculum delivery/Looping:
students remain with teacher for two years
Normal No No Yes Not Specified
Students residing in Baker, Calhoun,
Clay, Early, Randolph Public School districts
Students Served
School Name Pct. Female Pct. White Pct. Black Pct.
Hispanic Pct. Other
Race Pct. FRL Pct. Direct
Cert Pct. LEP Pct. SWD Pct. Gifted
Pataula 48.6 74.7 16.5 5.5 3.2 57.5 26.1 2.0 9.3 5.0
Value-Added and SGP Results Summary by Grade Level and Subject
Overall School Effect: 0.0283 Elementary / -0.0405 Middle/ 0.1212 9th Grade Literature/ -0.0237 American Literature/ -0.2951 Algebra 1/ 0.1962 Biology/ -0.0921 Economics/ -0.3958 Geometry/ 0.1849 Physical Science/ -0.0674 U.S. History Average Overall School Effect in District: -0.0409 Elementary / 0.0040 Middle/ -0.0460 9th Grade Literature/ -0.0668 American Literature/ 0.0329 Algebra 1/ -0.0269 Biology/ 0.0234 Economics/ 0.0723 Geometry/ -0.0694 Physical Science/ -0.0669 U.S. History
Pataula Charter Academy’s contribution to a student’s average achievement across ELA and Math is indistinguishable from the average elementary school in the state and district. The middle school average is also indistinguishable from the five-county area and the state average. Its high school performance is indistinguishable from the state in four of eight subjects, lower in two subjects, and higher in two subjects. It is important to note that averaging achievement scores across subjects masks any variation in school performance between subject areas. As a result, the table below also includes the school’s effect on student achievement in each subject area.
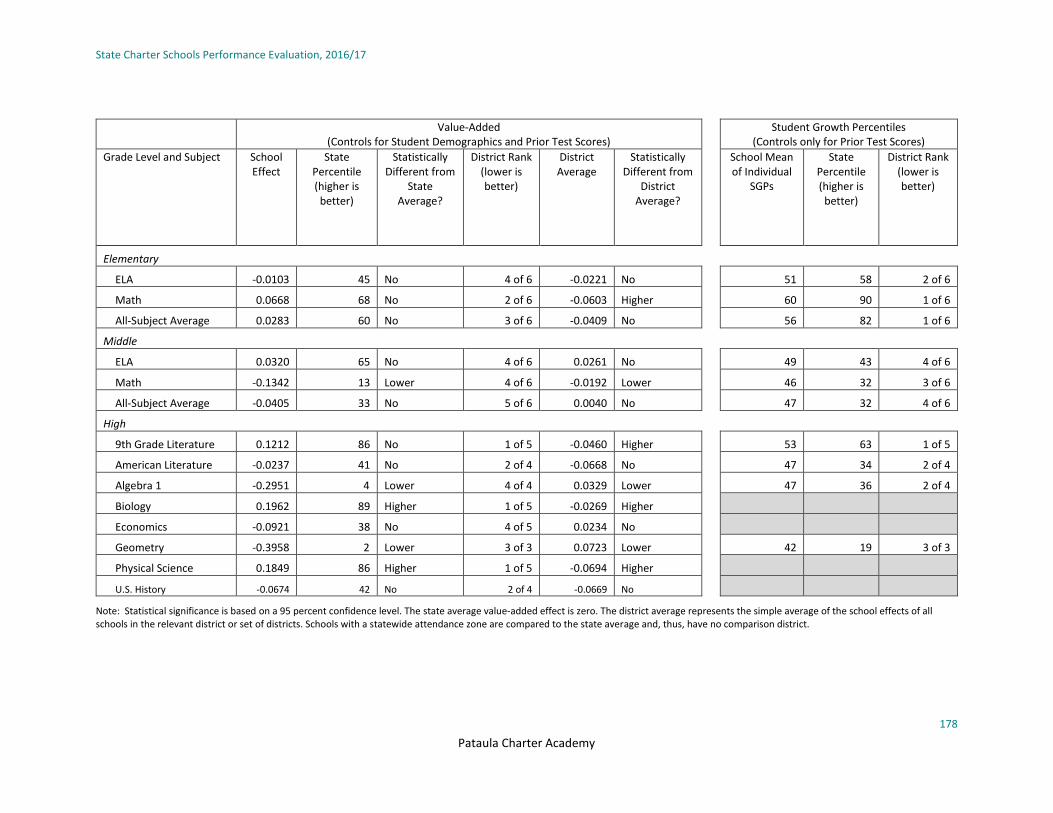
State Charter Schools Performance Evaluation, 2016/17
Pataula Charter Academy
178
Value-Added (Controls for Student Demographics and Prior Test Scores)
Student Growth Percentiles (Controls only for Prior Test Scores)
Grade Level and Subject School Effect
State Percentile (higher is
better)
Statistically Different from
State Average?
District Rank (lower is better)
District Average
Statistically Different from
District Average?
School Mean of Individual
SGPs
State Percentile (higher is
better)
District Rank (lower is better)
Elementary
ELA -0.0103 45 No 4 of 6 -0.0221 No 51 58 2 of 6
Math 0.0668 68 No 2 of 6 -0.0603 Higher 60 90 1 of 6
All-Subject Average 0.0283 60 No 3 of 6 -0.0409 No 56 82 1 of 6
Middle
ELA 0.0320 65 No 4 of 6 0.0261 No 49 43 4 of 6
Math -0.1342 13 Lower 4 of 6 -0.0192 Lower 46 32 3 of 6
All-Subject Average -0.0405 33 No 5 of 6 0.0040 No 47 32 4 of 6
High
9th Grade Literature 0.1212 86 No 1 of 5 -0.0460 Higher 53 63 1 of 5
American Literature -0.0237 41 No 2 of 4 -0.0668 No 47 34 2 of 4
Algebra 1 -0.2951 4 Lower 4 of 4 0.0329 Lower 47 36 2 of 4
Biology 0.1962 89 Higher 1 of 5 -0.0269 Higher
Economics -0.0921 38 No 4 of 5 0.0234 No
Geometry -0.3958 2 Lower 3 of 3 0.0723 Lower 42 19 3 of 3
Physical Science 0.1849 86 Higher 1 of 5 -0.0694 Higher
U.S. History -0.0674 42 No 2 of 4 -0.0669 No
Note: Statistical significance is based on a 95 percent confidence level. The state average value-added effect is zero. The district average represents the simple average of the school effects of all schools in the relevant district or set of districts. Schools with a statewide attendance zone are compared to the state average and, thus, have no comparison district.

State Charter Schools Performance Evaluation, 2016/17
Pataula Charter Academy
179
Comparison of 2016/17, 2015/16, and 2014/15 Value-Added and SGP Summary Results
Pataula Charter Academy’s performance in elementary ELA declined from the 2015/16 school year. Performance in elementary Math, middle school ELA, and middle school Math was consistent with the prior year. Relative to 2014/15, the performance in 2016/17 was worse in both middle school subjects and the same in both elementary subjects. Performance at the high school level was generally similar to the past, but Physical Science and U.S. History both showed improvement.
Value-Added
(Controls for Student Demographics and Prior Test Scores)
2014/15 2015/16 2016/17*
Grade Level and Subject
School Effect
Statistically Different
from State Average?
District Average
Statistically Different
from District
Average?
School Effect
Statistically Different
from State Average?
District Average
Statistically Different
from District Average?
School Effect
Statistically Different
from State Average?
District Average
Statistically Different
from District Average?
Elementary
ELA 0.0257 No 0.0085 No 0.2623 Higher 0.0547 Higher -0.0103 No -0.0221 No
Math -0.0499 No 0.0754 Lower -0.0487 No 0.0670 Lower 0.0668 No -0.0603 Higher
Science 0.0336 No -0.0201 No 0.0549 No 0.0194 No
Social Studies -0.0626 No -0.0267 No 0.2111 Higher 0.0667 Higher
All-Subject Average -0.0146 No 0.0094 No 0.1212 Higher 0.0523 No 0.0283 No -0.0409 No
Middle
ELA 0.1300 Higher 0.0578 No 0.0325 No 0.0873 No 0.0320 No 0.0261 No
Math -0.0549 No 0.0767 Lower -0.1015 Lower 0.1234 Lower -0.1342 Lower -0.0192 Lower
Science -0.0950 Lower -0.0646 No -0.1973 Lower -0.0376 Lower
Social Studies 0.0413 No -0.0212 No -0.1558 Lower 0.0207 Lower
All-Subject Average 0.0197 No 0.0165 No -0.1116 Lower 0.0454 Lower -0.0405 No 0.0040 No
High
9th Grade Literature -0.0520 No -0.0515 No 0.0643 No 0.1397 No 0.1212 No -0.0460 Higher
American Literature -0.0515 No 0.0875 No -0.0237 No -0.0668 No
Analytic Geometry -0.1829 No 0.0359 Lower -0.2179 Lower 0.1928 Lower

State Charter Schools Performance Evaluation, 2016/17
Pataula Charter Academy
180
Value-Added
(Controls for Student Demographics and Prior Test Scores)
2014/15 2015/16 2016/17*
Grade Level and Subject
School Effect
Statistically Different
from State Average?
District Average
Statistically Different
from District
Average?
School Effect
Statistically Different
from State Average?
District Average
Statistically Different
from District Average?
School Effect
Statistically Different
from State Average?
District Average
Statistically Different
from District Average?
Algebra 1 -0.2323 Lower 0.0947 Lower -0.2951 Lower 0.0329 Lower
Biology 0.6226 Higher 0.0807 Higher 0.1234 No 0.0373 No 0.1962 Higher -0.0269 Higher
Coordinate Algebra -0.1642 No 0.0331 No
Economics -0.0921 No 0.0234 No
Geometry -0.3958 Lower 0.0723 Lower
Physical Science 0.0583 No -0.0415 No 0.1176 No 0.0472 No 0.1849 Higher -0.0694 Higher
U.S. History -0.3478 Lower 0.0359 Lower -0.0674 No -0.0669 No
Note: Statistical significance is based on a 95 percent confidence level. The state average value-added effect is zero. The district average represents the simple average of the school effects of all schools in the relevant district or set of districts. Schools with a statewide attendance zone are compared to the state average and, thus, have no comparison district.
*For 2016/17 the school-level measure of "Direct Certification" employed in the value-added calculations differs from the measure employed in prior years. Direct Certification represents students who either live in a family unit receiving SNAP benefits, live in family unit receiving TANF benefits, are identified as homeless, are in foster care or are migrant. Due to data limitations, students in foster care were not included in the direct certification tally in 2016/17.
Student Growth Percentiles
(Controls only for Prior Test Scores)
2014/15 2015/16 2016/17
Grade Level and Subject School Mean of
Individual SGPs
State Percentile (higher is better)
District Rank (lower
is better)
School Mean of
Individual SGPs
State Percentile (higher is
better)
District Rank (lower is better)
School Mean of
Individual SGPs
State Percentile (higher is
better)
District Rank
(lower is better)
Elementary
ELA 49 47 1 of 6 63 98 1 of 6 51 58 2 of 6
Math 53 63 3 of 6 51 56 3 of 6 60 90 1 of 6

State Charter Schools Performance Evaluation, 2016/17
Pataula Charter Academy
181
Student Growth Percentiles
(Controls only for Prior Test Scores)
2014/15 2015/16 2016/17
Grade Level and Subject School Mean of
Individual SGPs
State Percentile (higher is better)
District Rank (lower
is better)
School Mean of
Individual SGPs
State Percentile (higher is
better)
District Rank (lower is better)
School Mean of
Individual SGPs
State Percentile (higher is
better)
District Rank
(lower is better)
Science 52 62 1 of 6 51 55 4 of 6
Social Studies 51 54 3 of 6 70 98 1 of 6
All-Subject Average 52 60 1 of 6 59 92 1 of 6 56 82 1 of 6
Middle
ELA 55 84 2 of 6 49 46 3 of 6 49 43 4 of 6
Math 50 49 2 of 6 48 45 4 of 6 46 32 3 of 6
Science 53 70 2 of 6 44 21 5 of 6
Social Studies 52 57 2 of 6 39 11 6 of 6
All-Subject Average 52 69 2 of 6 45 22 4 of 6 47 32 4 of 6
High
9th Grade Literature 43 21 2 of 5 49 45 3 of 5 53 63 1 of 5
American Literature 40 15 3 of 5 47 34 2 of 4
Analytic Geometry 50 56 4 of 5 41 19 4 of 4
Algebra 1 29 2 3 of 3 47 36 2 of 4
Biology 74 99 1 of 5 62 90 1 of 4
Coordinate Algebra 54 65 2 of 6
Economics
Geometry 42 19 3 of 3
Physical Science 50 55 2 of 5 66 95 1 of 5
U.S. History 31 6 4 of 5
Note: Schools with a statewide attendance zone are compared to the state average and, thus, have no comparison district.
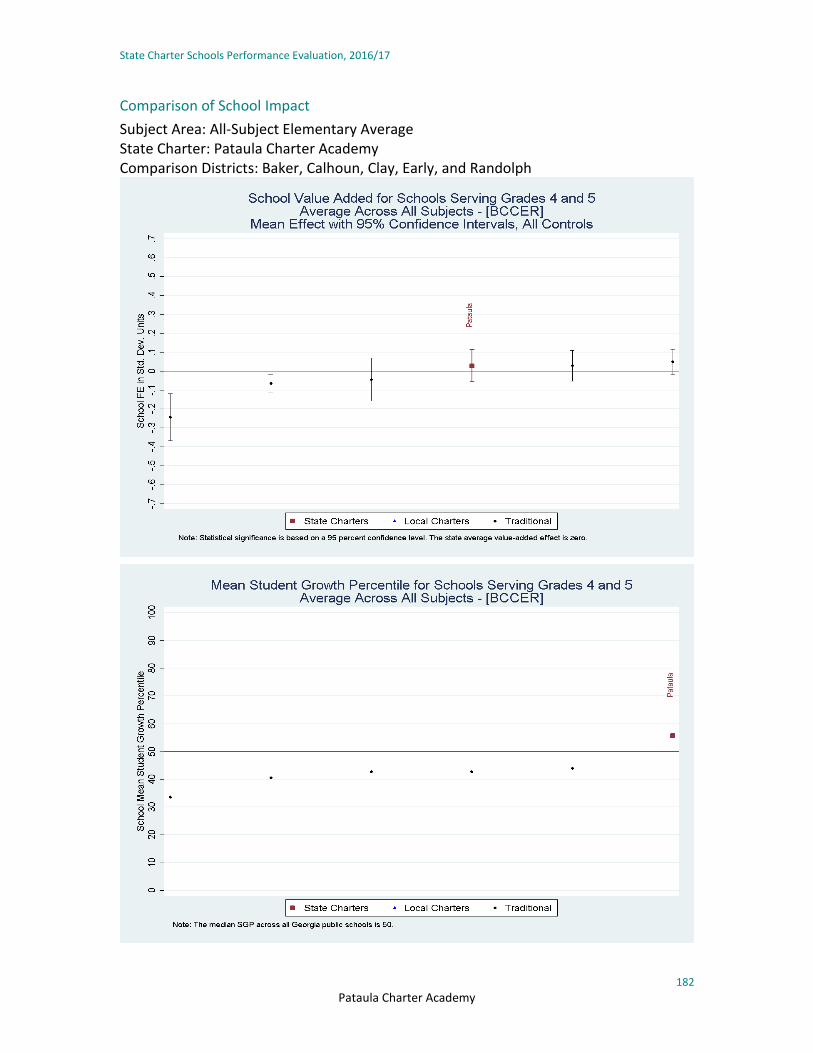
State Charter Schools Performance Evaluation, 2016/17
182 Pataula Charter Academy
Comparison of School Impact
Subject Area: All-Subject Elementary Average State Charter: Pataula Charter Academy Comparison Districts: Baker, Calhoun, Clay, Early, and Randolph

State Charter Schools Performance Evaluation, 2016/17
Pataula Charter Academy
183
Subject Area: Elementary ELA State Charter: Pataula Charter Academy Comparison Districts: Baker, Calhoun, Clay, Early, and Randolph
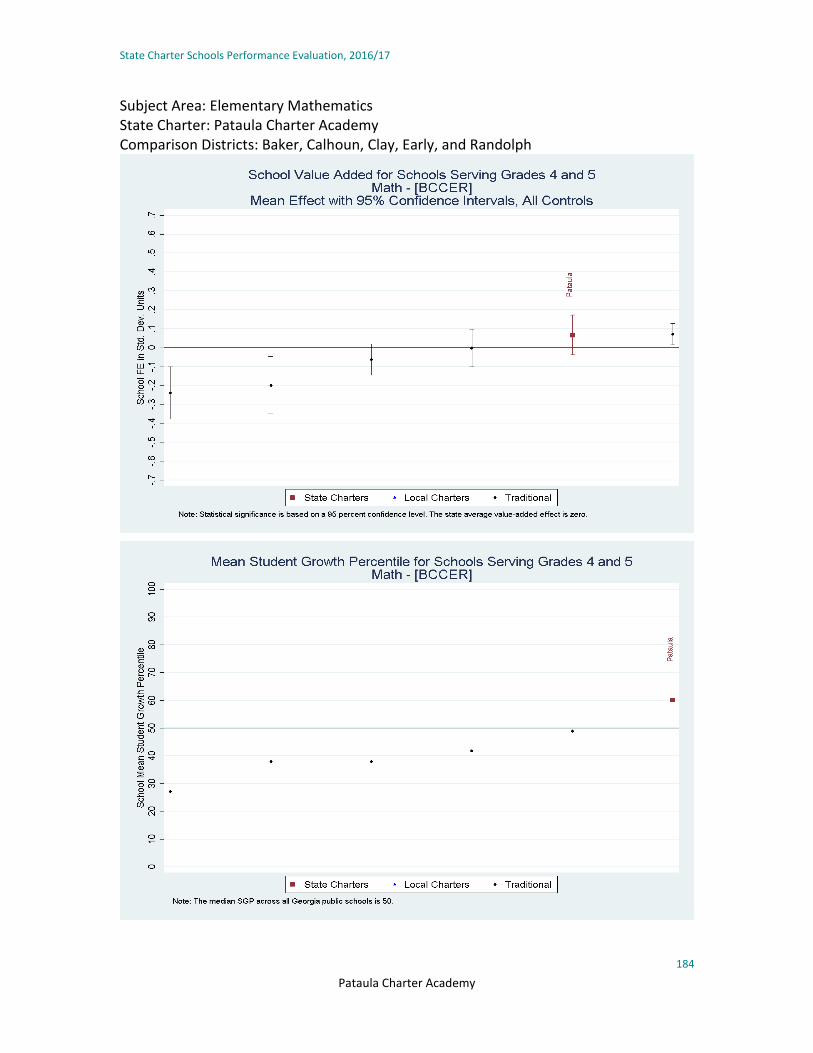
State Charter Schools Performance Evaluation, 2016/17
Pataula Charter Academy
184
Subject Area: Elementary Mathematics State Charter: Pataula Charter Academy Comparison Districts: Baker, Calhoun, Clay, Early, and Randolph

State Charter Schools Performance Evaluation, 2016/17
Pataula Charter Academy
185
Subject Area: All-Subject Middle Average State Charter: Pataula Charter Academy Comparison Districts: Baker, Calhoun, Clay, Early, and Randolph

State Charter Schools Performance Evaluation, 2016/17
Pataula Charter Academy
186
Subject Area: Middle ELA State Charter: Pataula Charter Academy Comparison Districts: Baker, Calhoun, Clay, Early, and Randolph
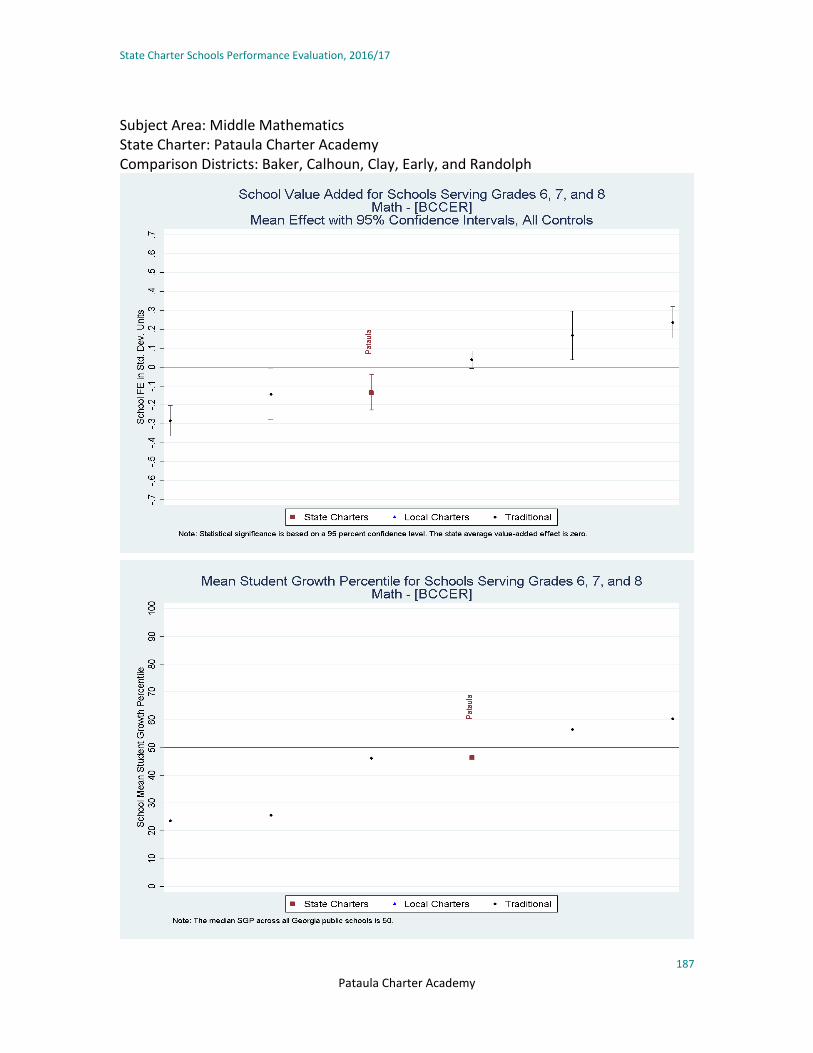
State Charter Schools Performance Evaluation, 2016/17
Pataula Charter Academy
187
Subject Area: Middle Mathematics State Charter: Pataula Charter Academy Comparison Districts: Baker, Calhoun, Clay, Early, and Randolph

State Charter Schools Performance Evaluation, 2016/17
Pataula Charter Academy
188
Subject Area: 9th Grade Literature State Charter: Pataula Charter Academy Comparison Districts: Baker, Calhoun, Clay, Early, and Randolph

State Charter Schools Performance Evaluation, 2016/17
Pataula Charter Academy
189
Subject Area: American Literature State Charter: Pataula Charter Academy Comparison Districts: Baker, Calhoun, Clay, Early, and Randolph

State Charter Schools Performance Evaluation, 2016/17
Pataula Charter Academy
190
Subject Area: Algebra 1 State Charter: Pataula Charter Academy Comparison Districts: Baker, Calhoun, Clay, Early, and Randolph

State Charter Schools Performance Evaluation, 2016/17
Pataula Charter Academy
191
Subject Area: Biology State Charter: Pataula Charter Academy Comparison Districts: Baker, Calhoun, Clay, Early, and Randolph
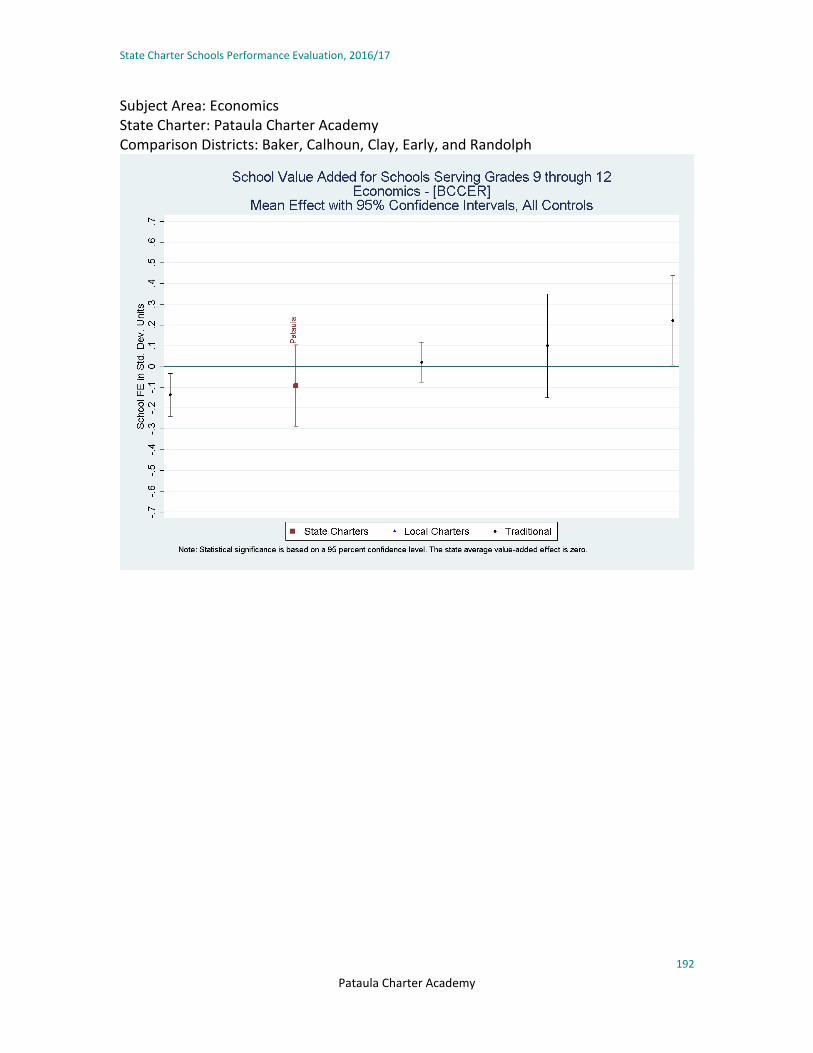
State Charter Schools Performance Evaluation, 2016/17
Pataula Charter Academy
192
Subject Area: Economics State Charter: Pataula Charter Academy Comparison Districts: Baker, Calhoun, Clay, Early, and Randolph

State Charter Schools Performance Evaluation, 2016/17
Pataula Charter Academy
193
Subject Area: Geometry State Charter: Pataula Charter Academy Comparison Districts: Baker, Calhoun, Clay, Early, and Randolph

State Charter Schools Performance Evaluation, 2016/17
Pataula Charter Academy
194
Subject Area: Physical Science State Charter: Pataula Charter Academy Comparison Districts: Baker, Calhoun, Clay, Early, and Randolph

State Charter Schools Performance Evaluation, 2016/17
Pataula Charter Academy
195
Subject Area: U.S. History State Charter: Pataula Charter Academy Comparison Districts: Baker, Calhoun, Clay, Early, and Randolph

State Charter Schools Performance Evaluation, 2016/17
196 Scintilla Charter Academy
Scintilla Charter Academy
Key Findings
• The value-added estimate of Scintilla Charter Academy’s impact on a student’s average achievement across all subjects is -0.0859 in elementary grades.
• Scintilla Charter Academy’s performance is statistically below the state average, but indistinguishable from the district.
• Compared to the 2015/16 school year, the school showed improvement. Elementary ELA improved from the prior year while elementary Math remained statistically below the state and district.
• The school’s contribution to student achievement is: o below the state and two-district average in elementary Math; and o indistinguishable from the state and two-district average in elementary ELA.
General Characteristics
School Name Calendar
Year Opened
EMO Affiliation
Grades Curriculum Focus School Year
Single-Gender School
Virtual/ Online School
Serves Multiple Districts
Parental Involvement Requirement
Enrollment Restrictions
Scintilla Charter Academy
2015 No K-5
Project-based learning with
emphasis on service learning
Normal No No Yes 20 volunteer hours/year
Students residing in Lowndes County and
Valdosta City School districts
Students Served
School Name Pct. Female Pct. White Pct. Black Pct.
Hispanic Pct. Other
Race Pct. FRL Pct. Direct
Cert Pct. LEP Pct. SWD Pct. Gifted
Scintilla 47.6 50.3 40.8 2.7 6.1 53.7 26.8 1.1 12.1 11.2

State Charter Schools Performance Evaluation, 2016/17
Scintilla Charter Academy
197
Value-Added and SGP Results Summary by Grade Level and Subject
Overall School Effect: -0.0859 Elementary Average Overall School Effect in District: -0.0186 Elementary
Scintilla Charter Academy’s contribution to a student’s average achievement across ELA and Math is below the average elementary school in the state but indistinguishable from its two-district attendance zone. It is important to note that averaging achievement scores across subjects masks any variation in school performance between subject areas. As a result, the table below also includes the school’s effect on student achievement in each subject area.
Value-Added (Controls for Student Demographics and Prior Test Scores)
Student Growth Percentiles (Controls only for Prior Test Scores)
Grade Level and Subject School Effect
State Percentile (higher is
better)
Statistically Different from
State Average?
District Rank (lower is better)
District Average
Statistically Different from
District Average?
School Mean of Individual
SGPs
State Percentile (higher is
better)
District Rank (lower is better)
Elementary
ELA -0.0768 19 No 11 of 13 -0.0403 No 48 34 4 of 13
Math -0.0919 23 Lower 11 of 13 0.0030 Lower 50 51 5 of 13
All-Subject Average -0.0859 18 Lower 11 of 13 -0.0186 No 49 40 5 of 13
Middle
ELA
Math
All-Subject Average
High
9th Grade Literature
American Literature
Algebra 1
Biology

State Charter Schools Performance Evaluation, 2016/17
Scintilla Charter Academy
198
Value-Added (Controls for Student Demographics and Prior Test Scores)
Student Growth Percentiles (Controls only for Prior Test Scores)
Grade Level and Subject School Effect
State Percentile (higher is
better)
Statistically Different from
State Average?
District Rank (lower is better)
District Average
Statistically Different from
District Average?
School Mean of Individual
SGPs
State Percentile (higher is
better)
District Rank (lower is better)
Economics
Geometry
Physical Science
U.S. History
Note: Statistical significance is based on a 95 percent confidence level. The state average value-added effect is zero. The district average represents the simple average of the school effects of all schools in the relevant district or set of districts. Schools with a statewide attendance zone are compared to the state average and, thus, have no comparison district.
Comparison of 2016/17, 2015/16, and 2014/15 Value-Added and SGP Summary Results
Compared to the 2015/16 school year, the school showed improvement. Elementary ELA performance improved from the prior year, while elementary Math performance remained statistically below the state and district.
Value-Added
(Controls for Student Demographics and Prior Test Scores)
2014/15 2015/16 2016/17*
Grade Level and Subject
School Effect
Statistically Different
from State Average?
District Average
Statistically Different
from District Average?
School Effect
Statistically Different
from State Average?
District Average
Statistically Different
from District Average?
School Effect
Statistically Different
from State Average?
District Average
Statistically Different
from District Average?
Elementary
ELA -0.2714 Lower -0.0356 Lower -0.0768 No -0.0403 No
Math -0.3735 Lower 0.0101 Lower -0.0919 Lower 0.0030 Lower
Science -0.0035 No 0.0493 No
Social Studies -0.0228 No 0.0651 No
All-Subject Average -0.1681 Lower 0.0212 Lower -0.0859 Lower -0.0186 No

State Charter Schools Performance Evaluation, 2016/17
Scintilla Charter Academy
199
Value-Added
(Controls for Student Demographics and Prior Test Scores)
2014/15 2015/16 2016/17*
Grade Level and Subject
School Effect
Statistically Different
from State Average?
District Average
Statistically Different
from District Average?
School Effect
Statistically Different
from State Average?
District Average
Statistically Different
from District Average?
School Effect
Statistically Different
from State Average?
District Average
Statistically Different
from District Average?
Middle
ELA
Math
Science
Social Studies
All-Subject Average
High
9th Grade Literature
American Literature
Analytic Geometry
Algebra 1
Biology
Coordinate Algebra
Economics
Geometry
Physical Science
U.S. History
Note: Statistical significance is based on a 95 percent confidence level. The state average value-added effect is zero. The district average represents the simple average of the school effects of all schools in the relevant district or set of districts. Schools with a statewide attendance zone are compared to the state average and, thus, have no comparison district.
*For 2016/17 the school-level measure of "Direct Certification" employed in the value-added calculations differs from the measure employed in prior years. Direct Certification represents students who either live in a family unit receiving SNAP benefits, live in family unit receiving TANF benefits, are identified as homeless, are in foster care or are migrant. Due to data limitations, students in foster care were not included in the direct certification tally in 2016/17.

State Charter Schools Performance Evaluation, 2016/17
Scintilla Charter Academy
200
Student Growth Percentiles
(Controls only for Prior Test Scores)
2014/15 2015/16 2016/17
Grade Level and Subject School Mean of
Individual SGPs
State Percentile (higher is better)
District Rank (lower
is better)
School Mean of
Individual SGPs
State Percentile (higher is
better)
District Rank (lower is better)
School Mean of
Individual SGPs
State Percentile (higher is
better)
District Rank
(lower is better)
Elementary
ELA 34 1 13 of 13 48 34 4 of 13
Math 26 1 13 of 13 50 51 5 of 13
Science 52 59 7 of 13
Social Studies 46 33 10 of 13
All-Subject Average 39 6 13 of 13 49 40 5 of 13
Middle
ELA
Math
Science
Social Studies
All-Subject Average
High
9th Grade Literature
American Literature
Analytic Geometry
Algebra 1
Biology
Coordinate Algebra
Economics
Geometry

State Charter Schools Performance Evaluation, 2016/17
Scintilla Charter Academy
201
Student Growth Percentiles
(Controls only for Prior Test Scores)
2014/15 2015/16 2016/17
Grade Level and Subject School Mean of
Individual SGPs
State Percentile (higher is better)
District Rank (lower
is better)
School Mean of
Individual SGPs
State Percentile (higher is
better)
District Rank (lower is better)
School Mean of
Individual SGPs
State Percentile (higher is
better)
District Rank
(lower is better)
Physical Science
U.S. History
Note: Schools with a statewide attendance zone are compared to the state average and, thus, have no comparison district.

State Charter Schools Performance Evaluation, 2016/17
202 Scintilla Charter Academy
Comparison of School Impact
Subject Area: All-Subject Elementary Average State Charter: Scintilla Charter Academy Comparison Districts: Lowndes County and Valdosta City

State Charter Schools Performance Evaluation, 2016/17
Scintilla Charter Academy
203
Subject Area: Elementary ELA State Charter: Scintilla Charter Academy Comparison Districts: Lowndes County and Valdosta City
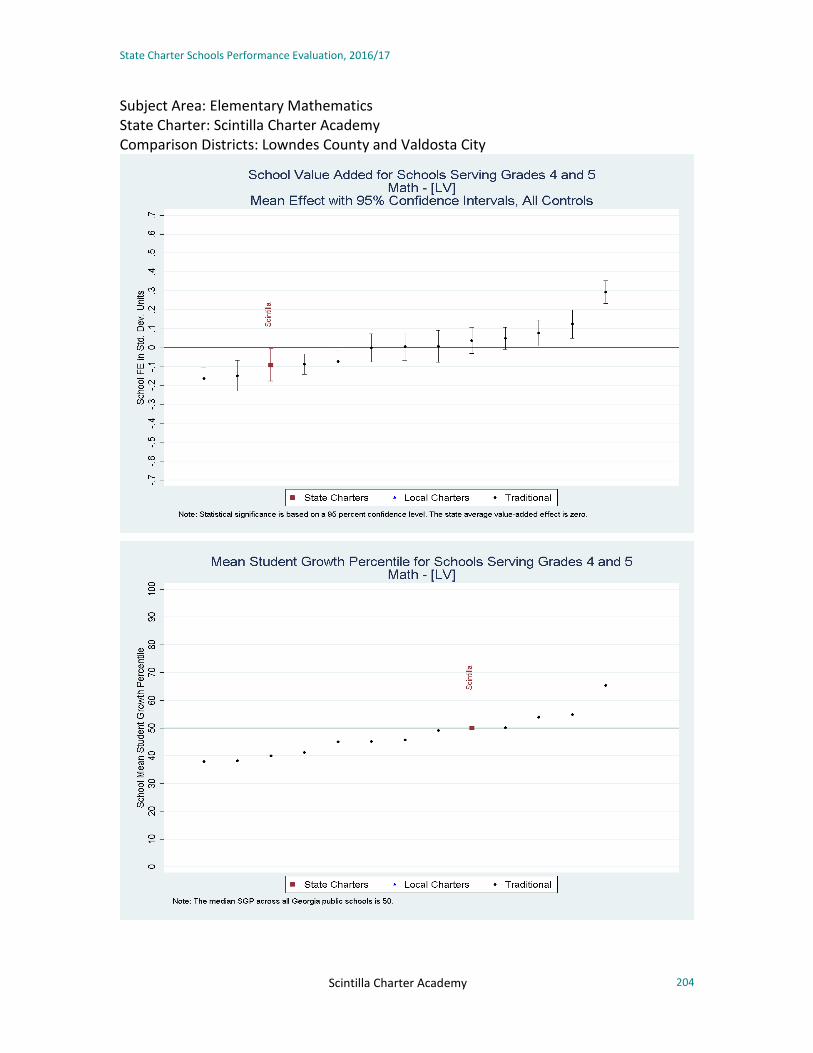
State Charter Schools Performance Evaluation, 2016/17
Scintilla Charter Academy
204
Subject Area: Elementary Mathematics State Charter: Scintilla Charter Academy Comparison Districts: Lowndes County and Valdosta City

State Charter Schools Performance Evaluation, 2016/17
205 Southwest Georgia STEM Charter
Southwest Georgia STEM Charter
Key Findings
• In each of the grades, fewer than 15 students were tested. As a result, performance information is not reported for Southwest Georgia STEM Charter.
• Southwest Georgia STEM’s first year in operation is 2016/17, so it is not possible to make year-to-year performance assessments.
General Characteristics
School Name Calendar
Year Opened
EMO Affiliation
Grades Curriculum Focus School Year
Single-Gender School
Virtual/ Online School
Serves Multiple Districts
Parental Involvement Requirement
Enrollment Restrictions
Southwest Georgia STEM Charter
2016 No K-5 Interdisciplinary,
place-based paired with STEM
Normal No No Yes Not Specified Students residing
in State of GA
Students Served
School Name Pct. Female Pct. White Pct. Black Pct.
Hispanic Pct. Other
Race Pct. FRL Pct. Direct
Cert Pct. LEP Pct. SWD Pct. Gifted
Southwest GA 50.6 72.3 14.5 8.4 4.8 0.0 44.9 0.0 12.0 0.0
Value-Added and SGP Results Summary by Grade Level and Subject
Fewer than 15 students enrolled per grade. Data is only reported for tests with at least 15 test-takers.
Comparison of 2016/17, 2015/16, and 2014/15 Value-Added and SGP Summary Results
Southwest Georgia STEM’s first year in operation is 2016/17, so it is not possible to make year-to-year performance assessments.

State Charter Schools Performance Evaluation, 2016/17
206 Statesboro STEAM
Statesboro STEAM College, Careers, Arts & Technology Academy (formerly Charter Conservatory for Liberal Arts & Technology (CCAT))
Key Findings
• The value-added estimate of the school’s impact on a student’s average achievement across all subjects is -0.1127 in middle grades.
• Statesboro STEAM College, Careers, Arts & Technology Academy’s estimated contribution to student achievement in courses where end-of-course exams are administered are as follows: 0.1206 in 9th Grade Literature, -0.0239 in Algebra 1, 0.0622 in Biology, 0.3134 in Economics, and 0.0823 in Physical Science.
• Statesboro STEAM College, Careers, Arts & Technology Academy’s performance is lower than the state and district average of middle schools. The value-added estimate of the school’s impact on a high school student’s achievement in all tested subjects is indistinguishable from the state and district averages, except for Economics, which is higher than the state average.
• Statesboro STEAM College, Careers, Arts & Technology Academy’s 2016/17 performance in middle school ELA is improved from 2015/16 and similar to 2014/15. For middle school Math, performance is consistently below the state and district in all three years. In high school grades, the school’s performance improved in 9th Grade Literature from 2015/16, but most subjects for which performance results are available in 2016/17 do not have performance results in the prior year.
• The school’s contribution to student achievement is: o below the state and district averages in middle school Math; o indistinguishable from the district but higher than the state in Economics; and o indistinguishable from the state and district average in middle school ELA, 9th Grade Literature, Algebra 1, Biology, and Physical
Science.
General Characteristics
School Name Calendar
Year Opened
EMO Affiliation
Grades Curriculum Focus School Year Single-Gender School
Virtual/ Online School
Serves Multiple Districts
Parental Involvement Requirement
Enrollment Restrictions
Statesboro STEAM
2002 No 6-12 Multi-age classrooms
- students grouped by skill level
Year-round No No No 1 Hour of
Service/week
Students residing in
Bulloch County Public Schools
Zone
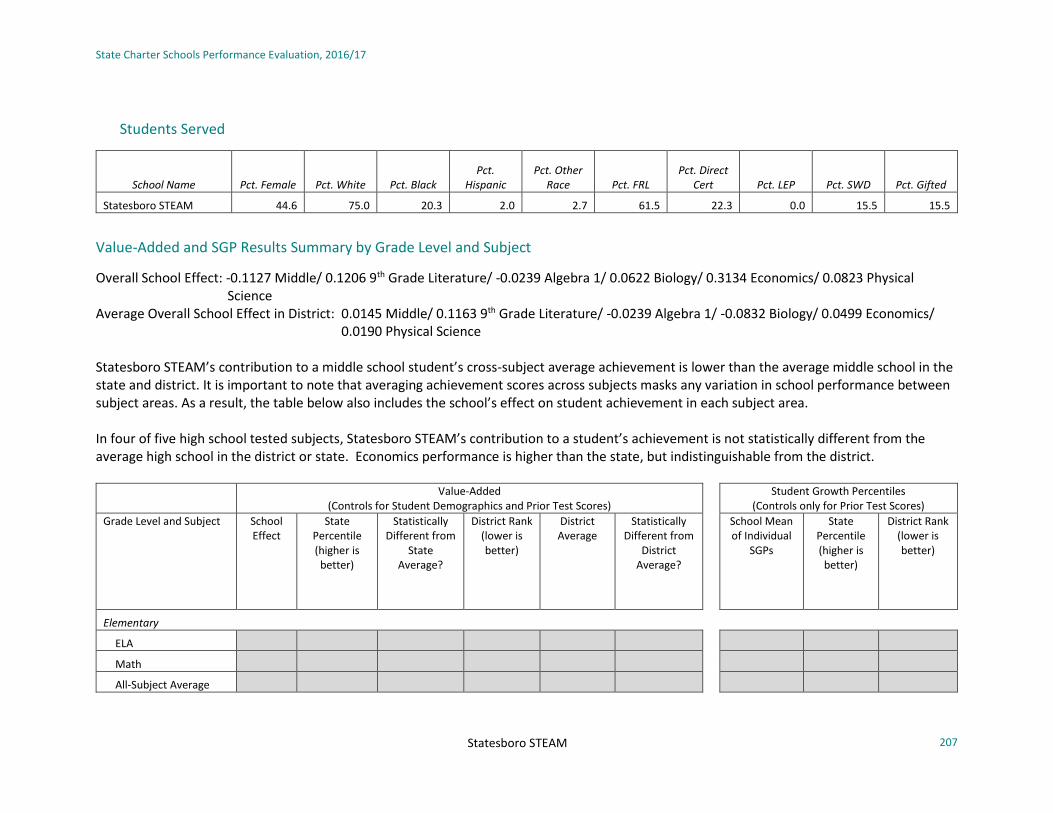
State Charter Schools Performance Evaluation, 2016/17
Statesboro STEAM
207
Students Served
School Name Pct. Female Pct. White Pct. Black Pct.
Hispanic Pct. Other
Race Pct. FRL Pct. Direct
Cert Pct. LEP Pct. SWD Pct. Gifted
Statesboro STEAM 44.6 75.0 20.3 2.0 2.7 61.5 22.3 0.0 15.5 15.5
Value-Added and SGP Results Summary by Grade Level and Subject
Overall School Effect: -0.1127 Middle/ 0.1206 9th Grade Literature/ -0.0239 Algebra 1/ 0.0622 Biology/ 0.3134 Economics/ 0.0823 Physical Science
Average Overall School Effect in District: 0.0145 Middle/ 0.1163 9th Grade Literature/ -0.0239 Algebra 1/ -0.0832 Biology/ 0.0499 Economics/ 0.0190 Physical Science
Statesboro STEAM’s contribution to a middle school student’s cross-subject average achievement is lower than the average middle school in the state and district. It is important to note that averaging achievement scores across subjects masks any variation in school performance between subject areas. As a result, the table below also includes the school’s effect on student achievement in each subject area. In four of five high school tested subjects, Statesboro STEAM’s contribution to a student’s achievement is not statistically different from the average high school in the district or state. Economics performance is higher than the state, but indistinguishable from the district.
Value-Added (Controls for Student Demographics and Prior Test Scores)
Student Growth Percentiles (Controls only for Prior Test Scores)
Grade Level and Subject School Effect
State Percentile (higher is
better)
Statistically Different from
State Average?
District Rank (lower is better)
District Average
Statistically Different from
District Average?
School Mean of Individual
SGPs
State Percentile (higher is better)
District Rank (lower is better)
Elementary
ELA
Math
All-Subject Average
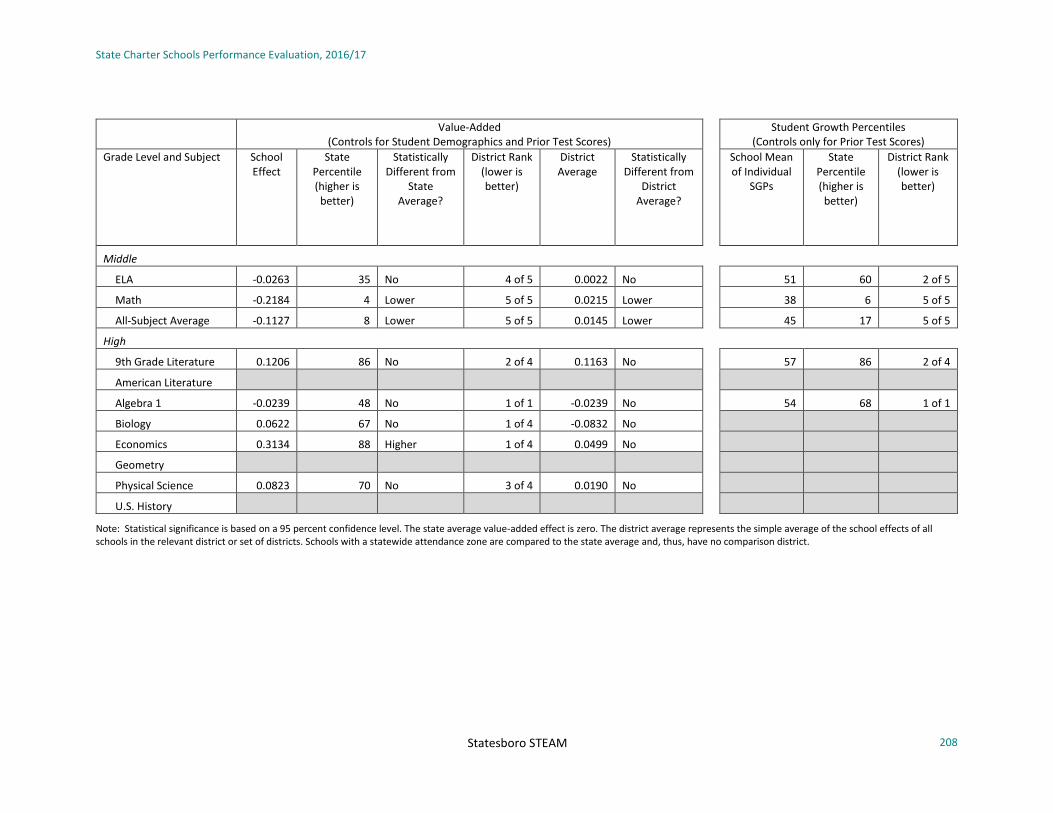
State Charter Schools Performance Evaluation, 2016/17
Statesboro STEAM
208
Value-Added (Controls for Student Demographics and Prior Test Scores)
Student Growth Percentiles (Controls only for Prior Test Scores)
Grade Level and Subject School Effect
State Percentile (higher is
better)
Statistically Different from
State Average?
District Rank (lower is better)
District Average
Statistically Different from
District Average?
School Mean of Individual
SGPs
State Percentile (higher is better)
District Rank (lower is better)
Middle
ELA -0.0263 35 No 4 of 5 0.0022 No 51 60 2 of 5
Math -0.2184 4 Lower 5 of 5 0.0215 Lower 38 6 5 of 5
All-Subject Average -0.1127 8 Lower 5 of 5 0.0145 Lower 45 17 5 of 5
High
9th Grade Literature 0.1206 86 No 2 of 4 0.1163 No 57 86 2 of 4
American Literature
Algebra 1 -0.0239 48 No 1 of 1 -0.0239 No 54 68 1 of 1
Biology 0.0622 67 No 1 of 4 -0.0832 No
Economics 0.3134 88 Higher 1 of 4 0.0499 No
Geometry
Physical Science 0.0823 70 No 3 of 4 0.0190 No
U.S. History
Note: Statistical significance is based on a 95 percent confidence level. The state average value-added effect is zero. The district average represents the simple average of the school effects of all schools in the relevant district or set of districts. Schools with a statewide attendance zone are compared to the state average and, thus, have no comparison district.

State Charter Schools Performance Evaluation, 2016/17
Statesboro STEAM
209
Comparison of 2016/17, 2015/16, and 2014/15 Value-Added and SGP Summary Results
Statesboro STEAM College, Careers, Arts & Technology Academy’s 2016/17 performance in middle school ELA improved from 2015/16 and is similar to its performance in 2014/15. For middle school Math, performance is consistently below the state and district in all three years. In high school grades, the school’s performance improved in 9th Grade Literature from 2015/16, but most subjects for which performance results are available in 2016/17 do not have performance results in the prior year.
Value-Added
(Controls for Student Demographics and Prior Test Scores)
2014/15 2015/16 2016/17*
Grade Level and Subject
School Effect
Statistically Different
from State Average?
District Average
Statistically Different
from District Average?
School Effect
Statistically Different
from State Average?
District Average
Statistically Different
from District Average?
School Effect
Statistically Different
from State Average?
District Average
Statistically Different
from District Average?
Elementary
ELA
Math
Science
Social Studies
All-Subject Average
Middle
ELA 0.0504 No 0.0013 No -0.2734 Lower -0.0154 Lower -0.0263 No 0.0022 No
Math -0.1862 Lower 0.0578 Lower -0.3284 Lower 0.0077 Lower -0.2184 Lower 0.0215 Lower
Science 0.0088 No -0.0755 No -0.1365 Lower -0.0174 Lower
Social Studies 0.0140 No 0.0134 No -0.3291 Lower -0.0754 Lower
All-Subject Average -0.0214 No 0.0016 No -0.2413 Lower -0.0152 Lower -0.1127 Lower 0.0145 Lower
High
9th Grade Literature 0.1496 No -0.0884 Higher -0.0062 No -0.0326 No 0.1206 No 0.1163 No
American Literature 0.0476 No 0.0250 No
Analytic Geometry -0.0106 No 0.0974 No

State Charter Schools Performance Evaluation, 2016/17
Statesboro STEAM
210
Value-Added
(Controls for Student Demographics and Prior Test Scores)
2014/15 2015/16 2016/17*
Grade Level and Subject
School Effect
Statistically Different
from State Average?
District Average
Statistically Different
from District Average?
School Effect
Statistically Different
from State Average?
District Average
Statistically Different
from District Average?
School Effect
Statistically Different
from State Average?
District Average
Statistically Different
from District Average?
Algebra 1 -0.0239 No -0.0239 No
Biology -0.1071 No -0.0187 No 0.0622 No -0.0832 No
Coordinate Algebra -0.0377 No 0.0710 No -0.1786 No -0.0236 No
Economics 0.3134 Higher 0.0499 No
Geometry
Physical Science 0.0328 No 0.0239 No 0.0823 No 0.0190 No
U.S. History -0.2119 No 0.0209 No
Note: Statistical significance is based on a 95 percent confidence level. The state average value-added effect is zero. The district average represents the simple average of the school effects of all schools in the relevant district or set of districts. Schools with a statewide attendance zone are compared to the state average and, thus, have no comparison district.
*For 2016/17 the school-level measure of "Direct Certification" employed in the value-added calculations differs from the measure employed in prior years. Direct Certification represents students who either live in a family unit receiving SNAP benefits, live in family unit receiving TANF benefits, are identified as homeless, are in foster care or are migrant. Due to data limitations, students in foster care were not included in the direct certification tally in 2016/17.
Student Growth Percentiles
(Controls only for Prior Test Scores)
2014/15 2015/16 2016/17
Grade Level and Subject School Mean of
Individual SGPs
State Percentile (higher is
better)
District Rank (lower
is better)
School Mean of
Individual SGPs
State Percentile (higher is
better)
District Rank (lower
is better)
School Mean of
Individual SGPs
State Percentile (higher is
better)
District Rank (lower
is better)
Elementary
ELA
Math
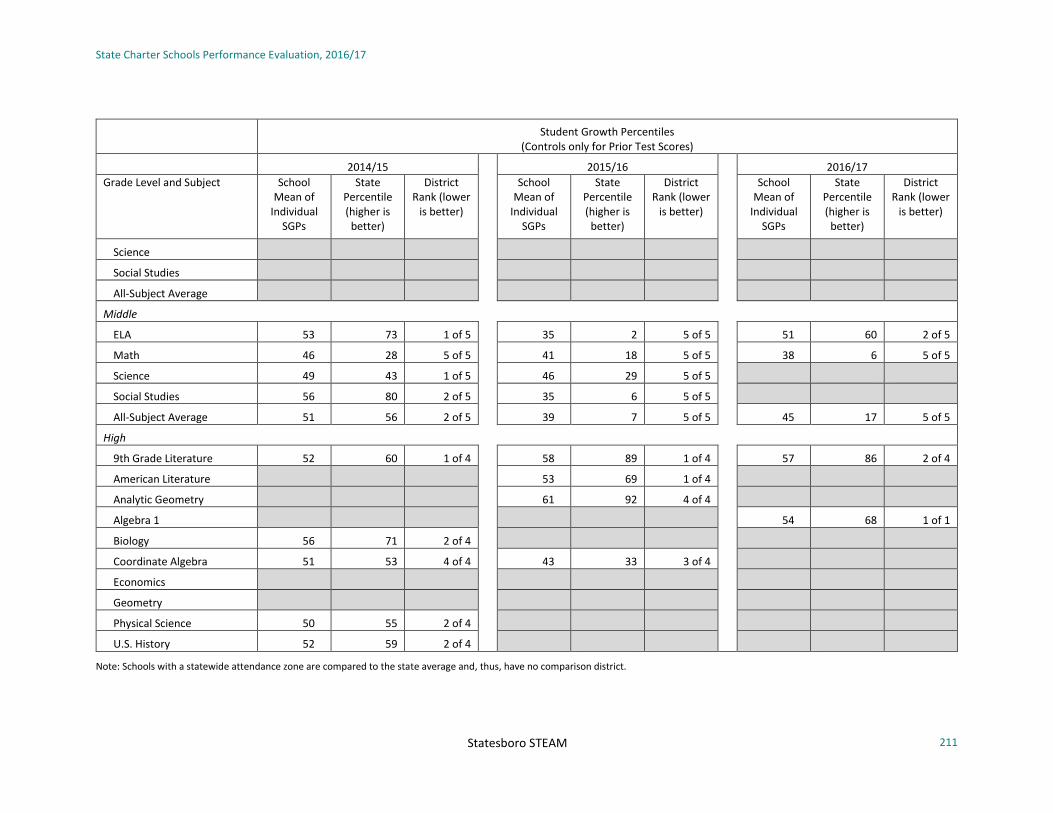
State Charter Schools Performance Evaluation, 2016/17
Statesboro STEAM
211
Student Growth Percentiles
(Controls only for Prior Test Scores)
2014/15 2015/16 2016/17
Grade Level and Subject School Mean of
Individual SGPs
State Percentile (higher is
better)
District Rank (lower
is better)
School Mean of
Individual SGPs
State Percentile (higher is
better)
District Rank (lower
is better)
School Mean of
Individual SGPs
State Percentile (higher is
better)
District Rank (lower
is better)
Science
Social Studies
All-Subject Average
Middle
ELA 53 73 1 of 5 35 2 5 of 5 51 60 2 of 5
Math 46 28 5 of 5 41 18 5 of 5 38 6 5 of 5
Science 49 43 1 of 5 46 29 5 of 5
Social Studies 56 80 2 of 5 35 6 5 of 5
All-Subject Average 51 56 2 of 5 39 7 5 of 5 45 17 5 of 5
High
9th Grade Literature 52 60 1 of 4 58 89 1 of 4 57 86 2 of 4
American Literature 53 69 1 of 4
Analytic Geometry 61 92 4 of 4
Algebra 1 54 68 1 of 1
Biology 56 71 2 of 4
Coordinate Algebra 51 53 4 of 4 43 33 3 of 4
Economics
Geometry
Physical Science 50 55 2 of 4
U.S. History 52 59 2 of 4
Note: Schools with a statewide attendance zone are compared to the state average and, thus, have no comparison district.

State Charter Schools Performance Evaluation, 2016/17
212 Statesboro STEAM
Comparison of School Impact Subject Area: All-Subject Middle Average State Charter: Statesboro STEAM Comparison District: Bulloch County Public Schools
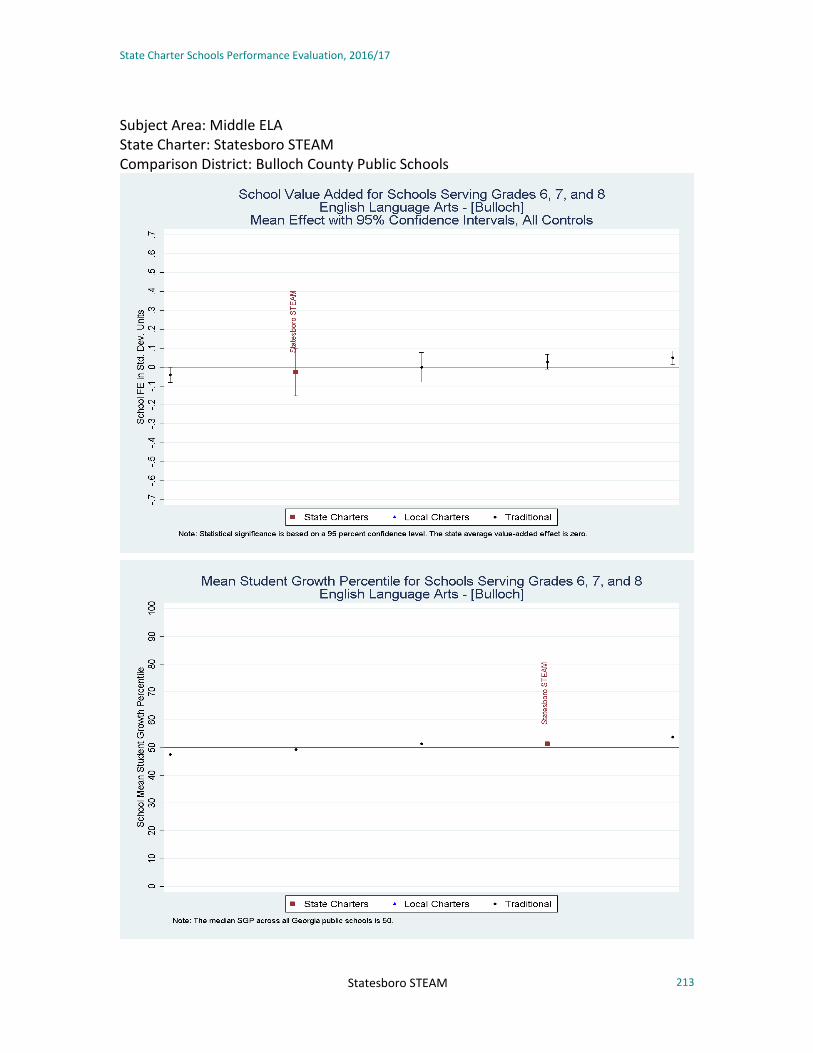
State Charter Schools Performance Evaluation, 2016/17
Statesboro STEAM
213
Subject Area: Middle ELA State Charter: Statesboro STEAM Comparison District: Bulloch County Public Schools

State Charter Schools Performance Evaluation, 2016/17
Statesboro STEAM
214
Subject Area: Middle Mathematics State Charter: Statesboro STEAM Comparison District: Bulloch County Public Schools
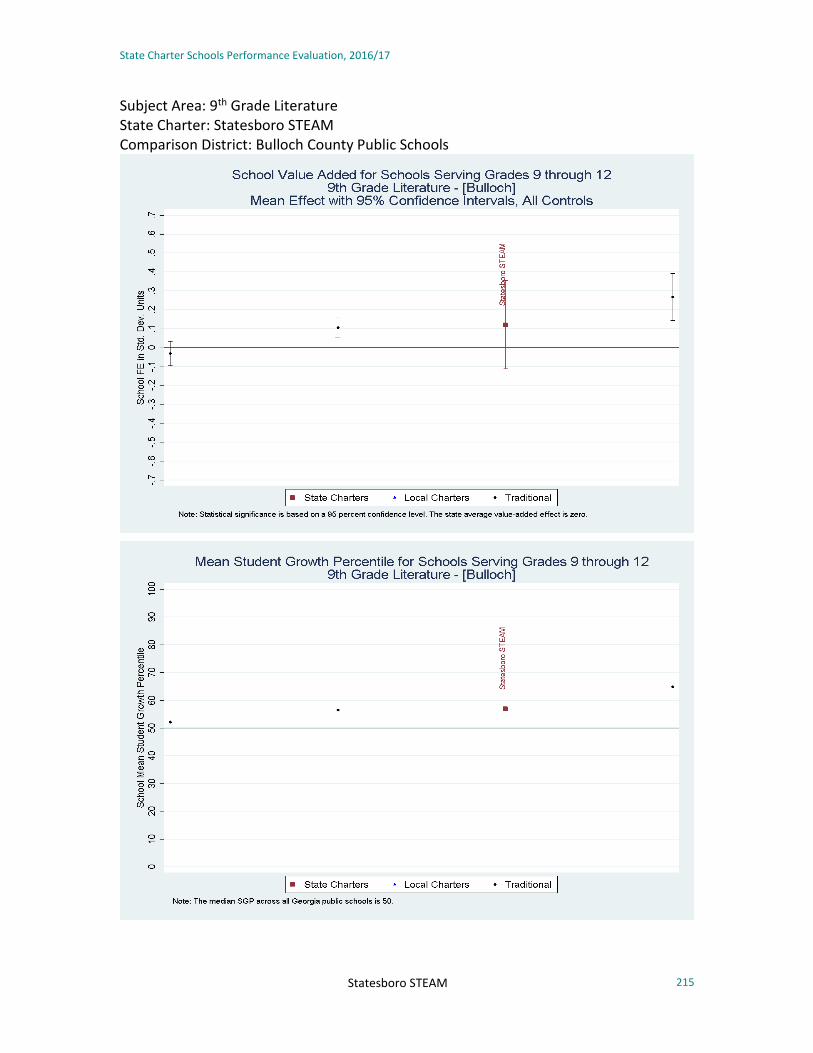
State Charter Schools Performance Evaluation, 2016/17
Statesboro STEAM
215
Subject Area: 9th Grade Literature State Charter: Statesboro STEAM Comparison District: Bulloch County Public Schools

State Charter Schools Performance Evaluation, 2016/17
Statesboro STEAM
216
Subject Area: Algebra 1 State Charter: Statesboro STEAM Comparison District: Bulloch County Public Schools

State Charter Schools Performance Evaluation, 2016/17
Statesboro STEAM
217
Subject Area: Biology State Charter: Statesboro STEAM Comparison District: Bulloch County Public Schools

State Charter Schools Performance Evaluation, 2016/17
Statesboro STEAM
218
Subject Area: Economics State Charter: Statesboro STEAM Comparison District: Bulloch County Public Schools
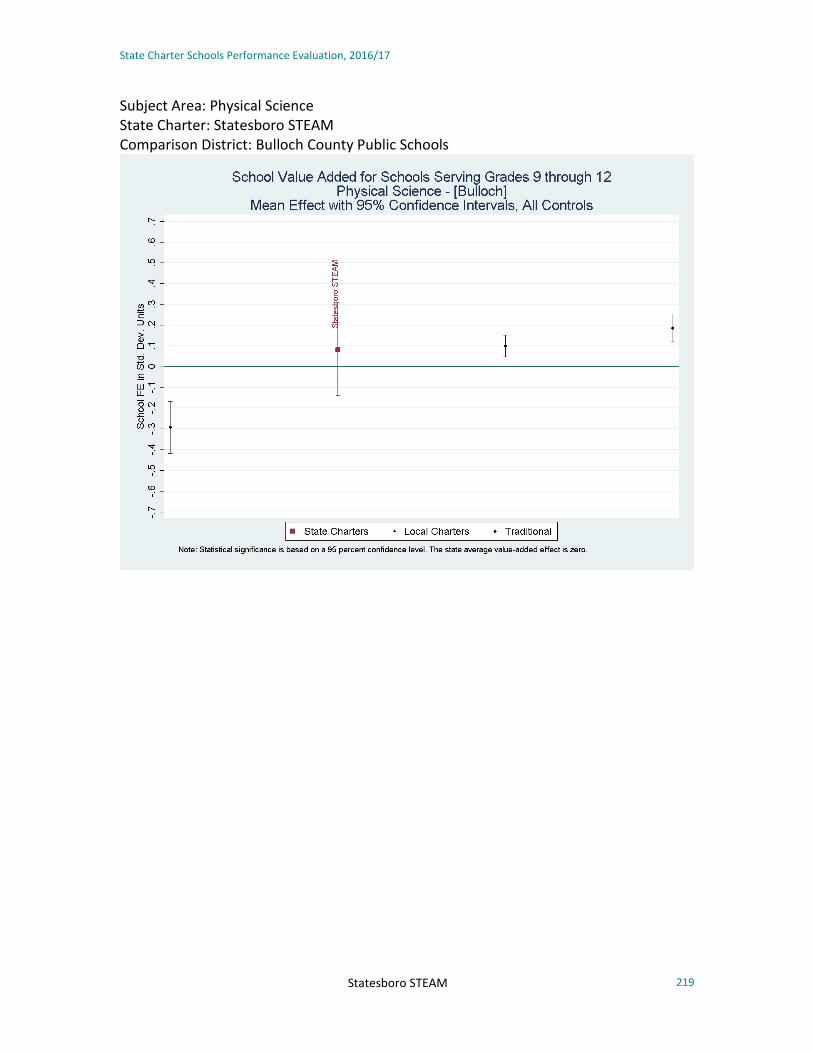
State Charter Schools Performance Evaluation, 2016/17
Statesboro STEAM
219
Subject Area: Physical Science State Charter: Statesboro STEAM Comparison District: Bulloch County Public Schools

State Charter Schools Performance Evaluation, 2016/17
Utopian Academy for the Arts
220
Utopian Academy for the Arts
Key Findings
• The value-added estimate of the Utopian Academy for the Arts’ impact on a student’s average achievement across all subjects is -0.1052 in middle grades.
• Utopian Academy for the Arts’ performance is below the state and district average in middle grades.
• Compared to 2015/16, performance is generally worse in middle school ELA and similar in middle school Math. When compared to
2014/15, the school did worse in both tested subjects.
• The school’s contribution to student achievement is:
o below the state and district average in middle school ELA and Math.
General Characteristics
School Name Calendar
Year Opened
EMO Affiliation
Grades Curriculum Focus School Year
Single-Gender School
Virtual/ Online School
Serves Multiple Districts
Parental Involvement Requirement
Enrollment Restrictions
Utopian Academy for the Arts
2014 No 6-8
Expeditionary Learning Curriculum.
Single-gender instructional
approach, and classes in the
dramatic, media, and culinary arts.
Extended Day/Week/
Year No No No
Attendance of a New
Parent Orientation Meeting &
sign an agreement
Students residing in Clayton County
Public Schools Zone
Students Served
School Name Pct. Female Pct. White Pct. Black Pct.
Hispanic Pct. Other
Race Pct. FRL Pct. Direct
Cert Pct. LEP Pct. SWD Pct. Gifted
Utopian 53.0 0.4 93.6 4.1 1.9 100.0 43.9 0.0 9.4 0.0

State Charter Schools Performance Evaluation, 2016/17
Utopian Academy for the Arts
221
Value-Added and SGP Results Summary by Grade Level and Subject
Overall School Effect: -0.1052 Middle Overall District Average: 0.0451 Middle
Utopian Academy for the Art’s contribution to a middle student’s average achievement across all subjects is below that of the average middle school in the state and district. It is important to note that averaging achievement scores across subjects masks any variation in school performance between subject areas. As a result, the table below also includes the school’s effect on student achievement in each subject area.
Value-Added (Controls for Student Demographics and Prior Test Scores)
Student Growth Percentiles (Controls only for Prior Test Scores)
Grade Level and Subject School Effect
State Percentile (higher is
better)
Statistically Different from
State Average?
District Rank (lower is better)
District Average
Statistically Different from
District Average?
School Mean of Individual
SGPs
State Percentile (higher is better)
District Rank (lower is better)
Elementary
ELA
Math
All-Subject Average
Middle
ELA -0.0712 16 Lower 18 of 18 0.0752 Lower 42 6 18 of 18
Math -0.1152 17 Lower 17 of 18 0.0132 Lower 40 9 18 of 18
All-Subject Average -0.1052 9 Lower 18 of 18 0.0451 Lower 41 5 18 of 18
High
9th Grade Literature
American Literature
Algebra 1
Biology
Economics
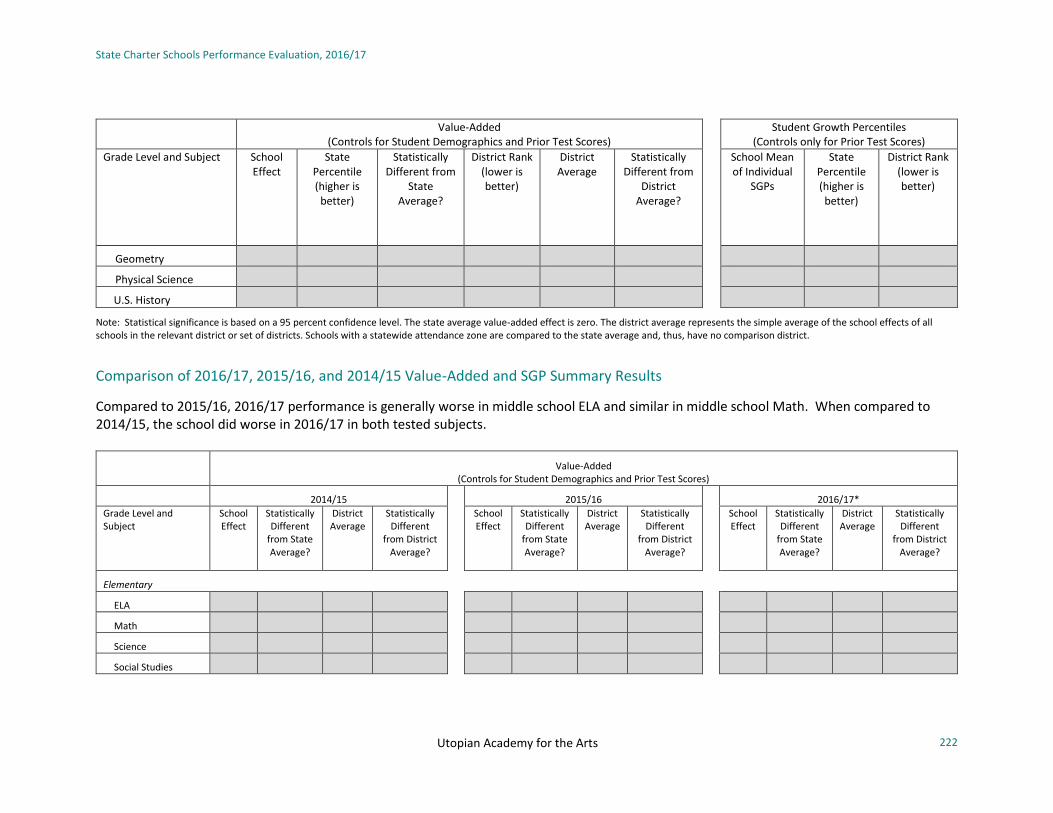
State Charter Schools Performance Evaluation, 2016/17
Utopian Academy for the Arts
222
Value-Added (Controls for Student Demographics and Prior Test Scores)
Student Growth Percentiles (Controls only for Prior Test Scores)
Grade Level and Subject School Effect
State Percentile (higher is
better)
Statistically Different from
State Average?
District Rank (lower is better)
District Average
Statistically Different from
District Average?
School Mean of Individual
SGPs
State Percentile (higher is better)
District Rank (lower is better)
Geometry
Physical Science
U.S. History
Note: Statistical significance is based on a 95 percent confidence level. The state average value-added effect is zero. The district average represents the simple average of the school effects of all schools in the relevant district or set of districts. Schools with a statewide attendance zone are compared to the state average and, thus, have no comparison district.
Comparison of 2016/17, 2015/16, and 2014/15 Value-Added and SGP Summary Results
Compared to 2015/16, 2016/17 performance is generally worse in middle school ELA and similar in middle school Math. When compared to 2014/15, the school did worse in 2016/17 in both tested subjects.
Value-Added
(Controls for Student Demographics and Prior Test Scores)
2014/15 2015/16 2016/17*
Grade Level and Subject
School Effect
Statistically Different
from State Average?
District Average
Statistically Different
from District Average?
School Effect
Statistically Different
from State Average?
District Average
Statistically Different
from District Average?
School Effect
Statistically Different
from State Average?
District Average
Statistically Different
from District Average?
Elementary
ELA
Math
Science
Social Studies

State Charter Schools Performance Evaluation, 2016/17
Utopian Academy for the Arts
223
Value-Added
(Controls for Student Demographics and Prior Test Scores)
2014/15 2015/16 2016/17*
Grade Level and Subject
School Effect
Statistically Different
from State Average?
District Average
Statistically Different
from District Average?
School Effect
Statistically Different
from State Average?
District Average
Statistically Different
from District Average?
School Effect
Statistically Different
from State Average?
District Average
Statistically Different
from District Average?
All-Subject Average
Middle
ELA -0.0229 No 0.0425 No 0.0716 Higher 0.0747 No -0.0712 Lower 0.0752 Lower
Math 0.0785 Higher -0.0198 Higher -0.1141 Lower -0.0320 Lower -0.1152 Lower 0.0132 Lower
Science -0.2309 Lower -0.0376 Lower 0.0790 Higher 0.0182 No
Social Studies -0.1545 Lower 0.0043 Lower -0.0069 No 0.0327 No
All-Subject Average -0.0826 Lower -0.0056 Lower 0.0078 No 0.0222 No -0.1052 Lower 0.0451 Lower
High
9th Grade Literature
American Literature
Analytic Geometry
Algebra 1
Biology
Coordinate Algebra
Economics
Geometry
Physical Science
U.S. History
Note: Statistical significance is based on a 95 percent confidence level. The state average value-added effect is zero. The district average represents the simple average of the school effects of all schools in the relevant district or set of districts. Schools with a statewide attendance zone are compared to the state average and, thus, have no comparison district.
*For 2016/17 the school-level measure of "Direct Certification" employed in the value-added calculations differs from the measure employed in prior years. Direct Certification represents students who either live in a family unit receiving SNAP benefits, live in family unit receiving TANF benefits, are identified as homeless, are in foster care or are migrant. Due to data limitations, students in foster care were not included in the direct certification tally in 2016/17.

State Charter Schools Performance Evaluation, 2016/17
Utopian Academy for the Arts
224
Student Growth Percentiles
(Controls only for Prior Test Scores)
2014/15 2015/16 2016/17
Grade Level and Subject School Mean of
Individual SGPs
State Percentile (higher is better)
District Rank (lower
is better)
School Mean of
Individual SGPs
State Percentile (higher is
better)
District Rank (lower is better)
School Mean of
Individual SGPs
State Percentile (higher is
better)
District Rank
(lower is better)
Elementary
ELA
Math
Science
Social Studies
All-Subject Average
Middle
ELA 52 64 8 of 18 49 47 13 of 18 42 6 18 of 18
Math 61 93 1 of 18 39 12 17 of 18 40 9 18 of 18
Science 34 4 18 of 18 51 61 5 of 18
Social Studies 47 33 17 of 18 49 45 12 of 18
All-Subject Average 48 38 9 of 18 47 33 14 of 18 41 5 18 of 18
High
9th Grade Literature
American Literature
Analytic Geometry
Algebra 1
Biology
Coordinate Algebra
Economics
Geometry

State Charter Schools Performance Evaluation, 2016/17
Utopian Academy for the Arts
225
Student Growth Percentiles
(Controls only for Prior Test Scores)
2014/15 2015/16 2016/17
Grade Level and Subject School Mean of
Individual SGPs
State Percentile (higher is better)
District Rank (lower
is better)
School Mean of
Individual SGPs
State Percentile (higher is
better)
District Rank (lower is better)
School Mean of
Individual SGPs
State Percentile (higher is
better)
District Rank
(lower is better)
Physical Science
U.S. History
Note: Schools with a statewide attendance zone are compared to the state average and, thus, have no comparison district.

State Charter Schools Performance Evaluation, 2016/17
226
Comparison of School Impact Subject Area: All-Subject Middle Average State Charter: Utopian Academy for the Arts Comparison District: Clayton County

State Charter Schools Performance Evaluation, 2016/17
Utopian Academy for the Arts
227
Subject Area: Middle ELA State Charter: Utopian Academy for the Arts Comparison District: Clayton County

State Charter Schools Performance Evaluation, 2016/17
Utopian Academy for the Arts
228
Subject Area: Middle Mathematics State Charter: Utopian Academy for the Arts Comparison District: Clayton County

State Charter Schools Performance Evaluation, 2016/17
229
IV. References Angrist, J. D., Pathak, P. A. & Walters, C R. (2013). “Explaining Charter School Effectiveness.”
American Economic Journal: Applied Economics, 5(4): 1-27.
American Institutes for Research (2012). 2011-2012 Growth Model for Educator Evaluation Technical Report: Final. Available at http://www.engageny.org/sites/default/ files/resource/attachments/growth-model-11-12-air-technical-report.pdf
Betebenner, D. (2009). “Norm- and criterion-referenced student growth.” Educational Measurement: Issues and Practice, 28: 42-51.
Bifulco, R., & Ladd, H. F. (2006). “The impacts of charter schools on student achievement: Evidence from North Carolina.” Education Finance and Policy, 1(1): 50-90.
Booker, K., Gilpatric, S. M., Gronberg, T., & Jansen, D. (2007). “The impact of charter school attendance on student performance.” Journal of Public Economics, 91(5): 849-876.
Dee, T., & Wyckoff, J. (2015). “Incentives, Selection and Teacher Performance: Evidence from IMPACT.” Journal of Policy Analysis and Management, 34(2): 267-297.
Dobbie, W. & Fryer, R. G. (2011). “Are High-Quality Schools Enough to Increase Achievement Among the Poor? Evidence from the Harlem Children’s Zone,” American Economic Journal: Applied Economics 3(3): 158-187.
Doran, H., Swanlund, A., & Lemke, M. (2012). Office of the State Superintendent of Education School-Level Model to Measure Student Achievement over Time: Technical Report. Available at http://seo.dc.gov/publication/school-level-model-measure-student-achievement-over-time-technical-report.
Ehlert, M., C Koedel, E. Parsons & M. Podgursky (2016). “Selecting Growth Measures for Use in School Evaluation Systems: Should Proportionality Matter?” Educational Policy 30(3): 465-500.
Georgia Department of Education (2010). Georgia Charter School Activity Each Year Since the First Charter School Law Passed in 1993. Available at http://www.gadoe.org/External-Affairs-and-Policy/Charter-Schools/Pages/default.aspx.
Georgia Department of Education (2011). Chartering in Georgia 2011-2012: The Charter Schools Division Annual Report for 2011 – 2012. Available at http://www.gadoe.org/External-Affairs-and-Policy/Charter-Schools/Pages/Annual-Reports.aspx.
Georgia Department of Education (2012). State Charter Schools Commission Briefing. Powerpoint presentation.
Georgia Department of Education (2016a). 2015 and 2016 CCRPI – Summary of Changes. Available at http://www.gadoe.org/Curriculum-Instruction-and-Assessment/Accountability/Documents/Indicators%20and%20Targets/SummaryofChanges.pdf.
Georgia Department of Education (2016b). Approved Charter Schools 2014-15. Available at https://www.gadoe.org/External-Affairs-and-Policy/Charter-Schools/Pages/Approved-Charter-Schools.aspx.
Georgia Department of Education (2016c). Georgia Milestones Statewide Scores. Available at http://www.gadoe.org/Curriculum-Instruction-and-Assessment/Assessment/Pages/ Georgia-Milestones-2015-2016-Statewide-Scores.aspx

State Charter Schools Performance Evaluation, 2016/17
230
Georgia Department of Education (2016d). Student Enrollment by Grade Level (PK-12). Available https://oraapp.doe.k12.ga.us/ows-bin/owa/fte_pack_enrollgrade.entry_form
Georgia Department of Education (2017). A Guide to the Georgia Student Growth Model. Available at http://www.gadoe.org/Curriculum-Instruction-and-Assessment/ Assessment/ Documents/GSGM/FY18/SGPGuide%2006052017.pdf
Gleason, P., Clark, M., Tuttle, C. C., & Dwoyer, E. (2010). The evaluation of charter school impacts: Final report (No. NCEE 2010-4029). Washington, D.C.: National Center for Education Evaluation and Regional Assistance, Institute of Education Sciences, U.S. Department of Education.
Goldhaber, D., Walch, J. & Gabele, B. (2013). “Does the Model Matter? Exploring the Relationship Between Different Student Achievement-Based Teacher Assessments.” Statistics and Public Policy 1(1): 28-39.
Guarino, C. M., Reckase, M. D. & Wooldridge, J. M. (2015). “Can Value-Added Measures of Teacher Performance be Trusted?” Education Finance and Policy 10: 117-156.
Guarino, C., Stacy, B., and Wooldridge, J. (2016). “Alignment Study Comparing Two Models of School Effectiveness: the Georgia Department of Education’s “Beating the Odds” Model and the State Charter Schools Commission’s “Value-Added” Model.” Report prepared for the State Charter Schools Commission of Georgia & The Georgia Department of Education’s Charter Division.
McCaffrey, D. F., Castellano, K. E. &Lockwood, J. R. (2014). “A Technical Evaluation of the Student Growth Component of the Georgia Teacher and Leader Evaluation System.” Educational Testing Service.
Hoxby, C. M., & Murarka, S. (2009). “Charter Schools in New York City: Who Enrolls and How They Affect Their Students’ Achievement.” NBER Working Paper 14852. Cambridge, MA: National Bureau of Economic Research.
Hoxby, C. M., & Rockoff, J. E. (2004). “The impact of charter schools on student achievement.” Harvard Institute of Economic Research Working Paper Series.
Sass, T. (2006). “Charter Schools and Student Achievement in Florida.” Education Finance and Policy 9(1): 91-122.
Sass, T. R., Semykina, A. & Harris, D. N. (2014). “Value-Added Models and the Measurement of Teacher Productivity.” Economics of Education Review 38: 9-23.
Solmon, L., Paark, K., & Garcia, D. (2001). “Does charter school attendance improve test scores? The Arizona results.” Phoenix, AZ: Goldwater Institute.
Todd, P. E. & Wolpin, K. I. (2003). “On the Specification and Estimation of the Production Function for Cognitive Achievement,” Economic Journal 113(485): F3-F33.
Walsh, E. & Isenberg, E. (2015). “How Does a Value-Added Model Compare to Student Growth Model?” Statistics and Public Policy 2(1): 1-13.
Whitehurst, G. J. & Chingos, M. M. (2011). “Class Size: What Research Says and What It Means for State Policy.” Brown Center on Education Policy at Brookings.
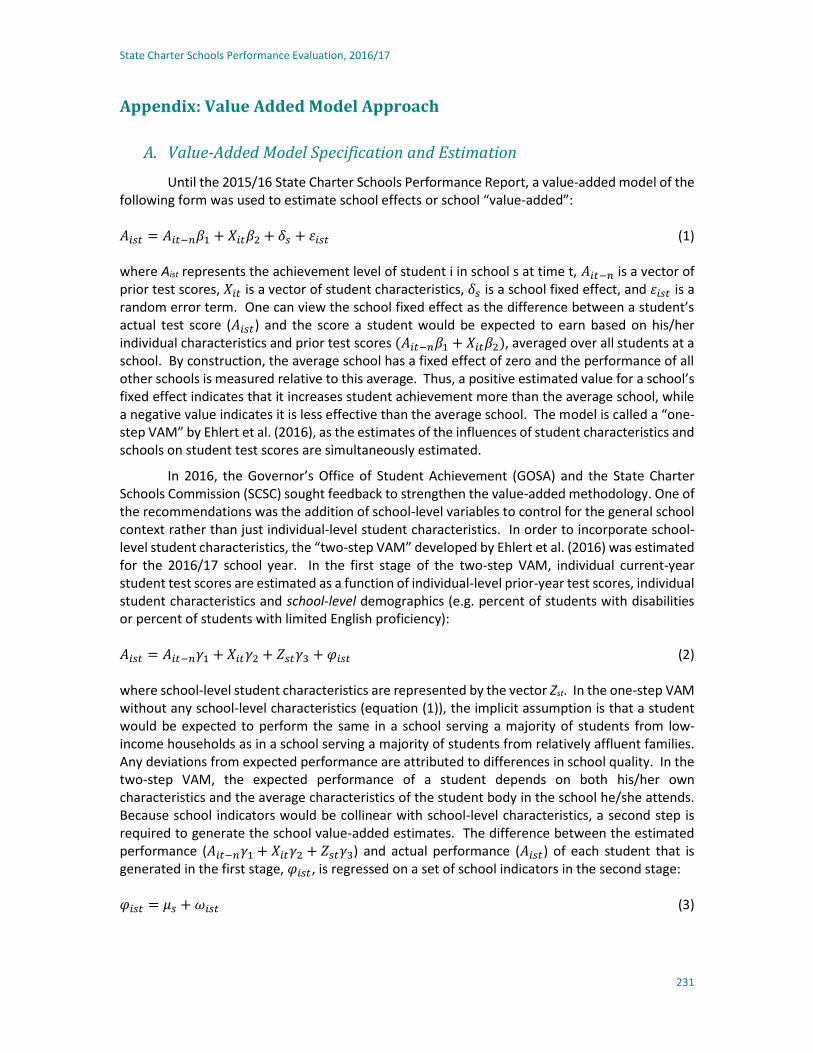
State Charter Schools Performance Evaluation, 2016/17
231
Appendix: Value Added Model Approach
A. Value-Added Model Specification and Estimation
Until the 2015/16 State Charter Schools Performance Report, a value-added model of the following form was used to estimate school effects or school “value-added”: 𝐴𝑖𝑠𝑡 = 𝐴𝑖𝑡−𝑛𝛽1 + 𝑋𝑖𝑡𝛽2 + 𝛿𝑠 + 휀𝑖𝑠𝑡 (1) where Aist represents the achievement level of student i in school s at time t, 𝐴𝑖𝑡−𝑛 is a vector of prior test scores, 𝑋𝑖𝑡 is a vector of student characteristics, 𝛿𝑠 is a school fixed effect, and 휀𝑖𝑠𝑡 is a random error term. One can view the school fixed effect as the difference between a student’s actual test score (𝐴𝑖𝑠𝑡) and the score a student would be expected to earn based on his/her individual characteristics and prior test scores (𝐴𝑖𝑡−𝑛𝛽1 + 𝑋𝑖𝑡𝛽2), averaged over all students at a school. By construction, the average school has a fixed effect of zero and the performance of all other schools is measured relative to this average. Thus, a positive estimated value for a school’s fixed effect indicates that it increases student achievement more than the average school, while a negative value indicates it is less effective than the average school. The model is called a “one-step VAM” by Ehlert et al. (2016), as the estimates of the influences of student characteristics and schools on student test scores are simultaneously estimated.
In 2016, the Governor’s Office of Student Achievement (GOSA) and the State Charter Schools Commission (SCSC) sought feedback to strengthen the value-added methodology. One of the recommendations was the addition of school-level variables to control for the general school context rather than just individual-level student characteristics. In order to incorporate school-level student characteristics, the “two-step VAM” developed by Ehlert et al. (2016) was estimated for the 2016/17 school year. In the first stage of the two-step VAM, individual current-year student test scores are estimated as a function of individual-level prior-year test scores, individual student characteristics and school-level demographics (e.g. percent of students with disabilities or percent of students with limited English proficiency): 𝐴𝑖𝑠𝑡 = 𝐴𝑖𝑡−𝑛𝛾1 + 𝑋𝑖𝑡𝛾2 + 𝑍𝑠𝑡𝛾3 + 𝜑𝑖𝑠𝑡 (2) where school-level student characteristics are represented by the vector Zst. In the one-step VAM without any school-level characteristics (equation (1)), the implicit assumption is that a student would be expected to perform the same in a school serving a majority of students from low-income households as in a school serving a majority of students from relatively affluent families. Any deviations from expected performance are attributed to differences in school quality. In the two-step VAM, the expected performance of a student depends on both his/her own characteristics and the average characteristics of the student body in the school he/she attends. Because school indicators would be collinear with school-level characteristics, a second step is required to generate the school value-added estimates. The difference between the estimated performance (𝐴𝑖𝑡−𝑛𝛾1 + 𝑋𝑖𝑡𝛾2 + 𝑍𝑠𝑡𝛾3) and actual performance (𝐴𝑖𝑠𝑡) of each student that is generated in the first stage, 𝜑𝑖𝑠𝑡, is regressed on a set of school indicators in the second stage: 𝜑𝑖𝑠𝑡 = 𝜇𝑠 +𝜔𝑖𝑠𝑡 (3)

State Charter Schools Performance Evaluation, 2016/17
232
The estimated effect for each school, 𝜇𝑠, is the weighted average difference between actual and predicted scores from the first stage, where the weights are the number of students in each school. Because the first stage nets out the impact of school environment, the school value-added estimates generated in the second stage represent the performance of a school relative to other schools with similar-looking student bodies.
At the request of GOSA, a comparison of the estimates from the two-step and one-step value-added models was conducted using data from the 2014/15 school year. After examining the impact analysis comparing the two methods, GOSA recommended and SCSC approved the use of the two-step approach with the inclusion of three school-level percentage variables in the first stage: the percent of Limited English Proficiency (LEP) students, Students with Disabilities (SWD), and economically disadvantaged (ED) students. For ED, the decision was made to use school-level direct certification instead of aggregating data from individual-level free/reduced-price lunch (FRL) status because of the recent expansion of the Community Eligibility Provision (CEP) of the National School Lunch Program, which allowed many schools to report 100 percent FRL even if their actual FRL percentage is well below that percentage. Direct certification includes students who are members of households receiving assistance under the Supplemental Nutrition Assistance Program (SNAP), the Temporary Assistance for Needy Families (TANF) program, or who are identified as foster, migrant, or homeless. While direct certification identifies fewer economically disadvantaged students than free/reduced-price lunch because the poverty thresholds are lower, it compares all schools equally regardless of CEP participation. There was also discussion about whether the model should exclude individual-level FRL due to the same data limitations. Individual-level direct certification is not available due to limits in current data sharing agreements with the Department of Human Services. Thus, the decision was made to keep individual-level FRL in the model so that there would still be a control for individual-level student poverty. In future years, if individual-level direct certification becomes available, it will replace individual-level FRL in the model.
Another concern that arose was the increasing incidence of students taking end-of-course (EOC) exams while in middle school. In 2015/16, a substantial number of middle school students took the Coordinate Algebra and Physical Science EOC. Overall, 27.3 percent of Physical Science exam takers and 10.1 percent of Coordinate Algebra exam takers were in middle grades.8 According to the Georgia Department of Education (GaDOE) website, middle school students taking EOC tests are exempted from taking end-of-grade (EOG) exams in math and science, “If enrolled in a mathematics and/or science EOC course, these middle school students will not take the corresponding content area end-of-grade (EOG) measure.” (http://www.gadoe.org/ Curriculum-Instruction-and-Assessment/Assessment/Pages/Georgia-Milestones-Assessment-System.aspx). The incidence of EOC test-taking and the GaDOE policy on exemptions from EOG exams creates potential biases at both the middle and high school level. If higher achieving students are more likely to take EOC exams in middle school, this would create a downward bias in the EOG testing pool in middle grades for math and science. Similarly, it would create a downward bias in the testing pool for EOC exams at the high school level.
To address these concerns, a control for the percentage of middle school students in each school taking any math EOC test was added to the first stage of the two-step VAM when
8 The only other subject with non-trivial EOC exam taking in middle school is Ninth Grade Literature, with roughly 3 percent of students taking the exam in grades 7 or 8. However, there is no policy in place to exempt students who take the Ninth Grade Literature exam in middle school from taking end-of-grade exams.

State Charter Schools Performance Evaluation, 2016/17
233
estimating school effects for middle school math EOG scores. For each of the EOC exams at the high school level, the value-added model included a control for the percentage of students in the high school who ever took a relevant EOC while they were in middle school. For the purpose of constructing the EOC-in-middle-school variable, the high school for each student was determined by the school they attended the longest in the given academic year. The “relevant” exams are the same exam for all subjects except math, where the relevant exam is any math EOC due to changes in the math EOCs over the past few years.
In addition to the inclusion of school-level controls, GOSA received suggestions to expand the set of individual-level student characteristics to better account for differences in performance that may arise in schools serving atypical student populations. After exploring the feasibility of various student-level measures, GOSA recommended and SCSC approved the inclusion of two new individual-level student controls in the first stage of the two-step model. One is an indicator for late enrollees, which are students whose first public school enrollment date in a school year is at least two weeks after the starting date for their school of longest enrollment. The other is an indicator for students who withdrew from school in the past under certain circumstances, i.e., who withdrew under one of the following exit codes: expelled, financial hardship/job, incarcerated, removed for lack of attendance, serious illness, pregnancy, court/legal, transferred to Department of Juvenile Justice, or Unsafe School Choice Option.9
The other significant difference from years before 2015/16 was a change in the way in which students were assigned to particular schools when estimating the value-added model. Prior to 2015/16, enrollment records were employed to determine the school of longest enrollment for each student and, then if the length of enrollment at that school met the full-academic-year (FAY) standard for Georgia’s College and Career Readiness Performance Index (CCRPI), the student was assigned to that school for the purpose of calculating school value-added. In a relatively small number of cases, these assignments were not the same as the assignments that resulted from GaDOE’s internal calculations for CCRPI. To avoid any inconsistencies, the school assignments, as determined by GaDOE in its student growth percentile calculations, were used to assign students for the purposes of calculating school value-added. It should be noted that these school assignments are course-specific at the high school level; in rare circumstances, a student could be assigned to one school for a particular EOC exam and be assigned to another school for a different EOC exam.
Given these substantial changes to the value-added methodology for 2015/16, revised estimates for years 2014/15 and 2013/14 were produced using the new methodology and included in the 2015/16 report. In this year’s report we continue to use the same two-step method instituted in 2015/16. For the year-to-year comparisons in this year’s report, we reproduce the estimates provided in the 2015/16 report for years 2014/15 and 2015/16. Thus, the current-year results and the two years of prior estimates are all derived from the same two-step value-added modeling approach.10
9 The analysis dataset includes enrollment information for 2010/11 and later school years. Therefore, in 2016/17 and 2015/16 the measure of prior withdrawals for specified reasons covers the five previous school years. For 2014/15 only four prior years are included. 10 There are some minor differences in the model specifications employed in 2014/15 – 2016/17 due to data availability issues. Official subject-specific FAY designations are only available for 2015/16 and later; for 2014/15 enrollment is calculated for each school attended and if enrollment at the school attended the longest exceeds the 65% FAY standard, a student is assigned to that school for the purpose of
State Charter Schools Performance Evaluation, 2016/17
234
Three versions of the value-added model were estimated. The first employed all available student characteristics in the vector X. Estimates from this model are presented in the main section of the report. The second removed indicators for student racial/ethnicity categories. The third eliminated the X vector entirely and only included the vector of prior test scores. Parameter estimates from each of the three value-added model specifications are provided in the following section.
There are two things worth noting in the value-added model estimates. First, virtually all of the coefficients on the demographic characteristics have the expected sign. Second, the majority of the coefficients on the demographic variables are statistically significant, indicating they have a non-zero impact on current test scores, even after controlling for prior test scores.
calculating school value-added. As noted above, for the 2016/17 school year data on foster care were delayed so the school-level direct certification percentage used in the 2016/17 value-added models excludes students in foster care who do not meet any of the other criteria for direct certification.

State Charter Schools Performance Evaluation, 2016/17
235
B. Value-Added Model Estimates
Elementary All-Subjects Value-Added Estimates
(1) (2) (3)
All Controls No Race/Ethnicity
Lagged Scores Only
Lagged ELA Score 0.3631*** 0.3639*** 0.4218***
(0.0014) (0.0014) (0.0013)
Lagged Math Score 0.4144*** 0.4213*** 0.4740***
(0.0014) (0.0014) (0.0013)
Grade 4 0.0080*** 0.0075***
(0.0017) (0.0017)
Free/Reduced-Price Lunch
-0.0566*** -0.0671***
(0.0023) (0.0023)
Female 0.0154*** 0.0153***
(0.0017) (0.0017)
Foreign Born 0.0497*** 0.0668***
(0.0060) (0.0058)
Black -0.0576***
(0.0022)
Hispanic -0.0146***
(0.0035)
Asian 0.0923***
(0.0048)
American Indian 0.0315
(0.0194)
Multi-Racial -0.0120**
(0.0046)
ESOL Enrolled -0.0806*** -0.0770***
(0.0046) (0.0045)
Gifted 0.2231*** 0.2261***
(0.0028) (0.0028)
Prim. Lang. Not English 0.0424*** 0.0627***
(0.0044) (0.0040)
Orthopedic Impairment
-0.1561*** -0.1548***
(0.0390) (0.0391)
Speech-Language Imp. -0.0192*** -0.0165**
(0.0058) (0.0058)
Deaf -0.2021*** -0.1997***
(0.0269) (0.0270)
Visual Impairment -0.0863* -0.0837*
(0.0399) (0.0400)
Emotional/Behav. Dis. -0.1718*** -0.1670***
(0.0104) (0.0104)
Specific Learning Dis. -0.1687*** -0.1662***
(0.0037) (0.0037)
Autism -0.2004*** -0.1948***
(0.0089) (0.0089)
Traumatic Brain Injury -0.1973** -0.1883**

State Charter Schools Performance Evaluation, 2016/17
236
(0.0698) (0.0700)
Significant Dev. Delay -0.1946*** -0.1923***
(0.0418) (0.0419)
Other Health Imp. -0.1801*** -0.1742***
(0.0055) (0.0055)
Mild Intellectual Dis. -0.2985*** -0.2955***
(0.0131) (0.0132)
Mod. Intellectual Dis. -0.2285* -0.2195*
(0.0959) (0.0962)
Sev. Intellectual Dis. -0.7507 -0.7510
(0.4068) (0.4078)
Prof. Intellectual Dis. 0.4846 0.5329
(0.4069) (0.4079)
Num. Schools Attended -0.0218*** -0.0208***
(0.0049) (0.0049)
Changed Schools -0.0178*** -0.0214***
(0.0025) (0.0025)
Diff. from Modal Age -0.0038*** -0.0036***
(0.0002) (0.0002)
Lagged Num. Disc. Inc. -0.0068*** -0.0085***
(0.0010) (0.0010)
Lagged Pct. Present 0.0015*** 0.0006*
(0.0003) (0.0003)
Late Entry -0.0430** -0.0450**
(0.0140) (0.0140)
Prior Negative Exit -0.0113 -0.0144
(0.0151) (0.0152)
School Pct. Direct Cert. -0.0019*** -0.0023***
(0.0001) (0.0001)
School Pct. LEP 0.0005*** 0.0005***
(0.0001) (0.0001)
School Pct. SWD 0.0018*** 0.0026***
(0.0002) (0.0002)
Constant -0.0591* 0.0182 0.0013
(0.0266) (0.0265) (0.0009)
R-Squared 0.8118 0.8109 0.7987
N 242861 242861 243781
Standard errors in parentheses * p < 0.05, ** p < 0.01, *** p < 0.001

State Charter Schools Performance Evaluation, 2016/17
237
Elementary English Language Arts Value-Added Estimates
(1) (2) (3)
All Controls No Race/Ethnicity
Lagged Scores Only
Lagged ELA Score 0.5623*** 0.5630*** 0.6412***
(0.0018) (0.0018) (0.0017)
Lagged Math Score 0.2123*** 0.2158*** 0.2545***
(0.0018) (0.0017) (0.0017)
Grade 4 0.0071*** 0.0066**
(0.0021) (0.0021)
Free/Reduced- Price Lunch
-0.0575*** -0.0634***
(0.0029) (0.0029)
Female 0.0962*** 0.0960***
(0.0022) (0.0022)
Foreign Born 0.0437*** 0.0429***
(0.0078) (0.0076)
Black -0.0395***
(0.0028)
Hispanic -0.0052
(0.0044)
Asian 0.0184**
(0.0060)
American Indian 0.0246
(0.0244)
Multi-Racial 0.0011
(0.0057)
ESOL Enrolled -0.0998*** -0.0931***
(0.0058) (0.0057)
Gifted 0.2040*** 0.2051***
(0.0035) (0.0035)
Prim. Lang. Not English 0.0282*** 0.0376***
(0.0056) (0.0051)
Orthopedic Impairment
-0.1721*** -0.1714***
(0.0490) (0.0490)
Speech-Language Imp. -0.0431*** -0.0414***
(0.0073) (0.0073)
Deaf -0.2556*** -0.2543***
(0.0341) (0.0342)
Visual Impairment -0.0385 -0.0378
(0.0502) (0.0502)
Emotional/Behav. Dis. -0.1739*** -0.1710***
(0.0130) (0.0130)
Specific Learning Dis. -0.2032*** -0.2018***
(0.0046) (0.0046)
Autism -0.2364*** -0.2336***
(0.0111) (0.0112)
Traumatic Brain Injury -0.2659** -0.2621**
(0.0873) (0.0874)
Significant Dev. Delay -0.2160*** -0.2143***

State Charter Schools Performance Evaluation, 2016/17
238
(0.0525) (0.0526)
Other Health Imp. -0.2012*** -0.1977***
(0.0069) (0.0069)
Mild Intellectual Dis. -0.4185*** -0.4185***
(0.0165) (0.0165)
Mod. Intellectual Dis. -0.4124*** -0.4074***
(0.1200) (0.1201)
Sev. Intellectual Dis. -0.8355 -0.8325
(0.5090) (0.5092)
Prof. Intellectual Dis. 0.5320 0.5630
(0.5090) (0.5092)
Num. Schools Attended -0.0229*** -0.0234***
(0.0061) (0.0061)
Changed Schools -0.0154*** -0.0177***
(0.0031) (0.0031)
Diff. from Modal Age -0.0033*** -0.0032***
(0.0002) (0.0002)
Lagged Num. Disc. Inc. -0.0093*** -0.0106***
(0.0012) (0.0012)
Lagged Pct. Present -0.0017*** -0.0024***
(0.0003) (0.0003)
Late Entry -0.0336 -0.0359*
(0.0175) (0.0176)
Prior Negative Exit -0.0217 -0.0252
(0.0190) (0.0190)
School Pct. Direct Cert. -0.0025*** -0.0027***
(0.0001) (0.0001)
School Pct. LEP 0.0004*** 0.0004***
(0.0001) (0.0001)
School Pct. SWD 0.0008** 0.0015***
(0.0003) (0.0003)
Constant 0.2524*** 0.3076*** -0.0004
(0.0335) (0.0333) (0.0011)
R-Squared 0.7379 0.7376 0.7239
N 241754 241754 242663
Standard errors in parentheses * p < 0.05, ** p < 0.01, *** p < 0.001
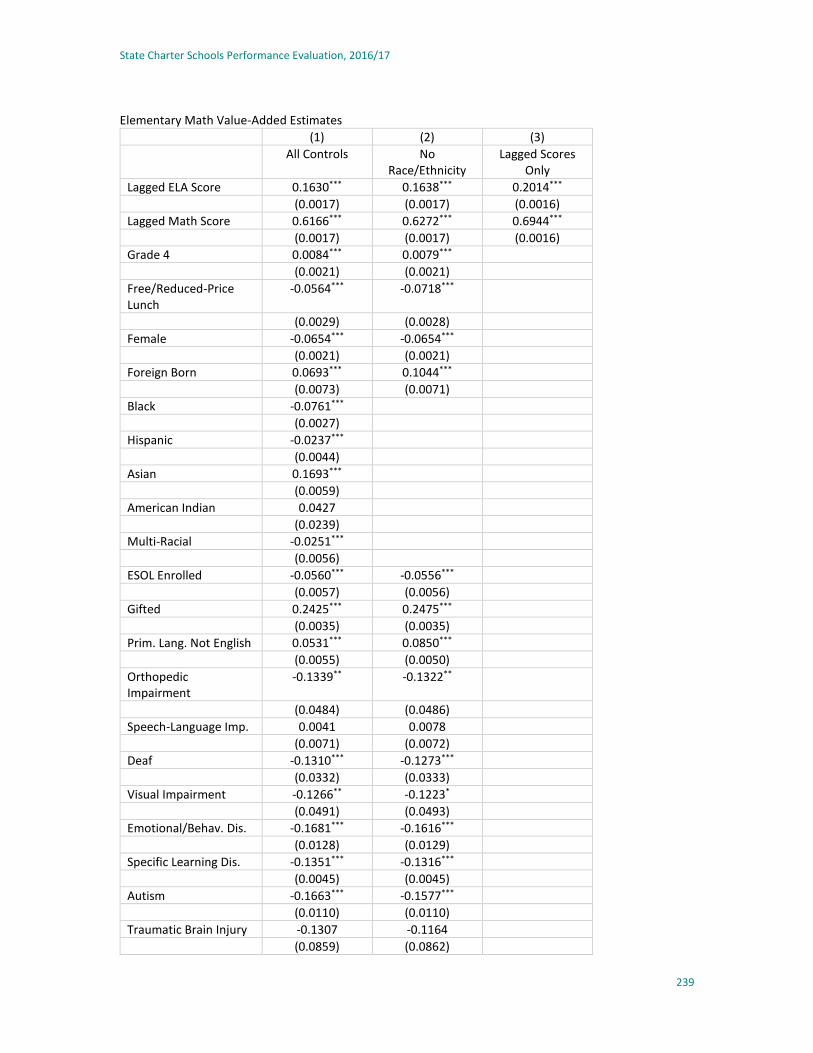
State Charter Schools Performance Evaluation, 2016/17
239
Elementary Math Value-Added Estimates
(1) (2) (3)
All Controls No Race/Ethnicity
Lagged Scores Only
Lagged ELA Score 0.1630*** 0.1638*** 0.2014***
(0.0017) (0.0017) (0.0016)
Lagged Math Score 0.6166*** 0.6272*** 0.6944***
(0.0017) (0.0017) (0.0016)
Grade 4 0.0084*** 0.0079***
(0.0021) (0.0021)
Free/Reduced-Price Lunch
-0.0564*** -0.0718***
(0.0029) (0.0028)
Female -0.0654*** -0.0654***
(0.0021) (0.0021)
Foreign Born 0.0693*** 0.1044***
(0.0073) (0.0071)
Black -0.0761***
(0.0027)
Hispanic -0.0237***
(0.0044)
Asian 0.1693***
(0.0059)
American Indian 0.0427
(0.0239)
Multi-Racial -0.0251***
(0.0056)
ESOL Enrolled -0.0560*** -0.0556***
(0.0057) (0.0056)
Gifted 0.2425*** 0.2475***
(0.0035) (0.0035)
Prim. Lang. Not English 0.0531*** 0.0850***
(0.0055) (0.0050)
Orthopedic Impairment
-0.1339** -0.1322**
(0.0484) (0.0486)
Speech-Language Imp. 0.0041 0.0078
(0.0071) (0.0072)
Deaf -0.1310*** -0.1273***
(0.0332) (0.0333)
Visual Impairment -0.1266** -0.1223*
(0.0491) (0.0493)
Emotional/Behav. Dis. -0.1681*** -0.1616***
(0.0128) (0.0129)
Specific Learning Dis. -0.1351*** -0.1316***
(0.0045) (0.0045)
Autism -0.1663*** -0.1577***
(0.0110) (0.0110)
Traumatic Brain Injury -0.1307 -0.1164
(0.0859) (0.0862)
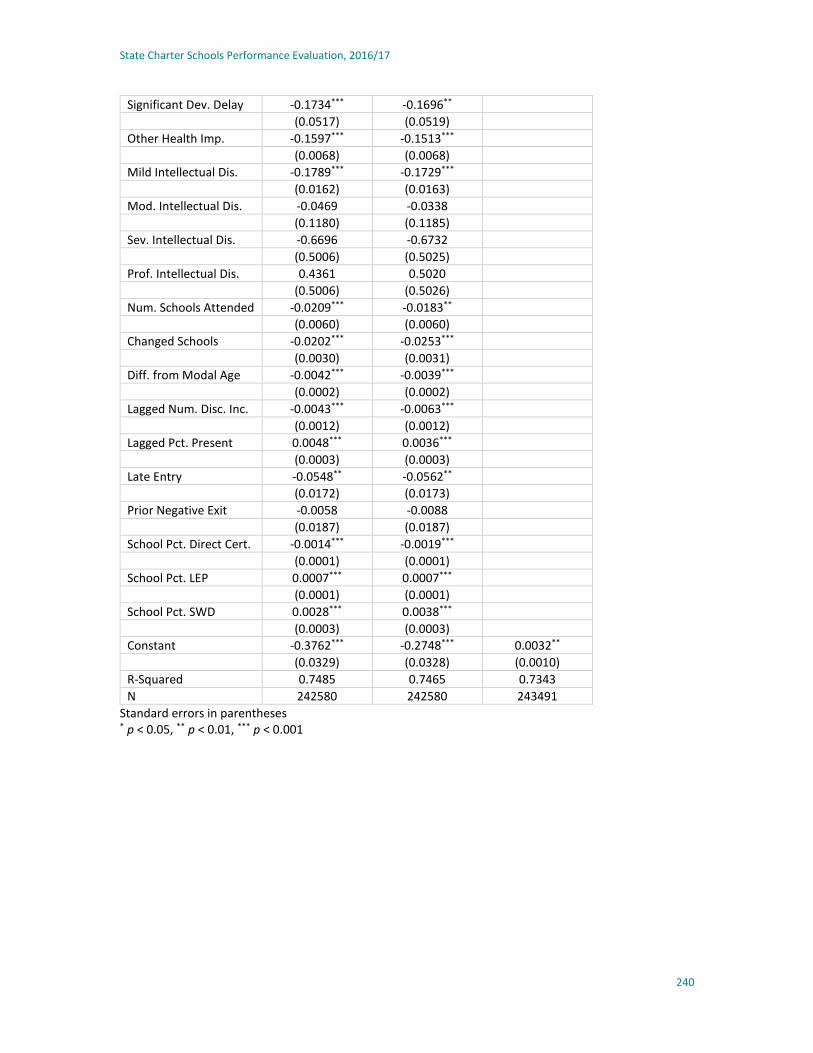
State Charter Schools Performance Evaluation, 2016/17
240
Significant Dev. Delay -0.1734*** -0.1696**
(0.0517) (0.0519)
Other Health Imp. -0.1597*** -0.1513***
(0.0068) (0.0068)
Mild Intellectual Dis. -0.1789*** -0.1729***
(0.0162) (0.0163)
Mod. Intellectual Dis. -0.0469 -0.0338
(0.1180) (0.1185)
Sev. Intellectual Dis. -0.6696 -0.6732
(0.5006) (0.5025)
Prof. Intellectual Dis. 0.4361 0.5020
(0.5006) (0.5026)
Num. Schools Attended -0.0209*** -0.0183**
(0.0060) (0.0060)
Changed Schools -0.0202*** -0.0253***
(0.0030) (0.0031)
Diff. from Modal Age -0.0042*** -0.0039***
(0.0002) (0.0002)
Lagged Num. Disc. Inc. -0.0043*** -0.0063***
(0.0012) (0.0012)
Lagged Pct. Present 0.0048*** 0.0036***
(0.0003) (0.0003)
Late Entry -0.0548** -0.0562**
(0.0172) (0.0173)
Prior Negative Exit -0.0058 -0.0088
(0.0187) (0.0187)
School Pct. Direct Cert. -0.0014*** -0.0019***
(0.0001) (0.0001)
School Pct. LEP 0.0007*** 0.0007***
(0.0001) (0.0001)
School Pct. SWD 0.0028*** 0.0038***
(0.0003) (0.0003)
Constant -0.3762*** -0.2748*** 0.0032**
(0.0329) (0.0328) (0.0010)
R-Squared 0.7485 0.7465 0.7343
N 242580 242580 243491
Standard errors in parentheses * p < 0.05, ** p < 0.01, *** p < 0.001

State Charter Schools Performance Evaluation, 2016/17
241
Middle School All-Subjects Value-Added Estimates
(1) (2) (3)
All Controls No Race/Ethnicity
Lagged Scores Only
Lagged ELA Score 0.3821*** 0.3825*** 0.4424***
(0.0012) (0.0012) (0.0011)
Lagged Math Score 0.3978*** 0.4056*** 0.4611***
(0.0012) (0.0012) (0.0011)
Grade 7 -0.0123*** -0.0137***
(0.0026) (0.0026)
Grade 8 0.0572*** 0.0553***
(0.0027) (0.0027)
Free/Reduced-Price Lunch
-0.0452*** -0.0560***
(0.0019) (0.0018)
Female 0.0407*** 0.0399***
(0.0015) (0.0015)
Foreign Born 0.0395*** 0.0480***
(0.0045) (0.0044)
Black -0.0598***
(0.0019)
Hispanic -0.0247***
(0.0029)
Asian 0.0631***
(0.0039)
American Indian 0.0159
(0.0164)
Multi-Racial -0.0160***
(0.0040)
ESOL Enrolled -0.0739*** -0.0714***
(0.0042) (0.0041)
Gifted 0.2061*** 0.2079***
(0.0023) (0.0023)
Prim. Lang. Not English 0.0058 0.0206***
(0.0032) (0.0026)
Orthopedic Impairment
-0.1079** -0.1001*
(0.0397) (0.0398)
Speech-Language Imp. -0.0254** -0.0241**
(0.0081) (0.0081)
Deaf -0.1390*** -0.1406***
(0.0230) (0.0231)
Visual Impairment -0.0262 -0.0219
(0.0328) (0.0328)
Emotional/Behav. Dis. -0.1269*** -0.1206***
(0.0083) (0.0083)
Specific Learning Dis. -0.1383*** -0.1357***
(0.0031) (0.0031)
Deaf and Blind 0.1043 0.1386
(0.4145) (0.4154)
Autism -0.0925*** -0.0852***
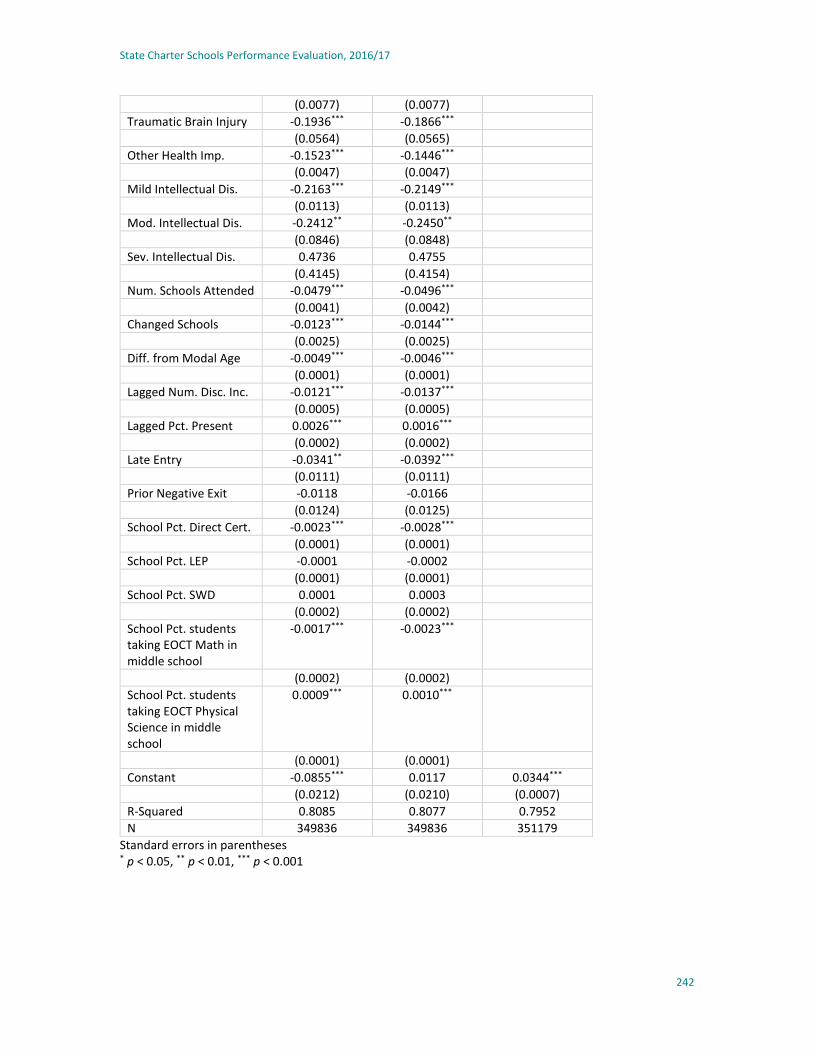
State Charter Schools Performance Evaluation, 2016/17
242
(0.0077) (0.0077)
Traumatic Brain Injury -0.1936*** -0.1866***
(0.0564) (0.0565)
Other Health Imp. -0.1523*** -0.1446***
(0.0047) (0.0047)
Mild Intellectual Dis. -0.2163*** -0.2149***
(0.0113) (0.0113)
Mod. Intellectual Dis. -0.2412** -0.2450**
(0.0846) (0.0848)
Sev. Intellectual Dis. 0.4736 0.4755
(0.4145) (0.4154)
Num. Schools Attended -0.0479*** -0.0496***
(0.0041) (0.0042)
Changed Schools -0.0123*** -0.0144***
(0.0025) (0.0025)
Diff. from Modal Age -0.0049*** -0.0046***
(0.0001) (0.0001)
Lagged Num. Disc. Inc. -0.0121*** -0.0137***
(0.0005) (0.0005)
Lagged Pct. Present 0.0026*** 0.0016***
(0.0002) (0.0002)
Late Entry -0.0341** -0.0392***
(0.0111) (0.0111)
Prior Negative Exit -0.0118 -0.0166
(0.0124) (0.0125)
School Pct. Direct Cert. -0.0023*** -0.0028***
(0.0001) (0.0001)
School Pct. LEP -0.0001 -0.0002
(0.0001) (0.0001)
School Pct. SWD 0.0001 0.0003
(0.0002) (0.0002)
School Pct. students taking EOCT Math in middle school
-0.0017*** -0.0023***
(0.0002) (0.0002)
School Pct. students taking EOCT Physical Science in middle school
0.0009*** 0.0010***
(0.0001) (0.0001)
Constant -0.0855*** 0.0117 0.0344***
(0.0212) (0.0210) (0.0007)
R-Squared 0.8085 0.8077 0.7952
N 349836 349836 351179
Standard errors in parentheses * p < 0.05, ** p < 0.01, *** p < 0.001

State Charter Schools Performance Evaluation, 2016/17
243
Middle School English Language Arts Value-Added Estimates
(1) (2) (3)
All Controls No Race/Ethnicity
Lagged Scores Only
Lagged ELA Score 0.5592*** 0.5594*** 0.6382***
(0.0015) (0.0015) (0.0014)
Lagged Math Score 0.2162*** 0.2200*** 0.2616***
(0.0015) (0.0014) (0.0014)
Grade 6 0.0289*** 0.0300***
(0.0033) (0.0033)
Grade 7 0.0118*** 0.0120***
(0.0021) (0.0021)
Free/Reduced-Price Lunch
-0.0505*** -0.0548***
(0.0023) (0.0022)
Female 0.1184*** 0.1181***
(0.0018) (0.0018)
Foreign Born 0.0494*** 0.0533***
(0.0055) (0.0054)
Black -0.0262***
(0.0022)
Hispanic -0.0054
(0.0035)
Asian 0.0377***
(0.0047)
American Indian 0.0283
(0.0198)
Multi-Racial 0.0135**
(0.0048)
ESOL Enrolled -0.1108*** -0.1091***
(0.0051) (0.0051)
Gifted 0.1989*** 0.1997***
(0.0028) (0.0028)
Prim. Lang. Not English -0.0129*** -0.0032
(0.0038) (0.0031)
Orthopedic Impairment
-0.1264** -0.1230*
(0.0480) (0.0480)
Speech-Language Imp. -0.0481*** -0.0474***
(0.0097) (0.0097)
Deaf -0.2483*** -0.2491***
(0.0278) (0.0278)
Visual Impairment -0.0054 -0.0040
(0.0397) (0.0397)
Emotional/Behav. Dis. -0.1445*** -0.1415***
(0.0100) (0.0100)
Specific Learning Dis. -0.1747*** -0.1738***
(0.0037) (0.0037)
Deaf and Blind 0.3269 0.3410
(0.4987) (0.4989)
Autism -0.1309*** -0.1278***
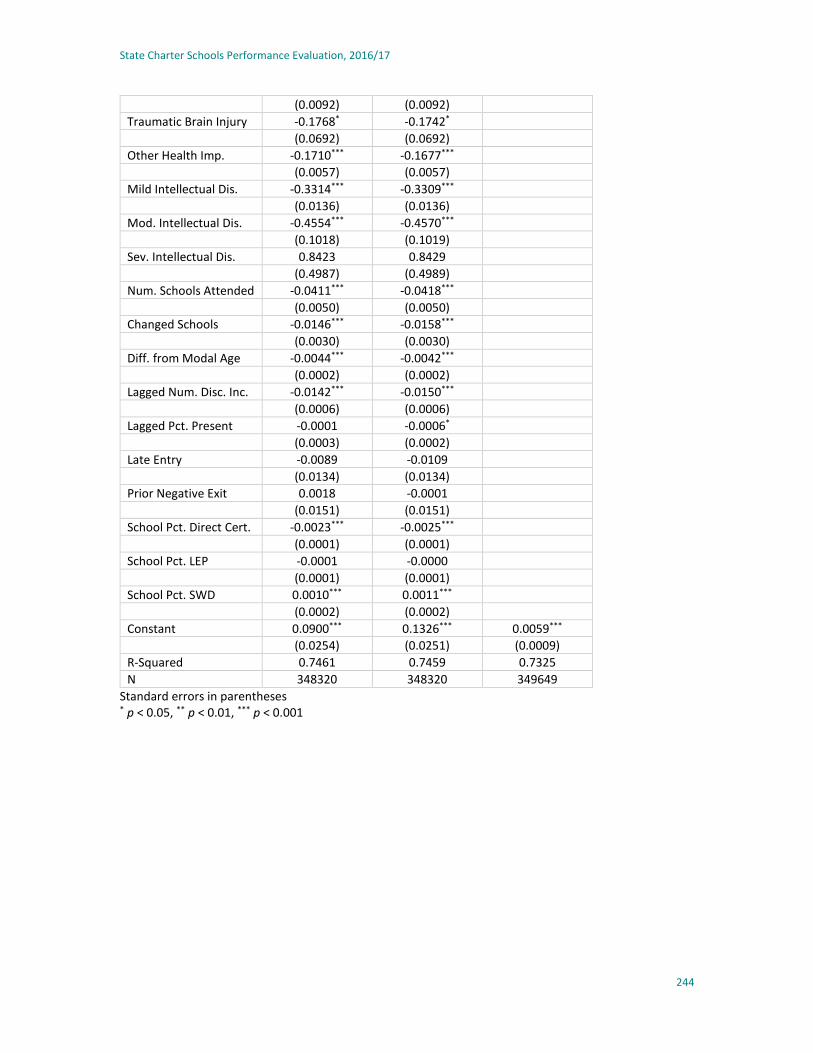
State Charter Schools Performance Evaluation, 2016/17
244
(0.0092) (0.0092)
Traumatic Brain Injury -0.1768* -0.1742*
(0.0692) (0.0692)
Other Health Imp. -0.1710*** -0.1677***
(0.0057) (0.0057)
Mild Intellectual Dis. -0.3314*** -0.3309***
(0.0136) (0.0136)
Mod. Intellectual Dis. -0.4554*** -0.4570***
(0.1018) (0.1019)
Sev. Intellectual Dis. 0.8423 0.8429
(0.4987) (0.4989)
Num. Schools Attended -0.0411*** -0.0418***
(0.0050) (0.0050)
Changed Schools -0.0146*** -0.0158***
(0.0030) (0.0030)
Diff. from Modal Age -0.0044*** -0.0042***
(0.0002) (0.0002)
Lagged Num. Disc. Inc. -0.0142*** -0.0150***
(0.0006) (0.0006)
Lagged Pct. Present -0.0001 -0.0006*
(0.0003) (0.0002)
Late Entry -0.0089 -0.0109
(0.0134) (0.0134)
Prior Negative Exit 0.0018 -0.0001
(0.0151) (0.0151)
School Pct. Direct Cert. -0.0023*** -0.0025***
(0.0001) (0.0001)
School Pct. LEP -0.0001 -0.0000
(0.0001) (0.0001)
School Pct. SWD 0.0010*** 0.0011***
(0.0002) (0.0002)
Constant 0.0900*** 0.1326*** 0.0059***
(0.0254) (0.0251) (0.0009)
R-Squared 0.7461 0.7459 0.7325
N 348320 348320 349649
Standard errors in parentheses * p < 0.05, ** p < 0.01, *** p < 0.001

State Charter Schools Performance Evaluation, 2016/17
245
Middle School Math Value-Added Estimates
(1) (2) (3)
All Controls No Race/Ethnicity
Lagged Scores Only
Lagged ELA Score 0.1789*** 0.1793*** 0.2179***
(0.0015) (0.0015) (0.0015)
Lagged Math Score 0.6284*** 0.6419*** 0.7046***
(0.0016) (0.0015) (0.0015)
Grade 6 -0.2011*** -0.1979***
(0.0034) (0.0034)
Grade 7 -0.2158*** -0.2149***
(0.0022) (0.0022)
Free/Reduced-Price Lunch
-0.0430*** -0.0611***
(0.0024) (0.0023)
Female -0.0534*** -0.0546***
(0.0018) (0.0018)
Foreign Born 0.0449*** 0.0662***
(0.0057) (0.0056)
Black -0.0940***
(0.0024)
Hispanic -0.0447***
(0.0036)
Asian 0.1313***
(0.0052)
American Indian 0.0108
(0.0207)
Multi-Racial -0.0451***
(0.0051)
ESOL Enrolled -0.0249*** -0.0219***
(0.0052) (0.0052)
Gifted 0.2453*** 0.2483***
(0.0030) (0.0030)
Prim. Lang. Not English 0.0328*** 0.0548***
(0.0041) (0.0034)
Orthopedic Impairment
-0.0999* -0.0863
(0.0502) (0.0504)
Speech-Language Imp. -0.0008 0.0018
(0.0100) (0.0100)
Deaf -0.0382 -0.0410
(0.0281) (0.0283)
Visual Impairment -0.0342 -0.0261
(0.0413) (0.0415)
Emotional/Behav. Dis. -0.1037*** -0.0935***
(0.0102) (0.0102)
Specific Learning Dis. -0.1002*** -0.0960***
(0.0038) (0.0038)
Deaf and Blind -0.1193 -0.0644
(0.5044) (0.5064)
Autism -0.0552*** -0.0428***
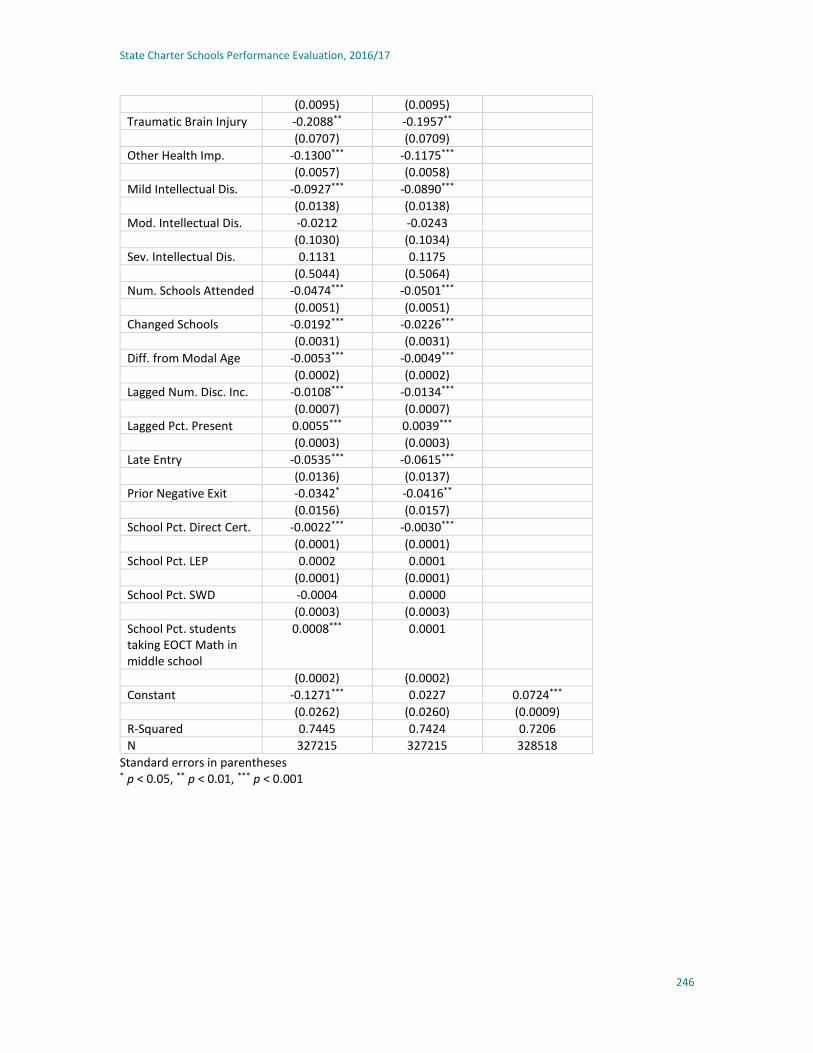
State Charter Schools Performance Evaluation, 2016/17
246
(0.0095) (0.0095)
Traumatic Brain Injury -0.2088** -0.1957**
(0.0707) (0.0709)
Other Health Imp. -0.1300*** -0.1175***
(0.0057) (0.0058)
Mild Intellectual Dis. -0.0927*** -0.0890***
(0.0138) (0.0138)
Mod. Intellectual Dis. -0.0212 -0.0243
(0.1030) (0.1034)
Sev. Intellectual Dis. 0.1131 0.1175
(0.5044) (0.5064)
Num. Schools Attended -0.0474*** -0.0501***
(0.0051) (0.0051)
Changed Schools -0.0192*** -0.0226***
(0.0031) (0.0031)
Diff. from Modal Age -0.0053*** -0.0049***
(0.0002) (0.0002)
Lagged Num. Disc. Inc. -0.0108*** -0.0134***
(0.0007) (0.0007)
Lagged Pct. Present 0.0055*** 0.0039***
(0.0003) (0.0003)
Late Entry -0.0535*** -0.0615***
(0.0136) (0.0137)
Prior Negative Exit -0.0342* -0.0416**
(0.0156) (0.0157)
School Pct. Direct Cert. -0.0022*** -0.0030***
(0.0001) (0.0001)
School Pct. LEP 0.0002 0.0001
(0.0001) (0.0001)
School Pct. SWD -0.0004 0.0000
(0.0003) (0.0003)
School Pct. students taking EOCT Math in middle school
0.0008*** 0.0001
(0.0002) (0.0002)
Constant -0.1271*** 0.0227 0.0724***
(0.0262) (0.0260) (0.0009)
R-Squared 0.7445 0.7424 0.7206
N 327215 327215 328518
Standard errors in parentheses * p < 0.05, ** p < 0.01, *** p < 0.001

State Charter Schools Performance Evaluation, 2016/17
247
High School 9th Grade Literature Value-Added Estimates
(1) (2) (3)
All Controls No Race/Ethnicity
Lagged Scores Only
Grade 8 Math Score 0.0318*** 0.0325*** 0.0642***
(0.0091) (0.0091) (0.0093)
Grade 8 ELA Score 0.4064*** 0.4066*** 0.5020***
(0.0092) (0.0092) (0.0094)
Grade 8 Reading Score 0.1485*** 0.1488*** 0.1869***
(0.0348) (0.0348) (0.0357)
Grade 8 Science Score 0.0334*** 0.0335*** 0.0083
(0.0092) (0.0092) (0.0095)
Grade 8 Soc. Stud. Score
0.1249*** 0.1249*** 0.1149***
(0.0091) (0.0091) (0.0094)
Free/Reduced-Price Lunch
-0.0707*** -0.0712***
(0.0038) (0.0037)
Female 0.1567*** 0.1566***
(0.0031) (0.0031)
Foreign Born 0.0208* 0.0253**
(0.0092) (0.0090)
Black -0.0020
(0.0039)
Hispanic 0.0060
(0.0061)
Asian 0.0505***
(0.0085)
American Indian 0.0300
(0.0329)
Multi-Racial 0.0062
(0.0086)
ESOL Enrolled -0.1330*** -0.1333***
(0.0103) (0.0102)
Gifted 0.1470*** 0.1486***
(0.0050) (0.0049)
Prim. Lang. Not English 0.0104 0.0205***
(0.0069) (0.0056)
Orthopedic Impairment
-0.0980 -0.0976
(0.0815) (0.0815)
Speech-Language Imp. -0.1050*** -0.1046***
(0.0261) (0.0261)
Deaf -0.2492*** -0.2486***
(0.0482) (0.0482)
Visual Impairment -0.1286 -0.1270
(0.0733) (0.0733)
Emotional/Behav. Dis. -0.2132*** -0.2123***
(0.0162) (0.0162)
Specific Learning Dis. -0.2197*** -0.2196***
(0.0065) (0.0065)

State Charter Schools Performance Evaluation, 2016/17
248
Autism -0.1999*** -0.1993***
(0.0169) (0.0169)
Traumatic Brain Injury -0.3912*** -0.3916***
(0.1005) (0.1005)
Other Health Imp. -0.2347*** -0.2343***
(0.0101) (0.0101)
Mild Intellectual Dis. -0.4836*** -0.4827***
(0.0241) (0.0241)
Mod. Intellectual Dis. -0.3923 -0.3936
(0.2512) (0.2512)
Num. Schools Attended -0.0505*** -0.0504***
(0.0070) (0.0070)
Changed Schools -0.0067 -0.0070
(0.0062) (0.0062)
Diff. from Modal Age -0.0059*** -0.0059***
(0.0003) (0.0003)
Lagged Num. Disc. Inc. -0.0192*** -0.0192***
(0.0010) (0.0010)
Lagged Pct. Present 0.0025*** 0.0025***
(0.0004) (0.0004)
Late Entry -0.0251 -0.0247
(0.0191) (0.0191)
Prior Negative Exit 0.0005 0.0007
(0.0163) (0.0163)
School Pct. Direct Cert. -0.0024*** -0.0025***
(0.0001) (0.0001)
School Pct. LEP -0.0005 -0.0004
(0.0003) (0.0003)
School Pct. SWD -0.0029*** -0.0030***
(0.0005) (0.0005)
School Pct. students taking EOCT 9th Grade Lit. exam in middle school
-0.3259*** -0.3322***
(0.0330) (0.0329)
Constant -0.1007** -0.1005** 0.0142***
(0.0373) (0.0368) (0.0016)
R-Squared 0.7289 0.7288 0.7082
N 116107 116107 116694
Standard errors in parentheses * p < 0.05, ** p < 0.01, *** p < 0.001

State Charter Schools Performance Evaluation, 2016/17
249
High School American Literature Value-Added Estimates
(1) (2) (3)
All Controls No Race/Ethnicity
Lagged Scores Only
Grade 8 Math Score 0.0734*** 0.0762*** 0.1337***
(0.0030) (0.0030) (0.0030)
Grade 8 ELA Score 0.2340*** 0.2337*** 0.2958***
(0.0032) (0.0032) (0.0033)
Grade 8 Reading Score 0.1684*** 0.1684*** 0.1998***
(0.0030) (0.0030) (0.0031)
Grade 8 Science Score 0.1081*** 0.1121*** 0.1133***
(0.0034) (0.0034) (0.0035)
Grade 8 Soc. Stud. Score
0.1576*** 0.1584*** 0.1761***
(0.0031) (0.0031) (0.0032)
Free/Reduced-Price Lunch
-0.0655*** -0.0755***
(0.0042) (0.0041)
Female 0.1203*** 0.1197***
(0.0035) (0.0035)
Foreign Born 0.0678*** 0.0665***
(0.0100) (0.0099)
Black -0.0580***
(0.0044)
Hispanic -0.0185**
(0.0070)
Asian 0.0378***
(0.0097)
American Indian 0.0422
(0.0404)
Multi-Racial -0.0140
(0.0101)
ESOL Enrolled -0.0483*** -0.0403**
(0.0136) (0.0135)
Gifted 0.2129*** 0.2145***
(0.0056) (0.0056)
Prim. Lang. Not English -0.0614*** -0.0468***
(0.0082) (0.0068)
Orthopedic Impairment
-0.1783* -0.1809*
(0.0764) (0.0765)
Speech-Language Imp. -0.0608 -0.0628
(0.0411) (0.0411)
Deaf -0.1997*** -0.1957***
(0.0555) (0.0556)
Visual Impairment -0.1507 -0.1543
(0.0867) (0.0868)
Emotional/Behav. Dis. -0.1607*** -0.1541***
(0.0204) (0.0204)
Specific Learning Dis. -0.2291*** -0.2268***
(0.0082) (0.0082)
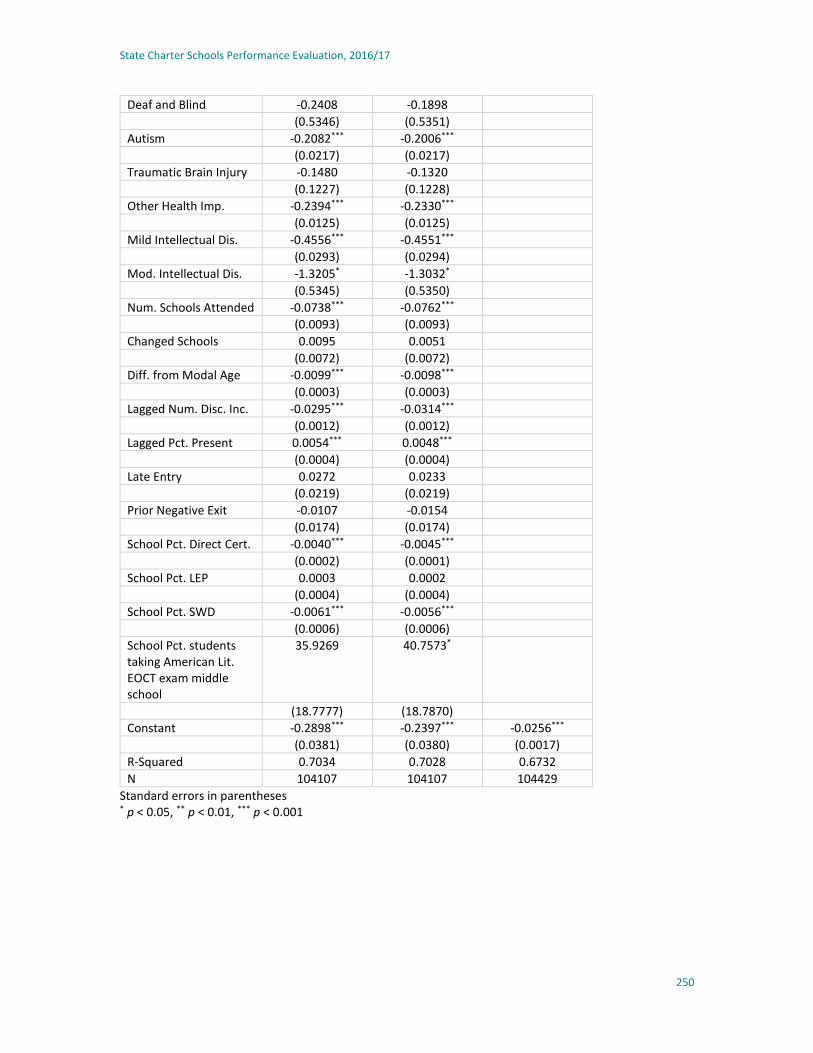
State Charter Schools Performance Evaluation, 2016/17
250
Deaf and Blind -0.2408 -0.1898
(0.5346) (0.5351)
Autism -0.2082*** -0.2006***
(0.0217) (0.0217)
Traumatic Brain Injury -0.1480 -0.1320
(0.1227) (0.1228)
Other Health Imp. -0.2394*** -0.2330***
(0.0125) (0.0125)
Mild Intellectual Dis. -0.4556*** -0.4551***
(0.0293) (0.0294)
Mod. Intellectual Dis. -1.3205* -1.3032*
(0.5345) (0.5350)
Num. Schools Attended -0.0738*** -0.0762***
(0.0093) (0.0093)
Changed Schools 0.0095 0.0051
(0.0072) (0.0072)
Diff. from Modal Age -0.0099*** -0.0098***
(0.0003) (0.0003)
Lagged Num. Disc. Inc. -0.0295*** -0.0314***
(0.0012) (0.0012)
Lagged Pct. Present 0.0054*** 0.0048***
(0.0004) (0.0004)
Late Entry 0.0272 0.0233
(0.0219) (0.0219)
Prior Negative Exit -0.0107 -0.0154
(0.0174) (0.0174)
School Pct. Direct Cert. -0.0040*** -0.0045***
(0.0002) (0.0001)
School Pct. LEP 0.0003 0.0002
(0.0004) (0.0004)
School Pct. SWD -0.0061*** -0.0056***
(0.0006) (0.0006)
School Pct. students taking American Lit. EOCT exam middle school
35.9269 40.7573*
(18.7777) (18.7870)
Constant -0.2898*** -0.2397*** -0.0256***
(0.0381) (0.0380) (0.0017)
R-Squared 0.7034 0.7028 0.6732
N 104107 104107 104429
Standard errors in parentheses * p < 0.05, ** p < 0.01, *** p < 0.001

State Charter Schools Performance Evaluation, 2016/17
251
High School Algebra 1 Value-Added Estimates
(1) (2) (3)
All Controls No Race/Ethnicity
Lagged Scores Only
Grade 8 Math Score 0.4124*** 0.4159*** 0.4614***
(0.0080) (0.0080) (0.0082)
Grade 8 ELA Score 0.0855*** 0.0845*** 0.1345***
(0.0082) (0.0082) (0.0083)
Grade 8 Reading Score 0.0279 0.0296 0.0285
(0.0297) (0.0298) (0.0305)
Grade 8 Science Score 0.1071*** 0.1046*** 0.0954***
(0.0082) (0.0082) (0.0084)
Grade 8 Soc. Stud. Score
0.0492*** 0.0481*** 0.0578***
(0.0081) (0.0081) (0.0083)
Free/Reduced-Price Lunch
-0.0534*** -0.0521***
(0.0043) (0.0043)
Female 0.0535*** 0.0538***
(0.0036) (0.0036)
Foreign Born 0.0809*** 0.1057***
(0.0104) (0.0102)
Black 0.0259***
(0.0045)
Hispanic 0.0169*
(0.0069)
Asian 0.2636***
(0.0114)
American Indian 0.0540
(0.0376)
Multi-Racial -0.0004
(0.0099)
ESOL Enrolled 0.0370*** 0.0330**
(0.0111) (0.0111)
Gifted 0.2289*** 0.2294***
(0.0065) (0.0066)
Prim. Lang. Not English -0.0211** 0.0011
(0.0081) (0.0067)
Orthopedic Impairment
-0.1132 -0.1207
(0.0849) (0.0852)
Speech-Language Imp. 0.0294 0.0342
(0.0289) (0.0290)
Deaf 0.0194 0.0209
(0.0520) (0.0522)
Visual Impairment -0.1139 -0.1055
(0.0801) (0.0804)
Emotional/Behav. Dis. -0.0809*** -0.0813***
(0.0181) (0.0182)
Specific Learning Dis. -0.0864*** -0.0878***
(0.0071) (0.0071)
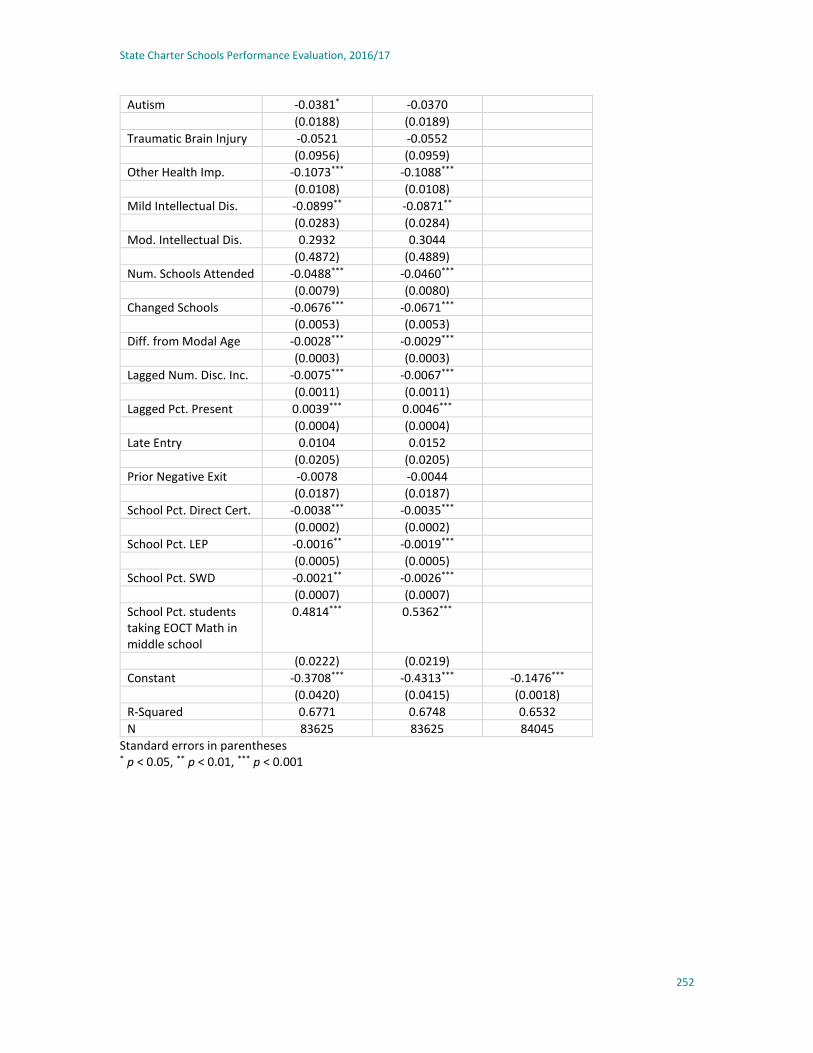
State Charter Schools Performance Evaluation, 2016/17
252
Autism -0.0381* -0.0370
(0.0188) (0.0189)
Traumatic Brain Injury -0.0521 -0.0552
(0.0956) (0.0959)
Other Health Imp. -0.1073*** -0.1088***
(0.0108) (0.0108)
Mild Intellectual Dis. -0.0899** -0.0871**
(0.0283) (0.0284)
Mod. Intellectual Dis. 0.2932 0.3044
(0.4872) (0.4889)
Num. Schools Attended -0.0488*** -0.0460***
(0.0079) (0.0080)
Changed Schools -0.0676*** -0.0671***
(0.0053) (0.0053)
Diff. from Modal Age -0.0028*** -0.0029***
(0.0003) (0.0003)
Lagged Num. Disc. Inc. -0.0075*** -0.0067***
(0.0011) (0.0011)
Lagged Pct. Present 0.0039*** 0.0046***
(0.0004) (0.0004)
Late Entry 0.0104 0.0152
(0.0205) (0.0205)
Prior Negative Exit -0.0078 -0.0044
(0.0187) (0.0187)
School Pct. Direct Cert. -0.0038*** -0.0035***
(0.0002) (0.0002)
School Pct. LEP -0.0016** -0.0019***
(0.0005) (0.0005)
School Pct. SWD -0.0021** -0.0026***
(0.0007) (0.0007)
School Pct. students taking EOCT Math in middle school
0.4814*** 0.5362***
(0.0222) (0.0219)
Constant -0.3708*** -0.4313*** -0.1476***
(0.0420) (0.0415) (0.0018)
R-Squared 0.6771 0.6748 0.6532
N 83625 83625 84045
Standard errors in parentheses * p < 0.05, ** p < 0.01, *** p < 0.001

State Charter Schools Performance Evaluation, 2016/17
253
High School Biology Value-Added Estimates
(1) (2) (3)
All Controls No Race/Ethnicity
Lagged Scores Only
Grade 8 Math Score 0.1257*** 0.1312*** 0.1688***
(0.0039) (0.0039) (0.0039)
Grade 8 ELA Score 0.1672*** 0.1667*** 0.1761***
(0.0041) (0.0041) (0.0040)
Grade 8 Reading Score 0.1126*** 0.1137*** 0.1071***
(0.0102) (0.0102) (0.0104)
Grade 8 Science Score 0.2096*** 0.2137*** 0.2405***
(0.0042) (0.0042) (0.0042)
Grade 8 Soc. Stud. Score
0.1824*** 0.1826*** 0.2112***
(0.0039) (0.0039) (0.0039)
Free/Reduced-Price Lunch
-0.0469*** -0.0611***
(0.0040) (0.0039)
Female -0.1034*** -0.1042***
(0.0033) (0.0033)
Foreign Born 0.0695*** 0.0876***
(0.0094) (0.0092)
Black -0.0648***
(0.0042)
Hispanic -0.0503***
(0.0064)
Asian 0.1184***
(0.0090)
American Indian -0.0098
(0.0346)
Multi-Racial -0.0107
(0.0092)
ESOL Enrolled -0.0025 0.0001
(0.0108) (0.0108)
Gifted 0.2336*** 0.2395***
(0.0051) (0.0051)
Prim. Lang. Not English -0.0379*** -0.0332***
(0.0073) (0.0059)
Orthopedic Impairment
-0.0383 -0.0300
(0.0879) (0.0881)
Speech-Language Imp. -0.0226 -0.0244
(0.0314) (0.0315)
Deaf -0.0015 0.0037
(0.0505) (0.0507)
Visual Impairment -0.0133 -0.0053
(0.0724) (0.0726)
Emotional/Behav. Dis. 0.0162 0.0253
(0.0177) (0.0178)
Specific Learning Dis. -0.0642*** -0.0625***
(0.0071) (0.0072)
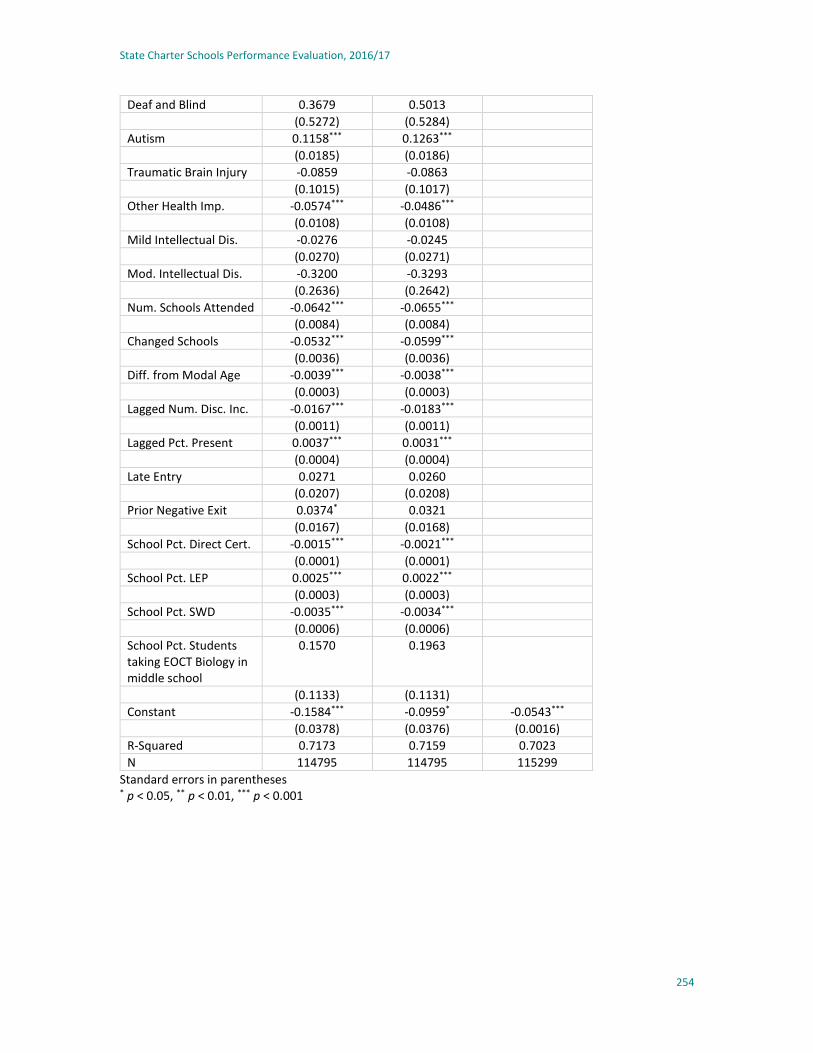
State Charter Schools Performance Evaluation, 2016/17
254
Deaf and Blind 0.3679 0.5013
(0.5272) (0.5284)
Autism 0.1158*** 0.1263***
(0.0185) (0.0186)
Traumatic Brain Injury -0.0859 -0.0863
(0.1015) (0.1017)
Other Health Imp. -0.0574*** -0.0486***
(0.0108) (0.0108)
Mild Intellectual Dis. -0.0276 -0.0245
(0.0270) (0.0271)
Mod. Intellectual Dis. -0.3200 -0.3293
(0.2636) (0.2642)
Num. Schools Attended -0.0642*** -0.0655***
(0.0084) (0.0084)
Changed Schools -0.0532*** -0.0599***
(0.0036) (0.0036)
Diff. from Modal Age -0.0039*** -0.0038***
(0.0003) (0.0003)
Lagged Num. Disc. Inc. -0.0167*** -0.0183***
(0.0011) (0.0011)
Lagged Pct. Present 0.0037*** 0.0031***
(0.0004) (0.0004)
Late Entry 0.0271 0.0260
(0.0207) (0.0208)
Prior Negative Exit 0.0374* 0.0321
(0.0167) (0.0168)
School Pct. Direct Cert. -0.0015*** -0.0021***
(0.0001) (0.0001)
School Pct. LEP 0.0025*** 0.0022***
(0.0003) (0.0003)
School Pct. SWD -0.0035*** -0.0034***
(0.0006) (0.0006)
School Pct. Students taking EOCT Biology in middle school
0.1570 0.1963
(0.1133) (0.1131)
Constant -0.1584*** -0.0959* -0.0543***
(0.0378) (0.0376) (0.0016)
R-Squared 0.7173 0.7159 0.7023
N 114795 114795 115299
Standard errors in parentheses * p < 0.05, ** p < 0.01, *** p < 0.001

State Charter Schools Performance Evaluation, 2016/17
255
High School Economics Value-Added Estimates
(1) (2) (3)
All Controls No Race/Ethnicity
Lagged Scores Only
Grade 8 Math Score 0.1082*** 0.1110*** 0.1553***
(0.0035) (0.0035) (0.0035)
Grade 8 ELA Score 0.0661*** 0.0656*** 0.0696***
(0.0038) (0.0038) (0.0037)
Grade 8 Reading Score 0.1155*** 0.1154*** 0.1207***
(0.0034) (0.0034) (0.0035)
Grade 8 Science Score 0.2076*** 0.2133*** 0.2510***
(0.0041) (0.0041) (0.0041)
Grade 8 Soc. Stud. Score
0.2347*** 0.2370*** 0.2777***
(0.0038) (0.0038) (0.0038)
Free/Reduced-Price Lunch
-0.0604*** -0.0769***
(0.0051) (0.0050)
Female -0.1145*** -0.1153***
(0.0043) (0.0043)
Foreign Born 0.1363*** 0.1440***
(0.0121) (0.0120)
Black -0.0788***
(0.0053)
Hispanic -0.0721***
(0.0087)
Asian 0.0432***
(0.0118)
American Indian 0.0480
(0.0478)
Multi-Racial -0.0331**
(0.0124)
ESOL Enrolled 0.0427* 0.0540**
(0.0206) (0.0206)
Gifted 0.2265*** 0.2295***
(0.0068) (0.0068)
Prim. Lang. Not English -0.0831*** -0.0929***
(0.0103) (0.0085)
Orthopedic Impairment
-0.0974 -0.0953
(0.1084) (0.1085)
Speech-Language Imp. -0.0715 -0.0684
(0.0605) (0.0606)
Deaf -0.0781 -0.0712
(0.0605) (0.0606)
Visual Impairment -0.0778 -0.0810
(0.0898) (0.0900)
Emotional/Behav. Dis. -0.0903*** -0.0776**
(0.0256) (0.0256)
Specific Learning Dis. -0.1316*** -0.1283***
(0.0103) (0.0103)

State Charter Schools Performance Evaluation, 2016/17
256
Deaf and Blind 0.8141 0.8359
(0.6221) (0.6231)
Autism -0.0862** -0.0755**
(0.0266) (0.0266)
Traumatic Brain Injury -0.3128** -0.3036**
(0.1052) (0.1054)
Other Health Imp. -0.1321*** -0.1211***
(0.0152) (0.0153)
Mild Intellectual Dis. -0.1009** -0.0994**
(0.0353) (0.0353)
Mod. Intellectual Dis. 0.0153 0.0078
(0.3593) (0.3598)
Num. Schools Attended -0.1111*** -0.1128***
(0.0134) (0.0134)
Changed Schools -0.1686*** -0.1732***
(0.0086) (0.0086)
Diff. from Modal Age -0.0065*** -0.0063***
(0.0003) (0.0003)
Lagged Num. Disc. Inc. -0.0251*** -0.0275***
(0.0017) (0.0017)
Lagged Pct. Present 0.0039*** 0.0033***
(0.0004) (0.0004)
Late Entry 0.0210 0.0200
(0.0276) (0.0276)
Prior Negative Exit 0.0284 0.0215
(0.0213) (0.0214)
School Pct. Direct Cert. -0.0029*** -0.0035***
(0.0002) (0.0002)
School Pct. LEP 0.0017*** 0.0010*
(0.0005) (0.0005)
School Pct. SWD -0.0057*** -0.0054***
(0.0008) (0.0008)
School Pct. Students taking EOCT Economics in middle school
-9.3399*** -9.7946***
(1.1558) (1.1570)
Constant -0.0550 -0.0062 -0.0629***
(0.0433) (0.0432) (0.0021)
R-Squared 0.6115 0.6103 0.5881
N 94479 94479 94788
Standard errors in parentheses * p < 0.05, ** p < 0.01, *** p < 0.001

State Charter Schools Performance Evaluation, 2016/17
257
High School Geometry Value-Added Estimates
(1) (2) (3)
All Controls No Race/Ethnicity
Lagged Scores Only
Grade 8 Math Score 0.4375*** 0.4464*** 0.5408***
(0.0053) (0.0054) (0.0055)
Grade 8 ELA Score 0.0846*** 0.0828*** 0.1270***
(0.0053) (0.0054) (0.0055)
Grade 8 Reading Score 0.0008 0.0004 0.0053
(0.0150) (0.0151) (0.0159)
Grade 8 Science Score 0.1700*** 0.1774*** 0.2045***
(0.0054) (0.0054) (0.0056)
Grade 8 Soc. Stud. Score
-0.0006 0.0005 0.0334***
(0.0051) (0.0051) (0.0054)
Free/Reduced-Price Lunch
-0.0668*** -0.0893***
(0.0048) (0.0047)
Female -0.0734*** -0.0742***
(0.0040) (0.0040)
Foreign Born 0.0608*** 0.0733***
(0.0111) (0.0110)
Black -0.1053***
(0.0050)
Hispanic -0.0679***
(0.0076)
Asian 0.1560***
(0.0102)
American Indian -0.0452
(0.0432)
Multi-Racial -0.0728***
(0.0109)
ESOL Enrolled 0.0287* 0.0296*
(0.0144) (0.0144)
Gifted 0.2995*** 0.3063***
(0.0060) (0.0060)
Prim. Lang. Not English -0.0430*** -0.0177*
(0.0087) (0.0073)
Orthopedic Impairment
-0.2243* -0.2173*
(0.1098) (0.1103)
Speech-Language Imp. -0.0074 -0.0134
(0.0407) (0.0409)
Deaf -0.0658 -0.0618
(0.0606) (0.0609)
Visual Impairment -0.0077 0.0118
(0.0861) (0.0865)
Emotional/Behav. Dis. -0.1556*** -0.1449***
(0.0266) (0.0268)
Specific Learning Dis. -0.1571*** -0.1550***
(0.0099) (0.0099)

State Charter Schools Performance Evaluation, 2016/17
258
Autism -0.1152*** -0.0992***
(0.0246) (0.0247)
Traumatic Brain Injury -0.1553 -0.1495
(0.1388) (0.1395)
Other Health Imp. -0.1586*** -0.1481***
(0.0153) (0.0154)
Mild Intellectual Dis. -0.2647*** -0.2663***
(0.0411) (0.0413)
Mod. Intellectual Dis. -0.5701 -0.4255
(0.3803) (0.3822)
Num. Schools Attended -0.0561*** -0.0621***
(0.0110) (0.0110)
Changed Schools 0.0716*** 0.0741***
(0.0051) (0.0051)
Diff. from Modal Age -0.0059*** -0.0057***
(0.0003) (0.0003)
Lagged Num. Disc. Inc. -0.0187*** -0.0220***
(0.0015) (0.0015)
Lagged Pct. Present 0.0057*** 0.0045***
(0.0005) (0.0005)
Late Entry -0.0176 -0.0265
(0.0307) (0.0308)
Prior Negative Exit -0.0050 -0.0127
(0.0252) (0.0253)
School Pct. Direct Cert. -0.0066*** -0.0075***
(0.0002) (0.0002)
School Pct. LEP -0.0028*** -0.0042***
(0.0005) (0.0005)
School Pct. SWD 0.0008 0.0006
(0.0007) (0.0007)
School Pct. students taking EOCT Math in middle school
0.3452*** 0.3051***
(0.0212) (0.0210)
Constant -0.3664*** -0.2466*** -0.0794***
(0.0523) (0.0519) (0.0020)
R-Squared 0.7048 0.7018 0.6647
N 83255 83255 83463
Standard errors in parentheses * p < 0.05, ** p < 0.01, *** p < 0.001

State Charter Schools Performance Evaluation, 2016/17
259
High School Physical Science Value-Added Estimates
(1) (2) (3)
All Controls No Race/Ethnicity
Lagged Scores Only
Grade 8 Math Score 0.2311*** 0.2387*** 0.2599***
(0.0045) (0.0045) (0.0045)
Grade 8 ELA Score 0.0704*** 0.0683*** 0.0742***
(0.0048) (0.0048) (0.0046)
Grade 8 Reading Score 0.0656*** 0.0663*** 0.0598***
(0.0080) (0.0081) (0.0082)
Grade 8 Science Score 0.2868*** 0.2977*** 0.3167***
(0.0047) (0.0047) (0.0047)
Grade 8 Soc. Stud. Score
0.1259*** 0.1280*** 0.1614***
(0.0046) (0.0046) (0.0046)
Free/Reduced-Price Lunch
-0.0251*** -0.0456***
(0.0053) (0.0053)
Female -0.1193*** -0.1195***
(0.0045) (0.0045)
Foreign Born 0.0496** 0.0607***
(0.0152) (0.0150)
Black -0.1235***
(0.0054)
Hispanic -0.0666***
(0.0097)
Asian 0.1042***
(0.0201)
American Indian -0.0900
(0.0515)
Multi-Racial -0.0572***
(0.0128)
ESOL Enrolled -0.0234 -0.0034
(0.0159) (0.0159)
Gifted 0.2006*** 0.2045***
(0.0097) (0.0097)
Prim. Lang. Not English -0.0386** -0.0358***
(0.0120) (0.0094)
Orthopedic Impairment
-0.0513 -0.0501
(0.1197) (0.1202)
Speech-Language Imp. -0.0390 -0.0432
(0.0379) (0.0381)
Deaf -0.1022 -0.1051
(0.0668) (0.0672)
Visual Impairment -0.1616 -0.1642
(0.1023) (0.1027)
Emotional/Behav. Dis. -0.0660*** -0.0496*
(0.0196) (0.0197)
Specific Learning Dis. -0.1043*** -0.0982***
(0.0088) (0.0089)

State Charter Schools Performance Evaluation, 2016/17
260
Autism 0.0005 0.0150
(0.0253) (0.0254)
Traumatic Brain Injury -0.0458 -0.0201
(0.1065) (0.1070)
Other Health Imp. -0.1138*** -0.0984***
(0.0132) (0.0133)
Mild Intellectual Dis. -0.1383*** -0.1362***
(0.0296) (0.0298)
Num. Schools Attended -0.0650*** -0.0725***
(0.0105) (0.0106)
Changed Schools -0.0960*** -0.0862***
(0.0046) (0.0046)
Diff. from Modal Age -0.0045*** -0.0043***
(0.0003) (0.0003)
Lagged Num. Disc. Inc. -0.0222*** -0.0256***
(0.0013) (0.0013)
Lagged Pct. Present 0.0012** -0.0001
(0.0004) (0.0004)
Late Entry 0.0335 0.0216
(0.0238) (0.0239)
Prior Negative Exit 0.0281 0.0136
(0.0190) (0.0191)
School Pct. Direct Cert. -0.0015*** -0.0027***
(0.0002) (0.0002)
School Pct. LEP 0.0026*** 0.0025***
(0.0005) (0.0005)
School Pct. SWD 0.0021** 0.0029***
(0.0008) (0.0008)
School Pct. Students taking EOCT Physical Science in middle school
0.1460*** 0.1515***
(0.0284) (0.0285)
Constant 0.0912* 0.2068*** -0.0346***
(0.0448) (0.0446) (0.0023)
R-Squared 0.6378 0.6344 0.6163
N 62130 62130 62479
Standard errors in parentheses * p < 0.05, ** p < 0.01, *** p < 0.001

State Charter Schools Performance Evaluation, 2016/17
261
High School U.S. History Value-Added Estimates
(1) (2) (3)
All Controls No Race/Ethnicity
Lagged Scores Only
Grade 8 Math Score 0.0471*** 0.0513*** 0.0989***
(0.0035) (0.0034) (0.0034)
Grade 8 ELA Score 0.0682*** 0.0677*** 0.0556***
(0.0038) (0.0038) (0.0037)
Grade 8 Reading Score 0.0929*** 0.0929*** 0.0860***
(0.0035) (0.0035) (0.0036)
Grade 8 Science Score 0.1351*** 0.1399*** 0.1822***
(0.0040) (0.0040) (0.0040)
Grade 8 Soc. Stud. Score
0.3968*** 0.3974*** 0.4390***
(0.0037) (0.0037) (0.0037)
Free/Reduced-Price Lunch
-0.0508*** -0.0627***
(0.0049) (0.0048)
Female -0.1766*** -0.1775***
(0.0041) (0.0041)
Foreign Born 0.1050*** 0.1051***
(0.0114) (0.0113)
Black -0.0682***
(0.0051)
Hispanic -0.0183*
(0.0082)
Asian 0.0665***
(0.0112)
American Indian -0.0001
(0.0479)
Multi-Racial -0.0474***
(0.0117)
ESOL Enrolled 0.0658*** 0.0747***
(0.0152) (0.0152)
Gifted 0.1687*** 0.1711***
(0.0065) (0.0065)
Prim. Lang. Not English -0.0867*** -0.0640***
(0.0096) (0.0078)
Orthopedic Impairment
-0.1297 -0.1282
(0.0885) (0.0886)
Speech-Language Imp. 0.0464 0.0445
(0.0473) (0.0474)
Deaf 0.0144 0.0196
(0.0654) (0.0654)
Visual Impairment -0.1332 -0.1393
(0.1047) (0.1048)
Emotional/Behav. Dis. 0.0044 0.0114
(0.0230) (0.0230)
Specific Learning Dis. -0.0502*** -0.0476***
(0.0095) (0.0095)

State Charter Schools Performance Evaluation, 2016/17
262
Autism 0.1583*** 0.1673***
(0.0249) (0.0249)
Traumatic Brain Injury -0.2730* -0.2622*
(0.1292) (0.1293)
Other Health Imp. -0.0306* -0.0233
(0.0142) (0.0142)
Mild Intellectual Dis. 0.0152 0.0166
(0.0350) (0.0350)
Mod. Intellectual Dis. -0.3846 -0.3981
(0.6192) (0.6199)
Num. Schools Attended -0.0792*** -0.0814***
(0.0117) (0.0117)
Changed Schools -0.0102 -0.0137
(0.0079) (0.0079)
Diff. from Modal Age -0.0063*** -0.0062***
(0.0003) (0.0003)
Lagged Num. Disc. Inc. -0.0241*** -0.0264***
(0.0014) (0.0014)
Lagged Pct. Present 0.0067*** 0.0061***
(0.0004) (0.0004)
Late Entry 0.0417 0.0424
(0.0254) (0.0254)
Prior Negative Exit 0.0251 0.0196
(0.0198) (0.0198)
School Pct. Direct Cert. -0.0037*** -0.0043***
(0.0002) (0.0002)
School Pct. LEP 0.0015*** 0.0013**
(0.0004) (0.0004)
School Pct. SWD -0.0063*** -0.0060***
(0.0007) (0.0007)
School Pct. Students taking EOCT U.S. History in middle school
-59.1334*** -56.6034***
(16.0713) (16.0873)
Constant -0.2976*** -0.2430*** -0.0348***
(0.0443) (0.0441) (0.0020)
R-Squared 0.6160 0.6151 0.5922
N 102414 102414 102771
Standard errors in parentheses * p < 0.05, ** p < 0.01, *** p < 0.001