the perception of broad-based black economic empowerment
TRANSCRIPT

The perception of broad-based Black economic empowerment (BBBEE) in
Small and Medium enterprises
AP van Niekerk
orcid.org 0000-0002-3637-1810
Mini-dissertation submitted in partial fulfilment of the requirements for the degree Master of Business Administration
at the North-West University
Supervisor: Prof JC Visagie
Graduation ceremony: May 2019
Student number: 20507593

The perception of broad-based Black economic empowerment (BBBEE)
in Small and Medium enterprises
Declaration Regarding Plagiarism
I (full names & surname): Adriaan Petrus van Niekerk
Student number: 20507593
Declare the following:
1. I understand what plagiarism entails and am aware of the University’s policy in this regard.
2. I declare that this assignment is my own, original work. Where someone else's work was used
(whether from a printed source, the Internet or any other source) due acknowledgement was
given, and reference was made according to departmental requirements.
3. I did not copy and paste any information directly from an electronic source (e.g., a web page,
electronic journal article or CD ROM) into this document.
4. I did not make use of another student’s previous work and submitted it as my own.
5. I did not allow and will not let anyone copy my work with the intention of presenting it as his/her
own work.
Adriaan P. van Niekerk 03/10/2018
Signature Date

ABSTRACT
Since the end of apartheid the democratically elected ruling party of South Africa, the
African National Congress (ANC) implemented legislation as a measure of correcting
historical injustices and enabling equity that includes equal access to education, training,
and other opportunities formerly restricted to the white minority population.
One of these measures is the policy broad-based black economic empowerment (BBEEE),
also commonly referred to as black economic empowerment (BEE). The overall mandate
of BEE is to increase the number of black people who own, manage and control
businesses and black employment in the South African economy. The BEE Act was
introdusced with accompanying codes of good practice that provide clear and practical
guidelines on how Employment Equity should be planned, implemented, monitored and
reported on.
The primary objective of the study is to investigate whether BEE is perceived, by
employees of Small and Medium Enterprises (SME), to have a positive or negative effect
on SMEs when measured against the proposed outcomes and goals set out by the South
African Government and to make recommendations for both SMEs and Government.
Research was conducted by means of a literature and empirical study. The literature study
focused on BEE and emphasized aspects such as: the history, policies, objectives and the
policy instruments used to achieve participation of BEE by the South African economy.
Data was collected from employees of SMEs by means of an anonymous online survey
and analysed by means of statistical software.
The study showed that employees of SMEs have a mostly neutral perception about
several factors of BEE that can be viewed as negative for the BEE policy, because not
only was the policy created to right the wrongs of the past, but to reduce unemployment
and increase economic growth and inclusivity for black entrepreneurs.
Based on the results of the survey recommendations were also made to guide and support
owner-managers through this highly emotional, but critical important issue that can
ultimately ensure the future of the Small- and Medium-Sized businesses in South Africa.
Keywords: Broad-based Black Economic Empowerment, BEE, employee perception,
Small and Medium Enterprise, SME, South African economy

- i -
TABLE OF CONTENTS
CHAPTER 1: INTRODUCTION AND BACKGROUND ..................................................... 1
1.1 INTRODUCTION ................................................................................................... 1
1.2 PROBLEM STATEMENT ...................................................................................... 5
1.3 RESEARCH QUESTIONS..................................................................................... 6
1.4 RESEARCH OBJECTIVES ................................................................................... 6
1.4.1 Primary objective ............................................................................................ 7
1.4.2 Secondary objectives ..................................................................................... 7
1.5 THE SCOPE OF THE STUDY ............................................................................... 7
1.6 RESEARCH METHODOLOGY ............................................................................. 7
1.6.1 Literature review ............................................................................................. 8
1.6.2 Empirical study ............................................................................................... 9
1.6.3 Constructing the questionnaire ....................................................................... 9
1.6.4 Data collection and ethical aspects .............................................................. 10
1.6.5 Statistical analysis ........................................................................................ 11
1.7 CONTRIBUTIONS OF THE STUDY .................................................................... 11
1.7.1 Individual contributions ................................................................................. 11
1.7.2 Organisational contributions ......................................................................... 11
1.8 LIMITATIONS OF THE STUDY ........................................................................... 12
1.9 THE LAYOUT OF THE STUDY ........................................................................... 12
CHAPTER 2: LITERATURE REVIEW ............................................................................ 13
2.1 INTRODUCTION ................................................................................................. 13
2.2 DEFINITIONS AND TERMS. ............................................................................... 14
2.2.1 BEE-controlled company .............................................................................. 14
2.2.2 Black people ................................................................................................. 15
2.2.3 Small and medium-sized enterprises (SME) ................................................ 16
2.2.4 Exempted micro enterprise (EME) ............................................................... 16

- ii -
2.2.5 Qualifying small enterprise (QSE) ................................................................ 17
2.2.6 Black economic empowerment (BEE) .......................................................... 17
2.2.7 Amendments to definitions ........................................................................... 18
2.3 HISTORICAL OVERVIEW OF BEE AND SOUTH AFRICAN LEGISLATION...... 18
2.3.1 Employment Equity Act No. 55 of 1998 (SAICA, 2017) ................................ 21
2.3.2 Competition Act 89 of 1998 (Competition Commission, 1998). .................... 21
2.3.3 National Empowerment Fund Act 105 of 1988 (DTI, 1998). ......................... 21
2.3.4 Broad-Based Black Economic Empowerment Act No. 53 of 2003 (DTI,
2003a). ......................................................................................................... 21
2.3.5 The B-BBEE Codes of Good Practice 2007 (DTI, 2007b) ............................ 22
2.3.6 The BEE Codes of Good Practice 2013 (DTI, 2013) .................................... 25
2.3.7 Preferential Procurement Act of 2000 (DTI, 2000) ....................................... 26
2.3.8 The generic BEE scorecard and revisions.................................................... 28
2.4 SME SECTOR IN THE SOUTH AFRICAN ECONOMY ...................................... 34
2.5 HOW EMPLOYEE PERCEPTIONS CAN INFLUENCE BUSINESS .................... 38
2.6 SUMMARY .......................................................................................................... 39
CHAPTER 3: RESULTS AND DISCUSSION ................................................................. 41
3.1 INTRODUCTION ................................................................................................. 41
3.2 RESEARCH ETHICS .......................................................................................... 41
3.3 QUESTIONNAIRE DESIGN ................................................................................ 41
3.4 STUDY POPULATION AND SAMPLE SIZE ....................................................... 42
3.5 DEMOGRAPHIC INFORMATION ....................................................................... 43
3.5.1 Genders of the study population ................................................................... 43
3.5.2 Age distribution of the study population ........................................................ 44
3.5.3 Level of education of the study population ................................................... 46
3.5.4 Employment level of the study population .................................................... 46
3.6 INFORMATION ABOUT THE SMES THAT EMPLOY THE STUDY
POPULATION ..................................................................................................... 47
3.6.1 SMEs sizes and number of employees ........................................................ 47
3.6.2 BEE compliance level of the SMEs .............................................................. 48

- iii -
3.7 THE GENERAL PERCEPTION EMPLOYEES OF SMES HAVE ABOUT
BEE ..................................................................................................................... 50
3.8 BEE AWARENESS AMONGST THE STUDY POPULATION ............................. 51
3.9 THE PERCEIVED IMPACT OF BEE ON SMES AND THEIR EMPLOYEES ...... 52
3.9.1 Perceived advantages of BEE on SMEs ...................................................... 54
3.9.2 Perceived advantages of BEE for employees of SMEs. ............................... 57
3.9.3 Disadvantages for efficiency and reliability for SMEs ................................... 59
3.9.4 Economic disadvantages for SMEs .............................................................. 61
3.9.5 Perceived fundamental disadvantages of BEE ............................................. 63
3.9.6 Construct correlations .................................................................................. 64
3.9.7 Demographic construct effect sizes .............................................................. 66
3.10 SUMMARY .......................................................................................................... 69
CHAPTER 4: CONCLUSIONS AND RECOMMENDATIONS ......................................... 71
4.1 INTRODUCTION ................................................................................................. 71
4.2 CONCLUSIONS ON EMPIRICAL STUDIES ....................................................... 71
4.2.1 Conclusions based on the demographic information .................................... 71
4.2.2 Conclusions based on the business information .......................................... 72
4.2.3 Conclusions based the general perception of BEE ...................................... 73
4.2.4 Conclusions based on the awareness of BEE .............................................. 74
4.2.5 Conclusions based on the perceived impact of BEE on SMEs and their
employees .................................................................................................... 74
4.3 RECOMMENDATIONS ....................................................................................... 77
4.3.1 Recommendations to employees and owners of SMEs ............................... 77
4.3.2 Recommendations to government and regulatory bodies ............................ 78
4.4 EVALUATION OF THE STUDY ........................................................................... 78
4.4.1 Primary objective .......................................................................................... 78
4.4.2 Secondary objectives ................................................................................... 79
4.5 SUGGESTIONS FOR FUTURE RESEARCH ..................................................... 80
4.6 SUMMARY .......................................................................................................... 81

- iv -
CHAPTER 5: LIST OF REFERENCES ........................................................................... 82
LIST OF APPENDICES
APPENDIX A: The Questionnaire ........................................................................ 89
APPENDIX B: Application for ethical clearance .................................................. 102

- v -
LIST OF FIGURES
Figure 1: Population demographics of South Africa by population group .......................... 13
Figure 2: Schematic layout of the history of the BEE legislation. ....................................... 20
Figure 3: Preferential procurement 80/20 principal equation ............................................. 27
Figure 4: Gender distributions of the study population ....................................................... 44
Figure 5: Age distribution of the study population .............................................................. 45
Figure 6: Level of education of the study population .......................................................... 46
Figure 7: Employment level distribution of the study population ........................................ 47
Figure 8: Number of employees employed by SMEs size.................................................. 48
Figure 9: BEE compliance level of the SMEs by which the study population is employed at
.......................................................................................................................... 49
Figure 10: The study population’s general perception about BEE ..................................... 50
Figure 11: The population’s awareness of BEE ................................................................. 51

- vi -
LIST OF TABLES
Table 1: 2013 Amendments to EME and QSE turnover thresholds ................................... 18
Table 2: Sector charters and their effective dates .............................................................. 23
Table 3: Preferential procurement points awarded on BEE-level ....................................... 27
Table 4: Comparison of generic BEE scorecard between the original and amended Acts 28
Table 5: Comparison of BEE-level contributor between the original and amended Acts ... 29
Table 6: Socio-economic development benefit facto matrix ............................................... 34
Table 7: TEA in South Africa 2005 – 2016, separated according to population group. ...... 36
Table 8: Questionnaire layout and sections. ...................................................................... 42
Table 9: Total respondents and the resulting study population .......................................... 43
Table 10: Question compilation for constructs ................................................................... 53
Table 11: Cronbach’s alpha internal consistency ............................................................... 53
Table 12: Cohen’s phi-value for effect sizes (Gignac & Szodorai, 2016) ........................... 54
Table 13: Pearson correlation coefficients effect sizes ...................................................... 54
Table 14: Construct 1 - Advantages of BEE for SMEs mean and Cronbach’s alpha values
.......................................................................................................................... 55
Table 15: Perceived advantages of BEE on SMEs mean and standard deviation ............. 55
Table 16: Construct 2 - Advantages of BEE for employees of SMEs mean and Cronbach’s
alpha analysis ................................................................................................... 57
Table 17: Benefits of BEE for employees of SMEs mean and standard deviation ............. 57
Table 18: Construct 3 - Disadvantages for efficiency and reliability for SMEs mean and
Cronbach’s alpha values ................................................................................... 60
Table 19: Disadvantages for efficiency and reliability for SMEs mean and standard
deviation............................................................................................................ 60
Table 20: Construct 4 - Economic disadvantages for SMEs mean and Cronbach’s alpha
values ............................................................................................................... 62
Table 21: Economic disadvantages for SMEs mean and standard deviation. ................... 62

- vii -
Table 22: Construct 5 - Fundamental disadvantages of BEE mean and Cronbach’s alpha
values ............................................................................................................... 63
Table 23: Fundamental disadvantages of BEE mean and standard deviation. .................. 64
Table 24: Cohen’s correlation coefficient (Φ) effect sizes between constructs .................. 65
Table 25: Pearson correlation coefficients between age groups ........................................ 67
Table 26: Pearson correlation coefficients for SMEs with different BEE compliance levels
.......................................................................................................................... 68

- viii -
LIST OF ABBREVIATIONS
ANC African National Congress
BBEEE Broad-based black economic empowerment
BEE Black economic empowerment
CSI Corporate social investment
CSR Corporate social responsibility
DTI The Department of Trade and Industry
EE Employment Equity
EME Exempt micro enterprises
GDP Gross Domestic Product
GE Generic enterprise
GEAR Growth, Employment and Redistribution
GEM Global Entrepreneurship Monitor
HR Human recourse
NDP National Development Plan
QSE Qualifying small enterprises
SARS The South African Revenue Service
SED Socio-economic development
SEDA Small Enterprise Development Agency
SME Small and Medium Enterprises
TEA Total early-stage entrepreneurial activity

- 1 -
Chapter 1: Introduction and background
1.1 Introduction
It has been more than two decades since the end of apartheid in South Africa and the first
democratic election in 1994. The democratically elected ruling party of South Africa, the
African National Congress (ANC) implemented legislation as a measure of correcting
historical injustices and enabling equity that includes equal access to education, training,
and other opportunities formerly restricted to the white minority population (Herman, 2017).
One of these measures is the policy broad-based black economic empowerment (BBEEE),
also commonly referred to as black economic empowerment (BEE). The overall mandate
of BEE is to increase the number of black people who own, manage and control
businesses and black employment in the South African economy (The Investment House,
2016).
These policies are under scrutiny for various aspects, and several opinions exist about
whether these policies will positively or negatively influence businesses in South Africa.
One of the central questions asked is whether policies like BEE will ever end and whether
it was implemented as originally intended. An article by David Gleason (2013) gives a
short negative answer as follows:
“Never, well not as long as this racially obsessed group who run the ANC
remain in control. It is going to take a few generational changes within the
party before common sense prevails and by then, of course, it may be too
late for the party itself. In the process, what worries me most is that the
domestic economy will suffer, perhaps irremediably. It will be overtaken by
other African countries that have the courage and will to confront the genuine
economic and social challenges, of which there are many.”
Another article by Hoffman (2008) concludes that the first step to equality in South Africa is
to restructure the BEE system. He explains that even though the current system has
created an opportunity for black empowerment, the country's financial system cannot
accommodate the process and thus the real benefit still ends up in the hands of the
privileged (Hoffman, 2008).

- 2 -
A more recent study by Angela et al. (2018) reveals that perceptions of the BEE legislation
included that implementing BEE legislation was increasing the number of unskilled
companies and encouraging tender corruption by awarding tenders to BEE companies
even though they did not fit the criteria or capabilities.
However, many positive opinions exist about the BEE legislation. An online publication by
Juliet Pitman (2012) explains how smart entrepreneurs will find a way to use the BEE
legislation to their advantage by using preferential procurement policies and government
funding to grow their businesses. Another article by Entrepreneur Magazine (2012) lists
the benefits of being BEE-compliant as follows:
• BEE provides companies with a competitive advantage;
• big corporate companies are encouraged to invest in smaller BEE-compliant
companies;
• entities will be able to apply for government tenders;
• entities can use their BEE contribution levels as marketing tools.
Another author suggests that by increasingly including Small and Medium Enterprises
(SME) with the BEE framework, BEE holds the promise of the most significant changes to
the South African economy since the advent of democracy (van der Nest, 2004). In an
empirical study on the effects of BEE on profit and competitiveness of South African firms,
the results indicate that there is a positive relationship between the different BEE scores
and operating profit, turnover, and investment (Kruger & Kleynhans, 2014).
The focus of this study, however, is not about the opinionated negatives and positives of
the BEE legislation as seen by the advocates and critics. Rather the focus of this study is
the perceptions of employees at SMEs. The owners of these SMEs will not be included in
this study, as previous studies have been done solely on owners of SMEs; conclusions in
these studies indicated in general that owners of SMEs perceived no benefit in
implementing BEE legislation (Van Wyk, 2010).
BEE legislation has however been amended since its original implementation in 2003 (DTI,
2013), and there are indications that more changes will be under way (Janisch, 2018). As
mentioned, while previous studies have focused on employers, they disregarded

- 3 -
employees of these institutions. The author believes that it is just as important to
understand how employees perceive the mandate and implementation of BEE legislation
and how it reflects on SMEs.
It is essential to understand how SMEs are influenced as well as how their employees
perceive the BEE legislation, because SMEs have been identified as one of the most
productive drivers of economic growth in South Africa. Some researchers have estimated
that in South Africa SMEs make up 91% of formalised businesses, employ about 60% of
the labour force, and their total economic output accounts for roughly 34% of Gross
Domestic Product (GDP) (The Banking Association of South Africa, 2018). South Africa's
long-plagued unemployment rate was the highest it had been in 13 years (Moya, 2017) at
27.7% in the third quarter of 2017. Considering that SMEs employ 60% of the South
African labour force, employees of these enterprises are expected to be the ones who
would benefit most from BEE, however would appear as though BEE is mostly helping the
upperclass, a well connected few, and the system has only opened doors to more
corruption (Whittles, 2017).
BEE legislation divides SMEs into two categories, the first being exempt micro enterprises
(EMEs). EMEs represent entities with annual revenue of less than R10 million.
Compliance with this category make the entity a level 4 contributor, regardless of black
ownership or procurement. The second category is qualifying small enterprises (QSE).
QSEs represent entities with annual revenue of between R10 million and R50 million. The
new BEE codes dictate that QSEs must comply with all five elements of the BEE
scorecard (Pieterse, 2015).
Dludlu (2017) suggests that the BEE system is failing for two apparent reasons. Firstly,
despite the Employment Equity (EE) Commission having issued a report on the shocking
state of affirmative action in South Africa each year, there are no consequences for non-
complying entities, resulting in empowerment losing its importance in state procurement
decisions. Secondly, the government’s monitoring and enforcement mechanisms are
weak. Only as recently as 2016 was a Black Economic Empowerment Commission
created to enforce the act, but has since opened yet another door for corruption and
dishonest practices of which fronting is one of the most prominent (B-BBEE Commission,
2018).

- 4 -
Fronting is an illegal practice that some SMEs have used in the past to obtain BEE
recognition, and is a practice that persists (Ensor, 2017). A transaction or arrangement is
considered fronting when it directly or indirectly undermines or disturbs the achievement of
the objectives or implementation of any of the provisions of the BEE Act. Anyone found
guilty of fronting practices can be held liable for a fine of up to 10% of their annual
turnover, or a maximum prison sentence of 10 years (Werkmans, 2014).
According to acting commissioner of the BEE Commission, Zodwa Ntuli, in 2016 alone 22
of the 33 complaints the Commission received involved fronting practices (Ngoepe, 2016).
Near the end of 2017, the BEE Commission was to issue a further 50 findings against
companies for fronting practices (Ensor, 2017).
The question is why is it essential to understand employee perception on BBBEE?
The majority of the South African workforce is black; therefore companies have to consider
the perceptions of their employees with regards to their corporate social responsibility
(CSR) practices. BEE makes up a large part of a South African company CSR efforts, not
to mention the legislative requirements of doing business in South Africa (Alessandri et al.,
2011). CRS may influence the way a company is viewed in the public domain and
therefore may impact how they do business (Kloppers, 2014). A study by Zhu et al. (2014)
have shown that employee perceptions about CSR practices can affect their loyalty,
including affective commitment and personal effort. In other words, generating a
perception of confidence toward a company’s BEE efforts as well as BEE in general could
well result in improved employee loyalty and job satisfaction.
Another reason it is essential to understand employee perceptions of BEE is that
companies wanting to do business in South Africa, especially with any organs of the state,
are required to have a functional BEE status to conduct business successfully. However, if
employees are not benefitting as intended, the resulting negative perception might have
less than desirable effects on the entity (Janse van Rensburg & Roodt, 2005).
Lastly, awareness of employee perceptions of the BEE system might offer insight on how
both government and businesses could improve and negate negative perceptions around
the BEE system. It could also indicate the need for communication and creating
awareness amongst employees, companies and government and identify the possible

- 5 -
necessary discussions and knowledge required about the subject (du Plessis & Grobler,
2014).
Additionally, understanding SME employees’ perceptions of BEE will indicate whether the
proposed benefits of the BEE system is reaching the people it was intended to reach or
whether it has resulted in any of the intended transformation for the benefit of the working.
This might also verify whether the statements, namely that only the well-connected benefit
from BEE and that employees believe that corrupt practices are happening in their
institutions, hold any ground.
According to the South African Government's National Development Plan (NDP), 11
million jobs need to be created by 2030, which means that for this to materialise over
49,000 SMEs must grow sustainably by 20% (BusinessTech, 2015). This raises the
following questions:
• Is BEE contributing to SME growth and creation, or is it impeding SME growth and
creation by placing smaller businesses that are not BEE compliant at a
disadvantage?
• Is enough being done to educate and support small businesses about the benefits
of being BEE compliant for them to obtain said benefits from the legislation?
1.2 Problem statement
SMEs play an essential role in the South African economy in creating jobs, addressing
unemployment, and providing sustainable growth for the South African economy. SMEs
make up 91% of formalised businesses, employ about 60% of the labour force, and their
total economic output accounts for roughly 34% of South Africa's GDP (The Banking
Association of South Africa, 2018).
The Broad-Based Economic Empowerment Act, 2003 (DTI, 2003a) regulates that organs
of state and public enterprises are required to review an applicant's BEE compliance level,
in which case a business that is not able to provide BEE credentials and an acceptable
BEE scorecard will not be awarded tenders and contracts. To improve the efficiency and

- 6 -
impact of the legislation the Act was amended in 2013 (DTI, 2013). These amendments
are discussed in the literature review.
The problem statement was derived from the theory, namely whether the intended
objectives and outcomes of the BEE legislation are perceived as being realised by
employees of SMEs. The study includes the general sentiment or perception as well as the
specific outcomes and objectives, including black ownership, enterprise growth and
development, and job creation associated with the implementation of BEE legislation.
1.3 Research questions
The following central research questions need to be answered in this study:
• Is there any perceived advantages of disadvantages for SMEs because of BEE?
• Is there any perceived advantage or disadvantage for employees of SMEs because
of BEE?
• Do SME employees perceive BEE positively or negatively?
• Do employees of SMEs perceive the mandates and goals of BEE as being met?
• Has BEE opened the door for more corrupt practices as perceived by employees?
• Is it important for employees, that the SME that employ them, has a reasonable
BEE-level?
• Has BEE had a positive or negative effect on SMEs as perceived by employees of
these entities?
1.4 Research objectives
This section outlines the primary and secondary research objectives of this study.

- 7 -
1.4.1 Primary objective
The primary objective of the study is to investigate whether BEE is perceived to have a
positive or negative effect on SMEs when measured against the proposed outcomes and
goals set out by the South African Government.
1.4.2 Secondary objectives
To achieve the primary objective, this study seeks to achieve the following secondary
objectives:
• To clearly define BEE;
• To identify and describe the outcomes and goals of BEE;
• To gain greater insight on the aspects of BEE by conducting a literature study;
• To understand the role that SMEs play in the South African economy;
• To construct a questionnaire to assess what the perceived impact of BEE is on
SMEs;
• To make conclusions and recommendations based on the literature study and
empirical study.
1.5 The scope of the study
This study focuses on the historical background and amendments to BEE legislation, its
proposed outcomes, objectives, principles, components, and elements. It aims to
determine the perceived impact of BEE on SMEs and make relevant recommendations
and observations. The research sample was mainly from the Gauteng area, but did
exclude participation from outside the region.
1.6 Research methodology
The research commences with a literature review focused on the BEE legislative
framework, its past, future, and its impact on SMEs in South Africa towards gaining a clear

- 8 -
understanding of what the implications are of BEE implementation for SMEs, the intended
outcomes, and how the BEE legislation is put together. The literature review aims to
establish whether similar research has been done in these areas to understand the
limitations and suggestions of these studies. Lastly, empirical research is done to
determine what the perceived opinions of employees of SMEs are about BEE, the
perceived positive and negative outcomes, and how it is implemented.
A quantitative strategy was used to collect data in the form of a questionnaire that was
distributed to South African SMEs. The primary approach was to use social media groups
with communities of employees and employers within the SME environment. These groups
are primarily based on Facebook. Managers and decision-makers were asked to distribute
the questionnaires to employees and try to ensure that employees from all employment
levels, races, genders and ages would participate. The researcher ensured that employers
understood that the focus of the surveys and research is on feedback from the employees
and not so much on the feedback from owners and employers. The minimum requirement
was that the employees understand, read and speak English, as the questionnaire was
only available in English. The survey was completely anonymous.
1.6.1 Literature review
Literature is found from the following sources:
• Scientific databases made available by the NWU library;
• Google Scholar;
• The internet;
• The Department of Trade and Industry (DTI);
• Experts of BBBEE legislation;
• SMEs from South Africa;
The literature review focuses on the topic of BEE and SMEs and includes the following
sub-themes:
• The history of BEE in South Africa;

- 9 -
• Policy objectives and outcomes of BEE legislation and its amendments;
• Policy instruments to achieve BEE targets; and
• SMEs and their place in the South African economy.
1.6.2 Empirical study
An empirical study was conducted by using a questionnaire that was developed for this
study. The questionnaire was distributed to possible respondents who use social media
and direct communication with SME owners in South Africa.
The target audience includes SME employees of all races, ages and backgrounds. The
results of the questionnaires were statistically analysed and used to draw conclusions on
the different perceptions of employees about SMEs and the perceived impact of BEE on
the enterprises they are employed at.
1.6.3 Constructing the questionnaire
The questionnaire was designed to obtain information in the following three sections:
Section 1
The first section deals with the demographic information of respondents and the
companies they are employed at. The questions in this section includes questions about
the respondent's age, gender, position in the company, and information about the
companies they are employed including BEE-level and number of employees. Some
questions in this section have been designed to ensure that only data from qualifying
respondents would be considered.
Section 2
The second section of the questionnaire was designed to determine the awareness of BEE
under respondents. This section ensures that data from respondents with no knowledge of
BEE are removed from the data pool as it could influence results. Opinions formed without
knowledge of BEE were considered invalid.
Section 3

- 10 -
The third section focuses on the degree of the impact which respondents perceive BEE to
have on their respective companies with the proposed outcomes and objectives of BEE
legislation as a guide. The questions have been designed to portray both positive and
negative aspects that would guide the respondents’ thinking before answering. The
previous two sections ensure that the data retained for evaluation in this section is
accurate and that only qualifying respondents were included.
1.6.4 Data collection and ethical aspects
A survey was created with Google Forms. The Google Forms application stores all
respondent data on cloud-based servers, and therefore only the researcher has access to
the data. The application was configured to collect no personal information like e-mail
addresses or IP-addresses. The data was backed up weekly on a local hard drive for
redundancy and will be kept for three years before being discarded.
The Google Forms platform ensures that anyone with internet access and a link to the
form can participate in the study. The anonymity of the platform allows respondents to be
entirely truthful with their answers without threat of intimidation of any sort. The anonymity
of the platform also ensures no adverse impacts with regards to this study to both
employers and employees or businesses, as there is no traceability between responses
given and those who give them.
Three primary methods for obtaining respondent data were used:
• A social media campaign was launched to reach as many employees of SMEs as
possible, reaching out to existing Facebook groups that are focused on SMEs in
South Africa.
• The study also directly contacted members of the groups mentioned above and
requested their willingness to participate in the study by asking them to distribute
the questionnaire between colleagues and employees.
• The study directly contacted SMEs and request willingness to participate.
No limits were placed on the number of respondents that could participate, but a minimum
of 150 respondents were set for the study.

- 11 -
1.6.5 Statistical analysis
Before analysing the data, the raw data was processed and “cleaned”. This process tested
for outliers and zero data points; only respondent data in which respondents answered all
the questions was accepted. Secondly, a small frequency analysis was done to determine
whether the target audience was reached. The data then underwent a statistical analysis
to verify information including: mean, variance and standard deviation. The statistical
analysis was necessary to validate perceptions from the data and determine what weight
those perceptions carried. The opinions were then compared with the intended outcomes
and mandates of the BBBEE legislation.
The North-West University provides a statistical consultation service that was used to
verify and analyse the data collected as mentioned above. The consultation service
department uses analytical software called SAS (SAS Institute Inc, 2017) to analyse the
questionnaires. The arithmetic means and Cronbach’s alpha values were used to interpret
the results, validity and reliability.
1.7 Contributions of the study
This section describes the individual and organisational contributions of the study.
1.7.1 Individual contributions
This study provides valuable feedback on whether BEE affects employees in SMEs and if
so, to which extent? The research also contributes to developing understanding on
whether employees regard BEE as essential and contributing positively to their wellbeing.
1.7.2 Organisational contributions
This study provides valuable feedback on how BEE affects SMEs in South Africa and
whether its impact is perceived as positive or negative. Not only can this study assist
organisations in positively reacting to BEE legislation but it can also assist the government
in refining BEE legislation to obtain the desired outcomes or even to educate employees
about what benefits BEE holds for SMEs in South Africa.

- 12 -
1.8 Limitations of the study
The following aspects have been identified as limitations to this study:
• As mentioned, SMEs is a massive contributor to the South African economy, and
therefore a review of this magnitude will not be able to meet a representative
sample size of all SMEs in South Africa.
• This study does not encapsulate all aspects of the BEE legislation, but only the
most relevant factors directly impacting employee perceptions.
• Willingness to participate by respondents may be limited because of the sensitive
nature of the study’s contents.
1.9 The layout of the study
The study is laid out in the following chapters:
Chapter 1 provides an introduction, problem statement, objectives, scope, research
methodology and limitations of the study.
Chapter 2 consists of a literature review on BEE. This chapter outlines the history, policy
objectives, fundamental principles, components, elements and amendments to the BEE
legislation.
Chapter 3 comprises the results of the empirical study, during which the information is
analysed, and the findings will be discussed.
Chapter 4 includes the conclusions and recommendations as answers to the research
questions posed earlier.

- 13 -
Chapter 2: Literature review
2.1 Introduction
South Africa has a population of over 51 million people and is still growing. The community
is divided into several population groups based on race according to the latest census
results. The South African population consist of a 79.1% black African population, 8.9%
coloured, 2.5% Indian/Asian, and 8.9% white. These statistics can be seen in Figure 1.
Figure 1: Population demographics of South Africa by population group
(Statistics South Africa, 2012)
Besides the majority of South Africans being black, the statistics show that South Africa
still battles a significant unemployment rate, which stood at 27.2% by the second quarter
of 2018, of which most of these are black Africans (Statistics South Africa, 2018). Black
Africans have the highest income inequality among South Africans with an increasing Gini
coefficient of 0,64 in 2006 to 0,65 in 2015. Income inequality amongst whites declined from
0,56 in 2006 to 0,51 in 2015 (Statistics South Africa, 2017c).
To address the abovementioned inequalities, the South African government has
implemented strategic policies, one of which is BEE, to increase the number of black
people that own, manage, control and gain employment in the South African economy.

- 14 -
The BEE legislation has a direct impact on both large firms as well as SMEs. As
mentioned, SMEs make up 91% of formalised businesses in South Africa and is therefore
one of the most significant contributors to the South African economy (The Banking
Association of South Africa, 2018).
This chapter aims to generate a clear understanding of the SME environment in South
Africa, the BEE policy, how it has changed since its conception, and the objectives that are
intended to be met by implementing the BEE policy. This chapter also briefly looks at the
effects of employee perceptions and their potential effects on SMEs.
Before delving into the inner workings of BEE in the South African context, it is essential to
understand the specific terms and definitions regularly used in the legislation. A proper
understanding of the definitions and terms used will avoid misinterpretation of the
legislation.
2.2 Definitions and Terms.
For this study, some terms and definitions are defined below to avoid unclarities. Some
amendments to these definitions will also be discussed.
2.2.1 BEE-controlled company
The BEE Act defines a BBE-owned company as a company owned by a juristic person
and having shareholding or similar member interests that are BEE-controlled, in which
black participants enjoy a right to economic interest that makes up at least 51% of the total
of such interests, which is measured with the flow-through principle (DTI, 2003a).
Before the latest amendments to the legislation, it was possible for companies that were
mostly white-owned to achieve good BEE-levels by excelling in other categories of the
BEE scorecard like employment equity, skills development, preferential procurement,
socioeconomic development, or enterprise development. The new legislation, however,
prioritises black ownership with a weighting of 40%, which equates to a minimum 10%
black shareholding. Companies that do not comply with the minimum requirement will be
penalised with one BEE-level on their scorecard (Steyn, 2015).

- 15 -
To summarise, the original BEE Act allowed a company with at least 51% black ownership
in the form of a juristic person(s) or shareholders to be declared a black-controlled
company. It allowed companies to sell shares to black shareholders while maintaining
white control and still being considered a black-controlled company. Formerly, the
ownership element of the BEE scorecard was not prioritised, and so companies focussed
more on the other aspects of the scorecard to obtain good BEE-levels. The legislation has
now been amended to ensure that companies place a greater emphasis on direct
ownership. Companies are now forced to comply with the ownership element to obtain the
desired BEE-level.
2.2.2 Black people
Black is a generic term that refers to African, coloured and Indian people who are citizens
of the Republic of South Africa by birth or decent; or who became citizens of the Republic
of South Africa by naturalisation before 27 April 1994 or after 27 April 1994 and who would
have been entitled to acquire citizenship by naturalisation prior to that date (DTI, 2013).
According to a website, BEE Analyst & BEE Analyst & Associates (2018), black people
can be defined as African, coloured or Indian persons who were either:
• born in South Africa,
• citizens by descent (through one or more parents),
• became citizens by naturalisation before the commencement of the Constitution, or
• became citizens by naturalisation after the commencement of the Constitution, but
who without the apartheid policy would have qualified for naturalisation before then.
It is important to note that the Chinese community is excluded from both these definitions,
but in 2008 the South African High Court in Pretoria ruled that Chinese South Africans
should be reclassified as black people. This ruling redefined the Chinese community as
black with regards to employment equity and BEE. It made the order so that ethnic
Chinese persons can benefit from government policies such as BEE and preferential
procurement (Harris, 2017).

- 16 -
From the abovementioned it can be concluded that only white persons are excluded from
the definition “black people” and that under the BEE Act all other South African racial
groups are included.
2.2.3 Small and medium-sized enterprises (SME)
An SME's general definition is an enterprise with a turnover of less than R50 million. SMEs
can be subdivided into two categories by the BEE legislation. The first is exempt micro
enterprises (EME). Compliance with this category will result in a company being a level-4
contributor regardless of black ownership or procurement. The second category is
qualifying small enterprises (QSE). In the new codes, QSEs need to comply with all five
elements of the BEE scorecard (Pieterse, 2015).
The above definition is however generalised as definitions vary from industry sector to
sector. For this study, the upper threshold for SMEs will include medium-sized companies
and all smaller companies. According to the National Small Business Amendment Act (26
of 2003) a South African company is considered a medium-sized company when:
• the company has fewer than 200 employees,
• the annual turnover is less than R64 million,
• it has capital assets of less than R10 million,
• there is direct managerial involvement by owners.
2.2.4 Exempted micro enterprise (EME)
An exempted micro enterprise (EME) has an annual turnover of less than R10 million., and
includes entities recently incorporated who have been operating for less than one year. An
EME is not measured on the B-BBEE scorecard (van der Westuizen, 2017).
Under the new B-BBEE Codes of Good Practice (DTI, 2012), a business qualifies as an
EME if its annual turnover is less than R10 million and the entity has been in operation for
less than one year. EMEs are also exempt from being measured with a BEE scorecard,
and also qualify for the following under the new BEE Act (EMPOWERDEX, 2018a):

- 17 -
• 100% black-owned EME – Level-1 BEE status and a procurement recognition level
of 135%.
• 51% or more black-owned EME – Level-2 status and a procurement recognition
level of 125%.
• Any other EME – Level-4 status and a procurement recognition level of 100%.
2.2.5 Qualifying small enterprise (QSE)
A business with an annual turnover of more than R10 million but less than R50 million
qualifies as a qualifying smaller enterprise (EMPOWERDEX, 2018b). This definition is
directly in line with the 2013 Codes of Good Practice (DTI, 2013). The Codes of Good
Practice also elaborates on the enhanced B-BBEE recognition level for QSEs as follows:
• Qualifying small enterprises which are 100% black-owned qualify for a level-1 B-
BBEE recognition.
• QSEs which are at least 51% black-owned qualify for level-2 B-BBEE recognition.
The turnover thresholds were amended since the original 2007 Codes of Good Practice in
which QSEs qualified for measurement under the qualifying small enterprise scorecard
with a turnover of between R5 million and R35 million (Jack & Harris, 2007).
2.2.6 Black economic empowerment (BEE)
The Department of Trade and Industry defines BEE as an integrated and coherent socio-
economic process that directly contributes to the economic transformation of South Africa.
It does so by bringing about significant increases in the numbers of black people who
manage, own and control the country's economy and significantly decreasing income
inequalities (DTI, 2003b).
The South African Western Cape Government (2018) defines BEE as the broad approach
to de-racialise South Africa's economy and to fast-track the entry of historically
disadvantaged individuals into the business arena. BEE is an inclusive process that needs
all sectors of the economy's input to make it work. Government is trying to create a real
BEE and avoid fronting, which many companies still use.

- 18 -
2.2.7 Amendments to definitions
The most prominent amendments to the Codes of Good Practice were those made on the
turnover thresholds that qualified EMEs and QSEs. The amended turnover thresholds to
definitions 2.2.4 and 2.2.5 can be seen in Table 1.
Table 1: 2013 Amendments to EME and QSE turnover thresholds
Entity size classifications
2007 Codes of Good Practice turnover
threshold
2013 Codes of Good Practice turnover
threshold
Exempt micro enterprise < R5-million < R10-million
Qualifying small enterprise R5-million ≤ R35-million R10-million ≤ R50-million
Generic enterprise ≥ R35-million ≥ R50-million
(EMPOWERDEX, 2015)
The table above illustrated that entities used to qualify as EMEs if they had a financial
annual turnover of less than R5 million, but under the 2013 Codes of Good Practice this
threshold was moved to entities with a turnover of less than R10 million. The turnover
threshold for QSEs has also been amended from between R5 million and R35 million per
financial year to between R10 million and R50 million.
This study focuses on SMEs that qualify under QSEs, but it is also important to note that
an SME that is currently operating just below the generic enterprise (GE) turnover
thresholds of R50-million may surpass the threshold, which would mean that the entity
could no longer use the enhanced BEE-level recognition levels as mentioned in section
2.2.5. These entities will have to manage their BEE-level differently under the generic
scorecard (which will be discussed later) on their next BEE-level evaluation (DTI, 2013).
2.3 Historical overview of BEE and South African legislation
Since the election of the ANC government in 1994, the ruling party has been driven to
redress the inequalities of the apartheid era government by implementing legislation that
sought to substantially and equitably transfer ownership, management and proportionate

- 19 -
control of South Africa's financial and economic resources to the majority of its citizens
(Harris, 2017).
In 1994 when the ANC took office South Africa’s unemployment rate was at 38.2%, of
which the vast majority consisted of black people living in large-scale poverty (Orkin,
1998). During the early days of the South African democracy, the ANC suffered from a
lack of skilled managers and policy coordination and implementation methods were not
proving to be successful. To address these constraints, the ANC introduced a
macroeconomic policy framework called the Growth, Employment and Redistribution
(GEAR) Strategy in 1996 to stimulate faster economic growth and alleviate the high
unemployment rate (SAHO, 2017).
GEAR was the start of a host of policy changes toward addressing the impeding inequality,
unemployment and poverty levels of South Africa. Some of the first policies drafted were
the Employment Equity Act, the Competition Act and the National Empowerment Fund.
Figure 2 Below illustrates a brief the historical timeline of BEE legislation and
supplementary legislation in South Africa as quoted by (Van Wyk, 2010) and updated from
(EMPOWERDEX, 2015) and (DTI, 2012).

- 20 -
Figure 2: Schematic layout of the history of the BEE legislation.
1998 2000 2003 2004 2005 2006 2007 2012 2013 2015 2018
BEE Commision
establishment
BEE Commissions
report released
DTI releases BEE strategy
January – BEE Act
promulgated
April – Drafting of
Phase 1 Codes began
December – Release of Phase 1 for
public comment
March – Collation of
comments on Phase 1
April – Drafting of
Phase 2
June – Second draft
discussed with private sector stakeholders
October – Cabinet
approved Phase 1 in principle
November – Release of final draft Phase 1
December – Release draft
of Phase 2
March – Cut-off for public comment on
Phase 2
April – Collation of
comments on Phase 2
August – Simplified
Codes prepared for
cabinet
February - Codes of
Good Practice Gazetted
Amended BEE Codes Drafted
New BEE Codes
Prepared for Cabinet
Amended BEE Gazetted
BEE Commissioner
comes into being &
Implementing 2013
Codes from 1st May 2015
March – DTI Gazetted new
proposed changes
(Van Wyk, 2010; EMPOWERDEX, 2015).

- 21 -
2.3.1 Employment Equity Act No. 55 of 1998 (SAICA, 2017)
During 1996 a need arose for the participation of the black population in economic
activity, which led to the establishment of the Employment Equity Act in 1998 to
promote the participation of black people in the economy (Ewert & Melinda, 2014).
The purpose of the Employment Equity Act is to achieve equity in the workplace by
promoting equal opportunity and fair treatment in employment toward eliminating unfair
discrimination, implementing affirmative action measures to redress the disadvantages
experienced by designated groups from the past, and to ensuring equitable
representation in all occupational categories and levels in the workforce (SAICA, 2017).
2.3.2 Competition Act 89 of 1998 (Competition Commission, 1998).
The Competition Commission was established in adherence with the Act. The
Competition Commission was empowered to investigate, control, and evaluate
restrictive business practices, abuse of dominant positions and mergers to achieve
equity and efficiency in the South African economy. Its primary purpose is to promote
and maintain competition in South Africa (Competition Commission, 2018).
2.3.3 National Empowerment Fund Act 105 of 1988 (DTI, 1998).
The National Empowerment Fund was created to hold equity stakes in state-owned
and private enterprises on behalf of historically disadvantaged persons. The National
Empowerment Fund was established as a driver for promoting and facilitating black
economic participation by providing both financial and non-financial support to BEE
businesses. The National Empowerment Fund grants business loans to BEE
companies in the range of R250 000 and R75 million across all industry sectors. These
business loans are aimed at start-ups, expansions and equity acquisitions (DTI,
2018c).
2.3.4 Broad-Based Black Economic Empowerment Act No. 53 of 2003 (DTI, 2003a).
During 2003 the concept of broad-based black economic empowerment (B-BBEE)
came into being. This policy was published by the Department of Trade and Industry in
a document known as A Strategy for Broad-Based Black Economic Empowerment and

- 22 -
was also the document that first mentioned the generic BEE scorecard (Ewert &
Melinda, 2014).
Subsequently, the Broad-Based Black Economic Empowerment (53 of 2003) (hereafter
referred to as the BEE Act) came into being on 7 January 2004 (DTI, 2003a). The
purpose of the Act was to establish a legislative framework for the promotion of BEE.
The BEE Act also empowers the Minister of Trade to issue codes of good practice and
to publish transformation charters. The BEE Act made provision for the establishment
of the Black Economic Empowerment Advisory Council (B-BBBEE Commision, 2018).
According to Ewert and Melinda (2014), primary objectives of the BEE Act can be
summarised as follows.
• To increase black ownership and management of enterprises. Black ownership
indicates that least 51% of a company is owned by a black person(s);
• To increase black ownership and management in priority sectors of the
economy. Some of the most significant contributing sectors are mining,
manufacturing and finance (Statistics South Africa, 2017a);
• To gain greater access to financial support for BEE through the National
Empowerment Fund;
• To enable rural communities to participate in economic activities, thereby
empowering them;
• To encourage the development of human resources in enterprises with
education and training; and
• To actively encourage black female ownership of companies by facilitating them
in skills development, infrastructure development, and access to economic
activities.
2.3.5 The B-BBEE Codes of Good Practice 2007 (DTI, 2007b)
Before the release of the BEE Act in 2003, there was no framework for measuring
BEE. Moreover, by the beginning of 2004 when the BEE Act had been promulgated,

- 23 -
many sectors of the economy had drafted industry charters on BEE and transformation,
but others had contained scorecards loosely based on the broad-based scorecard.
Some sectors had only written undertakings of commitment to change. The original
strategy had only provided the outline of a broad-based scorecard, together with
weightings, contained no detail on measurement principles and application of the
scorecard (Herman, 2017).
The Codes of Good Practice provides a standard framework for measuring BEE across
all sectors of the economy. The intention of the Codes of Good Practice is to create a
level playing field for all entities operating within the South African economy by
providing clear and comprehensive criteria and guidelines for the measurement of BEE
(DTI, 2007a). The Codes of Good Practice acts as a guideline for the overall
operational aspects of the BEE strategy in South Africa.
These Codes of Good Practice also allow for the creation of sector charters. These
sector charters were created by the DTI to ensure that sector charters submitted for
gazetting were sufficiently aligned with the BEE Act and Codes of Good Practice and
more importantly, that they advanced the objectives of sustainable BEE (DTI, 2018a).
The sector charters and their effective dates can be seen in Table 2:
Table 2: Sector charters and their effective dates
Sector Codes Effective date
Agri-BEE Charter 28-Dec-12
Financial Sector Charter 26-Nov-12
Information and Communication Technology (ICT) Charter 07-Nov-16
Property Sector Charter 01-Jun-12
Chartered Accountancy Sector Code 10-May-11
Integrated Transport Sector Codes 21-Aug-09
Forest Sector Code 12-Jun-09
Marketing, Advertising and Communication (MAC) Sector Code 01-Apr-16
Tourism Sector Code 20-Nov-15
(DTI, 2018a)

- 24 -
The original Codes of Good Practice allowed opportunistic entities to bend the rules to fit
their outlook on BEE, of which one of the most common transgressions is fronting.
Fronting is an arrangement or other act that directly or indirectly undermines the achieved
objectives or the implementation of any of the requirements of the BEE Act. The DTI
describes fronting as one or more of the following practices:
• Window-dressing (Jackson et al., 2015):
Window-dressing includes situations in which black people are appointed or
introduced to an enterprise by minimum effort and where black people who are
designated for an enterprise are discouraged or prohibited from participating in the
core business of that enterprise ;
• Benefit diversion(Jackson et al., 2015):
Benefit diversion includes activities where the economic benefits received as a
result of its BEE status do not flow to black people according to the percentage
specified in the relevant legal documentation. Benefit diversion also includes a legal
relationship with a black person to achieve a certain level of BEE compliance
without the economic benefits.
• Opportunistic intermediaries(DTI, 2018b):
Opportunistic intermediaries include enterprises that have made agreements with
other enterprises to use their favourable BEE status in circumstances where the
agreement involves limitations or restrictions upon the identity of the opportunistic
intermediary's suppliers, service providers, clients or customers .
According to acting commissioner of the BEE Commission, Zodwa Ntuli, in 2016 alone 22
of the 33 complaints the commission received involved fronting practices (Ngoepe, 2016).
This trend seems to be a growing concern as by October 2017 the BEE commissioner was
to issue 50 findings against companies with regards to fronting practices (Ensor, 2017).
The BEE Codes of Good Practice have however undergone several phases of
implementations since its promulgation in January 2004 and was amended in 2013 (DTI,
2013).

- 25 -
2.3.6 The BEE Codes of Good Practice 2013 (DTI, 2013)
The revisions to the 2007 Codes of Good Practice were gazetted in 2013 but was only
implemented on 1 May 2015 (EMPOWERDEX, 2015). There were five significant
amendments made to the Codes of Good Practice. The aim of these major amendments
was to show that the government was taking a more dominant and prescriptive approach
to the implementation of BEE. The new measures that were introduced included the
following (Werkmans, 2014):
• The Government established a BEE Commission to investigate complaints
relating to BEE, BEE transactions, and fronting practices.
• The new codes made provision for and introduced various criminal offences of
misrepresenting or providing false information regarding a firm’s BEE status and
have therefore classified fronting as a criminal offence.
• The new codes introduced a statutory right for public and private companies to
cancel any contract awarded due to false information being provided on a firm’s
BEE status.
• The new codes also pose an obligation by Government and public entities to
apply the Codes of Good Practice in their procurement policies.
• The new Act also forces South African listed entities to provide a report to the
BEE Commission on their compliance with BEE as well as the BEE targets they
aim to obtain.
One of the most significant amendments of the act was the establishment of the BEE
Commission on 6 August 2015 (B-BBEE Commission, 2016). The primary functions of
the commission are as follows (B-BBEE Commission, 2018):
• To oversee and regulate adherence to the BEE Act in the public interest;
• To strengthen collaboration between the public and private sector to protect the
BEE objectives;
• To receive complaints with regards to BEE and investigate;

- 26 -
• To promote educational programmes and initiatives of BEE;
• To maintain a register of essential BEE transactions;
• To receive and analyse BEE compliance reports;
• To encourage good governance and accountability with regards to BEE; and
• To create public awareness of BEE.
There are several policy instruments that the government has implemented to achieve
BEE, but one of the most crucial policy instruments that implemented across all sectors of
the economy is preferential procurement (Nkwananchi, 2015).
2.3.7 Preferential Procurement Act of 2000 (DTI, 2000)
The Preferential Procurement Framework Act allows government entities conducting a
tender process to evaluate tender submissions according to specific prescribed criteria.
The Preferential Procurement Act gives the government and private entities
guidance on how to calculate the points for price and categories of preference. The
regulations then require the tender to be awarded to the bidder that scores the
highest number of points (Barclay, 2012). Therefore, companies wanting to do
business with government organs should aim to have the best BEE procurement
scores to be more successful in tender applications.
The South African Government is one of the country’s largest spenders, having
spent R1.52 trillion in the 2015/2016 financial year (Statistics South Africa, 2017b).
This emphasises the importance of business in South Africa to have a good BEE
rating. Not only does Preferential Procurement Act as an incentive for dealing with
the government but also for dealing with enterprises with good BEE scores to
improve their BEE scores. Clearly, preferential procurement plays a significant role
in driving transformation across the South African economy.
The Preferential Procurement Act also calls for an 80/20 preferred procurement point
system when awarding tenders. This system assigns a score out of 100 based on the
BEE-level of the supplier and the rand value or the tender. This system is to be applied to

- 27 -
all tenders with a value larger than or equal to R30 000 and up to a value of R50 million
(DTI, 2017). The formula for this point system can be seen in Figure 3:
Figure 3: Preferential procurement 80/20 principal equation
For the 20 points available in the point system, a company scores points based on their
BEE level. The points are awarded in Table 3 below:
Table 3: Preferential procurement points awarded on BEE-level
BEE-level Number of points
1 20
2 18
3 14
4 12
5 8
6 6
7 4
8 2
Non-compliant 0
This point system changes for tenders over R50 million, but for this study, the focus is kept
on QSEs with an annual turnover of less than R50 million.

- 28 -
Another policy instrument to achieve BEE is the institution of the generic BEE scorecards.
These scorecards are used to verify the BEE credentials of businesses (The PRS Group,
2017).
These scorecards contain various elements such as ownership, management control,
employment equity, skills development, enterprise development, socio-economic
development, and sector specific contributions.
2.3.8 The generic BEE scorecard and revisions.
To obtain a BEE contribution level, firms are audited by approved auditing bodies on
several elements of their institutional operations. The original BEE Act focussed on seven
elements including ownership, management control, employment equity, skills
development, enterprise development, socio-economic development (Nkwananchi, 2015).
The amended Codes of Good practice focuses on only five elements with three elements
being prioritised (DTI, 2013).
A comparison between the original and amended generic BEE scorecard and weighting
points of each element can be seen in Table 4 below.
Table 4: Comparison of generic BEE scorecard between the original and amended
Acts
Element Weighting point
(amended Codes) Weighting point (current
Codes)
Ownership 25 20 plus 3 bonus points
Management control 15 plus 4 bonus points
Management control - 10 plus 1 bonus point
Employment equity - 15 plus 3 bonus points
Skills development 20 plus 5 bonus points skills development - 15
New enterprise and supplier development
40 plus 4 bonus points Preferential procurement - 20
Enterprise development - 15
Socio-economic development
5 5

- 29 -
Total 118 107
Source: (DTI, 2013).
Following how entities contribute to the above elements, they will be awarded a BEE-level.
A comparison of the levels that are allocated according to points earned on an entity's BEE
scorecard between the original and amended codes can be seen in Table 5.
Table 5: Comparison of BEE-level contributor between the original and amended
Acts
BEE-level Amended Codes Original Codes
1 ≥ 100 points ≥ 100 points
2 ≥ 90 but < 100 points ≥ 85 but < 100 points
3 ≥ 90 but < 95 points ≥ 75 but < 85 points
4 ≥ 80 but < 90 points ≥ 65 but < 75 points
5 ≥ 75 but < 80 points ≥ 55 but < 65 points
6 ≥ 70 But < 75 points ≥ 45 but < 55 points
7 ≥ 55 but < 70 points ≥ 40 but < 45 points
8 ≥ 40 but < 55 points ≥ 30 but < 40 points
Non-compliant < 40 points < 30 points
Source: (DTI, 2013)
Under the amended BEE Codes of Good Practice, the code prioritises three elements out
of the five, namely ownership, skills development, and enterprise and supplier
development. The only one of these that is compulsory is ownership (DTI, 2013). The new
Act calls for a QSE to achieve a minimum of 40% of at least two of the three priority
elements. Should an entity not meet the minimum requirement, their BEE-level will be
penalised by one level on their scorecard (Schoeman–Louw, 2017).
Ownership
The ownership element refers to the owner’s right to share in economic benefits that
accumulate resulting from the owner’s participation in the enterprise. The ownership
- 30 -
element also refers to the right of the owner to influence the use of resources of the
enterprise (SEESA, 2018). The weighting of the ownership element has also increased
from 20 to 25 points as set out in Table 4. This element is in alignment with the first
primary objective of the BEE Act as set out in section 2.3.4.
Under the current Codes of Good Practice, an EME is deemed to have a level-4 BEE
status regardless of the race of the ownership (Werkmans, 2014). The BEE contribution
level of QSEs will be measured by reference to all five BEE elements, but the ownership
element is compulsory. The Codes of Good Practice stipulates that at least 40% of the
available 25 points for ownership should be obtained or the entity’s BEE-level will be
penalised by one level (Schoeman–Louw, 2017).
Also concerning the ownership element, the Codes of Good Practice allows for the
following special conditions (DTI, 2013):
• A QSE with 51% black ownership will automatically qualify a business as a level 2
contributor,
• A QSE that is 100% black-owned will be considered as a level 1 contributor.
Under these special conditions, QSEs do not have to go through the process of being
certified by an authorised accreditation agency and can merely submit an affidavit proving
to the fact that they qualify as a QSE and confirming the percentage ownership. This can
also be viewed as an advantage for compliance, from an administrative and cost
perspective (Werkmans, 2014).
Enterprise and supplier development
Enterprise and supplier development is a new element added to the BEE scorecard, and
mostly represents the combination between what was previously separately known as
enterprise development and preferential procurement. This element measures the extent
to which the business purchases and supports other supplier businesses who are BEE
compliant. This element also measures to which extent entities incentivise supplier
development in the form of growth and the sustainability of black-owned businesses
(Werkmans, 2014).

- 31 -
Enterprise and supplier development are made up of four sub-categories as follows
(Sebati, 2018):
Preferential procurement
Preferential procurement is a national policy set out by the Preferential Procurement Act
(see section 2.3.7). The policy encourages government departments and public entities to
purchase goods and services from BEE empowered businesses.
Supplier diversity
Supplier diversity refers to the process of obtaining products and services from misspent
BEE suppliers. The process assists in the transformation of an entity’s supply chain to
include smaller and underutilised BEE empowered companies.
Supplier development
Supplier development refers to the process of working with BEE empowered suppliers on
a close basis to improve overall performance. The proses should result in improvements to
the total value added by the supplier, which may include improved business practices or
operation management improvements.
Enterprise development
Enterprise development is the process of promoting the economic growth of SMEs. The
process consists of financial and non-financial contributions with the specific objective of
assisting or fast-tracking the development, sustainability and ultimately, the financial
independence of BEE empowered businesses.
Management control
Unlike the ownership element, the management control element measures the effective
control of the business by black people on all management levels from board participation
to employees in junior management (DTI, 2013).
The management control element is aimed at addressing specific vital issues surrounding
black management and control of enterprises such as the representation of black people
at executive board level as well as the involvement of black people in daily operations and

- 32 -
strategic decision making at senior levels (CA Charter, 2018). In the past, companies
would employ black people on a company’s board as a non-executive board member in
order to obtain preferential BEE-levels. The measurement of this element also promotes
the promotion of black employees to more senior management roles.
Skills development
This element relates to the extent to which employers incentivise the internal and external
development and training of employees. Under the 2007 Codes of Good Practice, it was
not compulsory to comply with all the elements of the generic scorecard, but the amended
Codes of Good Practice requires entities to comply with all five elements. Skills
development is one of the priority elements – as mentioned earlier, entities are required to
obtain at least 40% of the minimum target of the priority elements or lose a level on their
BEE scores (DTI, 2013).
Skills development can be considered one of the more straightforward elements with
which to gain points. Entities can earn skills development points by doing the following (i-
fundi, 2017).
• An entity can earn eight points by investing 6% of its annual payroll on training
black people. Before the amendments to the Codes of Good Practice, it used to be
3%;
• An entity can earn four points by investing 0.3% of its total payroll on learning
programmes for disabled, black employees;
• An entity can earn four points by contributing to learnerships, apprenticeships and
internships if 2.5% of its staff is enrolled in such programmes;
• An entity can earn four points if 2.5% of its employees are black unemployed
learners;
• An entity can earn five bonus points if the abovementioned unemployed learners
are gainfully employed at the end of their learnerships.

- 33 -
Skills development compliance also carries an additional tax benefit. The South African
Revenue Service (SARS) offers a tax benefit of R60 000 per participant on a learnership,
which equals a saving of R16 800.00 per learner per year (Barry, 2017).
Socio-economic development
Socio-economic development (SED) contributions include any monetary or non-monetary
contribution implemented for individuals, a group of individuals, or communities, of which
at least 75% of the beneficiaries of the socio-economic activities are black people. These
developments can take many forms of which the following is most common (Van Deventer,
2017).
• Grant contributions;
• Discount offerings on products or professional services;
• Covering overheads or direct costs; and
• Providing professional services at no cost.
As per the amended Codes of Good Practice, entities can earn a maximum of five points
for the socio-economic development element. The type of contribution and benefit factor
percentage can be seen in Table 6.

- 34 -
Table 6: Socio-economic development benefit facto matrix
Qualifying Contribution type Contribution Amount
Benefit Factor
Grant and Related Contributions
Grant Contribution Full Grant Amount 100%
Direct Cost incurred in supporting enterprise development and supplier development
Verifiable cost (including both
monetary and non-monetary)
100%
Discounts in addition to normal business practices supporting enterprise development and supplier development
Discount amount (in addition to normal business discount)
100%
Overhead costs incurred in supporting enterprise development and supplier development (including people appointed in enterprise development and supplier development)
Verifiable costs (including both
monetary and non-monetary)
70%
Contributions made in the form of human resource capacity
Professional services rendered at no cost supporting socioeconomic development, sector-specific initiatives or qualifying socio-economic development contributions
Commercial hourly rate of professional
80%
Professional services rendered at a discount for supporting socio-economic development, sector-specific initiatives or qualifying socio-economic development contributions
Value of discount based on commercial
hourly rate of professional
80%
Time of employees of measured entity productively deployed in assisting beneficiaries and supporting socio-economic development, sector-specific initiatives or qualifying socio-economic development contributions.
Monthly salary divided by 160
80%
Source: (DTI, 2013)
2.4 SME sector in the South African economy
SMEs play a vital role in the South African economy and are considered critical drivers of
economic growth, innovation and job creation. The National Development Plan reports that

- 35 -
the SME sector accounted for 90% of jobs created in South Africa between 1998 and 2005
(National Planning Commission, 2013).
The South African Government’s realisation of the SME sector’s importance in the local
economy led them to establish a new Ministry of Small Business Development in early
2014 (Ingle, 2014). According to the Ministry, the Department’s focus is on providing
enhanced support for small business, with an emphasis on programmes that will advance
entrepreneurship amongst women, the youth, and people with disabilities to contribute to
job creation and economic growth (National Government of South Africa, 2018).
Despite the government’s efforts to support SMEs and in reduce the unemployment rate,
statistics show that South Africa still suffers a significant and increasing unemployment
rate of 27.2% as of the second quarter of 2018 (Statistics South Africa, 2018). The large
unemployment rate issue is further emphasised when taking into account that only 13% of
the South African population or 56 million people contribute to personal income tax. A
significant portion of personal income tax is used to provide grants to the less fortunate
people of South Africa (Business Tech, 2017).
In contrast with the above, according to a 2016/2017 Global Competitiveness
Reportcompiled by the World Economic Forum, South Africa has maintained an upward
trend in its economic competitiveness, climbing two places since 2016 to reach 47th
position out of 138 economies (Schwab, 2017). This could indicate that not all the upward
trend in competitiveness is contributed to SMEs in particular and that SMEs still have
constraints.
One of the major constraints on the SME sector is the fact that 80% of SMEs are resellers
of products, indicating that that South Africa is predominantly a consumption-driven
economy and that there is a direct need to invest in manufacturing and productive skills
(Guliwe, 2018).
The implementation of the government’s BEE policy was intended not only to facilitate and
accelerate the integration and participation of the black African population into the
mainstream economy, but also to encourage black Africans to start businesses (Ingle,
2014). The intent of the BEE policy was therefore to create opportunities for black Africans
to be entrepreneurs.

- 36 -
According to the Global Entrepreneurship Monitor (GEM), 22.9% of total early-stage
entrepreneurial activity (TEA) in 2006 was by opportunity-motivated black Africans
(Herrington et al., 2017). TEA can be defined as the percentage of the 18-64 population
who are either emerging entrepreneurs or owner-managers of a new businesses (World
Bank, 2018). These new or emerging entrepreneurs make up a substantial part of the
SME sector.
The abovementioned statistics do present evidence that the government is meeting its
intentions with regards to the BEE policy and the Codes of Good Practice, but according to
the same report, there has been a decline in TEA by coloured, Indian and white individuals
between 2005 and 2016. TEA in South Africa between 2005 and 2016 can be seen in
Table 7.
Table 7: TEA in South Africa 2005 – 2016, separated according to population group.
Population Group TEA (%) 2005 TEA (%) 2016
Black African 22.9 55.4
Coloured 9.3 4
Indian 6.4 4.6
White 19.3 9.7
(Herrington et al., 2017).
One of the key solutions to South Africa’s significant unemployment rate is suggested to
be to stimulate South Africa’s SME sector growth. The GEM report estimates that 58.7% of
early-stage entrepreneurs in 2016 expected to create between 1 and five jobs within the
next five years and 27.6% are expected to create 6 or more jobs within the next five years.
The report also reports that only 35% of South African adults (aged 18 to 64) in 2016
perceived good entrepreneurial opportunities in their areas of business (Herrington et al.,
2017).
One study conducted on factors that impede SME performance in South Africa suggests
that even though the government has put significant programmes and policies in place to
support SME creation and growth, many entrepreneurs might be incapable of complying
with stringent government regulations with regards to doing business (Ingle, 2014). A

- 37 -
further study also suggests that government and municipalities are not providing sufficient
infrastructure and basic services for SMEs to grow (Mokoena, 2017). Another article
reports that 80% of South African SMEs do not do business with the government due to
late payments even though government BEE policies favour them (Barnes, 2017).
The Small Enterprise Development Agency (SEDA) did a full report on South African
SMEs and identified eight critical challenges that SMEs face in South Africa (SEDA, 2016):
• Access to finance and credit;
• Poor infrastructure;
• Low levels of research and development;
• Onerous labour laws;
• An inadequately educated workforce;
• Inefficient government bureaucracy;
• High crime rates;
• Limited access to markets.
To summarise, South Africa has an increasing unemployment rate, and the South African
government has identified the SME sector as the last hope for reducing unemployment.
The government has set out to implement programmes and policies to promote the SME
sector growth. One of these policies is BEE, which is intended to stimulate business
opportunities between government and SMEs. From studies conducted it is clear that
policies and programmes alone are not sufficient and that government still impedes SME
growth by not being able to provide basic services.
The information provided above emphasises that government is working on solutions but
falling short. Therefore it is suggested that the government policies like BEE be
investigated to determine whether they are accelerating or impeding SME creation and
growth. One factor that might be impacting the success of the BEE policy is the
perceptions that employees of SMEs have about these policies.

- 38 -
2.5 How employee perceptions can influence business
Studies have shown that increased perceptions resulting from a company’s acts of
corporate social responsibility (CSR) can enhance employee commitment to employers,
and improving employee perceptions of CSR should result in positive employee work
attitudes (Valentine & Godkin, 2017).
In South Africa, the implementation of the BEE Act and Codes of Good Practice has
resulted in a significant increase BEE-related CSR actions in that the Codes of Good
Practice suggests that recommend expenditure on socio-economic development (SED) be
1% of the nett profit after tax (Impilo, 2018).
In the South African context, CSR could be used as an umbrella term that encapsulates
SED and corporate social investment (CSI). CSR should indicate that businesses have a
responsibility towards the societies within which they operate and that this responsibility
needs to be managed (Kloppers, 2014).
In a study on the authenticity of CSR activities, the results show that employees who
perceive their employers’ CSR activities as authentic will show greater organisational
identification and effective attachment. This means that these employees will experience a
greater sense of belonging to the organisation and therefore exhibit beneficial traits for the
organisation (Soojung & Jeongkoo, 2018). It can therefore be argued that organisations
involved in fronting practices will have the opposite effect on employees.
Employees also form perceptions about an organisation's human recourse (HR) practices.
The key findings of a study done on this topic have found that it is important to not only
have the right HR practices but the right employee perceptions of those practices. The
study further explains that employees are less engaged when they believed a company’s
HR practices were motivated by a desire to reduce costs and exploit employees (Center
for Advanced Human Resource Studies, 2011). In the BEE context, HR practices might
affect employees in two ways. Employees who benefit from BEE policies regarding the
management control element might have a positive perception of the organisational HR
practices, and the opposite can be assumed for employees who do not benefit. For
instance, one employee might get promoted above another without the promotion being
merit-based because HR is aiming at achieving BEE scorecard targets.

- 39 -
The developing economic environment of South Africa has seen an increased demand in
specific skills, making it more difficult for employers to retain current high-skilled
employees. Creating the desired perceptions among current employees could ensure
better employee retention (Oladipo et al., 2013).
2.6 Summary
SMEs make up 91% of formalised businesses in South Africa, employ about 60% of the
labour force, and the total economic output of South African SMEs accounts for roughly
34% of the GDP. SMEs are therefore one of the most significant contributors to the South
African economy.
To address the inequalities of the past, the South African government has implemented
strategic policies like BEE to increase the number of black people who own, manage,
control and gain employment in the South African economy. The BEE Act came into effect
on 7 January 2004 (DTI, 2003a). The purpose of the Act is to establish a legislative
framework for the promotion of BEE.
The South African government is one of the largest spenders in the country and
companies wanting to do business with government organs should aim to have the
best BEE contribution levels if they want be awarded tenders. For the government
to encourage BEE compliance under SMEs, several policies and legalisation were
introduced.
The first policy instrument that was introduced was the BEE Codes of Good Practice in
2007. Some SMEs, however, have used illegal practices like fronting to obtain BEE
recognition. Fronting practices and other shortcomings of the resulted in the amendment of
the BEE Codes of Good Practice in 2013 and its implementation in 2015. The main
amendments to the act were the establishment a BEE Commission, the introduction of
various criminal offences, and the obligation of government and public entities to apply the
Codes of Good Practice in their procurement policies.
The second policy instrument introduced was the Preferential Procurement Framework Act
in 2000. This Act guides governments and private entities in calculating the points for price
and categories of preference when SMEs or other entities submit tenders to government

- 40 -
or private entities. The Preferential Procurement Act provides a scoring system in which an
entity’s BEE contribution level makes up 20% of the points that can be awarded. An
entity’s BEE contribution level is calculated using the generic BEE scorecard.
The original generic scorecard consisted of seven elements, but the amended BEE
scorecard focuses on only five elements, with three elements being prioritised. The
scorecard elements consist of ownership, management control, skills development, new
enterprise and supplier development, and socio-economic development, with the first three
being priority elements. The latest Codes of Good Practice Act requires entities to achieve
a minimum of 40% of at least two of the three priority elements. Should an entity not meet
the minimum requirement, their BEE level will be penalised by one level on their
scorecard. The contribution levels are calculated per element, and a resulting BEE-level is
awarded between 1 and 8, of which 1 is the most desirable.
This study focuses on the perceptions employees have about the BEE legislation. Studies
show that there is a strong correlation between the perceptions formed by employees
about their entities and their commitment to their employers and improving employee
perceptions of CSR and HR practices should result in positive employee work attitudes.

- 41 -
Chapter 3: Results and discussion
3.1 Introduction
This empirical study focuses on BEE legislation and its perceived impact on SMEs in
South Africa by employees.
This chapter describes the compilation of the questionnaire, the target population, the data
collection, and the results obtained from the analysed information. These conclusions from
the results are then discussed in Chapter 4.
3.2 Research ethics
Due to the sensitive nature of race-based topics in South Africa, it is important to
guarantee respondent anonymity. The questionnaire was therefore constructed in such a
manner that respondents were unidentifiable from their correspondence and the platforms
from which data was gathered. All respondents were informed of the purpose of the study
as well the fact that the survey is entirely voluntary.
The questionnaire was accompanied by a research proposal and submitted to the North-
West University’s Ethics Committee for approval. This committee ensures that there are no
ethical transgressions in the study and questionnaire.
3.3 Questionnaire design
The questionnaire was designed to address specific aspects relating to BEE and SMEs.
The questionnaire design also ensures that data which does not comply with the study
parameters can be subtracted from the valid data. The questionnaire was divided into
three sections, each addressing various aspects. The sections and layout of the
questionnaire can be seen in Table 8.

- 42 -
Table 8: Questionnaire layout and sections.
Section Description of Section
Section A
Demographic information: This section gathered
data about respondent demographics as well as the
enterprises they are employed at. This assists in
controlling data collection limited to valid
respondents that fit the target population of this
study.
Section B
Awareness of BEE: This section focused on the
knowledge of respondents about BEE. Since this
study focuses on the perceptions of BEE, it was in
the interest of the study to disregard information
from respondents with no knowledge of BEE.
Section C
Advantages and disadvantages of BEE to the
business: This section focused on the perceived
positive and negative impacts of BEE on the
employee's workplace. This section combined with
the previous sections aims to answer the research
questions posed.
3.4 Study population and sample size
The study population and sample focus is on employees of SMEs, and therefore the
number of respondents was not restricted. Due to the sensitive nature of the subject in the
South African context, the author acknowledged that respondents may seem hesitant to
respond and therefore the study was conducted on a self-administered basis without the
presence of the researcher. The absence of the researcher was helpful in that it enabled
respondents to complete the questionnaire in private where they could devote as much
time as they wished on its completion. This was helpful because respondents might not
have wanted to spend excessive time on completing the survey. This method also helped
avoid feeling of intimidation or obligation to participate potentially resulting from the

- 43 -
researcher's presence. A further benefit of this method is that it is inexpensive and is more
anonymous than having the researcher present (Cohen et al., 2011).
During the data collection period, a target population of 164 respondents were obtained.
Not all the respondent data qualified respondents as employees of SMEs. The respondent
data of owners or part-owners were removed from the dataset as well as data obtained
from employees who were employed by an entity with more than 200 permanent
employees. The abovementioned respondent data did not qualify respondents as
employees of SMEs. The resulting 116 respondents’ data was then used as the study
population for this study and for data analysis. The respondent summary can be seen in
Table 9 below.
Table 9: Total respondents and the resulting study population
Respondent Summary
Qualifying respondents 48
Non-qualifying respondents 116
Total respondents 164
3.5 Demographic information
This section describes the demographic information of the study population and gives the
reader a better understanding of the participating respondents in this study. This section
furthermore represents a part of Section A of the questionnaire.
3.5.1 Genders of the study population
The purpose of this question is to indicate the gender profile of the respondents of the
study population. The results are represented in
Figure 4 below.

- 44 -
Figure 4: Gender distributions of the study population
Figure 4 it is evident that 46% of the study population is male and 52% female. The results
also indicate that 2% of respondents preferred not to disclose their genders. Respondents
were given this option to further emphasise the anonymity of the study and to encourage
further participation in the study without fear of being identified from the information they
provided. The results indicate a good representation from both genders which reduces the
risk of gender bias in the results.
3.5.2 Age distribution of the study population
The purpose of this question is to generate a view of the respondent age distribution in the
study population. The results are presented in Figure 5 below. This section is also used
later as a construct to determine whether there are differences between the perceptions of
different age groups.

- 45 -
Figure 5: Age distribution of the study population
Figure 5 illustrates how most of the study population falls within the category between 19
and 39 years of age, with 45% of respondents belonging to the 19 to 29 age group and
32% belonging to the 30 to 39 age group.
The 19 to 29 age group represents employees who entered the job market at a time when
BEE legislation and the most recently amended Codes of Good Practice had already been
implemented for businesses in South Africa. The 30 to 39 age group represents a mixture
of employees who entered the job market before the 2003 BEE legislation had been
introduced and employees who entered the job market while the BEE legislation and the
Codes of Good Practice were being implemented and amended.
The remaining respondents of the study population were part of the 40 to 60+ age group.
Ten percent (10%) of the respondents belong to the 40 to 49 age group, 10% of the
respondents belong to the 51 to 59 age group, and only 3% of respondents are older than
60 years and still employed. The age group 40 to 60+ represents employees who entered
the job market long before any BEE legislation had been introduced.

- 46 -
3.5.3 Level of education of the study population
The purpose of this question was to detemine the level of education of the respondents in
the study population. The results are represented in Figure 6.
Figure 6: Level of education of the study population
Figure 6 illustrates that 69% of the study population has some form of tertiary education,
28% of the study population has completed matric and only 3% of employees have no
formal education. From this it is clear that the majority of the study population is well-
educated and these employees can be assumed to hold more senior positions at the
entities that employ them.
Of the 69% of the study population with a tertiary education, Figure 6 indicates that 12% of
the respondents have a diploma or equivalent, 34% have a bachelor’s degree, 19% have a
master’s degree, and 4% of the study population holds a doctoral degree.
3.5.4 Employment level of the study population
The purpose of this question is to determine the level of education of the respondents in
the study population. The results are represented in Figure 7.

- 47 -
Figure 7: Employment level distribution of the study population
Figure 7 indicates that 27% of the study population consists of general workers, 20% are
specialists in their fields of work, 12% are in junior management, 15% are in mid-level
management, and 26% are in senior management. Figure 7 shows that 53% of
respondents are in some level of management role. This will also provide greater insight
on the perceptions of managers of SMEs and the role that the management control
element of the BEE scorecard may play in SMEs.
3.6 Information about the SMEs that employ the study population
This section describes the demographic information of the entities the study population is
employed at and gives reader a better understanding of these entities. This section further
represents part of Section A of the questionnaire.
3.6.1 SMEs sizes and number of employees
The purpose of this question is to get a clear understanding of the sizes of the SMEs that
employ the respondents in this study. The results are represented in Figure 8.

- 48 -
Figure 8: Number of employees employed by SMEs size
Figure 8 shows that 34% of SMEs have between one and nine employees, 26% of SMEs
have between 10 and 19 employees, 22% of SMEs have between 20 and 49 employees,
15% of SMEs have between 50 and 99 employees and 3% have between a 100 and 199
employees. Furthermore, 60% of the SMEs are very small businesses, 22% are small
businesses, and 18% are medium-sized businesses.
The data shows that an overwhelming amount of the respondents who participated in this
study are employed by very small businesses. This was considered when interpreting the
perceptions of the employees in addition to medium-sized businesses not being well-
represented in the study population.
3.6.2 BEE compliance level of the SMEs
The purpose of this question was to genrate a clear profile of the BEE compliance levels of
the various SMEs in the population. This section is also used later to determine whether
there are differences between the perceptions of employees employed by entities with
different BEE compliance levels. The results are represented in Figure 9.

- 49 -
Figure 9: BEE compliance level of the SMEs by which the study population is
employed at
Figure 9 indicates that 20% of SMEs are BEE-level 1 compliant, 15% of SMEs are BEE-
level 2 compliant, 8% of SMEs are BEE-level 3 compliant, 21% of SMEs are BEE-level 4
compliant, 5% of SMEs are BEE-level 5 compliant, 3% of SMEs are BEE-level 6
compliant, 1% of SMEs are BEE-level 7 compliant, 1% of SMEs are BEE-level 8
compliant, and 26% of SMEs are not compliant with BEE legislation.
The information from Figure 9 shows that four levels of compliance are more prevalent
than the others. It cannot be concluded with certainty how these entities’ BEE-levels were
calculated, but from the information in section two some speculative conclusions can be
drawn. Entities with level-1 compliance suggest that the 20% of SMEs are 100% black-
owned. The entities with level-2 compliance suggest that 15% of SMEs have at least 51%
black ownership. The entities with level-4 compliance suggest that 21% of SMEs do not
necessarily have black ownership, but that these entities have a turnover of less than
R10 million and therefore only have to complete an affidavit stating their annual turnover,
which then qualifies them as level-4 compliant. The SMEs with no BEE compliance
indicate that these enterprises are operating in markets where BEE compliance is not
compulsory or that the non-compliant entities have customer bases that do not require
BEE compliance for doing business.

- 50 -
3.7 The general perception employees of SMEs have about BEE
The purpose of this question is to get a general sense of employee perceptions about BEE
before looking at the individual aspects of BEE. This corresponds with the last question of
section A of the questionnaire. The results are represented in Figure 10.
Figure 10: The study population’s general perception about BEE
Figure 10 indicates that the majority (45%) of the respondents who participated in this
study have a generally negative perception about BEE. However, the information also
shows that 33% of the study population has a generally positive perception about BEE,
19% of the study population has no opinion about BEE, and 3% of the study population is
unsure about whether they perceive BEE to be positive or negative.
Figure 10 indicates that there is a good representation of both negative and positive
general perceptions with a slight bias to the negative end. The fact that 19% of
respondents have no opinion about BEE can be explained by the 26% of SMEs in Figure 9
that are BEE non-compliant companies, which suggests that BEE does not influence either
the company they are employed at or the employees personally. This was considered in
the analysis of section C of the questionnaire, as the respondents who had no opinion
about BEE would have had to form an opinion on each question of Section C to complete
the survey.
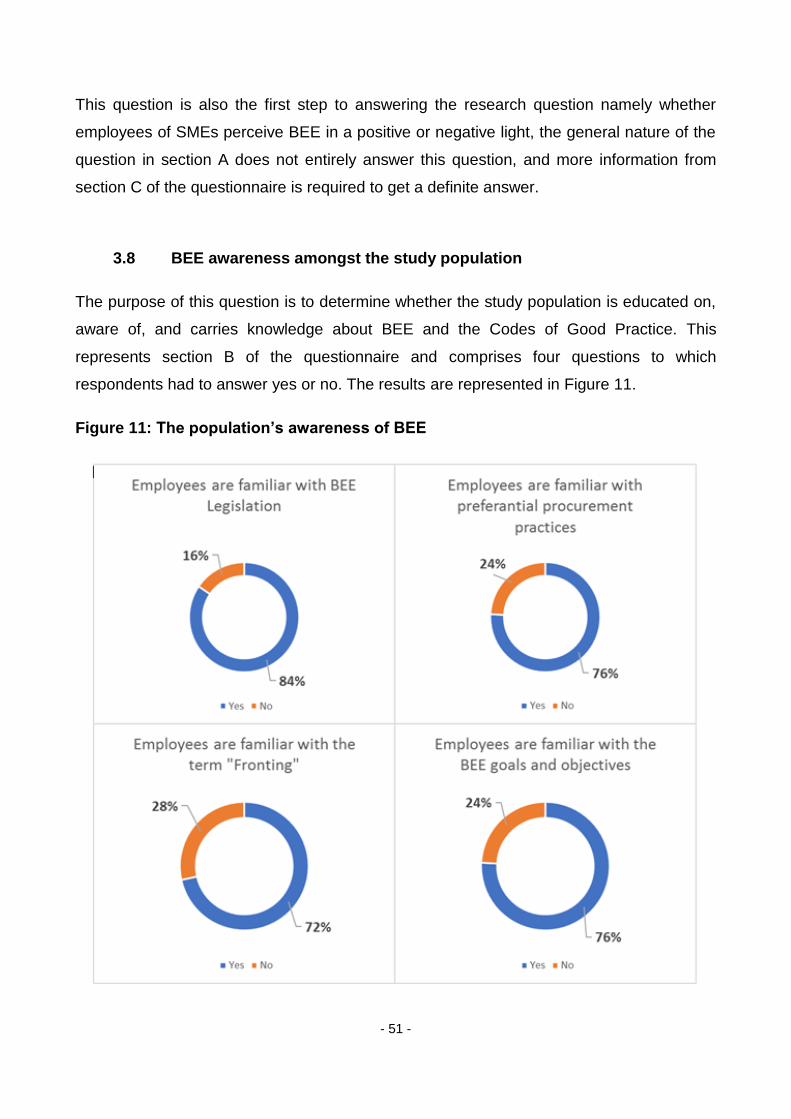
- 51 -
This question is also the first step to answering the research question namely whether
employees of SMEs perceive BEE in a positive or negative light, the general nature of the
question in section A does not entirely answer this question, and more information from
section C of the questionnaire is required to get a definite answer.
3.8 BEE awareness amongst the study population
The purpose of this question is to determine whether the study population is educated on,
aware of, and carries knowledge about BEE and the Codes of Good Practice. This
represents section B of the questionnaire and comprises four questions to which
respondents had to answer yes or no. The results are represented in Figure 11.
Figure 11: The population’s awareness of BEE

- 52 -
Figure 11 indicates that 84% of the study population is familiar with BEE legislation and
16% does not consider themselves familiar with the BEE legislation. Of all the respondents
in the study population, 76% indicated that they are familiar with the preferential
procurement practices. The information further shows that 72% of the study population is
familiar with the term fronting and that 76% of respondents are familiar with the set goals
and objectives of the BEE legislation. Overall, the study population indicated an average of
77% familiarity with the BEE legislation and its accompanying terms and practices, which
suggests that the study population is informed and can add value to the study.
3.9 The perceived impact of BEE on SMEs and their employees
This goal of this section is to measure the perceived advantages and disadvantages of
BEE overall and to look at specific advantages and disadvantages for the SMEs and their
employees separately. This section represents section C of the questionnaire.
The data was captured and statistically analysed by the North-West University’s Statistical
Consultation Services using computer software called SAS (SAS Institute Inc, 2017). The
arithmetic mean (x̅) was used to interpret the results. The results also have sub-constructs
for which the Cronbach’s alpha reliability coefficients were calculated to determine the
reliability of the constructs.
The questionnaire is based on a four-point scale (where 1 = strongly disagree and 4 =
strongly agree). An arithmetic mean for each question or construct with a value closer to 1
indicates that the study population strongly disagrees with the statement and an arithmetic
mean for each question or construct closer to 4 indicates that the study population strongly
agrees with the statement. For the interpretation of the results of this study, an arithmetic
mean value of lower than 2 indicates a disagreement to the statement by the study
population, while a value between 2 and 3 indicates that participants neither agree nor
disagree with the statement made. An arithmetic mean value larger than 3 indicates an
agreement with the statement made.
The questionnaire also has five sub-constructs comprise several questions within section
C of the questionnaire. The compilation of questions of each sub-construct can be seen in
Table 10.

- 53 -
Table 10: Question compilation for constructs
Construct Questions
Benefits of BEE for SMEs C1, C2, C4, C5, C6, C9, C10, C11
Benefits of BEE for employees of SMEs C3, C7, C8, C12, C13, C14, C15
Disadvantages for efficiency and reliability for SMEs C19, C21, C22, C23, C24, C25
Economic disadvantages for SMEs C17, C18, C26, C27
Perceived fundamental disadvantages of BEE C16, C20
To determine the reliability of the constructs, the Cronbach’s alpha value was calculated.
The Cronbach’s alpha value indicates the internal consistency of the construct (Field,
2009). The guidelines for interpreting Cronbach’s alpha value can be seen in Table 11.
Table 11: Cronbach’s alpha internal consistency
Cronbach's α Internal consistency
α ≥ 0.9 Excellent
0.9 > α ≥ 0.8 Good
0.8 > α ≥ 0.7 Acceptable
0.7 > α ≥ 0.6 Questionable
0.6 > α ≥ 0.5 Poor
0.5 > α Unacceptable
Similar to the Cronbach’s alpha calculation analysis, the practical significance of the
associations between the five constructs was analysed using Cohen’s correlation
coefficients (Φ). The guidelines used to analyse phi-values can be seen in Table 12
(Gignac & Szodorai, 2016). Some of the demographic information from section A of the
questionnaire was used to interpret and evaluate Cohen’s effect sizes for different
constructs.

- 54 -
Table 12: Cohen’s phi-value for effect sizes (Gignac & Szodorai, 2016)
phi-value Effect size
Φ = | 0.1 | Small effect
Φ = | 0.3 | Medium effect noticeable with the naked eye
Φ = | 0.5 | Large effect or practically significant
Lastly followed the interpretations of the practical significance of the five main constructs.
According to Gignac and Szodorai (2016), the guidelines for practical interpretation of the
strength of correlation coefficients are the same as those for the phi-coefficient and the
guidelines in Table 13 can be used.
Table 13: Pearson correlation coefficients effect sizes
r-value Effect size
r = | 0.2 | Small effect
r = | 0.5 | Medium effect noticeable with the naked eye
r = | 0.8 | Large effect or practically significant
3.9.1 Perceived advantages of BEE on SMEs
The goal of this section is to determine whether there is any BEE legislation that holds any
perceived benefit for SMEs, and it focuses on the entities that employ the respondents.
The next section discusses the perceived advantages of BEE for employees. Construct 1
therefore represents the perceived advantages of BEE for SMEs. The mean, standard
deviation, and Cronbach’s alpha values for this construct can be seen in Table 14.

- 55 -
Table 14: Construct 1 - Advantages of BEE for SMEs mean and Cronbach’s alpha
values
Construct 1 x̅ σ
Cronbach α
Advantages of BEE for SMEs
0.96 0.94
From Table 14 it is evident that this construct has a Cronbach’s alpha value of 0.94, which
indicates excellent internal consistency and that the construct is reliable. The mean value
for this construct is 2.5, which indicates that the study population has a neutral perception
of the statements made in this construct.
The questions used to compile construct 1, the resulting means, and standard deviations
can be seen in Table 15 below.
Table 15: Perceived advantages of BEE on SMEs mean and standard deviation
# Statement x̅ σ
C1 BEE creates new possibilities for the company I'm employed at in terms of business networks and new associates. 2.44 1.10
C2 The company I'm employed at has been more successful by complying with BEE legislation. 2.34 1.20
C4 The company I'm employed at has seen an increase in annual turnover since the implementation of BEE. 2.18 1.13
C5 BEE resulted in the acquisition of new customers for the company I'm employed at. 2.51 1.12
C6 Our company is continuously striving to better our BEE-level. 2.73 1.13
C9 BEE makes it possible for the company I'm employed at to be more competitive in the market. 2.56 1.15
C10 BEE makes it possible for the company I'm employed at to compete in new unexplored markets. 2.59 1.16

- 56 -
C11
BEE compliance makes it possible for the company I'm employed at to rapidly expand its business operations and grow faster than without BEE compliance. 2.51 1.18
All the questions in this section have mean scores of between 2 and 3, which confirms that
the study population has a neutral perception about the advantages of BEE for SMEs. This
neutrality of the result may be contributed to the facts that 36% of the SMEs represented in
this study have a BEE-level 5 or weaker and that 45% of the study population has a
generally negative perception of BEE, which would indicate that entities with a good BEE-
level enjoy more benefits from the implementation of BEE.
Question C4 has a mean of 2.18, which indicates that the study population leans slightly
more to disagree with the statement that the companies they are employed at has seen an
increase in annual turnover since the implementation of BEE. This result could be
contributed to the fact that 26% of the study population’s entities of employment are not
BEE compliant, and a further 10% are BEE-level 5 contributors and higher (Figure 9). It
can be deduced that the better the BEE-level of a company is, the better their chances are
of being awarded tenders, and level-4 contributors also have a better chance at being
awarded tenders.
Question C6 has a mean of 2.73, which indicates that the study population leans slightly
more to agree with the statement that the companies they are employed at are
continuously striving to better their BEE-levels. For the same reasons provided for
question C4 above, it can be assumed that companies are looking to better their BEE-
levels to get more work.
The resulting mean for questions C4 and C6 slightly deviates from the neutral position,
and therefore no definite answer is prevalent. This also contributes to answering two
research questions, the first being whether BEE holds any perceived advantages or
disadvantages for SMEs, and the second being whether BEE has had a positive or
negative impact on SMEs. This section indicates that that employees of SMEs do not
perceive BEE as having neither a negative impact on SMEs nor a positive impact.
Employees also have a neutral perception with regards to BEE having advantages for
SMEs.

- 57 -
3.9.2 Perceived advantages of BEE for employees of SMEs.
The goal of this section is to determine whether there are any perceived benefits of BEE
legislation for employees of SMEs. This section focuses on the employees of SMEs and
the perceived benefits for them. Construct 2 therefore represents the perceived
advantages of BEE for employees of SMEs. The mean, standard deviation, and
Cronbach’s alpha values for this construct can be seen in Table 16.
Table 16: Construct 2 - Advantages of BEE for employees of SMEs mean and
Cronbach’s alpha analysis
Construct 2
x̅ σ
Cronbach α
Advantages of BEE for employees of SMEs
0.92 0.93
From Table 15 is evident that this construct has a Cronbach’s alpha value of 0.93, which
indicates excellent internal consistency and that the construct is reliable. The mean value
for this construct is 2.3, which indicates that the study population has a neutral perception
of the statements made in this construct.
The questions used to compile construct 2, the resulting means, and standard deviations
can be seen in Table 17.
Table 17: Benefits of BEE for employees of SMEs mean and standard deviation
# Statement x̅ σ
C3 In general employees are better off in terms of skills and rank in the business since the implementation of BEE. 2.28 1.14
C7 BEE has directly resulted in better skilled workers in the company I'm employed at. 1.89 0.98
C8 BEE has helped the company I'm employed at to achieve its social responsibility towards the local community. 2.28 1.09

- 58 -
C12 BEE has led to more effective management of the company I'm employed at. 1.85 1.05
C13 BEE has created more jobs at the company I'm employed at. 2.18 1.12
C14 I have benefited because the company I'm employed at complies with BEE legislation. 1.86 1.11
C15 I feel positive about the company I'm employed at because it complies with BEE legislation. 2.37 1.17
The questions in this section have various mean values and is therefore discussed below.
Questions C3, C8, C13 and C15 have mean values of between 2 and 3, which indicates
that the study population has a neutral perception about the advantages of BEE for
employees of SMEs. The mean values of these questions also lean slightly more to 2,
which indicates that the study population tends to disagree with the statement that there
are perceived benefits for employees of SMEs because of BEE.
Question C3 (x̅ = 2.28) indicates that the study population leans slightly more to disagree
with the statement that in general employees are better off in terms of skills and rank in the
business since the implementation of BEE.
Question C8 (x̅ = 2.28) indicates that the study population leans slightly more to disagree
with the statement that BEE has helped the companies they are employed at to achieve
their social responsibilities towards the local community. This also helps answer one of the
research questions namely whether employees perceive the mandates and goals of BEE
as being met. The resulting mean indicates that employees have a neutral perception
about the entities they are employed at meeting their social responsibilities towards the
local community, which is one of the goals of BEE legislation.
Question C13 (x̅ = 2.18) indicates that study population leans slightly more to disagree
with the statement that BEE has created more jobs at the companies they are employed
at. Job creation is another goal of the BEE legislation and the results indicate that
employees have a neutral perception with regards to job creation because of BEE, but the
mean leans slightly more to disagreement.

- 59 -
Questions C7, C12 and C14 have mean values of between 1 and 2, which indicate that the
study population disagrees with the statements made in these questions.
Question C7 (x̅ = 1.89) indicates that the study population disagrees with the statement
that BEE has directly resulted in better-skilled workers in the company they are employed
at. This indicates that the study population does not perceive the skills development
element of the BEE scorecard as having resulted in better-skilled workers at SMEs.
Question C12 (x̅ = 1.85) indicates that the study population disagrees with the statement
that BEE has led to more effective management of the companies they are employed at.
This may be contributed to owners SMEs demoting or retrenching high-skilled managers in
to assign other managers to those positions to obtain a better score for the management
control element of the BEE scorecard.
Questions C7 and C12 contribute to answering the research question namely whether
employees perceive the mandates and goals of BEE as being met, and the results indicate
a negative perception.
Question C14 (x̅ = 1.86) indicates that the study population disagrees with the statement
that they have benefited because the companies they are employed at comply with BEE
legislation. This helps answer the research question as to whether there are perceived
benefits for employees of SMEs because of BEE, and the results indicate a negative
perception.
3.9.3 Disadvantages for efficiency and reliability for SMEs
The goal of this section is to determine whether there are any perceived disadvantages of
BEE legislation to SMEs. This section focuses on efficiency and reliability in the daily
operations of SMEs. Construct 3 therefore represents the perceived disadvantages of BEE
for SMEs regarding efficiency and reliability. The mean, standard deviation, and
Cronbach’s alpha values for this construct can be seen in Table 18.

- 60 -
Table 18: Construct 3 - Disadvantages for efficiency and reliability for SMEs mean
and Cronbach’s alpha values
Construct 3 x̅ σ
Cronbach α
Disadvantages for efficiency and reliability for SMEs
0.86 0.89
From Table 18 is evident that this construct has a Cronbach’s alpha value of 0.89, which
indicates good internal consistency and that the construct is reliable. The mean value for
this construct is 2.6, which indicates that the study population has a neutral perception of
the statements made in this construct.
The questions used to compile construct 3, the resulting means, and standard deviations
can be seen in Table 19.
Table 19: Disadvantages for efficiency and reliability for SMEs mean and standard
deviation
# Statement x̅ σ
C19
Implementing the Codes of Good Practice on BEE could result in a loss of focus on business matters and therefore could have a hampering effect on the company I'm employed at. 2.54 1.12
C21 The skills development aspect of BEE leads to a loss in productivity as workers need to attend courses or training. 2.40 1.05
C22 BEE has negatively impacted the company culture at the company I'm employed at. 2.21 1.14
C23
BEE has resulted in the company I'm employed at employing incompetent or undertrained people just for the sake of empowerment. 2.49 1.18
C24
Preferential procurement practices might force the company I'm employed at to buy from new suppliers, resulting in potential risks in terms of reliability. 2.82 0.98

- 61 -
C25
Established relationships with current suppliers will be at risk once the company I'm employed at has to buy from empowered suppliers. 2.86 0.98
All the questions in this section have mean scores of between 2 and 3, which confirm that
the study population has a neutral perception about the disadvantages of BEE for SMEs
regarding efficiency and reliability.
Question C22 (x̅ = 2.21) indicates that the study population leans slightly more to disagree
with the statement that BEE has negatively impacted the company culture at the
companies they are employed at. Despite the fact that the mean indicates a neutral
perception, it can be interpreted as positive in light of the study population leaning slightly
more to disagree with the statement.
Question C24 (x̅ = 2.82) indicates that the study population leans slightly more to agree
with the statement that preferential procurement practices might force the companies they
are employed at to buy from new suppliers thereby resulting in potential risks for reliability.
This indicates that the study population identifies the risk of dealing with new suppliers.
Question C25 (x̅ = 2.82) indicates that the study population leans slightly more to agree
with the statement that established relationships with current suppliers will be at risk once
the companies they are employed at have to buy from empowered suppliers. This
indicates that suppliers of the entities the study population is employed at are not BEE
compliant.
Questions 24 and 25 help answer the question of whether BEE has a positive or negative
impact on SMEs. The results show a neutral perception leaning towards the negative.
3.9.4 Economic disadvantages for SMEs
The goal of this section is to determine whether there are any perceived economic
disadvantages for SMEs from BEE legislation. Construct 4 therefore represents the
perceived economic disadvantages of BEE for SMEs. The mean, standard deviation, and
Cronbach’s alpha values for this construct can be seen in Table 20.

- 62 -
Table 20: Construct 4 - Economic disadvantages for SMEs mean and Cronbach’s
alpha values
Construct 4 x̅ σ
Cronbach α
Economic disadvantages for SMEs
0.82 0.74
From Table 20 it is evident that this construct has a Cronbach’s alpha value of 0.74, which
indicates acceptable internal consistency and that the construct is reliable. The mean
value for this construct is 1.9, which indicates that the study population disagrees with the
statements made in this construct.
The questions used to compile construct 4, the resulting means, and standard deviations
can be seen in Table 21.
Table 21: Economic disadvantages for SMEs mean and standard deviation.
# Statement x̅ σ
C17 The company I'm employed at has lost work which can be directly linked to BEE legislation. 2.37 1.28
C18 BEE has caused job losses in the company I'm employed at. 1.55 0.91
C26 I feel negative towards my job due to the BEE-level of the company I'm employed at. 1.80 1.02
C27 BEE legislation has resulted in corrupt or illegal practices at the company I'm employed at. 1.94 1.12
All the questions except for question C17 in this construct have mean scores of between 1
and 2, which confirm that the study population disagrees with the statements made in this
construct regarding the economic disadvantages of BEE for SMEs.
Question C17 (x̅ = 2.37) indicates that the study population has a neutral perception about
the statement that the companies they are employed at have lost work that is directly

- 63 -
linked to BEE legislation. The mean value of 2.37 however also indicates that the study
population leans slightly more to agree with the statement.
Question C18 (x̅ = 1.55) indicates that the study population disagrees with the statement
that BEE has caused job losses in the companies they are employed at. This can therefore
be considered as a positive perception of BEE for employees and SMEs.
Question C26 (x̅ = 1.80) indicates that the study population disagrees with the statement
that they feel negative towards their jobs due to the BEE-level of the companies they are
employed at. This can therefore be interpreted as a positive perception of BEE for
employees of SMEs.
Question C26 (x̅ = 1.94) indicates that the study population disagrees with the statement
that BEE legislation has resulted in corrupt or illegal practices at the companies they are
employed at. This can therefore be regarded as a positive perception of BEE for SMEs as
well as for BEE legislation in general. The mean value of 1.94 indicates that illegal
practices like fronting is less prevalent in the SMEs the employ the study population.
3.9.5 Perceived fundamental disadvantages of BEE
The goal of this section is to determine whether there are any perceived fundamental
disadvantages of the BEE legislation. Construct 5 therefore represents the perceived
fundamental disadvantages of BEE for SMEs. The mean, standard deviation, and
Cronbach’s alpha values for this construct can be seen in Table 22.
Table 22: Construct 5 - Fundamental disadvantages of BEE mean and Cronbach’s
alpha values
Construct 5 x̅ σ
Cronbach α
Fundamental disadvantages of BEE
0.91 0.54

- 64 -
From Table 20 it is evident that this construct has a Cronbach’s alpha value of 0.54, which
indicates poor internal consistency. The mean value for this construct is 2.4, which shows
that the study population has a neutral perception of the statements made in this construct.
Due to the poor internal consistency of this construct, the questions are investigated
separately.
The questions used to compile construct 5, the resulting means, and standard deviations
can be seen in Table 23.
Table 23: Fundamental disadvantages of BEE mean and standard deviation.
# Statement x̅ σ
C16 Complying with BEE is not a priority for the company I'm employed at. 2.07 1.16
C20 Implementing BEE is time consuming and a financial burden on the company I'm employed at. 2.77 1.05
Question C16 (x̅ = 2.07) indicates that the study population has a neutral perception of the
statement that complying with BEE is not a priority for the company they are employed at.
The mean value of 2.07 indicates that the study population leans slightly more to disagree
with the statement. This result can be viewed as a slightly positive perception for BEE as it
indicates that complying with BEE legislation is becoming more important for SMEs.
Question C20 (x̅ = 2.77) indicates that the study population has a neutral perception about
the statement that implementing BEE is time consuming and a financial burden on the
company they are employed at. The mean value of 2.77 indicates that the study population
leans slightly more to agree with the statement. This result can therefore be viewed as a
slightly negative perception for BEE as it indicates that complying with BEE places
additional strain on SMEs with regarding time consumption and finances.
3.9.6 Construct correlations
Cohen’s correlation coefficients were used to determine whether there is any correlation
between the five constructs discussed above. The guide for interpreting the correlations
and effect sizes were used as described in section 3.9. The Pearson correlation values (Φ)
between the constructs are depicted in Table 24.

- 65 -
Table 24: Cohen’s correlation coefficient (Φ) effect sizes between constructs
Advantages of BEE for SMEs
Advantages of BEE for employees of SMEs
Disadvantages to efficiency and reliability for SMEs
Economic disadvantages for SMEs
Fundamental disadvantages of BEE
Advantages of BEE for SMEs
1.0 0.8 -0.3 -0.2 -0.2
Advantages of BEE for employees of SMEs
0.8 1.0 -0.2 -0.1 -0.1
Disadvantages to efficiency and reliability for SMEs
-0.3 -0.2 1.0 0.6 0.6
Economic disadvantages for SMEs
-0.2 -0.1 0.6 1.0 0.4
Fundamental disadvantages of BEE
-0.2 -0.1 0.6 0.4 1.0
Table 24 reveals a large linear effect of practical significance between constructs 1 and 2
with a coefficient value of 0.8. This means that there is a direct linear relationship between
the advantages of BEE for SMEs and the advantages of BEE for employees of SMEs. The
large effect size can be interpreted as SMEs realising the advantages that BEE legislation
can offer and so their employees, and vice versa.
Both construct 1 and construct 2 resulted in a neutral perception of the advantages of BEE
for SMEs and their employees and can therefore not be considered either positive or
negative. This result could indicate that some SMEs are enjoying advantages from being
BEE compliant while others are not. This result could also be contributed to the fact that
26% of the study population’s entities are not BEE compliant, and a further 10% are BEE-
level 5 contributors and higher (Figure 9).
Table 24 also indicates that a medium inverse effect is noticeable with the naked eye
between construct 1 and construct 3, with an absolute coefficient value of 0.3. This result

- 66 -
indicates that the more advantages SMEs realise from the BEE legislation, the fewer
disadvantages they experience with regards to efficiency and reliability.
Both construct 1 and construct 3 resulted in a neutral perception regarding the advantages
and disadvantages of BEE for SMEs and can therefore not be considered as either
positive or negative. This result could, however, be interpreted as a positive outlook on
BEE legislation as it indicates that the more advantages an SME realises from BEE, the
fewer disadvantages they will experience regarding efficiency and reliability. Even though
the effect size can only be considered a medium effect, it could serve as a motivator for
SMEs to improve their BEE ratings to enjoy more advantages from implementing BEE.
Table 24 indicates that there is a large linear effect of practical significance between
constructs 3 and 4 with a coefficient value of 0.6. This means that there is a direct linear
relationship between the disadvantages for efficiency and reliability for SMEs and the
economic disadvantages for SMEs with regards to the BEE legislation. This result
indicates that when SMEs experience disadvantages for efficiency and reliability because
of the BEE legislation, they also experience economic disadvantages.
Construct 3 resulted in a neutral perception of BEE but construct 4 indicated that the study
population disagreed with the statements made in construct 4, which can be interpreted as
a positive perception about BEE.
Table 24 illustrates a large linear effect of practical significance between constructs 3 and
5 with a coefficient value of 0.6. This means that there is a direct linear relationship
between the disadvantages for efficiency and reliability for SMEs and the fundamental
disadvantages of BEE. Due to the poor internal consistency of construct 5 (α=0.54) this
effect size will not be interpreted further. The same conclusion is made for the effect size
between construct 4 and construct 5, which indicated a medium linear effect that is
noticeable with the naked eye between construct 4 and construct 5 with an absolute
coefficient value of 0.4.
3.9.7 Demographic construct effect sizes
The purpose of this section was to evaluate whether there is any correlation between
some of the demographic information obtained in Section A of the questionnaire and the
constructs created from the questions in section C of the questionnaire.

- 67 -
The first construct was created to determine whether there are any differences in
perceptions between three age groups. The first group is made up of respondents
between 19 and 29 years of age. The 19 to 29 age group represents employees who
entered the job market at a time when BEE legislation and the most recent amended
Codes of Good Practice had already been implemented in businesses in South Africa.
The second age group consists of respondents between 30 and 39 years of age. The 30 to
39 age group represents a mixture of employees who entered the job market before the
2003 BEE legislation had been introduced as well as employees who entered the job
market when the BEE legislation and Codes of Good Practice had been implemented and
amended.
The third age group is made up of respondents between 40 and 60+ years of age. The
age group 40 to 60+ represents employees who entered the job market long before any
BEE legislation had been introduced.
The Pearson correlation coefficients (r) were calculated between each age group and the
guide by which they were interpreted was used as set out in section 3.9. The resulting
effect size can be seen in Table 25.
Table 25: Pearson correlation coefficients between age groups
Benefits of BEE for SMEs
Benefits of BEE for employees of SMEs
Disadvantages for efficiency and reliability for SMEs
Economic disadvantages for SMEs
Perceived fundamental disadvantages of BEE
Age group 1 & 2 -0.31 -0.04 0.15 0.09 0.04
Age group 1 & 3 0 0.09 0.08 -0.03 -0.39
Age group 2 & 3 0.32 0.12 -0.08 -0.12 -0.43
From Table 25 it can be concluded that there is no correlating perceptions between the
selected age groups and not a single effect size having a value larger than 0.2. This result
is worthy of noting because these age groups entered the job market at different stages of
BEE. This result indicates that there is a difference in perception between the employee

- 68 -
age groups who entered the job market at various stages of the BEE implementation and
who consequently have different perceptions about the constructs in this study.
The second construct was created to determine whether there are any differences of
perceptions between respondents employed at SMEs with varying BEE contribution levels.
The entities with level-1 and level-2 compliance represent BEE-level group 1 for this
construct and suggests that these SMEs are 100% and 51% black-owned respectively.
The entities with level-3 compliance and higher represent BEE-level 2 for this construct.
This group represents SMEs that do not necessarily have black ownership.
The Pearson correlation coefficients (r) were calculated between each group and the guide
by which they were interpreted was used as set out in section 3.9. The resulting effect
sizes can be seen in Table 26.
Table 26: Pearson correlation coefficients for SMEs with different BEE compliance
levels
Benefits of BEE for SMEs
Benefits of BEE for employees of SMEs
Disadvantages for efficiency and reliability for SMEs
Economic disadvantages for SMEs
Perceived fundamental disadvantages of BEE
BEE-level group 1 and 2
-0.83 -0.68 0.05 0.32 0.16
Table 26 indicates that there is a large and practically significant inverse effect size (|r| =
0.83) between these two groups with regards to the perceived benefits of BEE for SMEs.
This indicates that respondents employed at SMEs with a BEE-level of 1 or 2 had
significantly differing perceptions about the benefits of BEE for SMEs. This result can be
contributed to the fact that the ownership element of the BEE scorecard is mandatory in
order to have a BEE-level of 1 or 2 and that these SMEs will enjoy more benefits because
of their higher BEE-levels. This indicates that SMEs with better BEE-levels directly enjoy
more benefits from BEE legislation than their counterparts.
Table 26 shows a medium inverse effect size (|r| = 0.68) noticeable with the naked eye
between the two groups regarding the benefits of BEE for employees of SMEs. For the
same reason mentioned above, when SMEs benefit from BEE legislation, their employees

- 69 -
indirectly benefit as well. This is further demonstrated by the Pearson correlation
coefficient of 0.8 as seen in Table 24. This result suggests that employees of SMEs with a
contribution level of 1 or 2 have different perceptions about the benefits of BEE for
employees of SMEs.
Lastly, Table 26 indicates that there is an insignificant difference between the perceptions
of the two groups about the disadvantages to efficiency and reliability for SMEs, the
economic disadvantages for SMEs, and the fundamental disadvantages of BEE.
3.10 Summary
This chapter reported on the statistical analysis results from the data collected by means
of an anonymous survey. The study population of this study was the employees of SMEs
in South Africa.
The evaluation of the questionnaires revealed that the majority of employees of SMEs who
participated in this study have a generally negative perception of BEE. This result was
obtained before asking in-depth questions about the implementation of BEE at SMEs.
Questions from section B of the questionnaire indicated that, overall, the study population
indicated an average of 77% familiarity with the BEE legislation and its accompanying
terms and practices.
Using some of the demographic results and the questions from section C of the
questionnaire, several constructs were created to answer the research questions. All but
one of the constructs had a high Cronbach’s alpha value with an internal consistency
ranging from acceptable to excellent, indicating that the constructs are reliable.
All but one of the constructs resulted in a neutral perception of BEE by employees of
SMEs. The study population did, however, indicate that it disagrees with the statements
made in the construct about the economic disadvantages for SMEs because of BEE
legislation. This could be interpreted as a positive perception from employees of BEE. The
neutrality of employee perceptions could neither be interpreted as positive nor negative for
BEE, which indicates the importance of the study, as the ideal outcome would require a
positive employee perception of BEE. The fact that the results are neutral indicates that

- 70 -
perceptions of BEE lean to a positive direction, where previous studies have indicated an
overall negative perception.
Based on the interpreted results of this chapter, the final conclusions and
recommendations are discussed in Chapter 4. Chapter 4 also addresses the research
questions and their answers.

- 71 -
Chapter 4: Conclusions and recommendations
4.1 Introduction
SMEs are one of the most significant contributors to the South African economy and one
of the most important instruments of job creation, addressing unemployment and providing
sustainable growth for the South African economy.
The implementation of BEE at SMEs is one of the most significant factors for doing
business with the country’s largest spender, namely the South African Government, in the
South African economy. SMEs are encouraged to obtain the best possible BEE
contribution levels to be awarded tenders, which will directly impact the growth and
sustainability of these entities.
The wellbeing of SMEs is not only important for the South African economy but also for the
wellbeing of their employees. The perceptions formed by employees about BEE could
indicate whether the implementation of BEE has had positive or negative effects on SMEs
and their employees. The perceptions formed could also indicate whether the
implementation of the BEE Act and the Codes of Good Practice have resulted in the
mandates and objectives of BEE being met or not.
Based on the results of Chapter 3, final conclusions and recommendations are reported in
this chapter.
4.2 Conclusions on empirical studies
An empirical study was conducted and received participation from 164 respondents, of
which 116 qualified as employees of SMEs. The results of the empirical study are
represented in Chapter 3, and the following conclusions are based on the results obtained
from the study population.
4.2.1 Conclusions based on the demographic information
• Gender groups of the study population: The results indicate that the study
population had a nearly even representation from both gender groups with 46% of
the study population being male and 52% female.

- 72 -
• Age groups of the study population: The results indicate that the majority (77%)
of the study population was in the age group 19 to 39 and that 23% of the
population was in the age group 40 to 60+. This indicates a good representation of
age groups of employees who entered the job market before BEE had been
implemented, while BEE was initially being implemented, and when BEE and the
Codes of Good Practice had been amended and fully implemented. The results also
show that there is no correlation between perceptions of different age groups. This
is a result of the different age groups having entered the job market at various
stages of BEE implementation. It can therefore be concluded that employees who
entered the job market before and after the implementation of BEE have different
perceptions about BEE.
• Education levels of the study population: The results indicate that 69% of the
study population has a tertiary education, 28% has secondary education, and only
3% has none of the previously mentioned. The results show that the majority of the
study population is well-educated, which indicates that the study population might
hold higher positions at the SMEs they are employed at overall. The portion of the
study population that represents secondary or no formal education is slightly under-
represented in this study.
• Employment levels of the study population: The results show that more than
half (53%) of the study population is employed in some capacity as a manager at a
SME and that 47% of the study population is general workers or specialists. This
makes sense when considering that SMEs usually have few employees and that a
large portion of the study population has a tertiary education.
4.2.2 Conclusions based on the business information
• SME size regarding number of employees: The results show that 60% of the
SMEs represented in this study only have between 1 and 19 employees, 22% have
between 22 and 49 employees, and 18% is larger entities with between 50 and 199
employees.
• BEE compliance levels of SMEs: The results show that 74% of the SMEs
represented have some form of BEE compliance level. The results also indicate that

- 73 -
a large portion (26%) of the SMEs represented in this study are non-compliant. This
suggests that these entities operate in an environment where BEE is not
compulsory and that these entities do not provide products or services to any
government departments. The results also indicate that respondents employed at
SMEs with a BEE-level of 1 or 2 have significantly differing perceptions than SMEs
with a BEE-level 3 and higher about the benefits of BEE for SMEs. The results also
indicate that employees employed at SMEs with varying levels of BEE compliance
have no correlating perceptions with regards to the disadvantages of BEE for
SMEs. It can therefore be concluded that SMEs with a BEE-level 1 or 2 enjoy more
benefits from the BEE legislation, but that perceptions of employees across SMEs
with varying BEE-levels have varying perceptions about the disadvantages of BEE
for SMEs.
4.2.3 Conclusions based the general perception of BEE
This question was asked at the end of section A of the questionnaire to determine the
general perception that employees of SMEs have about the BEE legislation. This question
was purposefully asked before any detailed questions to determine what the general
feeling was before respondents had a chance to think about all the particular aspects of
BEE.
The results indicate that 45% of respondents have a general negative feeling about BEE.
This is not surprising considering the sensitive nature of the study. It is well-documented
that in South Africa any topic involving race is a sensitive subject which usually evokes
negative feelings. The results however also show that 33% of the study population has
positive feelings about BEE. This can be considered positive for BEE in light of previous
studies on owners of SMEs indicating strong negative perceptions about BEE.
The remaining 21% of the study population indicates that they have no opinion or are
unsure of how they feel about BEE. This correlates with the results that 26% of the
represented SMEs are BEE non-compliant entities. It can therefore be concluded that
employees of these SMEs are less involved in or affected by the implementation of the
BEE legislation.

- 74 -
This result answers one of the research questions namely whether employees perceive
BEE in itself in a positive or negative light and the results indicate that the majority of the
study population perceives BEE negatively.
4.2.4 Conclusions based on the awareness of BEE
The results show that 84% of the respondents who participated in the study are familiar
with the BEE legislation and that on average 77% of respondents are familiar with
preferential procurement, the term fronting, and the goals and objectives of BEE.
Similar to the result in section 4.2.3 it can be concluded that employees employed at BEE
non-compliant SMEs are less involved or affected by BEE implementation and therefore
do not carry knowledge about it.
The results further indicate that there is some room for improvement by the government
regarding awareness of BEE and its accompanying terms and legislation. Considering the
importance of SMEs in South Africa and the effect that BEE can have on these entities,
everyone involved in these institutions should carry basic knowledge of the BEE legislation
outlined in section B of the questionnaire.
This result is important when considering that SMEs that are BEE non-compliant might
have benefitted from BEE had they been informed that an entity with less than a R10
million turnover is considered a BEE-level 4 compliant company. These SMEs might have
lost out on opportunities to benefit from the BEE legislation resulting from a lack of
information or knowledge.
4.2.5 Conclusions based on the perceived impact of BEE on SMEs and their
employees
• Conclusions based on the perceived advantages of BEE on SMEs: This
construct has a resulting Cronbach’s alpha value of 0.94, which indicates excellent
internal consistency and that the construct is reliable. The results from this construct
(x̅ = 2.5) indicate that the study population has a neutral perception about the
statements made in this construct. This indicates that some respondents perceive
the company they are employed at as having benefitted from BEE and others
perceive the opposite. This also answers one of the research questions of whether

- 75 -
there is any perceived advantage or disadvantage for SMEs because of BEE. The
results are neutral, and it can be concluded the study population does not perceive
SMEs as either being advantaged or disadvantaged by BEE.
• Conclusions based on the perceived advantages of BEE for employees of
SMEs: This construct has a resulting Cronbach’s alpha value of 0.93, which
indicates excellent internal consistency and that the construct is reliable. The results
from this construct (x̅ = 2.3) indicate that the study population has a neutral
perception about the statements made in this construct. This indicates that some
respondents perceive employees as having benefitted from BEE and others
perceive the opposite. This also answers one of the research questions of whether
there is any perceived advantage or disadvantage for employees because of BEE.
The results are neutral, and it can be concluded the study population does not
perceive employees as either being advantaged or disadvantaged by BEE.
Question C15 in this construct contributes to answering another research question,
namely whether it is important to employees that their employers have a reasonable
BEE-level. The result of this question (x̅ = 2.37) is neutral and therefore it cannot be
concluded whether the study population finds it important that their companies have
a reasonable BEE-level.
• Conclusions based on the disadvantages for efficiency and reliability for
SMEs: This construct has a resulting Cronbach’s alpha value of 0.89, which
indicates good internal consistency and that the construct is reliable. The results
from this construct (x̅ = 2.6) indicate that the study population has a neutral
perception about the statements made in this construct. This indicates that some
respondents perceive BEE as having disadvantaged SMEs with regards to
efficiency and reliability, and others perceive the opposite. This also contributes to
answering one of the research questions of whether employees perceive BEE as
having a positive or negative impact on SMEs. The results are neutral, and it can be
concluded that the study population does not perceive BEE as either having a
positive or negative impact on SMEs.
• Conclusions based on the economic disadvantages for SMEs: This construct
has a resulting Cronbach’s alpha value of 0.74, which indicates an acceptable

- 76 -
internal consistency and that the construct is reliable. The results from this construct
(x̅ = 1.9) indicate that the study population disagrees with the statements made in
this construct. This indicates that the study population perceives BEE as not having
economically disadvantaged SMEs. This also contributes to answering one of the
research questions of whether employees perceive BEE as having a positive or
negative impact on SMEs. The results are positive, and it can be concluded the
study population does not perceive BEE as having a negative impact on SMEs.
Question C26 in this construct contributes to answering another research question
of whether it is important to employees that their employers have a reasonable
BEE-level. The result of this question (x̅ = 1.8) indicates that the study population
does not feel negative towards their jobs because of the BEE-levels of their
companies. Considering that 64% of the represented SMEs have a BEE-level 4 or
higher, it can be concluded employees consider it important that the companies
they are employed at have reasonable BEE contribution levels.
Question C27 in this construct answers another research question of whether BEE
legislation has resulted in corrupt or illegal practices at the companies they are
employed at. The result of this question (x̅ = 1.94) indicates that the study
population does not agree with the statement and the results indicate that BEE has
not resulted in corrupt or illegal practices in these SMEs. This answer also indicates
that fronting and other related illegal practices have not been completely eradicated.
• Conclusions based on the fundamental disadvantages of BEE:
This construct has a resulting Cronbach’s alpha value of 0.54, which indicates a
poor internal consistency and that the construct is not reliable. The questions in this
construct were therefore evaluated separately. The results for question C16 and
C20 resulted in mean values of x̅ = 2.07 and x̅ = 2.77 respectively. The result for
C16 indicates that the study population has a neutral perception with regards to the
statement that complying with BEE is not a priority for the company they are
employed at. The result for question C20 indicates that the study population
perceives the implementation of BEE as time consuming and a financial burden.
This result answers one of the research questions of whether BEE has impacted

- 77 -
positively or negatively on SMEs. The results indicate that BEE has impacted SMEs
negatively concerning a loss of time and financial strain.
4.3 Recommendations
The following recommendations are made with regard to the conclusions of the empirical
study. This section includes recommendations to employees of SMEs, owners of SMEs,
and government and regulatory bodies.
4.3.1 Recommendations to employees and owners of SMEs
• Employees and owners of SMEs should familiarise themselves with the BEE Act,
the Codes of Good Practice, and the Preferential Procurement Act as well as all the
amendments. Significant changes have been made to the legislation and to obtain
the optimal BEE-level, owners and their employees should be up to date with those
changes.
• Employees and owners of SMEs should familiarise themselves with the industry
charter of their relevant industry to strategically position themselves in their
respective industries.
• Owners of SMEs who are not BEE compliant should familiarise themselves
particularly with the amended Codes of Good Practice. These SMEs could qualify
for a BEE rating without undergoing organisational changes, which could lead to
business opportunities with state-owned enterprises.
• Employees of SMEs should understand the BEE scorecard completely, as it may
serve as an initiative to work harder and move up in the company ranks.
• Employees and owners of SMEs should investigate the goals and objectives of BEE
clearly so that they can understand that BEE is not only implemented to right the
wrongs of the past but also to grow the economy inclusively and to assist SMEs.
• Owners of SMEs should ensure that their employees are informed about BEE and
the amendments made, and employees should also inform the owners.

- 78 -
• The BEE legislation should not be viewed in a negative light. Like all important
decisions in business, an informed well-communicated strategy should be set in
place to ensure the mutual benefit to all stakeholders.
4.3.2 Recommendations to government and regulatory bodies
• The government should duplicate this study on a larger scale. A lot has been done
to set these policies in place and amend shortcomings, but little information has
been gathered from the people who are supposed to benefit from it.
• The government should investigate better incentives for companies who comply
with BEE above just the opportunity to be awarded tenders.
• The government should assist white-owned SMEs in the process of finding black
African business partners and investors.
• Regulatory bodies should be more vigilant with regards to fronting, corruption or
other illegal practices. The results of this study clearly indicate that fronting has not
yet been eradicated.
• The government should prioritise the development of SMEs as SMEs have the
greatest potential of reducing the unemployment rate and developing the economy.
4.4 Evaluation of the study
The evaluation of this study is based on the achievements of the primary and secondary
objectives as set out in section 1.4.
4.4.1 Primary objective
The primary objective of the study was to investigate whether the impact of BEE on SMEs
in South Africa is perceived as positive or negative.
This objective was achieved by means of a questionnaire that was developed and
administered to employees of SMEs. The results are presented in Chapter 3 of the study
and the recommendations are made in Chapter 4 of the study.

- 79 -
4.4.2 Secondary objectives
Section 1.4.2 specified the following secondary objectives:
• To clearly define BEE;
• To identify and describe the outcomes and goals of BEE;
• To gain greater insight on the aspects of BEE by conducting a literature study;
• To understand the role that SMEs play in the South African economy;
• To construct a questionnaire to assess what the perceived impact of BEE is on
SMEs;
• To make conclusions and recommendations based on the literature study and
empirical study.
The first secondary objective was achieved through definitions relating to BEE in section
2.2 of this study and an in-depth definition was provided in section 2.3.4 of the study.
The second secondary objective of identifying and describing the outcomes and goals of
BEE was achieved by means of a literature study in section 2.3.4.
The third secondary objective of gaining greater insight on the aspects of BEE was
achieved through a literature study in section 2.3. This section included the most relevant
history of BEE from its inception to date and discussed subjects such as the Employment
Equity Act, Competition Act, National Empowerment Fund, the BEE Act, the BEE Codes of
Good Practice, and the Preferential Procurement Policy. The section explored the original
policies as well as the amendments made to these policies from their inception.
The fourth secondary objective was to establish an understanding of the role that SMEs
play in the South African economy. This objective was achieved through a literature study
in section 2.4.
The fifth secondary objective was to construct a questionnaire to assess the perceived
impact of BEE on SMEs in South Africa. The questionnaire design is discussed in Chapter

- 80 -
3, and specific details about the questionnaire and study population follow in sections 3.3
and 3.4 respectively.
The last secondary objective was to draw conclusions and recommendations based on the
literature study and empirical study. Conclusions based on the obtained results in section
3 are discussed in section 4.2 and recommendations based on the conclusions are
discussed in section 4.3.
4.5 Suggestions for future research
• From the conclusion of the study it is evident that BEE is still a controversial topic
amongst employees of SMEs and it carries a negative sentiment in general. This
topic should be openly discussed without prejudice, and therefore a similar study as
this study that requires some form of government backing or involvement in order
for it to be scaled is recommended.
• BEE has existed since 2003, yet little evidence shows the impact that BEE has truly
had on SMEs in south Africa. Although perceptions of BEE is important, it is
suggested that the actual economic impact of BEE on the SME sector be
investigated with regard to economic and growth advantages and disadvantages.
• An additional study comparing competing companies within the same sector but
with different BEE-levels will also contribute to understanding the true value that
BEE brings to SMEs.
• The study has shown that employee perceptions influence employee participation
and therefore a study into company culture should be conducted to understand
whether BEE has had a positive or negative effect on company culture.
• This study has focussed on SMEs, but it is suggested that this study be scaled to
include employees of all enterprises. It would be valuable to understand employee
perceptions are across all sectors and which policy amendments could be made in
order to change negative perceptions about BEE.

- 81 -
4.6 Summary
The South African Government has taken several steps into righting the wrongs of the
apartheid era with regards to implementing policy instruments that support SME growth
and sustainability. SMEs have been identified as one of the most significant drivers of the
South African economy but, despite the government efforts, South Africa still battles an
enormous unemployment rate and a struggling economy.
This study set out to determine the perceptions that employees of SMEs have of BEE, but
the true economic effect of BEE on SMEs have yet to be determined. The study showed
that employees of SMEs have a mostly neutral perception about several factors of BEE
and this can be viewed as negative for the BEE policy, because not only was the policy
created to right the wrongs of the past, but to reduce unemployment and increase
economic growth and inclusivity for black entrepreneurs. A positive perception of BEE
would be encouraging for young black entrepreneurs who plan to enter the market, which
in turn would reduce unemployment and increase economic growth.
This study has revealed that a large portion of the SMEs represented in this study has not
made an effort to comply with BEE, which suggests that a significant portion of economic
activity in South Africa does not require compliance with the BEE Act. This suggests that
government should focus their efforts on broadening the implementation of BEE across
more sectors and economic activity. This should, however, only be done once the true
economic and social implications of BEE have been investigated.
The study results indicate that there could be a strong relationship between the economic
wellbeing of a company and its BEE-level, illustrating that the BEE policies set in place are
achieving some of its set goals and mandates, but the extent to which this is achieved has
not yet been measured.
BEE should not be viewed as an obstacle for business owners but rather as a strategic
advantage to grow sustainable business. This message should be emphasised by the
government to accelerate participation of BEE.

- 82 -
Chapter 5: List of references
Alessandri, T.M., Black, S.S. & Jackson, I.I.I.W.E. 2011. Black Economic Empowerment Transactions in South Africa: Understanding When Corporate Social Responsibility May Create or Destroy Value. Long Range Planning, 44:229-249. Angela, P., Juliet, P. & Willie, T.C. 2018. Analysing the future of Broad-Based Black Economic Empowerment through the lens of small and medium enterprises. Acta Commercii, Vol 18, Iss 1, Pp e1-e10 (2018)(1):e1. B-BBBEE Commision. 2018. B-BBEE Advisory Council. https://bbbeecommission.co.za/b-bbee-advisory-council/ Date of access: 26 Jul 2018 2018. B-BBEE Commission (Cartographer). (2016). The Journey to Creating the B-BBEE Referee [ B-BBEE Commission. 2018. About Us. https://bbbeecommission.co.za/about-the-commission/ Date of access: 04 Jun 2018 2018. Barclay, C. 2012. Preferential Procurement in the South African Context, August 2012. http://whoswholegal.com/news/features/article/29829/preferential-procurement-south-african-context Date of access: 04 Jun 2018. Barnes, S. 2017. LATE PAYMENT BY GOVERNMENT DISCOURAGES SMME PARTICIPATION. Journal of the South African Institution of Civil Engineering, 25(7):47-48. Barry. 2017. Understanding “Skills Development” for BBBEE purposes, 12/06/2017. https://www.schoemanlaw.co.za/understanding-skills-development-bbbee-purposes/ Date of access: 30 Jul 2018. BEE Analyst & Associates. 2018. What Is The Definition Of Black People?. http://www.beeanalyst.co.za/bee-questions-and-answers/what-definition-black-people Date of access: 23 Jul 2018 2018. Business Tech. 2017. This is who is paying South Africa’s tax, 26/10/2017. https://businesstech.co.za/news/finance/207631/this-is-who-is-paying-south-africas-tax/ Date of access: 02 Aug 2018. BusinessTech. 2015. How SA can create 11 million jobs. https://businesstech.co.za/news/government/86348/how-sa-can-create-11-million-jobs/ Date of access: 09 Aug 2018 2018. CA Charter. 2018. Management Control Scorecard. http://www.cacharter.co.za/DisplayContent.asp?ContentPageID=1136&Menu=&ContentPageName=&ContentPageParentId=842 Date of access: 20 Jul 2018 2018.

- 83 -
Center for Advanced Human Resource Studies. 2011. Perception Is Reality: How Employees Perceive What Motivates HR Practices Affects their Engagement, Behavior and Performance. 193 Ives Hall, Ithaca, NY 14850: School, C.U.I. Cohen, L., Morrison, K. & Manion, L. 2011. Research Methods in Education. Vol. 7th ed. London,UK: Routledge. Competition Commission. 1998. Competition Act No. 89 of 1998, 30/11/1998. http://www.compcom.co.za/wp-content/uploads/2014/09/pocket-act-august-20141.pdf Date of access: 04 Jun 2018. Competition Commission. 2018. Welcome to the Competition Commission South Africa. http://www.compcom.co.za/ Date of access: 24 Jul 2018 2018. Dludlu, J. 2017. Why is BEE failing?, 08/01/2017. https://www.fin24.com/Economy/why-bee-is-failing-20170108-2 Date of access: 08 Jan 2018. DTI, T.D.o.T.a.I. Industry, D.O.T.A. 1998. National Empowerment Fund Act No. 105 of 1998 Cape Town, South Africa. DTI, T.D.o.T.a.I. 2000. PREFERENTIAL PROCUREMENT POLICY FRAMEWORK ACT. Cape Town, South Africa. DTI, T.D.o.T.a.I. 2003a. BROAD-BASED BLACK ECONOMIC EMPOWERMENT ACT, 2003. Cape Town, South Africa. DTI, T.D.o.T.a.I. 2003b. South Africa’s Economic Transformation: A strategy for Broad Based Black Economic Empowerment. Cape Town, South Africa. DTI, T.D.o.T.a.I. 2007a. BACKGROUND TO, INTENTION & APPLICATION OF THE CODES OF GOOD PRACTICE. Cape Town, South Africa. DTI, T.D.o.T.a.I. 2007b. Broad-Based Black Economic Empowerment Codes of Good Practice. Cape Town, South Africa. DTI, T.D.o.T.a.I. 2012. AMENDED BROAD -BASED BLACK ECONOMIC EMPOWERMENT CODES OF GOOD PRACTICE OCTOBER 2012. Cape Town, South Africa: The Department of Trade and Industry. https://www.thedti.gov.za/economic_empowerment/docs/bee_launch.pdf. Date of access: 04 Jun 2018. DTI, T.D.o.T.a.I. 2013. AMENDED CODE SERIES 000: FRAMEWORK FOR MEASURING BROADBASED BLACK ECONOMIC EMPOWERMENT. Cape Town, South Africa. DTI, T.D.o.T.a.I. 2017. PREFERENTIAL PROCUREMENT POLICY FRAMEWORK ACT, 2000: PREFERENTIAL PROCUREMENT REGULATIONS, 2017. Cape Town, South Africa.

- 84 -
DTI, T.D.o.T.a.I. 2018a. B-BBEE Sector Charters. http://www.dti.gov.za/economic_empowerment/bee_sector_charters.jsp Date of access: 04 Jun 2018 2018. DTI, T.D.o.T.a.I. 2018b. Fronting. https://www.thedti.gov.za/economic_empowerment/fronting.jsp Date of access: 15 Jun 2018 2018. DTI, T.D.o.T.a.I. 2018c. The National Empowerment Fund (NEF) https://www.thedti.gov.za/agencies/nef.jsp Date of access: 24 Jul 2018 2018. du Plessis, N. & Grobler, A.F. 2014. Achieving sustainability through strategically driven CSR in the South African retail sector. Public Relations Review, 40:267-277. EMPOWERDEX. 2015. New codes 2013 codes symmary https://www.empowerdex.com/images/Documents/Summary2013NewCodes.pdf Date of access: 04 Jun 2018. EMPOWERDEX. 2018a. Exempted Micro Enterprises (EMEs). http://www.empowerdex.com/our-services/types-of-ratings/exempted-micro-enterprises-eme-s Date of access: 23 Jul 2018 2018. EMPOWERDEX. 2018b. Qualifying Small Enterprise (QSE). http://www.empowerdex.com/our-services/types-of-ratings/qualifying-small-enterprise-qse Date of access: 04 Jun 2018 2018. Ensor, L. 2017. Fronting still a problem, says BEE regulator, 10/10/2017. https://www.businesslive.co.za/bd/national/2017-10-10-fronting-still-a-problem-says-bee-regulator/ Date of access: 23 Jul 2018. Entrepreneur Magazine. 2012. BEE and Small Businesses, 11/01/2012. https://www.entrepreneurmag.co.za/advice/starting-a-business/start-up-guide/bee-and-small-businesses/ Date of access: 14 Jun 2018. Ewert, P.J.K. & Melinda, C.K. 2014. Effect of Black Economic Empowerment on profit and competitiveness of firms in South Africa. Acta Commercii, Vol 14, Iss 1, Pp e1-e10 (2014)(1):e1. Field, A.P. 2009. Discovering statistics using SPSS : (and sex and drugs and rock 'n' roll). Los Angeles ; London : SAGE, c2009. 3rd ed. Gignac, G.E. & Szodorai, E.T. 2016. Effect size guidelines for individual differences researchers. Personality and Individual Differences, 102:74-78. Gleason, D. 2013. Africa surpasses while SA affirms Date of access: 08 Jan 2018. Guliwe, T. 2018. Rethinking the approach to SMME’s development support. Development Finance Agenda (DEFA)(1):20.
- 85 -
Harris, K.L. 2017. BEE-ing Chinese in South Africa: a legal historic perspective. Fundamina, 23:1-20. Herman, H.D. 2017. Affirmative Action in Education and Black Economic Empowerment in the Workplace in South Africa since 1994: Policies, Strengths and Limitations. Borovets, Bulgaria. Herrington, M., Kew, P. & Mwanga, A. 2017. SOUTH AFRICA REPORT 2016/2017. London, UK: Monitor, G.E. Hoffman, E.A. 2008. A wolf in sheeps clothing: Discrimination against the majority undermines equality, while continuing to benefit few under the guise of black economic empowerment. Syracuse Journal of International Law & Commerce, 36(1):87-115. i-fundi. 2017. How to Earn Maximum B-BEEE Points through Skills Development, 17/11/2017. https://ifundi.co.za/how-to-earn-maximum-b-beee-points-through-skills-development/ Date of access: 30 Jul 2018. Impilo, K. 2018. Corporate Social Responsibility. http://www.khethimpilo.org/social-responsibility/# Date of access: 13 Aug 2018 2018. Ingle, M.K. 2014. An analysis of factors impeding SMME performance in South Africa. Africa Insight(2):37. Jack, V. & Harris, K. 2007. Broad-based BEE: the complete guide. Northcliff, South Africa: Frontrunner. Jackson, M., Watson, K., Watson, S., Goodison, J. & Padoa, J. 2015. South Africa: Broad-Based Black Economic Empowerment: Fronting - Circular 3, 06/02/2015. http://www.mondaq.com/southafrica/x/372100/Corporate+Commercial+Law/BroadBased+Black+Economic+Empowerment+Fronting+Circular+3 Date of access: 08 Jan 2018. Janisch, P. 2018. Here’s how BEE must change to meet Ramaphosa’s vision for South Africa, 27/02/2018. https://www.biznews.com/sa-investing/2018/02/27/bee-must-change-ramaphosa-vision/ Date of access: 14 Jun 2018. Janse van Rensburg, K. & Roodt, G. 2005. The perceptions of employment equity and black economic empowerment as predictors of organisation-related commitment. Vol. 3: SA Journal of Human Resource Management. Kloppers, H. 2014. Driving corporate social responsibility through Black economic empowerment. Law, Democracy & Development(1):58. Kruger, C. & Kleynhans, P.J. 2014. Effect of Black Economic Empowerment on profit and competitiveness of firms in South Africa : original research. Acta Commercii(1):1. Mokoena, S.K. 2017. The role of Local Economic Development (LED) : some empirical findings on the Small, Medium and Micro Enterprises (SMMEs). Journal of Public Administration(2):466.

- 86 -
Moya, S. 2017. South Africa Unemployment Rate. https://tradingeconomics.com/south-africa/unemployment-rate Date of access: 08 Jan 2018 2018. National Government of South Africa. 2018. Department: Small Business Development DSBD. https://nationalgovernment.co.za/units/view/37/department-small-business-development Date of access: 02 Aug 2018 2018. National Planning Commission. Presidency, T. 2013. National Development Plan 2030. Our Future-make it work. Pretoria, South Africa. Ngoepe, K. 2016. Fronting remains a huge problem - BBBEE Commission. News 2431/05/2016. Nkwananchi, H. 2015. The Implementation of Preferential Procurement Policy in Gauteng Province: Challenges and Solutions. Africa’s Public Service Delivery & Performance Review, Vol 3, Iss 1, Pp 55-73 (2015)(1):55. Oladipo, T., Iyamabo, J. & Otubanjo, O. 2013. Employer Branding: Moulding Desired Perceptions in Current and Potential Employees (pp. 55-65). Richmond Hill, Canada: Canadian Center of Science and Education. (article). Orkin, F.M. 1998. Unemployment and employment in South Africa. Pretoria, South Africa. Pieterse, R. 2015. Why BBBEE is important for business, 15/05/2015. https://www.ecovis.com/en/why-bbbee-is-important-for-business/ Date of access: 08 Jan 2018. Pitman, J. 2012. BEE Making BEE Work for You, 14/08.2012. https://www.entrepreneurmag.co.za/advice/doing-business-in-sa/bee/making-bee-work-for-you/ Date of access: 14 Jun 2018. SAHO, S.A.H.O. 2017. South Africa’s Key economic policies changes (1994 - 2013). https://www.sahistory.org.za/article/south-africa%E2%80%99s-key-economic-policies-changes-1994-2013 Date of access: 24 Jul 2018 2018. SAICA, T.S.A.I.o.C.A. 2017. Employment Equity Act No. 55 of 1998 https://www.saica.co.za/Technical/LegalandGovernance/Legislation/EmploymentEquityActNo55of1998/tabid/3041/language/en-ZA/Default.aspx Date of access: 04 Jun 2018 2018. SAS Institute Inc. 2017. The SAS System for Windows Release 9.4 TS Level 1M3 Copyright© by SAS Institute Inc. Cary, NC, USA. Schoeman–Louw, N. 2017. BBBEE - How will this impact small businesse in South Africa? http://www.lionessesofafrica.com/blog/2017/3/9/bbbee-how-will-this-impact-small-businesses-in-south-africa Date of access: 15 Jun 2018 2018. Schwab, K. 2017. The Global Competitiveness Report 2016–2017. Geneva.

- 87 -
Sebati, N. 2018. What is ESD. http://www.enterprisesupplierdevelopment.co.za/what-is-esd/ Date of access: 30 Aug 2018 2108. SEDA, T.S.E.D.A. 2016. THE SMALL, MEDIUM AND MICRO ENTERPRISE SECTOR OF SOUTH AFRICA. Johannesburg, South Africa. SEESA. 2018. The Broad-Based Black Economic Empowerment Act. http://www.seesa.co.za/boss/ Date of access: 30 Jun 2018 2018. Soojung, L.E.E. & Jeongkoo, Y. 2018. DOES THE AUTHENTICITY OF CORPORATE SOCIAL RESPONSIBILITY AFFECT EMPLOYEE COMMITMENT? Social Behavior & Personality: an international journal, 46(4):617-632. Statistics South Africa. 2012. Statistical release (Revised). Pretoria, South Africa. Statistics South Africa. 2017a. Gross domestic product. First quarter 2017. Pretoria, South Africa. Statistics South Africa. 2017b. Infographic: Governments's Spending Priorities 24/11/2017. http://www.statssa.gov.za/?p=10730 Date of access: 04 Jun 2018. Statistics South Africa. 2017c. Poverty Trends in South Africa: An examination of absolute poverty between 2006 & 2015, 22/08/2017. http://www.statssa.gov.za/?p=10341 Date of access: 28 May 2018. Statistics South Africa. 2018. Quarterly Labour Force Survey Quarter 2: 2018. Pretoria, South Africa. Steyn, L. 2015. Small firms hit by new BEE codes, 10/03/2015. https://mg.co.za/article/2015-03-19-small-firms-hit-by-new-bee-codes Date of access: 23 Jul 2018. The Banking Association of South Africa. 2018. SME Enterprise. http://www.banking.org.za/what-we-do/sme/sme-enterprise Date of access: 08 Jan 2018 2018. The Investment House. 2016. What Is BBBEE? https://www.entrepreneurmag.co.za/advice/doing-business-in-sa/bee/what-is-bbbee/ Date of access: 14 Feb 2018 2018. The PRS Group. 2017. South Africa. East Syracuse,NY,USA. Valentine, S. & Godkin, L. 2017. Banking Employees' Perceptions of Corporate Social Responsibility, Value-Fit Commitment, and Turnover Intentions: Ethics as Social Glue and Attachment. Employee Responsibilities & Rights Journal, 29(2):51-71. van der Nest, D. (Cartographer). (2004). The impact of Black Economic Empowerment on the management of small companies in south africa. [

- 88 -
van der Westuizen, M. 2017. What Is An Exempted Micro Enterprise? http://globalbusiness.co.za/2017/08/24/exempted-micro-enterprise/ Date of access: 04 Jun 2018 2018. Van Deventer, D. 2017. Understanding socio-economic development as BEE element, 03/11/2017. https://www.golegal.co.za/socio-economic-development-bee/ Date of access: 30 Jul 2018. Van Wyk, H.M. 2010. The impact of BBBEE on small and medium-sized businesses in the Sedibeng region. Potchefstroom, South Africa: 2010. Werkmans. 2014. Amendments to the BBBEE Act and the codes explained 04/11/2014. http://www.werksmans.com/wp-content/uploads/2014/11/041763-WERKSMANS-bbbee-booklet.pdf Date of access: 15 Jun 2018. Western Cape Government. 2018. Black Economic Empowerment: Overview. https://www.westerncape.gov.za/your_gov/254 Date of access: 24 Jul 2018 2018. Whittles, G. 2017. State to discipline employees doing business with government. Mail&Guardian01 February 2017. World Bank. 2018. Total early-stage Entrepreneurial Activity (TEA). https://tcdata360.worldbank.org/indicators/aps.ea.total?country=BRA&indicator=3116&viz=line_chart&years=2001,2017 Date of access: 02 Aug 2018 2018.

- 89 -
APPENDIX A: The Questionnaire
Broad-Based Black Economic Empowerment Questionnaire
Thank you for taking the time to contribute to this study. This focus of this study is to understand your personal perceptions of the BBBEE legal framework and how it is affecting the business you are employed at. If you are an employer or owner of a small or medium enterprise, we would like to encourage you to distribute this questionnaire between your employees. This questionnaire seeks the feedback from ALL South Africans from all walks of life, employed at a small or medium enterprise. All information will be treated as STRICTLY CONFIDENTIAL and will only be used for academic purposes. No private information such as email-addresses of IP-addresses will be collected. This information will benefit not only you as an employee but also the South African economy that we all are reliant on.
Section A: Demographic Information
The following information is needed to help us with the statistical analysis of the data for
comparisons among different businesses. All your responses will be treated confidentially.
We appreciate your help in providing this important information.
A1: What is your gender? *
Female
Male
Prefer not to say
A2: What is your age group? *
19 to 29
30 to 39
40 to 49
50 to 59
60+
A3: What is your highest level of education? *
Matric
Diploma or equivalent

- 90 -
Bachelor’s degree
Master’s degree
Doctoral degree
None of the above
A4: What is your level of employment? *
Worker
Specialist
Junior Management
Mid-level management
Senior management
Owner or part owner
A5: How many permanent employees are employed by the business you are employed
at? *
1 to 9
10 to 19
20 to 49
50 to 99
100 to 199
200 to 499
500+
A6: What BEE-level does the business have? *
Level 1
Level 2
Level 3
Level 4

- 91 -
Level 5
Level 6
Level 7
Level 8
Non-compliant
A11: Complete the sentence: In general, I have an overall ___________ feeling towards
BEE legislation. *
Positive
Negative
Unsure
No Opinion
Section B: Awareness of BEE
B1: I am familiar with the BEE Legislation. *
Yes
No
B2: I am familiar with the preferential procurement practices as set out by BEE legislation *
Yes
No
B3: I am familiar with the term "fronting" in light of BEE legislation *
Yes
No
B4: I am familiar with the prescribed goals and objectives of BEE *
Yes
No

- 92 -
Section C: Advantages and disadvantages of BEE to the business
All the questions may be answered by making a selection in the relevant circle. Use the
following key:
1 = Strongly disagree;
2 = Slightly disagree;
3 = Slightly agree;
4 = Strongly agree.
You must select the number which best describes how you feel about the item.
C1: BEE creates new possibilities for the company I'm employed at in terms of business
networks and new associates. *
Strongly disagree
1
2
3
4
Strongly agree
C2: The company I'm employed at has been more successful by complying with BEE
legislation. *
Strongly disagree
1
2
3
4
Strongly agree
C3: In general employees are better off in terms of skills and rank in the business since the
implementation of BEE.

- 93 -
Strongly disagree
1
2
3
4
Strongly agree
C4: The company I'm employed at has seen an increase in annual turnover since the
implementation of BEE. *
Strongly disagree
1
2
3
4
Strongly agree
C5: BEE resulted in the acquisition of new customers for the company I'm employed at. *
Strongly disagree
1
2
3
4
Strongly agree
C6: Our company is continuously striving to better our BEE-level. *
Strongly disagree

- 94 -
1
2
3
4
Strongly agree
C7: BEE has directly resulted in better skilled workers in the company I'm employed at.
Strongly disagree
1
2
3
4
Strongly agree
C8: BEE has helped the company I'm employed at to achieve its social responsibility
towards the local community. *
Strongly disagree
1
2
3
4
Strongly agree

- 95 -
C9: BEE makes it possible for the company I'm employed at to be more competitive in the
market? *
Strongly disagree
1
2
3
4
Strongly agree
C10: BEE makes it possible for the company I'm employed at to compete in new
unexplored markets. *
Strongly disagree
1
2
3
4
Strongly agree
C11: BEE compliance makes it possible for the company I'm employed at to rapidly
expand its business operations and grow faster than without BEE compliance. *
Strongly disagree
1
2
3
4
Strongly agree

- 96 -
C12: BEE has led to more effective management of the company I'm employed at.
Strongly disagree
1
2
3
4
Strongly agree
C13: BEE has created more jobs at the company I'm employed at. *
Strongly disagree
1
2
3
4
Strongly agree
C14: I have benefited because the company I'm employed at complies with BEE
legislation. *
Strongly disagree
1
2
3
4
Strongly agree

- 97 -
C15: I feel positive about the company I'm employed at because it complies with BEE
Legislation. *
Strongly disagree
1
2
3
4
Strongly agree
C16: Complying with BEE is not a priority for the company I'm employed at.
Strongly disagree
1
2
3
4
Strongly agree
C17: The company I'm employed at has lost work which can be directly linked to BEE
legislation *
Strongly disagree
1
2

- 98 -
3
4
Strongly agree
C18: BEE has caused job losses in the company I'm employed at. *
Strongly disagree
1
2
3
4
Strongly agree
C19: Implementing the codes of good conduct on BEE could result in the loss of focus on
business matters and therefore could have a hampering effect on the company I'm
employed at. *
Strongly disagree
1
2
3
4
Strongly agree
C20: Implementing BEE is time consuming and a financial burden on the company I'm
employed at. *
Strongly disagree
1
2
3
- 99 -
4
Strongly agree
C21: The skills development aspect of BEE lead to a loss in productivity as workers need
to attend courses or training. *
Strongly disagree
1
2
3
4
Strongly agree
C22: BEE has impacted negatively on the company culture at the company I'm employed
at. *
Strongly disagree
1
2
3
4
Strongly agree
C23: BEE has resulted in the company I'm employed at employing incompetent or under
trained people just for the sake of empowerment. *
Strongly disagree
1
2

- 100 -
3
4
Strongly agree
C24: Preferential procurement practices might force the company I'm employed at to buy
from new suppliers, resulting in potential risks in terms of reliability. *
Strongly disagree
1
2
3
4
Strongly agree
C25: Established relationships with current suppliers will be at risk once the company I'm
employed at has to buy from empowered suppliers. *
Strongly disagree
1
2
3
4
Strongly agree
C26: I feel negative towards my job due to the BEE-level of the company I'm employed
at. *
Strongly disagree

- 101 -
1
2
3
4
Strongly agree
C27: BEE Legislation has resulted in corrupt or illegal practices at the company I'm
employed at. *
Strongly disagree
1
2
3
4
Strongly agree

- 102 -
APPENDIX B: Application for ethical clearance
a
Dear prof Visagie,
FEEDBACK – ETHICS APPLICATION: AP VAN NIEKERK (20507593)
Your application for ethical clearance – The perception of Broad-Based Black economic empowerment (BBBEE) in small and medium enterprises – has been evaluated on the 24th of August 2018.
Outcome:
The application is approved as a low risk study.
Ethics number: NWU-00629-18-S4
Yours sincerely,
Prof BJ Linde
Chairperson: Economic and Management Sciences Research Ethics Committee (EMS-
REC)
Original details: (11153431) C:\Fakulteit\Bestuur\Kwaliteitsbestuur\Etiek\Aug 2018\AP vNiekerk\24 Aug 2018
File reference: 9.1.5.3
Private Bag X6001, Potchefstroom
South Africa 2520
Tel: 018 299-1111/2222
Web: http://www.nwu.ac.za
Economic and Management Sciences Research
Ethics Committee (EMS-REC)
Tel: 018 299-1427
Email: [email protected]
3 September 2018 Prof JC Visagie
Per e-mail