the pathobiology of h7n3 low and high pathogenicity avian
TRANSCRIPT
viruses
Article
The Pathobiology of H7N3 Low and High Pathogenicity AvianInfluenza Viruses from the United States Outbreak in 2020Differs between Turkeys and Chickens
Miriã F. Criado 1,†,‡, Christina M. Leyson 1,† , Sungsu Youk 1, Suzanne DeBlois 1, Tim Olivier 1,Mary Lea Killian 2, Mia L. Torchetti 2, Darren J. Parris 1, Erica Spackman 1, Darrell R. Kapczynski 1,David L. Suarez 1, David E. Swayne 1 and Mary J. Pantin-Jackwood 1,*
�����������������
Citation: Criado, M.F.; Leyson, C.M.;
Youk, S.; DeBlois, S.; Olivier, T.;
Killian, M.L.; Torchetti, M.L.;
Parris, D.J.; Spackman, E.;
Kapczynski, D.R.; et al. The
Pathobiology of H7N3 Low and High
Pathogenicity Avian Influenza
Viruses from the United States
Outbreak in 2020 Differs between
Turkeys and Chickens. Viruses 2021,
13, 1851. https://doi.org/10.3390/
v13091851
Academic Editor: Mathilde Richard
Received: 19 August 2021
Accepted: 11 September 2021
Published: 16 September 2021
Publisher’s Note: MDPI stays neutral
with regard to jurisdictional claims in
published maps and institutional affil-
iations.
Copyright: © 2021 by the authors.
Licensee MDPI, Basel, Switzerland.
This article is an open access article
distributed under the terms and
conditions of the Creative Commons
Attribution (CC BY) license (https://
creativecommons.org/licenses/by/
4.0/).
1 Exotic and Emerging Avian Viral Diseases Research Unit, Southeast Poultry Research Laboratory,U.S. National Poultry Research Center, Agricultural Research Service, U.S. Department of Agriculture,Athens, GA 30605, USA; [email protected] (M.F.C.); [email protected] (C.M.L.);[email protected] (S.Y.); [email protected] (S.D.); [email protected] (T.O.);[email protected] (D.J.P.); [email protected] (E.S.); [email protected] (D.R.K.);[email protected] (D.L.S.); [email protected] (D.E.S.)
2 National Veterinary Services Laboratories, Animal and Plant Health Inspection Service, U.S. Department ofAgriculture, Ames, IA 50010, USA; [email protected] (M.L.K.); [email protected] (M.L.T.)
* Correspondence: [email protected]; Tel.: +1-706-5463419† Authors contributed equally to this study.‡ Current address: Center for Vaccines and Immunology, College of Veterinary Medicine,
University of Georgia, Athens, GA 30602, USA.
Abstract: An outbreak caused by H7N3 low pathogenicity avian influenza virus (LPAIV) occurredin commercial turkey farms in the states of North Carolina (NC) and South Carolina (SC), UnitedStates in March of 2020. Subsequently, H7N3 high pathogenicity avian influenza virus (HPAIV)was detected on a turkey farm in SC. The infectivity, transmissibility, and pathogenicity of theH7N3 HPAIV and two LPAIV isolates, including one with a deletion in the neuraminidase (NA)protein stalk, were studied in turkeys and chickens. High infectivity [<2 log10 50% bird infectiousdose (BID50)] and transmission to birds exposed by direct contact were observed with the HPAIVin turkeys. In contrast, the HPAIV dose to infect chickens was higher than for turkeys (3.7 log10
BID50), and no transmission was observed. Similarly, higher infectivity (<2–2.5 log10 BID50) andtransmissibility were observed with the H7N3 LPAIVs in turkeys compared to chickens, whichrequired higher virus doses to become infected (5.4–5.7 log10 BID50). The LPAIV with the NA stalkdeletion was more infectious in turkeys but did not have enhanced infectivity in chickens. Theseresults show clear differences in the pathobiology of AIVs in turkeys and chickens and corroboratethe high susceptibility of turkeys to both LPAIV and HPAIV infections.
Keywords: H7N3; high pathogenicity avian influenza; low pathogenicity avian influenza viruses;chickens; turkeys; infectivity; pathogenicity; transmission
1. Introduction
Avian influenza viruses (AIV) are type A influenza viruses belonging to the Orthomyx-oviridae family and are classified into subtypes based on the two viral surface glycoproteins:the hemagglutinin (HA) and the neuraminidase (NA). The virus is further classified aseither low pathogenicity (LP) or high pathogenicity (HP) based on lethality in chickensor sequence determination of the HA cleavage site of H5 and H7 subtypes that is consis-tent with HP viruses [1,2]. Wild aquatic birds are the natural reservoir of AIVs; virusesfrom these species are usually of the LP phenotype, and infections are asymptomatic [2].Periodically, these LPAIVs transmit from wild to domestic birds, resulting in subclinicalinfections, mild respiratory disease, and/or drops in egg production [3]. After circulating
Viruses 2021, 13, 1851. https://doi.org/10.3390/v13091851 https://www.mdpi.com/journal/viruses

Viruses 2021, 13, 1851 2 of 17
in chickens or turkeys, H5 and H7 LPAIVs have mutated on numerous occasions to HPAIV,causing poultry outbreaks worldwide [2,4].
Between 1955 and 2019, forty-two unique lineages of HPAIV outbreaks have beenreported around the world [4]. In the Americas in the last 20 years, H7 HPAIV outbreaksin poultry have occurred in Chile (H7N3) in 2002 [5], in Canada (H7N3) in 2004 [6] and2007 [7], and in Mexico in 2012 (H7N3), with the latter virus becoming endemic in thiscountry [8–10]. In the United States (US) in 2016, H7N8 HPAIV and its LPAIV precursorwere detected in a turkey flock in Indiana [11]. In 2017, H7N9 HPAIV was identified in twobroiler breeder farms in Tennessee, with the precursor LPAIV found in multiple broilerbreeder farms and backyard poultry in Tennessee and neighboring states [12].
In March 2020, an outbreak of H7N3 LPAIV occurred in turkey farms in North Car-olina and South Carolina [13]. In April 2020, an H7N3 HPAIV was also detected in one ofthe turkey premises. Around 400,000 birds were depopulated to control the outbreak [13].Whole genome sequencing of the viruses from this outbreak showed that the H7N3 genesegments have a North American wild bird origin and are genetically distinct from theviruses previously identified in the 2016 and 2017 US H7N8 and H7N9 outbreaks, respec-tively [13]. Although they are the same HA and NA subtype, the 2020 H7N3 virusesare genetically distinct from the Mexican H7N3 HPAIVs that have been circulating inpoultry since 2012. The 2020 US H7N3 virus isolates were all highly similar to each other,indicating a single introduction of a wild bird H7N3 LPAIV into turkeys with subsequentmutation to HPAIV [13]. Two notable genetic changes were identified among the virusisolates: a multibasic cleavage site in the HA gene present in the HPAIV isolates and adeletion in the NA stalk region found in some of the LPAIV isolates from the outbreak [13].Deletions in the NA stalk have been previously associated with adaptation to gallinaceousspecies [14–17].
In an effort to improve the control of LPAIV and HPAIV in poultry and increaseunderstanding of the pathobiology of these viruses in gallinaceous species, in this study,we characterized the infectivity, transmissibility, and pathogenicity of two H7N3 LPAIVs,one of them with the NA stalk deletion and one of the HPAIV isolates from the 2020outbreak in the two most important poultry species, turkeys and chickens.
2. Materials and Methods2.1. Viruses
Two LPAIV isolates, A/turkey/South Carolina/20-008394-1/2020 (H7N3) (LPAIV-1)(GenBank accession number MT444368-MT444375) and A/turkey/North Carolina/20-008425-1/2020 (H7N3) (LPAIV-2) (GenBank accession number MT444287-MT444294), andone HPAIV, A/turkey/South Carolina/20-010561-006/2020 (H7N3) (HPAIV) (GenBankaccession number MT444408-MT444415), were used in this study. The viruses were isolatedfrom an active surveillance testing program in North Carolina and South Carolina, US,during March–April 2020, and sequenced [13]. The virus isolates were kindly provided bythe National Veterinary Services Laboratories (NVSL) of the US Department of Agriculture,Animal and Plant Health Inspection Service (USDA-APHIS). The working virus stockswere propagated and titrated by allantoic sac inoculation of 9- to 10-day-old embryonatedchicken eggs (ECE) by standard methods [18]. The LPAIVs differed mainly by a 66 nu-cleotide (nt) deletion in the NA stalk region of LPAIV-2. The HPAIV had a 27 nt insertion inthe HA cleavage site compared to the LPAIVs and did not have the NA stalk deletion [13].Next-generation sequencing conducted in our laboratory [19] determined that the HPAIVisolate was a mix of LPAIV and HPAIV. To obtain a preparation with only HPAIV, the firstECE passage of the field HPAIV isolate was passaged in 10-day-old ECEs and then pas-saged a second time in 14-day-old ECEs, which is a procedure that has been shown to selectfor HPAIV [20,21]. Brain tissue harvested from embryos after the second ECE passage werehomogenized and subjected to another passage in 14-day-old ECEs. This last passage inECE was used as inoculum. Sequence reads from randomly amplified RNA in the last ECEpassage were assembled to the sequence of the original HPAIV isolate from the outbreak

Viruses 2021, 13, 1851 3 of 17
using BWA-MEM [22,23], and subsequently, variants were determined using Lofreq [24].No variants lacking the multibasic cleavage site (MBCS) were detected, demonstrating thatonly viruses with the MBCS were in the HPAIV preparation. Brain–heart infusion (BHI)broth (Becton Dickinson and Company, Sparks, MD, USA) was used to dilute the virusstocks to the appropriate dose. Full genome sequencing was conducted of the inoculumused for all the three viruses and sequences compared to that of the original published(GenBank) field viruses. No changes were found in LPAIV-1 and LPAIV-2. The HPAIVused as inoculum had four amino acid changes when compared to the published GenBanksequence (D44N in matrix (M), T251S in neuraminidase (NA), D680N and L648M in poly-merase basic protein (PB2) segments). Experiments were performed in a biosafety level-3enhanced (BSL-3E) facility in accordance with procedures approved by the U.S. NationalPoultry Research Center (USNPRC) Institutional Biosecurity Committee, AgriculturalResearch Service (ARS), USDA.
2.2. Animals and Housing
One-day-old turkeys (Meleagris gallopavo) were provided by a commercial producerand reared at the USNPRC until three weeks of age. Four-week-old specific-pathogen free(SPF) White leghorn chickens (Gallus gallus) were obtained from the USNPRC in-houseflocks. Birds were transferred to the animal biosafety level 3 enhanced (ABSL3E) facilitiesat the USNPRC, where each experimental group was housed in self-contained isolationunits ventilated under negative pressure and inlet and outlet HEPA filtration. Turkeys andchickens had ad libitum access to food and water throughout the experiment. Housingand experimental procedures were reviewed and approved by the USNPRC InstitutionalAnimal Care and Use Committee (IACUC).
2.3. Experimental Design
A total of 91 chickens and 61 turkeys were used in this study. The experimental designwas similar to previous studies [25–27]. A reduced number of turkeys was used comparedto chickens because of bird availability and the number of birds that could be housedper isolator. Ten birds of each species were bled prior to virus inoculation to confirmthe absence of AIV antibodies by ELISA using the IDEXX AI MultiS-Screen ELISA kit(Westbrook, ME, USA) according to the manufacturer’s protocol. Birds were divided intogroups, and each group was inoculated intrachoanally with one virus at the appropriatedose to determine the 50% bird infectious dose (BID50) for each virus in each bird species.The virus doses were initially intended to be 2 (low dose), 4 (medium dose), or 6 (highdose) log10 50% egg infective dose (EID50) in 0.1 mL per bird as in previous studies, butback titers of the LPAIVs inocula confirmed that the low dose was 2 log10, the mediumdose was 3 log10, and the high dose was 5 log10 EID50. A separate identical experimentwas repeated for the LPAIVs only in chickens using the dose of 6 log10 EID50 to obtain anendpoint to determine the BID50 for these viruses.
In all experiments, a group of sham-inoculated birds were inoculated intrachoanallywith 0.1 mL of sterile allantoic fluid diluted 1:300 in BHI medium. In addition, to evaluatethe transmissibility of each virus, two or three naïve birds from the same species wereadded to each dose group 24 h after inoculation (contact-exposed birds).
Oropharyngeal (OP) and cloacal (CL) swabs were collected at 12, 24 and 36 h post-inoculation, followed by 2, 3, 4, 7, 10 and 14 days post-inoculation (dpi). All swabswere placed in brain–heart infusion (BHI) medium with penicillin (2000 units/mL; SigmaAldrich, St. Louis, MO, USA), gentamicin (200 µg/mL, Sigma Aldrich; St. Louis, MO,USA) and amphotericin B (5 µg/mL, Sigma Aldrich; St. Louis, MO, USA) and stored at−80 ◦C to determine virus shed titers. Two turkeys from the groups that received the highdose of HPAIV (6 log10 EID50) and three chickens from each of the three high-dose groupsfor each virus were euthanized and necropsied at 2 dpi. Brain, heart, spleen, lung, andmuscle tissues were collected from these birds and stored at −80 ◦C for virus detectionand quantification. All birds were observed daily for clinical signs and mortality from 0 to

Viruses 2021, 13, 1851 4 of 17
14 dpi (direct inoculates) or 0 to 13 days post-contact (dpc). Birds showing severe clinicalsigns including severe listlessness, neurological signs, respiratory distress, or inability toeat or drink were euthanized and counted as dead the next day for mean death time (MDT)calculations. At day 14, surviving birds were bled and euthanized.
Sera collected from all surviving birds was used to evaluate infection status by anti-body levels using the hemagglutination inhibition (HI) assay. HI assays were performedusing standard methods and homologous antigen [28]. Seroconversion was also confirmedby the ELISA test using the IDEXX AI MultiS-Screen ELISA kit (Westbrook, ME, USA).HI titers less than 3 log2 GMT were considered negative. A signal-to-negative ratio (S/N)of greater than or equal to 0.5 was considered negative for the ELISA tests. HI assay andELISA results were consistent with each other. The mean bird infectious dose (BID50) foreach virus was calculated by the Reed–Muench method [29], using the criteria that birdswere considered infected if they shed detectable levels of virus at any time and/or werepositive for antibody at the end of the study.
2.4. Viral Titration in Swabs and Tissues
Swab and tissue samples were processed for quantitative real-time RT-PCR (qRT-PCR) to determine viral titers. We used a standard protocol that demonstrated the highcorrelation between qRT-PCR and the infectious titer determined in ECE as previouslydescribed [30]. Briefly, for oropharyngeal and cloacal swab samples, total RNA was ex-tracted using MagMAX™–96 AI/ND Viral RNA Isolation Kit® (Ambion Inc./ThermoFisher Scientific; Grand Island, NY, USA) according to the manufacturer’s protocol. Fortissues, samples were homogenized and resuspended in BHI media to a 10% (w/v) so-lution, and the total RNA was extracted from the homogenates using Trizol LS reagent(Invitrogen/Thermo Fisher Scientific; Grand Island, NY, USA) and chloroform (Life Tech-nologies/Thermo Fisher Scientific, Carlsbad, CA, USA) according to the manufacturer’sprotocol. The resulting aqueous supernatants from tissue RNA extracts were purified usingan RNA Clean and Concentrator kit (Zymo, Irvine, CA, USA), quantified by NanoDrop™1000 Spectrophotometer (Thermo Fisher Scientific) following the manufacturer’s instruc-tions, and diluted with Tris-EDTA buffer (10 mM Tris, 0.1 mM EDTA, pH 7.5) to obtain50 ng/µL.
qRT-PCR was performed with the AgPath-ID One-Step RT-PCR kit (Ambion/ThermoScientific; Grand Island, NY, USA) using a 7500 FAST real-time PCR system (AppliedBiosystems, Foster City, CA, USA) and matrix-specific primers and a probe as previouslydescribed [27]. The standard curves for viral RNA quantification were established with 10-fold dilutions of RNAs extracted from the same titrated stocks used for inoculation. Resultswere reported as EID50/mL or EID50/g equivalents, and the lower limit of detection wasset based on each standard curve. The lower limit of detection was 1.8 log10 EID50/mLfor LPAIV-1, 1.5 log10 EID50/mL for LPAIV-2, and 1.5 log10 EID50/mL for HPAIV. Forstatistical purposes, qRT-PCR negative samples were given a value of 0.1 log10 EID50/mLbelow the test limit of detection.
2.5. Statistical Analysis
Statistical analyses were performed using Prism 8 (GraphPad Software, San Diego,CA, USA; version 8.4.3). Virus RNA titers between OP and CL swabs were statisticallycompared at each time point using two-way ANOVA with Sidak’s multiple comparisons.Statistical differences in the area under the curve of the plot between viral RNA titers, andtime points were analyzed using one-way ANOVA with Sidak’s multiple comparisons test.Those p values < 0.05 were considered significant.
2.6. Sequence Analyses
Phylogenetic trees were adapted using the same set of sequences from a previousstudy [13]. Whole genome sequences (GenBank numbers MT444183-350 and MT444352-415) were obtained from the nucleotide database of the National Center for Biotechnology
Viruses 2021, 13, 1851 5 of 17
Information (NCBI). For each isolate, eight segments were concatenated in order of de-creasing segment length. Concatenated sequences were aligned using MAFFT [31], andmaximum likelihood trees were generated using RaxML as implemented in GeneiousPrime 2019.2.3 (Biomatters Ltd.; Auckland, New Zealand) and the CIPRES Science Gate-way [32]. Pairwise sequence identities among the concatenated genomes of the three virusisolates were calculated in Geneious Prime 2019.2.3. Additionally, pairwise differencesamong the genomes of the three isolates were identified and annotated using custom scriptsin Python 3.8.5 (Conda version 4.10.1, https://anaconda.com; accessed on 3 September2020). A sequence difference was considered nonsynonymous if the change results in anamino acid change in at least one protein encoded in the corresponding segment.
3. Results3.1. Infectivity, Transmission, and Pathogenicity of the H7N3 LPAIVs in Turkeys and Chickens
Birds were considered infected if they shed virus and/or seroconverted by the endof the study (14 dpi or 13 dpc). Results are presented in Table 1. None of the turkeysinoculated with the low dose (2 log10 EID50) of LPAIV-1 became infected; however, allturkeys were infected in the medium (3 log10 EID50) and high dose (5 log10 EID50) groups,resulting in a BID50 of 2.5 log10 EID50 (Table 1). Contact turkeys in the medium and high-dose groups of LPAIV-1 were also infected. All turkeys in the LPAIV-2 groups, includingcontacts, were infected, resulting in a BID50 of <2 log10 EID50 (Table 1).
All chickens inoculated with the highest dose (6 log10 EID50) of LPAIV-1 and LPAIV-2were infected. Only one chicken inoculated with 5 log10 EID50 of LPAIV-1, and one chickenfrom the groups inoculated with 3 or 5 log10 EID50 of LPAIV-2, respectively, were alsoinfected (Table 1). The BID50 was 5.7 log10 EID50 for LPAIV-1 and 5.4 log10 EID50 forLPAIV-2. Only one contact-exposed chicken in each of the LPAIV-1 and LPAIV-2 highestdose (6 log10 EID50) groups was infected (Table 1).
No or mild clinical signs (mild infraorbital swelling) were observed in the turkeysinfected with either LPAIV or the contacts in these groups. However, one turkey inoculatedwith 3 log10 EID50 of LPAIV-2 and a contact from the same group were found dead at 11 dpiand 3 dpc, respectively. Since these turkeys, or any other turkeys in this group, showed noclinical signs, and LPAIV was confirmed by sequencing the swab samples from these birds(no HPAIV), we concluded that the cause of death was not related to the LPAIV infection,since LPAIVs do not cause mortality if not complicated with other factors. No gross lesionswere identified in the dead turkeys, and the cause of death was not determined. No clinicalsigns were observed in the chickens infected with the LPAIVs, and no gross lesions wereobserved in the birds necropsied at 2 dpi.
3.2. Infectivity, Transmission, and Pathogenicity of the H7N3 HPAIV in Turkeys and Chickens
All turkeys inoculated with the HPAIV at all three challenge doses, and the contactsin those groups, were infected and died, with mean death times (MDTs) between 2 and 2.4days for inoculated turkeys and 3 days post-exposure for contacts (Table 1). The BID50 forthis virus in inoculated turkeys was <2 log10 EID50. The turkeys showed neurological signs(tremors, ataxia), lethargy, green diarrhea, mild periorbital swelling, and conjunctivitis.One turkey had blood in wing feather shafts. The gross lesions observed in the two turkeysnecropsied at 2 dpi included congested internal organs, enlarged heart, and moderatesplenomegaly with parenchymal mottling.
All chickens inoculated with the medium and high doses (4 and 6 log10 EID50) ofH7N3 HPAIV were infected, but only one chicken from the low dose (2 log10 EID50) groupwas infected. Thus, the BID50 for H7N3 HPAIV in chickens was 3.7 log10 EID50. None ofthe contact chickens in this group were infected (Table 1). All infected chickens died, withMDTs between 1 and 1.6 days, which was about half a day shorter than for turkeys. Incontrast to turkeys, which showed some clinical signs before death or euthanasia, mostchickens died without showing clinical signs (peracute disease). Ruffled feathers, lethargy,anorexia, prostration, mild periorbital swelling, green diarrhea, and cyanotic combs were
Viruses 2021, 13, 1851 6 of 17
observed in the rest. The gross lesions observed in the necropsied chickens includedcongested internal organs and petechial hemorrhage in cecal tonsils.
3.3. Viral Shedding and Virus Detection in Tissues
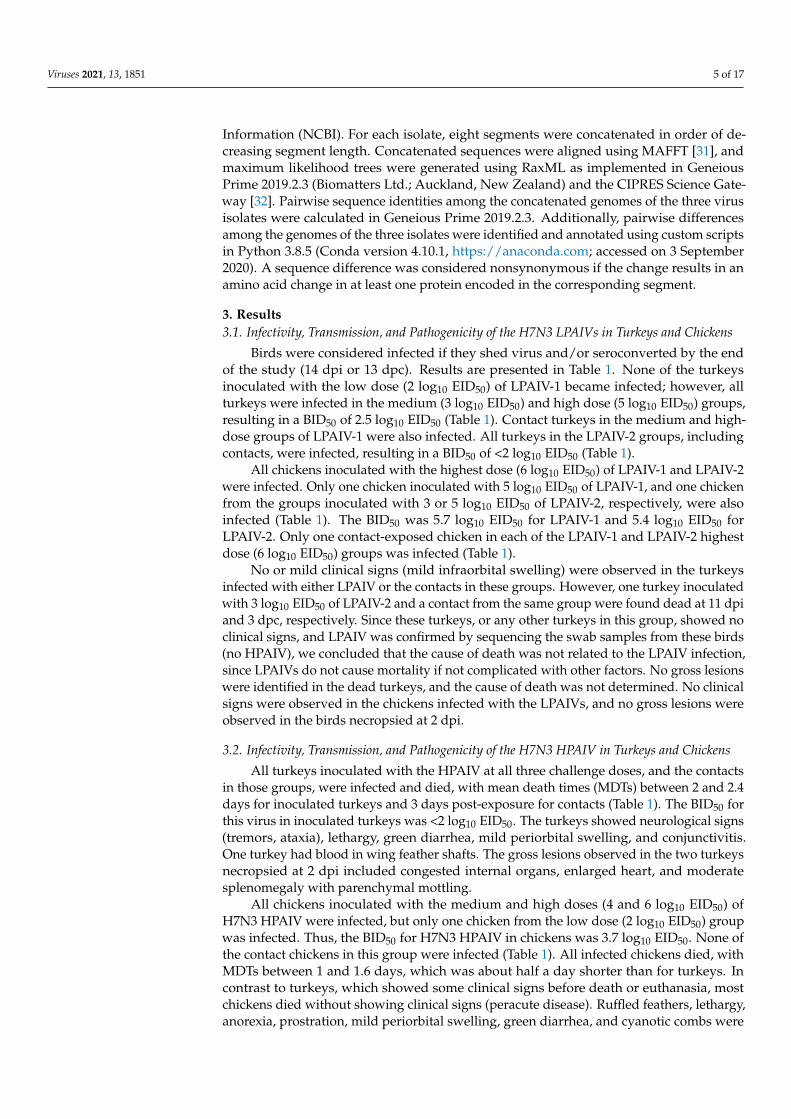
Oropharyngeal (OP) and cloacal (CL) virus shedding was evaluated in inoculatedand contact-exposed turkeys and chickens by qRT-PCR (Table 1). Figures 1 and 2 showthe shedding results for the groups inoculated with the highest dose of the viruses. Noviral RNA was detected in OP or CL swabs from turkeys inoculated with 2 log10 EID50 ofLPAIV-1. However, all turkeys that received higher doses of LPAIV-1 (3 and 5 log10 EID50)shed virus, predominantly by the OP route, with some turkeys shedding virus by bothroutes after 7 dpi. All turkeys inoculated with LPAIV-2, independent of the inoculationdose, shed virus by the OP and CL route, with higher titers shed by the OP route at3 and 4 dpi. Interestingly, at 14 dpi, the turkeys were shedding significantly higher titers bythe CL route compared to the OP route (p < 0.05) (Figure 1). The peak of OP virus sheddingfor both LPAIVs was between 3 and 7 dpi.
Viruses 2021, 13, x FOR PEER REVIEW 7 of 17
necropsy at 2 dpi. 7 One of the necropsied birds were qRT-PCR positive for at least two time points but serology was unavailable because the bird was euthanized at 2 dpi. na: not applicable.
Figure 1. Virus shedding for turkeys inoculated with 5 log10 EID50 of LPAIV-1 and LPAIV-2 or 6 log10 EID50 of HPAIV and their respective contact-exposed turkeys. Virus titers from oropharyngeal (OP) (blue) and cloacal (CL) (red) swabs were determined by qRT-PCR. Dotted lines indicate the limit of detection for each virus. Asterisks (*) indicate statistically sig-nificant difference between OP and CL virus titers (one-way ANOVA with Sidak’s multiple comparisons test; p < 0.05). Only two contact birds were available; thus, no statistical test was performed for these groups.
High viral titers were shed by all HPAIV-inoculated turkeys regardless of the dose received. Virus was detected at 12 h post-inoculation (hpi) from turkeys inoculated with 6 log10 EID50 (Figure 1). All turkeys shed HPAIV by the CL route, but virus titers were significantly lower than what were observed in OP swabs (Figure 1).
Independent of the virus and dose used, contact-exposed turkeys had similar shed-ding patterns to those observed in the inoculated turkeys (Figure 1), with virus detected in the OP samples at 2 dpc and subsequently in both OP and CL samples in the following days (Figure 1).
In the chickens inoculated with the LPAIV-1 and LPAIV-2, OP virus shedding was detected in all the birds that received the highest virus dose (6 log10 EID50); but low or no virus was detected in CL samples (Figure 2 and Table 1). One chicken in the group inoc-ulated with 5 log10 EID50 of LPAIV-1 and one chicken in each group that received 3 or 5 log10 EID50 of LPAIV-2 also shed virus (Table 1). The chickens inoculated with 5 log10 EID50 of LPAIV-1 shed higher virus titers for more days compared to chickens inoculated with LPAIV-2 (Figure 2). All chickens inoculated with 4 log10 EID50 (Table 1) and 6 log10 EID50 (Table 1 and Figure 2) of the HPAIV shed high virus titers by the OP and CL routes. Only one of five chickens inoculated with 2 log10 EID50 of the HPAIV shed at 12 hpi and was euthanized due to severe clinical signs (Table 1).
Contact chickens that became infected in the groups inoculated with 6 log10 EID50 of the LPAIVs shed low virus titers by both routes (Figure 2). However, chickens exposed by contact to the HPAIV-inoculated chickens did not shed any detectable virus (Figure 2).
Figure 1. Virus shedding for turkeys inoculated with 5 log10 EID50 of LPAIV-1 and LPAIV-2 or 6 log10 EID50 of HPAIVand their respective contact-exposed turkeys. Virus titers from oropharyngeal (OP) (blue) and cloacal (CL) (red) swabswere determined by qRT-PCR. Dotted lines indicate the limit of detection for each virus. Asterisks (*) indicate statisticallysignificant difference between OP and CL virus titers (one-way ANOVA with Sidak’s multiple comparisons test; p < 0.05).Only two contact birds were available; thus, no statistical test was performed for these groups.

Viruses 2021, 13, 1851 7 of 17
Viruses 2021, 13, x FOR PEER REVIEW 8 of 17
These contact chickens also did not show clinical signs or seroconverted, so they were not considered infected (Table 1).
Figure 2. Virus shedding for chickens inoculated with 6 log10 EID50 of LPAIV-1, LPAIV-2, or HPAIV. Virus titers from oropharyngeal (OP) (blue) and cloacal (CL) (red) swabs were determined by qRT-PCR. Dotted lines indicate the limit of detection for each virus. Asterisks (*) indicate statistically significant difference between OP and CL virus titers (one-way ANOVA with Sidak’s multiple comparisons test; p < 0.05).
To compare the amount and duration of virus shedding for all three isolates, areas under the curve (AUC) were calculated using qRT-PCR data from groups inoculated with the highest doses of the isolates (5 or 6 log10 EID50) (Figure 3). Except for CL viral shedding by chickens inoculated with 6 log10 EID50 of LPAIV-2, turkeys have a significantly higher AUC values for virus shedding compared to chickens for LPAIV-1 and LPAIV-2 but not HPAIV (Figure 3). For turkeys, AUCs of OP and CL shedding were significantly different between HPAIV and LPAIV-1 or LPAIV-2. No differences in OP or CL shedding for tur-keys were observed between LPAIV-1 and LPAIV-2. For chickens given a 6 log10 EID50 dose, AUCs for OP shedding were significantly different between HPAIV and LPAIV-1 or LPAIV-2, while AUCs for CL shedding were only statistically significant between HPAIV and LPAIV-1. Statistically significant differences in AUCs between chickens inoc-ulated with 6 log10 EID50 of LPAIV-1 and LPAIV-2 were only observed for OP shedding but not with CL shedding. Thus, in chickens, AUCs of OP shedding was higher in LPAIV-1 compared to that of LPAIV-2 or HPAIV (Figure 3, Supplementary Table S1).
Figure 2. Virus shedding for chickens inoculated with 6 log10 EID50 of LPAIV-1, LPAIV-2, or HPAIV. Virus titers fromoropharyngeal (OP) (blue) and cloacal (CL) (red) swabs were determined by qRT-PCR. Dotted lines indicate the limit ofdetection for each virus. Asterisks (*) indicate statistically significant difference between OP and CL virus titers (one-wayANOVA with Sidak’s multiple comparisons test; p < 0.05).
High viral titers were shed by all HPAIV-inoculated turkeys regardless of the dosereceived. Virus was detected at 12 h post-inoculation (hpi) from turkeys inoculated with6 log10 EID50 (Figure 1). All turkeys shed HPAIV by the CL route, but virus titers weresignificantly lower than what were observed in OP swabs (Figure 1).
Independent of the virus and dose used, contact-exposed turkeys had similar sheddingpatterns to those observed in the inoculated turkeys (Figure 1), with virus detected in theOP samples at 2 dpc and subsequently in both OP and CL samples in the following days(Figure 1).
In the chickens inoculated with the LPAIV-1 and LPAIV-2, OP virus shedding wasdetected in all the birds that received the highest virus dose (6 log10 EID50); but low orno virus was detected in CL samples (Figure 2 and Table 1). One chicken in the groupinoculated with 5 log10 EID50 of LPAIV-1 and one chicken in each group that received 3 or5 log10 EID50 of LPAIV-2 also shed virus (Table 1). The chickens inoculated with 5 log10EID50 of LPAIV-1 shed higher virus titers for more days compared to chickens inoculatedwith LPAIV-2 (Figure 2). All chickens inoculated with 4 log10 EID50 (Table 1) and 6 log10EID50 (Table 1 and Figure 2) of the HPAIV shed high virus titers by the OP and CL routes.Only one of five chickens inoculated with 2 log10 EID50 of the HPAIV shed at 12 hpi andwas euthanized due to severe clinical signs (Table 1).
Contact chickens that became infected in the groups inoculated with 6 log10 EID50 ofthe LPAIVs shed low virus titers by both routes (Figure 2). However, chickens exposedby contact to the HPAIV-inoculated chickens did not shed any detectable virus (Figure 2).These contact chickens also did not show clinical signs or seroconverted, so they were notconsidered infected (Table 1).

Viruses 2021, 13, 1851 8 of 17
Table 1. Infectivity, lethality, and transmission results from turkeys and chickens inoculated with the US 2020 H7N3 LPAIVsand HPAIV.
BirdSpecies Virus
Dose(log10EID50)
Inoculated Contact Exposed
No. of BirdsShedding
Virus/Total
No. ofDeadBirds/Total
(MDT) 1
No. of BirdsHI Positive
/Total (MeanHI Titer) 2
No. ofBirds
Infected/Total 3
BID50(log10) 4
No. ofBirdsShed-dingVirus/Total
No. of DeadBirds/Total
(MDT)
No. ofBirds HIPositive
/Total(Mean HI
Titer) 2
No. ofBirds
Infected/Total 3
Turkeys
LPAIV-12 0/4 0/4 0/4 (<3.0) 0/4
2.5na na na na
3 5/5 0/5 5/5 (9.4) 5/5 2/2 0/2 2/2 (10) 2/25 5/5 0/5 5/5 (9.4) 5/5 2/2 0/2 2/2 (10) 2/2
LPAIV-22 5/5 0/5 5/5 (8.0) 5/5
<2na na na na
3 5/5 1/5 5 4/4 (6.5) 5/5 2/2 1/2 5 1/1 (8.0) 2/25 5/5 0/5 5/5 (7.6) 5/5 2/2 0/2 2/2 (6.0) 2/2
HPAIV2 5/5 5/5 (2.4) na 5/5
<2na na na na
4 5/5 5/5 (2.2) na 5/5 2/2 2/2 (3) na 2/26 5/5 5/5 (2.0) na 5/5 2/2 2/2 (3) na 2/2
Chickens
LPAIV-1
2 0/5 0/5 0/5 (<3.0) 0/5
5.7
0/3 0/3 0/3 (<3.0) 0/33 0/5 0/5 0/5 (<3.0) 0/5 0/3 0/3 0/3 (<3.0) 0/35 1/8 0/8 0/5 6,7 (<3.0) 1/8 0/3 0/3 0/3 (<3.0) 0/36 8/8 0/8 5/5 6 (6.0) 8/8 3/3 0/3 1/3 (5.0) 3/3
LPAIV-2
2 0/5 0/5 0/5 (<3.0) 0/5
5.4
0/3 0/3 0/3 (<3.0) 0/33 1/5 0/5 1/5 (3.0) 1/5 0/3 0/3 0/3 (<3.0) 0/35 1/8 0/8 0/5 6,7 (3.0) 1/8 0/3 0/3 0/3 (<3.0) 0/36 8/8 0/8 5/5 6 (4.5) 8/8 3/3 0/3 1/3 (7.0) 3/3
HPAIV2 1/5 1/5 (1) 0/5 (<3.0) 1/5
3.70/3 0/3 0/3 (<3.0) 0/3
4 5/5 5/5 (1.6) na 5/5 0/3 0/3 0/3 (<3.0) 0/36 8/8 8/8 (1.6) na 8/8 0/3 0/3 0/3 (<3.0) 0/3
1 MDT, mean death time, number of dead birds × dpi/total dead birds expressed as dpi (days post-inoculation), or dpc, (days post-contact). 2 Mean HI titers for birds that survived (14 dpi or 13 dpc). Titer expressed in geometric mean titers (GMT log2). Samples withtiters < 3.0 log2 GMT were considered negative. 3 Inoculated or contact birds were considered infected if they shed virus and/or werepositive for antibodies at 14 dpi or 13 dpc. 4 BID50: 50% bird infectious dose. 5 Birds died of undetermined causes. qRT-PCR positive for atleast two time points. 6 The number of birds is reduced due to necropsy at 2 dpi. 7 One of the necropsied birds were qRT-PCR positive forat least two time points but serology was unavailable because the bird was euthanized at 2 dpi. na: not applicable.
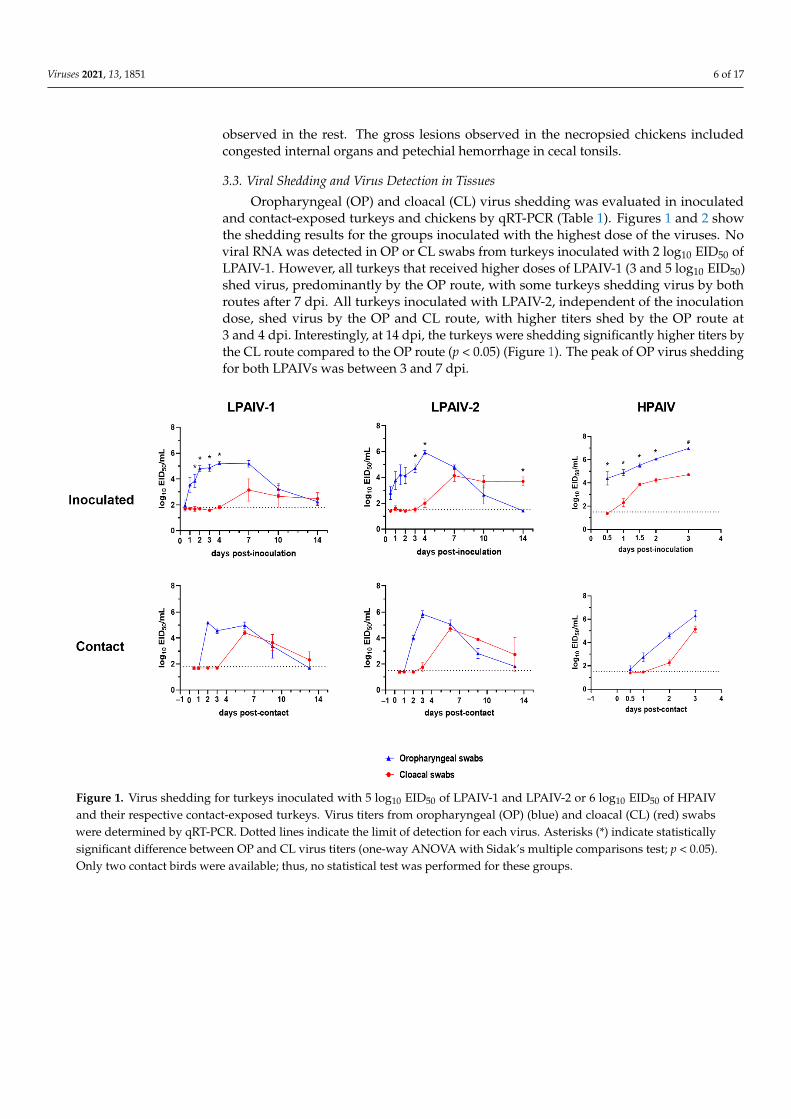
To compare the amount and duration of virus shedding for all three isolates, areasunder the curve (AUC) were calculated using qRT-PCR data from groups inoculated withthe highest doses of the isolates (5 or 6 log10 EID50) (Figure 3). Except for CL viral sheddingby chickens inoculated with 6 log10 EID50 of LPAIV-2, turkeys have a significantly higherAUC values for virus shedding compared to chickens for LPAIV-1 and LPAIV-2 but notHPAIV (Figure 3). For turkeys, AUCs of OP and CL shedding were significantly differentbetween HPAIV and LPAIV-1 or LPAIV-2. No differences in OP or CL shedding forturkeys were observed between LPAIV-1 and LPAIV-2. For chickens given a 6 log10 EID50dose, AUCs for OP shedding were significantly different between HPAIV and LPAIV-1 orLPAIV-2, while AUCs for CL shedding were only statistically significant between HPAIVand LPAIV-1. Statistically significant differences in AUCs between chickens inoculatedwith 6 log10 EID50 of LPAIV-1 and LPAIV-2 were only observed for OP shedding butnot with CL shedding. Thus, in chickens, AUCs of OP shedding was higher in LPAIV-1compared to that of LPAIV-2 or HPAIV (Figure 3, Supplementary Table S1).
The brain, heart, lung, muscle, and spleen were collected from necropsied birds forviral quantification by qRT-PCR (Table 2). We analyzed tissues from chickens inoculatedwith the H7N3 LPAIV-1, LPAIV-2, and the HPAIV. As a result of the reduced number ofturkeys, only tissues from HPAIV-inoculated turkeys were collected and examined. Ingeneral, results obtained for viral detection in turkey and chicken tissues were consistentwith the mortality data, with high virus titers found in most tissues from birds infectedwith the HPAIV. Turkeys had high titers of virus (ranging from 5.7 to 7.7 log10 EID50) inall tissues analyzed. Most tissues collected from the HPAIV-infected chickens also hadhigh virus titers, except for one of the chickens from the low-dose group, which had highvirus titers (7.4 log10 EID50) in the heart and no or low titers in the other tissues, and thechicken from the high-dose group, which had high virus titers in all tissues except the heart(Table 2). Very low or no virus was detected in tissues from the chickens inoculated withthe LPAIVs (1.62 ± 0.1 log10 EID50; p < 0.05).
Viruses 2021, 13, 1851 9 of 17Viruses 2021, 13, x FOR PEER REVIEW 9 of 17
Figure 3. Area under the curve calculation for qRT-PCR data to quantify the amount and duration of virus shed. Asterisks (*) indicate statistically significant difference between indicated groups (one-way ANOVA with Sidak’s multiple compar-isons test; p < 0.05).
The brain, heart, lung, muscle, and spleen were collected from necropsied birds for viral quantification by qRT-PCR (Table 2). We analyzed tissues from chickens inoculated with the H7N3 LPAIV-1, LPAIV-2, and the HPAIV. As a result of the reduced number of turkeys, only tissues from HPAIV-inoculated turkeys were collected and examined. In general, results obtained for viral detection in turkey and chicken tissues were consistent with the mortality data, with high virus titers found in most tissues from birds infected with the HPAIV. Turkeys had high titers of virus (ranging from 5.7 to 7.7 log10 EID50) in all tissues analyzed. Most tissues collected from the HPAIV-infected chickens also had high virus titers, except for one of the chickens from the low-dose group, which had high virus titers (7.4 log10 EID50) in the heart and no or low titers in the other tissues, and the chicken from the high-dose group, which had high virus titers in all tissues except the heart (Table 2). Very low or no virus was detected in tissues from the chickens inoculated with the LPAIVs (1.62 ± 0.1 log10 EID50; p < 0.05).
Table 2. Virus detection in tissues of turkeys and chickens inoculated with the 2020 H7N3 HPAIV. Tissues were taken from three birds euthanized at 2 dpi and virus titer was determined by qRT-PCR.
Species Bird
Number Dose Received
(log10 EID50) Virus Titer (log10 EID50/g)
Brain Heart Lung Muscle Spleen
Turkey 1 6 6.5 7.7 6.3 5.9 6.0 2 6 6.7 7.0 6.2 5.8 6.0 3 6 6.6 7.7 6.2 5.7 6.3
Chicken 1 2 2.5 7.4 - 2.4 - 2 4 6.8 7.5 6.4 7.0 6.8 3 6 * 7.0 1.8 6.3 7.0 6.7
- = negative. * Seven out of the eight chickens that were given a dose of 6 log10 EID50 died or were euthanized at 1.5 dpi. Thus, two chickens from other groups (dose 2 and 4 log10 EID50) were chosen for necropsy.
3.4. Sequence Comparisons of the H7N3 Viruses Phylogenetic trees of concatenated genome sequences from the H7N3 outbreak in
North and South Carolina were reconstructed as previously reported [13] (Figure 4). All outbreak sequences were highly related to each other with about 99% pairwise sequence identities in each segment. Thus, the outbreak was likely caused by a single introduction from a wild bird [13]. Moreover, phylogenetic trees of each segment were congruent with the phylogenetic trees constructed from concatenated sequences.
Figure 3. Area under the curve calculation for qRT-PCR data to quantify the amount and duration of virus shed. Asterisks (*)indicate statistically significant difference between indicated groups (one-way ANOVA with Sidak’s multiple comparisonstest; p < 0.05).
Table 2. Virus detection in tissues of turkeys and chickens inoculated with the 2020 H7N3 HPAIV. Tissues were taken fromthree birds euthanized at 2 dpi and virus titer was determined by qRT-PCR.
SpeciesBird
NumberDose Received(log10 EID50)
Virus Titer (log10 EID50/g)
Brain Heart Lung Muscle Spleen
Turkey1 6 6.5 7.7 6.3 5.9 6.02 6 6.7 7.0 6.2 5.8 6.03 6 6.6 7.7 6.2 5.7 6.3
Chicken1 2 2.5 7.4 - 2.4 -2 4 6.8 7.5 6.4 7.0 6.83 6 * 7.0 1.8 6.3 7.0 6.7
- = negative. * Seven out of the eight chickens that were given a dose of 6 log10 EID50 died or were euthanized at 1.5 dpi. Thus, two chickensfrom other groups (dose 2 and 4 log10 EID50) were chosen for necropsy.
3.4. Sequence Comparisons of the H7N3 Viruses
Phylogenetic trees of concatenated genome sequences from the H7N3 outbreak inNorth and South Carolina were reconstructed as previously reported [13] (Figure 4). Alloutbreak sequences were highly related to each other with about 99% pairwise sequenceidentities in each segment. Thus, the outbreak was likely caused by a single introductionfrom a wild bird [13]. Moreover, phylogenetic trees of each segment were congruent withthe phylogenetic trees constructed from concatenated sequences.
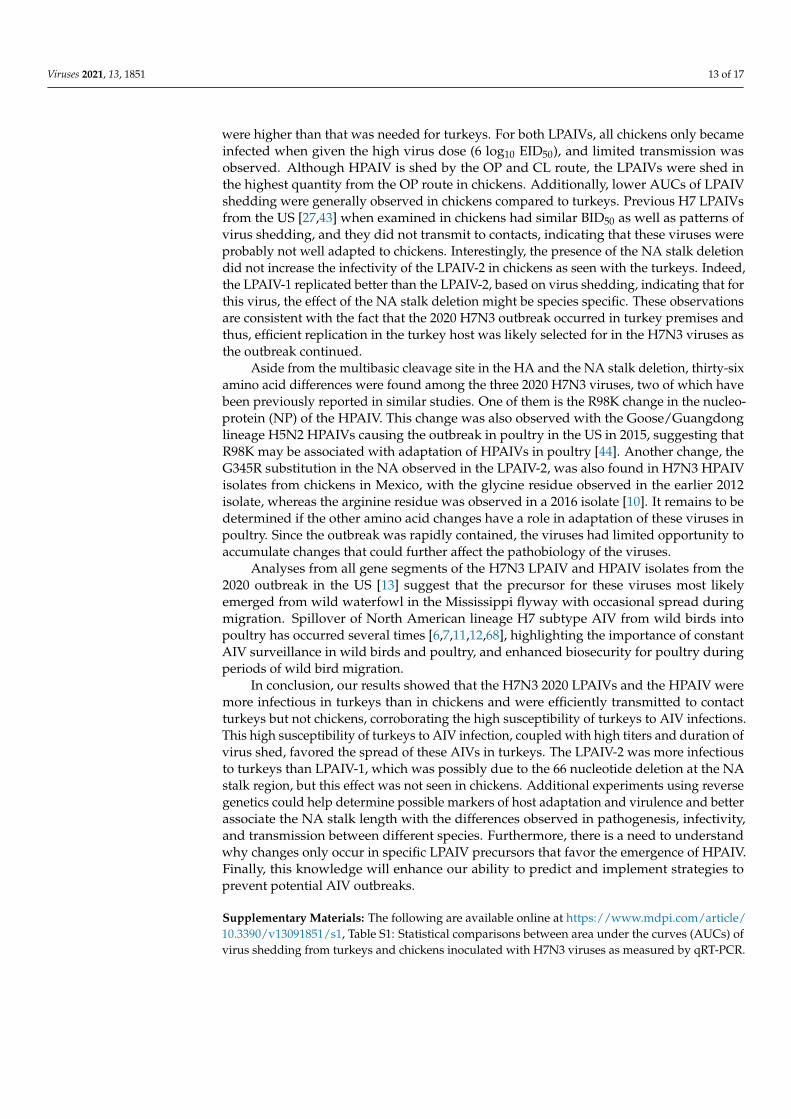
The LPAIV-1 and the HPAIV viruses used in this study belong to the main cluster ofoutbreak isolates, which is called Cluster A as in [13]. The LPAIV-2 belongs to a distinctcluster of isolates, Cluster C, which branched out early during the outbreak and had arelatively long branch length and is relatively distant to Cluster A [13]. Isolates withthe NA stalk deletion, including LPAIV-2, are exclusively found in Cluster C. Pairwisewhole genome sequence comparison of the H7N3 inoculum (Table 3) were also consistentwith these observations in that LPAIV-1 and HPAIV are more closely related compared toLPAIV-2. Specific nucleotide sequence differences among the isolates were additionallyidentified and mapped along the genome (Figure 5 and Table 4). Thirty-six amino acidchanges were found out of the fifty-seven nucleotide changes enumerated among allpairwise comparisons of isolates characterized in vivo. The major amino acid differencesfound were the NA stalk deletion in LPAIV-2 and the insertion of the multibasic cleavagesite in HPAIV. Other notable changes were R98K, I353V in the nucleoprotein (NP), andG345R in the NA, which have been previously associated with changes in the pathobiologyof AIVs in gallinaceous species (Table 4).
Viruses 2021, 13, 1851 10 of 17Viruses 2021, 13, x FOR PEER REVIEW 10 of 17
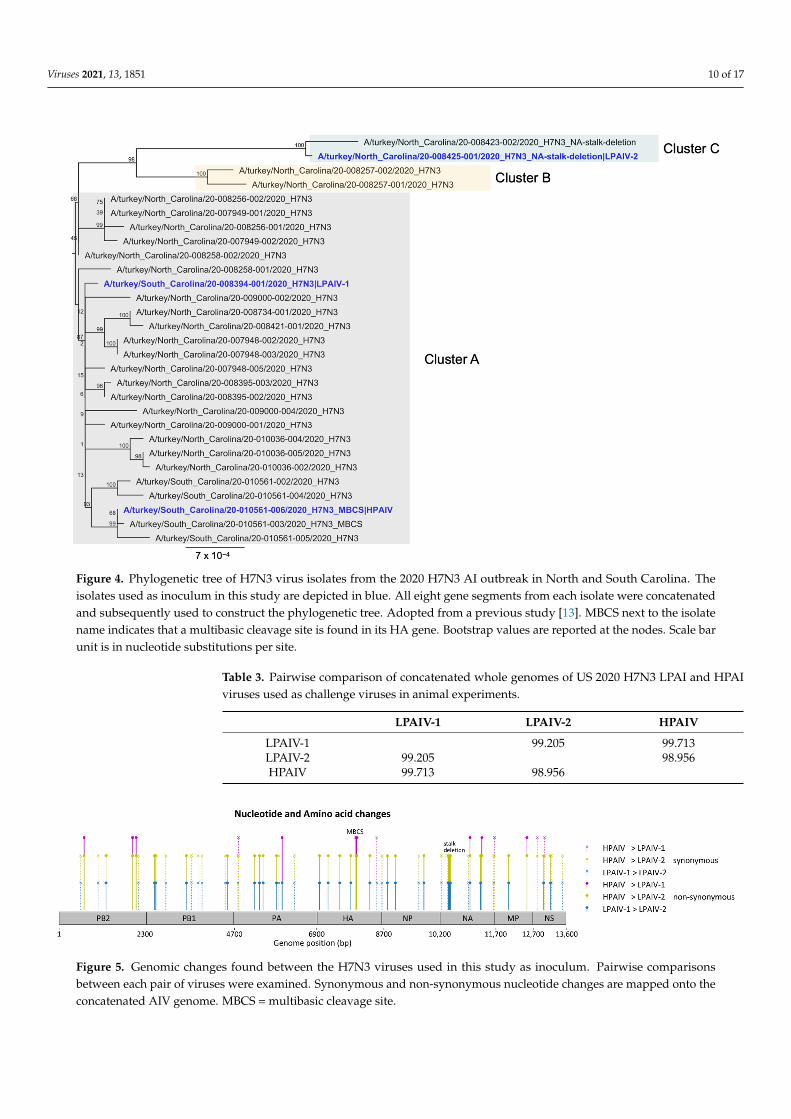
Figure 4. Phylogenetic tree of H7N3 virus isolates from the 2020 H7N3 AI outbreak in North and South Carolina. The isolates used as inoculum in this study are depicted in blue. All eight gene segments from each isolate were concatenated and subsequently used to construct the phylogenetic tree. Adopted from a previous study [13]. MBCS next to the isolate name indicates that a multibasic cleavage site is found in its HA gene. Bootstrap values are reported at the nodes. Scale bar unit is in nucleotide substitutions per site.
The LPAIV-1 and the HPAIV viruses used in this study belong to the main cluster of outbreak isolates, which is called Cluster A as in [13]. The LPAIV-2 belongs to a distinct cluster of isolates, Cluster C, which branched out early during the outbreak and had a relatively long branch length and is relatively distant to Cluster A [13]. Isolates with the NA stalk deletion, including LPAIV-2, are exclusively found in Cluster C. Pairwise whole genome sequence comparison of the H7N3 inoculum (Table 3) were also consistent with these observations in that LPAIV-1 and HPAIV are more closely related compared to LPAIV-2. Specific nucleotide sequence differences among the isolates were additionally identified and mapped along the genome (Figure 5 and Table 4). Thirty-six amino acid changes were found out of the fifty-seven nucleotide changes enumerated among all pair-wise comparisons of isolates characterized in vivo. The major amino acid differences found were the NA stalk deletion in LPAIV-2 and the insertion of the multibasic cleavage site in HPAIV. Other notable changes were R98K, I353V in the nucleoprotein (NP), and G345R in the NA, which have been previously associated with changes in the pathobiology of AIVs in gallinaceous species (Table 4).
Figure 4. Phylogenetic tree of H7N3 virus isolates from the 2020 H7N3 AI outbreak in North and South Carolina. Theisolates used as inoculum in this study are depicted in blue. All eight gene segments from each isolate were concatenatedand subsequently used to construct the phylogenetic tree. Adopted from a previous study [13]. MBCS next to the isolatename indicates that a multibasic cleavage site is found in its HA gene. Bootstrap values are reported at the nodes. Scale barunit is in nucleotide substitutions per site.
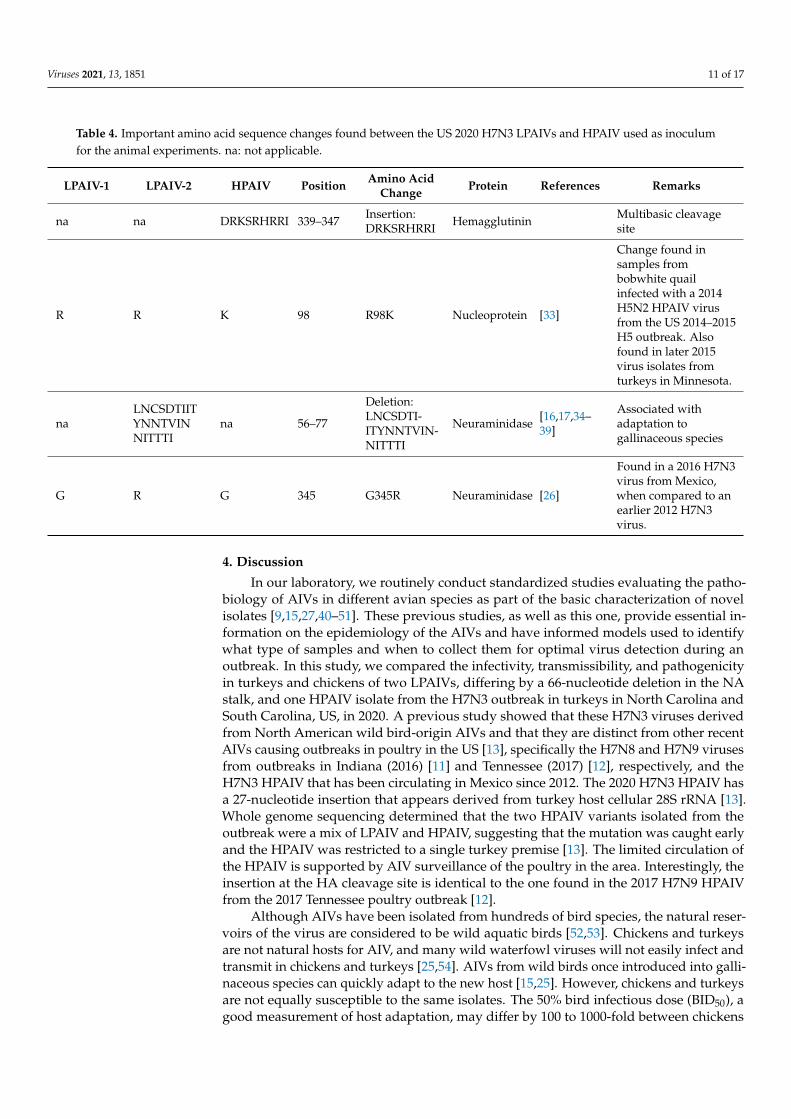
Table 3. Pairwise comparison of concatenated whole genomes of US 2020 H7N3 LPAI and HPAIviruses used as challenge viruses in animal experiments.
LPAIV-1 LPAIV-2 HPAIV
LPAIV-1 99.205 99.713LPAIV-2 99.205 98.956HPAIV 99.713 98.956
Viruses 2021, 13, x FOR PEER REVIEW 11 of 17
Table 3. Pairwise comparison of concatenated whole genomes of US 2020 H7N3 LPAI and HPAI viruses used as challenge viruses in animal experiments.
LPAIV-1 LPAIV-2 HPAIV LPAIV-1 99.205 99.713 LPAIV-2 99.205 98.956 HPAIV 99.713 98.956
Figure 5. Genomic changes found between the H7N3 viruses used in this study as inoculum. Pairwise comparisons be-tween each pair of viruses were examined. Synonymous and non-synonymous nucleotide changes are mapped onto the concatenated AIV genome. MBCS = multibasic cleavage site.
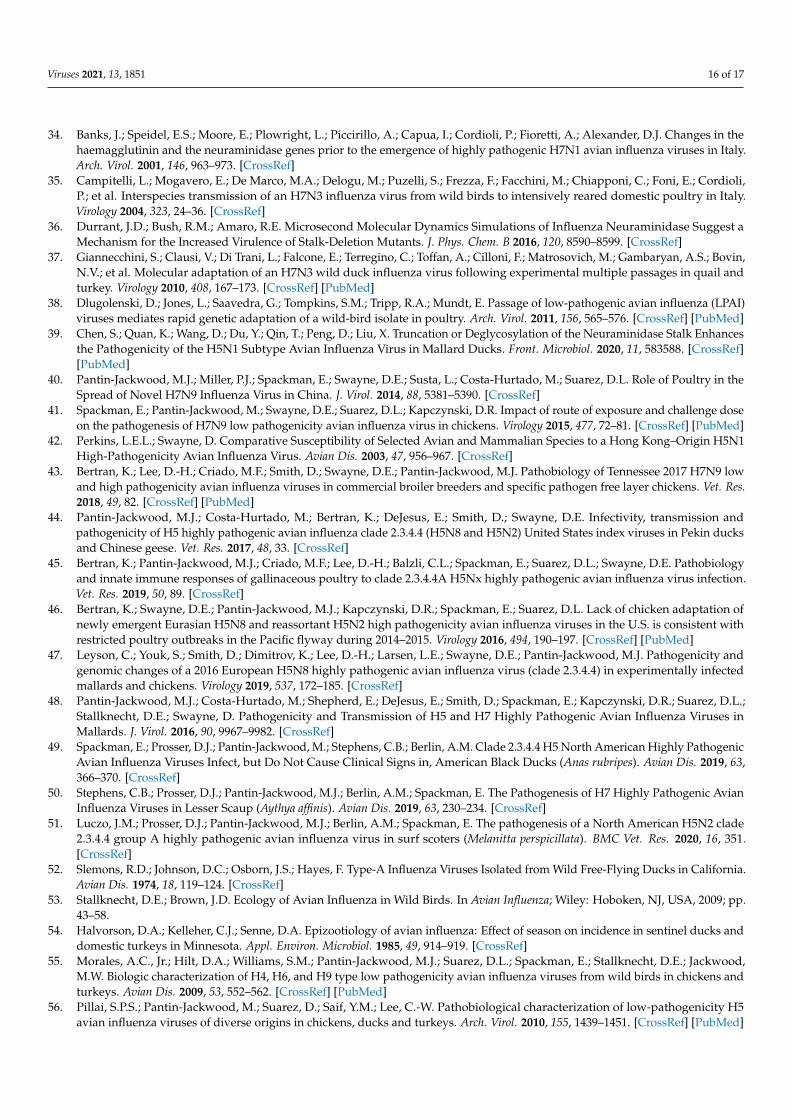
Table 4. Important amino acid sequence changes found between the US 2020 H7N3 LPAIVs and HPAIV used as inoculum for the animal experiments. na: not applicable.
LPAIV-1 LPAIV-2 HPAIV Position Amino Acid Change Protein References Remarks
na na DRKSRHRRI 339–347 Insertion:
DRKSRHRRI Hemagglutinin Multibasic cleavage site
R R K 98 R98K Nucleoprotein [33]
Change found in samples from bobwhite quail infected with a 2014 H5N2 HPAIV virus from the US 2014-2015 H5 outbreak. Also found in later 2015 virus isolates from turkeys in Minnesota.
na LNCSDTIITYNNTVINNITTTI
na 56–77 Deletion: LNCSDTIITYNNTVINNITTTI
Neuraminidase [16,17,34–39]
Associated with adaptation to gallinaceous species
G R G 345 G345R Neuraminidase [26]
Found in a 2016 H7N3 virus from Mexico, when compared to an earlier 2012 H7N3 virus.
4. Discussion In our laboratory, we routinely conduct standardized studies evaluating the patho-
biology of AIVs in different avian species as part of the basic characterization of novel isolates [9,15,27,40–51]. These previous studies, as well as this one, provide essential in-formation on the epidemiology of the AIVs and have informed models used to identify what type of samples and when to collect them for optimal virus detection during an out-break. In this study, we compared the infectivity, transmissibility, and pathogenicity in turkeys and chickens of two LPAIVs, differing by a 66-nucleotide deletion in the NA stalk, and one HPAIV isolate from the H7N3 outbreak in turkeys in North Carolina and South
Figure 5. Genomic changes found between the H7N3 viruses used in this study as inoculum. Pairwise comparisonsbetween each pair of viruses were examined. Synonymous and non-synonymous nucleotide changes are mapped onto theconcatenated AIV genome. MBCS = multibasic cleavage site.
Viruses 2021, 13, 1851 11 of 17
Table 4. Important amino acid sequence changes found between the US 2020 H7N3 LPAIVs and HPAIV used as inoculumfor the animal experiments. na: not applicable.
LPAIV-1 LPAIV-2 HPAIV Position Amino AcidChange Protein References Remarks
na na DRKSRHRRI 339–347 Insertion:DRKSRHRRI Hemagglutinin Multibasic cleavage
site
R R K 98 R98K Nucleoprotein [33]
Change found insamples frombobwhite quailinfected with a 2014H5N2 HPAIV virusfrom the US 2014–2015H5 outbreak. Alsofound in later 2015virus isolates fromturkeys in Minnesota.
naLNCSDTIITYNNTVINNITTTI
na 56–77
Deletion:LNCSDTI-ITYNNTVIN-NITTTI
Neuraminidase [16,17,34–39]
Associated withadaptation togallinaceous species
G R G 345 G345R Neuraminidase [26]
Found in a 2016 H7N3virus from Mexico,when compared to anearlier 2012 H7N3virus.
4. Discussion
In our laboratory, we routinely conduct standardized studies evaluating the patho-biology of AIVs in different avian species as part of the basic characterization of novelisolates [9,15,27,40–51]. These previous studies, as well as this one, provide essential in-formation on the epidemiology of the AIVs and have informed models used to identifywhat type of samples and when to collect them for optimal virus detection during anoutbreak. In this study, we compared the infectivity, transmissibility, and pathogenicityin turkeys and chickens of two LPAIVs, differing by a 66-nucleotide deletion in the NAstalk, and one HPAIV isolate from the H7N3 outbreak in turkeys in North Carolina andSouth Carolina, US, in 2020. A previous study showed that these H7N3 viruses derivedfrom North American wild bird-origin AIVs and that they are distinct from other recentAIVs causing outbreaks in poultry in the US [13], specifically the H7N8 and H7N9 virusesfrom outbreaks in Indiana (2016) [11] and Tennessee (2017) [12], respectively, and theH7N3 HPAIV that has been circulating in Mexico since 2012. The 2020 H7N3 HPAIV hasa 27-nucleotide insertion that appears derived from turkey host cellular 28S rRNA [13].Whole genome sequencing determined that the two HPAIV variants isolated from theoutbreak were a mix of LPAIV and HPAIV, suggesting that the mutation was caught earlyand the HPAIV was restricted to a single turkey premise [13]. The limited circulation ofthe HPAIV is supported by AIV surveillance of the poultry in the area. Interestingly, theinsertion at the HA cleavage site is identical to the one found in the 2017 H7N9 HPAIVfrom the 2017 Tennessee poultry outbreak [12].
Although AIVs have been isolated from hundreds of bird species, the natural reser-voirs of the virus are considered to be wild aquatic birds [52,53]. Chickens and turkeysare not natural hosts for AIV, and many wild waterfowl viruses will not easily infect andtransmit in chickens and turkeys [25,54]. AIVs from wild birds once introduced into galli-naceous species can quickly adapt to the new host [15,25]. However, chickens and turkeysare not equally susceptible to the same isolates. The 50% bird infectious dose (BID50), agood measurement of host adaptation, may differ by 100 to 1000-fold between chickens

Viruses 2021, 13, 1851 12 of 17
and turkeys [25]. Turkeys appear to be more susceptible to AIV infection than chickens formany AIV isolates from wild waterfowl and poultry [15,27,55–57].
HPAIV causes a severe systemic disease with high mortality in chickens, turkeys,and other gallinaceous species [2,3]. LPAIV typically causes mild to moderate respiratorydisease and can interrupt egg production in laying hens and turkey breeders [1]. However,in well-managed birds, LPAIV infection can be subclinical, which in commercial poultrymay be problematic because the virus can circulate undetected with the risk of mutatingand becoming HPAIV. Therefore, it is crucial to continue to conduct surveillance for AIVin poultry. The viruses causing the 2020 H7N3 outbreak were detected quickly, whichpermitted rapid control and eradication.
All turkeys inoculated with the 2020 H7N3 HPAIV became infected and died within2 days, resulting in a BID50 of less than 2 log10 EID50. In addition, all contact turkeysbecame infected and died. Although the chickens infected with the HPAIV died withintwo days, the BID50 was higher (3.7 log10 EID50), and the virus did not transmit andinfect contact-exposed chickens. These results clearly show the greater susceptibility andtransmissibility of 2020 H7N3 HPAIV for turkeys than chickens, as has been previouslyreported in other HPAIV studies [14,25,27,58]. The H7N8 HPAIV from the 2016 outbreakin turkeys [27] also had a BID50 below 2 log10 EID50 and was transmitted to all contactturkeys, and chickens were also less susceptible with a BID50 of 3.2 log10 EID50 and nocontact transmission. Interestingly, chickens infected with the 2017 H7N9 HPAIV outbreakwere more susceptible to infection [43], the virus having a BID50 below 2 log10 EID50,but the virus still poorly transmitted to contact-exposed chickens [43]. The 2017 H7N9LPAIV likely persisted longer, based on the wider geographic detections, in the chickenpopulations having more opportunity to adapt to this host.
Although the hemagglutinin (HA) protein has a significant influence on the pathogen-esis of AIVs and is the major determinant of the HPAI phenotype, the neuraminidase (NA)is also involved in virus fitness and immune evasion in the host population [1,2]. The HAand NA are constantly under selective pressure due to the location of these proteins on theenvelope of the virus. The two LPAIV isolates used in our study differed in the length ofNA stalk region [13], with a 66 nucleotide deletion in the NA of the LPAIV-2 compared toLPAIV-1. A short NA stalk has been previously observed in other AIVs including H2N2,H5N1, H6N1, H7N1, H7N9, H7N3 and H9N2 subtypes [34,35,59–63]. Deletions in the NAstalk have been associated with poultry adaptation [14–17,64], outbreaks in the field [34],and experimental virus passage in gallinaceous birds [37,38]. Other studies showed thatinfluenza viruses with different NA stalk lengths have different in vitro growth characteris-tics and plaque size [39,65,66] and differences in pathogenesis in ducks and chickens [39,63].A study demonstrated that an amino acid deletion in the NA stalk can remove potentialglycosylation sites, which may interfere in the protein’s function due to possible changesin the structure and consequently affect the immune response [67].
We analyzed the impact of the NA stalk deletion by comparing two 2020 H7N3 LPAIVisolates with and without such deletion. Our results demonstrate that both H7N3 LPAIVisolates could infect directly inoculated turkeys and transmit to contact-exposed turkeys.However, the virus with the NA deletion (LPAIV-2) was more infectious (BID50 of <2 log10EID50) than the one without (LPAIV-1) (BID50 of 2.5 log10 EID50), which could indicate thatthis virus is better adapted to turkeys. The LPAIVs had similar viral shedding patternsto what was observed with the 2016 H7N8 LPAIV in turkeys, with virus shed for manydays by both the OP and CL routes [27]. The extensive cloacal virus shedding, whichwas not observed in the chickens, could in part explain the better transmissibility of theseviruses in turkeys, since higher amounts of virus shed into the environment could facilitatetransmission. Moreover, the slightly higher infectivity of LPAIV-2 shows that potentiallyless LPAIV-2 is required to infect a turkey, thereby enabling more efficient transmissiongiven the same amount of virus present in the environment.
Similar data demonstrating the high susceptibility of turkeys to H7 LPAIVs have beenpreviously published [15,27,43,58]. In chickens, the LPAIV doses required to infect chickens
Viruses 2021, 13, 1851 13 of 17
were higher than that was needed for turkeys. For both LPAIVs, all chickens only becameinfected when given the high virus dose (6 log10 EID50), and limited transmission wasobserved. Although HPAIV is shed by the OP and CL route, the LPAIVs were shed inthe highest quantity from the OP route in chickens. Additionally, lower AUCs of LPAIVshedding were generally observed in chickens compared to turkeys. Previous H7 LPAIVsfrom the US [27,43] when examined in chickens had similar BID50 as well as patterns ofvirus shedding, and they did not transmit to contacts, indicating that these viruses wereprobably not well adapted to chickens. Interestingly, the presence of the NA stalk deletiondid not increase the infectivity of the LPAIV-2 in chickens as seen with the turkeys. Indeed,the LPAIV-1 replicated better than the LPAIV-2, based on virus shedding, indicating that forthis virus, the effect of the NA stalk deletion might be species specific. These observationsare consistent with the fact that the 2020 H7N3 outbreak occurred in turkey premises andthus, efficient replication in the turkey host was likely selected for in the H7N3 viruses asthe outbreak continued.
Aside from the multibasic cleavage site in the HA and the NA stalk deletion, thirty-sixamino acid differences were found among the three 2020 H7N3 viruses, two of which havebeen previously reported in similar studies. One of them is the R98K change in the nucleo-protein (NP) of the HPAIV. This change was also observed with the Goose/Guangdonglineage H5N2 HPAIVs causing the outbreak in poultry in the US in 2015, suggesting thatR98K may be associated with adaptation of HPAIVs in poultry [44]. Another change, theG345R substitution in the NA observed in the LPAIV-2, was also found in H7N3 HPAIVisolates from chickens in Mexico, with the glycine residue observed in the earlier 2012isolate, whereas the arginine residue was observed in a 2016 isolate [10]. It remains to bedetermined if the other amino acid changes have a role in adaptation of these viruses inpoultry. Since the outbreak was rapidly contained, the viruses had limited opportunity toaccumulate changes that could further affect the pathobiology of the viruses.
Analyses from all gene segments of the H7N3 LPAIV and HPAIV isolates from the2020 outbreak in the US [13] suggest that the precursor for these viruses most likelyemerged from wild waterfowl in the Mississippi flyway with occasional spread duringmigration. Spillover of North American lineage H7 subtype AIV from wild birds intopoultry has occurred several times [6,7,11,12,68], highlighting the importance of constantAIV surveillance in wild birds and poultry, and enhanced biosecurity for poultry duringperiods of wild bird migration.
In conclusion, our results showed that the H7N3 2020 LPAIVs and the HPAIV weremore infectious in turkeys than in chickens and were efficiently transmitted to contactturkeys but not chickens, corroborating the high susceptibility of turkeys to AIV infections.This high susceptibility of turkeys to AIV infection, coupled with high titers and duration ofvirus shed, favored the spread of these AIVs in turkeys. The LPAIV-2 was more infectiousto turkeys than LPAIV-1, which was possibly due to the 66 nucleotide deletion at the NAstalk region, but this effect was not seen in chickens. Additional experiments using reversegenetics could help determine possible markers of host adaptation and virulence and betterassociate the NA stalk length with the differences observed in pathogenesis, infectivity,and transmission between different species. Furthermore, there is a need to understandwhy changes only occur in specific LPAIV precursors that favor the emergence of HPAIV.Finally, this knowledge will enhance our ability to predict and implement strategies toprevent potential AIV outbreaks.
Supplementary Materials: The following are available online at https://www.mdpi.com/article/10.3390/v13091851/s1, Table S1: Statistical comparisons between area under the curves (AUCs) ofvirus shedding from turkeys and chickens inoculated with H7N3 viruses as measured by qRT-PCR.

Viruses 2021, 13, 1851 14 of 17
Author Contributions: Conceptualization, M.J.P.-J., M.F.C., C.M.L., E.S., D.E.S. and D.L.S.; method-ology, M.J.P.-J., D.E.S., D.L.S., E.S., M.F.C. and C.M.L.; validation, M.J.P.-J., M.F.C. and C.M.L.; formalanalysis, M.J.P.-J., M.F.C. and C.M.L.; investigation, M.J.P.-J., M.F.C., C.M.L., T.O., S.Y., S.D., D.J.P. andD.R.K.; resources, M.L.K., M.L.T.; writing—original draft preparation, M.F.C., C.M.L. and M.J.P.-J.;writing—review and editing, M.F.C., C.M.L., M.J.P.-J., T.O., S.Y., S.D., E.S., D.R.K., D.J.P., D.L.S.,D.E.S., M.L.K. and M.L.T.; visualization, M.F.C., C.M.L. and M.J.P.-J.; supervision, M.J.P.-J.; projectadministration, M.J.P.-J.; funding acquisition, D.L.S. and M.J.P.-J. All authors have read and agreed tothe published version of the manuscript.
Funding: This research was supported by the United States Department of Agriculture (USDA),Agricultural Research Service (ARS) Project 6612-32000-066-00D, the USDA/ARS- Animal and PlantHealth Inspection Service (APHIS) Interagency Agreement #60-6040-6-005, and the NIH-CEIRSAgreement #AAI-12004001. This research was also supported in part by an appointment to the ARSResearch Participation Program administered by the Oak Ridge Institute for Science and Education(ORISE) through an interagency agreement between the U.S. Department of Energy (DOE) andUSDA. ORISE is managed by ORAU under DOE contract number DE-SC0014664. All opinionsexpressed in this paper are the authors’ and do not necessarily reflect the policies and views of USDA,NIH, DOE, or ORAU/ORISE. Mention of trade names or commercial products in this publicationis solely for the purpose of providing specific information and does not imply recommendation orendorsement by the USDA. The USDA is an equal opportunity provider and employer.
Institutional Review Board Statement: The study was conducted in accordance with guidelines ofthe Institutional Animal Care and Use Committee (IACUC) at the US National Poultry ResearchCenter, Athens, Georgia (USNPRC; Animal Use Proposal# USNPRC-2021-021).
Informed Consent Statement: Not applicable.
Data Availability Statement: The data that support the findings of this study are provided in thefigures and tables of the article. Additional information is available from the corresponding authorupon reasonable request.
Acknowledgments: We gratefully acknowledge the technical assistance from Scott Lee, Jesse Gal-lagher, Nikolai Lee, Ricky Zoller, animal care assistance from Charles Foley, Roger Brock, andveterinary care from Anne Hurley-Bacon. We would also like to thank Eric Gonder from Butterballfor providing the turkeys.
Conflicts of Interest: The authors declare no conflict of interest.
References1. Avian Influenza (Including Infection with High Pathogenicity Avian Influenza Viruses). Manual for Diagnostic Tests and Vaccines
for Terrestrial Animals, 2021 edition; World Health Organization (OIE), Posted Online 30 June 2021. Available online: https://www.oie.int/en/what-we-do/standards/codes-and-manuals/terrestrial-manual-online-access/ (accessed on 6 May 2021).
2. Swayne, D.E.; Suarez, D.L.; Sims, L.D. Influenza. In Diseases of Poultry; John Wiley & Sons: Hoboken, NJ, USA, 2020; pp. 210–256.3. Pantin-Jackwood, M.J.; Swayne, D.E. Pathogenesis and pathobiology of avian influenza virus infection in birds. Rev. Sci. Tech.
2009, 28, 113–136. [CrossRef]4. Lee, D.-H.; Criado, M.F.; Swayne, D.E. Pathobiological Origins and Evolutionary History of Highly Pathogenic Avian Influenza
Viruses. Cold Spring Harb. Perspect. Med. 2021, 11, a038679. [CrossRef] [PubMed]5. Rojas, H.; Moreira, R.; Avalos, P.; Capua, I.; Marangon, S. Avian influenza in poultry in Chile. Vet. Rec. 2002, 151, 188.6. Hirst, M.; Astell, C.R.; Griffith, M.; Coughlin, S.M.; Moksa, M.; Zeng, T.; Smailus, D.E.; Holt, R.; Jones, S.; Marra, M.A.; et al.
Novel Avian Influenza H7N3 Strain Outbreak, British Columbia. Emerg. Infect. Dis. 2004, 10, 2192–2195. [CrossRef] [PubMed]7. Berhane, Y.; Hisanaga, T.; Kehler, H.; Neufeld, J.; Manning, L.; Argue, C.; Handel, K.; Hooper-McGrevy, K.; Jonas, M.; Robinson,
J.; et al. Highly Pathogenic Avian Influenza Virus A (H7N3) in Domestic Poultry, Saskatchewan, Canada, 2007. Emerg. Infect. Dis.2009, 15, 1492–1495. [CrossRef] [PubMed]
8. Maurer-Stroh, S.; Lee, R.T.C.; Gunalan, V.; Eisenhaber, F. The highly pathogenic H7N3 avian influenza strain from July 2012in Mexico acquired an extended cleavage site through recombination with host 28S rRNA. Virol. J. 2013, 10, 139. [CrossRef][PubMed]
9. Kapczynski, D.R.; Pantin-Jackwood, M.; Guzman, S.G.; Ricardez, Y.; Spackman, E.; Bertran, K.; Suarez, D.L.; Swayne, D.Characterization of the 2012 Highly Pathogenic Avian Influenza H7N3 Virus Isolated from Poultry in an Outbreak in Mexico:Pathobiology and Vaccine Protection. J. Virol. 2013, 87, 9086–9096. [CrossRef]

Viruses 2021, 13, 1851 15 of 17
10. Youk, S.; Lee, D.-H.; Ferreira, H.L.; Afonso, C.L.; Absalon, A.E.; Swayne, D.E.; Suarez, D.L.; Pantin-Jackwood, M.J. Rapidevolution of Mexican H7N3 highly pathogenic avian influenza viruses in poultry. PLoS ONE 2019, 14, e0222457. [CrossRef][PubMed]
11. Killian, M.L.; Kim-Torchetti, M.; Hines, N.; Yingst, S.; DeLiberto, T.; Lee, D.-H. Outbreak of H7N8 Low Pathogenic Avian Influenzain Commercial Turkeys with Spontaneous Mutation to Highly Pathogenic Avian Influenza. Genome Announc. 2016, 4, e00457-16.[CrossRef]
12. Lee, D.H.; Torchetti, M.K.; Killian, M.L.; Berhane, Y.; Swayne, D.E. Highly Pathogenic Avian Influenza A(H7N9) Virus, Tennessee,USA, March 2017. Emerg. Infect. Dis. 2017, 23, 1860–1863. [CrossRef]
13. Youk, S.; Lee, D.-H.; Killian, M.L.; Pantin-Jackwood, M.J.; Swayne, D.E.; Torchetti, M.K. Highly Pathogenic Avian InfluenzaA(H7N3) Virus in Poultry, United States, 2020. Emerg. Infect. Dis. 2020, 26, 2966–2969. [CrossRef]
14. Li, J.; Zu Dohna, H.; Cardona, C.J.; Miller, J.; Carpenter, T.E. Emergence and Genetic Variation of Neuraminidase Stalk Deletionsin Avian Influenza Viruses. PLoS ONE 2011, 6, e14722. [CrossRef] [PubMed]
15. Spackman, E.; Gelb, J.; Preskenis, L.A.; Ladman, B.S.; Pope, C.R.; Pantin-Jackwood, M.J.; McKinley, E.T. The pathogenesis of lowpathogenicity H7 avian influenza viruses in chickens, ducks and turkeys. Virol. J. 2010, 7, 331. [CrossRef] [PubMed]
16. Hoffmann, T.W.; Munier, S.; Larcher, T.; Soubieux, D.; Ledevin, M.; Esnault, E.; Tourdes, A.; Croville, G.; Guerin, J.-L.; Quere, P.;et al. Length Variations in the NA Stalk of an H7N1 Influenza Virus Have Opposite Effects on Viral Excretion in Chickens andDucks. J. Virol. 2011, 86, 584–588. [CrossRef]
17. Munier, S.; Larcher, T.; Cormier-Aline, F.; Soubieux, D.; Su, B.; Guigand, L.; Labrosse, B.; Cherel, Y.; Quéré, P.; Marc, D.; et al. AGenetically Engineered Waterfowl Influenza Virus with a Deletion in the Stalk of the Neuraminidase Has Increased Virulence forChickens. J. Virol. 2010, 84, 940–952. [CrossRef]
18. Swayne, D.; Senne, D.; Beard, C. Influenza; American Association of Avian Pathologists: Kennett Square, PA, USA, 1998.19. Chrzastek, K.; Lee, D.-H.; Smith, D.; Sharma, P.; Suarez, D.; Pantin-Jackwood, M.J.; Kapczynski, D.R. Use of Sequence-Independent,
Single-Primer-Amplification (SISPA) for rapid detection, identification, and characterization of avian RNA viruses. Virology 2017,509, 159–166. [CrossRef] [PubMed]
20. Horimoto, T.; Kawaoka, Y. Molecular Changes in virulent mutants arising from avirulent avian influenza viruses duringReplication in 14-day-old embryonated eggs. Virology 1995, 206, 755–759. [CrossRef]
21. Lee, C.W.; Lee, Y.J.; Swayne, D.; Senne, D.; Linares, D.J.; Suarez, D. Assessing potential pathogenicity of avian influenza virus:Current and experimental system. Avian Dis. 2007, 51, 260–263. [CrossRef]
22. Li, H. Aligning Sequence Reads, Clone Sequences and Assembly Contigs with BWA-MEM. arXiv 2013, arXiv:1303.3997. Availableonline: https://www.arxiv-vanity.com/papers/1303.3997/ (accessed on 24 June 2018).
23. Dimitrov, K.M.; Sharma, P.; Volkening, J.D.; Goraichuk, I.V.; Wajid, A.; Rehmani, S.F.; Basharat, A.; Shittu, I.; Joannis, T.M.; Miller,P.J.; et al. A robust and cost-effective approach to sequence and analyze complete genomes of small RNA viruses. Virol. J. 2017,14, 72. [CrossRef]
24. Wilm, A.; Aw, P.P.K.; Bertrand, D.; Yeo, G.H.T.; Ong, S.H.; Wong, C.H.; Khor, C.C.; Petric, R.; Hibberd, M.L.; Nagarajan, N. LoFreq:A sequence-quality aware, ultra-sensitive variant caller for uncovering cell-population heterogeneity from high-throughputsequencing datasets. Nucleic Acids Res. 2012, 40, 11189–11201. [CrossRef]
25. Swayne, D.E.; Slemons, R.D. Using Mean Infectious Dose of High- and Low-Pathogenicity Avian Influenza Viruses Originatingfrom Wild Duck and Poultry as One Measure of Infectivity and Adaptation to Poultry. Avian Dis. 2008, 52, 455–460. [CrossRef]
26. Youk, S.-S.; Lee, D.-H.; Leyson, C.M.; Smith, D.; Criado, M.F.; DeJesus, E.; Swayne, D.; Pantin-Jackwood, M.J. Loss of Fitness ofMexican H7N3 Highly Pathogenic Avian Influenza Virus in Mallards after Circulating in Chickens. J. Virol. 2019, 93, e00543-19.[CrossRef]
27. Spackman, E.; Prosser, D.J.; Pantin-Jackwood, M.J.; Berlin, A.M.; Stephens, C.B. The Pathogenesis of Clade 2.3.4.4 H5 HighlyPathogenic Avian Influenza Viruses in Ruddy Duck (Oxyura Jamaicensis) and Lesser Scaup (Aythya affinis). J. Wildl. Dis. 2017, 53,832–842. [CrossRef] [PubMed]
28. Pedersen, J.C. Hemagglutination-Inhibition Assay for Influenza VIrus Subtype Identification and the Detection and Quantificationof Serum Antibodies to Influenza Virus. In Animal Influenza Virus; Spackman, E., Ed.; Humana Press: Totova, NJ, USA, 2014.
29. Reed, L.J.; Muench, H. A simple method of estimating fifty percent endpoints. Am. J. Epidemiol. 1938, 27, 493–497. [CrossRef]30. Lee, C.-W.; Suarez, D.L. Application of real-time RT-PCR for the quantitation and competitive replication study of H5 and H7
subtype avian influenza virus. J. Virol. Methods 2004, 119, 151–158. [CrossRef] [PubMed]31. Katoh, K.; Misawa, K.; Kuma, K.I.; Miyata, T. MAFFT: A novel method for rapid multiple sequence alignment based on fast
Fourier transform. Nucleic Acids Res. 2002, 30, 3059–3066. [CrossRef] [PubMed]32. Miller, M.A.; Pfeiffer, W.; Schwartz, T. Creating the CIPRES Science Gateway for inference of large phylogenetic trees. In
Proceedings of the 2010 Gateway Computing Environments Workshop (GCE), New Orleans, LA, USA, 14 November 2010; pp.1–8. [CrossRef]
33. Bertran, K.; Lee, D.-H.; Pantin-Jackwood, M.J.; Spackman, E.; Balzli, C.; Suarez, D.L.; Swayne, D.E. Pathobiology of Clade2.3.4.4 H5Nx High-Pathogenicity Avian Influenza Virus Infections in Minor Gallinaceous Poultry Supports Early Backyard FlockIntroductions in the Western United States in 2014–2015. J. Virol. 2017, 91, e00960-17. [CrossRef]
Viruses 2021, 13, 1851 16 of 17
34. Banks, J.; Speidel, E.S.; Moore, E.; Plowright, L.; Piccirillo, A.; Capua, I.; Cordioli, P.; Fioretti, A.; Alexander, D.J. Changes in thehaemagglutinin and the neuraminidase genes prior to the emergence of highly pathogenic H7N1 avian influenza viruses in Italy.Arch. Virol. 2001, 146, 963–973. [CrossRef]
35. Campitelli, L.; Mogavero, E.; De Marco, M.A.; Delogu, M.; Puzelli, S.; Frezza, F.; Facchini, M.; Chiapponi, C.; Foni, E.; Cordioli,P.; et al. Interspecies transmission of an H7N3 influenza virus from wild birds to intensively reared domestic poultry in Italy.Virology 2004, 323, 24–36. [CrossRef]
36. Durrant, J.D.; Bush, R.M.; Amaro, R.E. Microsecond Molecular Dynamics Simulations of Influenza Neuraminidase Suggest aMechanism for the Increased Virulence of Stalk-Deletion Mutants. J. Phys. Chem. B 2016, 120, 8590–8599. [CrossRef]
37. Giannecchini, S.; Clausi, V.; Di Trani, L.; Falcone, E.; Terregino, C.; Toffan, A.; Cilloni, F.; Matrosovich, M.; Gambaryan, A.S.; Bovin,N.V.; et al. Molecular adaptation of an H7N3 wild duck influenza virus following experimental multiple passages in quail andturkey. Virology 2010, 408, 167–173. [CrossRef] [PubMed]
38. Dlugolenski, D.; Jones, L.; Saavedra, G.; Tompkins, S.M.; Tripp, R.A.; Mundt, E. Passage of low-pathogenic avian influenza (LPAI)viruses mediates rapid genetic adaptation of a wild-bird isolate in poultry. Arch. Virol. 2011, 156, 565–576. [CrossRef] [PubMed]
39. Chen, S.; Quan, K.; Wang, D.; Du, Y.; Qin, T.; Peng, D.; Liu, X. Truncation or Deglycosylation of the Neuraminidase Stalk Enhancesthe Pathogenicity of the H5N1 Subtype Avian Influenza Virus in Mallard Ducks. Front. Microbiol. 2020, 11, 583588. [CrossRef][PubMed]
40. Pantin-Jackwood, M.J.; Miller, P.J.; Spackman, E.; Swayne, D.E.; Susta, L.; Costa-Hurtado, M.; Suarez, D.L. Role of Poultry in theSpread of Novel H7N9 Influenza Virus in China. J. Virol. 2014, 88, 5381–5390. [CrossRef]
41. Spackman, E.; Pantin-Jackwood, M.; Swayne, D.E.; Suarez, D.L.; Kapczynski, D.R. Impact of route of exposure and challenge doseon the pathogenesis of H7N9 low pathogenicity avian influenza virus in chickens. Virology 2015, 477, 72–81. [CrossRef] [PubMed]
42. Perkins, L.E.L.; Swayne, D. Comparative Susceptibility of Selected Avian and Mammalian Species to a Hong Kong–Origin H5N1High-Pathogenicity Avian Influenza Virus. Avian Dis. 2003, 47, 956–967. [CrossRef]
43. Bertran, K.; Lee, D.-H.; Criado, M.F.; Smith, D.; Swayne, D.E.; Pantin-Jackwood, M.J. Pathobiology of Tennessee 2017 H7N9 lowand high pathogenicity avian influenza viruses in commercial broiler breeders and specific pathogen free layer chickens. Vet. Res.2018, 49, 82. [CrossRef] [PubMed]
44. Pantin-Jackwood, M.J.; Costa-Hurtado, M.; Bertran, K.; DeJesus, E.; Smith, D.; Swayne, D.E. Infectivity, transmission andpathogenicity of H5 highly pathogenic avian influenza clade 2.3.4.4 (H5N8 and H5N2) United States index viruses in Pekin ducksand Chinese geese. Vet. Res. 2017, 48, 33. [CrossRef]
45. Bertran, K.; Pantin-Jackwood, M.J.; Criado, M.F.; Lee, D.-H.; Balzli, C.L.; Spackman, E.; Suarez, D.L.; Swayne, D.E. Pathobiologyand innate immune responses of gallinaceous poultry to clade 2.3.4.4A H5Nx highly pathogenic avian influenza virus infection.Vet. Res. 2019, 50, 89. [CrossRef]
46. Bertran, K.; Swayne, D.E.; Pantin-Jackwood, M.J.; Kapczynski, D.R.; Spackman, E.; Suarez, D.L. Lack of chicken adaptation ofnewly emergent Eurasian H5N8 and reassortant H5N2 high pathogenicity avian influenza viruses in the U.S. is consistent withrestricted poultry outbreaks in the Pacific flyway during 2014–2015. Virology 2016, 494, 190–197. [CrossRef] [PubMed]
47. Leyson, C.; Youk, S.; Smith, D.; Dimitrov, K.; Lee, D.-H.; Larsen, L.E.; Swayne, D.E.; Pantin-Jackwood, M.J. Pathogenicity andgenomic changes of a 2016 European H5N8 highly pathogenic avian influenza virus (clade 2.3.4.4) in experimentally infectedmallards and chickens. Virology 2019, 537, 172–185. [CrossRef]
48. Pantin-Jackwood, M.J.; Costa-Hurtado, M.; Shepherd, E.; DeJesus, E.; Smith, D.; Spackman, E.; Kapczynski, D.R.; Suarez, D.L.;Stallknecht, D.E.; Swayne, D. Pathogenicity and Transmission of H5 and H7 Highly Pathogenic Avian Influenza Viruses inMallards. J. Virol. 2016, 90, 9967–9982. [CrossRef]
49. Spackman, E.; Prosser, D.J.; Pantin-Jackwood, M.; Stephens, C.B.; Berlin, A.M. Clade 2.3.4.4 H5 North American Highly PathogenicAvian Influenza Viruses Infect, but Do Not Cause Clinical Signs in, American Black Ducks (Anas rubripes). Avian Dis. 2019, 63,366–370. [CrossRef]
50. Stephens, C.B.; Prosser, D.J.; Pantin-Jackwood, M.J.; Berlin, A.M.; Spackman, E. The Pathogenesis of H7 Highly Pathogenic AvianInfluenza Viruses in Lesser Scaup (Aythya affinis). Avian Dis. 2019, 63, 230–234. [CrossRef]
51. Luczo, J.M.; Prosser, D.J.; Pantin-Jackwood, M.J.; Berlin, A.M.; Spackman, E. The pathogenesis of a North American H5N2 clade2.3.4.4 group A highly pathogenic avian influenza virus in surf scoters (Melanitta perspicillata). BMC Vet. Res. 2020, 16, 351.[CrossRef]
52. Slemons, R.D.; Johnson, D.C.; Osborn, J.S.; Hayes, F. Type-A Influenza Viruses Isolated from Wild Free-Flying Ducks in California.Avian Dis. 1974, 18, 119–124. [CrossRef]
53. Stallknecht, D.E.; Brown, J.D. Ecology of Avian Influenza in Wild Birds. In Avian Influenza; Wiley: Hoboken, NJ, USA, 2009; pp.43–58.
54. Halvorson, D.A.; Kelleher, C.J.; Senne, D.A. Epizootiology of avian influenza: Effect of season on incidence in sentinel ducks anddomestic turkeys in Minnesota. Appl. Environ. Microbiol. 1985, 49, 914–919. [CrossRef]
55. Morales, A.C., Jr.; Hilt, D.A.; Williams, S.M.; Pantin-Jackwood, M.J.; Suarez, D.L.; Spackman, E.; Stallknecht, D.E.; Jackwood,M.W. Biologic characterization of H4, H6, and H9 type low pathogenicity avian influenza viruses from wild birds in chickens andturkeys. Avian Dis. 2009, 53, 552–562. [CrossRef] [PubMed]
56. Pillai, S.P.S.; Pantin-Jackwood, M.; Suarez, D.; Saif, Y.M.; Lee, C.-W. Pathobiological characterization of low-pathogenicity H5avian influenza viruses of diverse origins in chickens, ducks and turkeys. Arch. Virol. 2010, 155, 1439–1451. [CrossRef] [PubMed]
Viruses 2021, 13, 1851 17 of 17
57. Pillai, S.P.; Pantin-Jackwood, M.; Yassine, H.M.; Saif, Y.M.; Lee, C.W. The high susceptibility of turkeys to influenza viruses ofdifferent origins implies their importance as potential intermediate hosts. Avian Dis. 2010, 54, 522–526. [CrossRef]
58. Tumpey, T.M.; Kapczynski, D.R.; Swayne, D. Comparative Susceptibility of Chickens and Turkeys to Avian Influenza A H7N2Virus Infection and Protective Efficacy of a Commercial Avian Influenza H7N2 Virus Vaccine. Avian Dis. 2004, 48, 167–176.[CrossRef] [PubMed]
59. Matrosovich, M.; Zhou, N.; Kawaoka, Y.; Webster, R. The surface glycoproteins of H5 influenza viruses isolated from humans,chickens, and wild aquatic birds have distinguishable properties. J. Virol. 1999, 73, 1146–1155. [CrossRef] [PubMed]
60. Matsuoka, Y.; Swayne, D.; Thomas, C.; Rameix-Welti, M.-A.; Naffakh, N.; Warnes, C.; Altholtz, M.; Donis, R.; Subbarao, K.Neuraminidase Stalk Length and Additional Glycosylation of the Hemagglutinin Influence the Virulence of Influenza H5N1Viruses for Mice. J. Virol. 2009, 83, 4704–4708. [CrossRef]
61. Sorrell, E.M.; Song, H.; Pena, L.; Perez, D.R. A 27-Amino-Acid Deletion in the Neuraminidase Stalk Supports Replication of anAvian H2N2 Influenza A Virus in the Respiratory Tract of Chickens. J. Virol. 2010, 84, 11831–11840. [CrossRef]
62. Gao, R.; Cao, B.; Hu, Y.; Feng, Z.; Wang, D.; Hu, W.; Chen, J.; Jie, Z.; Qiu, H.; Xu, K.; et al. Human Infection with a NovelAvian-Origin Influenza A (H7N9) Virus. N. Engl. J. Med. 2013, 368, 1888–1897. [CrossRef]
63. Sun, Y.; Tan, Y.; Wei, K.; Sun, H.; Shi, Y.; Pu, J.; Yang, H.; Gao, G.F.; Yin, Y.; Feng, W.; et al. Amino Acid 316 of Hemagglutinin andthe Neuraminidase Stalk Length Influence Virulence of H9N2 Influenza Virus in Chickens and Mice. J. Virol. 2012, 87, 2963–2968.[CrossRef] [PubMed]
64. Mo, J.; Youk, S.; Pantin-Jackwood, M.J.; Suarez, D.L.; Lee, D.-H.; Killian, M.L.; Bergeson, N.H.; Spackman, E. The pathogenicityand transmission of live bird market H2N2 avian influenza viruses in chickens, Pekin ducks, and guinea fowl. Vet. Microbiol.2021, 260, 109180. [CrossRef] [PubMed]
65. Wang, Q.-Z.; Long, J.-X.; Hu, S.-L.; Wu, Y.-T.; Liu, X.-F. Biological significance of amino acids deletion in NA stalk of H5N1 avianinfluenza virus. Acta Microbiol. Sin. 2006, 46, 542–546.
66. Luo, G.; Chung, J.; Palese, P. Alterations of the stalk of the influenza virus neuraminidase: Deletions and insertions. Virus Res.1993, 29, 141–153. [PubMed]
67. Kim, P.; Jang, Y.H.; Bin Kwon, S.; Lee, C.M.; Han, G.; Seong, B.L. Glycosylation of Hemagglutinin and Neuraminidase of InfluenzaA Virus as Signature for Ecological Spillover and Adaptation among Influenza Reservoirs. Viruses 2018, 10, 183. [CrossRef][PubMed]
68. World Organisation for Animal Health Avian Influenza Portal. Available online: http://www.oie.int/en/animal-health-in-the-world/update-on-avian-influenza/ (accessed on 5 January 2021).