the nutritional composition of dairy products - dairy · pdf file3 the nutritional composition...
TRANSCRIPT

The Nutritional Composition of Dairy products1
The Nutritional Composition of Dairy products

The Nutritional Composition of Dairy products
Milk Whole milk 5 Semi-skimmed milk 6 Skimmed milk 7 Channel Island milk 8 Breakfast milk 9 Condensed milk (whole and skimmed) 10 Dried skimmed milk (fortified) 11 Evaporated whole milk 12 Evaporated milk (4% fat) 13 Flavoured milk 14 Milkshake (thick, takeaway type) 15
Yogurt and fromage frais Whole milk yogurt (plain and fruit) 16 Low fat yogurt (plain and fruit) 17 Virtually fat free (diet) yogurt (plain and fruit) 18 Greek style yogurt (plain and fruit) 19 Infant fruit flavour yogurt 20 Twinpot yogurt - thick and creamy with fruit 21 Drinking yogurt 22 Fromage frais - various types 23
Cheese Cheddar cheese (regular and half fat varieties) 24 Vegetarian Cheddar cheese 25 Cheese spread (regular and reduced fat) 26 Cottage cheese - various types 27 Cream cheese 28 Hard Cheese - average of English Cheddar, Red Leicester and Double Gloucester 29 Processed cheese slices (regular and reduced fat) 30 Stilton cheese 31 White cheese - average of Cheshire, Lancashire and Wensleydale 32
Cream Single cream 33 Soured cream 34 Whipping cream 35 Double cream 36 Clotted cream 37 Crème fraiche (full fat and half fat) 38 Dairy cream, extra thick 39 Sterilised cream, canned 40 UHT canned spray dairy cream (full fat and half fat) 41 Imitation cream - Dream Topping (made with semi-skimmed milk) 42 Imitation cream - Elmlea (single, whipping and double) 43 Imitation cream - Tip Top Dessert Topping 44
Dairy desserts Ice cream, vanilla (dairy and non-dairy) 45 Custard (made with whole or semi-skimmed milk) 46 Custard, ready to eat 47 Milk pudding (made with whole milk) 48 Rice pudding, canned (regular and low fat) 49
Page
About the tables 3-4
Contents
Sec
tion
1 S
ectio
n 2
Sec
tion
3S
ectio
n 4
Sec
tion
5

The Nutritional Composition of Dairy products3
About the Tables
Please read this information carefully before using the tables
The nutritional information on all milk and dairy products covered in this publication have been taken from the 2002 summary edition of The Composition of Foods (Food Standards Agency (2002) McCance and Widdowson’s The Composition of Foods, Sixth summary edition. Cambridge: Royal Society of Chemistry).
The data for the Sixth summary edition were compiled, under contract, by the Institute of Food Research, Norwich. In comparison to the fifth edition of The Composition of Foods, many new fresh and processed milk and dairy products have been included.
The tables featured in this publication have been divided into 5 sections:
Section 1 - Milk
Section 2 - Yogurt and fromage frais
Section 3 - Cheese
Section 4 - Cream
Section 5 - Dairy desserts
Nutrient composition values are given for:
Macronutrients
(energy, protein, carbohydrate, fat, fibre);
Water-soluble vitamins
(thiamin, riboflavin, niacin, niacin from tryptophan, vitamin
B6, vitamin B12, folate, pantothenate, biotin, vitamin C);
Fat-soluble vitamins
(retinol, carotene, vitamin D, vitamin E); and
Minerals
(sodium, potassium, calcium, magnesium, phosphorus,
iron, copper, zinc, chloride, manganese, selenium, iodine)
Energy conversion factors:
Protein 1g = 4 kcal or 17 kJ
Fat 1g = 9 kcal or 37 kJ
Carbohydrate 1g = 4 kcal or 17 kJ
The nutrient units used throughout the tables are as follows:
Gram (g)
Milligram (mg) - 10-3 g or one thousandth of a gram
Microgram (g) - 10-6 g or one millionth of a gram
Kilocalorie (kcal) - a unit used to measure the energy
value of a food
Kilojoule (kJ) - this unit is also used to measure the
energy value of food (1 kcal = 4.18 kJ)
Symbols used in the tables:
( ) - values have been estimated
N - values for this particular nutrient were not available

The Nutritional Composition of Dairy products4
Portion size and volume
All nutrient values in the subsequent tables are expressed per 100g of product and per average portion [taken from Ministry of Agriculture, Fisheries and Food, Food Portion Sizes, second edition, London: HMSO (1988), or from the leading brand sold in UK]. For exam-ple, the average portions of milk, cheese and yogurt are given as a 200ml glass, a 30g matchbox size piece and a 150g pot respectively.
For those products sold by volume such as milk and cream, nutrient values are given per 100mls, as well as per 100g. The specific gravities (densities) used to calculate the volume are as follows:
Whole milk 1.03
Semi-skimmed milk 1.03
Skimmed milk 1.03
Evaporated milk 1.07
Single cream 1.00
Whipping cream 0.96
Double cream 0.94
Yogurt, low fat fruit 1.08
Ice cream:
- Dairy, vanilla 0.61
- Non-dairy, vanilla 0.51
NB: Volume is calculated by dividing the weight (g) by the density (specific gravity) of the product
Bioavailability
With the exception of retinol and carotene, the fig-ures shown do not take nutrient bioavailability (i.e. the proportion of a nutrient in food that the body can absorb and use) into account. Bioavailability can affect the absorption and utilisation of the following nutrients: iron, calcium, magnesium, zinc, copper, manganese, selenium, folate, niacin and vitamin B6. In general, the availability of most nutrients in milk and dairy products compares favourably with other foods.
Product variation
The nutrient values given are derived from analysis of a range of samples and brands taken throughout the year in order to account for seasonal variation and therefore represent ‘average’ values. A wide range of products are available on the market and each has a unique nutritional composition. If information on the nutrient composition of a specific product is required it is advisable to contact the manufacturer or supplier directly in order to obtain up-to-date accurate information.
Vitamin A - Retinol and Carotene
The two main components of vitamin A are retinol (or preformed vitamin A) and carotene (which can be broken down in the body to give retinol). The values for retinol and carotene should be added together to give a value for total vitamin A.
Niacin and Tryptophan
Niacin values are the sum of nicotinic acid and nicotina-mide, which are collectively known as niacin. Tryptophan can be converted in the body to nicotinic acid. On average, 60mg tryptophan is equivalent to 1mg niacin. In order to estimate the niacin equivalent for the food it is necessary to add together the figures given for ‘niacin’ and ‘niacin from tryptophan’.
Other points to note
• Separate values are given for saturated fat,
monounsaturated fat and polyunsaturated fat as
well as total fat. The sum of these fatty acids
is, however, lower than that for total fat
because fat is not totally composed of fatty
acids, it is also made up of glycerol.
• Sodium is expressed in milligrams, values
should therefore be divided by 1000 in order to
convert them into grams.
• All the product values are for pasteurised milk
and dairy products.

The Nutritional Composition of Dairy products5
Sec
tion
1 - M
ilk
Per 100g Per 100mls Per 200ml glass
(103g) (206g)
Energy (kcal) 66 68 136
(kJ) 274 282 564
Protein (g) 3.3 3.4 6.8
Carbohydrate (g) 4.6 4.7 9.5
of which sugars (g) 4.6 4.7 9.5
Fat (g) 3.9 4.0 8.0
of which saturates 2.5 2.6 5.2
monounsaturates 1.0 1.0 2.0
polyunsaturates 0.1 0.1 0.2
trans fatty acids 0.1 0.1 0.2
Dietary fibre (g) 0 0 0
Thiamin (mg) 0.03 0.03 0.06
Riboflavin (mg) 0.23 0.24 0.48
Niacin (mg) 0.2 0.2 0.4
Niacin from Tryptophan (mg) 0.6 0.6 1.2
Vitamin B6 (mg) 0.06 0.06 0.12
Vitamin B12 (µg) 0.9 0.9 1.9
Folate (µg) 8 8 16
Pantothenate (mg) 0.58 0.60 1.19
Biotin (µg) 2.5 2.6 5.2
Vitamin C (mg) 2 2 4
Retinol (µg) 30 31 62
Carotene (µg) 19 20 39
Vitamin D (µg) Trace Trace Trace
Vitamin E (mg) 0.08 0.08 0.16
Sodium (mg) 43 44 89
Potassium (mg) 155 160 319
Calcium (mg) 118 122 243
Magnesium (mg) 11 11 23
Phosphorus (mg) 93 96 192
Iron (mg) 0.03 0.03 0.06
Copper (mg) Trace Trace Trace
Zinc (mg) 0.4 0.4 0.8
Chloride (mg) 89 92 183
Manganese (mg) Trace Trace Trace
Selenium (µg) 1 1 2
Iodine (µg) 31 32 64
Whole milk

The Nutritional Composition of Dairy products6
Sec
tion
1 - M
ilk
Per 100g Per 100mls Per 200ml glass
(103g) (206g)
Energy (kcal) 46 47 95
(kJ) 195 201 402
Protein (g) 3.5 3.6 7.2
Carbohydrate (g) 4.7 4.8 9.7
of which sugars (g) 4.7 4.8 9.7
Fat (g) 1.7 1.8 3.5
of which saturates 1.1 1.1 2.3
monounsaturates 0.4 0.4 0.8
polyunsaturates Trace Trace Trace
trans fatty acids 0.1 0.1 0.3
Dietary fibre (g) 0 0 0
Thiamin (mg) 0.03 0.03 0.06
Riboflavin (mg) 0.24 0.25 0.50
Niacin (mg) 0.1 0.1 0.2
Niacin from Tryptophan (mg) 0.6 0.6 1.2
Vitamin B6 (mg) 0.06 0.06 0.12
Vitamin B12 (µg) 0.9 0.9 1.9
Folate (µg) 9 9 19
Pantothenate (mg) 0.68 0.70 1.4
Biotin (µg) 3.0 3.1 6.2
Vitamin C (mg) 2 2 4
Retinol (µg) 19 20 39
Carotene (µg) 9 9 19
Vitamin D (µg) Trace Trace Trace
Vitamin E (mg) 0.04 0.04 0.08
Sodium (mg) 43 44 89
Potassium (mg) 156 161 321
Calcium (mg) 120 124 247
Magnesium (mg) 11 11 23
Phosphorus (mg) 94 97 194
Iron (mg) 0.02 0.02 0.04
Copper (mg) Trace Trace Trace
Zinc (mg) 0.4 0.4 0.8
Chloride (mg) 87 90 179
Manganese (mg) Trace Trace Trace
Selenium (µg) 1 1 2
Iodine (µg) 30 31 62
Semi-skimmed milk

The Nutritional Composition of Dairy products7
Sec
tion
1 - M
ilk
Per 100g Per 100mls Per 200ml glass
(103g) (206g)
Energy (kcal) 34 35 70
(kJ) 144 148 297
Protein (g) 3.5 3.6 7.2
Carbohydrate (g) 4.8 4.9 9.9
of which sugars (g) 4.8 4.9 9.9
Fat (g) 0.3 0.3 0.62
of which saturates 0.1 0.1 0.2
monounsaturates 0.1 0.1 0.2
polyunsaturates Trace Trace Trace
trans fatty acids Trace Trace Trace
Dietary fibre (g) 0 0 0
Thiamin (mg) 0.03 0.03 0.06
Riboflavin (mg) 0.22 0.23 0.45
Niacin (mg) 0.1 0.1 0.2
Niacin from Tryptophan (mg) 0.7 0.7 1.4
Vitamin B6 (mg) 0.06 0.06 0.12
Vitamin B12 (µg) 0.8 0.8 1.6
Folate (µg) 9 9 19
Pantothenate (mg) 0.50 0.52 1.03
Biotin (µg) 2.5 2.6 5.2
Vitamin C (mg) 1 1 1
Retinol (µg) 1 1 2
Carotene (µg) Trace Trace Trace
Vitamin D (µg) Trace Trace Trace
Vitamin E (mg) Trace Trace Trace
Sodium (mg) 44 45 91
Potassium (mg) 162 167 334
Calcium (mg) 125 129 258
Magnesium (mg) 11 11 23
Phosphorus (mg) 96 99 198
Iron (mg) 0.03 0.03 0.06
Copper (mg) Trace Trace Trace
Zinc (mg) 0.5 0.5 1.0
Chloride (mg) 87 90 179
Manganese (mg) Trace Trace Trace
Selenium (µg) 1 1 2
Iodine (µg) 30a 31 62
Skimmed milk
aWinter milk may contain slightly higher levels of iodine than summer milk

The Nutritional Composition of Dairy products8
Sec
tion
1 - M
ilk
Channel Island milk
Per 100g Per 100mls Per 200ml glass
(103g) (206g)
Energy (kcal) 78 80 161
(kJ) 327 337 674
Protein (g) 3.6 3.7 7.4
Carbohydrate (g) 4.8 4.9 9.9
of which sugars (g) 4.8 4.9 9.9
Fat (g) 5.1 5.3 10.5
of which saturates 3.3 3.4 6.8
monounsaturates 1.3 1.3 2.7
polyunsaturates 0.1 0.1 0.2
trans fatty acids (0.1) (0.1) (0.2)
Dietary fibre (g) 0 0 0
Thiamin (mg) 0.04 0.04 0.08
Riboflavin (mg) 0.19 0.20 0.39
Niacin (mg) 0.1 0.1 0.2
Niacin from Tryptophan (mg) 0.9 0.9 1.9
Vitamin B6 (mg) 0.06 0.06 0.12
Vitamin B12 (µg) 0.4 0.4 0.8
Folate (µg) 6 6 12
Pantothenate (mg) 0.36 0.37 0.74
Biotin (µg) 1.9 2.0 3.9
Vitamin C (mg) 1 1 2
Retinol (µg) 46 47 95
Carotene (µg) 71 73 146
Vitamin D (µg) Trace Trace Trace
Vitamin E (mg) 0.11 0.11 0.23
Sodium (mg) 54 56 111
Potassium (mg) 140 144 288
Calcium (mg) 130 134 268
Magnesium (mg) 12 12 25
Phosphorus (mg) 100 103 206
Iron (mg) 0.05 0.05 0.1
Copper (mg) Trace Trace Trace
Zinc (mg) 0.4 0.4 0.8
Chloride (mg) 100 103 206
Manganese (mg) Trace Trace Trace
Selenium (µg) (1) (1) (2)
Iodine (µg) N N N

The Nutritional Composition of Dairy products9
Sec
tion
1 - M
ilk
Breakfast milk
Per 100g Per 100mls Per 200ml glass
(103g) (206g)
Energy (kcal) 72 74 148
(kJ) 302 311 622
Protein (g) 3.5 3.6 7.2
Carbohydrate (g) 4.3 4.4 8.9
of which sugars (g) 4.3 4.4 8.9
Fat (g) 4.7 4.8 9.7
of which saturates 3.0 3.1 6.2
monounsaturates 1.1 1.1 2.3
polyunsaturates 0.2 0.2 0.4
trans fatty acids 0.2 0.2 0.4
Dietary fibre (g) 0 0 0
Thiamin (mg) 0.04 0.04 0.08
Riboflavin (mg) 0.22 0.23 0.45
Niacin (mg) 0.1 0.1 0.2
Niacin from Tryptophan (mg) 0.6 0.6 1.2
Vitamin B6 (mg) 0.03 0.03 0.06
Vitamin B12 (µg) 0.8 0.8 1.6
Folate (µg) 6 6 12
Pantothenate (mg) 0.38 0.39 0.78
Biotin (µg) 1.9 2.0 3.9
Vitamin C (mg) (1) (1) (2)
Retinol (µg) 35 36 72
Carotene (µg) 41 42 84
Vitamin D (µg) 0.1 0.1 0.2
Vitamin E (mg) 0.17 0.18 0.35
Sodium (mg) 39 40 80
Potassium (mg) 131 135 270
Calcium (mg) 129 133 266
Magnesium (mg) 12 12 25
Phosphorus (mg) 106 109 218
Iron (mg) Trace Trace Trace
Copper (mg) 0.01 0.01 0.02
Zinc (mg) 0.4 0.4 0.8
Chloride (mg) (100) (103) (206)
Manganese (mg) Trace Trace Trace
Selenium (µg) (1) (1) (2)
Iodine (µg) 29 30 60

The Nutritional Composition of Dairy products10
Sec
tion
1 - M
ilk
Per 100g Whole milk Per 100mls Skimmed milk
(sweetened) (sweetened)
Energy (kcal) 333 267
(kJ) 1406 1137
Protein (g) 8.5 10
Carbohydrate (g) 55.5 60
of which sugars (g) 55.5 60
Fat (g) 10.1 0.2
of which saturates 6.3 0.1
monounsaturates 2.9 0.1
polyunsaturates 0.3 Trace
trans fatty acids N Trace
Dietary fibre (g) 0 0
Thiamin (mg) 0.09 0.11
Riboflavin (mg) 0.46 0.51
Niacin (mg) 0.3 0.3
Niacin from Tryptophan (mg) 2.0 2.3
Vitamin B6 (mg) 0.07 0.09
Vitamin B12 (µg) 0.7 0.9
Folate (µg) 15 16
Pantothenate (mg) 0.85 1.03
Biotin (µg) 3.9 5.2
Vitamin C (mg) 4 5
Retinol (µg) 110 28
Carotene (µg) 70 20
Vitamin D (µg) 5.4 0.9
Vitamin E (mg) 0.19 0.04
Sodium (mg) 140 150
Potassium (mg) 360 450
Calcium (mg) 290 330
Magnesium (mg) 29 33
Phosphorus (mg) 240 270
Iron (mg) 0.23 0.33
Copper (mg) Trace Trace
Zinc (mg) 1.0 1.2
Chloride (mg) 230 300
Manganese (mg) Trace Trace
Selenium (µg) (3) (3)
Iodine (µg) 74 (89)
Condensed milk (whole and skimmed)

The Nutritional Composition of Dairy products11
Sec
tion
1 - M
ilk
Per 100g Per teaspoon
(3g)
Energy (kcal) 348 10.4
(kJ) 1482 46
Protein (g) 36.1 1.1
Carbohydrate (g) 52.9 1.6
of which sugars (g) 52.9 1.6
Fat (g) 0.6 0.02
of which saturates 0.4 0.02
monounsaturates 0.2 Trace
polyunsaturates Trace Trace
trans fatty acids Trace Trace
Dietary fibre (g) 0 0
Thiamin (mg) 0.38 0.01
Riboflavin (mg) 1.63 0.05
Niacin (mg) 1.0 0.03
Niacin from Tryptophan (mg) 8.5 0.3
Vitamin B6 (mg) 0.6 0.02
Vitamin B12 (µg) 2.6 0.08
Folate (µg) 51 1.5
Pantothenate (mg) 3.28 0.1
Biotin (µg) 20.1 0.6
Vitamin C (mg) 13 0.4
Retinol (µg) 350 10.5
Carotene (µg) 5b 0.15b
Vitamin D (µg) 2.1b 0.06b
Vitamin E (mg) 0.27b 0.01 b
Sodium (mg) 550 17
Potassium (mg) 1590 48
Calcium (mg) 1280 38
Magnesium (mg) 130 4
Phosphorus (mg) 970 29
Iron (mg) 0.27 0.01
Copper (mg) Trace Trace
Zinc (mg) 4 0.12
Chloride (mg) 1070 32
Manganese (mg) Trace Trace
Selenium (µg) (11) (0.3)
Iodine (µg) (150) (4.5)
Dried skimmed milk (fortified)
bUnfortified skimmed milk powder contains approximately 8(g retinol, 3(g Carotene,
trace Vitamin D and 0.01mg of Vitamin E per 100g.

The Nutritional Composition of Dairy products12
Sec
tion
1 - M
ilk
Evaporated whole milk
Per 100g Per 100mls Per 170ml small can
(107g) (181g)
Energy (kcal) 151 162 273
(kJ) 629 673 1138
Protein (g) 8.4 9.1 15.2
Carbohydrate (g) 8.5 9.1 15.4
of which sugars (g) 8.5 9.1 15.4
Fat (g) 9.4 10.1 17.0
of which saturates 5.9 6.3 10.7
monounsaturates 2.7 2.9 4.9
polyunsaturates 0.3 0.3 0.5
trans fatty acids N N N
Dietary fibre (g) 0 0 0
Thiamin (mg) 0.07 0.07 0.13
Riboflavin (mg) 0.42 0.45 0.76
Niacin (mg) 0.2 0.2 0.6
Niacin from Tryptophan (mg) 2.0 2.1 3.6
Vitamin B6 (mg) 0.07 0.07 0.13
Vitamin B12 (µg) 0.1 0.1 0.2
Folate (µg) 11 12 20
Pantothenate (mg) 0.75 0.8 1.4
Biotin (µg) 4.0 4.3 7.2
Vitamin C (mg) 1.0 1.1 1.8
Retinol (µg) 105 112 190
Carotene (µg) 100 107 181
Vitamin D (µg) 4.0c 4.3c 7.2c
Vitamin E (mg) 0.19 0.20 0.34
Sodium (mg) 180 193 326
Potassium (mg) 360 385 652
Calcium (mg) 290 310 525
Magnesium (mg) 29 31 52
Phosphorus (mg) 260 278 471
Iron (mg) 0.26 0.28 0.47
Copper (mg) 0.02 0.02 0.04
Zinc (mg) 0.9 1.0 1.6
Chloride (mg) 250 268 453
Manganese (mg) Trace Trace Trace
Selenium (µg) (3) (3) (5)
Iodine (µg) 11 12 20
cThis is for fortified product. Unfortified evaporated milk contains approximately
0.09 (g vitamin D per 100g

The Nutritional Composition of Dairy products13
Sec
tion
1 - M
ilk
Per 100g Per 100mls Per 170ml small can
(107g) (181g)
Energy (kcal) 107 114 194
(kJ) 449 480 813
Protein (g) 7.8 8.3 14.1
Carbohydrate (g) 10.3 11.0 18.6
of which sugars (g) 10.3 11.0 18.6
Fat (g) 4.1 4.4 7.4
of which saturates 2.5 2.7 4.5
monounsaturates 1.1 1.2 2.0
polyunsaturates 0.2 0.2 0.4
trans fatty acids 0.2 0.2 0.4
Dietary fibre (g) 0 0 0
Thiamin (mg) 0.07 0.07 0.13
Riboflavin (mg) (0.42) (0.45) (0.76)
Niacin (mg) 0.2 0.2 0.4
Niacin from Tryptophan (mg) (2.0) (2.1) (3.6)
Vitamin B6 (mg) 0.04 0.04 0.07
Vitamin B12 (µg) 0.2 0.2 0.4
Folate (µg) 8.0 8.6 14.5
Pantothenate (mg) (0.75) (0.80) (1.36)
Biotin (µg) (4.0) (4.3) (7.2)
Vitamin C (mg) (1) (1) (2)
Retinol (µg) 50 52 91
Carotene (µg) 21 23 38
Vitamin D (µg) 3.1 3.3 5.6
Vitamin E (mg) 0.11 0.12 0.18
Vitamin K (mg) N N N
Sodium (mg) 115 123 208
Potassium (mg) 336 360 608
Calcium (mg) 260 278 471
Magnesium (mg) 25 27 45
Phosphorus (mg) 233 249 422
Iron (mg) Trace Trace Trace
Copper (mg) Trace Trace Trace
Zinc (mg) 1.0 1.0 1.8
Chloride (mg) 222 238 402
Manganese (mg) Trace Trace Trace
Selenium (µg) 3 3 5
Iodine (µg) 47 50 85
Evaporated milk (4% fat)

The Nutritional Composition of Dairy products14
Sec
tion
1 - M
ilk
Flavoured milk
Per 100g Per 100mls Per 200ml glass
(103g) (206g)
Energy (kcal) 64 66 132
(kJ) 270 278 556
Protein (g) 3.6 3.7 7.4
Carbohydrate (g) 9.6 9.9 19.8
of which sugars (g) 8.9 9.2 18.3
Fat (g) 1.5 1.5 3.1
of which saturates 1.0 1.0 2.1
monounsaturates 0.3 0.3 0.6
polyunsaturates 0.1 0.1 0.2
trans fatty acids Trace Trace Trace
Dietary fibre (g) 0 0 0
Thiamin (mg) 0.03 0.03 0.06
Riboflavin (mg) 0.17 0.17 0.35
Niacin (mg) 0.1 0.1 0.2
Niacin from Tryptophan (mg) 0.8 0.8 1.6
Vitamin B6 (mg) 0.03 0.03 0.06
Vitamin B12 (µg) 0.1 0.1 0.2
Folate (µg) 2 2 4
Pantothenate (mg) 0.3 0.3 0.6
Biotin (µg) 2.2 2.3 4.5
Vitamin C (mg) Trace Trace Trace
Retinol (µg) 20 21 41
Carotene (µg) 8 8 16
Vitamin D (µg) 0 0 0
Vitamin E (mg) 0.03 0.03 0.06
Sodium (mg) 52 54 107
Potassium (mg) 168 173 346
Calcium (mg) 120 124 247
Magnesium (mg) 12 12 25
Phosphorus (mg) 102 105 210
Iron (mg) 0.13 0.13 0.26
Copper (mg) Trace Trace Trace
Zinc (mg) 0.4 0.4 0.8
Chloride (mg) 110 113 227
Manganese (mg) Trace Trace Trace
Selenium (µg) N N N
Iodine (µg) N N N

The Nutritional Composition of Dairy products15
Sec
tion
1 - M
ilk
Milkshake (thick, takeaway type)
Per 100g Per average takaway serving 300g
Energy (kcal) 88 264
(kJ) 374 1122
Protein (g) 3.7 11.1
Carbohydrate (g) 15.3 45.9
of which sugars (g) 11.1 33.3
Fat (g) 1.8 5.4
of which saturates 1.2 3.6
monounsaturates 0.4 1.2
polyunsaturates 0.1 0.3
trans fatty acids 0.1 0.3
Dietary fibre (g) Trace Trace
Thiamin (mg) 0.03 0.09
Riboflavin (mg) 0.23 0.69
Niacin (mg) 0.1 0.3
Niacin from Tryptophan (mg) 0.7 2.1
Vitamin B6 (mg) 0.03 0.09
Vitamin B12 (µg) 0.5 1.5
Folate (µg) 4.0 12
Pantothenate (mg) 0.31 0.93
Biotin (µg) 2.0 6.0
Vitamin C (mg) 1 3
Retinol (µg) 35 105
Carotene (µg) 11 33
Vitamin D (µg) Trace Trace
Vitamin E (mg) 0.1 0.3
Sodium (mg) 57 171
Potassium (mg) 171 513
Calcium (mg) 129 387
Magnesium (mg) 13 39
Phosphorus (mg) 120 360
Iron (mg) Trace Trace
Copper (mg) Trace Trace
Zinc (mg) 0.1 0.3
Chloride (mg) 111 333
Manganese (mg) Trace Trace
Selenium (µg) 2 6
Iodine (µg) 37 111

The Nutritional Composition of Dairy products16
Sec
tion
2 - Y
ogurt
and
fro
mag
e fr
ais
Whole milk yogurt (plain and fruit)
Plain Fruit
Per 100g Per 150 pot Per 100g Per 150 pot
Energy (kcal) 79 119 109 164
(kJ) 333 500 463 695
Protein (g) 5.7 8.6 4.0 6.0
Carbohydrate (g) 7.8 11.7 17.7 26.6
of which sugars (g) 7.8 11.7 16.6 24.9
Fat (g) 3.0 4.5 3.0 4.5
of which saturates 1.7 2.6 2.0 3.0
monounsaturates 0.9 1.4 0.7 1.1
polyunsaturates 0.2 0.3 0.1 0.2
trans fatty acids N N 0.1 0.2
Dietary fibre (g) N N N N
Thiamin (mg) 0.06 0.09 0.12 0.18
Riboflavin (mg) 0.27 0.4 0.16 0.24
Niacin (mg) 0.2 0.3 0.1 0.2
Niacin from Tryptophan (mg) 1.3 2.0 0.7 1.1
Vitamin B6 (mg) 0.10 0.15 0.01 0.02
Vitamin B12 (µg) 0.2 0.3 0.3 0.5
Folate (µg) 18 27 10.0 15.0
Pantothenate (mg) 0.50 0.75 0.40 0.60
Biotin (µg) 2.6 3.9 1.1 1.7
Vitamin C (mg) 1 1.2 1.0 1.2
Retinol (µg) 28 42 36 54
Carotene (µg) 21 32 Trace Trace
Vitamin D (µg) 0 0 0.1 0.2
Vitamin E (mg) 0.05 0.08 0.18 0.27
Sodium (mg) 80 120 58 87
Potassium (mg) 280 420 170 255
Calcium (mg) 200 300 122 183
Magnesium (mg) 19 29 13 20
Phosphorus (mg) 170 255 96 144
Iron (mg) 0.10 0.15 0.10 0.15
Copper (mg) Trace Trace Trace Trace
Zinc (mg) 0.7 1.1 0.4 0.6
Chloride (mg) 170 255 179 269
Manganese (mg) Trace Trace Trace Trace
Selenium (µg) (2) (3) 2 3
Iodine (µg) (63) (95) (27) (41)

The Nutritional Composition of Dairy products17
Sec
tion
2 - Y
ogurt
and
fro
mag
e fr
ais
Plain Fruit
Per 100g Per 150 pot Per 100g Per 150 pot
Energy (kcal) 56 84 78 117
(kJ) 237 356 331 497
Protein (g) 4.8 7.2 4.2 6.3
Carbohydrate (g) 7.4 11.1 13.7 20.6
of which sugars (g) 7.1 10.7 12.7 19.1
Fat (g) 1.0 1.5 1.1 1.7
of which saturates 0.7 1.1 (0.8) (1.2)
monounsaturates 0.2 0.3 (0.3) (0.5)
polyunsaturates Trace Trace Trace Trace
trans fatty acids Trace Trace Trace Trace
Dietary fibre (g) N N 0.2 0.3
Thiamin (mg) 0.12 0.18 0.12 0.18
Riboflavin (mg) 0.22 0.33 0.21 0.32
Niacin (mg) 0.1 0.2 0.1 0.2
Niacin from Tryptophan (mg) 1.0 1.5 1.0 1.5
Vitamin B6 (mg) 0.01 0.02 Trace Trace
Vitamin B12 (µg) 0.3 0.5 0.3 0.5
Folate (µg) 18 27 16 24
Pantothenate (mg) 0.56 0.84 0.33 0.50
Biotin (µg) 1.5 2.3 2.3 3.5
Vitamin C (mg) 1 2 1 2
Retinol (µg) 8 12 (10) (15)
Carotene (µg) Trace Trace Trace Trace
Vitamin D (µg) 0.1 0.2 Trace Trace
Vitamin E (mg) Trace Trace 0.28 0.42
Sodium (mg) 63 95 62 93
Potassium (mg) 228 342 204 306
Calcium (mg) 162 243 140 210
Magnesium (mg) 16 24 15 23
Phosphorus (mg) 143 215 120 180
Iron (mg) 0.10 0.15 0.1 0.15
Copper (mg) 0.03 0.05 Trace Trace
Zinc (mg) 0.6 0.9 0.5 0.8
Chloride (mg) 235 353 (130) (195)
Manganese (mg) Trace Trace Trace Trace
Selenium (µg) 2 3 (2) (3)
Iodine (µg) 34 51 (48) (72)
Low fat yogurt (plain and fruit)

The Nutritional Composition of Dairy products18
Sec
tion
2 - Y
ogurt
and
fro
mag
e fr
ais
Plain Fruit
Per 100g Per 150 pot Per 100g Per 150 pot
Energy (kcal) 54 81 47 71
(kJ) 230 345 201 302
Protein (g) 5.4 8.1 4.8 7.2
Carbohydrate (g) 8.2 12.3 7.0 10.5
of which sugars (g) 7.9 11.9 6.3 9.5
Fat (g) 0.2 0.3 0.2 0.3
of which saturates 0.1 0.2 (0.1) (0.2)
monounsaturates 0.1 0.2 (0.1) (0.2)
polyunsaturates Trace Trace Trace Trace
trans fatty acids Trace Trace Trace Trace
Dietary fibre (g) 0 0 Trace Trace
Thiamin (mg) (0.04) (0.06) 0.04 0.06
Riboflavin (mg) (0.29) (0.44) 0.29 0.44
Niacin (mg) (0.1) (0.2) 0.1 0.2
Niacin from Tryptophan (mg) (1.0) (1.5) 1.0 1.5
Vitamin B6 (mg) (0.07) (0.11) 0.07 0.1
Vitamin B12 (µg) (0.2) (0.3) (0.2) (0.3)
Folate (µg) (8) (12) 8 12
Pantothenate (mg) N N N N
Biotin (µg) N N N N
Vitamin C (mg) (1) (2) 1 2
Retinol (µg) Trace Trace Trace Trace
Carotene (µg) Trace Trace Trace Trace
Vitamin D (µg) Trace Trace Trace Trace
Vitamin E (mg) Trace Trace 0.03 0.05
Sodium (mg) 71 107 73 110
Potassium (mg) 247 371 180 270
Calcium (mg) 160 240 130 195
Magnesium (mg) 16 24 13 20
Phosphorus (mg) 151 227 110 165
Iron (mg) 0.10 0.15 0.10 0.15
Copper (mg) 0.03 0.05 Trace Trace
Zinc (mg) 0.6 0.9 0.4 0.6
Chloride (mg) 252 378 120 180
Manganese (mg) Trace Trace Trace Trace
Selenium (µg) 2 3 (1) (2)
Iodine (µg) 53 80 N N
Virtually fat free (diet) yogurt (plain and fruit)

The Nutritional Composition of Dairy products19
Sec
tion
2 - Y
ogurt
and
fro
mag
e fr
ais
Plain Fruit
Per 100g Per 150 pot Per 100g Per 150 pot
Energy (kcal) 133 200 137 206
(kJ) 551 827 572 858
Protein (g) 5.7 8.6 4.8 7.2
Carbohydrate (g) 4.8 7.2 11.2 16.8
of which sugars (g) 4.5 6.8 10.5 15.8
Fat (g) 10.2 15.3 8.4 12.6
of which saturates 6.8 10.2 5.6 8.4
monounsaturates 2.5 3.8 2.2 3.3
polyunsaturates 0.3 0.5 0.2 0.3
trans fatty acids 0.2 0.3 0.2 0.3
Dietary fibre (g) 0 0 Trace Trace
Thiamin (mg) 0.12 0.18 (0.12) (0.18)
Riboflavin (mg) 0.13 0.20 (0.13) (0.20)
Niacin (mg) (0.1) (0.2) (0.1) (0.2)
Niacin from Tryptophan (mg) (1.5) (2.3) (1.5) (2.3)
Vitamin B6 (mg) 0.01 0.02 Trace Trace
Vitamin B12 (µg) 0.2 0.3 0 0
Folate (µg) (6) (9) (6) (9)
Pantothenate (mg) N N N N
Biotin (µg) N N N N
Vitamin C (mg) Trace Trace Trace Trace
Retinol (µg) 115 173 115 173
Carotene (µg) Trace Trace Trace Trace
Vitamin D (µg) 0.1 0.2 0.1 0.2
Vitamin E (mg) 0.38 0.57 0.39 0.59
Sodium (mg) 66 99 64 96
Potassium (mg) 184 276 218 327
Calcium (mg) 126 189 141 212
Magnesium (mg) 13 20 14 21
Phosphorus (mg) 138 207 136 204
Iron (mg) 0.10 0.15 0.20 0.30
Copper (mg) Trace Trace Trace Trace
Zinc (mg) 0.5 0.8 0.6 0.9
Chloride (mg) 159 239 (159) (239)
Manganese (mg) Trace Trace Trace Trace
Selenium (µg) 3 5 (3) (5)
Iodine (µg) 39 59 (39) (59)
Greek style yogurt (plain and fruit)

The Nutritional Composition of Dairy products20
Sec
tion
2 - Y
ogurt
and
fro
mag
e fr
ais
Per 100g Per 90g pot
Energy (kcal) 90 81
(kJ) 378 340
Protein (g) 3.8 3.4
Carbohydrate (g) 11.1 10.1
of which sugars (g) 10.4 9.4
Fat (g) 3.7 3.3
of which saturates 2.5 2.3
monounsaturates 0.9 0.8
polyunsaturates 0.1 0.1
trans fatty acids 0.1 0.1
Dietary fibre (g) 0.1 0.1
Thiamin (mg) 0.12 0.11
Riboflavin (mg) 0.15 0.14
Niacin (mg) (0.1) (0.1)
Niacin from Tryptophan (mg) (0.7) (0.6)
Vitamin B6 (mg) 0.01 Trace
Vitamin B12 (µg) 0.3 0.3
Folate (µg) 10 9
Pantothenate (mg) (0.40) (0.36)
Biotin (µg) (1.1) (0.9)
Vitamin C (mg) Trace Trace
Retinol (µg) (36) (32)
Carotene (µg) Trace Trace
Vitamin D (µg) (0.1) (0.1)
Vitamin E (mg) (0.18) (0.16)
Sodium (mg) 46 41
Potassium (mg) 176 158
Calcium (mg) 120 108
Magnesium (mg) 12 11
Phosphorus (mg) 114 103
Iron (mg) 0.2 0.2
Copper (mg) 0.02 0.02
Zinc (mg) 0.5 0.5
Chloride (mg) (179) (161)
Manganese (mg) Trace Trace
Selenium (µg) (2) (2)
Iodine (µg) (27) (24)
Infant fruit flavour yogurt

The Nutritional Composition of Dairy products21
Sec
tion
2 - Y
ogurt
and
fro
mag
e fr
ais
Per 100g Per 175g pot
Energy (kcal) 106 186
(kJ) 446 781
Protein (g) 4.1 7.2
Carbohydrate (g) 16.2 28.4
of which sugars (g) 15.6 27.3
Fat (g) 3.2 5.6
of which saturates N N
monounsaturates N N
polyunsaturates N N
trans fatty acids N N
Dietary fibre (g) N N
Thiamin (mg) (0.06) (0.11)
Riboflavin (mg) (0.19) (0.33)
Niacin (mg) (0.2) (0.4)
Niacin from Tryptophan (mg) (0.9) (1.6)
Vitamin B6 (mg) (0.08) (0.14)
Vitamin B12 (µg) 0 0
Folate (µg) (13) (23)
Pantothenate (mg) (0.36) (0.95)
Biotin (µg) (2.0) (3.5)
Vitamin C (mg) (2) (4)
Retinol (µg) (20) (35)
Carotene (µg) (15) (26)
Vitamin D (µg) 0 0
Vitamin E (mg) (0.12) (0.21)
Sodium (mg) 53 93
Potassium (mg) 175 306
Calcium (mg) 130 228
Magnesium (mg) 13 23
Phosphorus (mg) 106 186
Iron (mg) 0.20 0.35
Copper (mg) Trace Trace
Zinc (mg) 0.4 0.7
Chloride (mg) N N
Manganese (mg) Trace Trace
Selenium (µg) N N
Iodine (µg) N N
Twinpot yogurt (thick and creamy with fruit)
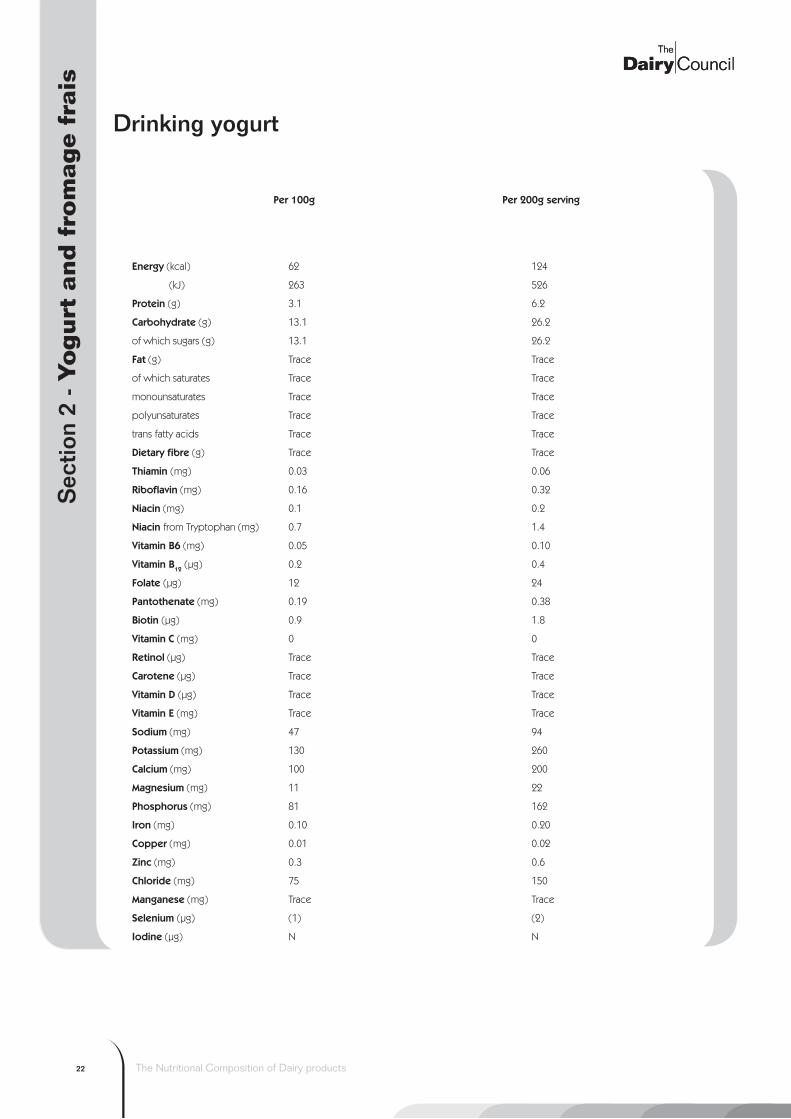
The Nutritional Composition of Dairy products22
Sec
tion
2 - Y
ogurt
and
fro
mag
e fr
ais
Per 100g Per 200g serving
Energy (kcal) 62 124
(kJ) 263 526
Protein (g) 3.1 6.2
Carbohydrate (g) 13.1 26.2
of which sugars (g) 13.1 26.2
Fat (g) Trace Trace
of which saturates Trace Trace
monounsaturates Trace Trace
polyunsaturates Trace Trace
trans fatty acids Trace Trace
Dietary fibre (g) Trace Trace
Thiamin (mg) 0.03 0.06
Riboflavin (mg) 0.16 0.32
Niacin (mg) 0.1 0.2
Niacin from Tryptophan (mg) 0.7 1.4
Vitamin B6 (mg) 0.05 0.10
Vitamin B12 (µg) 0.2 0.4
Folate (µg) 12 24
Pantothenate (mg) 0.19 0.38
Biotin (µg) 0.9 1.8
Vitamin C (mg) 0 0
Retinol (µg) Trace Trace
Carotene (µg) Trace Trace
Vitamin D (µg) Trace Trace
Vitamin E (mg) Trace Trace
Sodium (mg) 47 94
Potassium (mg) 130 260
Calcium (mg) 100 200
Magnesium (mg) 11 22
Phosphorus (mg) 81 162
Iron (mg) 0.10 0.20
Copper (mg) 0.01 0.02
Zinc (mg) 0.3 0.6
Chloride (mg) 75 150
Manganese (mg) Trace Trace
Selenium (µg) (1) (2)
Iodine (µg) N N
Drinking yogurt

The Nutritional Composition of Dairy products23
Sec
tion
2 - Y
ogurt
and
fro
mag
e fr
ais
Per 100g† Per 100g†
Plain Fruit Virtually fat free - plain Virtually fat free - fruit
Energy (kcal) 113 124 49 50
(kJ) 470 520 208 213
Protein (g) 6.1 5.3 7.7 6.8
Carbohydrate (g) 4.4 13.9 4.6 5.6
of which sugars (g) 4.1 13.3 4.4 4.9
Fat (g) 8.0 5.6 0.1 0.2
of which saturates 5.5 3.5 0.1 0.1
monounsaturates 1.8 1.6 Trace 0.1
polyunsaturates 0.2 0.2 Trace Trace
trans fatty acids 0.1 0.1 Trace Trace
Dietary fibre (g) 0 Trace 0 0.4
Thiamin (mg) 0.13 0.12 (0.03) (0.03)
Riboflavin (mg) 0.20 0.13 (0.37) (0.37)
Niacin (mg) 0.1 0.1 (0.1) (0.1)
Niacin from Tryptophan (mg) 1.2 1.2 1.8 1.8
Vitamin B6 (mg) 0.01 0.01 (0.07) (0.07)
Vitamin B12 (µg) 0.5 0.5 (1.4) (1.4)
Folate (µg) 15 15 (15) (15)
Pantothenate (mg) 0.47 0.38 N N
Biotin (µg) Trace 0.6 N N
Vitamin C (mg) Trace Trace Trace Trace
Retinol (µg) 82 82 (3) (3)
Carotene (µg) Trace Trace Trace Trace
Vitamin D (µg) 0 0 Trace Trace
Vitamin E (mg) 0.15 (0.01) Trace Trace
Sodium (mg) 36 35 37 (33)
Potassium (mg) 143 110 155 (110)
Calcium (mg) 110 86 127 (87)
Magnesium (mg) 11 8 12 (8)
Phosphorus (mg) 123 110 120 (110)
Iron (mg) 0.1 0.1 0.1 (0.1)
Copper (mg) 0.03 0.02 0.03 (0.01)
Zinc (mg) 0.4 0.4 0.6 (0.3)
Chloride (mg) 137 78 (137) (89)
Manganese (mg) Trace Trace Trace Trace
Selenium (µg) 3 (3) (3) (2)
Iodine (µg) 17 (17) 23 N
Fromage frais (various types)
† (or size of an average pot)
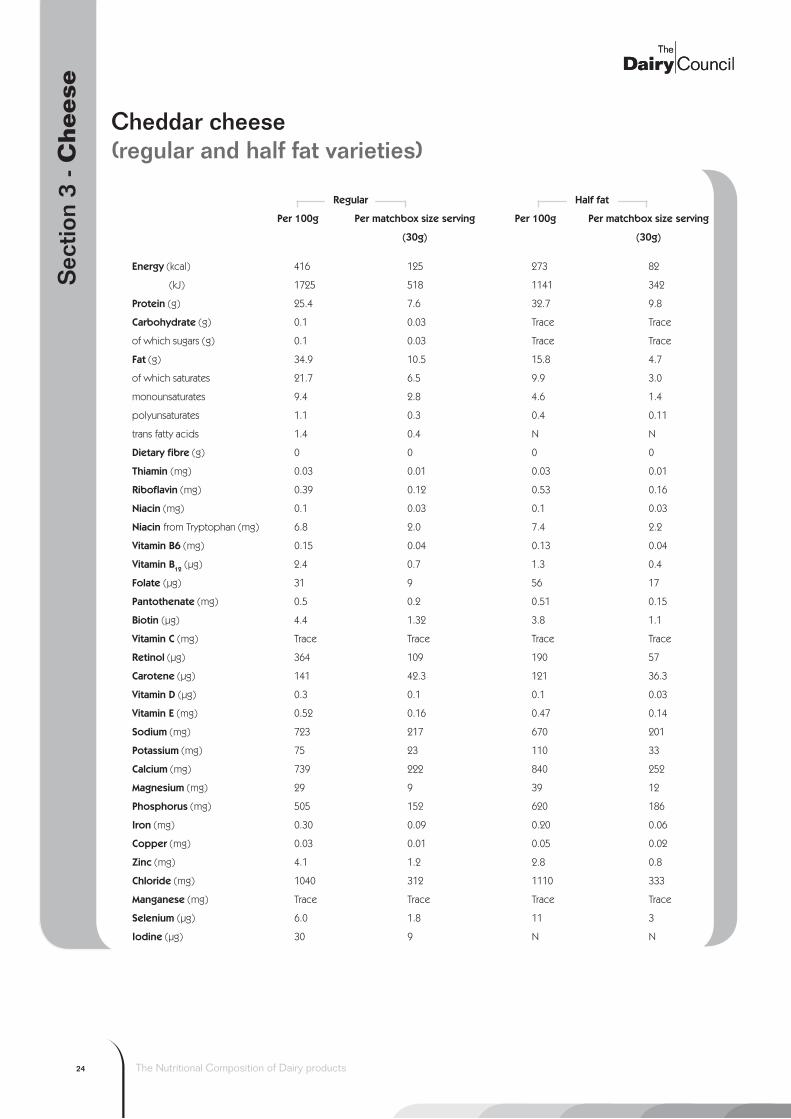
The Nutritional Composition of Dairy products24
Sec
tion
3 - C
hee
se
Regular Half fat
Per 100g Per matchbox size serving Per 100g Per matchbox size serving
(30g) (30g)
Energy (kcal) 416 125 273 82
(kJ) 1725 518 1141 342
Protein (g) 25.4 7.6 32.7 9.8
Carbohydrate (g) 0.1 0.03 Trace Trace
of which sugars (g) 0.1 0.03 Trace Trace
Fat (g) 34.9 10.5 15.8 4.7
of which saturates 21.7 6.5 9.9 3.0
monounsaturates 9.4 2.8 4.6 1.4
polyunsaturates 1.1 0.3 0.4 0.11
trans fatty acids 1.4 0.4 N N
Dietary fibre (g) 0 0 0 0
Thiamin (mg) 0.03 0.01 0.03 0.01
Riboflavin (mg) 0.39 0.12 0.53 0.16
Niacin (mg) 0.1 0.03 0.1 0.03
Niacin from Tryptophan (mg) 6.8 2.0 7.4 2.2
Vitamin B6 (mg) 0.15 0.04 0.13 0.04
Vitamin B12 (µg) 2.4 0.7 1.3 0.4
Folate (µg) 31 9 56 17
Pantothenate (mg) 0.5 0.2 0.51 0.15
Biotin (µg) 4.4 1.32 3.8 1.1
Vitamin C (mg) Trace Trace Trace Trace
Retinol (µg) 364 109 190 57
Carotene (µg) 141 42.3 121 36.3
Vitamin D (µg) 0.3 0.1 0.1 0.03
Vitamin E (mg) 0.52 0.16 0.47 0.14
Sodium (mg) 723 217 670 201
Potassium (mg) 75 23 110 33
Calcium (mg) 739 222 840 252
Magnesium (mg) 29 9 39 12
Phosphorus (mg) 505 152 620 186
Iron (mg) 0.30 0.09 0.20 0.06
Copper (mg) 0.03 0.01 0.05 0.02
Zinc (mg) 4.1 1.2 2.8 0.8
Chloride (mg) 1040 312 1110 333
Manganese (mg) Trace Trace Trace Trace
Selenium (µg) 6.0 1.8 11 3
Iodine (µg) 30 9 N N
Cheddar cheese (regular and half fat varieties)

The Nutritional Composition of Dairy products25
Sec
tion
3 - C
hee
se
Vegetarian Cheddar cheese
Per 100g Per matchbox size serving
(30g)
Energy (kcal) 390 117
(kJ) 1618 485
Protein (g) 25.5 7.7
Carbohydrate (g) Trace Trace
of which sugars (g) Trace Trace
Fat (g) 32 9.6
of which saturates 20.8 6.2
monounsaturates 8.7 2.6
polyunsaturates 1.2 0.5
trans fatty acids 1.5 0.5
Dietary fibre (g) 0 0
Thiamin (mg) 0.03 0.01
Riboflavin (mg) 0.41 0.12
Niacin (mg) 0 0
Niacin from Tryptophan (mg) 6.2 1.9
Vitamin B6 (mg) 0.11 0.03
Vitamin B12 (µg) 1.2 0.4
Folate (µg) 30 9
Pantothenate (mg) 0.30 0.09
Biotin (µg) 2.6 0.8
Vitamin C (mg) Trace Trace
Retinol (µg) 356 106.8
Carotene (µg) 203 0.1
Vitamin E (mg) 0.80 0.24
Sodium (mg) 670 201
Potassium (mg) 67 20
Calcium (mg) 690 207
Magnesium (mg) 31 9
Phosphorus (mg) 490 147
Iron (mg) 0.20 0.06
Copper (mg) Trace Trace
Zinc (mg) 1.9 0.6
Chloride (mg) 990 297
Manganese (mg) 0.1 0.03
Selenium (µg) 5 2
Iodine (µg) 26 8

The Nutritional Composition of Dairy products26
Sec
tion
3 - C
hee
se
Cheese spread (plain and reduced fat)
Plain Reduced fat
Per 100g Per small triangle Per 100g Per small triangle
(14g) (14g)
Energy (kcal) 267 37 175 25
(kJ) 1106 155 733 103
Protein (g) 11.3 1.6 15 2
Carbohydrate (g) 4.4 0.6 9 1.3
of which sugars (g) 4.4 0.6 7.3 1.0
Fat (g) 22.8 3.2 9.5 1.3
of which saturates 15.8 2.2 6.6 0.9
monounsaturates 5.8 0.8 2.4 0.3
polyunsaturates 0.8 0.1 0.3 0.04
trans fatty acids 1.1 0.2 0.5 0.07
Dietary fibre (g) 0 0 0 0
Thiamin (mg) 0.05 0.01 0.06 0.01
Riboflavin (mg) 0.36 0.05 0.53 0.07
Niacin (mg) 0.1 0.01 0.1 0.01
Niacin from Tryptophan (mg) 3.2 0.5 3.1 0.4
Vitamin B6 (mg) 0.08 0.01 0.07 0.01
Vitamin B12 (µg) 0.6 0.08 2 0.3
Folate (µg) 19 3 7 1
Pantothenate (mg) 0.51 0.07 0.42 0.06
Biotin (µg) 3.6 0.5 3 0.4
Vitamin C (mg) Trace Trace Trace Trace
Retinol (µg) 262 37 119 17
Carotene (µg) 119 17 90 13
Vitamin D (µg) 0.2 0.03 N N
Vitamin E (mg) 0.30 0.04 0.4 0.1
Sodium (mg) 288 40.3 438 61.3
Potassium (mg) 219 31 235 33
Calcium (mg) 498 70 485 68
Magnesium (mg) 24 3 24 3
Phosphorus (mg) 835 117 850 119
Iron (mg) Trace Trace 0.30 0.04
Copper (mg) Trace Trace 0.05 0.01
Zinc (mg) 1.8 0.3 1.7 0.2
Chloride (mg) 820 115 775 109
Manganese (mg) Trace Trace Trace Trace
Selenium (µg) (4) (1) 4 1
Iodine (µg) 29 4 29 4

The Nutritional Composition of Dairy products27
Sec
tion
3 - C
hee
se
Cottage cheese (various types)
†(plain) ‡(e.g. pineapple)
Regular Reduced fat† Plain with additions‡
Per 100g Per tablespoon Per 100g Per tablespoon Per 100g Per tablespoon
(40g) (40g) (40g)
Energy (kcal) 101 40 79 32 95 38
(kJ) 423 169 334 134 400 160
Protein (g) 12.6 5.0 13.3 5.3 12.8 5.1
Carbohydrate (g) 3.1 1.2 3.3 1.3 2.6 1.0
of which sugars (g) 3.1 1.2 3.3 1.3 2.6 1.0
Fat (g) 4.3 1.7 1.5 0.6 3.8 1.5
of which saturates 2.3 0.9 1.0 0.4 2.4 1.0
monounsaturates 1.2 0.5 0.4 0.2 1.1 0.4
polyunsaturates 0.2 0.1 Trace Trace 0.1 0.04
trans fatty acids 0.2 0.1 Trace Trace N N
Dietary fibre (g) 0 0 0 0 0 0
Thiamin (mg) (0.05) (0.02) 0.05 0.02 0.06 0.02
Riboflavin (mg) (0.24) (0.04) 0.24 0.10 0.21 0.08
Niacin (mg) (0.2) (0.1) 0.2 0.1 0.2 0.08
Niacin from Tryptophan (mg) (3.4) (1.4) 3.4 1.4 3.0 1.2
Vitamin B6 (mg) (0.05) (0.02) 0.05 0.02 0.08 0.03
Vitamin B12 (µg) (0.6) (0.2) 0.6 0.24 0.6 0.2
Folate (µg) (22) (9) 22 9 13 5
Pantothenate (mg) (0.3) (0.1) 0.3 0.1 0.31 0.12
Biotin (µg) (5.1) (2.0) 5.1 2.0 3.0 1.2
Vitamin C (mg) Trace Trace Trace Trace 1 0.4
Retinol (µg) 46 18 16 6 43 17
Carotene (µg) 13 5 4 2 10 4
Vitamin D (µg) 0 0 0 0 0 0
Vitamin E (mg) 0.1 0.04 0.03 0.01 0.08 0.03
Sodium (mg) (300) (120) 300 120 360 144
Potassium (mg) (161) (64) 161 64 130 52
Calcium (mg) (127) (51) 127 51 110 44
Magnesium (mg) (13) (5) 13 5 12 4.8
Phosphorus (mg) (171) (68) 171 68 160 64
Iron (mg) Trace Trace Trace Trace 0.1 0.04
Copper (mg) Trace Trace Trace Trace 0.05 0.02
Zinc (mg) (0.6) (0.2) 0.6 0.2 0.5 0.2
Chloride (mg) (490) (196) 490 196 590 236
Manganese (mg) Trace Trace Trace Trace Trace Trace
Selenium (µg) (4) (2) 4 2 (4) (2)
Iodine (µg) (24) (10) 24 10 N N

The Nutritional Composition of Dairy products28
Sec
tion
3 - C
hee
se
Cream cheese
Per 100g Per average serving in a sandwich
(30g)
Energy (kcal) 439 132
(kJ) 1807 542
Protein (g) 3.1 0.9
Carbohydrate (g) Trace Trace
of which sugars (g) Trace Trace
Fat (g) 47.4 14.2
of which saturates 29.7 8.9
monounsaturates 13.7 4.1
polyunsaturates 1.4 0.4
trans fatty acids N N
Dietary fibre (g) 0 0
Thiamin (mg) 0.03 0.01
Riboflavin (mg) 0.13 0.04
Niacin (mg) 0.1 0.03
Niacin from Tryptophan (mg) 0.7 0.2
Vitamin B6 (mg) 0.04 0.01
Vitamin B12 (µg) 0.3 0.1
Folate (µg) 11 3.3
Pantothenate (mg) 0.27 0.08
Biotin (µg) 1.6 0.5
Vitamin C (mg) Trace Trace
Retinol (µg) 385 116
Carotene (µg) 220 66
Vitamin D (µg) 0.3 0.1
Vitamin E (mg) 1.0 0.3
Sodium (mg) 300 90
Potassium (mg) 160 48
Calcium (mg) 98 29
Magnesium (mg) 10 3
Phosphorus (mg) 100 30
Iron (mg) 0.10 0.03
Copper (mg) (0.04) (0.01)
Zinc (mg) 0.5 0.2
Chloride (mg) 480 144
Manganese (mg) Trace Trace
Selenium (µg) 4 1
Iodine (µg) N N

The Nutritional Composition of Dairy products29
Sec
tion
3 - C
hee
se
Hard cheese (average of English Cheddar, Red Leicester and Double Gloucester)
Per 100g Per matchbox size serving
(30g)
Energy (kcal) 411 123
(kJ) 1702 511
Protein (g) 24.9 7.5
Carbohydrate (g) 0.1 0.03
of which sugars (g) 0.1 0.03
Fat (g) 34.5 10.4
of which saturates 21.6 6.5
monounsaturates 10.1 3.0
polyunsaturates 1.0 0.3
trans fatty acids N N
Dietary fibre (g) 0 0
Thiamin (mg) 0.03 0.01
Riboflavin (mg) 0.41 0.12
Niacin (mg) 0.1 0.03
Niacin from Tryptophan (mg) 6.8 2.0
Vitamin B6 (mg) 0.15 0.05
Vitamin B12 (µg) 2.4 0.7
Folate (µg) 31 9
Pantothenate (mg) 0.50 0.15
Biotin (µg) 3.0 0.9
Vitamin C (mg) Trace Trace
Retinol (µg) 330 99
Carotene (µg) 215 65
Vitamin D (µg) 0.3 0.1
Vitamin E (mg) 0.52 0.16
Sodium (mg) 687 206
Potassium (mg) 76 23
Calcium (mg) 731 219
Magnesium (mg) 29 9
Phosphorus (mg) 500 150
Iron (mg) 0.30 0.09
Copper (mg) 0.05 0.02
Zinc (mg) 4.1 1.2
Chloride (mg) 1005 302
Manganese (mg) Trace Trace
Selenium (µg) 6 2
Iodine (µg) 30 9

The Nutritional Composition of Dairy products30
Sec
tion
3 - C
hee
se
Processed cheese slices (regular and reduced fat)
Regular Reduced fat
Per 100g Per slice Per 100g Per slice
(20g) (20g)
Energy (kcal) 297 59 228 46
(kJ) 1234 247 953 191
Protein (g) 17.8 3.6 22.4 4.5
Carbohydrate (g) 5.0 1.0 5.0 1.0
of which sugars (g) 5.0 1.0 5.0 1.0
Fat (g) 23.0 4.6 13.1 2.6
of which saturates 14.3 2.9 8.1 1.6
monounsaturates 6.3 1.3 3.6 0.7
polyunsaturates 0.8 0.2 0.5 0.1
trans fatty acids 1.1 0.2 0.4 0.08
Dietary fibre (g) 0 0 0 0
Thiamin (mg) 0.06 0.01 0.06 0.01
Riboflavin (mg) 0.25 0.05 0.25 0.05
Niacin (mg) 0.1 0.02 0.1 0.02
Niacin from Tryptophan (mg) 4.7 0.9 4.7 0.9
Vitamin B6 (mg) 0.07 0.01 0.07 0.01
Vitamin B12 (µg) 1.2 0.2 1.2 0.2
Folate (µg) 15 3 15 3
Pantothenate (mg) 0.60 0.12 0.60 0.12
Biotin (µg) 5.6 1.1 5.6 1.1
Vitamin C (mg) Trace Trace Trace Trace
Retinol (µg) 270 54 157 31
Carotene (µg) 95 19 197 39
Vitamin D (µg) 0.2 0.04 N N
Vitamin E (mg) 0.55 0.11 0.54 0.11
Sodium (mg) 1351 270 1390 278
Potassium (mg) 178 36 185 37
Calcium (mg) 610 122 800 160
Magnesium (mg) 27 5 31 6
Phosphorus (mg) 178 36 185 37
Iron (mg) 0.50 0.10 0.30 0.06
Copper (mg) Trace Trace 0.07 0.01
Zinc (mg) 2.6 0.5 3.0 0.6
Chloride (mg) 1080 216 (1080) (216)
Manganese (mg) Trace Trace Trace Trace
Selenium (µg) 5 1 (7) (1.4)
Iodine (µg) 27 5 (27) (5.4)

The Nutritional Composition of Dairy products31
Sec
tion
3 - C
hee
se
Per 100g Per matchbox size serving
(30g)
Energy (kcal) 410 123
(kJ) 1698 509
Protein (g) 23.7 7.1
Carbohydrate (g) 0.1 0.03
of which sugars (g) 0.1 0.03
Fat (g) 35 10.5
of which saturates 23.0 7.0
monounsaturates 9.2 2.8
polyunsaturates 1.2 0.4
trans fatty acids 1.5 0.5
Dietary fibre (g) 0 0
Thiamin (mg) 0.03 0.01
Riboflavin (mg) 0.47 0.14
Niacin (mg) 0.7 0.2
Niacin from Tryptophan (mg) 5.9 1.8
Vitamin B6 (mg) 0.13 0.04
Vitamin B12 (µg) 1.2 0.4
Folate (µg) 78 23
Pantothenate (mg) 0.90 0.27
Biotin (µg) 3.3 1.0
Vitamin C (mg) Trace Trace
Retinol (µg) 360 108
Carotene (µg) 182 55
Vitamin D (µg) 0.2 0.1
Vitamin E (mg) 0.6 0.2
Sodium (mg) 788 236
Potassium (mg) 96 29
Calcium (mg) 326 98
Magnesium (mg) 15 5
Phosphorus (mg) 314 94
Iron (mg) 0.20 0.06
Copper (mg) 0.04 0.01
Zinc (mg) 2.9 0.9
Chloride (mg) 1230 369
Manganese (mg) Trace Trace
Selenium (µg) 7 2
Iodine (µg) 40 12
Stilton cheese

The Nutritional Composition of Dairy products32
Sec
tion
3 - C
hee
se
White cheese (average of Cheshire, Lancashire and Wensleydale)
Per 100g Per matchbox size serving
(30g)
Energy (kcal) 381 114
(kJ) 1580 474
Protein (g) 23.7 7.1
Carbohydrate (g) 0.1 0.03
of which sugars (g) 0.1 0.03
Fat (g) 31.8 9.5
of which saturates 21.1 6.3
monounsaturates 7.9 2.4
polyunsaturates 0.7 0.2
trans fatty acids N N
Dietary fibre (g) 0 0
Thiamin (mg) 0.02 Trace
Riboflavin (mg) 0.46 0.14
Niacin (mg) 0.1 0.03
Niacin from Tryptophan (mg) 6.3 1.9
Vitamin B6 (mg) 0.08 0.02
Vitamin B12 (µg) 1.6 0.5
Folate (µg) 39 12
Pantothenate (mg) 0.29 0.09
Biotin (µg) 3.9 1.2
Vitamin C (mg) Trace Trace
Retinol (µg) 351 105
Carotene (µg) 231 69
Vitamin D (µg) 0.2 0.1
Vitamin E (mg) 0.62 0.19
Sodium (mg) 502 151
Potassium (mg) 82 25
Calcium (mg) 544 163
Magnesium (mg) 22 7
Phosphorus (mg) 408 122
Iron (mg) 0.3 0.1
Copper (mg) 0.03 0.01
Zinc (mg) 3.5 1.1
Chloride (mg) 810 243
Manganese (mg) Trace Trace
Selenium (µg) 3 1
Iodine (µg) 41 12

The Nutritional Composition of Dairy products33
Sec
tion
4 - C
ream
Single cream
Per 100g Per 100mls Per tablespoon
(15g)
Energy (kcal) 193 193 29
(kJ) 798 798 120
Protein (g) 3.3 3.3 0.5
Carbohydrate (g) 2.2 2.2 0.3
of which sugars (g) 2.2 2.2 0.3
Fat (g) 19.1 19.1 2.9
of which saturates 12.2 12.2 1.8
monounsaturates 5.1 5.1 0.8
polyunsaturates 0.6 0.6 0.1
trans fatty acids 0.7 0.7 0.1
Dietary fibre (g) 0 0 0
Thiamin (mg) 0.03 0.03 Trace
Riboflavin (mg) 0.19 0.19 0.03
Niacin (mg) 0.1 0.1 0.02
Niacin from Tryptophan (mg) 0.5 0.5 0.08
Vitamin B6 (mg) 0.03 0.03 Trace
Vitamin B12 (µg) 0.4 0.4 0.06
Folate (µg) 5.0 5.0 0.8
Pantothenate (mg) 0.3 0.3 0.05
Biotin (µg) 2.8 2.8 0.4
Vitamin C (mg) 1.0 1.0 0.2
Retinol (µg) 291 291 44
Carotene (µg) 169 169 25
Vitamin D (µg) 0.3 0.3 0.04
Vitamin E (mg) 0.47 0.47 0.07
Sodium (mg) 29 29 4
Potassium (mg) 104 104 16
Calcium (mg) 89 89 13
Magnesium (mg) 8 8 1
Phosphorus (mg) 79 79 12
Iron (mg) Trace Trace Trace
Copper (mg) Trace Trace Trace
Zinc (mg) 0.3 0.3 0.04
Chloride (mg) 80 80 12
Manganese (mg) Trace Trace Trace
Selenium (µg) N N N
Iodine (µg) N N N

The Nutritional Composition of Dairy products34
Sec
tion
4 - C
ream
Soured cream
Per 100g Per tablespoon
(15g)
Energy (kcal) 205 31
(kJ) 845 127
Protein (g) 2.9 0.4
Carbohydrate (g) 3.8 0.6
of which sugars (g) 3.8 0.6
Fat (g) 19.9 3.0
of which saturates 12.5 1.9
monounsaturates 5.8 0.9
polyunsaturates 0.6 0.1
trans fatty acids N N
Dietary fibre (g) 0 0
Thiamin (mg) 0.03 Trace
Riboflavin (mg) 0.17 0.02
Niacin (mg) 0.1 0.01
Niacin from Tryptophan (mg) 0.7 0.1
Vitamin B6 (mg) 0.04 Trace
Vitamin B12 (µg) 0.2 0.03
Folate (µg) 12 2
Pantothenate (mg) 0.24 0.04
Biotin (µg) 1.5 0.2
Vitamin C (mg) Trace Trace
Retinol (µg) 330 50
Carotene (µg) 105 16
Vitamin D (µg) 0.2 0.03
Vitamin E (mg) 0.44 0.07
Sodium (mg) 41 6
Potassium (mg) 110 17
Calcium (mg) 93 14
Magnesium (mg) 10 2
Phosphorus (mg) 81 12
Iron (mg) 0.4 0.06
Copper (mg) Trace Trace
Zinc (mg) 0.5 0.07
Chloride (mg) 81 12
Manganese (mg) Trace Trace
Selenium (µg) Trace Trace
Iodine (µg) N N

The Nutritional Composition of Dairy products35
Sec
tion
4 - C
ream
Per 100g Per 100mls Per tablespoon
(96g) (30g)
Energy (kcal) 381 366 114
(kJ) 1568 1505 470
Protein (g) 2.0 1.9 0.6
Carbohydrate (g) 2.7 2.6 0.8
of which sugars (g) 2.7 2.6 0.8
Fat (g) 40.3 38.7 12.1
of which saturates 25.2 24.2 7.6
monounsaturates 11.7 11.2 3.5
polyunsaturates 1.1 1.1 0.3
trans fatty acids N N N
Dietary fibre (g) 0 0 0
Thiamin (mg) 0.02 0.02 0.01
Riboflavin (mg) 0.17 0.16 0.05
Niacin (mg) Trace Trace Trace
Niacin from Tryptophan (mg) 0.5 0.5 0.2
Vitamin B6 (mg) 0.04 0.04 0.01
Vitamin B12 (µg) 0.2 0.2 0.06
Folate (µg) 7.0 6.7 2
Pantothenate (mg) 0.22 0.21 0.07
Biotin (µg) 1.4 1.3 0.4
Vitamin C (mg) 1.0 0.9 0.3
Retinol (µg) 399 383 120
Carotene (µg) 247 237 74
Vitamin D (µg) 0.3 0.3 0.1
Vitamin E (mg) 1.32 1.27 0.40
Sodium (mg) 25 24 8
Potassium (mg) 86 83 26
Calcium (mg) 58 56 17
Magnesium (mg) 6 6 2
Phosphorus (mg) 59 57 18
Iron (mg) Trace Trace Trace
Copper (mg) Trace Trace Trace
Zinc (mg) 0.2 0.2 0.1
Chloride (mg) 59 57 18
Manganese (mg) Trace Trace Trace
Selenium (µg) N N N
Iodine (µg) N N N
Whipping cream

The Nutritional Composition of Dairy products36
Sec
tion
4 - C
ream
Per 100g Per 100mls Per tablespoon
(94g) (30g)
Energy (kcal) 496 466 149
(kJ) 2041 1919 612
Protein (g) 1.6 1.5 0.5
Carbohydrate (g) 1.7 1.6 0.5
of which sugars (g) 1.7 1.6 0.5
Fat (g) 53.7 50.5 16.1
of which saturates 33.4 31.4 10.0
monounsaturates 13.8 13.0 4.1
polyunsaturates 1.9 1.8 0.6
trans fatty acids 1.8 1.7 0.5
Dietary fibre (g) 0 0 0
Thiamin (mg) 0.02 0.02 0.01
Riboflavin (mg) 0.19 0.18 0.06
Niacin (mg) Trace Trace Trace
Niacin from Tryptophan (mg) 0.3 0.3 0.1
Vitamin B6 (mg) 0.01 0.01 Trace
Vitamin B12 (µg) 0.6 0.6 0.2
Folate (µg) 7 7 2
Pantothenate (mg) 0.23 0.22 0.07
Biotin (µg) 0.9 0.8 0.3
Vitamin C (mg) 1.0 0.9 0.3
Retinol (µg) 779d 732d 234d
Carotene (µg) 483d 454d 145d
Vitamin D (µg) 0.3 0.3 0.1
Vitamin E (mg) 1.64d 1.54d 0.49d
Sodium (mg) 22 21 7
Potassium (mg) 65 61 20
Calcium (mg) 49 46 15
Magnesium (mg) 5 5 2
Phosphorus (mg) 52 49 16
Iron (mg) 0.10 0.09 0.03
Copper (mg) Trace Trace Trace
Zinc (mg) 0.2 0.2 0.1
Chloride (mg) 36 34 11
Manganese (mg) Trace Trace Trace
Selenium (µg) 3 3 1
Iodine (µg) 35 33 11
Double cream
dDouble cream with added alcohol contains 390(g retinol, 187(g carotene
and 1.08mg vitamin E per 100g

The Nutritional Composition of Dairy products37
Sec
tion
4 - C
ream
Per 100g Per tablespoon
(30g)
Energy (kcal) 586 176
(kJ) 2413 724
Protein (g) 1.6 0.5
Carbohydrate (g) 2.3 0.7
of which sugars (g) 2.3 0.7
Fat (g) 63.5 19.1
of which saturates 39.7 11.9
monounsaturates 18.4 5.5
polyunsaturates 1.8 0.5
trans fatty acids N N
Dietary fibre (g) 0 0
Thiamin (mg) 0.02 0.01
Riboflavin (mg) 0.16 0.05
Niacin (mg) Trace Trace
Niacin from Tryptophan (mg) 0.4 0.1
Vitamin B6 (mg) 0.03 0.01
Vitamin B12 (µg) 0.1 0.03
Folate (µg) 6 2
Pantothenate (mg) 0.14 0.04
Biotin (µg) 1.0 0.3
Vitamin C (mg) Trace Trace
Retinol (µg) 705 212
Carotene (µg) 685 206
Vitamin D (µg) 0.3 0.1
Vitamin E (mg) 1.48 0.44
Sodium (mg) 18 5
Potassium (mg) 55 17
Calcium (mg) 37 11
Magnesium (mg) 5 2
Phosphorus (mg) 40 12
Iron (mg) 0.10 0.03
Copper (mg) 0.09 0.03
Zinc (mg) 0.2 0.1
Chloride (mg) 40 12
Manganese (mg) Trace Trace
Selenium (µg) Trace Trace
Iodine (µg) Trace Trace
Clotted cream

The Nutritional Composition of Dairy products38
Sec
tion
4 - C
ream
Full fat Half fat
Per 100g Per tablespoon Per 100g Per tablespoon
(30g) (30g)
Energy (kcal) 378 113 162 49
(kJ) 1556 467 671 201
Protein (g) 2.2 0.7 2.7 0.8
Carbohydrate (g) 2.4 0.7 4.4 1.3
of which sugars (g) 2.1 0.6 3.0 0.9
Fat (g) 40.0 12.0 15 4.5
of which saturates 27.1 8.1 10.2 3.1
monounsaturates 8.6 2.6 3.2 1.0
polyunsaturates 1.1 0.3 0.4 0.1
trans fatty acids 0.8 0.2 0.3 0.1
Dietary fibre (g) 0 0 0 0
Thiamin (mg) 0.02 0.01 0.02 Trace
Riboflavin (mg) 0.21 0.06 0.21 0.06
Niacin (mg) 0.1 0.03 0.1 0.03
Niacin from Tryptophan (mg) N N N N
Vitamin B6 (mg) 0.01 Trace 0.01 Trace
Vitamin B12 (µg) 0.2 0.1 0.2 0.1
Folate (µg) 3.0 0.9 3 1
Pantothenate (mg) N N N N
Biotin (µg) N N N N
Vitamin C (mg) N N N N
Retinol (µg) 388 116 300 90
Carotene (µg) 143 43 21 6
Vitamin D (µg) 0.3 0.1 Trace Trace
Vitamin E (mg) 0.72 0.22 0.42 0.12
Sodium (mg) 22 7 36 11
Potassium (mg) 81 24 122 37
Calcium (mg) 58 17 95 29
Magnesium (mg) 6 2 9 3
Phosphorus (mg) 58 17 81 24
Iron (mg) 0.10 0.03 0.10 0.03
Copper (mg) Trace Trace Trace Trace
Zinc (mg) 0.2 0.1 0.3 0.1
Chloride (mg) 55 17 N N
Manganese (mg) Trace Trace Trace Trace
Selenium (µg) 0 0 (4) (1)
Iodine (µg) 8 2 (8) (2)
Crème fraiche (full fat and half fat)

The Nutritional Composition of Dairy products39
Sec
tion
4 - C
ream
Dairy cream (extra thick)
Per 100g Per tablespoon
(30g)
Energy (kcal) 236 71
(kJ) 973 292
Protein (g) 2.9 0.9
Carbohydrate (g) 3.4 1.0
of which sugars (g) 3.4 1.0
Fat (g) 23.5 7.1
of which saturates 15.3 4.6
monounsaturates 6.0 1.8
polyunsaturates 0.8 0.2
trans fatty acids 0.8 0.2
Dietary fibre (g) 0 0
Thiamin (mg) 0.03 0.01
Riboflavin (mg) 0.19 0.06
Niacin (mg) 0.1 0.03
Niacin from Tryptophan (mg) 0.5 0.2
Vitamin B6 (mg) 0.03 0.01
Vitamin B12 (µg) 0.4 0.1
Folate (µg) 5 2
Pantothenate (mg) 0.3 0.1
Biotin (µg) 2.8 0.8
Vitamin C (mg) 1 0.3
Retinol (µg) 435 131
Carotene (µg) 384 115
Vitamin D (µg) 0.3 0.1
Vitamin E (mg) 0.8 0.2
Sodium (mg) 29 9
Potassium (mg) 100 30
Calcium (mg) 95 29
Magnesium (mg) 8 2
Phosphorus (mg) 81 24
Iron (mg) 0.10 0.03
Copper (mg) 0.01 Trace
Zinc (mg) 0.3 0.1
Chloride (mg) N N
Manganese (mg) Trace Trace
Selenium (µg) N N
Iodine (µg) N N

The Nutritional Composition of Dairy products40
Sec
tion
4 - C
ream
Sterilised cream (canned)
Per 100g Per tablespoon
(15g)
Energy (kcal) 239 36
(kJ) 985 148
Protein (g) 2.5 0.4
Carbohydrate (g) 3.7 0.6
of which sugars (g) 3.7 0.6
Fat (g) 23.9 3.6
of which saturates 14.9 2.2
monounsaturates 6.9 1.0
polyunsaturates 0.7 0.1
trans fatty acids N N
Dietary fibre (g) 0 0
Thiamin (mg) 0.02 Trace
Riboflavin (mg) 0.16 0.02
Niacin (mg) 0.1 0.02
Niacin from Tryptophan (mg) 0.6 0.1
Vitamin B6 (mg) 0.02 Trace
Vitamin B12 (µg) 0.1 0.02
Folate (µg) 1 0.2
Pantothenate (mg) 0.25 0.04
Biotin (µg) 2.1 0.3
Vitamin C (mg) Trace Trace
Retinol (µg) 240 36
Carotene (µg) 215 32
Vitamin D (µg) Trace Trace
Vitamin E (mg) 0.48 0.07
Sodium (mg) 53 8
Potassium (mg) 110 17
Calcium (mg) 86 13
Magnesium (mg) 10 2
Phosphorus (mg) 73 11
Iron (mg) 0.8 0.1
Copper (mg) Trace Trace
Zinc (mg) 1.1 0.2
Chloride (mg) 78 12
Manganese (mg) Trace Trace
Selenium (µg) Trace Trace
Iodine (µg) N N

The Nutritional Composition of Dairy products41
Sec
tion
4 - C
ream
Full fat Half fat
Per 100g Per tablespoon Per 100g Per tablespoon
(10g) (10g)
Energy (kcal) 252 25 196 20
(kJ) 1043 104 811 81
Protein (g) 1.9 0.2 2.8 0.3
Carbohydrate (g) 7.2 0.7 7.6 0.8
of which sugars (g) 7.2 0.7 7.4 0.7
Fat (g) 24.2 2.5 17.3 1.7
of which saturates 15.2 1.5 10.9 1.1
monounsaturates 6.1 0.6 4.3 0.4
polyunsaturates 0.8 0.1 0.6 0.1
trans fatty acids 0.8 0.1 0.6 0.1
Dietary fibre (g) 0 0 0 0
Thiamin (mg) 0.03 Trace 0.03 Trace
Riboflavin (mg) 0.26 0.03 0.26 0.03
Niacin (mg) 0.1 0.01 0.1 0.01
Niacin from Tryptophan (mg) 0.5 0.05 0.5 0.05
Vitamin B6 (mg) 0.02 Trace 0.02 Trace
Vitamin B12 (µg) 0.1 0.01 0.1 0.01
Folate (µg) 6 1 6 1
Pantothenate (mg) 0.19 0.02 0.19 0.02
Biotin (µg) 1.7 0.2 1.7 0.2
Vitamin C (mg) 0 0 0 0
Retinol (µg) 279 28 147 15
Carotene (µg) 111 11 39 4
Vitamin D (µg) 0.3 0.03 Trace Trace
Vitamin E (mg) 0.79 0.08 0.46 0.05
Sodium (mg) 31 3 35 4
Potassium (mg) 107 11 110 11
Calcium (mg) 54 5 87 9
Magnesium (mg) 7 1 9 1
Phosphorus (mg) 57 6 77 8
Iron (mg) Trace Trace Trace Trace
Copper (mg) Trace Trace Trace Trace
Zinc (mg) 0.2 0.02 0.3 0.03
Chloride (mg) 66 7 66 7
Manganese (mg) Trace Trace Trace Trace
Selenium (µg) 1 0.1 1 0.1
Iodine (µg) 11 1 11 1
UHT canned spray dairy cream (full fat and half fat)

The Nutritional Composition of Dairy products42
Sec
tion
4 - C
ream
Imitation cream (Dream Topping made with semi-skimmed milk)
Per 100g Per average serving on fruit or cake
(15g)
Energy (kcal) 166 25
(kJ) 694 104
Protein (g) 3.9 0.6
Carbohydrate (g) 12.2 1.8
of which sugars (g) 10.2 1.5
Fat (g) 11.7 1.8
of which saturates 10.5 1.6
monounsaturates 0.5 0.08
polyunsaturates 0.1 0.02
trans fatty acids N N
Dietary fibre (g) Trace Trace
Thiamin (mg) 0.04 Trace
Riboflavin (mg) 0.19 0.03
Niacin (mg) 0.1 0.02
Niacin from Tryptophan (mg) 0.9 0.1
Vitamin B6 (mg) 0.05 Trace
Vitamin B12 (µg) 0.5 0.1
Folate (µg) 4 1
Pantothenate (mg) N N
Biotin (µg) N N
Vitamin C (mg) 1 0.2
Retinol (µg) 16 2
Carotene (µg) N N
Vitamin D (µg) 0 0
Vitamin E (mg) N N
Sodium (mg) 70 11
Potassium (mg) 130 20
Calcium (mg) 99 15
Magnesium (mg) 9 1
Phosphorus (mg) 94 14
Iron (mg) 0.1 0.02
Copper (mg) 0.03 Trace
Zinc (mg) 0.4 0.1
Chloride (mg) 82 12
Manganese (mg) Trace Trace
Selenium (µg) N N
Iodine (µg) 12 2

The Nutritional Composition of Dairy products43
Sec
tion
4 - C
ream
Single Whipping Double
Per 100g Per average serving Per 100g Per tablespoon Per 100g Per tablespoon
on fruit/cake (30g) (30g)
Energy (kcal) 158 24 292 88 345 104
(kJ) 654 98 1204 361 1423 427
Protein (g) 3.1 0.5 2.6 0.8 2.6 0.8
Carbohydrate (g) 4.0 0.6 3.3 1.0 3.6 1.1
of which sugars (g) 4.0 0.6 3.3 1.0 3.6 1.1
Fat (g) 14.5 2.2 29.9 9.0 35.7 10.7
of which saturates 9.2 1.4 26.4 7.9 24.3 7.3
monounsaturates 3.2 0.5 2.8 0.8 6.5 2.0
polyunsaturates 1.3 0.2 0.9 0.3 2.8 0.8
trans fatty acids 0.4 0.1 N N 0.9 0.3
Dietary fibre (g) 0.3e 0.1e 0.1e 0.03e 0.1e 0.03e
Thiamin (mg) N N 0.04 0.01 N N
Riboflavin (mg) N N 0.24 0.07 N N
Niacin (mg) N N 0.1 0.03 N N
Niacin from Tryptophan (mg) 0.7 0.1 0.4 0.1 0.6 0.2
Vitamin B6 (mg) N N 0.01 Trace N N
Vitamin B12 (µg) N N 0.3 0.1 N N
Folate (µg) N N 8 2 N N
Pantothenate (mg) N N 0.23 0.07 N N
Biotin (µg) N N 1.1 0.3 N N
Vitamin C (mg) N N N N N N
Retinol (µg) 11 2 9 3 10 3
Carotene (µg) 166 25 340 102 363 109
Vitamin D (µg) Trace Trace Trace Trace Trace Trace
Vitamin E (mg) 0.84 0.13 0.53 0.16 1.33 0.40
Sodium (mg) 61 9 56 17 47 14
Potassium (mg) 139 21 94 28 109 33
Calcium (mg) 96 14 78 23 79 24
Magnesium (mg) 10 2 9 3 8 2
Phosphorus (mg) 88 13 75 23 73 22
Iron (mg) 0.10 0.02 0.40 0.10 0.20 0.06
Copper (mg) Trace Trace Trace Trace Trace Trace
Zinc (mg) 0.3 0.1 0.3 0.9 0.3 0.1
Chloride (mg) N N 77 23 N N
Manganese (mg) Trace Trace Trace Trace N N
Selenium (µg) (2) (0.3) 2 1 (2) (1)
Iodine (µg) N N 12 4 N -N
Imitation cream - Elmlea (single, whipping and double)
eCarob and guar gums are added as thickeners

The Nutritional Composition of Dairy products44
Sec
tion
4 - C
ream
Imitation Cream(Tip Top Dessert Topping)
Per 100g Per 3 dessert spoon serving
(50g)
Energy (kcal) 112 56
(kJ) 468 234
Protein (g) 4.9 2.5
Carbohydrate (g) 9.0 4.5
of which sugars (g) 9.0 4.5
Fat (g) 6.5 3.3
of which saturates 5.9 3.0
monounsaturates 0.2 0.1
polyunsaturates 0.1 0.05
trans fatty acids 0.1 0.05
Dietary fibre (g) Trace Trace
Thiamin (mg) 0.04 0.02
Riboflavin (mg) 0.33 0.17
Niacin (mg) 0.1 0.05
Niacin from Tryptophan (mg) 1.2 0.6
Vitamin B6 (mg) 0.02 0.01
Vitamin B12 (µg) 0.1 0.05
Folate (µg) 7 4
Pantothenate (mg) N N
Biotin (µg) N N
Vitamin C (mg) Trace Trace
Retinol (µg) Trace Trace
Carotene (µg) Trace Trace
Vitamin D (µg) Trace Trace
Vitamin E (mg) Trace Trace
Sodium (mg) 110 55
Potassium (mg) 205 103
Calcium (mg) 173 87
Magnesium (mg) 18 9
Phosphorus (mg) 171 86
Iron (mg) 0.2 0.1
Copper (mg) Trace Trace
Zinc (mg) 0.6 0.3
Chloride (mg) 147 74
Manganese (mg) Trace Trace
Selenium (µg) (2) (1)
Iodine (µg) N N

The Nutritional Composition of Dairy products45
Sec
tion
5 - D
airy
des
sert
s
Ice cream, vanilla (dairy† and non-dairy‡)
*Gums and cellulose derivatives are added as stabilisers
†Must be made with whole milk and contain only milk fat
‡Usually made from skimmed milk and vegetable fat
Dairy ice cream† Non-dairy ice cream‡
Per 100g Per 75g portion Per 100g Per 75g portion
Energy (kcal) 177 133 153 115
(kJ) 741 556 640 480
Protein (g) 3.6 2.7 3.0 2.3
Carbohydrate (g) 19.8 14.9 18.8 14.1
of which sugars (g) 18.7 14.0 18.0 13.5
Fat (g) 9.8 7.4 7.8 5.9
of which saturates 6.1 4.6 4.8 3.6
monounsaturates 2.8 2.1 2.2 1.7
polyunsaturates 0.3 0.2 0.4 0.3
trans fatty acids 0.8 0.6 0.3 0.2
Dietary fibre (g) Trace* Trace* Trace* Trace*
Thiamin (mg) 0.1 0.08 0.14 0.11
Riboflavin (mg) 0.28 0.21 0.26 0.20
Niacin (mg) 0.2 0.2 0.2 0.2
Niacin from Tryptophan (mg) 0.9 0.7 0.7 0.5
Vitamin B6 (mg) 0.04 0.03 Trace Trace
Vitamin B12 (µg) 0.5 0.4 0.7 0.5
Folate (µg) 6 5 8 6
Pantothenate (mg) 1.05 0.79 0.43 0.32
Biotin (µg) 2.2 1.7 3.0 2.2
Vitamin C (mg) 1 1 1 1
Retinol (µg) 91 68 1 1
Carotene (µg) 45 34 5 4
Vitamin D (µg) 0.5 0.4 0.3 0.2
Vitamin E (mg) 0.49 0.37 0.26 0.20
Sodium (mg) 60 45 62 47
Potassium (mg) 174 131 164 123
Calcium (mg) 100 75 72 54
Magnesium (mg) 12 9 11 8
Phosphorus (mg) 91 68 74 56
Iron (mg) Trace Trace 0.1 0.1
Copper (mg) Trace Trace Trace Trace
Zinc (mg) 0.3 0.2 0.2 0.2
Chloride (mg) 110 83 107 80
Manganese (mg) Trace Trace Trace Trace
Selenium (µg) 2 2 2 2
Iodine (µg) 32 24 36 27

The Nutritional Composition of Dairy products46
Sec
tion
5 - D
airy
des
sert
s
Custard (made with whole or semi-skimmed milk)
whole milk semi-skimmed milk
Per 100g Per average portion Per 100g Per average portion
(120g) (120g)
Energy (kcal) 118 142 95 114
(kJ) 494 593 404 485
Protein (g) 3.9 4.7 4.0 4.8
Carbohydrate (g) 16.2 19.4 16.4 19.7
of which sugars (g) 11.1 13.3 11.3 13.6
Fat (g) 4.5 5.4 2.0 2.4
of which saturates 2.9 3.5 1.2 1.4
monounsaturates 1.2 1.4 0.5 0.6
polyunsaturates 0.2 0.2 0.1 0.1
trans fatty acids 0.2 0.2 0.1 0.1
Dietary fibre (g) 0 0 0 0
Thiamin (mg) 0.03 0.04 0.04 0.05
Riboflavin (mg) 0.24 0.29 0.25 0.3
Niacin (mg) 0.2 0.2 0.1 0.1
Niacin from Tryptophan (mg) 0.7 0.8 0.9 1.1
Vitamin B6 (mg) 0.06 0.07 0.06 0.07
Vitamin B12 (µg) 1.0 1.2 0.4 0.5
Folate (µg) 7 8 6 7
Pantothenate (mg) 0.60 0.70 0.33 0.40
Biotin (µg) 2.9 3.5 2.3 2.8
Vitamin C (mg) 1 1 1 1
Retinol (µg) 38 46 21 25
Carotene (µg) 23 28 10 12
Vitamin D (µg) Trace Trace Trace Trace
Vitamin E (mg) 0.07 0.08 0.04 0.05
Sodium (mg) 67 80 67 80
Potassium (mg) 182 218 184 221
Calcium (mg) 138 166 140 168
Magnesium (mg) 13 16 13 15.6
Phosphorus (mg) 110 132 111 133
Iron (mg) 0.1 0.1 0.1 0.1
Copper (mg) 0.01 0.01 0.01 0.01
Zinc (mg) 0.5 0.6 0.5 0.6
Chloride (mg) 129 155 127 152
Manganese (mg) N N N N
Selenium (µg) N N N N
Iodine (µg) N N N N

The Nutritional Composition of Dairy products47
Sec
tion
5 - D
airy
des
sert
s
Per 100g Per individual pot
(150g)
Energy (kcal) 98 147
(kJ) 414 621
Protein (g) 2.7 4.1
Carbohydrate (g) 16.3 24.5
of which sugars (g) 12.8 19.0
Fat (g) 2.9 4.4
of which saturates 0 0
monounsaturates 0.8 1.2
polyunsaturates 0.1 0.2
trans fatty acids 0.1 0.2
Dietary fibre (g) (0.1) (0.2)
Thiamin (mg) 0.12 0.18
Riboflavin (mg) 0.19 0.29
Niacin (mg) 0.1 0.2
Niacin from Tryptophan (mg) 0.3 0.5
Vitamin B6 (mg) 0.01 0.02
Vitamin B12 (µg) 0.2 0.3
Folate (µg) 2 3
Pantothenate (mg) 0.43 0.65
Biotin (µg) 1.3 2.0
Vitamin C (mg) 0 0
Retinol (µg) 36 54
Carotene (µg) 376 564
Vitamin D (µg) Trace Trace
Vitamin E (mg) 0.29 0.44
Sodium (mg) 41 62
Potassium (mg) 129 194
Calcium (mg) 91 137
Magnesium (mg) 9 14
Phosphorus (mg) 83 125
Iron (mg) 0.1 0.2
Copper (mg) Trace Trace
Zinc (mg) 0.3 0.5
Chloride (mg) 137 206
Manganese (mg) Trace Trace
Selenium (µg) 1 2
Iodine (µg) 26 39
Custard, ready to eat

The Nutritional Composition of Dairy products48
Sec
tion
5 - D
airy
des
sert
s
Milk pudding (made with whole milk)
Per 100g Per average portion
(200g)
Energy (kcal) 130 260
(kJ) 545 1090
Protein (g) 4.1 8.2
Carbohydrate (g) 19.6 39.2
of which sugars (g) 10.4 20.8
Fat (g) 4.3 8.6
of which saturates 2.7 5.4
monounsaturates 1.1 2.2
polyunsaturates 0.2 0.4
trans fatty acids 0.2 0.4
Dietary fibre (g) 0.1 0.1
Thiamin (mg) 0.03 0.06
Riboflavin (mg) 0.22 0.44
Niacin (mg) 0.3 0.6
Niacin from Tryptophan (mg) 0.8 1.6
Vitamin B6 (mg) 0.06 0.12
Vitamin B12 (µg) 1 2
Folate (µg) 5 10
Pantothenate (mg) 0.49 0.98
Biotin (µg) 2.8 5.6
Vitamin C (mg) 2 4
Retinol (µg) 36 72
Carotene (µg) 21 42
Vitamin D (µg) Trace Trace
Vitamin E (mg) 0.09 0.18
Sodium (mg) 47 94
Potassium (mg) 176 352
Calcium (mg) 130 260
Magnesium (mg) 13 26
Phosphorus (mg) 109 218
Iron (mg) 0.1 0.2
Copper (mg) 0.02 0.04
Zinc (mg) 0.5 1.0
Chloride (mg) 98 196
Manganese (mg) N N
Selenium (µg) N N
Iodine (µg) N N

The Nutritional Composition of Dairy products49
Sec
tion
5 - D
airy
des
sert
s
Regular Low fat
Per 100g Per average portion Per 100g Per average portion
(200g) (200g)
Energy (kcal) 85 170 71 142
(kJ) 262 524 304 608
Protein (g) 3.3 6.6 3.5 7.0
Carbohydrate (g) 16.1 32.2 13.4 26.8
of which sugars (g) 8.7 17.4 6.1 12.2
Fat (g) 1.3 2.6 0.8 1.6
of which saturates 0.8 1.6 (0.5) (1.0)
monounsaturates 0.3 0.6 (0.2) (0.4)
polyunsaturates 0.1 0.2 (0.1) (0.2)
trans fatty acids Trace Trace Trace Trace
Dietary fibre (g) 0.1 0.2 (0.1) (0.2)
Thiamin (mg) 0.01 0.02 (0.01) (0.02)
Riboflavin (mg) 0.13 0.26 (0.13) (0.26)
Niacin (mg) 0.2 0.4 (0.2) (0.4)
Niacin from Tryptophan (mg) 0.6 1.2 (0.7) (1.4)
Vitamin B6 (mg) 0.01 0.02 (0.01) (0.02)
Vitamin B12 (µg) Trace Trace Trace Trace
Folate (µg) 0 0 Trace Trace
Pantothenate (mg) 0.30 0.60 (0.03) (0.06)
Biotin (µg) 2 4 (2) (4)
Vitamin C (mg) 0 0 Trace Trace
Retinol (µg) 16 32 (16) (32)
Carotene (µg) 10 20 (10) (20)
Vitamin D (µg) Trace Trace Trace Trace
Vitamin E (mg) 0.16 0.32 (0.10) (0.20)
Sodium (mg) 43 86 (43) (86)
Potassium (mg) 130 260 (130) (260)
Calcium (mg) 88 176 (88) (176)
Magnesium (mg) 12 24 (12) (24)
Phosphorus (mg) 86 172 (86) (172)
Iron (mg) 0.1 0.2 (0.1) (0.2)
Copper (mg) 0.13 0.26 (0.13) (0.26)
Zinc (mg) 0.5 1.0 (0.5) (1.0)
Chloride (mg) 93 186 (93) (186)
Manganese (mg) 0.1 0.2 (0.1) (0.2)
Selenium (µg) N N N N
Iodine (µg) 28 56 (28) (56)
Rice pudding, canned (regular and low fat)