the northeast bird monitoring handbook - nc state … and paper...ten steps to successful bird...
TRANSCRIPT

Ten Steps to Successful Bird Conservation through Improved Monitoring
The Northeast Bird Monitoring Handbook
January 2009
J. Daniel Lambert, Thomas P. Hodgman, Edward J. Laurent, Gwenda L. Brewer, Marshall J. Iliff, and Randy Dettmers
Northeast Coordinated Bird Monitoring Partnership

The Northeast Coordinated Bird Monitoring (NECBM) Partnership is an alliance of government agencies, universities, and non-governmental organizations dedicated to strengthening the scientific basis for bird conservation through effective and efficient
monitoring. It is administered by American Bird Conservancy in concert with Northeast Partners In Flight, the Northeast Shorebird Conservation Plan, the Mid-Atlantic/New England/Maritimes Waterbird Conservation Plan, and the North American Bird Conservation Initiative Monitoring Subcommittee. The Sport Fish and Wildlife Restoration Programs of the U.S. Fish and Wildlife Service made the Partnership possible with a Multistate Conservation Grant, awarded in conjunction with the Association of Fish and Wildlife Agencies.
Northeast Coordinated Bird Monitoring Steering Committee
David N. Pashley, American Bird Conservancy, Co-chair
Kenneth V. Rosenberg, Cornell Lab of Ornithology, Co-chair
J. Daniel Lambert, American Bird Conservancy, Coordinator
Gwenda L. Brewer, Maryland Department of Natural Resources
Stephen C. Brown, Manomet Center for Conservation Sciences
Randy Dettmers, U.S. Fish and Wildlife Service
Thomas P. Hodgman, Maine Department of Inland Fisheries and Wildlife
Marshall J. Iliff, Cornell Lab of Ornithology
Edward J. Laurent, American Bird Conservancy
Katharine C. Parsons, Manomet Center for Conservation Sciences
Stephanie R. Schmidt, Manomet Center for Conservation Sciences
Published by American Bird Conservancy and available in digital format at http://www.nebirdmonitor.org
P. O. Box 249 • 4249 Loudoun Ave The Plains, VA 20198-0249 (540) 253-5780 • [email protected] • www.abcbirds.org
Recommended citation. Lambert, J. D., T. P. Hodgman, E. J. Laurent, G. L. Brewer, M. J. Iliff, and R. Dettmers. 2009. The Northeast Bird Monitoring Handbook. American Bird Conservancy. The Plains, Virginia. 32 pp.
Design by Gemma Radko, ABC. Cover photos, clockwise from top left: Red Knots: Ralph Wright; Sarah Frey monitoring Bicknell’s Thrush demography: Kent McFarland; Ovenbird: Greg Lavaty; Bryan Pfeiffer conducting playback survey: Steve Faccio.

– 3 –
TaBle of CoNTeNTs
Monitoring birds for conservation in the Northeast .................................................................................................... 4
Step 1: Establish a clear purpose ................................................................................................................................. 6
Step 2: Determine whether an existing program or protocol meets your needs ........................................................... 8
Step 3: Assemble a team of collaborators with complementary interests and skills ...................................................... 9
Step 4: Summarize the relationship of target populations to other ecosystem elements, processes, and stressors ............ 11
Step 5: Develop a statistically robust approach to sampling and data analysis ........................................................... 13
Step 6: Design and pilot standardized field protocols that minimize error and bias ................................................... 15
Step 7: Identify or develop a data management system ............................................................................................ 17
Step 8: Implement the monitoring program ............................................................................................................. 19
Step 9: Present results in a format that supports sound management and conservation decisions .............................. 21
Step 10: Evaluate and adjust management and monitoring to make better bird conservation decisions .................... 23
Building a legacy of coordinated bird monitoring ................................................................................................... 26
Literature cited ......................................................................................................................................................... 27
Appendix 1. Ten steps at a glance ............................................................................................................................. 29
Acknowledgments .................................................................................................................................................... 30
Ten Steps to Successful Bird Conservation through Improved Monitoring
The Northeast Bird Monitoring Handbook
Saltmarsh Sharp-tailed Sparrow: George Jett Black Skimmers: Tom Grey Golden-winged Warbler: George Jett

– 4 –
Common Loon: Michael Butler, Trent University
Bird monitoring has played an important role in con-servation planning in the northeastern United States for over 50 years, providing essential information on avian distribution, abundance, and population trends. Some monitoring initiatives also have quantified species-habitat relationships and population responses to environmental change. Integration of monitoring into management and conservation has helped stabilize or restore several high-profile species that once were imperiled or extirpated in the region, including the Common Loon, Atlantic Puffin, American Black Duck, Bald Eagle, and Peregrine Falcon.
However, many monitoring programs have operated sepa-rately from the decision-making process, exerting little in-fluence on management and conservation actions. At the same time, widely varying survey methods have prevented the pooling of data from multiple projects for regional or even statewide analyses. As threats to birds multiply and funds to confront them fail to keep pace, the limits of monitoring in isolation have become increasingly evident. Success in bird conservation today calls for a strategic and regionally coordinated approach to monitoring.
Bird monitoring involves repeated measurement of avian populations over brief or long periods of time, at local to international scales. Monitoring programs that measure covariates, variables expected to be associated with popu-lation change, can provide new insight into the ecology of target species by revealing threats and potential remedies to conservation problems. When performed effectively, monitoring can:
quantify the current status, or condition, of bird populations in terms of occurrence, distribution, abundance, vital rates, and/or health;
measure trends, or changes in status, over time;
reveal effects of natural or human-induced changes in the environment; and
aid in the development and evaluation of conservation and management decisions.
Monitoring birds for conservation in the Northeast
Who uses bird monitoring results? How are they used?Knowledge gained from monitoring is integral to many aspects of bird conservation, enabling:
Agency directors to justify greater support for conservation programs;
Program administrators to allocate resources according to need and opportunity;
Public and private landowners to make informed management decisions;
Extension educators to promote bird-friendly agriculture, forestry, and municipal planning;
Public affairs specialists to communicate urgent problems and conservation achievements;
Land protection organizations to identify properties of high value to birds;
Lawmakers to craft public policies that reduce threats to birds and other wildlife;
Regulators to assess the risks of issuing development, emissions, or discharge permits; and
Conservation officers to bring evidence to bear on enforcement of environmental laws.

– 5 –
The No r t heas t B i r d Mon i t o r i ng Handbook
Each of these uses depends on the work of biologists who develop and implement bird monitoring programs on be-half of state and federal agencies and non-governmental organizations. For decades, monitoring biologists have operated without the benefit of clear guidelines that de-scribe the many phases of effective monitoring. Adopt-ing current and consistent standards could help biologists and their colleagues in natural resource management and conservation work together to realize the full potential of bird monitoring.
How to use this bookThis handbook presents ten steps that optimize the value of bird monitoring when designing new programs, modi-fying existing ones, or applying results to the practice of bird conservation. These steps echo themes contained in an extensive bird monitoring literature and summarized in Opportunities for Improving Avian Monitoring (US NABCI 2007) and A Framework for Coordinated Bird Monitoring in the Northeast (NECBM Partnership 2007). The themes include: coordination and collaboration, peer-reviewed and standardized protocols, statistical rigor in survey de-sign and data analysis, and use of modern data manage-ment tools. Following the steps outlined in this handbook will make it possible for biologists and decision makers to implement State Wildlife Action Plans, Endangered Species Recovery Plans, Strategic Habitat Conservation
CASE STUDYMonitoring efforts in several
northeastern states documented a rapid decline of breeding Peregrine
Falcons beginning around 1950. Observed trends amplified evidence of failed nests and vacant eyries first reported by egg collectors and falconers. Within 15 years, the species was extirpated from the region (Hickey 1969). Alarm over the raptor’s disappearance plus clues from nest observations and monitoring data spurred research into the effects of DDT on eggshell formation. These studies revealed that peregrines with high DDT loads laid eggs that could not support the weight of incubating adults (Risebrough and
Peakall 1988), a discovery that led to the 1972 ban on the use of DDT in the United States. Monitoring results also formed the basis for the falcon’s designation as a federally endangered species, one of the nation’s first to be listed under the Endangered Species Act. When Peregrine Falcon reintroduction to the Northeast began in 1974, monitoring was an integral part of the recovery strategy (Barclay 1988). Peregrine Falcon monitoring soon became one of the region’s most successful conservation tools as biologists, managers, landowners, and citizen scientists joined to carry out many of the activities described in this handbook.
Pere
grin
e Fa
lcon
: Pet
er L
aTou
rret
te
Initiatives (National Ecological Assessment Team 2006), and other programs to conserve northeastern birds and their habitats.
This handbook is not an exhaustive treatment of all aspects of bird monitoring, but is rather a quick-reference guide that can be applied to birds of any habitat. Each step is illustrated with an example from coordinated efforts to monitor Peregrine Falcon populations in the Northeast. We chose this well-known monitoring program to facili-tate the clear presentation of basic concepts. However, the same ten steps also would apply to multi-species monitor-ing initiatives, which can be more cost-effective than sin-gle-species programs. Monitoring multiple species should be considered when goals are broad, involve measuring the effectiveness of conservation practices, or attempt to identify relationships among species.
The appropriate sequence of steps and emphasis on any individual step will depend on varying circumstances. If one or more steps are beyond the financial or technical capacity of the monitoring organizations, then expanded partnerships, phased implementation, and/or conservative use of results may be in order. Improving the efficiency and effectiveness of monitoring may eventually alleviate funding constraints and permit a more comprehensive approach.

– 6 –
Bird monitoring is hard work, requiring meticulous attention to detail during survey design and planning. While collecting data, field observers must often navigate inhospitable areas and maintain intense concentration under difficult conditions. Data entry, analysis, and reporting demand time and money, resources that are frequently in short supply. A clear purpose helps ensure that all the effort and expense produce real conservation benefits. The establishment of a clear purpose requires a lead organization to define the problem, identify stakeholders, and consult them to determine what monitoring products could help solve the problem. Input from stakeholders can then be used to draft a conservation goal and corresponding monitoring objectives, which should be refined as the program develops.
Define the problem – Problem statements identify the populations of concern within clear boundaries of space and time, as well as the management issues or threats that are believed to limit them. A problem statement also might describe policy, regulatory, or management decisions that could benefit the target species. Background information can be gleaned from the primary literature, state breeding bird atlases, Birds of North America species accounts (Poole and Gill 2003), and from a variety of online data portals managed by the North American Breeding Bird Survey, the Bird Point Count Database, the Avian Knowledge Network (AKN), and AKN’s northeastern node—the Northeast Avian Data Center (NADC; http://akn.nebirdmonitor.org). In addition, expert opinion has been synthesized in State Wildlife Action Plans and regional bird conservation plans. If these sources lack basic information on species’ distributions, abundances, trends, habitats, or potential limiting factors, then insufficient knowledge is itself a problem that hinders successful conservation. In such cases, the need for effective monitoring is especially urgent.
Identify and consult stakeholders – Defining the problem will help identify stakeholders who need to be engaged in assessing its scope, setting a conservation goal, and eventually pursuing that goal with tools built from monitoring data. Biologists who design and implement monitoring programs are rarely in the position to dictate management or conservation strategy. Terms are more often set by policy makers, regulatory agencies, managers on the ground, and land protection specialists, based on information provided by biologists. Ask the following
step 1: establish a clear purpose
questions of these stakeholders: What tools do you need to make decisions in support of the conservation goal (written guidelines, graphs, a map, GIS files, computer simulations, data visualizations, etc.)? When and where could the tools be applied? What level of confidence is required to justify their use? What is the probability that new tools will be used? Answers to these questions will help clarify monitoring objectives and ensure appropriate allocation of effort. Most importantly, these answers will provide a foundation for better management and conservation decisions.
Set a conservation goal – Conservation goals can be expressed in terms of desired measures of distribution, abundance or density, vital rates (e.g., productivity and survival), diversity (including measures of species richness and evenness), integrity (the similarity of a community to “natural” conditions), or trends in any of these parameters. Useful goal statements explicitly address geographic scope and timing. They may also align with goals contained in state, regional, and/or continental conservation plans. Goal statements can include criteria for triggering a management or conservation response, such as a change in legal status (refer to Peregrine Falcon example on next page).
It may not be possible to establish a conservation goal when baseline information is lacking. In this case, a monitoring objective related to assessing status could be sufficient to focus a program until increased understanding provides the basis for a conservation goal and enhanced monitoring objectives. Some monitoring initiatives may need to evolve with a growing knowledge base, while making the best possible use of previously collected data. Flexibility in the original design can reduce tradeoffs associated with this type of adaptive monitoring.
American Black Duck: Ken Rosenberg

– 7 –
The No r t heas t B i r d Mon i t o r i ng Handbook
East
ern
Mea
dow
lark
: Gre
g La
vaty
Develop monitoring objectives that are linked to the conservation goal – Monitoring programs typically aim to assess the population status of one or more species, quantify population trends, identify the effects of environmental changes on populations, or determine the effectiveness of efforts to stabilize or increase populations. It is sometimes possible to achieve all four types of objectives simultaneously.
Status assessment involves measuring the current condition of populations to inform a pressing management or conservation decision and/or establish a baseline for quantifying future change. Related objectives may be to inventory species, describe species-habitat relationships, identify critical habitat, or compare present population size to a desired level. Knowledge of status helps inform conservation goal-setting.
Trend monitoring calls for surveys to be repeated at the same locations in order to estimate rates of change in status measures (e.g., occurrence, distribution, abundance, vital rates, and/or health). Trend estimates, like status measures, often shape bird conservation goals.
Effects monitoring uses covariates to link changes in bird populations to changes in the environment. This approach can help explain why populations rise or fall. Monitoring effects also can aid in projecting impacts of development, climate change, and other potential threats.
Effectiveness monitoring, also known as evaluation, consists of monitoring populations before and after conservation decisions are implemented. This is a critical
Document your work – Thorough docu-mentation is essential during all steps of the monitor-ing process. A record of when and why decisions are made ensures forward momentum in both planning and implementation. A documentation standard devel-oped by Oakley et al. (2003) offers a useful format for recording a project’s background and goals, as well as its protocols and standard operating procedures.
CASE STUDYWhen restoring Peregrine Falcons
to the eastern states, the U.S. Fish and Wildlife Service aimed to establish
a minimum of 20-25 nesting pairs in each of five recovery units and sustain them for a minimum of three years. Another goal was to achieve an overall minimum of 175-200 successfully nesting pairs in the region. The species was removed from the Federal
List of Endangered and Threatened Wildlife in 1999, after three of the five eastern recovery units had exceeded their goals by wide margins, and after the entire eastern region had reached its population and productivity targets (USFWS 1999). This change in legal status permitted resources to be redirected toward other vulnerable species.
Pere
grin
e Fa
lcon
: Pet
er L
aTou
rret
te
component of adaptive management, an iterative process that relies on monitoring results to formulate and refine conservation decisions (Walters and Holling 1990).
As with conservation goal-setting, it is important to make monitoring objectives specific and quantifiable. They may start out broad, but should be sharpened after a partnership is formalized and pilot data are available to help establish reasonable standards (see Step 6).

– 8 –
step 2: Determine whether an existing program or protocol meets your needs
Wood Thrush: Greg Lavaty
CASE STUDYIn 1965, over fifty of the world’s leading
Peregrine Falcon experts gathered in Wisconsin to share information about the
species’ status and to discuss possible contributors to its decline. Participants in this meeting shared information on monitoring techniques and forged professional relationships that would shape the course
of subsequent recovery and monitoring efforts (Hickey 1969). This conference and a second one held twenty years later (Cade et al. 1988) produced three basic elements of efficient and effective bird monitoring: an inventory of existing monitoring programs, an assessment of available information, and lasting and productive partnerships.
Pere
grin
e Fa
lcon
: Pet
er L
aTou
rret
te
The Northeast is home to hundreds of monitoring programs of varying scope and quality, including some that might meet your information needs. Carefully consider available options before starting a new program or adopting an existing one.
Consult the Register of Northeast Bird Monitoring Programs – This register catalogs various attributes of over 450 monitoring initiatives, including sponsoring in-stitutions, principal investigators, web links, geographic scope, survey methods and frequency, and information on target species. The Register is posted online at the Northeast Avian Data Center, a node of the Avian Knowl-edge Network that archives monitoring databases and provides metadata describing their content, origins, and structure. The Natural Resources Monitoring Partnership (http://nrmp.nbii.gov), administered by the U.S. Geolog-ical Survey, is another repository of project metadata and data collection protocols.
Build on monitoring assets that are fundamentally sound – Exercise caution in selecting an existing program or protocol because deficiencies in design and implementation are widespread. To assess the suitability of available survey options, use the online monitoring evaluation tool developed by Southeast Partners In Flight (http://www.sepif.org). This interactive tool describes appropriate uses of survey data based on user responses to a comprehensive set of questions. It also provides a list of potential biases and scores for regional coordination, management relevance, and data security.
Start a new program only if it addresses a defined conservation need and meets basic standards – If an existing program is fundamentally sound and aligns with your conservation and monitoring goals, use it and consider adding to its value through design enhancements or replication. However, if existing efforts are inadequate, a new program may be necessary. Keep in mind that initiatives involving multiple partners, working in pursuit of regionally shared conservation goals, are most likely to attract funding and maintain support over time. Monitoring techniques that quantify and adjust for biases and errors further enhance a program’s viability (see Step 6).

– 9 –
The traditionally fragmented approach to bird monitoring in the Northeast has resulted in duplicate efforts to monitor some species, even as others receive little attention. To compound the problem, monitoring strategies have suffered from a lack of communication among program managers and others interested in monitoring methods and results. A movement toward coordination provides the opportunity to avoid redundancy, increase the number of adequately monitored species, and strengthen the scientific basis for bird conservation.
Form or participate in a monitoring partnership – Monitoring programs benefit from active collaboration among government agencies, universities, other non-governmental organizations, and private industry. Such partnerships combine technical expertise in management planning, ecology and behavior of the target species, field methods, geographic information systems, and data management. While large partnerships risk conflict and stagnation, a well coordinated partnership can strengthen
step 3: assemble a team of collaborators with complementary interests and skills
From an administrative standpoint, it makes sense for individual agencies and institutions to focus monitor-ing on certain properties or political units, even though their boundaries are often meaningless to birds. How-ever, integrating site- or state-based monitoring into a regional strategy offers several distinct advantages over monitoring independently. Region-ally coordinated monitoring:
produces consistent information for areas that share common ecological characteristics and management concerns;
adds meaning to local results by placing them within a regional context;
increases sample sizes and corresponding power to detect trends;
increases geographic scope and ability to recognize spatial patterns;
draws on a larger pool of technical expertise, which can yield more useful results; and
reduces overall expense through economies of scale.
Unique information needs often can be accommodated by intensifying ef-fort within certain land units or by customizing protocols within a com-mon monitoring framework.
the case for regionally coorDinateD monitoring
Prot
hono
tary
War
bler
: Gre
g La
vaty
monitoring by aligning equipment, staff, historical data, financial resources, analytical tools, and management influence behind a common conservation purpose. Certain circumstances may call for the assembly of a formal partnership prior to Step 1. However, in most cases efficiencies are gained when a lead organization lays the groundwork with stakeholder input and then assembles a team to develop and execute the monitoring plan.
Cerulean Warbler: Greg Lavaty
The No r t heas t B i r d Mon i t o r i ng Handbook
– 10 –
Engage people with the necessary quantitative expertise– It is important to involve partners with advanced quantitative skills in the development of sampling protocols and analytical methods. Biostatisticians, population biologists, and spatial ecologists can help partnerships avoid common monitoring pitfalls and add credibility to survey results. In the Northeast, statistical expertise is concentrated at universities, in cooperative research units, at field locations of the U.S. Forest Service Northern Research Station, and at the Patuxent Wildlife Research Center. If members of these institutions are unable to participate in the partnership, enroll in a course to build your skills and seek input on specific monitoring questions. Be clear about budgetary and logistical constraints to avoid problems that could arise from impractical sampling schemes, cumbersome field methods, or analytical procedures that exceed the technical or financial resources of the monitoring organizations.
Multi-partner cooperation has been integral to successful Peregrine
Falcon monitoring and conservation in the Northeast. Eleven state agencies, several non-governmental organizations, and scores of cliff-watching volunteers have conducted the program in
recent years, with regional coordination provided by the Ecological Services Division of the U.S. Fish and Wildlife Service. These institutions and individuals have combined their skills and resources to address the program’s needs for funding, protocol development, and data collection.
CASE STUDY
Pere
grin
e Fa
lcon
: Pet
er L
aTou
rret
te
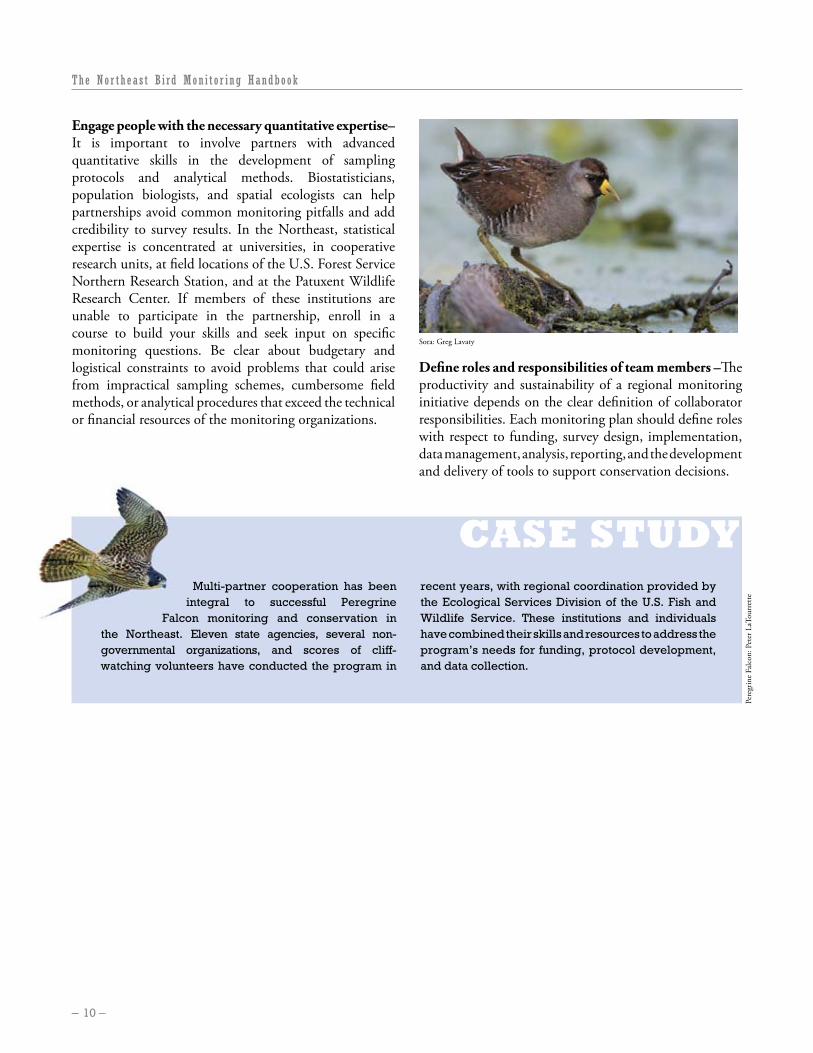
Sora: Greg Lavaty
Define roles and responsibilities of team members –The productivity and sustainability of a regional monitoring initiative depends on the clear definition of collaborator responsibilities. Each monitoring plan should define roles with respect to funding, survey design, implementation, data management, analysis, reporting, and the development and delivery of tools to support conservation decisions.
– 11 –
Most bird monitoring programs implicitly consider the life history of target populations in the development of field protocols. However, few explicitly describe the known or hypothesized relationships among life history traits, populations, habitat characteristics, and real or potential stressors. Detailing these relationships during the design of a monitoring strategy can help identify what response variables and covariates to measure.
Summarize life history information for the species or species group of interest – For each focal bird species or species group, develop a concise narrative of diagnostic characteristics and behaviors, distribution patterns, habitat associations, reproductive strategies and behaviors, activity patterns, intra- and inter-specific relationships, and known and suspected stressors (Vesely et al. 2006). This written account should elaborate on the basic information summarized in the problem statement (Step 1), providing enough detail to support the creation of a conceptual model. Any assumptions and gaps in knowledge should be explicitly stated (Manley et al. 2000).
Build a conceptual model – A conceptual model is “a hypothesis regarding the expected response of a species or species group to changes in environmental conditions and/or management” (Vesely et al. 2006). This type of model uses written descriptions and/or diagrams to depict cause-and-effect relationships among ecosystem elements, natural processes, and anthropogenic stressors. Conceptual models may be created through hand drawings or flowchart tools available in most office software packages, or by using systems modeling (e.g., Stella) and workflow software (e.g., Kepler).
Monitoring programs that build and test alternative models are better equipped to distinguish the importance of individual conservation activities. In such cases, it can be useful to assign measures of confidence to each alternative. For example, three models could be weighted 0.5, 0.25, and 0.25, respectively, if the first model seemed twice as likely as the other two to reflect real dynamics. These “model-specific probabilities” can be adjusted as monitoring results come to support one hypothesis over another (Nichols and Williams 2006) and can then be
step 4: summarize the relationship of target populations to other ecosystem elements, processes, and stressors
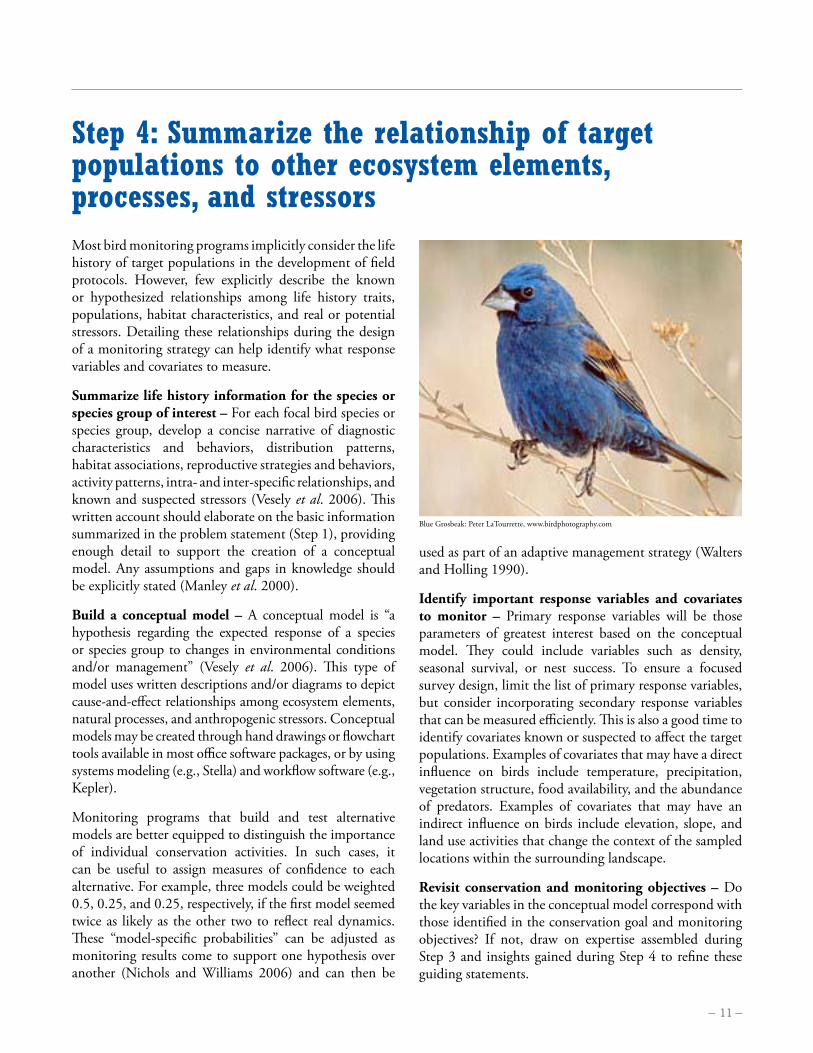
Blue Grosbeak: Peter LaTourrette, www.birdphotography.com
used as part of an adaptive management strategy (Walters and Holling 1990).
Identify important response variables and covariates to monitor – Primary response variables will be those parameters of greatest interest based on the conceptual model. They could include variables such as density, seasonal survival, or nest success. To ensure a focused survey design, limit the list of primary response variables, but consider incorporating secondary response variables that can be measured efficiently. This is also a good time to identify covariates known or suspected to affect the target populations. Examples of covariates that may have a direct influence on birds include temperature, precipitation, vegetation structure, food availability, and the abundance of predators. Examples of covariates that may have an indirect influence on birds include elevation, slope, and land use activities that change the context of the sampled locations within the surrounding landscape.
Revisit conservation and monitoring objectives – Do the key variables in the conceptual model correspond with those identified in the conservation goal and monitoring objectives? If not, draw on expertise assembled during Step 3 and insights gained during Step 4 to refine these guiding statements.

The No r t heas t B i r d Mon i t o r i ng Handbook
– 12 –
CASE STUDY
Pere
grin
e Fa
lcon
: Pet
er L
aTou
rret
te
The diagram above illustrates the basic system underlying Peregrine
Falcon population recovery in the Northeast. Repeated surveys of the system’s state variables permitted the testing of various influences on population rates. A ban on DDT, hand-rearing and release of captive-bred chicks at historic eyries (hacking), and education and management to protect sensitive sites were found to have a positive effect on breeding population size. While other influences not
included in the conceptual model likely had an effect on the net change in Peregrine Falcon numbers, a simple graphical description of the major system components can offer insight into the system’s mechanics and focus partner activities on those factors likely to have the greatest influence on population recovery. Suggestions for constructing conceptual models to guide the monitoring of multiple species are also available (e.g., Barrows et al. 2005).
CASE STUDY
State variables quantify mutually exclusive portions of the population. Rates describe the changes in the population, including the transformation of one portion of the population to another. Influences are tested by monitoring state variables before and after treatments or by comparing independent populations subject to differing treatments.
Conceptual model of Peregrine Falcon population dynamics and hypothesized influences on those dynamics

– 13 –
Sound conservation strategies often depend on monitoring data, and benefit most from data collected through robust survey designs. Inattention to statistical issues can significantly undermine the scope and credibility of inferences drawn from bird surveys. Strong statistical design begins during Step 1, when target populations and monitoring objectives are defined. The following measures also will help ensure scientific rigor in the monitoring process.
Identify appropriate analytical procedures – A variety of analysis methods can be used to estimate variables such as productivity, density, and occupancy (the proportion of an area occupied or the probability that an area is occupied by the species of interest). Likewise, numerous methods exist to model habitat and estimate trends. Thomas (1996), Nur et al. (1999), and Vesely et al. (2006) provide overviews of many standard analytical procedures, while selected references and useful links can be found online at http://www.nebirdmonitor.org. Consulting with a statistician or biometrician when selecting the appropriate analytical methods is always recommended.
Clapper Rail: Ralph Wright
step 5: Develop a statistically robust approach to sampling and data analysis
Delineate the sample frame – Define the area from which sample units will be selected. This area may be contiguous or comprised of separate units. The sample frame may be stratified into areas having different properties to test for systematic variation in the occurrence or abundance of the target population(s). It is often good practice to limit
Ellen Robertson monitoring marsh birds: Jonathan Mays

The No r t heas t B i r d Mon i t o r i ng Handbook
– 14 –
CASE STUDY
Pere
grin
e Fa
lcon
: Pet
er L
aTou
rret
te
The low number and conspicuousness of Peregrine Falcon nesting cliffs
allowed for a nearly complete survey of the species’ abundance and nesting success each year between 1974 and 1999 (USFWS 1999). This rare opportunity greatly simplified data analysis. In 2003, the American Peregrine Falcon Monitoring Team adopted a less intensive approach that called for monitoring 96 randomly selected nest sites in each of six U.S. regions, including a combined midwestern/
northeastern region. The monitoring plan stipulates field surveys at three-year intervals from 2003 to 2015. The sample size was chosen to achieve 80% power to detect a 12.5% decline in nest success over this period, a level of change considered potentially threatening to the population’s long-term stability (USFWS 2003). Measures of variation in nest success, obtained over previous decades of monitoring, were essential for determining the number of samples required for this analysis.
the stratification of a sample frame to a small number of properties because replication is a key requirement for inferring relationships. More strata therefore require larger sample sizes at greater cost in time and resources.
Determine an appropriate method for selecting sample units – Standard approaches include simple or stratified random sampling, systematic sampling, and cluster sampling. A generalized random tessellation stratified design (GRTS) offers a compromise between systematic and stratified random sampling, incorporating randomization while avoiding chance gaps in coverage (Stevens and Olsen 2004). This spatially balanced design allows geographic variation in sampling intensity and permits sites to be added or removed over time. However, advanced technical skills are required to carry out a GRTS sample. The most appropriate sampling method will depend on overall objectives, logistical considerations, and characteristics of the target population and sample frame. Reviews (Nur et al. 1999, Vesely et al. 2006) and references (Cochran 1977, Hayek and Buzas 1997, Thompson 1992) should be consulted prior to choosing a sampling strategy. Here again, a statistically proficient team member who understands the realities of field biology is invaluable to the planning process.
Henslow’s Sparrow: George Jett

– 15 –
Bird monitoring is subject to multiple sources of error and bias. Unless these are controlled, results may not accurately inform management and conservation decisions. Classification errors arise when observers misidentify birds or use mistaken field codes when rushed to record observations during a fast-paced count. Measurement errors can stem from double-counting an individual bird, assuming two or more birds are the same individual, failing to detect a bird that is quiet or otherwise undetectable, or missing an observable bird due to inattention or failure to hear. Characteristics of a site, such as a dense understory or a noisy stream, may introduce sampling bias, in which some members of the population (e.g., highly visible and loud birds) are more likely to be detected than others. Bias also may arise from survey conditions that affect bird activity and/or one’s ability to detect the activity, such as time of year, time of day, or weather. Fortunately, a variety of practical approaches can limit the impact of error and bias on survey findings.
Screen and train observers – Error rates can be reduced by screening volunteers and field technicians for required identification skill and hearing ability. Also, all observers should receive adequate training in data collection procedures to reduce the frequency of errors, especially those that occur while gaining familiarity with protocols early in the field season.
The science of bird monitoring is rapidly evolving, producing new techniques to quantify and ad-just for variable detection rates. Options include repeated simple counts (Kery et al. 2005), time-of-removal methods (Farnsworth et al. 2002), time-of-detection meth-ods (Alldredge et al. 2007), dis-tance sampling (Rosenstock et al. 2002), double-observer (Nichols et al. 2000), double-sampling (Col-lins 2007), and hybrid approaches
(e.g., Farnsworth et al. 2005). Re-peated presence-absence surveys can be used to estimate occupancy or abundance with methods that include measures of detectability (Royle and Nichols 2003, McK-enzie et al. 2006). Because the op-tions are varied and complex, it may be necessary to consult a spe-cialist in survey methodology who can help assess the advantages and disadvantages of each.
an evolving fielD
Step 6: Design and pilot standardized field protocols that minimize error and bias
Researchers with Peregrine Falcon: FWS
Simplify survey methods – Errors increase with the number of species being monitored and the number of tasks performed during a count. Simplify protocols to focus attention on priority species and tasks.
Stratify to minimize site effects – Variation in habitat structure and other physical site conditions can be controlled through stratification. Stratification based on site characteristics may not be appropriate during the design phase for long-term monitoring if those characteristics are expected to change over time, unless the sites are part of an experimental manipulation or subject to other predictable influences. However, the collection of relevant covariates, as identified through the development
Monitors at the Avalon Sea Watch: Doug Forsell
The No r t heas t B i r d Mon i t o r i ng Handbook
– 16 –
CASE STUDY
Pere
grin
e Fa
lcon
: Pet
er L
aTou
rret
teThe U.S. Fish and Wildlife Service published a post-delisting monitoring
plan in 2003, with input and critical review from state fish and wildlife agencies,
non-governmental organizations, and academic institutions (USFWS 2003). The document contains
detailed information on a coordinated sampling scheme, field protocols, and procedures for data analysis and reporting. Such blueprints for monitoring add strength and credibility to coordinated monitoring efforts.
Test protocol and solicit feedback from observers– Spend time collecting pilot data from a limited but representative set of sites. Develop a process for observers to provide feedback on training materials, protocols, and data forms. When possible, adjust the protocol or associated materials to address any concerns that arise.
Use pilot data to establish quantifiable objectives and determine sample size – Analysis of pilot data can aid in assigning measurable standards to each monitoring objective so that they can be expressed in terms of power, the likelihood of a test reaching the correct conclusion, and precision, the degree to which multiple samples show similar results. Whenever possible, quantifiable objectives should refer to the geographic scope and timeframe established by the conservation goal (Bart et al. 2004b). Options for describing precision include: standard deviation (a measure of distance from the mean in a frequency distribution), coefficient of variation (the ratio of a standard deviation to the mean), and confidence interval (a range of values with a specified probability of containing the true value). Determining sample size requirements to meet quantifiable objectives calls for the selection of a significance level (the likelihood of drawing a false conclusion), for which the risk-averse convention is 0.10 (Askins et al. 1990, Bart et al. 2004b).
The sample size needed to achieve a desirable level of power or precision will depend on such factors as data analysis methods, the magnitude of the effect to be detected (the effect size), variability of the data, the size of the area to be monitored, and the number of years over which parameters are to be measured. Guidance on determining sample size requirements is contained in the Patuxent Wildlife Research Center’s Manager’s Monitoring Manual, as well as in other references such as those cited by Thomas and Krebs (1997) and Nur et al. (1999).
of a conceptual model, may be useful for the stratification of data during the analysis phase to adjust for site-specific error rates or bias.
Use standardized methods to control or model survey effects – Survey effects may occur when survey conditions vary among observations. To minimize survey effects, time counts to correspond with periods of observable activity and limit conditions under which surveys can be performed. Gather covariate data to mathematically model survey effects. Covariates that may warrant consideration in data analysis include date, time of day, temperature, wind speed, interfering noise, and observer experience.
Account for variation in detection rates, if called for by monitoring objectives – Several survey methods account for various dimensions of detectability (the probability that a given bird is detected) and thus permit estimates of density and/or abundance (Thompson 2002, McCallum 2005). Uncorrected, raw counts (a.k.a. indices) provide a simple alternative that may satisfy certain monitoring objectives, particularly if detection rates are known to be constant across time and space (Bart et al. 2004a, Johnson 2007). This knowledge could be gained from a pilot or other previous study conducted under similar conditions. However, the sensitivity of simple counts to errors and biases generally limits the usefulness of index methods.
Obtain peer review of protocols – Feedback from independent reviewers can help strengthen a proposed monitoring strategy and eliminate future barriers to publishing or applying results. The group of reviewers should be large enough to represent a range of skills and interests. Often the best reviews come from those with differing views and diverse experiences.

– 17 –
Users specify the area and time frame of interest, as well as the datasets to be represented in the chart.
An example of frequency of occurrence histograms available from NADC
Monitoring data are often detailed and complex, involving records from multiple observers over many sampling occasions. Protocols change over time, which adds to the challenge of managing data. Therefore, a data management system must effectively describe and efficiently store the data so they may be used now and in the future. When developing a data management system, plan for the long term, and design your data architecture to be compatible with the Northeast Avian Data Center. The NADC provides guidelines on sound data management strategies and serves as a node for archiving, integrating, and disseminating bird data via the Avian Knowledge Network.
Develop project metadata – Describing the “who, what, where, when, and how” of a particular set of data is key to responsible data management, and is particularly important to guide third-party interpretation of monitoring program data. Creation of project metadata should be initiated while the project is underway and finalized immediately after its completion. Use of the AKN’s metadata standard will ensure that your metadata conform to current guidelines set by the National Biodiversity Information Infrastructure and the Federal Geographic Data Committee. Metadata that are shared with the AKN also are shared with groups such as the Natural Resources Monitoring Partnership.
step 7: Identify or develop a data management system
Design and curate the database – Refer to the NADC guidelines for database design (http://akn.nebirdmonitor.org). Develop straightforward data entry pages and quality control methods to prevent data entry errors (see Step 8). Monitoring data should always be backed up with at least one copy of the data stored in a fireproof and waterproof container at a separate facility.
Archive and/or exchange your data with the North-east Avian Data Center – The NADC enriches the utility of monitoring data by promoting interop-erability among datasets, disseminating data, con-tributing to larger biodiversity initiatives, bolstering locality information with remotely-sensed variables, providing data exploration tools, and providing a secure data archive that ensures longevity. Monitoring data as well as any codes or conventions used in the database must be archived. These dataset-specific meta-data are essential to allow others to interpret your data. The NADC project manager is available to assist with mapping data to a common organizational structure (or schema), which facilitates updating and aggregation of data. Data uploads are best conducted immediately fol-lowing each field season once the quality control process has been completed. However, the services of NADC may be available even if quality control has not been
American Pippit: Greg Lavaty

The No r t heas t B i r d Mon i t o r i ng Handbook
– 18 –
completed. Contact the NADC project manager through http://akn.nebirdmonitor.org to participate or learn more.
Provide access to data in accordance with legal and proprietary constraints – Monitoring data are expensive and time consuming to collect. Often, access to data must be limited to protect the locations of sensitive species, to safeguard proprietary interests, or for other reasons. Therefore, NADC has established formal accessibility guidelines for sharing data which provide several options for data owners to control access to centrally archived data: (1) not displayed; (2) shown only in certain visualizations; (3) shared with other bioinformatics efforts (e.g., Global Biodiversity Information Facility and Ornithological Information Systems); (4) available with permission of the provider; and (5) unrestricted availability for download. While participation at the first level provides secure, off-site storage, participation in levels 2 through 5 accelerates the delivery of monitoring results to those who can use them for conservation.
CASE STUDY
Pere
grin
e Fa
lcon
: Pet
er L
aTou
rret
te
Each northeastern state administers its own Peregrine Falcon dataset, with
core fields that correspond to those of the national protocol as well as ancillary fields
customized to meet each state’s particular needs or interests. This proactive approach to data management permits the pooling of data at regular intervals from multiple sources into a regional database managed by
the USFWS Ecological Services Division. The ability to integrate data at the regional level, while preserving the structure of original datasets, is essential for many regionally coordinated programs. The Northeast Avian Data Center provides automated tools and personalized service for archiving, integrating, and visualizing bird monitoring information.
Tricolored Heron: Greg Lavaty

– 19 –
After months of planning and coordination, the fun is about to begin, with field surveys leading to better conservation decisions. But preparations for the field season must begin far in advance of heading to the field.
Prepare for the field season – Allow ample time for hiring observers, obtaining landowner permissions or other permits, ordering supplies, preparing data sheets and maps, organizing transportation and other logistics, training field crews, and scheduling field activities. Providing field crews with a checklist of items needed in the field and sufficient resources (e.g., maps, optics, GPS, batteries, etc.) to complete surveys saves much time and reduces headaches. Prepare a contact list with needed phone numbers and designate a contact person who can help answer questions that invariably come up during fieldwork. Don’t forget worker safety! Ensure that every observer is equipped with a basic first aid kit, addresses and maps to the nearest medical facilities, a cell phone or radio, and procedures to be followed in case of emergency.
Perform the survey – The survey should be conducted in strict adherence to standardized methods. Even slight deviations in protocol, such as relaxing wind-speed thresholds or shifting point locations for convenience, undermine the value of hard-won data. Pioneering programs may require a pilot season to test field methods and to gather variance information needed to determine an adequate sample size (see step 6).
step 8: Implement the monitoring program
Enter and error-check the data – Data entry is the least glamorous part of conducting bird surveys, but without it, all the effort and expense will not provide the full array of quantitative information needed to make science-based decisions. Whether data are entered in the
Blair Nikula and Sharon Riley collecting data in the field: © Bryan Pfeiffer
Larry Hindman measures Canada Goose eggs as part of a project monitoring Atlantic populations of the species along the Hudson Bay coast in Nunavut, Canada.

The No r t heas t B i r d Mon i t o r i ng Handbook
– 20 –
CASE STUDYIn several northeastern states, trained and dedicated volunteers have
teamed up with state, federal, and non-governmental biologists to monitor nesting
Peregrine Falcons, as well as unoccupied cliff sites. The participation of these volunteer “cliff-watchers”
reduces personnel and travel expenses, adding to the sustainability of monitoring. With simple methods and a charismatic target, Peregrine Falcon monitoring is particularly well suited for citizen scientists from the coastal cliffs of Acadia National Park to downtown Richmond, Virginia.
Pere
grin
e Fa
lcon
: Pet
er L
aTou
rret
te
field on handheld electronic devices or in the office from hardcopy field forms, minimizing error is very important. Quality control can range from use of simple data filters to flag entries that do not fall within an acceptable range, to the more exhaustive approach of entering the data twice and comparing the two datasets to identify errors. Quality control measures that fall somewhere between these extremes are probably most cost-effective and more widely used. “Look-up tables” that provide a limited list of categorical variables and data ranges that limit the scale of continuous variables are a first line of defense against most typographical errors. Data entry forms, especially those that resemble field sheets, also ease the burden of transferring data from hard copy to digital format and provide a means for visual comparison. An additional consideration to minimize error is to have field staff enter their own data. Field personnel can quickly spot a mistake that would go unnoticed by a naive data entry technician. Field forms that provide a space for comments are useful in clarifying anomalous records and further reducing mistakes in data entry. Finally, someone familiar with the data collection protocol should screen all entered data for errors. This provides a level of quality control that is
consistent across all entered data regardless of the number of field staff or data entry technicians.
Explore and analyze the data – Limited data exploration is often helpful to refine hypotheses, confirm the most appropriate analyses, and suggest needed data transformations. However, detailed analyses without specific hypotheses in mind can lead to false conclusions and ultimately weaken conservation efforts. When in doubt, revisit your program’s goals and objectives and refer to the analytical approach described in Step 5.
Common Nighthawk: Greg Lavaty

– 21 –
If monitoring results are to be applied to conservation decisions, they must be presented in a useful format. Options include traditional scientific reports, as well as more practical conservation tools such as the Bicknell’s Thrush distribution model developed by Lambert et al. (2005) for stewards of high-elevation forests in New York and northern New England. Both approaches call on biologists to describe their survey methodology and provide supporting interpretation. Furthermore, proactive outreach efforts may be necessary to incorporate monitoring results into conservation decisions. For example, when Lambert et al. (2005) used monitoring data to develop the Bicknell’s Thrush model, they distributed copies of their GIS data to natural resource and regulatory agencies across the Northeast. All the care and planning in the world will not be put to good use if your results do not reach conservation decision makers.
Interpret results and prepare reports with your audience in mind – Interpretation of biological data is often the most important job of biologists and ecologists. Knowledge of the surrounding landscape, ecology of the species, and an understanding of the details of the monitoring protocol often provide insight into what drives observed changes. This familiarity is also helpful in defining the limits to which monitoring data should be applied. When reporting your findings, consider your audience and how members of that audience will use the information. A detailed technical report may be appropriate for a group of conservation biologists, but may be too data rich for busy policy makers or for others
step 9: Present results in a format that supports sound management and conservation decisions
Bicknell’s Thrush: George Jett
without scientific backgrounds.When preparing a report for a scientific audience, follow a standardized format such as that recommended by the Council of Science Editors (CSE 2006). It is especially important to include a copy of the data collection protocols when writing for a technical audience. This practice maintains transparency and can encourage collaboration and strengthen partnerships. When preparing a report for a wider audience, be sure to provide a concise executive summary, focus on major findings, and keep documents short and free of jargon.
Provide tools that inform management and conservation decisions – Useful tools can include management guidelines, paper maps, GIS data layers, or computer programs that simulate effects of management alternatives. Often, the simplest of graphics can have the greatest effect in guiding science-based planning and decision-making (e.g., Murphy and Noon 1992). However, even the simplest of graphics may need some explanation to avoid misinterpretation.
Scarlet Tanager: Greg Lavaty

The No r t heas t B i r d Mon i t o r i ng Handbook
– 22 –
When packaged for the appropriate audience, monitoring results can be used to guide conservation in a variety of arenas.
Policy – The State of New Jersey imposed a moratorium on horseshoe crab harvesting in Delaware Bay based on monitoring results that revealed a rapid decline in Red Knots, which depend on horseshoe crab eggs to fuel their long-distance migration. Monitoring of Red Knots has continued during the moratorium to determine whether or not it has been useful for slowing the decline.
Regulation – The Maine Department of Inland Fisheries and Wildlife used monitoring data to identify significant shorebird feeding and roosting habitats under Maine’s Natural Resource Protection Act. This “Significant Wildlife Habitat” designation regulates adjacent development activities such as vegetation alteration, setbacks for new construction, and the number, size, and placement of docks and piers.
Management – Knowledge and experience gained from Peregrine Falcon monitoring has led to the
development of several tools to support reproductive success, including signage, informational brochures, and a Guide to Management of Peregrine Falcons at the Eyrie (Cade et al. 1996). One such tool, developed by a private-public partnership in Vermont, provides conservation and safety guidelines to rock climbers in the form of an informational brochure.
Industry – Annual monitoring of Common Loons in some New England states produces lake-specific information on nest locations and breeding activity. Hydropower companies use this information to stabilize water levels for a period of time to avoid stranding (or flooding) of shoreline loon nests during the critical incubation period.
Land protection – New York City Audubon, the Trust for Public Lands, and the New York State Department of Environmental Conservation used the results of bird monitoring to guide the expansion of conserved lands within the Harbor Herons Complex. This area, which borders Staten Island, supports one of the largest breeding populations of colonial waterbirds in the Northeast.
using monitoring results to make conservation Decisions
Red
Kno
ts: R
alph
Wrig
ht

– 23 –
A monitoring program that equips decision makers with useful tools and information can be a catalyst for bird conservation. The remaining challenge is to continue providing value as knowledge grows, or as circumstances and priorities change. This calls for periodic evaluation of management and monitoring efforts, and a willingness to adapt. During this crucial step, monitoring biologists must bring their findings forward to agency administrators and habitat managers so that they can provide the support necessary to make changes in management, policy, or monitoring itself.
Evaluate the conceptual model – Go back to the conceptual model(s) and assumptions from Step 4 and evaluate their performance in the face of real-world data. Do the monitoring results confirm the model and its assumptions, or support any of the hypothesized relationships? If a management action was taken, did it achieve the expected results? If not, there are several possible explanations: the assumptions were wrong, the management action was poorly chosen or poorly executed, the conditions at the project site have changed, information from monitoring was faulty, or these problems occurred in
step 10. evaluate and adjust management and monitoring to make better bird conservation decisions
Bay-breasted Warbler: Greg Lavaty
Some state and federal agencies have recently adopted structured decision-making (SDM) to plan and implement adaptive management (Williams et al. 2007). This approach, also known as decision analysis, involves many of the same measures described in this handbook, such as engage stakeholders, define the problem, set objectives, assess alternatives, make decisions, evaluate, and adjust (Hammond et al. 1999). Because SDM offers a variety of formal assessment tools to weigh tradeoffs and is typically led by a
trained facilitator, the technique may be particularly well suited for navigating complex or contentious issues. However, SDM may not be suited to all circumstances. Some successful conservation professionals prefer more intuitive approaches to decision-making and trained facilitators are not widely available. Nonetheless, SDM warrants full consideration as a formal process for making decisions related to the monitoring and management of bird populations.
structureD Decision-making anD aDaptive management
Bobo
link:
Pen
nsyl
vani
a G
ame
Com
miss
ion
some combination (Salafsky et al. 2001). Monitoring data may reveal which of these potential factors is responsible, and thus indicate whether it is necessary to revise the conceptual model, try new management or conservation strategies, and/or modify the monitoring itself.
Adapt management, if necessary – Adaptive management is an increasingly popular method for incorporating monitoring results into the decision-making process, when

The No r t heas t B i r d Mon i t o r i ng Handbook
– 24 –
faced with inevitable uncertainty. This approach draws on survey data to design, evaluate, and adjust management actions in an iterative process to achieve stated objectives (Williams et al. 2007). Optimization methods, which assign numerical weights to advantages and disadvantages (sometimes including financial constraints), may be useful in selecting from a list of alternative management actions (e.g., Bayesian belief networks, Nyberg et al. 2006). Computer simulations also can be used to predict
future conditions under different scenarios and to fine-tune monitoring programs so that they collect data that are better suited to address key management decisions.
Adjust monitoring, if necessary – Monitoring protocols may need to be adjusted if critical information was missed. In such cases, it may be prudent to sharpen the focus on possible drivers of population change, such as environmental factors (Barrows and Allen 2007), focus on threat reduction assessment (Salafsky and Margoluis 1999), or consider whether multi-species monitoring is needed to understand and maintain ecosystems that support the bird species of interest (Barrows et al. 2005). New information may invalidate model assumptions and therefore call for changes in management action. Often, several adjustments to management and/or monitoring may be needed to achieve the overall conservation goal.
Assess the cost-effectiveness of the chosen management and monitoring strategies – It is also important to ensure that resources are allocated efficiently so that desired information is obtained without unnecessary cost. Because data are expensive to collect, results should only be as precise as necessary to achieve the monitoring and conservation objectives. Field et al. (2004) argued that
Bald Eagle: Ralph Wright
Growth of the Peregrine Population in the Contiguous United States, 1980-2002. (from “Monitoring Plan for the American Peregrine Falcon, A Species Recovered Under the Endangered Species Act’’, USFWS 2003)
Peregrine Falcon: Tom Kogut/USDA Forest Service
Peregrine Falcon: Peter LaTourrette, www.birdphotography.com

– 25 –
The No r t heas t B i r d Mon i t o r i ng Handbook
CASE STUDYDetermining that a once-endangered population is secure is one of the most
gratifying conservation decisions that can be made. In 1999, the U.S. Fish and Wildlife
Service declared the Peregrine Falcon recovered, thanks to the efforts of a nationwide collaboration
(USFWS 1999). Some northeastern states have since followed suit by downlisting or delisting the species within their jurisdictions. These decisions, which showcase success and generate additional support for conservation programs, would not have been possible without coordinated monitoring.
Pere
grin
e Fa
lcon
: Pet
er L
aTou
rret
te
strict adherence to decisions based on a significance level of 0.05 can lead to large and unnecessary expenditures. These authors advocate using feedback from monitoring together with an economic analysis to update priorities, make predictions, consider the costs of alternative management activities, and ultimately direct funding to those activities that will achieve a better return on investment. Similarly, Wilson et al. (2007) identified a framework for conservation decision-making that
evaluates the cost of actions to abate threats to habitat loss and degradation versus the cost of land acquisition. Their findings suggest that some management actions (e.g., controlling invasive species) can be more effective and far less expensive than acquiring lands outright to protect a species’ habitat. Consequently, monitoring programs that evaluate the success of a suite of management actions or that collect limited data on multiple species may result in more effective and efficient conservation.

– 26 –
Marsh bird monitoring: © Bryan Pfeiffer
Long-billed Curlew: Greg Lavaty
A half-century ago, biologists who had been monitoring Peregrine Falcons raised concern for their status in the Northeast. As the region’s population dwindled, knowledge gained from monitoring helped test hypotheses about the causes of this decline. Following the peregrine’s extirpation, monitoring data were used to identify promising reintroduction sites, evaluate hacking efforts, and formulate management guidelines for nesting areas. As the reintroduced population gained ground across its former range, coordinated monitoring validated management decisions and increased popular support for conservation programs. Ultimately, monitoring provided a vehicle for educating the public about the hazards of pesticides and the value of science-based stewardship.
Despite numerous conservation success stories, northeastern birds still face threats of increasing magnitude and complexity. Rapid development, invasive species, climate change, and a host of other issues have placed many of the Northeast’s varied habitats and associated birds at risk. However, the collective capacity to monitor and react to threats also has grown. Today, the region is home to more conservation organizations, more bird monitoring programs, and more skilled observers than ever before. In recent years, they have accumulated vast stores of data that can help establish population targets and strengthen survey designs. Similarly, methods to collect, analyze, and exchange monitoring information have advanced considerably. However, if these improved monitoring resources are not used in the most efficient
Building a legacy of coordinated bird monitoring
way, the opportunities they represent will have been squandered. Recognizing these assets and aligning them behind clear and unified goals will be critical to successful bird conservation in the Northeast. Success also depends on garnering the support of agency administrators and other decision makers. A carefully planned, cooperative approach worked for Peregrine Falcons and can work for other species at risk today. Attention to the details summarized in this handbook should help improve the effectiveness of bird monitoring programs in the region. Maintaining the Northeast’s rich natural heritage depends, in part, on building a legacy of coordinated bird monitoring that provides crucial information to conservation planning, implementation, and decision making processes.

– 27 –
literature CitedAlldredge, M. W, T. R. Simons, K. H. Pollock, and K. Pacifici. 2007. A field evaluation of the time-of-detection method to estimate population size and density for aural avian point counts. Avian Conservation and Ecology – Écologie et conservation des oiseaux 2:13. Online at http://www.ace-eco.org/vol2/iss2/art13/
Askins, R. A., J. E. Lynch, and R. Greenberg. 1990. Population declines in migratory birds in eastern North America. Current Ornithology 7:1-57.
Barclay, J. H. 1988. Peregrine restoration in the eastern United States. P. 549-558. In T. J. Cade, J. H. Enderson, C. G. Thelander, and C. M. White (Eds.), Peregrine Falcon Populations: Their Management and Recovery. The Peregrine Fund, Boise, ID. 949 pp.
Barrows, C. W. and M. F. Allen. 2007. Biological monitoring and bridging the gap between land management and science. Natural Areas Journal 27:194-197.
Barrows, C. W., M. B. Swartz, W. L. Hodges, M. F. Allen, J. T. Rotenberry, B.-L. Li, T. A. Scott, and X. Chen. 2005. A framework for monitoring multiple-species conservation plans. Journal of Wildlife Management 69:1333-1345.
Bart, J., S. Droege, P. Geissler, B. Peterjohn, and C. J. Ralph. 2004a. Density estimation in wildlife surveys. Wildlife Society Bulletin 32:1242-1247.
Bart, J., K. P. Burnham, E. H. Dunn, and C. M. Francis. 2004b. Goals and strategies for estimating trends in landbird abundance. Journal of Wildlife Management 68:611-626.
Cade, T. J., J. H. Enderson, and J. Linthicum. 1996. Guide to Management of Peregrine Falcons at the Eyrie. The Peregrine Fund, Boise, ID. 97 pp.
Cade, T. J., J. H. Enderson, C. G. Thelander, and C. M. White (Eds.). 1988. Peregrine Falcon Populations: Their Management and Recovery. The Peregrine Fund, Boise, ID. 949 pp.
Cochran, W. G. 1977. Sampling techniques. John Wiley & Sons, New York. 427 pp.
Collins, B. T. 2007. Guidelines for using double sampling in avian population monitoring. Auk 124:1273-1387.
Council of Scientific Editors (CSE). 2006. Scientific Style and Format: The CSE Manual for Authors, Editors and Publishers. 7th edition. Council of Science Editors and Rockefeller University Press, Reston, VA. 680 pp.
Farnsworth, G. L., K. H. Pollock, J. D. Nichols, T. R. Simons, J. E. Hines, and J. R. Sauer. 2002. A removal model for estimating detection probabilities from point-count surveys. Auk 119:414–425.
Farnsworth, G. L., J. D. Nichols, J. R. Sauer, S. G. Fancy, K. H. Pollock, S. A. Shriner, and T. R. Simons. 2005. Statistical approaches to the analysis of point count data: a little extra information can go a long way. USDA Forest Service General Technical Report PSW–GTR–191:735–743.
Field, S. A., A. J. Tyre, N. Jonzen, J. R. Rhodes, and H. P. Possingham. 2004. Minimizing the cost of environmental management decisions by optimizing statistical thresholds. Ecology Letters 7:669-675.
Hammond, J. S., R. L. Keeney, and H. Raiffa. 1999. Smart Choices: a Practical Guide to Making Better Life Decisions. Broadway Books, New York, 244 pp.
Hayek, L.C., and M. A. Buzas. 1997. Surveying Natural Populations. Columbia University Press, New York. 563 pp.
Hickey, J. J. (Ed.). 1969. Peregrine Falcon Populations: Their Biology and Decline. University of Wisconsin Press, Madison. 596 pp.
Johnson, D. H. 2007. In defense of indices: the case of bird surveys. Journal of Wildlife Management 72:857-868.
Kery, M., J. A. Royle, and H. Schmid. 2005. Modeling avian abundance from replicated counts using binomial mixture models. Ecological Applications 15:1450–1461.
Lambert, J. D., K. P. McFarland, C. C. Rimmer, S. D. Faccio, and J. A. Atwood. 2005. A practical model of Bicknell’s Thrush distribution in the northeastern United States. Wilson Bulletin 117: 1-11.
MacKenzie, D. I., J. D. Nichols, J. A. Royle, K. H. Pollock, L. L. Bailey, and J. E. Hines. 2006. Occupancy Estimation and Modeling: Inferring Patterns and Dynamics of Species Occurrence. Elsevier, Amsterdam. 343 pp.
Manley, P. N., W. J. Zielinski, C. M. Stuart, J. J. Keane, A. J. Lind, C. Brown, B. L. Plymale, and C. O. Napper. 2000. Monitoring ecosystems in the Sierra Nevada: the conceptual model foundation. Environmental Monitoring and Assessment 64:139-152.
McCallum, D. A. 2005. A conceptual guide to detection probability for point counts and other count-based survey methods. USDA Forest Service General Technical Report PSW–GTR–191:754-761.
Murphy, D. D., and B. R. Noon. 1992. Integrating scientific methods with habitat conservation planning: reserve design for northern spotted owls. Ecological Applications 2:3-17.
Murphy, D. D., and B. D. Noon. 2007. The role of scientists in conservation planning on private lands. Conservation Biology 21:25-28.
National Ecological Assessment Team (U.S.) 2006. Strategic habitat conservation: a report from the National Ecological Assessment Team. U.S. Geological Survey and U.S. Fish and Wildlife Service, Washington, D.C. 45 pp. Online at http://www.fws.gov/southwest/About%20Us/SHC%20NEAT_Final_Rpt.pdf
The No r t heas t B i r d Mon i t o r i ng Handbook
– 28 –
Nichols, J. D., J. E. Hines, J. R. Sauer, F. W. Fallon, F. E. Fallon, and P. J. Heglund. 2000. A double-observer approach for estimating detection probability and abundance from point counts. Auk 117:393-408.
Nichols, J. D., and B. K. Williams. 2006. Monitoring for conservation. TRENDS in Ecology and Evolution 21:668-673.
Northeast Coordinated Bird Monitoring (NECBM) Partnership. 2007. A framework for coordinated bird monitoring in the Northeast. Unpublished Northeast Coordinated Bird Monitoring Partnership Report. 62 pp.
Nur, N., S. L. Jones, and G. R. Geupel. 1999. A statistical guide to data analysis of avian monitoring programs. U.S. Fish and Wildlife Service, BTP-R6001-1999, Washington, D.C. 54 pp.
Nyberg, J.B., B.G. Marcot, and R. Sulyma. 2006. Using Bayesian belief networks in adaptive management. Canadian Journal of Forest Research 36:3104-3116.
Oakley, K. L., L. P. Thomas, and S. G. Fancy. 2003. Guidelines for long-term monitoring protocols. Wildlife Society Bulletin 31:1000-1003.
Poole, A. and F. Gill (Eds.). 2003. The Birds of North America. The Birds of North America, Inc. Philadelphia.
Risebrough, R. W., and D. B. Peakall. 1988. The relative importance of the several organochlorines in the decline of peregrine falcon populations. P. 449-462 In T. J. Cade, J. H. Enderson, C. G. Thelander, and C. M. White (Eds.), Peregrine Falcon Populations: Their Management and Recovery. The Peregrine Fund, Boise, ID. 949 pp.
Rosenstock, S. S., D. R. Anderson, K. M. Giesen, T. Leukering, and M. F. Carter. 2002. Landbird counting techniques: current practices and an alternative. Auk 119:46–53.
Royle, J. A., and J. D. Nichols. 2003. Estimating abundance from repeated presence-absence data or point counts. Ecology 84:777–790.
Salafsky, N. and R. Margoluis. 1999. Threat reduction assessment: a practical and cost-effective approach to evaluating conservation and development projects. Conservation Biology 13:830-841.
Salafsky, N., R. Margoluis, and K. Redford. 2001. Adaptive Management: A Tool for Conservation Practitioners. World Wildlife Fund Biodiversity Support Program, Washington, D. C., 100 pp.
Stevens, D. L. and A. R. Olsen. 2004. Spatially balanced sampling of natural resources. Journal of the American Statistical Association 99:262-278.
Thomas, L. 1996. Monitoring long-term population change: why are there so many analysis methods? Ecology 77:49-58.
Thomas, L., and C. J. Krebs. 1997. A review of statistical power analysis software. Bulletin of the Ecological Society of America. 78:126-139.
Thompson, S.K. 1992. Sampling. Wiley InterScience, New York. 343 pp.
Thompson, W. L. 2002. Towards reliable bird surveys: accounting for individuals present but not detected. Auk 119:18-25.
U.S. North American Bird Conservation Initiative Monitoring Subcommittee (US NABCI 2007). Opportunities for Improving Avian Monitoring. U.S. North American Bird Conservation Initiative Report. Division of Migratory Bird Management, U.S. Fish and Wildlife Service, Arlington, VA. 50 pp. Online at http://www.nabci-us.org/
U.S. Fish and Wildlife Service (USFWS). 1999. Endangered and threatened wildlife and plants; final rule to remove the American Peregrine Falcon from the Federal list of endangered and threatened wildlife, and to remove the similarity of appearance provision for free flying peregrines in the conterminous United States. U.S.Fish and Wildlife Service. Federal Register 64: 46542-46558.
U.S. Fish and Wildlife Service (USFWS). 2003. Monitoring plan for the American Peregrine Falcon, a species recovered under the Endangered Species Act. U.S. Fish and Wildlife Service, Divisions of Endangered Species and Migratory Birds and State Programs, Pacific Region, Portland, OR. 53 pp.
Vesely, D., B. C. McComb, C. D. Vojta, L. H. Suring, J. Halaj, R. S. Holthausen, B. Zuckerberg, P. M. Manley. 2006. Development of Protocols to Inventory or Monitor Wildlife, Fish, or Rare Plants. USDA Forest Service General Technical Report GTR-WO-72, Washington, D.C. 100 pp.
Walters, C. J. and C. S. Holling. 1990. Large scale management experiments and learning by doing. Ecology 71:2060-2068.
Williams, B. K., R. C. Szaro, and C. D. Shapiro. 2007. Adaptive management: the U.S. Department of Interior technical guide. Adaptive Management Working Group, U.S. Department of the Interior, Washington, D.C. 72 pp.
Wilson, K. A., E. C. Underwood, S. A. Morrison, K. R. Klausmeyer, W. W. Murdoch, B. Reyers, G. Wardell-Johnson, P. A. Marquet, P. W. Rundel, M. F. McBride, R. L. Pressey, M. Bode, J. M. Hoekstra, S. Andelman, M. Looker, C. Rondinini, P. Kareiva, M. R. Shaw, and H. P. Possingham. 2007. Conserving biodiversity efficiently: what to do, where, and when. PLoS Biology 5:1850-1861.

– 29 –
step 1: establish a clear purpose Define the problem Identify and consult stakeholders Set a conservation goal Develop monitoring objectives that are linked to the conservation goal
step 2: Determine whether an existing program or protocol meets your needs Consult the Register of Northeast Bird Monitoring Programs Build on monitoring assets that are fundamentally sound Start a new program only if it addresses a defined conservation need and meets basic standards
step 3: assemble a team of collaborators with complementary interests and skills Form or participate in a monitoring partnership Engage people with the necessary quantitative expertise Define roles and responsibilities of team members
step 4: summarize the relationship of target populations to other ecosystem elements, processes, and stressors Summarize life history information for the species or species group of interest Build a conceptual model Identify important responses to monitor Revisit conservation and monitoring objectives
step 5: Develop a statistically robust approach to sampling and data analysis Identify appropriate analytical procedures Delineate the sample frame Determine method for selecting sample units
Atlantic Puffin: ClipArt.com
appendix 1. Ten steps at a glance
step 6: Design and pilot standardized field protocols that minimize error and bias Screen and train observers Simplify survey methods Stratify to minimize site effects Use standardized methods to control survey effects Account for variation in detection rates, if called for by monitoring objectives Obtain peer review of protocols Test protocol and solicit feedback from observers Use pilot data to establish quantifiable objectives and determine sample size
step 7: identify or develop a data management system Develop project metadata Design and curate the database Archive and/or exchange your data with the Northeast Avian Data Center Provide access to data in accordance with legal and proprietary constraints
step 8: implement the monitoring program Prepare for the field season Perform the survey Enter and error-check the data Explore and analyze the data
step 9: present results in a format that supports sound management and conservation decisions Interpret results/prepare reports with audience in mind Provide tools that inform management/conservation decisions
step 10: evaluate and adjust management and monitoring to make better bird conservation decisions Evaluate the conceptual model Adapt management, if necessary Adjust monitoring, if necessary Assess the cost-effectiveness of the chosen management and monitoring strategies
American Oystercatcher: Ralph Wright

The No r t heas t B i r d Mon i t o r i ng Handbook
– 30 –
The design and printing of this handbook were funded by members of the Northeast Association of Fish and Wildlife Agencies to support implementation of a priority action of the State Wildlife Action Plans. We thank Wildlife Management Institute for administering the grant. The Association of Fish and Wildlife Agencies and the U.S. Fish and Wildlife Service Migratory Bird Division provided additional support for publication costs. We thank the following individuals for providing helpful comments on an earlier draft of this handbook: John Alexander, Klamath Bird Observatory; Debbie Hahn, Association of Fish and Wildlife Agencies; David Hanni, Rocky Mountain Bird Observatory; Sergio Harding, Virginia Department of Game and Inland Fisheries; Melinda Knutson, U.S. Fish and Wildlife Service; Casey Lott, American Bird Conservancy; Rua Mordecai, Southeast Partners In Flight; and Iain Stenhouse, National Audubon Society. Many others
assisted in the development and evaluation of ideas contained in this handbook by participating in regionally coordinated working groups led by: Susan Gallo, Maine Audubon; Julie Hart, Vermont Center for Ecostudies; Pam Hunt, Audubon Society of New Hampshire; Ernesto Ruelas Inzunza, Hawk Migration Association of North America; Shannon Kearney-McGee, Connecticut Department of Environmental Protection; David King, U.S. Forest Service; David Mizrahi, New Jersey Audubon Society; Mike Morgan, Audubon New York; Stephanie Schmidt, Manomet Center for Conservation Sciences; Gregory Shriver, University of Delaware; and Melanie Steinkamp, U.S. Fish and Wildlife Service. Finally, we gratefully acknowledge Jon Bart and the Western Working Group of Partners In Flight, whose efforts to improve the usefulness of bird monitoring have spurred significant advances in the field.
aCkNoWleDgMeNTs
Ellen Robertson monitoring shorebirds: Jonathan Mays

– 31 –
The No r t heas t B i r d Mon i t o r i ng Handbook
NoTes:___________________________________________________________________________________
___________________________________________________________________________________
___________________________________________________________________________________
___________________________________________________________________________________
___________________________________________________________________________________
___________________________________________________________________________________
___________________________________________________________________________________
___________________________________________________________________________________
___________________________________________________________________________________
___________________________________________________________________________________
___________________________________________________________________________________
___________________________________________________________________________________
___________________________________________________________________________________
___________________________________________________________________________________
___________________________________________________________________________________
___________________________________________________________________________________
___________________________________________________________________________________
___________________________________________________________________________________
___________________________________________________________________________________
___________________________________________________________________________________
___________________________________________________________________________________
___________________________________________________________________________________
___________________________________________________________________________________
___________________________________________________________________________________
___________________________________________________________________________________
___________________________________________________________________________________
