the newfoundland capital corporation registered … are required to contribute 5.0% of your earnings...
TRANSCRIPT

The Newfoundland Capital Corporation RegisteredPension Plan

About this Enrolment GuideThis Guide provides information you will need to enroll in your company's Registered Pension Plan.
This process will take a bit of your time, but it will be time well invested. A colour-coded, step-by-stepprocess will help you navigate through this Guide. Each step includes a ‘To Do’ box showing what you must complete to enroll. The boxes separate what you must do from what you should keep in mind.
2

Here's what you need to do...
Step one: Learn about your program
Step two: Decide how to enroll
Step three: Decide how to invest
Step four: Decide how much to contribute
Step five: Check to see you've completed each step
Let's Get Started...
3
one
Learn about your program
Learn about the advantages of your program.
Review the details of your program.
Advantages of the Newfoundland Capital Corporation Registered Pension PlanTo help ensure you are prepared for life after work, your Plan Sponsor (employer) has taken the first step toward
helping you save for your retirement by offering you a Registered Pension Plan. Now, it’s up to you to take the next
step and join your program.
Your Registered Pension Plan provides many benefits that may not be available to you through an individual savings or
investment account, such as:
• A convenient way to save – Making regular contributions directly from your pay – before money ever reaches your
bank account – makes it easier to commit to saving consistently. Even if the amount you contribute each time is
small – and is an amount you’re not likely to miss – it can grow very nicely over the long term.
• Immediate tax reduction – Regular payroll contributions to Registered Retirement Savings Plans and/or Registered
Pension Plans are taken from your gross pay before payroll taxes are calculated. This immediately reduces the amount
of your income that’s taxed. You’ll only pay income tax on the remaining portion of your salary, so you’ll enjoy tax
savings on each and every pay cheque throughout the year.
• Tax-deferred growth – Growth you realize in Registered Retirement Savings Plans, Deferred Profit Sharing Plans or
Registered Pension Plans occurs in a tax-sheltered environment until you withdraw funds from the plan.
• Lower investment management fees – Take advantage of the competitive investment management fees (IMFs)
offered by your group plan. Lower IMFs leave more of your savings in your account and growing for you.
• Leading fund managers – Through your group plan, you have access to some of the world’s leading fund
managers and their funds. Many of these funds aren’t available to individual investors.
4
To Do!

one
• Secure website and telephone account access – Manage your account and investments using the service option
you prefer. Access your account via the secure member website and/or the Customer Service Centre.
• Easy-to-read statements – Manulife’s member statements provide updates on your savings and include tips and
reminders to help you build an effective retirement savings plan.
• Consolidate your savings – You can transfer accounts you hold at other institutions to your group program,
allowing you to enjoy the above benefits for all of your retirement savings.
Keep reading to learn about the details of your company’s program and find out how to join.
Details of your programThe Newfoundland Capital Corporation Group Retirement Program includes these plan(s):
• Registered Pension Plan (RPP)
The details of your program – shown below – are subject to change by your Plan Sponsor (employer).
Registered Pension Plan
Policy number 500349
Who is eligible to join this plan? All full-time and part-time employees.
Do I have to join? Yes.
When can I join? You are eligible to join the plan after completing 12 months of continuous service. Membership is compulsory after have 3 years of service and have worked more than 19 hours per week.
How much do I contribute? You are required to contribute 5.0% of your earnings each year.You can make voluntary contributions up to the Canada Revenue Agency (CRA) maximum limit.
How much does my Plan Sponsor (employer) contribute?
Your plan sponsor/employer matches contributions you are required to make each year.
Who decides how my contributions will be invested?
You do.
Can I transfer money into the plan? Yes, you may transfer amounts from another registered plan.
5

one
Registered Pension Plan
Can I take money out of the plan while I am employed?
You can withdraw voluntary contributions you make.
Can I make additional one-time contributions?
No.
What happens if I leave the company?
The full value of your account belongs to you.
What happens if I retire from the company?
The full value of your account belongs to you.
What happens if I die? Your beneficiary or beneficiaries will be entitled to the portion of your account that you have specified.
6

two
Decide how to enroll
Decide how you want to enroll – either online or with a paper form.
Follow the instructions for your preferred enrolment option.
To enroll online
Go to www.manulife.ca/GRO/enroll and enter the information shown below for each plan you are joining. Follow the
instructions as they appear on the screen.
The online enrolment process will guide you through most of the remaining steps in this Enrolment Guide. Remember – you
will need to return to Step four on page 10 of this Guide once you have finished enrolling online.
You can choose to join this plan:
Registered Pension Plan Policy number: 500349 Access code: H2007
7
To Do!
Tips for enrolling online:
• Review the Fund Selection Guide included in this package to learn about the
investments available through your program and their investment management fees
(IMFs).
• Print your Beneficiary confirmation when you finish enrolling. Sign the completed
form(s), then return them to Manulife in the envelope provided.
• Print your Enrolment confirmation when you finish enrolling so you have a copy for
your records. You will need the Customer number shown on your confirmation to
identify yourself to the Customer Service Centre and to access online services.
• Choose your Personal Identification Number (PIN) to access the secure website at
the end of the enrolment process. Remember to keep this number in a safe place.
8

two
To enroll using paper forms
Detach the Application form(s) for the plan(s) below. All forms you need to complete are located at the back of this Guide.
You can choose to join this plan:
Application form for the Registered Pension Plan Page 23
Complete the following sections on each Application form:
• Tell us about your plan
• Your personal information
• Name your beneficiary (or beneficiaries)
Once you have completed these sections on each Application form, go to the next step in your Enrolment Guide.
8

three
Decide how to invest
Open the Fund Selection Guide you received in this enrolment package.
Follow the instructions to determine your investor style and select your investments.
Note - If you consult a Financial Planner for advice regarding funds for this Registered Pension Plan, provide him or
her with this Guide. If you do not generally seek the advice of a financial planner before making investment
decisions, please continue reading.
Remember: After you’re finished with the Fund Selection Guide, you’ll need to return to Step four on page 10 in
this Guide.
If you do not provide instructions on where to invest contributions to your plan, contributions will be deposited to the
plan default investment - Target Retirement Date Fund. You are strongly encouraged to take an active role in how your
retirement savings are invested and ensure you are invested in fund(s) that suit you. Your plan’s default investment is
intended as a temporary destination for your contributions and may not be appropriate for your long-term retirement
planning.
9
To Do!

four
Decide how much to contribute
Detach and complete the Payroll Deduction Authorization form found at the
back of this Guide on page 29.
TIP – Refer to the Details of your program table beginning on page 5 to see how
much you can contribute.
10
To Do!
A small amount can make a real difference
Even small contributions can grow significantly over time. For example, a contribution of $600 a year – just $50 a month – will grow to more than $25,000 after 20 years.
This projection assumes the contributions remain in your account until you retire and grow at a rate of 8% per year.

five
Check to see you've completed each step
Refer to the checklist below.
Return the completed forms in the envelopes included in your enrolment
package. See the list below for details of which form should be returned in which
envelope.
Your enrolment package includes the following form(s):
• An Application form for the Registered Pension Plan (policy 500349) - return to Newcap Radio in the enclosed
envelope.
• A Payroll Deduction Authorization form - return to Newcap Radio in the enclosed envelope.
• A Transfer Authorization for Registered Investments form if you decide to transfer other savings to your
group program – send to the financial institution you wish to transfer from. (You will find this form at the back of
this Guide on page 31.)
11
To Do!
Make sure you've fully completed each Application form. Have you:
Completed the Your personal information section?
Named your beneficiary (or beneficiaries)?
Provided instructions on how to invest contributions to your plan?
Signed and dated each form?

You've successfully enrolled
How can I track the progress of my account?
• Member statements – You’ll receive regular easy-to-understand member statements updating you about your
account activity and growth.
• Internet – You can access your account online 24 hours a day, 7 days a week at www.manulife.ca/GRO.
• Phone – You can contact Customer Service at 1-888-727-7766 to speak with a Manulife Customer Service
Representative, Monday to Friday from 8 a.m. to 8 p.m. ET.
12
What’s next?
If you enrolled online…
You received your Customer number and chose your PIN at the end of the enrolment process. You can use this
information to access your account online anytime. Instructions for accessing your account online appear below.
If you enrolled using paper forms…
You’ll receive a letter from Manulife welcoming you to your group program. This letter will provide your
Customer number and explain how you can get your Personal Identification Number (PIN). With your Customer
number and PIN, you can access the online tools Manulife offers to help you track and manage your savings.

Transfer your other savings to your group program
Decide if you want to transfer your other registered savings to Manulife.
Complete a Transfer Authorization for Registered Investments form (located
at the back of this Guide on page 31) for each account you wish to transfer to
Manulife.
Send to the financial institution you wish to transfer from. This will initiate the
transfer of your savings to Manulife Financial. Once Manulife has received the
funds, you’ll receive a confirmation from the previous institution.
Enjoy the benefits of your group plan for all your retirement savings.
It can be difficult to track your progress towards your retirement income goal when your savings are divided between
several financial institutions.
By consolidating your retirement savings with Manulife, you will benefit from:
• Competitive fees – The lower fees generally associated with a group program mean more of your savings stay
in your account and keep growing.
• A single point of access – Enjoy the convenience of receiving one statement, going to one website, and calling
one phone number to manage all your retirement savings.
13
To Do!

What are my responsibilities as a plan member?
Review and understand your responsibilities.
Any tax-deferred group savings plan that lets you choose between two or more investment options is known as a
Capital Accumulation Plan (CAP).
As a CAP plan member, you have these responsibilities:
• Deciding how much to contribute.
• Making use of the tools and information available to you through your program.
• Selecting your investments.
• Reviewing your investments regularly to ensure they continue to meet your retirement savings
and investment goals.
You should also consider obtaining investment advice from an appropriately qualified independent advisor.
Manulife’s Customer Service Representatives and Financial Education Specialists are available to help you understand the
many planning tools and services you can use.
Call 1-888-727-7766 to speak with a representative, Monday to Friday from 8 a.m. to 8 p.m. ET.
14
To Do!

Take an extra step – Learn more about planning for your retirementYou have taken the most important step – enrolling in your plan. Now think about how to get on track – and stay on
track – to achieve your retirement income goal.
In this section, you’ll find these articles to help you get started:
• Creating and maintaining a retirement plan
• Other sources of retirement income
• The cost of early retirement
• Retirement planning for every step of your life
• Pay yourself first
• Starting early pays more
15

Creating and maintaining a retirement plan
It’s hard to imagine retiring when you’re rushing to work, paying your mortgage and organizing day care. However,
taking the time to create a retirement plan now can:
• help you determine how much income you’d like to have at retirement.
• assist you in creating a plan and keep you focused on achieving your retirement income goal.
• let you track your progress to ensure your plan is meeting your expectations.
Creating a retirement plan shouldn’t be a one-time activity. Like an annual check-up with your doctor, you should review
your plan once a year. A retirement check-up gives you a chance to re-evaluate your retirement plan and keep track of
your progress towards achieving your goal.
Manulife’s Steps Retirement Program® (Steps) helps you to gain a clearer view of your retirement outlook. Steps walks
you through a quick, simple process that helps you set your annual retirement income goal. With your goal set, you can
check your progress online at any time – or see how you’re doing on the statement mailed to your home – to be sure
you’re on track to reach your goal. If you’re not on track, you’ll see suggestions to help you close any gap.
To learn more about the Steps Retirement Program® – and put Steps to work for you – go to
www.manulife.ca/GRO and log in to the secure member website. You’ll need to wait until you have your Customer
number and Personal Identification Number (PIN).
16

Other sources of retirement income
Canadians generally rely on three distinct sources of income during retirement.
1. Government benefits, such as Canada Pension Plan (CPP), Quebec Pension Plan (QPP) and Old Age Security
(OAS) income.
2. Personal savings, such as savings accounts and individual retirement accounts.
3. Income from this company-sponsored Group Retirement Program.
Government benefits provide some portion of income, but you’ll likely need income from all three sources to maintain the
lifestyle you enjoyed during your working years.
Joining this plan and making regular contributions will help you start building toward the retirement you hope to enjoy.
17

The cost of early retirement
Considering early retirement?
Most people are, but they need to properly plan for it.
Let’s meet Eric. Eric is 25 years old, and earns $38,000 per year. He’s been thinking about when he’d
like to retire – at age 55, 60, or 65. He’s also wondering how much he’ll need to save each month in order to do that.
Let’s learn a bit more about Eric...
• He saves 10% of his income ($316.66 monthly), and will save that much from now on.
• He assumes his investments – on average – will earn an 8% rate of return annually.
• He wants his retirement savings to last until he reaches age 90.
• He assumes he will need 70% of his current annual income – $26,600 – during retirement.
How much will Eric need to save?
If Eric retires at age 55 60 65
He will need to save this mucheach month $453.84 $298.91 $195.34
Is he saving enough?
Right now, Eric is saving enough to be able to retire at age 60. However, if he’d like to retire earlier, we can
see how much more he’ll need to save – starting now – to do that.
18

Retirement planning for every step of your life
Putting a retirement plan in place makes sense for everyone – no matter what step of your life you’re at. The depth and
detail of that retirement plan is obviously not going to be the same for a 25-year-old as it would be for a 55-year-old.
Here’s an overview of what a retirement plan can do for you depending on your “Steps”* in life.
The “first-step” years – if you’re in your 20s, you may just be getting out of school, and establishing yourself in the
workforce. Retirement is the last thing you’re thinking of right now, especially if you have student loans. Your
retirement plan can be as simple as taking two small steps that can really pay off:
1. Start saving – the sooner you start to save for retirement, the easier it is. Even if it’s a small amount, you’ve got
the power of time on your side.
2. Keep saving – by making saving part of your monthly financial plans, you’ll stick with saving even when other
expenses come your way. It will become second nature to save, and you won’t even give it a second thought.
The “step to it” years – without a doubt, your 30s are the toughest years to keep step with a retirement plan. This
time of your life can be financially challenging. You have many expenses – mortgage, day care, and car payments. It
seems like your money goes out just as fast as it comes in. In your mind, retirement still seems far away. However, the
most important thing you can do is “step to it” and keep up with the saving habit you established in your 20s. If at this
point, you haven’t started saving for retirement, it’s definitely time to take the first step.
The “step it up” years – in your 40s and 50s, your salary increases based on the skills, knowledge and experience you
gain through your working years. At the same time, you’ll likely make significant progress with your mortgage. These
are the years to “step it up”, take advantage of your increasing income and aggressively save for retirement.
Now is also the time to put a more accurate retirement plan in place. Consider writing down your retirement plan(s);
create a budget and complete an annual review to stay on track.
The “just a step away” years – in your 50s and 60s, retirement is close. At this step of your life, you can make
definite after-work arrangements, pick a date for leaving work and complete a final review to make sure your savings
are in place to make your retirement happen.
*These life steps will not represent everyone, but can give a general overview of how someone’s retirement plans might evolve over
time.
19
Pay yourself first
Regular payroll deductions are a great way to force yourself to save because you:
• won’t miss what you don’t have and
• reduce the income tax you pay right away (for Registered Retirement Savings Plans and Registered Pension
Plans).
Automatic payroll deductions are easy to make. It’s like using pre-authorized debit for your mortgage and insurance
payments. You don’t have to think about it as it happens automatically.
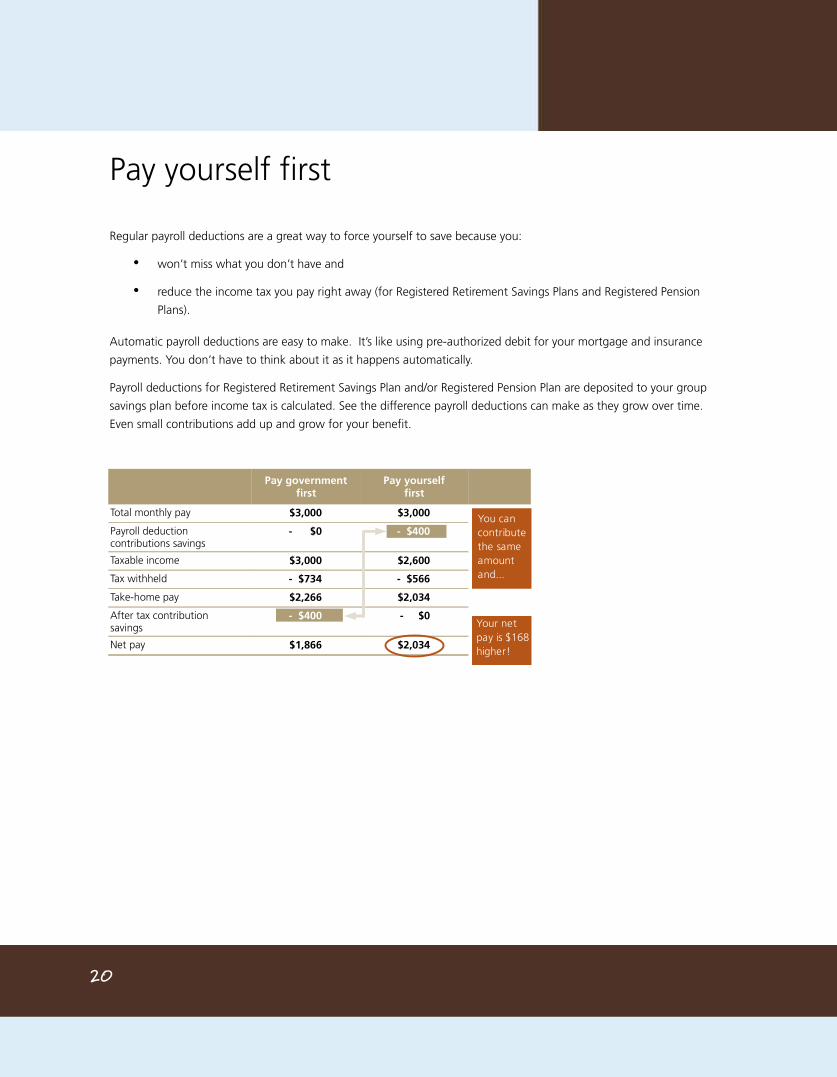
Payroll deductions for Registered Retirement Savings Plan and/or Registered Pension Plan are deposited to your group
savings plan before income tax is calculated. See the difference payroll deductions can make as they grow over time.
Even small contributions add up and grow for your benefit.
Pay governmentfirst
Pay yourselffirst
Total monthly pay $3,000 $3,000
Payroll deduction contributions savings
- $0 - $400
Taxable income $3,000 $2,600
Tax withheld - $734 - $566
Take-home pay $2,266 $2,034
After tax contributionsavings
- $400 - $0
Net pay $1,866 $2,034
20
You can contribute the same amount and...
Your net pay is $168 higher!

Starting early pays more
The sooner you start to save the better. By starting now, you won’t have to put as much money away to achieve the
same amount as someone who starts ten years after you.
Take a look at the difference – Terry starts to save at age 25 contributing $1,000 every year for 10 years. While Chris
starts saving at age 35; contributing $1000 for 30 years. Chris still can’t catch up to Terry – it really pays to start early!
Terry Chris
Starts contributing at age 25 35
Annual contribution $1,000 $1,000
Number of years contributing 10 30
Total contributions $10,000 $30,000
Total accumulated valueat age 65 $157,435 $122,346
Assumptions: Contributions made at the beginning of each year, compounded annually, at an 8% rate of return.
21

Forms
Here is a list of forms found in your Enrolment Guide:
• An Application form for the Registered Pension Plan
• A Payroll Deduction Authorization form
• A Transfer Authorization for Registered Investments form
22

If you aren't sure how to complete any of these boxes, the Plan Sponsor/Employer can help you.
Tell us about your planPlan Sponsor/EmployerNewfoundland Capital Corporation
Manulife policy number500349
Member Number Date you started with your employer (mmm/dd/yyyy) Date you are joining the plan (mmm/dd/yyyy)
Division Province of Employment
Your personal informationGender First Name Middle Initial Last Name
Mailing address (number, street and apartment number)
City Province Country Postal Code
Date of birth (mmm/dd/yyyy) Social Insurance Number (SIN) Marital Status
Spouse's name Spouse's date of birth (mmm/dd/yyyy)
Your preferred language Telephone number Ext. Email address
23
Application Form
Sign up for your Registered Pension Plan (RPP)
Send your completed form to: Newcap Radio Attention: Payroll Department 745 Windmill Road, Dartmouth, Nova Scotia, Canada, B3B 1C2
Please print clearly in the blank boxes.

A revocable beneficiary can be changed at anytime.
An irrevocable beneficiary can only be changed with written consent from that beneficiary. You will also need your beneficiary’s consent to withdraw or transfer money from your account. A parent or guardian cannot provide consent on behalf of a minor who has been named as irrevocable beneficiary.
If you want to name more than three beneficiaries, attach a separate page with the names and the percentage of proceeds for each beneficiary.
If you have locked-in money in your RPP and you have a spouse on the date of your death, the law may require any death benefit be paid to your spouse, regardless of other beneficiaries you've named.
If you die while your beneficiary is still a minor, the trustee you name on this form will act on the child’s behalf.
Name your beneficiary (or beneficiaries)
If you do not name a beneficiary and you do not have a spouse at the date of your death, proceeds will be paid to your estate. Check here if you have attached a separate page listing your beneficiaries. Please sign and date.
Name Relationship Percentage of proceeds
The above beneficiary designations are considered revocable unless you write “irrevocable” in the chart above.
For Quebec only: The designation of a spouse as beneficiary is deemed to be irrevocable unless specified here: Revocable
Trustee for a minor beneficiary named above (not applicable in Quebec)Any payment to a beneficiary who is a minor will be paid in trust to the trustee named below.
In Quebec, the proceeds will be paid in trust to the minor child's tutor.
Trustee name Relationship
If you do not complete this section, or the total does not add up to 100%, your contributions will be invested in the appropriate Target Retirement Date Fund based on when you reach your plan’s normal retirement age.
You can go online at anytime to change the funds you have chosen.
The minimum amount you can invest in a fund is 5%.
Percentages must be whole numbers.
Note: the investment performance of a market-based fund is not guaranteed.
Your investment instructions
Follow the instructions on page 3 of your Fund Selection Guide to see what type of investor you are. Then fill in one of the sections below according to your type.
Complete if Retirement Date Fund is your investment strategy
1. Follow the instructions starting on page 4 of your Fund Selection Guide to choose your Retirement Date Fund.2. Write in the 4-digit fund code for your Retirement Date Fund below.
Fund Code Fund name
Target Retirement Date FundPercentage of your contribution
100%
Complete if Asset Allocation Fund is your investment strategy
1. Follow the instructions starting on page 6 of your Fund Selection Guide to determine your investor style and choose your Asset Allocation Fund.
2. Write in the 4-digit fund code for your Asset Allocation Fund below.
Fund Code Fund name
Manulife Asset Allocation FundPercentage of your contribution
100%
Complete if Build your own portfolio is your investment strategy
1. Follow the instructions starting on page 6 of your Fund Selection Guide to determine your investor style and choose your funds.
2. Specify the percentage of contributions you want to invest in each fund. Your percentages must add to 100%.
Fund Code % Fund Code % Fund Code % Fund Code %
1000 1001 1003 1005
3132 4131 4191 5011
7011 7131 7132 7313
7381 8131 8451 8631
8011 8321 8181
Total selected must add up to 100% 100%
24
Please sign here
You confirm that you have read, understood and agreed to the information in this form, including the Enrolment and Registration Authorization section below, and the Personal Information Statement. You also confirm that information in this form is correct to the best of your knowledge.
Enrolment and Registration Authorization
You request that Manulife enroll you as a Member in this plan. If applicable, you authorize the Plan Sponsor/Employer to deduct your contributions to the plan from your earnings.
Your signature Date signed (mmm/dd/yyyy)
Plan administrator's signature Date signed (mmm/dd/yyyy)
For Manulife use Manulife customer number Date (mmm/dd/yyyy) Document version
306-1.5
25

26

The personal information statement
Your consent to use your personal informationBy signing this Application form, you give your consent for us to obtain, verify, and share your personal information, as set out below, in administering your account, now and in the future, with the plan sponsor, the plan administrator, the plan advisor and its employees and other parties in the performance of their duties for us.
You authorize us to use your Social Insurance Number (SIN) if applicable, to uniquely identify you during the administration of your account.
How we will maintain and use your personal information You agree that we may use the personal information that we collect to:
• comply with legal and regulatory requirements, • confirm your identity and the accuracy of the information you’ve provided, • conduct searches to locate you and update your member information, • administer this plan while you actively work for your employer, and after you no longer work with your employer, • administer any other products and service that we provide to you, and • determine your eligibility for, and provide you with details of, other select financial products or services that may be of interest to you that are
offered by us, our affiliates or other select financial product providers.
Who may access your personal information The following individuals may have access to your personal information:
• our employees and representatives who require this information to do their jobs, • the plan advisor, including its employees, appointed by your Plan Sponsor to provide ongoing benefit counselling or plan administrative services,• people to whom you have granted access, • people who are legally authorized to view your personal information, and • service providers who require this information to do their jobs.
This may include data processing, programming, printing, mailing, distribution, research and marketing or administration and investigation services.
Asking us not to use your personal information You may withdraw your consent for us to use your SIN for non-tax administration purposes. You may also withdraw your consent for us to use your personal information to provide you with other product or service offerings, except those that are mailed with your statements.
If you wish to withdraw your consent for us to collect, use, retain or share your personal information, you may contact us by phoning our customer service centre at 1-888-727-7766 or by writing to the Privacy Officer at the address below.
How long we can keep your personal information You authorize us to keep your personal information for the longer of:
• the time period required by law and by guidelines set for the financial services industry, and • the time period required to administer the products and services we provide.
The information we collect with your consent will be protected and maintained in your Manulife plan member file.
The personal information that we must have You may not withdraw your consent for us to collect, use, retain or share personal information that we need to issue or administer your account unlessfederal or provincial laws give you this right. If you do so, we may no longer be able to properly administer your account and this is what could happen:
• benefits will not be payable as provided under the plan, • we may treat your withdrawal of consent as a request to terminate your contract, and • your rights, and the rights of your beneficiary or estate under the plan may be limited.
Recording your customer service calls to us We may record your customer service calls to us for the following reasons:
• quality service controls,• information verification, and • training.
If you do not wish to have your calls recorded, you must communicate with us in writing to Group Retirement Solutions, 25 Water Street South, Kitchener, ON N2G 4Y5, and request that any response by us also be in writing.
Questions, updates and requests for additional informationIf you have a request, a concern, or wish to receive more information about our privacy policies, or if you wish to review your personal information in our files or correct any inaccuracies, you may contact us by sending a written request to: Privacy Officer, Group Retirement Solutions, 25 Water Street South, Kitchener ON N2G 4Y5.
27

28

Your Payroll Deduction Authorization Form
For: Newfoundland Capital Corporation Send your completed form to:Newcap RadioAttention: Payroll Department745 Windmill Road, Dartmouth, Nova Scotia, Canada, B3B 1C2
Please print clearly in the blank boxes.
Your personal information
First name Middle Initial Last name
Date of birth (mmm/dd/yyyy) Member number
Payroll authorization You authorize Newfoundland Capital Corporation to deduct the specified amounts from your pay each pay period and submit these contributions to Manulife to invest in your RPP.
For your RPP (Policy number 500349)
Contribution type: Voluntary Contributions
Enter a percentage to 8.0%: ________%
I understand that I am required to contribute 5% of my earnings to the Pension Plan. Please deduct the additional amount above and direct it as voluntary contributions to the Pension Plan Policy 500349. I understand that this voluntary amount will not be matched by the Plan Sponsor.
Please sign here
Your signature Date signed (mmm/dd/yyyy)
29

30

Transfer Authorization for Registered Investments(RSP, TFSA, LIRA, LRSP, RIF, LRIF, LIF)
Complete this form for:
Note:
• RSP to RSP transfers (excluding transfers due to death or marriage breakdown) • TFSA to TFSA transfers (excluding transfers due to death or marriage breakdown) • RSP to RIF and RIF to RIF transfers • Complete sections 1 through 4 and forward to the relinquishing institution. • If required, retain a photocopy for your files. • The completion of this transfer will NOT result in reporting of income or issuance of an
official tax receipt.
General Information
Account/Policyholder last name First name Middle initial
Address City Province Postal Code
Social Insurance Number (SIN) Home telephone number Business telephone number
Transfer:(check one box only)
*Please refer to the statement in bold in theClient authorization section below.
Client direction to relinquishing institution
Relinquishing institution name
Address City Province Postal Code
Client account/policy numberOR
Group plan number Member number
All in cash* Partial* – as listed below or on attached list
All
Investment Amount Symbol and/or certificate number or policy number Delay delivery until (mmm/dd/yyyy)
Dollars
Investment Description
All
Investment Amount Symbol and/or certificate number or policy number Delay delivery until (mmm/dd/yyyy)
Dollars
Investment Description
All
Investment Amount Symbol and/or certificate number or policy number Delay delivery until (mmm/dd/yyyy)
Dollars
Investment Description
31

Receiving institution information
Receiving Institution
TO: Attn: GRS Client Services, KC-6, P.O. Box 396 Stn Waterloo, Waterloo, ON N2J 4A9, CANADACustomer number Policy number Member number
Fund name Fund code Percentage
Client authorization
I hereby request the transfer of my account and its investments as described above.* I have requested a transfer in cash, I authorize the liquidation of all or part of my investments and agree to
pay any applicable fees, charges or adjustments.
Irrevocable Beneficiary: I consent to the transfer of the account.
Signature of account holder Date (mmm/dd/yyyy) Signature of irrevocable befeficiary (if applicable) Date (mmm/dd/yyyy)
For use by relinquishing institution onlyRegistered type: RSP TFSA LIRA LRSP RIF LRIF LIF
Spousal plan? No Yes – if “Yes”, Contributors:
Last name First name Initial Social Insurance Number (SIN)
Locked-in: No Yes – Locked-in
confirmation attached
Locked-in funds Governing Legislation
Contact name Telephone number Fax number
Authorized signature Date (mmm/dd/yyyy)
32


You need your Customer number (found on page 1 of your statement) and Personal Identification Number (PIN) to access your account online. Call the number on the front of this card if you need a PIN.
You can reach Customer Service Representatives and Financial Education Specialists using this number.
My Customer number is:_________________

Questions?
Contact Manulife
( Call 1-888-727-7766 • Customer Service Representatives are available Monday to Friday from 8 a.m. to 8 p.m. ET
• Financial Education Specialists can be reached Monday to Friday from 9 a.m. to 5 p.m. ET
@ Send an email to [email protected]
8 Visit www.manulife.ca/GRO
Use our TTY service at 1-866-391-7788.
Contact Manulife
( Call 1-888-727-7766
@ Send an email to [email protected]
8 Visit www.manulife.ca/GRO
Use our TTY service at 1-866-391-7788.Manulife Financial (The Manufacturers Life Insurance Company) offers retirement products and services for Canadian groups through its Group Retirement Solutions (GRS) business unit.
Manulife, Manulife Financial, Manulife Financial For Your Future logo and the block design are service marks and trademarks of The Manufacturers Life Insurance Company and are used by it and its affiliates under license.

Use this Guide, along with your Enrolment Guide, to understand the investments available through the Newfoundland Capital Corporation Registered Pension Plan.

About this Fund Selection GuideThis Guide explains the funds available to you through your company's Registered Pension Plan and helps you make investment choices suited to your needs.
Once you’ve selected your investments, please return to the Enrolment Guide to complete your enrolment.
If you have questions about your investments…
• You can contact a Manulife Financial Education Specialist by calling 1-888-727-7766 from Monday to Friday between 9 a.m. and 5 p.m. ET.
Refer to the back cover of your Enrolment Guide for a card you can detach and keep in your wallet.
2

Determine what type of investor you are
Answer the questions below to determine whether you should build your own portfolio or select a single, ready-made fund.
1. How interested are you in selecting investment funds for your retirement savings?
A B C
I am not interested.
I have some interest.
I am very interested.
2. How likely are you to monitor and rebalance your investments on an annual basis?
I don't want to review my investments.
I review my investments annually.
I check my investments on a regular basis (at least quarterly).
3. How would you rate your investment knowledge?
I have little to no knowledge about investing.
I understandthe basics of investing.
I am confident in my investment knowledge.
If you chose two or more responses from...
The best investment strategy for you is...Turnto
page...
Column A ...to select a Retirement Date Fund.
A Retirement Date Fund offers a well-balanced investment portfolioinside a single fund. Each fund is identified by its year of maturity, andas the maturity date approaches the fund gradually rebalances tobecome more conservative
4
Column B ...to select an Asset Allocation Fund.
Asset Allocation Funds offer a well-balanced portfolio inside a singlefund, and a professional fund manager monitors and rebalances theseportfolios for you. There is an Asset Allocation Fund that is suitable foryou – whether you’re a conservative investor or an aggressive one.
6
Column C ...to build your own portfolio.
Choose from the individual funds available through your program to build your own portfolio.
6
3
To Do!

How to choose a Retirement Date Fund
Confirm the age at which you plan to retirement: ___________Calculate the year you plan to retire: _____________
Use the table below to select the Retirement Date Fund that is best suited to you.
For example: If you are 40 years old and plan to retire at age 65, you plan to retire in 25 years. Therefore, you will plan to retire in 2040. The fund best suited to you is the ML Retirement Date 2040.
Specify the 4-digit fund code for the Retirement Date Fund you select in the Your investment instructions section on each Application form.
If you plan to retire duringthe period... The Retirement Date fund for you is... Fund code
Before 2021 ML Retirement Date 2020 2020
2021 - 2025 ML Retirement Date 2025 2025
2026 - 2030 ML Retirement Date 2030 2030
2031 - 2035 ML Retirement Date 2035 2035
2036 - 2040 ML Retirement Date 2040 2040
2041 - 2045 ML Retirement Date 2045 2045
2046 - 2050 ML Retirement Date 2050 2050
2051 or later ML Retirement Date 2055 2055
To see the investment management fees and historical rates of returns for these funds, turn to page 15.
If you are already retired, or are close to retirement, there is an income fund (2000 - ML Retirement Income) that you may be interested in.
Please refer to the back of this Guide to obtain a detailed description of each Retirement Date Fund.
You have now finished the fund selection process. Please return to
4
To Do!

Step four on page 10 of the Enrolment Guide to complete your
enrolment.
5

Determine your investor style
Circle one answer for each question.
Write your score – indicated in brackets at the end of each answer – in the box to the right of each question.
Tally the scores you record for each question to get your total.
Your age, the numbers of years remaining until you retire, and how you feel about risk will determine your investor style. Once you know your investor style, you can choose funds for your retirement savings.
Your score
1. What is your investment horizon – when will you need this money?
a. Within 3 years (0)
b. 3-5 years (3)
c. 6-10 years (5)
d. 11-15 years (8)
e. 15 + years (10)
2. What is your most important investment goal?
a. To preserve your money (0)
b. To see modest growth in your account (4)
c. To see more significant growth in your account (7)
d. To earn the highest return possible (10)
3. Please indicate which statement reflects your overall view of managing risk:
a. I don’t like risk and I am not prepared to expose my investments to any market fluctuations in order to earn higher long-term returns. (0)
b. I am prepared to experience modest short-term market fluctuations in order to generate growth of capital. (2)
c. I am prepared to experience average short-term market fluctuations in order to achieve a higher long-term return. (4)
d. I want to maximize my long-term returns and am comfortable with significant short-term market fluctuations. (6)
6
To Do!

4. If you owned an investment that declined by 20% over a short period, what would you do?
a. Sell all of the remaining investment (0)
b. Sell a portion of the remaining investment (2)
c. Hold the investment and sell nothing (4)
d. Buy more of the investment (6)
5. If you could increase your chances of improving your investment returns by taking more risk, would you:
a. Be unlikely to take more risk (0)
b. Be willing to take a little more risk with some of your portfolio (2)
c. Be willing to take a lot more risk with some of your portfolio (4)
d. Be willing to take a lot more risk with your entire portfolio (6)
6. The following picture shows threemodel portfolios and the highest andlowest returns each is likely to earn inany given year. Which portfolio would you be most likely to hold?
a. Portfolio A (0)
b. Portfolio B (3)
c. Portfolio C (6)
7. After several years of following your retirement plan, you review your progress anddetermine you are behind schedule and will need to modify your strategy in order toretire at your preferred age. What would you do?
a. Keep the same investments you currently hold, but increase your contributions as much as possible. (0)
b. Slightly increase your exposure to riskier investments and slightly increase your contributions.(3)
c. Move your entire portfolio to riskier investments, hoping to achieve the highest long-term return. (6)
7

8. Which statement best applies to your approach regarding achieving your retirementincome goals on time?
a. I must achieve my financial goal by my target retirement date. (0)
b. I would like to come close to achieving my financial goal by my target retirement date. (2)
c. If I have not reached my financial goal by my target retirement date, I have the flexibility to delay my target retirement date. (4)
d. I re-evaluate my financial goals and target retirement date regularly and have the flexibility to adjust them to align with the performance of my investments. (6)
Your total score:
Match your score to an investor style below.
If your score is between...
Your investor style is... About your investor style
0 – 7 Conservative Protecting your money is your chief concern. You may be approaching retirement, or simply prefer to take a cautious approach to investing and preserve your money.
8 – 22 Moderate You want your money to grow, but are more concerned about protecting it. Retirement may be in your near future or you may prefer to be cautious with your investments and preserve your money.
23 – 37 Balanced You want a balance between growth and security although you will accept some risk to have the potential for higher returns over time.
38 – 48 Growth You want to increase your money and are somewhat comfortable riding the ups and downs of the market in exchange for the possibility of higher returns over the long term. You may have time on your side until you retire.
49 – 56 Aggressive You want to maximize the long-term growth of your retirement savings. You understand the ups and downs of the markets and are comfortable taking more risk to maximize potential returns. You have plenty of time to wait out market cycles until you retire.
My investor style is: __________________________
8

If you are choosing...
...an Asset Allocation Fund
Refer to page 10 for assistance with selecting the Asset Allocation Fund thatis right for you.
Specify the 4-digit fund code for the Asset Allocation Fund you select in the Your investment instructions section on each Application form.
...to build your own portfolio
Refer to page 11 for assistance with selecting the investments that are rightfor you.
Specify the percentage of contributions you want to invest in each fund inthe Your investment instructions section on each Application form.
9
To Do!

How to choose an Asset Allocation Fund
Your investor style (from page 8): ________________________
Choose the Asset Allocation (AA) Fund that matches your investor style.
If your investor style is... The Asset Allocation Fund for you is... Fund code
Conservative ML Conservative AA 2001
Moderate ML Moderate AA 2002
Balanced ML Balanced AA 2003
Growth ML Growth AA 2004
Aggressive ML Aggressive AA 2005
Note – Although these funds are rebalanced periodically to ensure they meet the objectives for each investor style, we recommend you complete the Investor Style Questionnaire at least annually to ensure your style has not changed.
To see the investment management fees and historical rates of returns for these funds, turn to page 15 in this Guide. Please refer to the back of this Guide to obtain a detailed description of each Asset Allocation FundError: Reference source not found.
You have now finished the fund selection process. Please return to
Step four on page 10 of the Enrolment Guide to complete your
enrolment.
10

How to build your own portfolio
Your investor style (from page 8): ________________________
Find the sample portfolio that matches your investor style.
You can use the sample portfolios as a guideline to help you choose individual funds. To ensure you create a well-diversified portfolio, select at least one fund from each asset class.
Each asset class in the sample portfolio is represented by a different colour, and each fund's description is printed in the colour that represents its asset class. For example, all Fix Income fund descriptions are blue, and all US Equity fund descriptions are orange. Keep this in mind when researching and choosing funds to invest in.
You can find descriptions of all available funds at the back of this Guide.
If your investor style is... A recommended asset mix for you is...
Conservative
Moderate
11
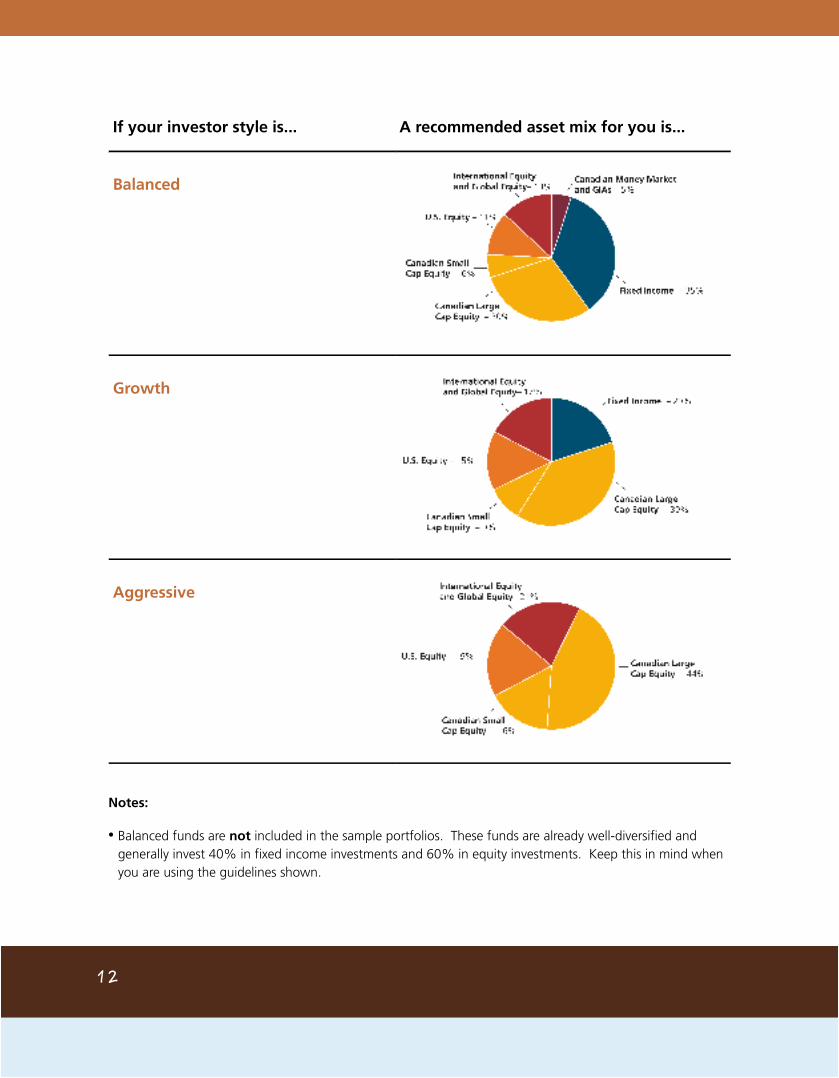
If your investor style is... A recommended asset mix for you is...
Balanced
Growth
Aggressive
Notes:
• Balanced funds are not included in the sample portfolios. These funds are already well-diversified and generally invest 40% in fixed income investments and 60% in equity investments. Keep this in mind when you are using the guidelines shown.
12

• You should consider how your savings outside of this plan are invested. Your other investments may already fulfill some parts of the sample portfolio in the above table. The guidelines provided are only suggestions.
Where to find detailed fund information
A summary of the funds available through your group program – including the investment management feesand historical rates of return for these funds – is in the next section of this Guide titled Your investment choices. Please refer to the back of this Guide to obtain a detailed description of each fund.
You have now finished the fund selection process. Please return to
Step four on page 10 of the Enrolment Guide to complete your
enrolment.
13
Your investment choicesThe remaining sections of this Guide include detailed information about the investments available in your program.
Page
Rates of Return Overview for your plan investments 15
How to Read Fund Descriptions 18
Funds available:
• Guaranteed Interest Accounts
• Target Date Funds
• Asset Allocation
• Canadian Money Market
• Fixed Income
• Balanced
• Canadian Large Cap Eqty
• Cdn Small/Mid Cap Eqty
• US Large Cap Eqty
• International Equity
• Global Equity
14
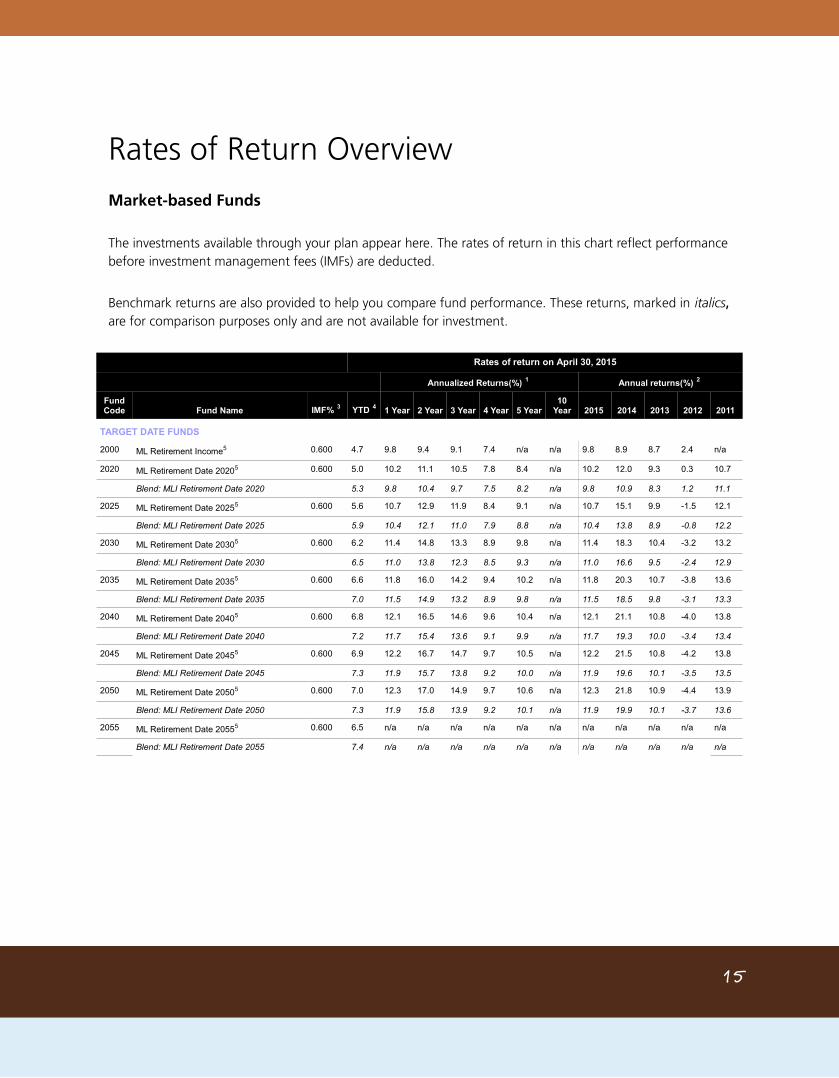
Rates of Return OverviewMarket-based Funds
The investments available through your plan appear here. The rates of return in this chart reflect performance before investment management fees (IMFs) are deducted.
Benchmark returns are also provided to help you compare fund performance. These returns, marked in italics, are for comparison purposes only and are not available for investment.
Rates of return on April 30, 2015
Annualized Returns(%) 1 Annual returns(%) 2 Fund Code Fund Name IMF% 3 YTD 4 1 Year 2 Year 3 Year 4 Year 5 Year
10 Year 2015 2014 2013 2012 2011
TARGET DATE FUNDS
2000 ML Retirement Income5 0.600 4.7 9.8 9.4 9.1 7.4 n/a n/a 9.8 8.9 8.7 2.4 n/a
2020 ML Retirement Date 20205 0.600 5.0 10.2 11.1 10.5 7.8 8.4 n/a 10.2 12.0 9.3 0.3 10.7
Blend: MLI Retirement Date 2020 5.3 9.8 10.4 9.7 7.5 8.2 n/a 9.8 10.9 8.3 1.2 11.1
2025 ML Retirement Date 20255 0.600 5.6 10.7 12.9 11.9 8.4 9.1 n/a 10.7 15.1 9.9 -1.5 12.1
Blend: MLI Retirement Date 2025 5.9 10.4 12.1 11.0 7.9 8.8 n/a 10.4 13.8 8.9 -0.8 12.2
2030 ML Retirement Date 20305 0.600 6.2 11.4 14.8 13.3 8.9 9.8 n/a 11.4 18.3 10.4 -3.2 13.2
Blend: MLI Retirement Date 2030 6.5 11.0 13.8 12.3 8.5 9.3 n/a 11.0 16.6 9.5 -2.4 12.9
2035 ML Retirement Date 20355 0.600 6.6 11.8 16.0 14.2 9.4 10.2 n/a 11.8 20.3 10.7 -3.8 13.6
Blend: MLI Retirement Date 2035 7.0 11.5 14.9 13.2 8.9 9.8 n/a 11.5 18.5 9.8 -3.1 13.3
2040 ML Retirement Date 20405 0.600 6.8 12.1 16.5 14.6 9.6 10.4 n/a 12.1 21.1 10.8 -4.0 13.8
Blend: MLI Retirement Date 2040 7.2 11.7 15.4 13.6 9.1 9.9 n/a 11.7 19.3 10.0 -3.4 13.4
2045 ML Retirement Date 20455 0.600 6.9 12.2 16.7 14.7 9.7 10.5 n/a 12.2 21.5 10.8 -4.2 13.8
Blend: MLI Retirement Date 2045 7.3 11.9 15.7 13.8 9.2 10.0 n/a 11.9 19.6 10.1 -3.5 13.5
2050 ML Retirement Date 20505 0.600 7.0 12.3 17.0 14.9 9.7 10.6 n/a 12.3 21.8 10.9 -4.4 13.9
Blend: MLI Retirement Date 2050 7.3 11.9 15.8 13.9 9.2 10.1 n/a 11.9 19.9 10.1 -3.7 13.6
2055 ML Retirement Date 20555 0.600 6.5 n/a n/a n/a n/a n/a n/a n/a n/a n/a n/a n/a
Blend: MLI Retirement Date 2055 7.4 n/a n/a n/a n/a n/a n/a n/a n/a n/a n/a n/a
15

Rates of return on April 30, 2015
Annualized Returns(%) 1 Annual returns(%) 2 Fund Code Fund Name IMF% 3 YTD 4 1 Year 2 Year 3 Year 4 Year 5 Year
10 Year 2015 2014 2013 2012 2011
ASSET ALLOCATION
2001 ML Conservative AA5 0.550 3.9 9.0 7.3 7.5 6.8 6.9 5.8 9.0 5.7 7.8 4.8 7.1
Blend: MLI Conservative Asset Allocation 4.0 8.8 6.7 6.5 6.0 6.2 5.6 8.8 4.7 6.0 4.8 7.1
2002 ML Moderate AA5 0.550 4.8 9.9 10.1 9.7 7.8 8.0 6.4 9.9 10.2 9.0 2.2 9.0
Blend: MLI Moderate Asset Allocation 5.1 9.6 9.3 8.8 7.4 7.8 6.5 9.6 9.0 7.8 3.1 9.7
2003 ML Balanced AA5 0.550 5.7 10.8 12.9 11.9 8.7 9.3 7.2 10.8 15.0 10.0 -0.4 11.6
Blend: MLI Balanced Asset Allocation 6.1 10.6 12.1 11.0 8.2 8.8 7.0 10.6 13.7 8.8 0.1 11.5
2004 ML Growth AA5 0.550 6.6 11.8 16.0 14.2 9.5 10.2 7.4 11.8 20.2 10.8 -3.4 13.0
Blend: MLI Growth Asset Allocation 7.1 11.6 15.0 13.2 9.0 9.8 7.6 11.6 18.5 9.8 -2.8 13.2
2005 ML Aggressive AA5 0.550 7.4 12.6 18.5 16.1 10.0 11.1 7.9 12.6 24.6 11.4 -6.3 15.3
Blend: MLI Aggressive Asset Allocation 8.0 12.6 17.9 15.5 9.8 10.8 8.0 12.6 23.5 10.8 -5.7 14.9
CANADIAN MONEY MARKET
3132 ML Cdn Money Market (MAM) 0.250 0.4 1.2 1.3 1.3 1.3 1.3 2.2 1.2 1.3 1.3 1.4 1.2
FTSE TMX 91 Day Treasury Bill Index 0.3 0.9 0.9 1.0 1.0 0.9 1.9 0.9 1.0 1.1 0.9 0.8
FIXED INCOME
4131 ML Canadian Bond (MAM) 0.550 2.8 8.1 4.1 5.0 5.8 5.9 5.7 8.1 0.3 6.9 8.2 6.2
4191 ML MAM Cdn Bond Index 0.255 2.7 8.2 4.2 4.6 5.7 5.8 5.3 8.2 0.2 5.6 9.0 6.0
FTSE TMX Universe Bond Total Return Idx 2.7 8.2 4.1 4.6 5.7 5.8 5.4 8.2 0.2 5.6 9.0 6.1
BALANCED
5011 ML Balanced5 0.550 4.6 10.7 12.7 12.0 9.6 10.1 7.7 10.7 14.7 10.6 2.6 12.3
Balanced Benchmark6 4.9 9.2 10.9 9.8 7.3 7.9 6.5 9.2 12.6 7.8 -0.1 10.5
CANADIAN LARGE CAP EQTY
7011 ML Canadian Equity 0.550 5.0 8.1 16.3 12.7 6.0 7.7 7.9 8.1 25.2 5.7 -11.6 14.4
7131 ML Cdn Lrg Cap Val (MAM) 0.650 2.7 7.0 14.0 13.3 7.8 8.4 7.7 7.0 21.5 12.0 -7.3 11.2
7132 ML MAM Cd Equity Index 0.250 5.0 7.1 14.0 10.8 5.3 7.6 8.1 7.1 21.4 4.5 -9.4 17.3
7313 ML CC&L Group Cdn Q Growth 0.450 3.9 7.5 17.5 15.6 9.6 11.3 10.2 7.5 28.4 11.9 -6.7 18.3
S&P/TSX Total Return 5.1 6.9 13.9 10.7 5.3 7.6 7.9 6.9 21.3 4.5 -9.4 17.2
CDN SMALL/MID CAP EQTY
7381 ML FGP Small Cap Cdn Equity 0.500 -0.8 -1.2 13.7 12.4 8.5 11.0 10.8 -1.2 30.9 9.8 -2.4 21.6
BMO Nesbitt Burns Cdn Small Cap Index 4.9 -6.2 8.3 3.6 -1.0 4.3 6.5 -6.2 25.0 -5.2 -13.8 28.6
US LARGE CAP EQTY
8131 ML MAM U.S. Equity Index 0.250 6.4 24.3 27.5 24.5 20.3 18.1 7.6 24.3 30.9 18.6 8.7 9.5
8451 ML Mawer U.S. Equity 0.700 6.7 26.0 28.5 25.3 21.5 18.2 8.6 26.0 31.1 19.0 10.8 6.0
8631 ML BG American Equity 0.700 7.9 25.8 29.0 26.7 22.5 19.3 10.0 25.8 32.3 22.1 10.8 7.1
S&P 500 Composite Total Return Idx($Cdn)
6.5 25.0 28.0 24.9 20.8 18.5 7.9 25.0 31.0 19.1 9.2 9.9
16

Rates of return on April 30, 2015
Annualized Returns(%) 1 Annual returns(%) 2 Fund Code Fund Name IMF% 3 YTD 4 1 Year 2 Year 3 Year 4 Year 5 Year
10 Year 2015 2014 2013 2012 2011
INTERNATIONAL EQUITY
8011 ML EAFE Plus Eq (Pictet) 0.850 18.0 9.7 17.2 19.4 11.8 12.7 4.6 9.7 25.2 23.9 -8.3 16.5
8321 ML BR Intl Equity Index 0.400 14.2 12.4 18.0 19.2 11.4 11.5 5.4 12.4 23.9 21.7 -9.0 11.9
MSCI EAFE ($ Cdn) 14.2 12.9 18.2 19.6 11.8 11.9 5.7 12.9 23.8 22.2 -8.7 12.2
GLOBAL EQUITY
8181 ML Trimark 0.800 11.5 18.1 22.8 21.4 18.2 16.4 7.9 18.1 27.8 18.4 9.4 9.2
MSCI World ($ Cdn) 9.6 19.4 23.4 22.2 16.2 15.2 7.1 19.4 27.5 19.6 -0.0 11.5
Guaranteed Interest Accounts (GIAs)
The interest rates for the GIAs available through your plan appear here.
These rates are as at April 30, 2015.
Fund Code Fund Name
Interest Rate
1000 Manulife Daily Interest .700%
1001 Manulife 1 Year GIA .950%
1003 Manulife 3 Year GIA 1.000%
1005 Manulife 5 Year GIA 1.300%
Notes:
1 An annualized return is an average return that has been expressed as an annual (yearly) rate.
2 An annual return is the return of an investment over a 12 month period. As an example: a one year annual return as at June 30, 2012 would be from July 1, 2011 to June 30, 2012.
3 The Investment Management Fees (IMFs) shown incorporate costs related to investment management services, record-keeping, administration and segregated fund operating expenses, and may include underlying fund operating expenses. Applicable taxes are not included in the IMFs.
4 Year to date (YTD) rates of return are not annualized.
5 Refer to the fund page for details on how the benchmark is comprised.
6 The Benchmark is comprised of 35% S&P/TSX Composite Total Return Index ($CA), 35% FTSE TMX Canada Universe Bond Index, 10% S&P 500 Composite Total Return Index ($CA), 10% MSCI EAFE Total Return Index ($CA), and 10% FTSE TMX Canada 91 Day Treasury Bill Index.
Manulife Return These numbers represent the gross rate of return of the Manulife fund.
Additional Historical Information In order to provide further historical information, we have included the returns of the underlying funds.
17
How to Read Fund Descriptions
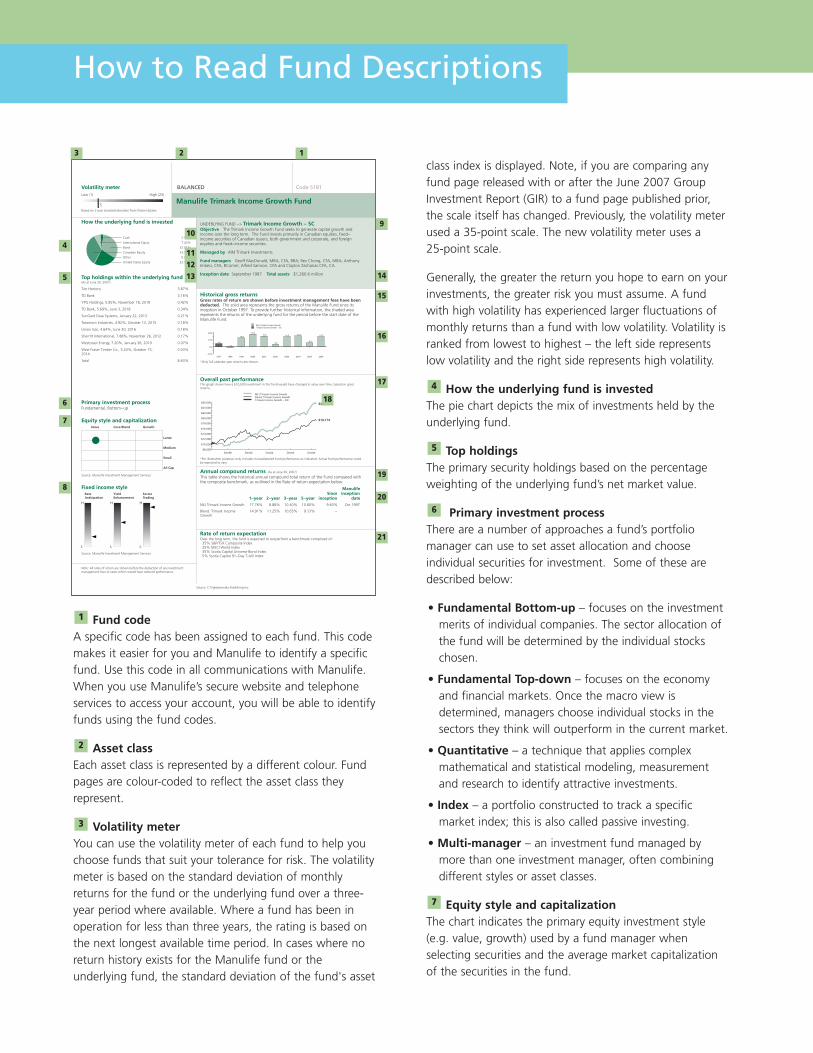
Fund codeA specific code has been assigned to each fund. This codemakes it easier for you and Manulife to identify a specificfund. Use this code in all communications with Manulife.When you use Manulife’s secure website and telephoneservices to access your account, you will be able to identifyfunds using the fund codes.
Asset classEach asset class is represented by a different colour. Fundpages are colour-coded to reflect the asset class theyrepresent.
Volatility meterYou can use the volatility meter of each fund to help youchoose funds that suit your tolerance for risk. The volatilitymeter is based on the standard deviation of monthlyreturns for the fund or the underlying fund over a three-year period where available. Where a fund has been inoperation for less than three years, the rating is based onthe next longest available time period. In cases where noreturn history exists for the Manulife fund or theunderlying fund, the standard deviation of the fund's asset
3
2
1
class index is displayed. Note, if you are comparing anyfund page released with or after the June 2007 GroupInvestment Report (GIR) to a fund page published prior,the scale itself has changed. Previously, the volatility meterused a 35-point scale. The new volatility meter uses a25-point scale.
Generally, the greater the return you hope to earn on yourinvestments, the greater risk you must assume. A fundwith high volatility has experienced larger fluctuations ofmonthly returns than a fund with low volatility. Volatility isranked from lowest to highest – the left side representslow volatility and the right side represents high volatility.
How the underlying fund is investedThe pie chart depicts the mix of investments held by theunderlying fund.
Top holdingsThe primary security holdings based on the percentageweighting of the underlying fund’s net market value.
Primary investment processThere are a number of approaches a fund’s portfoliomanager can use to set asset allocation and chooseindividual securities for investment. Some of these aredescribed below:
• Fundamental Bottom-up – focuses on the investmentmerits of individual companies. The sector allocation ofthe fund will be determined by the individual stockschosen.
• Fundamental Top-down – focuses on the economyand financial markets. Once the macro view isdetermined, managers choose individual stocks in thesectors they think will outperform in the current market.
• Quantitative – a technique that applies complexmathematical and statistical modeling, measurementand research to identify attractive investments.
• Index – a portfolio constructed to track a specificmarket index; this is also called passive investing.
• Multi-manager – an investment fund managed bymore than one investment manager, often combiningdifferent styles or asset classes.
Equity style and capitalizationThe chart indicates the primary equity investment style(e.g. value, growth) used by a fund manager whenselecting securities and the average market capitalizationof the securities in the fund.
7
6
5
4
Volatility meter
Based on 3 year standard deviation from Globe HySales
Low (1) High (25)
.5
BALANCED Code 5181
Manulife Trimark Income Growth Fund
Cash 2.98%
United States Equity 23.52%
International Equity 7.43%
Other 0.05%
Bond 32.51%
Canadian Equity 33.53%
How the underlying fund is invested
Top holdings within the underlying fund(As at June 30, 2007)
Tim Hortons 3.87%
TD Bank 3.16%
YPG Holdings, 5.85%, November 18, 2019 0.42%
TD Bank, 5.69%, June 3, 2018 0.34%
SunGard Data Systems, January 22, 2013 0.21%
Toromont Industries, 4.92%, October 13, 2015 0.18%
Union Gas, 4.64%, June 30, 2016 0.18%
Sherritt International, 7.88%, November 26, 2012 0.17%
Westcoast Energy, 7.20%, January 26, 2010 0.07%
West Fraser Timber Co., 5.20%, October 15,2014
0.03%
Total 8.63%
Primary investment processFundamental, Bottom−up
Equity style and capitalization
Source: Manulife Investment Management Services
Fixed income style
Source: Manulife Investment Management Services
Value Core/Blend Growth
Large
Medium
Small
All Cap
RateAnticipation
YieldEnhancement
SectorTrading
Note: All rates of return are shown before the deduction of any investmentmanagement fees or taxes which would have reduced performance.
UNDERLYING FUND −> Trimark Income Growth − SCObjective The Trimark Income Growth Fund seeks to generate capital growth andincome over the long term. The Fund invests primarily in Canadian equities, fixed−income securities of Canadian issuers, both government and corporate, and foreignequities and fixed−income securities.
Managed by AIM Trimark Investments
Fund managers Geoff MacDonald, MBA, CFA, BBA; Rex Chong, CFA, MBA; AnthonyImbesi, CFA, BComm; Alfred Samson, CFA and Clayton Zacharias CFA, CA
Inception date September 1987 Total assets $1,260.6 million
Historical gross returnsGross rates of return are shown before investment management fees have beendeducted. The solid area represents the gross returns of the Manulife Fund since itsinception in October 1997. To provide further historical information, the shaded arearepresents the returns of the underlying fund for the period before the start date of theManulife Fund.
−10%
0%
10%
20%
1997 1998 1999 2000 2001 2002 2003 2004 2005 2006
MLI Trimark Income GrowthTrimark Income Growth − SC
14.5
6.0
15.814.5
3.8
15.618.3
12.8
−1.2
4.6
*Only full calendar year returns are shown.
Overall past performanceThis graph shows how a $10,000 investment in this fund would have changed in value over time, based on grossreturns.
$8,000
$10,000
$12,000
$14,000
$16,000
$18,000
$20,000
$22,000
$24,000
$26,000
Dec98 Dec00 Dec02 Dec04 Dec06
MLI Trimark Income GrowthBlend: Trimark Income GrowthTrimark Income Growth − SC
$25,318*
$19,174
*For illustration purposes only. Includes mutual/pooled fund performance as indicated. Actual fund performance couldbe expected to vary.
Annual compound returns (As at June 30, 2007)
This table shows the historical annual compound total return of the Fund compared withthe composite benchmark, as outlined in the Rate of return expectation below.
1−year 2−year 3−year 5−yearSince
inception
Manulifeinception
date
MLI Trimark Income Growth 17.76% 8.88% 10.40% 10.80% 9.63% Oct 1997
Blend: Trimark IncomeGrowth
14.91% 11.25% 10.65% 9.13% −
Rate of return expectation Over the long term, the fund is expected to outperform a benchmark comprised of:· 35% S&P/TSX Composite Index· 25% MSCI World Index · 35% Scotia Capital Universe Bond Index· 5% Scotia Capital 91−Day T−bill Index
Source: CTVglobemedia Publishing Inc.
17
18
19
20
21
16
15
14
9
131211
10
123
4
5
6
7
8

Fixed Income StyleThe chart indicates various fixed income investment stylesand the degree a fund manager uses each style inselecting securities for the fund.
Underlying fundThe market-based investment options in your group planare primarily fund-on-fund investments which invest inexisting pooled or mutual funds (referred to as underlyingfunds). When a contribution is made into a Manulife fund,the contribution is used to purchase units of thecorresponding underlying fund. For example, if youpurchase units of the “Manulife Trimark Canadian Fund”this Manulife fund invests in units of the “TrimarkCanadian Fund.” Due to the timing of these transactions,each Manulife fund may contain a small cash componentin addition to the underlying fund's cash component. Thegoal of the fund-on-fund strategy is to produce returns onthe Manulife fund that are similar to the returns on theunderlying fund.
ObjectiveThe fund’s primary investment goal(s) as determined bythe fund manager.
Managed byThe fund management company that manages theunderlying fund.
Fund managersThe name of the lead fund manager(s) responsible for theinvestment decisions regarding the underlying fund.
Inception dateThe date the underlying fund was made available forpurchase by investors.
Total assetsThe total market value of all the assets invested in theunderlying fund as of the specified date.
Historical gross returnsHistorical performance of the fund over a specified timeperiod. All performance histories are offered for illustrative
15
8
14
13
12
9
11
10
purposes only and are not a guarantee of futureperformance. Unit values will fluctuate with the marketvalue of the underlying fund’s assets. Gross returns are therates of return earned before the deduction of investmentmanagement fees and GST. An individual investing in theFund earns a net return after applicable management feesare charged. Management fees can vary by clientdepending on the products purchased. The returns shownhere are returns for the Manulife fund and/or theunderlying fund. Returns for individual plans will differ asinvestment management fees are applied.
Year by year returnsThe one-year return for the fund during each yearspecified, based upon a calendar year from January toDecember.
Overall past performanceThe graph shows you how a $10,000 investment in a fundwould change in value for the specific number of yearscompared with a related broad-based index.
IndexThe index shown represents a broad-based market viewand is not necessarily the fund’s specific benchmark. Itshould be used as a reference to compare funds against abroad asset class. The fund’s objective may differ from thestyle of the index.
Annual compound returnsThe return for historical period specified, converted to anannualized rate.
Manulife inception dateThe first full month the fund was made available forinvestment by Manulife’s Group Savings and RetirementSolutions division.
Rate of return expectationThe benchmark the fund manager expects to meet orexceed over the long term.
16
17
20
19
18
21
Group Savings and Retirement Solutions’ products and services are offeredthrough Manulife Financial (The Manufacturers Life Insurance Company).Manulife Financial is a leading Canadian-based financial services group serving millions of customersin 19 countries and territories worldwide. Operating as Manulife Financial in Canada and Asia, andprimarily through John Hancock in the United States, the Company offers clients a diverse range offinancial protection products and wealth management services through its extensive network ofemployees, agents and distribution partners.
Manulife Financial Corporation trades as ‘MFC’ on the TSX, NYSE and PSE, and under ‘0945’ onthe SEHK. Manulife Financial can be found on the Internet at www.manulife.com.
Manulife Financial and the block design are registered service marks and trademarks ofThe Manufacturers Life Insurance Company and are used by it and its affiliates including ManulifeFinancial Corporation.
GP4943E (09/2007)

21
HOW THE DAILY INTEREST ACCOUNT WORKS
Similar to a daily interest account at a bank or trust company, this account earns interestdaily at the current rate for that account. While Manulife always guarantees the principaland interest, the interest rate may change at any time.
Contributions begin earning interest when received by Manulife Financial's head office.As Manulife Financial receives contributions, those funds begin to earn interest at a ratesimilar to a bank savings account.
HOW THE DAILY INTEREST ACCOUNT IS PROTECTED
Manulife Financial is a member of Assuris. With Assuris, consumers may be entitled toprotection against the loss of their savings and retirement incomes if a member financialinstitution becomes insolvent. You can call Assuris at 1-866-878-1225 for details aboutmaximum coverage guarantees.
Volatility and risk
This account is backed by the general assets of ManulifeFinancial. It has the lowest risk and lowest volatility, butearns the lowest rate of interest over the long term.Consider this account as a short-term holding accountwhile you decide on your long-term investment strategy.Once you have determined your investment strategy, youcan transfer your funds at any time.
Manulife Daily Interest Accounts
Code 1000GUARANTEED INTEREST ACCOUNTSVOLATILITY METER
WHAT THESE ACCOUNTS OFFER
• Guaranteed returns when held to maturity • Principal and interest backed by the assets of Manulife Financial• Choice of 1, 2, 3, 4, 5 and 10-year terms
Investment codes respectively (1001, 1002, 1003, 1004, 1005, 1010)
HOW THE GUARANTEED INTEREST ACCOUNT IS PROTECTED
Manulife Financial is a member of Assuris. With Assuris, consumers may be entitled toprotection against the loss of their savings and retirement incomes if a member financialinstitution becomes insolvent. You can call Assuris at 1-866-878-1225 for details aboutmaximum coverage guarantees.
Volatility and risk
These accounts offer good returns and excellent investmentsecurity. Consider these accounts if you are an investor whoneeds guaranteed security for your investment and cancommit to investments for a fixed period of time. There isno volatility associated with the return in this account andthere is minimal risk as this is a guaranteed investmentbacked by the general assets of Manulife Financial.
Manulife Guaranteed Interest Accounts
Codes 1001, 1002, 1003, 1004, 1005, 1010GUARANTEED INTEREST ACCOUNTSVOLATILITY METER
Sources : Manulife Financial

Volatility meter
Based on 3 year standard deviation of the Fund
Low (1) High (25)
. 3
TARGET DATE Code 2000
Manulife Retirement Income Fund
Fixed Income 56.21%
Global Equity 3.25%
Mortgage 8.78%
Real Estate 1.69%
International Equity 7.69%
U.S. Equity 10.13%Canadian Equity 12.25%
How the fund is invested
Top Target Allocation of the FundMLI Cdn Bond (MAM) 18.76%MAM Strategic Income Pooled 18.57%MLI Mortgage Backed Fund (MAM) 8.78%MLI Fixed Income Plus (AB) 8.09%MAM Cdn Bond Index Pooled Fund 6.21%MLI Cdn Universe Bond (CIBC) 4.58%MAM US Equity Index Pooled Fund 4.37%MLI Cdn Large Cap Value Eq (MAM) 3.50%MLI International Eq (Templeton) 3.25%MLI World Investment (Mawer) 3.25%MLI Pure Canadian Equity Grw (MAM) 2.88%MLI U.S. Large Cap Val (T. Rowe) 2.88%MLI U.S. Div Grwth Eq (Wellington) 2.88%MAM EAFE Equity Index Pooled 2.69%MLI CC&L Q Core Canadian Equity 2.44%MLI Franklin Bissett Cdn Eq 2.44%MLI Emerging Market Value (DFA) 1.75%MLI Canadian Real Estate Investment 1.69%MLI Cdn Growth Opportunities (MAM) 0.37%MLI Canadian Small Cap Value (FGP) 0.37%
Primary investment processMulti−manager
Equity style and capitalization
Source: Manulife Investment Management Services
Fixed income style
Source: Manulife Investment Management Services
1 Value Core/Blend Growth
Large
Medium
Small
All Cap
RateAnticipation
YieldEnhancement
SectorTrading
Note: All rates of return are shown before investment management fees or taxeshave been deducted.
The rate of return is used only to illustrate the effects of the compound growthrate and is not intended to reflect the future values or returns in the Fund.
Objective The Fund is managed to provide a balance between current income andgrowth of capital, with emphasis on income and capital preservation. This fund isdiversified by asset class and investment style with the objective of achieving superiorrisk−adjusted returns.
Managed by Manulife Asset Management Limited − Portfolio Solutions Group
Fund managers Various (please refer to Top Target Allocation of the Fund on this page)
Inception date September 2010 Total assets $155.1 million
Historical gross returnsGross rates of return are shown before investment management fees have beendeducted. The solid area represents the gross returns of the Manulife Fund since itsinception in October 2010.
0.0%
2.0%
4.0%
6.0%
8.0%
10.0%
2005 2006 2007 2008 2009 2010 2011 2012 2013 2014
Manulife Retirement Income Fund
9.5
8.1 8.0
1.4
* Only full calendar year returns are shown.
Overall past performanceThis graph shows how a $10,000 investment in this fund would have changed in value over time, based on grossreturns.
$10,000
$11,000
$12,000
$13,000
$14,000
Dec10 Dec11 Dec12 Dec13 Dec14
Manulife Retirement Income FundBlend: MLI Retirement Income
$13,352*
$13,106
* For illustration purposes only. Includes mutual/pooled fund performance as indicated. Actual fund performance couldbe expected to vary.
Annual compound returns (As at December 31, 2014)
This table shows the historical annual compound total return of the Fund compared withthe composite benchmark, as outlined in the Rate of return expectation below.
1−year 2−year 3−year 5−yearSince
inception
Manulifeinception
date
Manulife Retirement Income Fund
9.50% 8.77% 8.50% − 7.03% Sep 2010
Blend: MLI RetirementIncome
9.34% 7.88% 7.24% 6.94% −
Rate of return expectation The benchmark for this fund is adjusted annually. As of March 1, 2014, the benchmark is as follows:· 46.50% FTSE TMX Universe Bond Total Return Idx· 18.50% Barclays Capital Multiverse Index TR C$· 17.50% S&P/TSX Total Return· 9.45% MSCI EAFE ($ Cdn)· 8.05% S&P 500 Composite Total Return Idx($Cdn)
Source: The Globe and Mail Inc.

Volatility meter
Based on 3 year standard deviation of the Fund
Low (1) High (25)
. 4
TARGET DATE Code 2020
Manulife Retirement Date 2020 Fund
Fixed Income 50.53%
Global Equity 4.17%
International Equity 9.54%
Real Estate 2.21%
Mortgage 5.28%
U.S. Equity 12.60%Canadian Equity 15.67%
How the fund is invested
Top Target Allocation of the FundMAM Strategic Income Pooled 18.39%MLI Cdn Bond (MAM) 16.04%MLI Fixed Income Plus (AB) 6.94%MAM US Equity Index Pooled Fund 5.53%MLI Mortgage Backed Fund (MAM) 5.28%MAM Cdn Bond Index Pooled Fund 5.21%MLI Cdn Large Cap Value Eq (MAM) 4.42%MLI International Eq (Templeton) 4.17%MLI World Investment (Mawer) 4.17%MLI Cdn Universe Bond (CIBC) 3.95%MLI Pure Canadian Equity Grw (MAM) 3.62%MLI U.S. Large Cap Val (T. Rowe) 3.56%MLI U.S. Div Grwth Eq (Wellington) 3.51%MAM EAFE Equity Index Pooled 3.16%MLI CC&L Q Core Canadian Equity 3.06%MLI Franklin Bissett Cdn Eq 3.06%MLI Emerging Market Value (DFA) 2.21%MLI Canadian Real Estate Investment 2.21%MLI Canadian Small Cap Value (FGP) 0.63%MLI Cdn Growth Opportunities (MAM) 0.63%
Primary investment processMulti−manager
Equity style and capitalization
Source: Manulife Investment Management Services
Fixed income style
Source: Manulife Investment Management Services
1 Value Core/Blend Growth
Large
Medium
Small
All Cap
RateAnticipation
YieldEnhancement
SectorTrading
Note: All rates of return are shown before investment management fees or taxeshave been deducted.
The rate of return is used only to illustrate the effects of the compound growthrate and is not intended to reflect the future values or returns in the Fund.
Objective The Fund is managed to provide a balance between current income andgrowth of capital, with emphasis on income and capital preservation. This fund isdiversified by asset class and investment style with the objective of achieving superiorrisk−adjusted returns. The Fund will commence with approximately 66% in equities,while the remainder of the Fund will be invested in fixed income, mortgages and moneymarket investments. The Fund’s asset mix will decline to approximately 35% in equities inthe year 2020.
Managed by Manulife Asset Management Limited − Portfolio Solutions Group
Fund managers Various (please refer to Top Target Allocation of the Fund on this page)
Inception date October 2005 Total assets $278.0 million
Historical gross returnsGross rates of return are shown before investment management fees have beendeducted. The solid area represents the gross returns of the Manulife Fund since itsinception in November 2005.
−40%
−20%
0%
20%
40%
2005 2006 2007 2008 2009 2010 2011 2012 2013 2014
Manulife Retirement Date 2020 Fund
9.8 11.3 9.3 −1.1
10.8 21.0
−20.2 0.4
14.7
* Only full calendar year returns are shown.
Overall past performanceThis graph shows how a $10,000 investment in this fund would have changed in value over time, based on grossreturns.
$9,000
$10,000
$11,000
$12,000
$13,000
$14,000
$15,000
$16,000
$17,000
$18,000
Dec06 Dec08 Dec10 Dec12 Dec14
Manulife Retirement Date 2020 FundBlend: MLI Retirement Date 2020
$17,074* $16,954
* For illustration purposes only. Includes mutual/pooled fund performance as indicated. Actual fund performance couldbe expected to vary.
Annual compound returns (As at December 31, 2014)
This table shows the historical annual compound total return of the Fund compared withthe composite benchmark, as outlined in the Rate of return expectation below.
1−year 2−year 3−year 5−yearSince
inception
Manulifeinception
date
9.79% 10.54% 10.13% 7.91% 6.01% Oct 2005Manulife Retirement Date 2020 FundBlend: MLI Retirement Date2020
9.66% 9.60% 8.76% 7.50% −
Rate of return expectation The benchmark for this fund is adjusted quarterly. The benchmark effective January 01, 2015 is asfollows:· 38.22% FTSE TMX Canada Universe· 22.10% S&P/TSX Composite TR· 17.58% Barclays Multiverse TR CAD· 11.93% MSCI EAFE GR CAD· 10.17% S&P 500 TR CAD
Source: The Globe and Mail Inc.

Volatility meter
Based on 3 year standard deviation of the Fund
Low (1) High (25)
. 4
TARGET DATE Code 2025
Manulife Retirement Date 2025 Fund
International Equity 11.67%
Real Estate 2.78%
Global Equity 5.31%
Mortgage 3.39%
Canadian Equity 20.23%
U.S. Equity 15.60%Fixed Income 41.02%
How the fund is invested
Top Target Allocation of the FundMAM Strategic Income Pooled 17.34%MLI Cdn Bond (MAM) 12.12%MAM US Equity Index Pooled Fund 6.95%MLI Cdn Large Cap Value Eq (MAM) 5.56%MLI International Eq (Templeton) 5.31%MLI World Investment (Mawer) 5.31%MLI Fixed Income Plus (AB) 5.18%MLI Pure Canadian Equity Grw (MAM) 4.61%MLI U.S. Large Cap Val (T. Rowe) 4.42%MLI U.S. Div Grwth Eq (Wellington) 4.23%MLI CC&L Q Core Canadian Equity 3.92%MLI Franklin Bissett Cdn Eq 3.92%MAM Cdn Bond Index Pooled Fund 3.74%MAM EAFE Equity Index Pooled 3.58%MLI Mortgage Backed Fund (MAM) 3.39%MLI Emerging Market Value (DFA) 2.78%MLI Canadian Real Estate Investment 2.78%MLI Cdn Universe Bond (CIBC) 2.64%MLI Cdn Growth Opportunities (MAM) 0.99%MLI Canadian Small Cap Value (FGP) 0.98%
Primary investment processMulti−manager
Equity style and capitalization
Source: Manulife Investment Management Services
Fixed income style
Source: Manulife Investment Management Services
1 Value Core/Blend Growth
Large
Medium
Small
All Cap
RateAnticipation
YieldEnhancement
SectorTrading
Note: All rates of return are shown before investment management fees or taxeshave been deducted.
The rate of return is used only to illustrate the effects of the compound growthrate and is not intended to reflect the future values or returns in the Fund.
Objective The Fund is managed to provide a balance between current income andgrowth of capital, with emphasis on growth of capital. This fund is diversified by assetclass and investment style with the objective of achieving superior risk−adjusted returns.The Fund will commence with approximately 77% in equities, while the remainder of theFund will be invested in fixed income, mortgages and money market investments. TheFund’s asset mix will decline to approximately 35% in equity investments in the year2025.
Managed by Manulife Asset Management Limited − Portfolio Solutions Group
Fund managers Various (please refer to Top Target Allocation of the Fund on this page)
Inception date October 2005 Total assets $340.8 million
Historical gross returnsGross rates of return are shown before investment management fees have beendeducted. The solid area represents the gross returns of the Manulife Fund since itsinception in November 2005.
−40%
−20%
0%
20%
40%
2005 2006 2007 2008 2009 2010 2011 2012 2013 2014
Manulife Retirement Date 2025 Fund
10.2 14.5 10.2 −3.2
11.9
23.9
−24.3 −0.1
16.9
* Only full calendar year returns are shown.
Overall past performanceThis graph shows how a $10,000 investment in this fund would have changed in value over time, based on grossreturns.
$8,000
$9,000
$10,000
$11,000
$12,000
$13,000
$14,000
$15,000
$16,000
$17,000
$18,000
Dec06 Dec08 Dec10 Dec12 Dec14
Manulife Retirement Date 2025 Fund Blend: MLI Retirement Date 2025
$17,437*
$17,007
* For illustration purposes only. Includes mutual/pooled fund performance as indicated. Actual fund performance couldbe expected to vary.
Annual compound returns (As at December 31, 2014)
This table shows the historical annual compound total return of the Fund compared withthe composite benchmark, as outlined in the Rate of return expectation below.
1−year 2−year 3−year 5−yearSince
inception
Manulifeinception
date
10.16% 12.29% 11.59% 8.54% 6.25% Oct 2005Manulife Retirement Date 2025 FundBlend: MLI Retirement Date2025
10.06% 11.22% 10.12% 7.99% −
Rate of return expectation The benchmark for this fund is adjusted quarterly. The benchmark effective January 01, 2015 is asfollows:· 27.96% FTSE TMX Canada Universe· 27.80% S&P/TSX Composite TR· 16.44% Barclays Multiverse TR CAD· 15.01% MSCI EAFE GR CAD· 12.79% S&P 500 TR CAD
Source: The Globe and Mail Inc.

Volatility meter
Based on 3 year standard deviation of the Fund
Low (1) High (25)
. 5
TARGET DATE Code 2030
Manulife Retirement Date 2030 Fund
International Equity 14.04%
U.S. Equity 19.11%
Global Equity 6.57%
Mortgage 1.93%
Canadian Equity 25.28%
Real Estate 3.20%Fixed Income 29.87%
How the fund is invested
Top Target Allocation of the FundMAM Strategic Income Pooled 14.41%MAM US Equity Index Pooled Fund 8.42%MLI Cdn Bond (MAM) 8.02%MLI Cdn Large Cap Value Eq (MAM) 6.82%MLI International Eq (Templeton) 6.57%MLI World Investment (Mawer) 6.57%MLI Pure Canadian Equity Grw (MAM) 5.62%MLI U.S. Large Cap Val (T. Rowe) 5.47%MLI U.S. Div Grwth Eq (Wellington) 5.22%MLI CC&L Q Core Canadian Equity 4.92%MLI Franklin Bissett Cdn Eq 4.91%MAM EAFE Equity Index Pooled 4.06%MLI Fixed Income Plus (AB) 3.43%MLI Emerging Market Value (DFA) 3.41%MLI Canadian Real Estate Investment 3.20%MAM Cdn Bond Index Pooled Fund 2.43%MLI Mortgage Backed Fund (MAM) 1.93%MLI Cdn Universe Bond (CIBC) 1.58%MLI Canadian Small Cap Value (FGP) 1.38%MLI Cdn Growth Opportunities (MAM) 1.38%
Primary investment processMulti−manager
Equity style and capitalization
Source: Manulife Investment Management Services
Fixed income style
Source: Manulife Investment Management Services
1 Value Core/Blend Growth
Large
Medium
Small
All Cap
RateAnticipation
YieldEnhancement
SectorTrading
Note: All rates of return are shown before investment management fees or taxeshave been deducted.
The rate of return is used only to illustrate the effects of the compound growthrate and is not intended to reflect the future values or returns in the Fund.
Objective The Fund is managed to provide a balance between current income andgrowth of capital, with emphasis on growth of capital. This fund is diversified by assetclass and investment style with the objective of achieving superior risk−adjusted returns.The Fund will commence with approximately 82% in equity investments, while theremainder of the Fund will be invested in fixed income, mortgages and money marketinvestments. The Fund’s asset mix will decline to approximately 35% in equities in theyear 2030.
Managed by Manulife Asset Management Limited − Portfolio Solutions Group
Fund managers Various (please refer to Top Target Allocation of the Fund on this page)
Inception date October 2005 Total assets $353.0 million
Historical gross returnsGross rates of return are shown before investment management fees have beendeducted. The solid area represents the gross returns of the Manulife Fund since itsinception in November 2005.
−40%
−20%
0%
20%
40%
2005 2006 2007 2008 2009 2010 2011 2012 2013 2014
Manulife Retirement Date 2030 Fund
10.6 17.7
11.0
−5.1
12.8
25.8
−26.6 −0.4
17.1
* Only full calendar year returns are shown.
Overall past performanceThis graph shows how a $10,000 investment in this fund would have changed in value over time, based on grossreturns.
$8,000
$9,000
$10,000
$11,000
$12,000
$13,000
$14,000
$15,000
$16,000
$17,000
$18,000
Dec06 Dec08 Dec10 Dec12 Dec14
Manulife Retirement Date 2030 FundBlend: MLI Retirement Date 2030
$17,616*
$17,115
* For illustration purposes only. Includes mutual/pooled fund performance as indicated. Actual fund performance couldbe expected to vary.
Annual compound returns (As at December 31, 2014)
This table shows the historical annual compound total return of the Fund compared withthe composite benchmark, as outlined in the Rate of return expectation below.
1−year 2−year 3−year 5−yearSince
inception
Manulifeinception
date
10.56% 14.09% 13.05% 9.11% 6.37% Oct 2005Manulife Retirement Date 2030 FundBlend: MLI Retirement Date2030
10.52% 12.83% 11.42% 8.43% −
Rate of return expectation The benchmark for this fund is adjusted quarterly. The benchmark effective January 01, 2015 is asfollows:· 18.26% FTSE TMX Canada Universe· 34.10% S&P/TSX Composite TR· 13.54% Barclays Multiverse TR CAD· 18.41% MSCI EAFE GR CAD· 15.69% S&P 500 TR CAD
Source: The Globe and Mail Inc.

Volatility meter
Based on 3 year standard deviation of the Fund
Low (1) High (25)
. 6
TARGET DATE Code 2035
Manulife Retirement Date 2035 Fund
International Equity 15.86%
Fixed Income 20.62%
Global Equity 7.55%
Mortgage 1.38%
U.S. Equity 21.93%
Real Estate 3.45%Canadian Equity 29.21%
How the fund is invested
Top Target Allocation of the FundMAM Strategic Income Pooled 11.21%MAM US Equity Index Pooled Fund 9.53%MLI Cdn Large Cap Value Eq (MAM) 7.80%MLI International Eq (Templeton) 7.55%MLI World Investment (Mawer) 7.55%MLI Pure Canadian Equity Grw (MAM) 6.35%MLI U.S. Large Cap Val (T. Rowe) 6.32%MLI U.S. Div Grwth Eq (Wellington) 6.08%MLI CC&L Q Core Canadian Equity 5.72%MLI Franklin Bissett Cdn Eq 5.71%MLI Cdn Bond (MAM) 4.86%MAM EAFE Equity Index Pooled 4.41%MLI Emerging Market Value (DFA) 3.90%MLI Canadian Real Estate Investment 3.45%MLI Fixed Income Plus (AB) 2.11%MLI Canadian Small Cap Value (FGP) 1.69%MLI Cdn Growth Opportunities (MAM) 1.69%MAM Cdn Bond Index Pooled Fund 1.51%MLI Mortgage Backed Fund (MAM) 1.38%MLI Cdn Universe Bond (CIBC) 0.93%
Primary investment processMulti−manager
Equity style and capitalization
Source: Manulife Investment Management Services
Fixed income style
Source: Manulife Investment Management Services
1 Value Core/Blend Growth
Large
Medium
Small
All Cap
RateAnticipation
YieldEnhancement
SectorTrading
Note: All rates of return are shown before investment management fees or taxeshave been deducted.
The rate of return is used only to illustrate the effects of the compound growthrate and is not intended to reflect the future values or returns in the Fund.
Objective The Fund is managed to provide a balance between current income andgrowth of capital, with emphasis on growth of capital. This fund is diversified by assetclass and investment style with the objective of achieving superior risk−adjusted returns.The Fund will commence with approximately 84% in equities, while the remainder of theFund will be invested in fixed income, mortgages and money market investments. TheFund’s asset mix will gradually decline to approximately 35% in equities in the year 2035.
Managed by Manulife Asset Management Limited − Portfolio Solutions Group
Fund managers Various (please refer to Top Target Allocation of the Fund on this page)
Inception date October 2005 Total assets $317.5 million
Historical gross returnsGross rates of return are shown before investment management fees have beendeducted. The solid area represents the gross returns of the Manulife Fund since itsinception in November 2005.
−40%
−20%
0%
20%
40%
2005 2006 2007 2008 2009 2010 2011 2012 2013 2014
Manulife Retirement Date 2035 Fund
10.8 19.8
11.4
−5.9
13.1
26.6
−27.4 −0.6
17.6
* Only full calendar year returns are shown.
Overall past performanceThis graph shows how a $10,000 investment in this fund would have changed in value over time, based on grossreturns.
$8,000
$9,000
$10,000
$11,000
$12,000
$13,000
$14,000
$15,000
$16,000
$17,000
$18,000
Dec06 Dec08 Dec10 Dec12 Dec14
Manulife Retirement Date 2035 Fund Blend: MLI Retirement Date 2035
$17,913*
$17,298
* For illustration purposes only. Includes mutual/pooled fund performance as indicated. Actual fund performance couldbe expected to vary.
Annual compound returns (As at December 31, 2014)
This table shows the historical annual compound total return of the Fund compared withthe composite benchmark, as outlined in the Rate of return expectation below.
1−year 2−year 3−year 5−yearSince
inception
Manulifeinception
date
10.83% 15.25% 13.95% 9.51% 6.60% Oct 2005Manulife Retirement Date 2035 FundBlend: MLI Retirement Date2035
10.86% 13.89% 12.23% 8.78% −
Rate of return expectation The benchmark for this fund is adjusted quarterly. The benchmark effective January 01, 2015 is asfollows:· 11.40% FTSE TMX Canada Universe· 39.00% S&P/TSX Composite TR· 10.60% Barclays Multiverse TR CAD· 21.06% MSCI EAFE GR CAD· 17.94% S&P 500 TR CAD
Source: The Globe and Mail Inc.

Volatility meter
Based on 3 year standard deviation of the Fund
Low (1) High (25)
. 6
TARGET DATE Code 2040
Manulife Retirement Date 2040 Fund
Fixed Income 16.43%
International Equity 16.76%
Global Equity 7.96%
Mortgage 1.17%
Canadian Equity 30.93%
Real Estate 3.62%U.S. Equity 23.13%
How the fund is invested
Top Target Allocation of the FundMAM US Equity Index Pooled Fund 10.05%MAM Strategic Income Pooled 9.26%MLI Cdn Large Cap Value Eq (MAM) 8.24%MLI International Eq (Templeton) 7.96%MLI World Investment (Mawer) 7.96%MLI Pure Canadian Equity Grw (MAM) 6.71%MLI U.S. Large Cap Val (T. Rowe) 6.68%MLI U.S. Div Grwth Eq (Wellington) 6.40%MLI CC&L Q Core Canadian Equity 6.04%MLI Franklin Bissett Cdn Eq 6.04%MAM EAFE Equity Index Pooled 4.68%MLI Emerging Market Value (DFA) 4.12%MLI Cdn Bond (MAM) 3.70%MLI Canadian Real Estate Investment 3.62%MLI Canadian Small Cap Value (FGP) 1.83%MLI Cdn Growth Opportunities (MAM) 1.82%MLI Fixed Income Plus (AB) 1.62%MLI Mortgage Backed Fund (MAM) 1.17%MAM Cdn Bond Index Pooled Fund 1.16%MLI Cdn Universe Bond (CIBC) 0.69%
Primary investment processMulti−manager
Equity style and capitalization
Source: Manulife Investment Management Services
Fixed income style
Source: Manulife Investment Management Services
1 Value Core/Blend Growth
Large
Medium
Small
All Cap
RateAnticipation
YieldEnhancement
SectorTrading
Note: All rates of return are shown before investment management fees or taxeshave been deducted.
The rate of return is used only to illustrate the effects of the compound growthrate and is not intended to reflect the future values or returns in the Fund.
Objective The Fund is managed to provide a balance between current income andgrowth of capital, with emphasis on growth of capital. This fund is diversified by assetclass and investment style with the objective of achieving superior risk−adjusted returns.The Fund will commence with approximately 85% in equities, while the remainder of theFund will be invested in fixed income, mortgages and money market investments. TheFund’s asset mix will gradually decline to approximately 35% in equities in the year 2040.
Managed by Manulife Asset Management Limited − Portfolio Solutions Group
Fund managers Various (please refer to Top Target Allocation of the Fund on this page)
Inception date October 2005 Total assets $266.9 million
Historical gross returnsGross rates of return are shown before investment management fees have beendeducted. The solid area represents the gross returns of the Manulife Fund since itsinception in November 2005.
−40%
−20%
0%
20%
40%
2005 2006 2007 2008 2009 2010 2011 2012 2013 2014
Manulife Retirement Date 2040 Fund
10.9 20.7
11.6
−6.2
13.3
27.0
−27.9 −0.7
17.6
* Only full calendar year returns are shown.
Overall past performanceThis graph shows how a $10,000 investment in this fund would have changed in value over time, based on grossreturns.
$8,000
$10,000
$12,000
$14,000
$16,000
$18,000
$20,000
Dec06 Dec08 Dec10 Dec12 Dec14
Manulife Retirement Date 2040 FundBlend: MLI Retirement Date 2040
$17,964*
$17,346
* For illustration purposes only. Includes mutual/pooled fund performance as indicated. Actual fund performance couldbe expected to vary.
Annual compound returns (As at December 31, 2014)
This table shows the historical annual compound total return of the Fund compared withthe composite benchmark, as outlined in the Rate of return expectation below.
1−year 2−year 3−year 5−yearSince
inception
Manulifeinception
date
10.94% 15.70% 14.30% 9.67% 6.60% Oct 2005Manulife Retirement Date 2040 FundBlend: MLI Retirement Date2040
11.02% 14.34% 12.56% 8.91% −
Rate of return expectation The benchmark for this fund is adjusted quarterly. The benchmark effective January 01, 2015 is asfollows:· 41.20% S&P/TSX Composite TR· 22.25% MSCI EAFE GR CAD· 18.95% S&P 500 TR CAD· 8.80% FTSE TMX Canada Universe· 8.80% Barclays Multiverse TR CAD
Source: The Globe and Mail Inc.

Volatility meter
Based on 3 year standard deviation of the Fund
Low (1) High (25)
. 6
TARGET DATE Code 2045
Manulife Retirement Date 2045 Fund
Fixed Income 14.86%
Mortgage 0.95%
Global Equity 8.12%
International Equity 17.14%
Canadian Equity 31.62%
Real Estate 3.71%U.S. Equity 23.60%
How the fund is invested
Top Target Allocation of the FundMAM US Equity Index Pooled Fund 10.28%MLI Cdn Large Cap Value Eq (MAM) 8.41%MAM Strategic Income Pooled 8.37%MLI International Eq (Templeton) 8.12%MLI World Investment (Mawer) 8.12%MLI Pure Canadian Equity Grw (MAM) 6.87%MLI U.S. Large Cap Val (T. Rowe) 6.81%MLI U.S. Div Grwth Eq (Wellington) 6.51%MLI CC&L Q Core Canadian Equity 6.17%MLI Franklin Bissett Cdn Eq 6.16%MAM EAFE Equity Index Pooled 4.81%MLI Emerging Market Value (DFA) 4.21%MLI Canadian Real Estate Investment 3.71%MLI Cdn Bond (MAM) 3.35%MLI Canadian Small Cap Value (FGP) 1.88%MLI Cdn Growth Opportunities (MAM) 1.88%MLI Fixed Income Plus (AB) 1.46%MAM Cdn Bond Index Pooled Fund 1.05%MLI Mortgage Backed Fund (MAM) 0.95%MLI Cdn Universe Bond (CIBC) 0.63%
Primary investment processMulti−manager
Equity style and capitalization
Source: Manulife Investment Management Services
Fixed income style
Source: Manulife Investment Management Services
1 Value Core/Blend Growth
Large
Medium
Small
All Cap
RateAnticipation
YieldEnhancement
SectorTrading
Note: All rates of return are shown before investment management fees or taxeshave been deducted.
The rate of return is used only to illustrate the effects of the compound growthrate and is not intended to reflect the future values or returns in the Fund.
Objective The Fund is managed to provide a balance between current income andgrowth of capital, with emphasis on growth of capital. This fund is diversified by assetclass and investment style with the objective of achieving superior risk−adjusted returns.The Fund will commence with approximately 85% in equities, while the remainder of theFund will be invested in fixed income, mortgages and money market investments. TheFund’s asset mix will gradually decline to approximately 35% in equities in the year 2045.
Managed by Manulife Asset Management Limited − Portfolio Solutions Group
Fund managers Various (please refer to Top Target Allocation of the Fund on this page)
Inception date May 2007 Total assets $203.2 million
Historical gross returnsGross rates of return are shown before investment management fees have beendeducted. The solid area represents the gross returns of the Manulife fund since itsinception in June 2007.
−40%
−20%
0%
20%
40%
2005 2006 2007 2008 2009 2010 2011 2012 2013 2014
Manulife Retirement Date 2045 Fund
11.0 21.0
11.6
−6.5
13.3
27.4
−28.1
* Only full calendar year returns are shown.
Overall past performanceThis graph shows how a $10,000 investment in this fund would have changed in value over time, based on grossreturns.
$6,000
$7,000
$8,000
$9,000
$10,000
$11,000
$12,000
$13,000
$14,000
Dec07 Dec08 Dec09 Dec10 Dec11 Dec12 Dec13 Dec14
Manulife Retirement Date 2045 Fund Blend: MLI Retirement Date 2045
$13,590*
$13,322
* For illustration purposes only. Includes mutual/pooled fund performance as indicated. Actual fund performance couldbe expected to vary.
Annual compound returns (As at December 31, 2014)
This table shows the historical annual compound total return of the Fund compared withthe composite benchmark, as outlined in the Rate of return expectation below.
1−year 2−year 3−year 5−yearSince
inception
Manulifeinception
date
11.00% 15.91% 14.46% 9.72% 4.13% May 2007Manulife Retirement Date 2045 FundBlend: MLI Retirement Date2045
11.11% 14.55% 12.73% 8.98% −
Rate of return expectation The benchmark for this fund is adjusted quarterly. The benchmark effective January 01, 2015 is asfollows:· 42.10% S&P/TSX Composite TR· 22.73% MSCI EAFE GR CAD· 19.37% S&P 500 TR CAD· 7.90% FTSE TMX Canada Universe· 7.90% Barclays Multiverse TR CAD
Source: The Globe and Mail Inc.

Volatility meter
Based on 3 year standard deviation of the Fund
Low (1) High (25)
. 6
TARGET DATE Code 2050
Manulife Retirement Date 2050 Fund
Fixed Income 14.14%
Mortgage 0.66%
Global Equity 8.21%
International Equity 17.36%
Canadian Equity 32.00%
Real Estate 3.76%U.S. Equity 23.87%
How the fund is invested
Top Target Allocation of the FundMAM US Equity Index Pooled Fund 10.40%MLI Cdn Large Cap Value Eq (MAM) 8.51%MLI International Eq (Templeton) 8.21%MLI World Investment (Mawer) 8.21%MAM Strategic Income Pooled 7.96%MLI Pure Canadian Equity Grw (MAM) 6.96%MLI U.S. Large Cap Val (T. Rowe) 6.89%MLI U.S. Div Grwth Eq (Wellington) 6.58%MLI CC&L Q Core Canadian Equity 6.23%MLI Franklin Bissett Cdn Eq 6.23%MAM EAFE Equity Index Pooled 4.89%MLI Emerging Market Value (DFA) 4.26%MLI Canadian Real Estate Investment 3.76%MLI Cdn Bond (MAM) 3.19%MLI Canadian Small Cap Value (FGP) 1.91%MLI Cdn Growth Opportunities (MAM) 1.91%MLI Fixed Income Plus (AB) 1.39%MAM Cdn Bond Index Pooled Fund 1.00%MLI Mortgage Backed Fund (MAM) 0.66%MLI Cdn Universe Bond (CIBC) 0.60%
Primary investment processMulti−manager
Equity style and capitalization
Source: Manulife Investment Management Services
Fixed income style
Source: Manulife Investment Management Services
1 Value Core/Blend Growth
Large
Medium
Small
All Cap
RateAnticipation
YieldEnhancement
SectorTrading
Note: All rates of return are shown before investment management fees or taxeshave been deducted.
The rate of return is used only to illustrate the effects of the compound growthrate and is not intended to reflect the future values or returns in the Fund.
Objective The Fund is managed to provide a balance between current income andgrowth of capital, with emphasis on growth of capital. This fund is diversified by assetclass and investment style with the objective of achieving superior risk−adjusted returns.The Fund will commence with approximately 85% in equities, while the remainder of theFund will be invested in fixed income, mortgages and money market investments. TheFund’s asset mix will gradually decline to approximately 35% in equities in the year 2050.
Managed by Manulife Asset Management Limited − Portfolio Solutions Group
Fund managers Various (please refer to Top Target Allocation of the Fund on this page)
Inception date May 2007 Total assets $194.0 million
Historical gross returnsGross rates of return are shown before investment management fees have beendeducted. The solid area represents the gross returns of the Manulife fund since itsinception in June 2007.
−40%
−20%
0%
20%
40%
2005 2006 2007 2008 2009 2010 2011 2012 2013 2014
Manulife Retirement Date 2050 Fund
11.1 21.4
11.7
−6.6
13.4
27.8
−28.6
* Only full calendar year returns are shown.
Overall past performanceThis graph shows how a $10,000 investment in this fund would have changed in value over time, based on grossreturns.
$6,000
$7,000
$8,000
$9,000
$10,000
$11,000
$12,000
$13,000
$14,000
Dec07 Dec08 Dec09 Dec10 Dec11 Dec12 Dec13 Dec14
Manulife Retirement Date 2050 FundBlend: MLI Retirement Date 2050
$13,567*
$13,300
* For illustration purposes only. Includes mutual/pooled fund performance as indicated. Actual fund performance couldbe expected to vary.
Annual compound returns (As at December 31, 2014)
This table shows the historical annual compound total return of the Fund compared withthe composite benchmark, as outlined in the Rate of return expectation below.
1−year 2−year 3−year 5−yearSince
inception
Manulifeinception
date
11.07% 16.11% 14.61% 9.77% 4.11% May 2007Manulife Retirement Date 2050 FundBlend: MLI Retirement Date2050
11.15% 14.70% 12.84% 9.02% −
Rate of return expectation The benchmark for this fund is adjusted quarterly. The benchmark effective January 01, 2015 is asfollows:· 42.60% S&P/TSX Composite TR· 23.00% MSCI EAFE GR CAD· 19.60% S&P 500 TR CAD· 7.40% FTSE TMX Canada Universe· 7.40% Barclays Multiverse TR CAD
Source: The Globe and Mail Inc.

Volatility meter
Insufficient history to produce a volatility rating
Low (1) High (25)
TARGET DATE Code 2055
Manulife Retirement Date 2055 Fund
Fixed Income 12.87%
Mortgage 0.93%
Global Equity 8.29%
International Equity 17.56%
U.S. Equity 24.14%
Real Estate 3.81%Canadian Equity 32.40%
How the fund is invested
Top Target Allocation of the Fund
MAM US Equity Index Pooled Fund 10.53%MLI Cdn Large Cap Value Eq (MAM) 8.62%MLI International Eq (Templeton) 8.29%MLI World Investment (Mawer) 8.29%MAM Strategic Income Pooled 7.25%MLI Pure Canadian Equity Grw (MAM) 7.04%MLI U.S. Large Cap Val (T. Rowe) 6.97%MLI U.S. Div Grwth Eq (Wellington) 6.64%MLI CC&L Q Core Canadian Equity 6.30%MLI Franklin Bissett Cdn Eq 6.30%MAM EAFE Equity Index Pooled 4.96%MLI Emerging Market Value (DFA) 4.31%MLI Canadian Real Estate Investment 3.81%MLI Cdn Bond (MAM) 2.90%MLI Canadian Small Cap Value (FGP) 1.95%MLI Cdn Growth Opportunities (MAM) 1.94%MLI Fixed Income Plus (AB) 1.27%MLI Mortgage Backed Fund (MAM) 0.93%MAM Cdn Bond Index Pooled Fund 0.91%MLI Cdn Universe Bond (CIBC) 0.54%
Note: All rates of return are shown before investment management fees or taxeshave been deducted.
The rate of return is used only to illustrate the effects of the compound growthrate and is not intended to reflect the future values or returns in the Fund.
Objective The Fund is managed to provide a balance between current income andgrowth of capital, with emphasis on growth of capital. This fund is diversified by assetclass and investment style with the objective of achieving superior risk−adjusted returns.The Fund will commence with approximately 85% in equities, while the remainder of theFund will be invested in fixed income, mortgages and money market investments. TheFund’s asset mix will gradually decline to approximately 35% in equities in the year 2055.
Managed by Manulife Asset Management Limited − Portfolio Solutions Group
Fund managers Various (please refer to Top Target Allocation of the Fund on this page)
Inception date September 2014 Total assets $2.5 million
Historical gross returnsGross rates of return are shown before investment management fees have beendeducted. The shaded area represents the returns of the underlying fund for the periodbefore the start date of the Manulife Fund.
* Only full calendar year returns are shown.
Overall past performanceThis graph shows how a $10,000 investment in this fund would have changed in value over time, based on grossreturns.
$9,975
$9,980
$9,985
$9,990
$9,995
$10,000
Sep14 Oct14 Nov14 Dec14
Manulife Retirement Date 2055 Fund Blend: MLI Retirement Date 2055
$10,000*
$9,978
* For illustration purposes only. Includes mutual/pooled fund performance as indicated. Actual fund performance couldbe expected to vary.
Annual compound returns (As at December 31, 2014)
This table shows the historical annual compound total return of the Fund compared withthe composite benchmark, as outlined in the Rate of return expectation below.
1−year 2−year 3−year 5−yearSince
inception
Manulifeinception
date
− − − − Sep 2014Manulife Retirement Date 2055 FundBlend: MLI Retirement Date2055
− − − − −
Rate of return expectation The benchmark for this fund is adjusted quarterly. The benchmark effective January 01, 2015 is asfollows:· 43.10% S&P/TSX Composite TR· 23.27% MSCI EAFE GR CAD· 19.83% S&P 500 TR CAD· 6.90% FTSE TMX Canada Universe· 6.90% Barclays Multiverse TR CAD
Source: The Globe and Mail Inc.
−
Primary investment processMulti−manager
Equity style and capitalization
Source: Manulife Investment Management Services
Fixed income style
Source: Manulife Investment Management Services
1 Value Core/Blend Growth
Large
Medium
Small
All Cap
RateAnticipation
YieldEnhancement
SectorTrading

Volatility meter
Based on 3 year standard deviation of the Fund
Low (1) High (25)
. 2
ASSET ALLOCATION Code 2001
Manulife Conservative Asset Allocation Fund
Fixed Income 68.75%
Global Equity 1.75%
U.S. Equity 6.00%
Real Estate 0.75%
International Equity 4.50%
Canadian Equity 7.00%Mortgage 11.25%
How the fund is invested
Top Target Allocation of the FundMLI Cdn Bond (MAM) 24.50%MAM Strategic Income Pooled 20.00%MLI Mortgage Backed Fund (MAM) 11.25%MLI Fixed Income Plus (AB) 10.50%MAM Cdn Bond Index Pooled Fund 8.25%MLI Cdn Universe Bond (CIBC) 5.50%MAM US Equity Index Pooled Fund 2.50%MLI Cdn Large Cap Value Eq (MAM) 2.00%MAM EAFE Equity Index Pooled 1.75%MLI International Eq (Templeton) 1.75%MLI World Investment (Mawer) 1.75%MLI U.S. Large Cap Val (T. Rowe) 1.75%MLI U.S. Div Grwth Eq (Wellington) 1.75%MLI Pure Canadian Equity Grw (MAM) 1.75%MLI CC&L Q Core Canadian Equity 1.50%MLI Franklin Bissett Cdn Eq 1.50%MLI Emerging Market Value (DFA) 1.00%MLI Canadian Real Estate Investment 0.75%MAM Canadian Equity Index Pooled 0.25%
Primary investment processMulti−manager
Equity style and capitalization
Source: Manulife Investment Management Services
Fixed income style
Source: Manulife Investment Management Services
1 Value Core/Blend Growth
Large
Medium
Small
All Cap
RateAnticipation
YieldEnhancement
SectorTrading
Note: All rates of return are shown before investment management fees or taxeshave been deducted.
The rate of return is used only to illustrate the effects of the compound growthrate and is not intended to reflect the future values or returns in the Fund.
Objective The Manulife Conservative Asset Allocation Fund is managed to provide ahigh level of current income and capital preservation with some consideration given togrowth of capital. This fund is diversified by asset class and investment styles with theobjective of achieving superior risk−adjusted returns over the long term. The Fund willgenerally maintain 80% of its investments in fixed income funds and 20% in equityfunds, though each segment may vary up to 10% from time to time.
Managed by Manulife Asset Management Limited − Portfolio Solutions Group
Fund managers Various (please refer to Top Target Allocation of the Fund on this page)
Inception date January 1999 Total assets $562.8 million
Historical gross returnsGross rates of return are shown before investment management fees have beendeducted. The solid area represents the gross returns of the Manulife Fund since itsinception in February 1999.
−5%
0%
5%
10%
15%
2005 2006 2007 2008 2009 2010 2011 2012 2013 2014
Manulife Conservative Asset Allocation Fund
9.0
4.7 6.8
4.2
7.5
10.9
−4.1
2.8
7.7 7.8
* Only full calendar year returns are shown.
Overall past performanceThis graph shows how a $10,000 investment in this fund would have changed in value over time, based on grossreturns.
$10,000
$11,000
$12,000
$13,000
$14,000
$15,000
$16,000
$17,000
$18,000
Dec04 Dec06 Dec08 Dec10 Dec12 Dec14
Manulife Conservative Asset Allocation Fund Blend: MLI Conservative Asset Allocation
$17,333*
$16,806
* For illustration purposes only. Includes mutual/pooled fund performance as indicated. Actual fund performance couldbe expected to vary.
Annual compound returns (As at December 31, 2014)
This table shows the historical annual compound total return of the Fund compared withthe composite benchmark, as outlined in the Rate of return expectation below.
1−year 2−year 3−year 5−yearSince
inception
Manulifeinception
date
Manulife Conservative Asset Allocation Fund
9.04% 6.87% 6.83% 6.42% 5.76% Jan 1999
Blend: MLI ConservativeAsset Allocation
8.31% 5.86% 5.42% 5.71% −
Rate of return expectation Over the long term, the Fund attempts to outperform a benchmark portfolio that is comprised of thefollowing:· 60.0% FTSE TMX Canada Universe Bond· 20.0% Barclays Multiverse· 10.0% S&P/TSX Total Return Index· 4.6% S&P 500 Total Return Index ($Cdn)· 5.4% MSCI EAFE Total Return Index ($Cdn)
Effective May 1, 2010, assets in this fund reflect GRS assets exclusively. Performance data for periodsbeginning after May 1, 2010 will reflect detail strictly for the GRS fund. Data for periods that beganprior to May 1 will continue to reflect detail for the combined fund.
Source: The Globe and Mail Inc.

Volatility meter
Based on 3 year standard deviation of the Fund
Low (1) High (25)
. 3
ASSET ALLOCATION Code 2002
Manulife Moderate Asset Allocation Fund
Fixed Income 51.75%
Global Equity 3.75%
International Equity 8.75%
Real Estate 2.00%
Mortgage 8.25%
U.S. Equity 11.50%Canadian Equity 14.00%
How the fund is invested
Top Target Allocation of the FundMAM Strategic Income Pooled 18.00%MLI Cdn Bond (MAM) 16.75%MLI Mortgage Backed Fund (MAM) 8.25%MLI Fixed Income Plus (AB) 7.25%MAM Cdn Bond Index Pooled Fund 5.50%MAM US Equity Index Pooled Fund 5.00%MLI Cdn Universe Bond (CIBC) 4.25%MLI Cdn Large Cap Value Eq (MAM) 4.00%MLI International Eq (Templeton) 3.75%MLI World Investment (Mawer) 3.75%MLI Pure Canadian Equity Grw (MAM) 3.25%MLI U.S. Large Cap Val (T. Rowe) 3.25%MLI U.S. Div Grwth Eq (Wellington) 3.25%MAM EAFE Equity Index Pooled 3.00%MLI CC&L Q Core Canadian Equity 2.75%MLI Franklin Bissett Cdn Eq 2.75%MLI Emerging Market Value (DFA) 2.00%MLI Canadian Real Estate Investment 2.00%MLI Cdn Growth Opportunities (MAM) 0.50%MLI Canadian Small Cap Value (FGP) 0.50%
Primary investment processMulti−manager
Equity style and capitalization
Source: Manulife Investment Management Services
Fixed income style
Source: Manulife Investment Management Services
1 Value Core/Blend Growth
Large
Medium
Small
All Cap
RateAnticipation
YieldEnhancement
SectorTrading
Note: All rates of return are shown before investment management fees or taxeshave been deducted.
The rate of return is used only to illustrate the effects of the compound growthrate and is not intended to reflect the future values or returns in the Fund.
Objective The Manulife Moderate Asset Allocation Fund is managed to provide abalance between current income and growth of capital with a greater emphasis onincome and capital preservation. This fund is diversified by asset class and investmentstyles with the objective of achieving superior risk−adjusted returns over the long term.The Fund will generally maintain 60% of its investments in fixed income funds and 40%in equity funds, though each segment may vary up to 10% from time to time.
Managed by Manulife Asset Management Limited − Portfolio Solutions Group
Fund managers Various (please refer to Top Target Allocation of the Fund on this page)
Inception date January 1999 Total assets $574.8 million
Historical gross returnsGross rates of return are shown before investment management fees have beendeducted. The solid area represents the gross returns of the Manulife Fund since itsinception in February 1999.
−20%
−10%
0%
10%
20%
2005 2006 2007 2008 2009 2010 2011 2012 2013 2014
Manulife Moderate Asset Allocation Fund
9.6 9.5 8.5
1.0
9.0
14.6
−10.8 2.1
10.5 9.7
* Only full calendar year returns are shown.
Overall past performanceThis graph shows how a $10,000 investment in this fund would have changed in value over time, based on grossreturns.
$10,000
$11,000
$12,000
$13,000
$14,000
$15,000
$16,000
$17,000
$18,000
$19,000
Dec04 Dec06 Dec08 Dec10 Dec12 Dec14
Manulife Moderate Asset Allocation FundBlend: MLI Moderate Asset Allocation
$18,120* $18,197
* For illustration purposes only. Includes mutual/pooled fund performance as indicated. Actual fund performance couldbe expected to vary.
Annual compound returns (As at December 31, 2014)
This table shows the historical annual compound total return of the Fund compared withthe composite benchmark, as outlined in the Rate of return expectation below.
1−year 2−year 3−year 5−yearSince
inception
Manulifeinception
date
Manulife Moderate AssetAllocation Fund
9.56% 9.53% 9.18% 7.45% 6.12% Jan 1999
Blend: MLI Moderate AssetAllocation
9.42% 8.49% 7.75% 7.16% −
Rate of return expectation Over the long term, the Fund attempts to outperform a benchmark portfolio that is comprised of thefollowing:· 42.0% FTSE TMX Canada Universe Bond· 18.0% Barclays Multiverse· 20.0% S&P/TSX Total Return Index· 10.8% MSCI EAFE Total Return Index ($Cdn)· 9.2% S&P 500 Total Return Index ($Cdn)
Effective May 1, 2010, assets in this fund reflect GRS assets exclusively. Performance data for periodsbeginning after May 1, 2010 will reflect detail strictly for the GRS fund. Data for periods that beganprior to May 1 will continue to reflect detail for the combined fund.
Source: The Globe and Mail Inc.
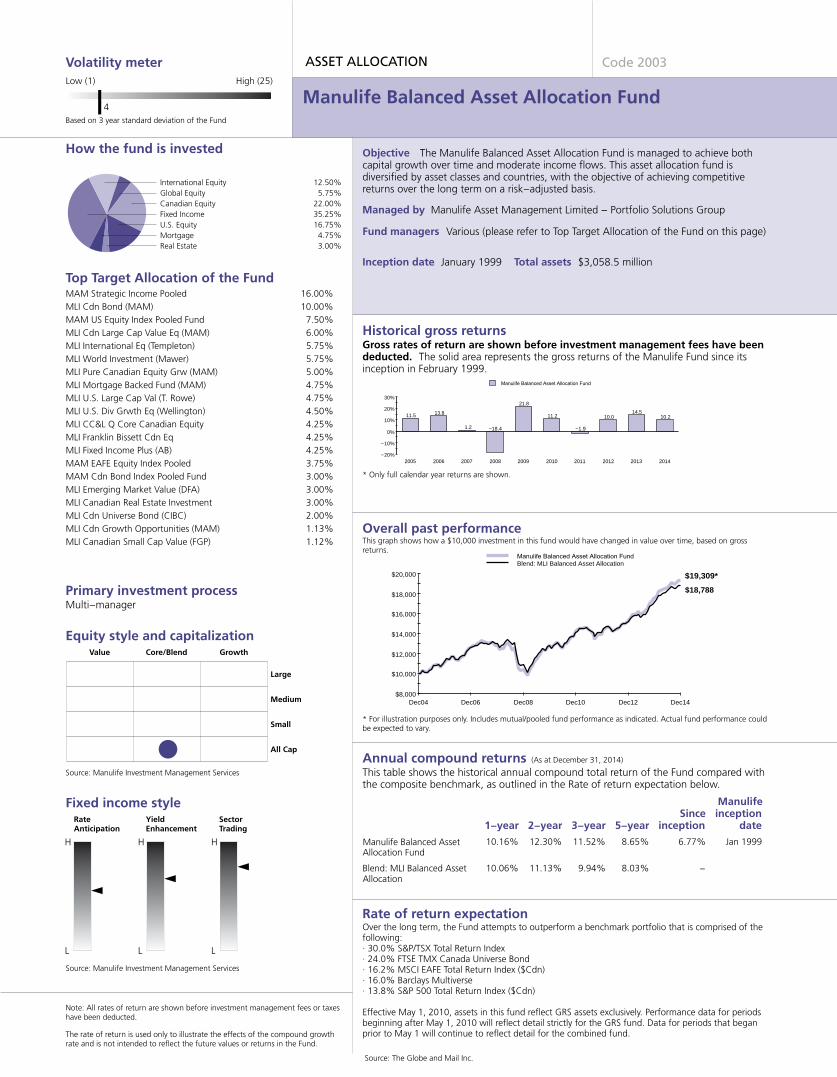
Volatility meter
Based on 3 year standard deviation of the Fund
Low (1) High (25)
. 4
ASSET ALLOCATION Code 2003
Manulife Balanced Asset Allocation Fund
International Equity 12.50%
Real Estate 3.00%
Global Equity 5.75%
Mortgage 4.75%
Canadian Equity 22.00%
U.S. Equity 16.75%Fixed Income 35.25%
How the fund is invested
Top Target Allocation of the FundMAM Strategic Income Pooled 16.00%MLI Cdn Bond (MAM) 10.00%MAM US Equity Index Pooled Fund 7.50%MLI Cdn Large Cap Value Eq (MAM) 6.00%MLI International Eq (Templeton) 5.75%MLI World Investment (Mawer) 5.75%MLI Pure Canadian Equity Grw (MAM) 5.00%MLI Mortgage Backed Fund (MAM) 4.75%MLI U.S. Large Cap Val (T. Rowe) 4.75%MLI U.S. Div Grwth Eq (Wellington) 4.50%MLI CC&L Q Core Canadian Equity 4.25%MLI Franklin Bissett Cdn Eq 4.25%MLI Fixed Income Plus (AB) 4.25%MAM EAFE Equity Index Pooled 3.75%MAM Cdn Bond Index Pooled Fund 3.00%MLI Emerging Market Value (DFA) 3.00%MLI Canadian Real Estate Investment 3.00%MLI Cdn Universe Bond (CIBC) 2.00%MLI Cdn Growth Opportunities (MAM) 1.13%MLI Canadian Small Cap Value (FGP) 1.12%
Primary investment processMulti−manager
Equity style and capitalization
Source: Manulife Investment Management Services
Fixed income style
Source: Manulife Investment Management Services
1 Value Core/Blend Growth
Large
Medium
Small
All Cap
RateAnticipation
YieldEnhancement
SectorTrading
Note: All rates of return are shown before investment management fees or taxeshave been deducted.
The rate of return is used only to illustrate the effects of the compound growthrate and is not intended to reflect the future values or returns in the Fund.
Objective The Manulife Balanced Asset Allocation Fund is managed to achieve bothcapital growth over time and moderate income flows. This asset allocation fund isdiversified by asset classes and countries, with the objective of achieving competitivereturns over the long term on a risk−adjusted basis.
Managed by Manulife Asset Management Limited − Portfolio Solutions Group
Fund managers Various (please refer to Top Target Allocation of the Fund on this page)
Inception date January 1999 Total assets $3,058.5 million
Historical gross returnsGross rates of return are shown before investment management fees have beendeducted. The solid area represents the gross returns of the Manulife Fund since itsinception in February 1999.
−20%
−10%
0%
10%
20%
30%
2005 2006 2007 2008 2009 2010 2011 2012 2013 2014
Manulife Balanced Asset Allocation Fund
10.2 14.5
10.0
−1.9
11.2
21.8
−18.4 1.2
13.8 11.5
* Only full calendar year returns are shown.
Overall past performanceThis graph shows how a $10,000 investment in this fund would have changed in value over time, based on grossreturns.
$8,000
$10,000
$12,000
$14,000
$16,000
$18,000
$20,000
Dec04 Dec06 Dec08 Dec10 Dec12 Dec14
Manulife Balanced Asset Allocation FundBlend: MLI Balanced Asset Allocation
$19,309*
$18,788
* For illustration purposes only. Includes mutual/pooled fund performance as indicated. Actual fund performance couldbe expected to vary.
Annual compound returns (As at December 31, 2014)
This table shows the historical annual compound total return of the Fund compared withthe composite benchmark, as outlined in the Rate of return expectation below.
1−year 2−year 3−year 5−yearSince
inception
Manulifeinception
date
Manulife Balanced AssetAllocation Fund
10.16% 12.30% 11.52% 8.65% 6.77% Jan 1999
Blend: MLI Balanced AssetAllocation
10.06% 11.13% 9.94% 8.03% −
Rate of return expectation Over the long term, the Fund attempts to outperform a benchmark portfolio that is comprised of thefollowing:· 30.0% S&P/TSX Total Return Index· 24.0% FTSE TMX Canada Universe Bond· 16.2% MSCI EAFE Total Return Index ($Cdn)· 16.0% Barclays Multiverse· 13.8% S&P 500 Total Return Index ($Cdn)
Effective May 1, 2010, assets in this fund reflect GRS assets exclusively. Performance data for periodsbeginning after May 1, 2010 will reflect detail strictly for the GRS fund. Data for periods that beganprior to May 1 will continue to reflect detail for the combined fund.
Source: The Globe and Mail Inc.

Volatility meter
Based on 3 year standard deviation of the Fund
Low (1) High (25)
. 6
ASSET ALLOCATION Code 2004
Manulife Growth Asset Allocation Fund
International Equity 16.25%
Mortgage 2.25%
Global Equity 7.75%
Fixed Income 17.75%
U.S. Equity 22.50%
Real Estate 3.50%Canadian Equity 30.00%
How the fund is invested
Top Target Allocation of the FundMAM Strategic Income Pooled 10.00%MAM US Equity Index Pooled Fund 9.75%MLI Cdn Large Cap Value Eq (MAM) 8.00%MLI International Eq (Templeton) 7.75%MLI World Investment (Mawer) 7.75%MLI Pure Canadian Equity Grw (MAM) 6.50%MLI U.S. Large Cap Val (T. Rowe) 6.50%MLI U.S. Div Grwth Eq (Wellington) 6.25%MLI CC&L Q Core Canadian Equity 5.88%MLI Franklin Bissett Cdn Eq 5.87%MAM EAFE Equity Index Pooled 4.50%MLI Emerging Market Value (DFA) 4.00%MLI Cdn Bond (MAM) 4.00%MLI Canadian Real Estate Investment 3.50%MLI Mortgage Backed Fund (MAM) 2.25%MLI Canadian Small Cap Value (FGP) 1.75%MLI Fixed Income Plus (AB) 1.75%MLI Cdn Growth Opportunities (MAM) 1.75%MAM Cdn Bond Index Pooled Fund 1.25%MLI Cdn Universe Bond (CIBC) 0.75%
Primary investment processMulti−manager
Equity style and capitalization
Source: Manulife Investment Management Services
Fixed income style
Source: Manulife Investment Management Services
1 Value Core/Blend Growth
Large
Medium
Small
All Cap
RateAnticipation
YieldEnhancement
SectorTrading
Note: All rates of return are shown before investment management fees or taxeshave been deducted.
The rate of return is used only to illustrate the effects of the compound growthrate and is not intended to reflect the future values or returns in the Fund.
Objective The Manulife Growth Asset Allocation Fund is managed to provide long−term growth of capital with some consideration given to current income. This fund isdiversified by asset class and investment styles with the objective of achieving superiorrisk−adjusted returns over the long term. The Fund will generally maintain 80% of itsinvestments in equity funds and 20% in fixed income funds though each segment mayvary up to 10% from time to time.
Managed by Manulife Asset Management Limited − Portfolio Solutions Group
Fund managers Various (please refer to Top Target Allocation of the Fund on this page)
Inception date January 1999 Total assets $1,318.5 million
Historical gross returnsGross rates of return are shown before investment management fees have beendeducted. The solid area represents the gross returns of the Manulife Fund since itsinception in February 1999.
−40%
−20%
0%
20%
40%
2005 2006 2007 2008 2009 2010 2011 2012 2013 2014
Manulife Growth Asset Allocation Fund
10.8 19.8
11.4
−5.7
12.6
24.3
−25.5 0.7
16.7 13.6
* Only full calendar year returns are shown.
Overall past performanceThis graph shows how a $10,000 investment in this fund would have changed in value over time, based on grossreturns.
$8,000
$10,000
$12,000
$14,000
$16,000
$18,000
$20,000
Dec04 Dec06 Dec08 Dec10 Dec12 Dec14
Manulife Growth Asset Allocation FundBlend: MLI Growth Asset Allocation
$19,408* $19,640
* For illustration purposes only. Includes mutual/pooled fund performance as indicated. Actual fund performance couldbe expected to vary.
Annual compound returns (As at December 31, 2014)
This table shows the historical annual compound total return of the Fund compared withthe composite benchmark, as outlined in the Rate of return expectation below.
1−year 2−year 3−year 5−yearSince
inception
Manulifeinception
date
ManulifeGrowthAssetAllocation Fund
10.79% 15.22% 13.93% 9.44% 7.17% Jan 1999
Blend: MLI Growth AssetAllocation
10.84% 13.87% 12.18% 8.88% −
Rate of return expectation Over the long term, the Fund attempts to outperform a benchmark portfolio that is comprised of thefollowing:· 40.0% S&P/TSX Total Return Index· 21.6% MSCI EAFE Total Return Index ($Cdn)· 18.4% S&P 500 Total Return Index ($Cdn)· 10.0% FTSE TMX Canada Universe Bond· 10.0% Barclays Multiverse
Effective May 1, 2010, assets in this fund reflect GRS assets exclusively. Performance data for periodsbeginning after May 1, 2010 will reflect detail strictly for the GRS fund. Data for periods that beganprior to May 1 will continue to reflect detail for the combined fund.
Source: The Globe and Mail Inc.

Volatility meter
Based on 3 year standard deviation of the Fund
Low (1) High (25)
. 7
ASSET ALLOCATION Code 2005
Manulife Aggressive Asset Allocation Fund
Global Equity 9.50%
International Equity 20.50%
Real Estate 4.50%
Canadian Equity 37.75%
U.S. Equity 27.75%
How the fund is invested
Top Target Allocation of the FundMAM US Equity Index Pooled Fund 12.25%MLI Cdn Large Cap Value Eq (MAM) 10.00%MLI International Eq (Templeton) 9.50%MLI World Investment (Mawer) 9.50%MLI Pure Canadian Equity Grw (MAM) 8.25%MLI U.S. Large Cap Val (T. Rowe) 8.00%MLI U.S. Div Grwth Eq (Wellington) 7.50%MLI CC&L Q Core Canadian Equity 7.25%MLI Franklin Bissett Cdn Eq 7.25%MAM EAFE Equity Index Pooled 6.00%MLI Emerging Market Value (DFA) 5.00%MLI Canadian Real Estate Investment 4.50%MLI Canadian Small Cap Value (FGP) 2.38%MLI Cdn Growth Opportunities (MAM) 2.37%MAM Canadian Equity Index Pooled 0.25%
Primary investment processMulti−manager
Equity style and capitalization
Source: Manulife Investment Management Services
1 Value Core/Blend Growth
Large
Medium
Small
All Cap
Note: All rates of return are shown before investment management fees or taxeshave been deducted.
The rate of return is used only to illustrate the effects of the compound growthrate and is not intended to reflect the future values or returns in the Fund.
Objective The Manulife Aggressive Asset Allocation Fund investment objective is toprovide long−term growth of capital. Typically, this fund will maintain an asset mix ofapproximately 100% equities.
Managed by Manulife Asset Management Limited − Portfolio Solutions Group
Fund managers Various (please refer to Top Target Allocation of the Fund on this page)
Inception date January 1999 Total assets $695.4 million
Historical gross returnsGross rates of return are shown before investment management fees have beendeducted. The solid area represents the gross returns of the Manulife Fund since itsinception in February 1999.
−40%
−20%
0%
20%
40%
2005 2006 2007 2008 2009 2010 2011 2012 2013 2014
Manulife Aggressive Asset Allocation Fund
11.2
24.6
12.6
−8.8
14.5
29.9
−31.9 0.8
18.9 16.0
* Only full calendar year returns are shown.
Overall past performanceThis graph shows how a $10,000 investment in this fund would have changed in value over time, based on grossreturns.
$8,000
$10,000
$12,000
$14,000
$16,000
$18,000
$20,000
$22,000
Dec04 Dec06 Dec08 Dec10 Dec12 Dec14
Manulife Aggressive Asset Allocation Fund Blend: MLI Aggressive Asset Allocation
$20,033* $20,243
* For illustration purposes only. Includes mutual/pooled fund performance as indicated. Actual fund performance couldbe expected to vary.
Annual compound returns (As at December 31, 2014)
This table shows the historical annual compound total return of the Fund compared withthe composite benchmark, as outlined in the Rate of return expectation below.
1−year 2−year 3−year 5−yearSince
inception
Manulifeinception
date
Manulife Aggressive Asset Allocation Fund
11.19% 17.69% 15.96% 10.24% 7.72% Jan 1999
Blend: MLI Aggressive AssetAllocation
11.74% 16.73% 14.48% 9.72% −
Rate of return expectation Over the long term, the Fund attempts to outperform a benchmark portfolio that is comprised of thefollowing:
· 50.0% S&P/TSX Total Return Index· 27.0% MSCI EAFE Total Return Index ($Cdn)· 23.0% S&P 500 Total Return Index ($Cdn)
Effective May 1, 2010, assets in this fund reflect GRS assets exclusively. Performance data for periodsbeginning after May 1, 2010 will reflect detail strictly for the GRS fund. Data for periods that beganprior to May 1 will continue to reflect detail for the combined fund.
Source: The Globe and Mail Inc.

Volatility meter
Based on 3 year standard deviation of the Fund
Low (1) High (25)
. 0
MONEY MARKET Code 3132
Manulife Canadian Money Market Fund (MAM)
Cash 91.53%
Bond 8.47%
How the underlying fund is invested
Top holdings within the underlying Fund(As at December 31, 2014)
Gov’t of Canada, November 2015 8.26%
CIBC, 2.24%, January 2015 6.26%
Gov’t of Canada, July 2015 6.20%
Gov’t of Canada, September 2015 3.77%
Royal Bank of Canada, 1.36%, September 2015 3.75%
Gov’t of Canada, June 2015 3.73%
Gov’t of Canada, August 2015 3.72%
Gov’t of Canada, October 2015 3.70%
Bank of Nova Scotia, 1.37%, September 2015 3.68%
Plaza Trust, March 2015 3.31%
Fixed income style
Source: Manulife Investment Management Services
RateAnticipation
YieldEnhancement
SectorTrading
Note: All rates of return are shown before investment management fees or taxeshave been deducted.
The rate of return is used only to illustrate the effects of the compound growthrate and is not intended to reflect the future values or returns in the Fund.
UNDERLYING FUND −> Manulife Canadian Money Market Fund (MAM) Objective The Manulife Canadian Money Market Fund is managed to achieve a consistent level of interest income while attempting to preserve capital and maintaining liquidity. This fund invests primarily in money market securities guaranteed by the Government of Canada, its provinces or municipalities, corporations and chartered banks.
Managed by Manulife Asset Management Limited
Fund managers Faisal Rahman, CFA
Inception date January 1999Total assets $797.8 million
Historical gross returnsGross rates of return are shown before investment management fees have beendeducted. The solid area represents the gross returns of the Manulife Fund since itsinception in July 2002.
0.0%
1.0%
2.0%
3.0%
4.0%
5.0%
2005 2006 2007 2008 2009 2010 2011 2012 2013 2014
Manulife Canadian Money Market Fund (MAM)
1.3 1.3 1.3 1.4 0.9
1.3
3.9
4.6 4.0
2.8
* Only full calendar year returns are shown.
Overall past performanceThis graph shows how a $10,000 investment in this fund would have changed in value over time, based on grossreturns.
$10,000
$11,000
$12,000
$13,000
Dec04 Dec06 Dec08 Dec10 Dec12 Dec14
Manulife Canadian Money Market Fund (MAM) FTSE TMX 91 Day Treasury Bill Index
$12,516*
$12,106
* For illustration purposes only. Includes mutual/pooled fund performance as indicated. Actual fund performance couldbe expected to vary.
Annual compound returns (As at December 31, 2014)
This table shows the historical annual compound total return of the Fund compared withthe FTSE TMX 91 Day Treasury Bill Index.
1−year 2−year 3−year 5−yearSince
inception
Manulifeinception
dateManulife anadian Money Market Fund (MAM)
1.29% 1.31% 1.30% 1.26% 2.37% Jun 2002
FTSE TMX 91 Day TreasuryBill Index
0.91% 0.96% 0.98% 0.89% −
Rate of return expectation The Fund is expected to outperform the FTSE TMX 91 Day Treasury Bills.
Source: The Globe and Mail Inc.

Volatility meter
Based on 3 year standard deviation of the Fund
Low (1) High (25)
. 3
FIXED INCOME Code 4131
Manulife Canadian Bond Fund (MAM)
Municipal Bonds 5.76%
Federal Bonds 10.18%
Other 2.60%
Corporate Debentures 49.49%
Provincial Bonds 31.97%
How the underlying fund is invested
Top holdings within the underlying Fund(As at December 31, 2014)
Gov’t of Canada, 3.50%, December 2045 4.47%
Province of Ontario, 3.45%, June 2045 3.37%
Province of Ontario, 2.85%, June 2023 2.94%
Province of Ontario, 3.50%, June 2024 2.30%
Province of Ontario, 3.15%, June 2022 2.06%
CDP Financial, 4.60%, July 2020 2.03%
Province of British Columbia, 4.30%, June 2042 1.82%
Province of British Columbia, 3.20%, June 2044 1.76%
B.C. Municipal Finance, 3.75%, September 2023 1.63%
Gov’t of Canada, 2.75%, December 2048 1.46%
Fixed income style
Source: Manulife Investment Management Services
RateAnticipation
YieldEnhancement
SectorTrading
Note: All rates of return are shown before investment management fees or taxeshave been deducted.
The rate of return is used only to illustrate the effects of the compound growthrate and is not intended to reflect the future values or returns in the Fund.
UNDERLYING FUND −> Manulife Canadian Bond Fund (MAM)Objective The Manulife Canadian Bond Fund is managed to maximize stable, long−term growth through a combination of income and capital appreciation. This fund investsprimarily in securities guaranteed by the Government of Canada, its provinces ormunicipalities, corporations and chartered banks.
Managed by Manulife Asset Management Limited
Fund managers Hosen Marjaee, CFA and Terry Carr, CFA
Inception date January 1999Total assets $1,048.6 million
Historical gross returnsGross rates of return are shown before investment management fees have beendeducted. The solid area represents the gross returns of the Manulife Fund since itsinception in September 1998.
−5.0%
0.0%
5.0%
10.0%
2005 2006 2007 2008 2009 2010 2011 2012 2013 2014
Manulife Canadian Bond Fund (MAM)
8.7
−0.9
5.3
8.5 7.3
8.5
5.1 3.3
4.3
6.5
* Only full calendar year returns are shown.
Overall past performanceThis graph shows how a $10,000 investment in this fund would have changed in value over time, based on grossreturns.
$10,000
$11,000
$12,000
$13,000
$14,000
$15,000
$16,000
$17,000
$18,000
Dec04 Dec06 Dec08 Dec10 Dec12 Dec14
Manulife Canadian Bond Fund (MAM) FTSE TMX Universe Bond Index
$17,281*
$16,796
* For illustration purposes only. Includes mutual/pooled fund performance as indicated. Actual fund performance couldbe expected to vary.
Annual compound returns (As at December 31, 2014)
This table shows the historical annual compound total return of the Fund compared with the FTSE TMX Canada Universe Bond Index.
1−year 2−year 3−year 5−yearSince
inception
Manulifeinception
date
8.73% 3.82% 4.31% 5.72% 5.98% Aug 1998MLI Canadian Bond (MAM) FTSE TMX Universe Bond Index
8.79% 3.68% 3.65% 5.45% −
Rate of return expectation Over the long term, the Fund is expected to outperform the FTSE TMX Canada Universe Bond Index.
Source: The Globe and Mail Inc.

Volatility meter
Based on 3 year standard deviation of the Fund
Low (1) High (25)
. 3
FIXED INCOME Code 4191
Manulife Asset Management Canadian Bond IndexFund
Other 0.18%
Corporate Debentures 30.36%
Municipal Bonds 1.81%
Federal Bonds 36.36%
Provincial Bonds 31.29%
How the underlying fund is invested
Top holdings within the underlying Fund(As at December 31, 2014)
Gov’t of Canada, 1.75%, March 2019 1.62%
Gov’t of Canada, 1.00%, May 2016 1.59%
Gov’t of Canada, 4.25%, June 2018 1.38%
Gov’t of Canada, 2.00%, June 2016 1.37%
Gov’t of Canada, 1.50%, March 2017 1.35%
Gov’t of Canada, 5.75%, June 2033 1.33%
Canada Housing Trust, 2.75%, June 2016 1.25%
Canada Housing Trust, 1.95%, June 2019 1.19%
Gov’t of Canada, 4.00%, June 2041 1.15%
Gov’t of Canada, 3.50%, December 2045 1.15%
Primary investment processIndex
Note: All rates of return are shown before investment management fees or taxeshave been deducted.
The rate of return is used only to illustrate the effects of the compound growthrate and is not intended to reflect the future values or returns in the Fund.
UNDERLYING FUND −> MAM Canadian Bond Index Pooled FundObjective MAM Canadian Bond Index Pooled Fund is managed to provide a rate ofreturn based on the performance of the FTSE TMX Universe Bond Index. This fund seeksto earn returns that replicate, as closely as possible, the FTSE TMX Universe Bond Index.This is a passively managed fund. To achieve its investment objective, the Fund will investdirectly in bonds and may use derivative instruments in order to replicate the securities ofthe FTSE TMX Universe Bond Index.
Managed by Manulife Asset Management Limited
Fund managers Terry Carr, CFA, Andrew Gretzinger, CFA and Hosen Marjaee, CFA
Inception date April 1999Total assets $1,224.4 million
Historical gross returnsGross rates of return are shown before investment management fees have beendeducted. The solid area represents the gross returns of the Manulife Fund since itsinception in October 2001.
−5.0%
0.0%
5.0%
10.0%
2005 2006 2007 2008 2009 2010 2011 2012 2013 2014
MLI MAM Canadian Bond Index Fund
8.8
−1.2
3.6
9.7
6.7 5.3
6.3
3.7 3.9
6.4
* Only full calendar year returns are shown.
Overall past performanceThis graph shows how a $10,000 investment in this fund would have changed in value over time, based on grossreturns.
$10,000
$11,000
$12,000
$13,000
$14,000
$15,000
$16,000
$17,000
Dec04 Dec06 Dec08 Dec10 Dec12 Dec14
MLI MAM Canadian Bond Index Fund FTSE TMX Universe Bond Index
$16,731* $16,796
* For illustration purposes only. Includes mutual/pooled fund performance as indicated. Actual fund performance couldbe expected to vary.
Annual compound returns (As at December 31, 2014)
This table shows the historical annual compound total return of the Fund compared with the FTSE TMX Universe Bond Index.
1−year 2−year 3−year 5−yearSince
inception
Manulifeinception
date
Manulife MAM Canadian Bond Index Fund
8.82% 3.69% 3.66% 5.45% 5.76% Sep 2001
FTSE TMX Universe Bond Index
8.79% 3.68% 3.65% 5.45% −
Rate of return expectation Over the long term, the Fund is expected to track the performance of the FTSE TMX Universe BondTotal Return Idx.
Source: The Globe and Mail Inc.

Volatility meter
Based on 3 year standard deviation of the Fund
Low (1) High (25)
. 4
BALANCED Code 5011
Manulife Balanced Fund
International Equity 8.81%
United States Equity 10.02%
Cash 4.27%
Canadian Equity 36.03%
Bond 40.87%
How the underlying fund is invested
Top holdings within the underlying Fund(As at December 31, 2014)
MLI Canadian Balanced (JF) 32.70%
MLI Canadian Bond (CIBC) 32.67%
MLI Canadian Equity (Mawer) 14.51%
MLI US Equity (Wellington) 10.40%
MLI International Eq (Templeton) 9.31%
MLI Q Core Canadian Eq (CC&L) 0.41%
Primary investment processMulti−manager
Equity style and capitalization
Source: Manulife Investment Management Services
Fixed income style
Source: Manulife Investment Management Services
1 Value Core/Blend Growth
Large
Medium
Small
All Cap
RateAnticipation
YieldEnhancement
SectorTrading
Note: All rates of return are shown before investment management fees or taxeshave been deducted.
The rate of return is used only to illustrate the effects of the compound growthrate and is not intended to reflect the future values or returns in the Fund.
UNDERLYING FUND −> Manulife Balanced Fund (Pension)Objective Investing in a combination of stocks, bonds and short−term securities, thisfund participates in a variety of markets with asset mix decisions left to an investmentprofessional.
Managed by Manulife Financial
Fund managers CIBC Global Asset Management − Mgmt.Team, Jarislowsky Fraser −Mgmt. Team, Wellington Management Co. − Mgmt. Team, Mawer Investment − MgmtTeam and Franklin Templeton − Mgmt. Team
Inception date September 1986Total assets $1,438.8 million
Historical gross returnsGross rates of return are shown before investment management fees have beendeducted. The solid area represents the gross returns of the Manulife Fund since itsinception in September 1986.
−20%
−10%
0%
10%
20%
2005 2006 2007 2008 2009 2010 2011 2012 2013 2014
Manulife Balanced Fund
10.9 15.4
8.8
2.4
11.2
16.5
−13.0 3.1
11.1 12.9
* Only full calendar year returns are shown.
Overall past performanceThis graph shows how a $10,000 investment in this fund would have changed in value over time, based on grossreturns.
$10,000
$12,000
$14,000
$16,000
$18,000
$20,000
$22,000
Dec04 Dec06 Dec08 Dec10 Dec12 Dec14
Manulife Balanced FundBlend: Manulife Balanced
$20,755*
$18,524
* For illustration purposes only. Includes mutual/pooled fund performance as indicated. Actual fund performance couldbe expected to vary.
Annual compound returns (As at December 31, 2014)
This table shows the historical annual compound total return of the Fund compared withthe composite benchmark, as outlined in the Rate of return expectation below.
1−year 2−year 3−year 5−yearSince
inception
Manulifeinception
date
10.91% 13.15% 11.67% 9.64% 7.79% Jun 1997Manulife Balanced Fund
Blend: Manulife Balanced 10.00% 9.45% 8.42% 7.25% −
Rate of return expectation Over the long term, the Fund strives to outperform a benchmark comprised of thefollowing:
· 45% FTSE TMX Universe Bond Index· 35% S&P/TSX Total Return Index· 15% MSCI World ($ Cdn)· 5% FTSE TMX 91 Day Treasury Bills
Source: The Globe and Mail Inc.

Volatility meter
Based on 3 year standard deviation of the Fund
Low (1) High (25)
. 8
CANADIAN LARGE CAP EQUITY Code 7011
Manulife Canadian Equity Fund
Other 11.30%
Information Technology 4.88%
Cash 0.56%
Materials 7.94%
Consumer Discretionary 8.89%
Industrials 11.78%
Energy 20.88%Financials 33.77%
How the underlying fund is invested
Top holdings within the underlying Fund(As at December 31, 2014)
MLI Q Core Canadian Eq (CC&L) 49.56%
MLI Canadian Equity (Greystone) 30.60%
MLI Canadian Equity (Mawer) 12.80%
MLI Canadian Small Cap (Bolton) 7.17%
Primary investment processFundamental, Bottom−up
Equity style and capitalization
Source: Manulife Investment Management Services
1 Value Core/Blend Growth
Large
Medium
Small
All Cap
Note: All rates of return are shown before investment management fees or taxeshave been deducted.
The rate of return is used only to illustrate the effects of the compound growthrate and is not intended to reflect the future values or returns in the Fund.
UNDERLYING FUND −> Manulife Canadian Equity Fund (Pensions) Objective Managed by team of Canada’s top money managers, the Fund provides investors with a portfolio that is diversified by both the stocks it holds and its multiple managers’ investment styles.
Managed by Manulife Financial
Fund managers Montrusco Bolton Inc. − Mgmt. Team, Genus Capital Management −Mgmt. Team, Greystone Mgd. Invest. − Mgmt. Team, Connor, Clark & Lunn − Mgmt.Team and Mawer Investment − Mgmt Team
Inception date January 1980Total assets $243.3 million
Historical gross returnsGross rates of return are shown before investment management fees have beendeducted. The solid area represents the gross returns of the Manulife Fund since itsinception in January 1980.
−40%
−20%
0%
20%
40%
2005 2006 2007 2008 2009 2010 2011 2012 2013 2014
Manulife Canadian Equity Fund
11.0 19.0
6.4−11.7
16.9
31.4
−34.5
12.8 17.2 27.3
* Only full calendar year returns are shown.
Overall past performanceThis graph shows how a $10,000 investment in this fund would have changed in value over time, based on grossreturns.
$8,000
$10,000
$12,000
$14,000
$16,000
$18,000
$20,000
$22,000
Dec04 Dec06 Dec08 Dec10 Dec12 Dec14
Manulife Canadian Equity Fund S&P/TSX Composite TR Index ($CA)
$20,996* $20,793
* For illustration purposes only. Includes mutual/pooled fund performance as indicated. Actual fund performance couldbe expected to vary.
Annual compound returns (As at December 31, 2014)
This table shows the historical annual compound total return of the Fund compared with the S&P/TSX Composite TR Index ($CA).
1−year 2−year 3−year 5−yearSince
inception
Manulifeinception
date
10.97% 14.92% 11.99% 7.71% 8.29% Jun 1997MLI Canadian Equity Fund
S&P/TSX Total Return Index 10.55% 11.77% 10.22% 7.53% −
Rate of return expectation Over the long term, this Fund strives to outperform the S&P TSX Total Return Index.
Source: The Globe and Mail Inc.

Volatility meter
Based on 3 year standard deviation of the Fund
Low (1) High (25)
. 9
CANADIAN LARGE CAP EQUITY Code 7131
Manulife Canadian Large Cap Value Equity Fund(MAM)
Materials 4.67%
Industrials 8.14%
Other 12.71%
Cash 9.74%
Consumer Staples 9.88%
Energy 14.43%
Consumer Discretionary 15.98%Financials 24.45%
How the underlying fund is invested
Top holdings within the underlying Fund(As at December 31, 2014)
Metro Inc. 5.46%
IGM Financial 5.18%
Rogers Communications 3.95%
Imperial Oil 3.83%
Dorel Industries 3.50%
ATCO Ltd. 3.32%
Corus Entertainment 2.93%
TD Bank 2.90%
WestJet Airlines 2.85%
Canadian Tire Corporation 2.84%
Primary investment processFundamental, Bottom−up
Equity style and capitalization
Source: Manulife Investment Management Services
1 Value Core/Blend Growth
Large
Medium
Small
All Cap
Note: All rates of return are shown before investment management fees or taxeshave been deducted.
The rate of return is used only to illustrate the effects of the compound growthrate and is not intended to reflect the future values or returns in the Fund.
UNDERLYING FUND −> Manulife Canadian Large Cap Value EquityFund (MAM)Objective The Manulife Canadian Large Cap Value Equity Fund (MAM) is managed toachieve long−term capital growth. The Fund invests primarily in high−quality large capCanadian Equities including income trusts and convertible instruments.
Managed by Manulife Asset Management Limited
Fund managers Alan Wicks, CFA, Conrad Dabiet, CFA and Jonathan Popper, CIM
Inception date January 1999Total assets $708.1 million
Historical gross returnsGross rates of return are shown before investment management fees have beendeducted. The solid area represents the gross returns of the Manulife Fund since itsinception in July 1997. The underlying fund was changed on September 30, 2002 fromthe Elliott & Page Pooled Canadian Equity Fund to the Manulife Canadian Large CapValue Equity Fund.
−40%
−20%
0%
20%
40%
60%
2005 2006 2007 2008 2009 2010 2011 2012 2013 2014
Manulife Canadian Large Cap Value Equity Fund (MAM)
10.4 20.6 15.2
−13.1
14.1
42.6
−34.6 5.4
15.2 24.3
* Only full calendar year returns are shown.
Overall past performanceThis graph shows how a $10,000 investment in this fund would have changed in value over time, based on grossreturns.
$8,000
$10,000
$12,000
$14,000
$16,000
$18,000
$20,000
$22,000
Dec04 Dec06 Dec08 Dec10 Dec12 Dec14
Manulife Canadian Large Cap Value Equity Fund (MAM) S&P/TSX Composite TR Index ($CA)
$21,405*
$20,793
* For illustration purposes only. Includes mutual/pooled fund performance as indicated. Actual fund performance couldbe expected to vary.
Annual compound returns (As at December 31, 2014)
This table shows the historical annual compound total return of the Fund compared with the S&P/TSX Composite TR Index ($CA).
1−year 2−year 3−year 5−yearSince
inception
Manulifeinception
date
MLI Cdn Large Cap ValueEqu (MAM)
10.36% 15.36% 15.31% 8.74% 6.72% Jun 1997
S&P/TSX Total Return 10.55% 11.77% 10.22% 7.53% −
Rate of return expectation Over the long term, the Fund is expected to outperform the S&P/TSX Composite Total Return Index.
Source: The Globe and Mail Inc.

Volatility meter
Based on 3 year standard deviation of the Fund
Low (1) High (25)
. 8
CANADIAN EQUITY Code 7132
Manulife Asset Management Canadian Equity IndexFund
Materials 10.31%
Telecommunication Services 4.75%
Cash 2.37%
Consumer Discretionary 5.59%
Industrials 8.45%
Other 11.71%
Energy 21.39%Financials 35.43%
How the underlying fund is invested
Top holdings within the underlying Fund(As at December 31, 2014)
Royal Bank of Canada 6.12%
TD Bank 5.42%
Bank of Nova Scotia 4.26%
Canadian National Railway 3.44%
Suncor Energy 2.83%
Bank of Montreal 2.82%
Valeant Pharmaceuticals Intl. 2.73%
Enbridge Inc. 2.68%
BCE Inc. 2.36%
Manulife Financial 2.18%
Primary investment processIndex
Equity style and capitalization
Source: Manulife Investment Management Services
1 Value Core/Blend Growth
Large
Medium
Small
All Cap
Note: All rates of return are shown before investment management fees or taxeshave been deducted.
The rate of return is used only to illustrate the effects of the compound growthrate and is not intended to reflect the future values or returns in the Fund.
UNDERLYING FUND −> MAM Canadian Equity Index Pooled FundObjective The MAM Canadian Equity Index Pooled Fund seeks to track the total returnof the S&P/ TSX Composite Index through investments primarily in common stocks,Income Trusts Royalty trusts, REITS of Canadian issuers which are listed on the S&P/ TSXComposite Index. This is a passively managed fund.
Managed by Manulife Asset Management Limited
Fund manager(s) Carson Jen
Inception date January 1998Total assets $680.3 million
Historical gross returnsGross rates of return are shown before investment management fees have beendeducted. The solid area represents the gross returns of the Manulife Fund since itsinception in January 1998.
−40%
−20%
0%
20%
40%
2005 2006 2007 2008 2009 2010 2011 2012 2013 2014
MLI MAM Canadian Equity Index Fund
10.9 13.0 7.2
−8.7
17.6
35.1
−32.6 10.0
17.5 24.2
* Only full calendar year returns are shown.
Overall past performanceThis graph shows how a $10,000 investment in this fund would have changed in value over time, based on grossreturns.
$8,000
$10,000
$12,000
$14,000
$16,000
$18,000
$20,000
$22,000
$24,000
Dec04 Dec06 Dec08 Dec10 Dec12 Dec14
MLI MAM Canadian Equity Index Fund S&P/TSX Composite TR Index ($CA)
$21,052* $20,793
* For illustration purposes only. Includes mutual/pooled fund performance as indicated. Actual fund performance couldbe expected to vary.
Annual compound returns (As at December 31, 2014)
This table shows the historical annual compound total return of the Fund compared withthe S&P/TSX Total Return.
1−year 2−year 3−year 5−yearSince
inception
Manulifeinception
date
10.86% 11.93% 10.32% 7.58% 7.27% Dec 1997MLI MAM Canadian Equity Index FundS&P/TSX Total Return Index 10.55% 11.77% 10.22% 7.53% −
Rate of return expectation Over the long term, the Fund is expected to track the performance of the S&P/TSX Total Return Index.
Source: The Globe and Mail Inc.

Volatility meter
Based on 3 year standard deviation of the underlying fund
Low (1) High (25)
. 8
CANADIAN LARGE CAP EQUITY Code 7313
Manulife CC&L Group Canadian Q Growth Fund
Cash 0.42%
Consumer Staples 6.06%
Other 10.83%
Materials 9.30%
Consumer Discretionary 10.64%
Industrials 13.16%
Energy 18.96%Financials 30.63%
How the underlying fund is invested
Top holdings within the underlying Fund(As at December 31, 2014)
Royal Bank of Canada 5.96%
Canadian National Railway 5.19%
TD Bank 4.99%
Canadian Natural Resources 4.29%
Suncor Energy 3.99%
TransCanada Corp. 3.67%
Canadian Pacific Railway 3.34%
Magna International 3.33%
Alimentation Couche−Tard 2.94%
CIBC 2.53%
Primary investment processQuantitative
Equity style and capitalization
Source: Manulife Investment Management Services
1 Value Core/Blend Growth
Large
Medium
Small
All Cap
Note: All rates of return are shown before investment management fees or taxeshave been deducted.
The rate of return is used only to illustrate the effects of the compound growthrate and is not intended to reflect the future values or returns in the Fund.
UNDERLYING FUND −> CC&L Group Canadian Q Growth FundObjective The CC&L Group Canadian Q Growth Fund holds various equity securities(including common shares, limited partnerships, royalty and income trusts) traded onrecognized Canadian exchanges, rights, warrants, cash and cash equivalents. Holdings arediversified among S&P/TSX Composite Index industry sectors.
Managed by Connor, Clark & Lunn Investment Management Limited
Fund managers Connor, Clark & Lunn − Mgmt. Team
Inception date January2001Total assets $1,086.2 million
Historical gross returnsGross rates of return are shown before investment management fees have been deducted. The solid area represents the gross returns of the Manulife fund since its inception in May 2012. In order to provide further historical information, the shaded area represents the returns of the underlying fund for the period before the start date of the Manulife Fund.
−40%
−20%
0%
20%
40%
2005 2006 2007 2008 2009 2010 2011 2012 2013 2014
Manulife CC&L Group Canadian Q Growth Fund CC&L Group Canadian Q Growth Fund
11.6
25.4
8.7 −5.9
22.7 28.8
−32.8
13.6 14.5
32.7
* Only full calendar year returns are shown.
Overall past performanceThis graph shows how a $10,000 investment in this fund would have changed in value over time, based on grossreturns.
$8,000
$10,000
$12,000
$14,000
$16,000
$18,000
$20,000
$22,000
$24,000
$26,000
$28,000
Dec04 Dec06 Dec08 Dec10 Dec12 Dec14
Manulife CC&L Group Canadian Q Growth Fund S&P/TSX Composite TR Index ($CA)CC&L Group Canadian Q Growth Fund
$26,256*
$20,793
* For illustration purposes only. Includes mutual/pooled fund performance as indicated. Actual fund performance couldbe expected to vary.
Annual compound returns (As at December 31, 2014)
This table shows the historical annual compound total return of the Fund compared with the S&P/TSX Composite TR Index ($CA).
1−year 2−year 3−year 5−yearSince
inception
Manulifeinception
date
11.57% 18.28% − − 16.02% Apr 2012MLI CC&L Group Canadian Q Growth Fund S&P/TSX Composite TR Index ($CA)
10.55% 11.77% 10.22% 7.53% −
Rate of return expectation Over the long term, the Fund is expected to outperform the S&P/TSX Composite Index by 2.0 % overmoving four−year periods.
Source: The Globe and Mail Inc.

Volatility meter
Based on 3 year standard deviation of the Fund
Low (1) High (25)
. 9
CANADIAN SMALL/MID CAP EQUITY Code 7381
Manulife FGP Small Cap Canadian Equity Fund
Cash 4.32%
Other 7.99%
Consumer Discretionary 15.27%
Financials 16.06%
Energy 10.99%
Consumer Staples 8.29%
Materials 16.98%Industrials 20.10%
How the underlying fund is invested
Top holdings within the underlying Fund(As at December 31, 2014)
Canfor Pulp Products 4.75%Equitable Group 4.39%FGP Short Term Investment Fund 4.38%Transcontinental Inc. 3.83%Intertape Polymer Group 3.82%Western Forest Products 3.34%Algoma Central 3.08%AGT Food and Ingredients 2.87%Dorel Industries 2.83%COGECO Inc. 2.63%Uni−Select Inc. 2.59%Molson Coors Canada 2.53%E−L Financial Corporation 2.52%Savanna Energy Services 2.46%Home Capital Group 2.42%Rocky Mountain Dealerships 2.38%Sherritt International 2.36%Laurentian Bank of Canada 2.33%PHX Energy Services 2.32%Akita Drilling 2.31%
Primary investment processFundamental, Bottom−up
Equity style and capitalization
Source: Manulife Investment Management Services
1 Value Core/Blend Growth
Large
Medium
Small
All Cap
Note: All rates of return are shown before investment management fees or taxeshave been deducted.
The rate of return is used only to illustrate the effects of the compound growthrate and is not intended to reflect the future values or returns in the Fund.
UNDERLYING FUND −> FGP Small Cap Canadian Equity FundObjective The FGP Small Cap Canadian Equity Fund aims to generate an attractive totalinvestment return through long−term capital growth as well as dividend and otherincome. To achieve this, the Fund will invest in a diversified mix of Canadian equitysecurities.
Managed by Foyston Gordon Payne Investment Counsel (FGP)
Fund manager(s) Bryan Pilsworth, CFA, MBA
Inception date February 2002Total assets $424.2 million
Historical gross returnsGross rates of return are shown before investment management fees have been deducted. The solid area represents the gross returns of the Manulife Fund since its inception in June 2008. In order to provide further historical information, the shaded area represents the returns of the underlying fund for the period before the start date of the Manulife Fund.
−40%
−20%
0%
20%
40%
60%
2005 2006 2007 2008 2009 2010 2011 2012 2013 2014
Manulife FGP Small Cap Canadian Equity Fund FGP Small Cap Canadian Equity Fund
6.8
31.0
16.0
−8.9
22.6
56.1
−39.7 11.0
22.4 21.5
* Only full calendar year returns are shown.
Overall past performanceThis graph shows how a $10,000 investment in this fund would have changed in value over time, based on grossreturns.
$5,000
$10,000
$15,000
$20,000
$25,000
$30,000
Dec04 Dec06 Dec08 Dec10 Dec12 Dec14
Manulife FGP Small Cap Canadian Equity Fund BMO Nesbitt Burns CDN Small Cap IndexFGP Small Cap Canadian Equity Fund
$28,483*
$17,461
* For illustration purposes only. Includes mutual/pooled fund performance as indicated. Actual fund performance couldbe expected to vary.
Annual compound returns (As at December 31, 2014)
This table shows the historical annual compound total return of the Fund compared withthe BMO Nesbitt Burns Canadian Small Cap Index.
1−year 2−year 3−year 5−yearSince
inception
Manulifeinception
date
Manulife FGP Small Cap Canadian Equity Fund
6.84% 18.33% 17.54% 12.64% 8.25% May 2008
BMO Nesbitt Burns Canadian Small Cap Index
−0.09% 3.76% 3.32% 5.57% −
Rate of return expectation The Fund is expected to exceed the return of the BMO Nesbitt Burns Canadian Small Cap Index + 1.50% (annualized) over five-year periods.
Source: The Globe and Mail Inc.

Volatility meter
Based on 3 year standard deviation of the Fund
Low (1) High (25)
. 7
U.S. EQUITY Code 8131
Manulife Asset Management U.S. Equity Index Fund
Cash 3.95%
Consumer Staples 8.45%
Health Care 13.33%
Industrials 10.84%
Consumer Discretionary 13.35%
Financials 15.89%
Other 16.52%Information Technology 17.67%
How the underlying fund is invested
Top holdings within the underlying Fund(As at December 31, 2014)
Apple 3.41%
Exxon Mobil 2.06%
Microsoft 2.02%
Federal Home Loan Bank, 0.01%, January 2015 1.86%
Federal Home Loan Bank, 0.01%, March 2015 1.82%
Johnson & Johnson 1.54%
Berkshire Hathaway 1.44%
Wells Fargo & Co. 1.36%
General Electric 1.34%
Procter & Gamble 1.30%
Primary investment processIndex
Equity style and capitalization
Source: Manulife Investment Management Services
1 Value Core/Blend Growth
Large
Medium
Small
All Cap
Note: All rates of return are shown before investment management fees or taxeshave been deducted.
The rate of return is used only to illustrate the effects of the compound growthrate and is not intended to reflect the future values or returns in the Fund.
UNDERLYING FUND −> MAM US Equity Index Pooled FundObjective The Fund aims to achieve investment results that approximate the totalreturn of the S&P 500 Stock Index. To achieve its investment objective, the Fund willinvest directly in common shares and may use derivative instruments such as futures inorder to replicate the returns of the S&P 500 Stock Index. The Fund may also invest aportion of its funds in cash. This is a passively managed fund.
Managed by Manulife Asset Management Limited
Fund manager(s) Carson Jen
Inception date January 1998Total assets $771.1 million
Historical gross returnsGross rates of return are shown before investment management fees have beendeducted. The solid area represents the gross returns of the Manulife Fund since itsinception in January 1998.
−40%
−20%
0%
20%
40%
60%
2005 2006 2007 2008 2009 2010 2011 2012 2013 2014
MLI MAM U.S. Equity Index Fund
23.5
40.8
13.1 4.1 8.9 7.6
−21.8−10.8
15.3
1.3
* Only full calendar year returns are shown.
Overall past performanceThis graph shows how a $10,000 investment in this fund would have changed in value over time, based on grossreturns.
$6,000
$8,000
$10,000
$12,000
$14,000
$16,000
$18,000
$20,000
Dec04 Dec06 Dec08 Dec10 Dec12 Dec14
MLI MAM U.S. Equity Index FundS&P 500 TR Index (Net of 15% Tax − $CA)
$19,566* $19,509
* For illustration purposes only. Includes mutual/pooled fund performance as indicated. Actual fund performance couldbe expected to vary.
Annual compound returns (As at December 31, 2014)
This table shows the historical annual compound total return of the Fund compared withthe S&P 500 Composite TR Index (Net of 15% Withholding Tax − $CA).
1−year 2−year 3−year 5−yearSince
inception
Manulifeinception
date
MLI MAM U.S. Equity Index 23.53% 31.89% 25.28% 17.40% 4.93% Dec 1997
S&P 500 TR Index (Net of15% Tax − $CA)
23.52% 31.93% 25.36% 17.42% −
Rate of return expectation Over the long term, the Fund is expected to outperform the S&P 500, net of 15% withholding tax ($Cdn).
Source: The Globe and Mail Inc.

Volatility meter
Based on 3 year standard deviation of the Fund
Low (1) High (25)
. 8
U.S. LARGE CAP EQUITY Code 8451
Manulife Mawer U.S. Equity Fund
Cash 1.46%
Energy 7.69%
Information Technology 10.79%
Health Care 10.13%
Industrials 11.94%
Other 15.66%
Financials 19.44%Consumer Discretionary 22.89%
How the underlying fund is invested
Top holdings within the underlying Fund(As at December 31, 2014)
Blackrock Inc. 4.04%
JP Morgan Chase & Co. 3.74%
Becton Dickinson 3.69%
Oracle Corp. 3.65%
Wells Fargo & Co. 3.49%
Visa Inc. 3.45%
World Fuel Services 3.38%
United Technologies 3.32%
Autozone Inc. 3.10%
Whirlpool Corp. 2.99%
Primary investment processFundamental, Bottom−up
Equity style and capitalization
Source: Manulife Investment Management Services
1 Value Core/Blend Growth
Large
Medium
Small
All Cap
Note: All rates of return are shown before investment management fees or taxeshave been deducted.
The rate of return is used only to illustrate the effects of the compound growthrate and is not intended to reflect the future values or returns in the Fund.
UNDERLYING FUND −> Mawer U.S. Equity Fund − Class OObjective The objective of the Mawer U.S. Equity Fund is to invest for above−average long−term rates of return from both capital gains and dividend income from common shares of U.S. companies. Treasury bills or short−term investments, not exceeding three years to maturity, may also be used from time to time.
Managed by Mawer Investment Management Limited
Fund manager(s) Grayson Witcher, CFA
Inception date December 1992Total assets $1,947.6 million
Historical gross returnsGross rates of return are shown before investment management fees have beendeducted. The solid area represents the gross returns of the Manulife Fund since its inception in August 2010. In order to provide historical information, the shaded area represents the returns of the underlying fund for the period before the start date of the Manulife Fund.
−20%
0%
20%
40%
60%
2005 2006 2007 2008 2009 2010 2011 2012 2013 2014
Manulife Mawer U.S. Equity FundMawer U.S. Equity Fund − Class O
22.1
43.3
13.2 5.5 7.1 3.7−13.1 −6.9
16.0
−2.0
* Only full calendar year returns are shown.
Overall past performanceThis graph shows how a $10,000 investment in this fund would have changed in value over time, based on grossreturns.
$6,000
$8,000
$10,000
$12,000
$14,000
$16,000
$18,000
$20,000
$22,000
Dec04 Dec06 Dec08 Dec10 Dec12 Dec14
Manulife Mawer U.S. Equity FundS&P 500 Composite Total Return Idx ($CA) Mawer U.S. Equity Fund − Class O
$21,400*
$20,208
* For illustration purposes only. Includes mutual/pooled fund performance as indicated. Actual fund performance couldbe expected to vary.
Annual compound returns (As at December 31, 2014)
This table shows the historical annual compound total return of the Fund compared withthe S&P 500 Composite Total Return Index ($ CA).
1−year 2−year 3−year 5−yearSince
inception
Manulifeinception
date
22.10% 32.26% 25.56% − 22.12% Aug 2010MLI Mawer U.S. Equity Fund S&P 500 Composite Total Return Index ($CA)
23.99% 32.47% 25.81% 17.85% −
Rate of return expectation The performance benchmark is the S&P 500 Total Return Index ($CA). The performance goal is to exceed the S&P 500 Index by at least 2% over 4−year moving time periods.
Source: The Globe and Mail Inc.

Volatility meter
Based on 3 year standard deviation of the Fund
Low (1) High (25)
. 7
U.S. LARGE CAP EQUITY Code 8631
Manulife Beutel Goodman American Equity Fund
Cash 2.63%
Consumer Staples 5.66%
Consumer Discretionary 12.93%
Industrials 11.99%
Other 13.00%
Financials 15.46%
Health Care 16.59%Information Technology 21.74%
How the underlying fund is invested
Top holdings within the underlying Fund(As at December 31, 2014)
Oracle Corp. 6.86%
Baxter International 6.19%
JP Morgan Chase & Co. 5.53%
Verizon Communications 5.49%
BB&T Corp. 5.44%
Symantec Corp. 5.44%
Eli Lilly & Co. 4.72%
Amdocs 4.25%
Bemis 4.12%
Kohls 3.82%
Primary investment processFundamental, Bottom−up
Equity style and capitalization
Source: Manulife Investment Management Services
1 Value Core/Blend Growth
Large
Medium
Small
All Cap
Note: All rates of return are shown before investment management fees or taxeshave been deducted.
The rate of return is used only to illustrate the effects of the compound growthrate and is not intended to reflect the future values or returns in the Fund.
UNDERLYING FUND −> Beutel Goodman American Equity Fund − I Objective The Beutel Goodman American Equity Fund seeks long−term enhancement of capital primarily through investments in common stocks and other equity securities of American issuers.
Managed by Beutel Goodman & Company Limited
Fund managers Glenn Fortin, BComm, CFA and Rui Cardoso, MBA, CFA
Inception date January1991 Total assets $674million
Historical gross returnsGross rates of return are shown before investment management fees have been deducted. The solid area represents the gross returns of the Manulife Fund since its inception in September 2010. In order the shaded area represents the returns of the underlying fund for the period before the start date of the Manulife Fund.
−20%
0%
20%
40%
60%
2005 2006 2007 2008 2009 2010 2011 2012 2013 2014
Manulife Beutel Goodman American Equity FundBeutel Goodman American Equity Fund − I
26.1
41.4
15.4 4.7 7.7 8.0
−9.5−10.9
19.7
3.0
* Only full calendar year returns are shown.
Overall past performanceThis graph shows how a $10,000 investment in this fund would have changed in value over time, based on grossreturns.
$6,000
$8,000
$10,000
$12,000
$14,000
$16,000
$18,000
$20,000
$22,000
$24,000
$26,000
Dec04 Dec06 Dec08 Dec10 Dec12 Dec14
Manulife Beutel Goodman American Equity Fund S&P 500 Composite Total Return Idx($CA) Beutel Goodman American Equity Fund − I
$24,744*
$20,189
* For illustration purposes only. Includes mutual/pooled fund performance as indicated. Actual fund performance couldbe expected to vary.
Annual compound returns (As at December 31, 2014)
This table shows the historical annual compound total return of the Fund compared withthe S&P 500 Composite Total Return Index ($ CA).
1−year 2−year 3−year 5−yearSince
inception
Manulifeinception
date
MLI Beutel GoodmanAmerican Equity
26.13% 33.53% 27.18% − 22.22% Aug 2010
S&P 500 Composite TotalReturn Idx($CA)
23.99% 32.47% 25.81% 17.85% −
Rate of return expectation Over the long term, the Fund strives to outperform the S&P 500 Total Return Index ($ Cdn).
Source: The Globe and Mail Inc.

Volatility meter
Based on 3 year standard deviation of the Fund
Low (1) High (25)
. 10
INTERNATIONAL EQUITY Code 8011
Manulife EAFE Plus Equity Fund (Pictet)
Switzerland 7.98%
Netherlands 3.63%
Italy 2.60%
Germany 3.45%
France 3.73%
United Kingdom 14.42%
Japan 16.77%Other 47.42%
How the underlying fund is invested
Top holdings within the underlying Fund(As at December 31, 2014)
Sompo Japan Nipponkoa Holdings 3.32%
Nestle SA 3.00%
HSBC Holdings PLC 2.69%
INPEX Corporation 2.36%
Inmarsat PLC 2.21%
Societe Genl Fr 2.12%
Carlsberg A/S 2.07%
Bayer Ag Sponsored Adr 2.03%
Softbank Corporation 1.95%
Samsung Electronics Co. 1.93%
Primary investment processFundamental, Bottom−up
Equity style and capitalization
Source: Manulife Investment Management Services
1 Value Core/Blend Growth
Large
Medium
Small
All Cap
Note: All rates of return are shown before investment management fees or taxeshave been deducted.
The rate of return is used only to illustrate the effects of the compound growthrate and is not intended to reflect the future values or returns in the Fund.
UNDERLYING FUND −> Manulife EAFE Plus Equity Fund (Pictet)Objective Long−term growth is achieved by investing in a diversified mix of stocks around the world. Emphasis is placed on adding returns without risk.
Managed by Manulife Financial
Fund managers Pictet Asset Mgmt − Mgmt Team
Inception date September 2001Total assets $33.7 million
Historical gross returnsGross rates of return are shown before investment management fees have beendeducted. The solid area represents the gross returns of the Manulife Fund since itsinception in September 2001.
−40%
−20%
0%
20%
40%
2005 2006 2007 2008 2009 2010 2011 2012 2013 2014
Manulife EAFE Plus Equity Fund (Pictet)
−2.8
32.7 23.4
−12.1 6.9
18.5
−38.4 −8.6
23.7
9.2
* Only full calendar year returns are shown.
Overall past performanceThis graph shows how a $10,000 investment in this fund would have changed in value over time, based on grossreturns.
$6,000
$8,000
$10,000
$12,000
$14,000
$16,000
$18,000
Dec04 Dec06 Dec08 Dec10 Dec12 Dec14
Manulife EAFE Plus Equity Fund (Pictet) MSCI EAFE TR Index ($CA)
$13,494*
$16,677
* For illustration purposes only. Includes mutual/pooled fund performance as indicated. Actual fund performance couldbe expected to vary.
Annual compound returns (As at December 31, 2014)
This table shows the historical annual compound total return of the Fund compared with the MSCI EAFE TR Index ($CA).
Sinceinception
Manulifeinception
date 1−year 2−year 3−year 5−year
EAFE Plus Equity Fund −2.85% 13.56% 16.76% 8.40% 2.19% Aug 2001
MSCI EAFE TR Index ($CA) 4.18% 17.18% 16.56% 8.01% −
Rate of return expectation Over the long term, the Fund strives to outperform the MSCI EAFE TR Index ($ CA) Index.
Source: The Globe and Mail Inc.

Volatility meter
Based on 3 year standard deviation of the Fund
Low (1) High (25)
. 9
INTERNATIONAL EQUITY Code 8321
Manulife BlackRock International Equity Index Fund
Switzerland 9.28%
Australia 7.53%
Spain 3.52%
Germany 9.11%
France 9.65%
Other 18.74%
Japan 21.05%United Kingdom 21.12%
How the underlying fund is invested
Top holdings within the underlying Fund(As at December 31, 2014)
Nestle S.A. 1.89%
Novartis AG 1.71%
Roche Holdings 1.52%
HSBC Holdings PLC 1.47%
Toyota Motor Corporation 1.38%
Royal Dutch Shell PLC 1.07%
BP PLC 0.95%
Commonwealth Bank of Australia 0.92%
Bayer Ag Sponsored Adr 0.90%
Total SA 0.89%
Primary investment processIndex
Equity style and capitalization
Source: Manulife Investment Management Services
1 Value Core/Blend Growth
Large
Medium
Small
All Cap
Note: All rates of return are shown before investment management fees or taxeshave been deducted.
The rate of return is used only to illustrate the effects of the compound growthrate and is not intended to reflect the future values or returns in the Fund.
UNDERLYING FUND −> BlackRock CDN MSCI EAFE Equity Index Class D Objective The BlackRock Daily EAFE Equity Index Fund’s objective is to match the returns of the MSCI EAFE Index ("index") as closely as possible. BlackRock uses an indexing approach, where they own assets to match those of the index, in about the same names, weights, sectors, and countries.
Managed by BlackRock Asset Management Canada Limited
Fund managers Ed Corallo, Joselle Duncan, CFA, Tim Wong, CFA and Creighton Jue,CFA
Inception date April 1999Total assets $3,042.6 million
Historical gross returnsGross rates of return are shown before investment management fees have beendeducted. The solid area represents the gross returns of the Manulife Fund since itsinception in November 2003.
−40%
−20%
0%
20%
40%
2005 2006 2007 2008 2009 2010 2011 2012 2013 2014
Manulife BlackRock International Equity Index Fund
3.9
31.2
14.9
−9.7 2.3 12.0
−29.0 −5.6
26.0
11.2
* Only full calendar year returns are shown.
Overall past performanceThis graph shows how a $10,000 investment in this fund would have changed in value over time, based on grossreturns.
$7,000
$8,000
$9,000
$10,000
$11,000
$12,000
$13,000
$14,000
$15,000
$16,000
Dec04 Dec06 Dec08 Dec10 Dec12 Dec14
Manulife BlackRock International Equity Index Fund MSCI EAFE TR Index (net of with. taxes)
$15,215*
$14,914
* For illustration purposes only. Includes mutual/pooled fund performance as indicated. Actual fund performance couldbe expected to vary.
Annual compound returns (As at December 31, 2014)
This table shows the historical annual compound total return of the Fund compared withthe MSCI EAFE Index Total Return (net of withholding taxes).
1−year 2−year 3−year 5−yearSince
inception
Manulifeinception
date
3.90% 16.75% 16.13% 7.65% 5.36% Oct 2003MLI BR Intl Equity Index Fund MSCI EAFE Index (net of with. taxes)
3.66% 16.54% 15.93% 7.46% −
Rate of return expectation Over the long term, this fund is expected to track the return and risk profile of the MSCI EAFE Index(total return, net of withholing taxes) within 0.50% annualized over 4 years
Source: The Globe and Mail Inc.

Volatility meter
Based on 3 year standard deviation of the Fund
Low (1) High (25)
. 7
GLOBAL EQUITY Code 8181
Manulife Trimark Fund
United Kingdom 4.48%
Brazil 4.41%
France 2.94%
Switzerland 3.48%
China 4.43%
Germany 6.27%
Other 24.48%United States 49.51%
How the underlying fund is invested
Top holdings within the underlying Fund(As at December 31, 2014)
Walt Disney 4.81%
Becton Dickinson 4.47%
Henkel KGaA 4.35%
Express Scripts Holding 4.32%
United Technologies 3.49%
Nestle S.A. 3.48%
Wells Fargo & Co. 3.24%
Microsoft 3.20%
British American Tobacco 3.16%
Publicis Groupe SA 2.94%
Primary investment processFundamental, Bottom−up
Equity style and capitalization
Source: Manulife Investment Management Services
1 Value Core/Blend Growth
Large
Medium
Small
All Cap
Note: All rates of return are shown before investment management fees or taxeshave been deducted.
The rate of return is used only to illustrate the effects of the compound growthrate and is not intended to reflect the future values or returns in the Fund.
UNDERLYING FUND −> Trimark Fund − IObjective The Trimark Fund seeks to achieve strong capital growth with a high degreeof reliability over the long term. The Fund invests primarily in equities of companiesanywhere in the world.
Managed by Invesco Canada Limited
Fund managers Michael Hatcher, CFA, MSC, Master Math, Jeff Feng CFA, MBA andMatt Peden
Inception date September 1981Total assets $3,351.8 million
Historical gross returnsGross rates of return are shown before investment management fees have beendeducted. The solid area represents the gross returns of the Manulife Fund since itsinception in October 1997.
−40%
−20%
0%
20%
40%
2005 2006 2007 2008 2009 2010 2011 2012 2013 2014
Manulife Trimark Fund
12.0
32.8
14.0 5.0 6.8
12.2
−27.5 −8.1
29.1
5.7
* Only full calendar year returns are shown.
Overall past performanceThis graph shows how a $10,000 investment in this fund would have changed in value over time, based on grossreturns.
$6,000
$8,000
$10,000
$12,000
$14,000
$16,000
$18,000
$20,000
Dec04 Dec06 Dec08 Dec10 Dec12 Dec14
Manulife Trimark FundMSCI World TR Index ($ CA)
$19,373*
$18,280
* For illustration purposes only. Includes mutual/pooled fund performance as indicated. Actual fund performance couldbe expected to vary.
Annual compound returns (As at December 31, 2014)
This table shows the historical annual compound total return of the Fund compared with the MSCI World Index ($ CA).
1−year 2−year 3−year 5−yearSince
inception
Manulifeinception
date
11.95% 21.92% 19.23% 13.70% 7.50% Sep 1997Manulife Trimark Fund
MSCI World TR Index ($ CA) 15.08% 25.17% 21.33% 13.12% −
Rate of return expectation To be the top of its respective category over the long term, while striving to outperform the MSCI World Index ($ CA).
Source: The Globe and Mail Inc.


Manulife Financial (The Manufacturers Life Insurance Company) offers retirement products and services for Canadian groups through its Group Retirement Solutions (GRS) business unit.
Manulife, Manulife Financial, Manulife Financial For Your Future logo and the block design are service marks and trademarks of The Manufacturers Life Insurance Company and are used by it and its affiliates under license.

This sheet will not be printed. It is for fulfillment purposes only.
Fulfillment Summary Sheet
Line Item
Kit Item Details Qty
1 White custom return envelope Attention: Payroll Department, Newcap Radio, 745 WindmillRoad, Dartmouth, Nova Scotia, Canada, B3B 1C2, B3B 1C2,
1
2 White standard return envelope Attn: GRS Client Services, KC-6, P.O. Box 396 Stn Waterloo,Waterloo, ON N2J 4A9, CANADA
1
3 Separate white custom return envelope for the Payroll deduction (and waiver) form only
Attention: Payroll Department, Newcap Radio, 745 WindmillRoad, Dartmouth, Nova Scotia, Canada, B3B 1C2, B3B 1C2,
1
4 Blue return address envelope 0
5 GIP Bold Print stock items packaged in kit NONE

Funds available for
Newfoundland Capital Corporation