the neocortex of cetartiodactyls. ii. neuronal … neocortex of cetartiodactyls. ii. neuronal...
TRANSCRIPT

ORIGINAL ARTICLE
The neocortex of cetartiodactyls. II. Neuronal morphologyof the visual and motor cortices in the giraffe (Giraffacamelopardalis)
Bob Jacobs • Tessa Harland • Deborah Kennedy • Matthew Schall •
Bridget Wicinski • Camilla Butti • Patrick R. Hof • Chet C. Sherwood •
Paul R. Manger
Received: 11 May 2014 / Accepted: 21 June 2014 / Published online: 22 July 2014
� Springer-Verlag Berlin Heidelberg 2014
Abstract The present quantitative study extends our
investigation of cetartiodactyls by exploring the neuronal
morphology in the giraffe (Giraffa camelopardalis) neo-
cortex. Here, we investigate giraffe primary visual and
motor cortices from perfusion-fixed brains of three su-
badults stained with a modified rapid Golgi technique.
Neurons (n = 244) were quantified on a computer-assis-
ted microscopy system. Qualitatively, the giraffe neo-
cortex contained an array of complex spiny neurons that
included both ‘‘typical’’ pyramidal neuron morphology
and ‘‘atypical’’ spiny neurons in terms of morphology
and/or orientation. In general, the neocortex exhibited a
vertical columnar organization of apical dendrites.
Although there was no significant quantitative difference
in dendritic complexity for pyramidal neurons between
primary visual (n = 78) and motor cortices (n = 65),
there was a significant difference in dendritic spine
density (motor cortex[ visual cortex). The morphology
of aspiny neurons in giraffes appeared to be similar to
that of other eutherian mammals. For cross-species
comparison of neuron morphology, giraffe pyramidal
neurons were compared to those quantified with the same
methodology in African elephants and some cetaceans
(e.g., bottlenose dolphin, minke whale, humpback whale).
Across species, the giraffe (and cetaceans) exhibited less
widely bifurcating apical dendrites compared to ele-
phants. Quantitative dendritic measures revealed that the
elephant and humpback whale had more extensive den-
drites than giraffes, whereas the minke whale and bot-
tlenose dolphin had less extensive dendritic arbors. Spine
measures were highest in the giraffe, perhaps due to the
high quality, perfusion fixation. The neuronal morphol-
ogy in giraffe neocortex is thus generally consistent with
what is known about other cetartiodactyls.
Keywords Dendrite � Morphometry � Dendritic spine �Golgi method � Brain evolution
Introduction
In our companion paper on cetartiodactyls (Butti et al.
2014b), we documented the neuronal morphology of
three cetacean species (bottlenose dolphin, minke whale,
and humpback whale). Here, we explore the neuronal
morphology of the giraffe (Giraffa camelopardalis) for
the first time. Although the long necked-giraffe’s status
as the tallest extant land mammal has resulted in exten-
sive investigation of its vertebral column (Solounias
1999; Badlangana et al. 2009) and cardiovascular system
(Nilsson et al. 1988; Badeer 1997), few studies have
examined the giraffe brain beyond gross anatomy (Friant
1968). Recent investigations have begun to explore the
B. Jacobs (&) � T. Harland � D. Kennedy � M. Schall
Laboratory of Quantitative Neuromorphology, Psychology,
Colorado College, 14 E. Cache La Poudre, Colorado Springs,
CO 80903, USA
e-mail: [email protected]
B. Wicinski � C. Butti � P. R. HofFishberg Department of Neuroscience and Friedman Brain
Institute, Mount Sinai School of Medicine, One Gustave L. Levy
Place, New York, NY 10029, USA
C. C. Sherwood
Department of Anthropology, The George Washington
University, 2110 G Street, NW, Washington, DC 20052, USA
P. R. Manger
School of Anatomical Sciences, Faculty of Health Sciences,
University of the Witwatersrand, 7 York Road, Parktown,
Johannesburg 2193, South Africa
123
Brain Struct Funct (2015) 220:2851–2872
DOI 10.1007/s00429-014-0830-9

implications of an elongated neck in the anatomy of
brainstem nuclei (Badlangana et al. 2007a; Bux et al.
2010) and the corticospinal system (Badlangana et al.
2007b); nevertheless, apart from some initial descriptions
of neurons in selected ungulates (Barasa 1960), the
morphology of cortical neurons in the giraffe remains
unknown. As part of an ongoing project documenting
neocortical neuromorphology in previously unexplored
large brained mammals (Jacobs et al. 2011), the current
study may further our understanding of which aspects of
neuronal morphology are general to all vertebrates, and
which are specific to particular species. To that end, the
present investigation documents the neuronal morphology
of the primary motor and visual cortices of the giraffe.
Within the superorder Laurasiatheria, giraffes belong
to the clade Cetartiodactyla (order Artiodactyla; sub-
order Ruminantia). Giraffidae emerged from Pecora in
the Oligocene period, with Giraffini diverging from
their closest living relative, Okapini, approximately 19
million years ago (Hassanin and Douzery 2003). Extant
laurasiatherian species (e.g., giraffe, cat, dog, horse,
sheep, cow, seal, hippopotamus, dolphin, whale) exhibit
considerable diversity in terms of physiology, behavior,
brain mass, and encephalization quotient (Radinsky
1981; Fernandez and Vrba 2005; Boddy et al. 2012),
and thus may provide insight into the complexities and
evolutionary plasticity of mammalian neocortical evo-
lution. In particular, comparison of evolutionary pat-
terns and modern phylogenomic techniques underscore
a close relationship between cetaceans and artiodactyls,
which have recently been grouped in the clade Cetar-
tiodactyla (Nikaido et al. 1999; Murphy et al. 2004;
Price et al. 2005). It should be noted that the Artio-
dactyla suborder Ruminantia appears to be most closely
related to hippopotami and cetaceans, and composes a
clade referred to as Cetruminantia (Graur and Higgins
1994; Shimamura et al. 1997). As such, it would be
reasonable to expect similarities in the organization of
the brain among related species within cetartiodactyls
(Hof and Sherwood 2005, 2007; Sherwood et al. 2009).
For example, in the pygmy hippopotamus (Hexaproto-
don liberiensis) and cetaceans (bottlenose dolphin,
Tursiops truncatus; minke whale, Balaenoptera acut-
orostrata; humpback whale, Megaptera novaeangliae),
a variety of complex neocortical neurons have recently
been documented, with spiny neurons existing along a
continuum from those that appeared more pyramid-like
to those that differ from the ‘‘typical’’ (i.e., primate/
rodent-like) pyramidal neuron in terms of morphology
and/or orientation (Butti et al. 2014a, b). In contrast,
aspiny cortical neurons appear relatively uniform and
morphologically conserved across eutherian mammals
(Hof et al. 1999; Sherwood et al. 2009). Given the
close relationship between certain large artiodactyls
(e.g., Hippopotomidae) and cetaceans (Shimamura et al.
1997; Ursing and Arnason 1998; Nikaido et al. 1999;
Price et al. 2005), we expect comparable neuromor-
phological features across giraffes, the pygmy hippo-
potamus, and cetaceans. Such a comparative
perspective provides a focal point of the current
investigation.
The giraffe, with a brain mass of between 400 and
700 g (Crile and Quiring 1940; Mitchell et al. 2008), has
a relatively long gestation period and a relatively com-
plex sociobehavioral environment (Perez-Barberıa and
Gordon 2005; Shultz and Dunbar 2006). They reside
within a fission–fusion, mostly matrilineal social structure
characterized by considerable flexibility in herd size (Van
der Jeugd and Prins 2000; Bashaw et al. 2007; Bercov-
itch and Berry 2013; Carter et al. 2012). Several types of
social interaction have been documented: urine assess-
ment to determine female reproductive status, mate
guarding of receptive females (Bercovitch et al. 2006),
and neck rubbing for social cohesion and bonding (Coe
1967; Tarou et al. 2000). Auditory and particularly visual
senses seem well developed (Innis 1958). The giraffe has
a visual acuity of 25–27 cycles per degree, which is
approximately half that of humans, but substantially
higher than that seen in most other Cetartiodactyls
(Coimbra et al. 2013). The extent to which giraffes
communicate vocally remains unclear, although it has
been suggested that they are among several species (e.g.,
okapi, rhinoceros, elephants, whales) that may use in-
frasound (Bashaw 1993). These behaviors, coupled with a
relatively large brain size, suggest considerable cognitive
ability in giraffes.
The relationship between cognitive abilities and cor-
tical neuronal morphometry remains elusive in giraffes
because their cerebral cortex remains largely unexplored
(DeFelipe et al. 2002), with only one recent study
examining giraffe cortex directly (Badlangana et al.
2007b). Therefore, in addition to qualitative classification
of neuronal types, the present study quantitatively
investigated regional variation, with a focus on the
numerically dominant pyramidal neurons, in primary
motor and visual cortices. Although increased dendritic
complexity has been associated with enhanced processing
demands in higher order primate cortices (Elston 2003,
2007; Jacobs and Scheibel 2002), there appears to be no
a priori reason to expect differences in cortical pro-
cessing across primary cortical areas (Jacobs et al. 2001;
Clemo and Meredith 2012). As such, we expect pyra-
midal neuron dendritic extent to be similar between
giraffe primary motor and visual cortices.
2852 Brain Struct Funct (2015) 220:2851–2872
123

Materials and methods
Specimens
Tissue was obtained from three (G1, G2, G3) subadult
male giraffes (2–4 years of age) euthanized with an intra-
venous overdose of sodium pentobarbital (for details, see
Dell et al. 2012). Briefly, after being perfused through the
common carotid artery with 0.9 % saline solution and a
fixative of 4 % paraformaldehyde in 0.1 M phosphate
buffer, each brain was placed in fixative, weighed (G1:
610 g, G2: 527 g, G3: 480 g), and post-fixed in 4 %
paraformaldehyde in 0.1 M phosphate buffer (Manger et al.
2009). In postmortem examinations, the brains of all ani-
mals exhibited no obvious gross neuroanatomical abnor-
malities. Tissue blocks (3–5 mm-thick) were dissected
from the cortical surface and stored in 1 % sodium azide in
0.1 M phosphate buffer for 3 months prior to staining. The
present study was approved by the Colorado College
Institutional Review Board (#011311-1) and the University
of the Witwatersrand Animal Ethics Committee (2008/36/
1).
Tissue selection
Cortical blocks (3–5 mm-thick) were removed from the
right hemisphere. Tissue from the primary motor cortex,
located anteriorly on the dorsomedial aspect of the neo-
cortex (Badlangana et al. 2007b), was removed approxi-
mately 1–2 cm lateral to the longitudinal fissure; tissue
from the primary visual cortex, located posteriorly on the
dorsomedial aspect of the neocortex, was removed
approximately 2–3 cm lateral to the longitudinal fissure
(Fig. 1). Tissue was coded to prevent experimenter bias,
stained via a modified rapid Golgi technique (Scheibel and
Scheibel 1978b), and sectioned serially at 120 lm with a
vibratome (Leica VT1000S, Leica Microsystems, Buffalo
Grove, IL, USA). Tissue blocks adjacent to those removed
for Golgi analysis were examined with a routine Nissl and
myelin stain to reveal cytoarchitectonic characteristics. To
determine laminar thickness, sample measurements for
each layer were averaged in Nissl stains across 10 sections
from each cortical region.
Neuron selection and quantification
Neurons (n = 244) were analyzed across the three giraffes
from motor (n = 125: G1, 78; G2, 11; G3, 36) and visual
cortices (n = 119; G1, 67; G2, 13; G3, 39), with more
neurons from G1 (n = 145) and G3 (n = 75) than from G2
(n = 24) due to inconsistent staining. Neurons were
selected for tracing based on established criteria (Roitman
et al. 2002; Anderson et al. 2009; Jacobs et al. 2011; Lu
et al. 2013), which required an isolated soma near the
center of the 120 lm section, with as fully impregnated,
unobscured, and complete dendritic arbors as possible (i.e.,
no beading or interruptions). To provide a comprehensive
analysis of giraffe neuromorphology, neurons were selec-
ted to encompass representative typologies, and were
quantified under a planachromatic 609 oil objective (NA
1.4) along x-, y-, z-coordinates using a Neurolucida system
(MBF Bioscience, Williston, VT, USA) interfaced with an
Olympus BH-2 microscope equipped with a Ludl XY
motorized stage (Ludl Electronics, Hawthorne, NY, USA)
and a Heidenhain Z-axis encoder (Schaumburg, IL, USA).
A MicroFire Digital CCD 2-megapixel camera (Optronics,
Goleta, CA, USA) mounted on a trinocular head (model
1-L0229, Olympus, Center Valley, PA, USA) displayed
images on a 1,920 9 1,200 resolution Dell E248WFP
24-in. LCD monitor. Somata were traced first at their
widest point in the two-dimensional plane to provide an
estimate of the cross-sectional area. Subsequently, den-
drites were traced somatofugally in their entirety, recording
dendritic diameter and quantity of spines, without differ-
entiating morphological types of spines. Dendritic arbors
were not followed into adjacent sections, with broken ends
and ambiguous terminations identified as incomplete
endings.
Neurons were traced by two investigators (TH and DK).
Intrarater reliability was determined by having each rater
trace the same soma, dendritic segment, and spines 10
times. The average coefficient of variation for soma size
(3.8 %), dendritic spine number (DSN 7.2 %) and total
dendritic length (TDL 3.9 %) indicated little variation in
the tracings. Intrarater reliability was further tested with a
split plot design (a = 0.05), which indicated no significant
difference between the first five tracings and the last five
Fig. 1 Dorsal view of a giraffe brain illustrating the primary motor
and visual cortices from which tissue blocks were selected for
staining. Adapted from Fig. 2 in Badlangana et al. (2007b)
Brain Struct Funct (2015) 220:2851–2872 2853
123

tracings. Interrater reliability was determined through
comparison of 10 dendritic system tracings with the same
tracings completed by the primary investigator (BJ).
Interclass correlations across soma size, DSN, and TDL
averaged 0.98, 0.95, 0.99, respectively. An analysis of
variance (ANOVA, a = 0.05) indicated no significant
differences among the tracers for the three measures.
Additionally, the primary investigator reexamined all
completed tracings under the microscope to ensure
accuracy.
Neuron descriptions and dependent dendritic/spine
measures
Descriptively, neurons were classified according to so-
matodendritic criteria (Ferrer et al. 1986a, b; Jacobs et al.
2011) by considering factors such as soma size/shape,
presence of spines, laminar location, and general mor-
phology. Quantitatively, centrifugal nomenclature was used
to characterize branches extending from the soma as first-
order segments, which bifurcate into second- and then third-
order segments, and so on (Bok 1959; Uylings et al. 1986).
In addition to quantifying soma size (i.e., surface area, lm2)
and depth from the pial surface (lm), we examined six other
measures that have been analyzed in previous studies
(Jacobs et al. 2011): dendritic volume (Vol lm3, the total
volume of all dendrites); total dendritic length (TDL lm,
the summed length of all dendritic segments); mean seg-
ment length (MSL lm, the average length of each dendritic
segment); dendritic segment count (DSC, the number of
dendritic segments); dendritic spine number (DSN, the total
number of spines on dendritic segments); and dendritic
spine density (DSD, the average number of spines per lm of
dendritic length). Additionally, dendritic branching patterns
were analyzed using a Sholl analysis (Sholl 1953), which
quantified dendritic intersections at 20-lm intervals radi-
ating somatofugally. All descriptive measures are presented
as mean ± standard deviation (SD) unless noted otherwise
(e.g., Table 3).
Independent variables and statistical analyses
Descriptive statistics obtained for the six dependent mea-
sures were aggregated by neuron type and brain region. For
inferential statistical analysis of regional dendritic differ-
ences, only pyramidal neurons were examined (using SPSS
release 19.0.0.1), with dendritic systems as the unit of
analysis. In the past, we have used a nested repeated
measures design (PROC NESTED; SAS) to analyze
regional cortical dendritic differences. The present study,
however, expanded this analysis by incorporating the main
effects of three Brains (G1, n = 88 pyramidal neurons; G2,
n = 7 pyramidal neurons; G3, n = 48 pyramidal neurons)
and the nested effect of two Regions (motor and visual
cortices) within Brain. Three subsequent levels of analysis
were completed: (1) a cluster analysis to provide an initial
descriptive overview of dendritic distributions, (2) a series
of decision trees to explore potentially significant rela-
tionships between Brain and Region for each dependent
measure, and (3) a generalized linear equations (GENLIN)
framework to assess whether overall variability in the
measure could be modeled. Each of these is explained in
detail below.
Insofar as dendritic measures may be distributed dif-
ferently within nested effects, a two-stage cluster analysis
of Brains, and Regions nested within Brains, was per-
formed using Akaike’s Information Criteria for Brains G1
and G3 with both Brain, and Region within Brain entered
as effects and a forced solution of four clusters. For this
cluster analysis, Brain G2 was excluded due to a small
sample size. Within each cluster, dependent variable dis-
tributions were examined to characterize the data. Log-
likelihood distances were used with standardization of the
dependent measures to define similarity.
Because brains may differ from each other for a variety
of reasons, a CHAID decision tree framework (Hawkins
and Kass 1982), with a parent node size set to 20 and
child node size set to 10 with Brain forced in as the first
effect and Block nested within Brain as the second effect,
was used to explore possible asymmetric effects such as
differential relevance of Block within Brain. This analysis
was chosen because the three Brains could have differ-
ences in their structures that would not be apparent from
conventional t tests or an ANOVA. In addition, this form
of analysis is crucial for understanding results with small
sample sizes and reveals which Brains were similar/dif-
ferent from each other. Specifically, possible differences
were evaluated for (1) Brain main effect with six tests
across the 2 Brains on the 6 dendritic measures and (2)
the Region within Brain effect with 18 tests across 2
Regions evaluated for 6 dependent measures across 3
Brains.
To summarize the relationships between the dependent
variables, and the nested and main effects, a bootstrap of
100 runs was used to secure robust maximum likelihood
estimations (RMLE) within the analytical framework of
GENLIN tested with a variety of links and distributions.
GENLIN enables analyses that separate distributional
characteristics of the dependent measures (e.g., normal
versus probit) from the transformation used to estimate the
model (e.g., identity or no transformation, Cauchit for a
multinomial mixture). A variety of distribution and link
functions were evaluated after examining the descriptive
results. The small sample size warranted the use of the
2854 Brain Struct Funct (2015) 220:2851–2872
123

bootstrap estimations of RMLE effects. Six such analyses,
one for each dependent variable, were performed, with five
v2 statistics calculated for each model: (1) improvement
over a model fit with just the intercept term, (2) overall
goodness of fit and three significance tests of the (3)
intercept, (4) Brain and (5) Region nested within Brain.
Results
Overview
Nissl and myelin stains suggested an absence of a clear
layer IV in the primary motor cortex, but not in primary
visual cortex (Fig. 2). The relative thickness of all laminae
across both cortical regions is provided in Table 1, with
layers I and III in both regions being relatively thick. The
overall high quality of Golgi preparations is evident in
photomicrographs (Figs. 3, 4), which reveal well impreg-
nated, relatively complete dendritic systems. In general,
pyramidal-like neurons in both regions exhibited long (up to
*1,500 lm) apical dendrites which, in extending up to
layers I and II, contributed to the vertical, columnar
organization of the neocortex. Aspiny neurons were found
at all depths, with considerable variation in dendritic den-
sity and length. Quantitative data broken down by cortical
region and neuron type are presented in Table 2, which
indicates that spiny neurons in motor cortex (excluding the
gigantopyramidal neurons found only in motor cortex)
tended to exhibit greater dendritic (by 39 % for Vol, 13 %
for TDL, 0 % for MSL, 11 % for DSC) and spine (by 26 %
for DSN, and 14 % for DSD) extent than those in visual
regions. Individual spiny neuron tracings are depicted for
the visual cortex in Fig. 5, and for the motor cortex in
Fig. 6. Aspiny neuron tracings are provided in Fig. 7, and
Sholl analyses for all neuron types are illustrated in Fig. 8.
Below, we provide more detailed descriptions of spiny and
aspiny neuron types based on examination of all Golgi-
stained sections as well as the quantified neurons
themselves.
Spiny neurons
Typical pyramidal neurons (n = 143; Figs. 3a, d, 4e, 5A–J,
6A–H), considered ‘‘typical’’ because they resemble those
in anthropoid primate and murid rodent models, were the
Fig. 2 Photomicrographs of
Nissl (a, c) and myelin (b,d) stained sections through the
primary motor (a, b) andprimary visual (c, d) corticeswith the layers labeled. Note the
large pyramidal neurons in layer
V of the primary motor cortex
(a) and the lack of layer IV in
this cortical area. Layer IV
appears to be present in the
primary visual cortex (c) as doesthe stria of Gennari in the lower
half of layer IV (d). Scale bar
500 lm
Brain Struct Funct (2015) 220:2851–2872 2855
123
most prominent neuron type traced in both primary motor
(n = 78) and visual cortices (n = 65). Somata, located at
an average depth of *1,000 lm (Table 2), were usually
triangular with a single, sometimes bifurcating apical den-
drite and an average of 4.93 ± 1.53 primary basilar den-
drites that radiated in all directions to form a circular skirt.
Superficial pyramidal neurons tended to have more widely
divergent apical dendrites whereas deeper pyramidal neu-
rons exhibited longer apical dendrites with fewer bifurca-
tions. All dendrites were relatively spiny (DSD = 0.83,
Table 2). Sholl analysis indicated that pyramidal neurons
exhibited an intersection pattern similar to, but slightly less
complex than the larger magnopyramidal and gigantopyra-
midal neurons described below (Fig. 8c).
Magnopyramidal neurons (n = 10; Figs. 5R, S, 6P, Q),
located in both cortical regions at an average depth of
*1,400 lm (Table 2), were morphologically similar to
pyramidal neurons but were much larger in terms of Vol
(by 122 %), TDL (by 17 %), MSL (by 15 %) and soma
size (by 102 %; Table 2). They displayed an average of
7.6 ± 3.13 primary basilar dendrites per neuron. The
dendrites of magnopyramidal neurons were marginally less
spiny (DSD = 0.76) than those of pyramidal neurons.
Sholl analysis revealed a higher density of basilar dendritic
intersections for magnopyramidal neurons than for pyra-
midal neurons (Fig. 8b).
Gigantopyramidal neurons (n = 6, Figs. 4a, g, 6K, L),
located only in the motor cortex, were the largest neurons
examined, particularly in terms of Vol (113 %[magno-
pyramidal neurons, and 375 %[ pyramidal neurons), but
also in terms of TDL (47 %[magnopyramidal neurons,
and 72 %[ pyramidal neurons), MSL (10 %[magno-
pyramidal neurons, and 26 %[ pyramidal neurons), and
soma size (80 %[magnopyramidal neurons, and
265 %[ pyramidal neurons; Table 2). The fusiform
somata, located at an average depth *1,500 lm, typically
extended a single apical dendrite, although one giganto-
pyramidal neuron exhibited a fork-like soma (Ngowyang
1932) with two, parallel, ascending apical dendrites
(Figs. 4g, 6K). The basilar dendrites of gigantopyramidal
neurons resembled the perisomatic, circumferential den-
drites of Betz cells described by Scheibel and Scheibel
(1978a) and were the highest in number as compared to all
other neuron types (an average of 13 ± 5.5 primary den-
dritic segments/neuron). Dendrites were highly spiny, with
a DSD (0.91) equal to that of extraverted neurons
(Table 2). Sholl analyses indicated that gigantopyramidal
neurons, despite their relatively short basilar dendrites,
were characterized by a higher density of basilar dendritic
intersections than any other neuron types (Fig. 8a).
Extraverted neurons (n = 35, Figs. 3e, 4d, 5K–M, 6M–
O), located in both cortical regions at an average depth
*600 lm (Table 2), were the most superficial neuron
type. These were roughly comparable to pyramidal neurons
in terms of quantitative dendritic measurements, although
basilar dendritic number (3.89 ± 1.7 primary dendritic
segments/neuron) and extent were lower than in pyramidal
neurons. This is the only neuron type where apical den-
dritic length was greater than basilar dendritic length (by
5.27 %). Somata ranged from triangular to globular in
shape with apical bifurcations at or immediately above the
soma such that there were two individual, ascending
branches. DSD (0.91) was equal to that of gigantopyra-
midal neurons (Table 2). Sholl analyses indicated that
apical dendrites had a higher density of intersections than
did other neuron types, although basilar dendritic inter-
sections were the lowest density among all other spiny
neuron types (Fig. 8d).
Horizontal pyramidal neurons (n = 17, Figs. 3i, 5P, Q,
6I, J), located in both cortical regions at an average depth
of *1,300 lm, exhibited an apical dendrite that extended
laterally or obliquely (\45�) from a triangular soma. Most
of these (15 of 17) were located deep in the sulcus, with the
rest located in intermediate sulcal regions. Basilar den-
drites (4.41 ± 1.94 primary dendritic segments/neuron)
radiated from the soma in all directions and tended to be
quite long relative to basilar dendrites in other spiny neu-
rons. Overall, horizontal pyramidal dendrites were mod-
erately spiny (DSD = 0.67; Table 2). Sholl analyses
revealed a pattern similar to that observed in pyramidal
neurons (Fig. 8e). Axons, when visualized, initially
extended towards the basilar dendrites but typically turned
to travel parallel to the apical dendrite.
Crab-like neurons (n = 4, Figs. 3c, 5N, O), traced only
in the visual cortex, had oval or rounded somata (at an
average depth of *1,100 lm) from which dendrites
(4.5 ± 0.58 primary dendritic segments/neuron) radiated
symmetrically from opposite ends. These horizontally, bi-
tufted neurons (Jacobs et al. 2011) were the smallest of all
spiny neuron types, with the lowest spine values as well
(Table 2). Sholl analyses indicated that crab-like neurons
had the lowest density of basilar dendritic intersections and
shortest dendritic length of all spiny neurons (Fig. 8f).
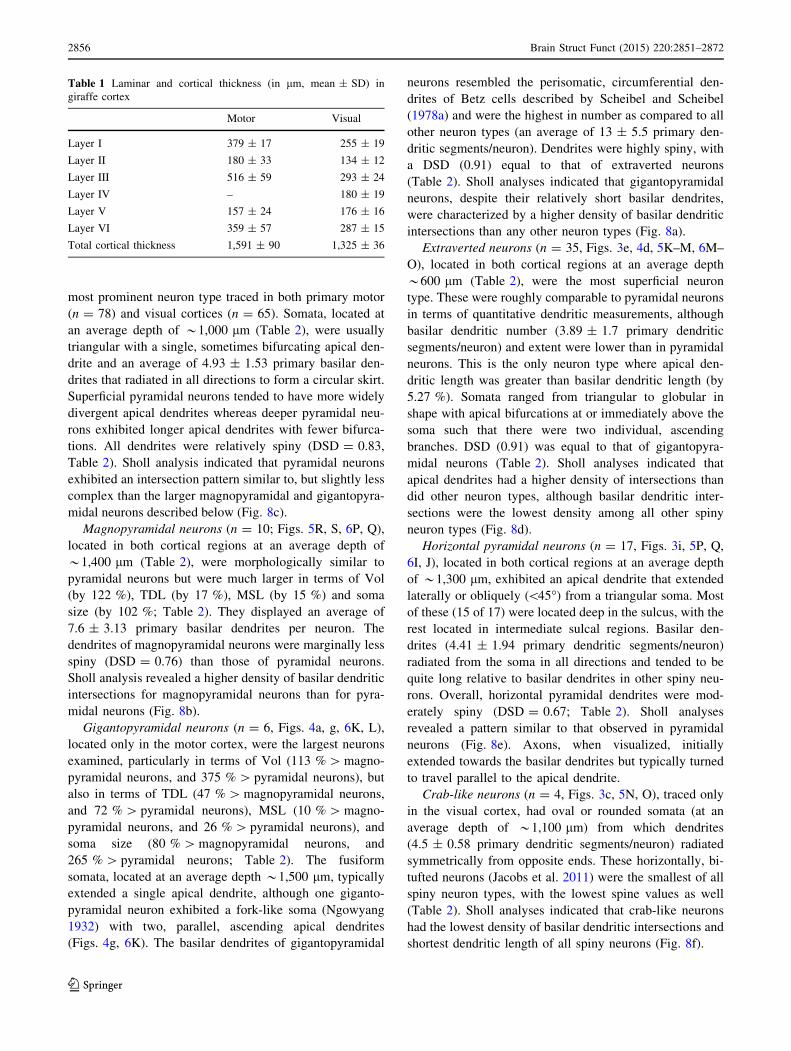
Table 1 Laminar and cortical thickness (in lm, mean ± SD) in
giraffe cortex
Motor Visual
Layer I 379 ± 17 255 ± 19
Layer II 180 ± 33 134 ± 12
Layer III 516 ± 59 293 ± 24
Layer IV – 180 ± 19
Layer V 157 ± 24 176 ± 16
Layer VI 359 ± 57 287 ± 15
Total cortical thickness 1,591 ± 90 1,325 ± 36
2856 Brain Struct Funct (2015) 220:2851–2872
123
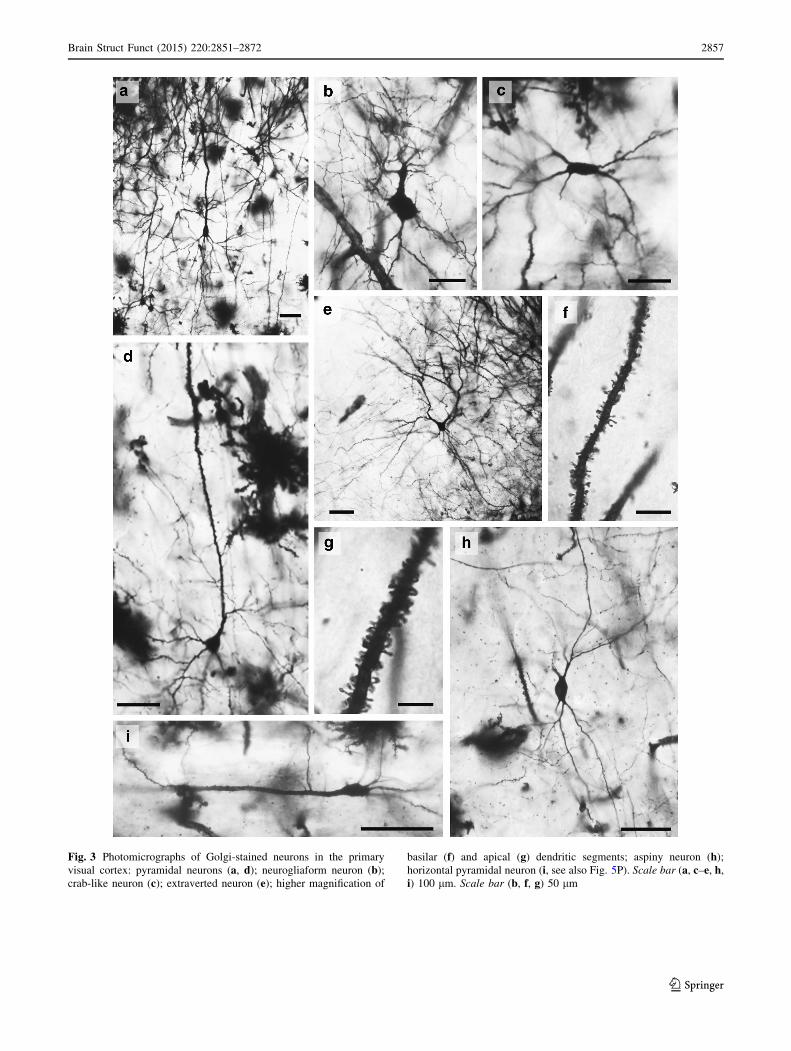
Fig. 3 Photomicrographs of Golgi-stained neurons in the primary
visual cortex: pyramidal neurons (a, d); neurogliaform neuron (b);crab-like neuron (c); extraverted neuron (e); higher magnification of
basilar (f) and apical (g) dendritic segments; aspiny neuron (h);horizontal pyramidal neuron (i, see also Fig. 5P). Scale bar (a, c–e, h,i) 100 lm. Scale bar (b, f, g) 50 lm
Brain Struct Funct (2015) 220:2851–2872 2857
123

Fig. 4 Photomicrographs of Golgi-stained neurons in the primary
motor cortex: gigantopyramidal neurons (a, see also Fig. 6L; g, seealso Fig. 6K); higher magnification of basilar (b) and apical
(f) dendritic segments; neurogliaform neuron (c); extraverted neuron
(d, see also Fig. 6O); pyramidal neuron (e). Scale bar (a, c–f) 100 lm. Scale bar (b, g) 50 lm
2858 Brain Struct Funct (2015) 220:2851–2872
123

Table
2Summarystatistics
(mean±
SEM)foreach
typeofgiraffe
neuronquantified
inprimarymotorandvisual
cortices
Type
nVol
TDL
MSL
DSC
DSN
DSD
SoSize
SoDepth
Spiny
Motor
Gigantopyramidal
668,547±
33,632
7,882±
2,201
101±
978±
22
7,232±
2,270
0.91±
0.10
1,184±
246
1,494±
190
Extraverted
19
19,298±
7,461
4,566±
1,149
79±
858±
14
4,264±
947
0.94±
0.10
374±
112
616±
181
Horizontal
717,645±
5,503
4,649±
2,149
72±
16
63±
16
3,307±
1,406
0.73±
0.13
432±
110
1,177±
412
Magnopyramidal
434,896±
8,348
5,662±
1,198
93±
961±
12
4,790±
1,005
0.86±
0.15
634±
77
1,481±
275
Pyramidal
78
16,659±
7,002
4,809±
1,296
80±
12
61±
13
4,119±
1,263
0.86±
0.17
349±
106
968±
421
Visual
Crab-like
44,923±
1,111
2,711±
596
64±
543±
81,192±
310
0.46±
0.16
207±
21
1,132±
121
Extraverted
16
12,560±
4,689
4,441±
815
74±
13
61±
12
3,953±
1,128
0.88±
0.14
346±
113
625±
225
Horizontal
10
9,731±
4,391
3,343±
704
79±
14
43±
82,155±
878
0.63±
0.15
304±
103
1,432±
565
Magnopyramidal
630,412±
14,413
5,186±
1,295
91±
13
57±
10
3,518±
904
0.70±
0.19
671±
339
1,385±
358
Pyramidal
65
11,889±
5,381
4,295±
1,149
79±
12
54±
14
3,435±
1,384
0.79±
0.18
293±
71
1,012±
418
Aspiny
Motor
Aspiny
56,360±
4,302
2,538±
768
93±
24
28±
60
0282±
66
1,262±
420
Neuroglial
64,677±
1,636
4,193±
1,211
43±
18
103±
21
00
267±
93
1,363±
321
Visual
Aspiny
15
6,038±
3,221
2,815±
1,180
70±
18
41±
13
00
288±
60
1,003±
301
Neuroglial
35,248±
1,088
4,660±
945
38±
5126±
38
00
263±
46
1,157±
60
nnumber
ofneuronsofagiven
typetraced
ineach
cortical
region,Volvolume(inlm
3)ofalldendriticbranches
inaneuron,TDLtotaldendriticlength
inlm
(i.e.,thesummed
length
ofall
dendriticbranches
inaneuron),MSLmeansegmentlength
inlm
(i.e.,averagelength
ofindividualdendriticbranches),DSCdendriticsegmentcount(i.e.,thenumber
ofdendriticsegmentsper
neuron),DSNdendriticspinenumber
(i.e.,thetotalnumber
ofspines
per
neuron),DSDdendriticspinedensity
(i.e.,thenumber
ofspines
per
lmofdendriticlength),SoSizeneuronalsomasize
inlm
2,SoDepth
depth
oftheneuronal
somain
lm
from
thepialsurface
Brain Struct Funct (2015) 220:2851–2872 2859
123

Aspiny neurons
Aspiny neurons (n = 20, Figs. 3h, 7A–E, 7I–L) were
distributed at various depths (averaging *1,700 lm;
Table 2) in both cortical regions. They were
characterized by rounded somata with straight, minimally
branching dendrites (8.85 ± 4.88 primary dendritic seg-
ments/neuron) that extended up to 600 lm. Two subtypes
of aspiny neurons were noted: multipolar neurons, which
possessed multiple dendrites that extended radially in all
Fig. 5 Sample neurolucida tracings of spiny neurons in the giraffe
primary visual cortex indicating relative soma depth from the pial
surface (in lm): pyramidal neurons (A–J); extraverted neurons (K–
M); crab-like neurons (N, O); horizontal pyramidal neurons (P, Q);
magnopyramidal neurons (R, S). Scale bar 100 lm
Fig. 6 Sample neurolucida tracings of spiny neurons in the giraffe
primary motor cortex indicating relative soma depth from the pial
surface (in lm): pyramidal neurons (A–H); horizontal pyramidal
neurons (I, J); gigantopyramidal neurons (K, L); extraverted neurons
(M–O); magnopyramidal neurons (P, Q). Scale bar 100 lm
2860 Brain Struct Funct (2015) 220:2851–2872
123

directions from the soma (Figs. 7A–D, I–K), and bitufted
neurons (Figs. 3h, 7E, L), which exhibited two dendritic
tufts that extended from opposite poles of the soma.
Sholl analyses indicated that aspiny neurons had the
lowest density of dendritic intersections of all neuron
types (Fig. 8g).
Neurogliaform neurons (n = 9, Figs. 3b, 4c, 7F–H, M–
P), also referred to as ‘‘spiderweb’’ cells (Ramon y Cajal
Fig. 7 Sample neurolucida tracings of aspiny neurons in giraffe
primary visual (A–H) and motor cortices (I–P) indicating relative
soma depth from the pial surface (in lm): multipolar aspiny neurons
(A–D; I–K); bitufted aspiny neurons (E, l); neurogliaform neurons (F–
H; M–P). Scale bar 100 lm
Fig. 8 Sholl analyses of eight cell types indicating relative basilar,
apical, and total dendritic complexity of branching patterns. Dendritic
intersections were quantified at 20-lm intervals using concentric
rings. Neurons a–f were spiny and neurons g and h were aspiny. a–
c had relatively long apical dendrites whereas d, e had shorter apical
dendrites. For all cells, relative dendritic intersections peaked before
200 lm. Apical dendrites either extended much further than the
basilar dendrites (a–c) or were of similar length (d, e)
Brain Struct Funct (2015) 220:2851–2872 2861
123

1922) or ‘‘clewed’’ cells (Valverde 1971), were traced
throughout the cortical layers (average depth *1,300 lm;
Table 2) and exhibited a dense dendritic plexus that arose
in all directions from a rounded soma. Dendrites
(9.44 ± 2.13 primary dendritic segments/neuron) extended
an average of 400 lm with most bifurcations occurring
close to the soma. DSC for neurogliaform neurons was
189 % greater than DSC for other aspiny neurons
(Table 2). Accordingly, Sholl analyses revealed the highest
density of dendritic intersections close to the soma, with
nearly twice as many intersections as any other neuron type
(Fig. 8h).
Regional dendritic variation
Inferential analyses of regional differences were focused
only on pyramidal neurons. Review of cluster analysis
indicated considerable and varying skew and kurtosis in the
distributions of pyramidal dendritic measures between the
two Brains (G1 and G3) and two Regions (Motor and
Fig. 9 A cluster analysis characterizing the six dendritic measures of
pyramidal neurons (n = 136) for Brains G1 (n = 88) and G3
(n = 48) and the visual and motor Regions within those Brains.
Because only a small number of pyramidal neurons (n = 7) were
traced in Brain G2, it was excluded from the cluster analysis. Four
clusters emerged, one for each combination of Brains G1 and G3 and
their two Regions. The first row of the figure provides the number and
percentages of pyramidal neurons falling within each Region of each
Brain (e.g., 50 neurons of the 136 total were from the motor region of
Brain G1, or 36.8 %). Subsequent rows indicate the distributions of
each dendritic measure (e.g., DSD, Volume, DSN, MSL, DSC,
TDL—see Table 2 for abbreviations) for each cluster, with the mean
of these measures above each histogram for that cell (e.g.,
MeanDSD = 0.81 for the Motor Region of G1). The dependent
measures are arranged in relative order of importance from top to
bottom. This qualitative depiction of the data reveals that the
distributions across Visual and Motor Regions within Brain vary
considerably, even for the same dependent measure. For example,
although DSD looks normally distributed for the Visual region within
Brain G3, comparing across brains on DSD reveals considerable skew
and kurtosis in the distributions shown in the corresponding cells. See
text for further details
2862 Brain Struct Funct (2015) 220:2851–2872
123

Visual, Fig. 9). This heterogeneity underscored why con-
ventional statistical tests were inappropriate for additional
quantitative analyses. Decision trees results were incon-
sistent, with significant Brain and asymmetric Region
effects for DSD on Brains G2 and G3 versus G1, and
significant Brain and asymmetric Region effects for Vol on
Brains G2 and G3 versus G1. These distributional results
motivated the use of a GENLIN model with a normal
distribution and an identity link function. Four of the
dependent variable models had a significant Brain main
effect and three had a significant Region within Brain
effect, but only the model for DSD fit the data (Table 3),
indicating a significant difference between Regions for
DSD (motor cortex[ visual cortex) but also underscoring
the extensive variability within the data.
Discussion
Grossly, the giraffe brain appears to be roughly the same size
as the horse (Equus caballus) brain (Meanweight = 599 g;
Cozzi et al. 2014). Cytoarchitectonically, insofar as giraffe
visual cortex exhibits a layer IV, it may differ slightly from
cetartiodactyls such as the pygmy hippopotamus (Butti et al.
2011) and several cetacean species (Morgane et al. 1988;
Glezer and Morgane 1990; Hof et al. 2005; Hof and Van der
Gucht 2007; Oelschlager 2008; Butti et al. 2014a), which
display an agranular cerebral cortex lacking in a detectable
layer IV across all regions. Futher, the cytoarchitecture of the
giraffe cerebral cortex contrasts with that of primate primary
visual cortex, which exhibits an extraordinarily expanded
layer IV that is divided into multiple sublaminae and a pri-
mary motor cortex characterized by a lower cell packing
density, increased overall cortical thickness, and a predomi-
nance of large pyramidal neurons in layer V (Brodmann
1909). Before firm conclusions can be reached, however,
more in depth examination of laminar differentiation using
molecular signatures (e.g., the RORB gene) is warranted to
determine the exact extent of layer IV in the giraffe as well as
other cetartiodactyls (Zeng et al. 2012).
In terms of neuronal morphology, giraffe neurons
appear similar to those documented in other cetartiodac-
tyls, particularly in ungulates (Barasa 1960) and cetaceans
(Butti et al. 2014b). However, there are also some
important differences, both in terms of neuron types and
specific morphologies. Giraffe neocortex exhibits an array
of complex spiny neurons with singular or narrowly
bifurcating apical dendrites contributing to a largely ver-
tical columnar organization similar to typical rodent/pri-
mate cortical organization (Mountcastle 1997; Innocenti
and Vercelli 2010). Quantitatively, although spiny neurons
in the motor cortex tended to be more complex than those
in the visual cortex, inferential analysis of pyramidal
neurons suggested that only DSD measures indicated a
consistent significant regional difference in favor of the
primary motor region. Further interpretation of these
results first requires consideration of several methodolog-
ical issues.
Methodological considerations
Many of the general constraints that apply to Golgi-stained
human materials also apply here, and have been outlined in
more detail elsewhere (Jacobs and Scheibel 2002; Jacobs
et al. 2011): (1) lack of historical information on the sub-
jects (Jacobs et al. 1993); (2) a small sample size in terms
Table 3 Evaluation of effects in initial exploratory models
Dependent
variableaOverall model compared to
intercept only modelbModel fit Pearson
v2 cModel fit
conclusion
Intercept Wald
v2Brain main
effect Wald v2Block within
Brain Wald v2
DSC n.s. v2
(137) = 25,940.9,
p B 0.000
Model does not
fit the data
v2 (1) = 775.5,
p B 0.000
n.s. n.s.
DSD v2 (5) = 64.5, p B 0.000 v2 (137) = 2.9,
p[ 0.05
Model fits the
data
v2 (1) = 5,207.0,
p B 0.000
v2 (2) = 58.4,
p B 0.000
v2 (3) = 19.7,
p B 0.000
DSN v2 (5) = 28.7, p B 0.000 v2 (137) = 2.1E8,
p B 0.000
Model does not
fit the data
v2 (1) = 662.8,
p B 0.000
v2 (2) = 15.6,
p B 0.000
v2 (3) = 20.8,
p B 0.000
MSL v2 (5) = 16.7, p B 0.000 v2 (137) = 19,160.3
p B 0.000
Model does not
fit the data
v2 (1) = 7,525.9,
p B 0.000
v2 (2) = 19.1,
p B 0.000
n.s.
TDL n.s. v2 (137) = 2.1E8,
p B 0.000
Model does not
fit the data
v2 (1) = 811.2,
p B 0.000
n.s. n.s.
Vol v2 (5) = 51.2, p B 0.000 v2 (137) = 4.5E9,
p B 0.000
Model does not
fit the data
v2 (1) = 480.2,
p B 0.000
v2 (2) = 26.2,
p B 0.000
v2 (3) = 35.2,
p B 0.000
a See Table 2 for abbreviationsb A significant result indicates that we can reject H0 that the model is no better than a model with just the intercept termc A significant result indicates that we can reject H0 that the model fits the data (adequately captures sources of variability)
Brain Struct Funct (2015) 220:2851–2872 2863
123
of subjects, with an uneven, limited sampling of neurons
among these subjects (Jacobs and Scheibel 1993); (3)
inherent issues with fixation and Golgi impregnations
(Williams et al. 1978; Braak and Braak 1985) and attenu-
ated dendritic measures because of section thickness
(Jacobs et al. 1997); (4) underestimation of spines in light
microscopy (Horner and Arbuthnott 1991); and (5) prob-
lems of neuronal classification (Germroth et al. 1989;
Masland 2004; Bota and Swanson 2007; DeFelipe et al.
2013) based solely on somatodendritic architecture (Nelson
et al. 2006; The Petilla Interneuron Nomenclature Group
et al. 2008), particularly when biased by an essentially
Euarchontoglires-centric nomenclature in the literature
(Manger et al. 2008).
It should be noted that comparative neuroanatomical
statements based on Golgi impregnations are inherently
constrained because one cannot definitively determine the
presence or absence of cell types. As such, one can only
make general observations about the relative number or
distribution of cell types either within or across species.
Currently, although cytoarchitectural studies have delin-
eated the giraffe primary motor cortex (Badlangana et al.
2007b), the lack of functional information about regions
sampled in the present study preclude firm morphological-
functional correlations in these regions, as has been done in
primates (Elston and Rosa 1998a, b; Jacobs et al. 2001).
Nevertheless, two factors suggest the correct identification
of these two cortical regions in the current sample: (1) the
presence of gigantopyramidal neurons in the primary motor
cortex that resemble Betz cells (Betz 1874), and (2) the
presence of magnopyramidal neurons in the primary visual
cortex that resemble the solitary gigantopyramidal cells of
Meynert (Chan-Palay et al. 1974). As such, the present
neuromorphological descriptions should be relatively
accurate depictions of primary motor and visual cortices in
the giraffe.
Spiny neurons
Spiny neurons in the giraffe ranged from those that were
pyramidal-like (e.g., pyramidal, magnopyramidal, gigant-
opyramidal, and extraverted neurons) to those that were
more atypical in orientation (e.g., horizontal pyramidal
neurons) or structure (e.g., crab-like neurons). Beyond the
results highlighted below, specific comparisons of neuronal
types for each dendritic measure in different cortical
regions across species (e.g., giraffe, bottlenose dolphin,
minke whale, and humpback whale) can be made by
comparing Table 2 of the present paper with Table 1 in
Butti et al. (2014b). The most frequently traced neuron in
the giraffe was the pyramidal neuron, which usually
exhibited either a single apical shaft with associated apical
oblique branches similar to what typifies primate pyramidal
neurons (de Lima et al. 1990), or an acutely bifurcating
apical dendrite similar to what is common in some ungu-
lates, the pygmy hippopotamus, and cetaceans. Specifi-
cally, within ungulates, giraffe pyramidal neurons appear
morphologically similar to those of the pig and sheep, but
differ considerably from those in the horse and cow (Bar-
asa 1960; Ferrer et al. 1986b), both of which exhibit more
widely bifurcating, V-shaped apical dendrites that resemble
those found in the elephant (Jacobs et al. 2011). Giraffe
pyramidal neurons tend to resemble the typical pyramidal
neurons (i.e., possessing a prominent apical dendrite that
may bifurcate some distance from the soma) rather than the
multiapical pyramidal neurons found in the pygmy hippo-
potamus (Butti et al. 2014a). Moreover, giraffe pyramidal
neurons appear qualitatively similar to those in cetaceans,
particularly in terms of apical dendritic morphology (Garey
et al. 1985; Ferrer and Perera 1988; Butti et al. 2014b).
Nevertheless, one pyramidal neuron variant that is promi-
nent in cetaceans does not appear in the giraffe cortex: tri-
tufted pyramidal neurons, which exhibit three primary
dendritic branches, namely an apical and two basilar den-
drites at 90� angles to each other (Butti et al. 2014b). At
this point, it remains unclear whether this particular variant
does not exist in the giraffe or whether they simply did not
stain. The quantitative attributes of pyramidal neurons are
discussed below.
Morphologically similar to giraffe pyramidal neurons
are the much larger magnopyramidal neurons, which were
found exclusively in deeper cortical layers. These neurons
are common in laurasiatherians, having been documented
in classical language areas in humans (Braak 1978; Hayes
and Lewis 1995), and in primate visual cortex as the sol-
itary cells of Meynert (Meynert 1867; le Gros Clark 1942;
Hof et al. 2000). In the giraffe, magnopyramidal neurons in
visual cortex resemble Meynert neurons in the primate,
both in terms of morphology and in terms of their relatively
equal spacing (*400 lm between neurons; Chan-Palay
et al. 1974). This spacing is slightly less than the*500 lmnoted in the humpback whale (Butti et al. 2014b). Quan-
titatively, magnopyramidal neurons in the giraffe were
similar in both Vol and TDL to those documented in the
minke whale (Butti et al. 2014b), making them larger than
those observed in the dolphin (by 82 % for Vol, and by
23 % for TDL), but smaller than those observed in the
humpback whale (by 72 % for Vol, and by 66 % for TDL).
Functionally, to the extent that these neurons evolved in a
species that migrated into open territory, where increased
visual dependence is necessary for predator detection and
survival, their presence in the visual cortex of the current
study may underscore the importance of visual abilities in
giraffes, especially considering that somatic volume of
these neurons has been demonstrated to correlate with
habitat type in primates (Sherwood et al. 2003; Coimbra
2864 Brain Struct Funct (2015) 220:2851–2872
123

et al. 2013). Within ungulates, the giraffe magnopyramidal
neurons clearly resemble pig gigantopyramidal neurons
(Barasa 1960) as well as the magnocellular neurons
observed in layer V of the putative motor cortex in the
pygmy hippopotamus (Butti et al. 2014a); however, both
pig and pygmy hippopotamus magnopyramidal neurons
have apical dendrites that tend to bifurcate further away
from the soma than in the giraffe.
Substantially larger than the magnopyramidal neurons
were the spine-rich gigantopyramidal neurons found in the
deeper layers of giraffe motor cortex. Although the term
‘‘Betz cell’’ has usually been reserved for gigantopyramidal
neurons in layer Vb of human (and, by extension primate)
motor cortex (Braak and Braak 1976; Rivara et al. 2003;
Sherwood et al. 2003), Betz (1874) himself noted smaller
variants in dogs, and others have applied the term to gi-
gantopyramidal neurons in non-primate species (cats:
Crawford and Curtis 1966; Kaiserman-Abramof and Peters
1972; rats: Phillis and Limacher 1974). However, in the
absence of information about the pigmentoarchitecture,
specific connectivity, and functional attributes, it is
impossible to determine if giraffe gigantopyramidal neu-
rons meet the defining criteria for Betz cells. In the present
study, these neurons had a soma size (*1,200 lm2)
comparable to human Betz neurons (Sasaki and Iwata
2001), but were notably larger than those observed by
Badlangana et al. (2007b) in giraffe motor cortex based on
Nissl staining (*600 lm2). Distinguishing magnopyrami-
dal from gigantopyramidal neurons based on soma size is
difficult (Walshe 1942), especially because their dimen-
sions are known to overlap (von Bonin 1938; Rivara et al.
2003). As such, the gigantopyramidal neurons noted in
cresyl violet stains by Badlangana et al. (2007b) may be the
same as the magnopyramidal neurons quantified in the
present Golgi study (soma size = *656 lm2), or they may
simply be smaller variants of gigantopyramidal neurons.
Regardless, both the extensive dendritic Vol and the dis-
tinctive presence of a large number (i.e., *13) of cir-
cumferential dendrites per neuron, which falls within the
range (i.e., 7–15) for Betz cells (Betz 1874), indicate
morphological similarity between the traced gigantopyra-
midal neurons in the giraffe and human Betz cells. Whether
these similarities extend to the functional realm remains
unclear.
Much smaller in scale is a neuronal type found across
many species, the extraverted neuron, which has been
documented in (semi-) aquatic (cetaceans: Kraus and Pil-
leri 1969a, b; Ferrer and Perera 1988; Glezer and Morgane
1990; Hof and Van der Gucht 2007; pygmy hippopotamus:
Butti et al. 2014a) and terrestrial species (opossums, bats,
hedgehogs, monkeys: Sanides and Sanides 1972; quokkas:
Tyler et al. 1998; giant elephant shrews and anteaters:
Sherwood et al. 2009; elephants: Jacobs et al. 2011). Its
appearance as the second most prominent neuronal type
traced in the giraffe motor and visual cortices is therefore
not surprising, and is consistent with our own observations
in cetaceans (Butti et al. 2014b). Overall morphology was
typical of extraverted neurons described previously, with a
relatively wide apical dendritic array that was more
extensive than the more limited basilar dendritic system
(Sanides and Sanides 1972). Quantitatively, extraverted
neurons in the giraffe were larger in both Vol and TDL
than those documented in the dolphin (by 182 % for Vol,
and by 170 % for TDL) and minke whale (by 46 % for
Vol, and by 100 % for TDL), but similar to those observed
in the humpback whale (Butti et al. 2014b). Although
originally believed to represent a more primitive type of
cortical neuron (Sanides and Sanides 1972; Morgane et al.
1985), it seems more likely that extraverted neurons are
common in those species (e.g., giraffe, cetaceans, pygmy
hippopotamus, and African elephant) that possess pre-
dominantly agranular cortices (Jacobs et al. 2011; Butti
et al. 2014a, b). Functionally, the wide apical bouquet of
extraverted neurons in these species facilitates communi-
cation within superficial layers, where many thalamocor-
tical afferents tend to synapse (Sanides and Sanides 1972;
Ferrer 1987, 1989; Ferrer and Perera 1988; Deacon 1990).
The two atypical spiny neurons types traced in the gir-
affe, horizontal pyramidal and crab-like neurons, both
appear to facilitate horizontal integration within the cortex
based on the domain covered by their dendritic arrays (van
Brederode et al. 2000). Consistent with reports in carni-
vores, artiodactyls, and primates, horizontal pyramidal
neurons in the giraffe were located mainly in deep regions
of the sulcus (Ferrer et al.1986b). Horizontal pyramidal
neurons have been documented in several species at vari-
ous cortical depths (bat, rat, dog: Ferrer et al. 1986b; Ferrer
1987; human: Meyer 1987; rodents: Miller 1988; elephant:
Jacobs et al. 2011), including a variety of cetaceans (Kraus
and Pilleri 1969a, b; Garey et al. 1985; Ferrer and Perera
1988). Giraffe horizontal neurons tended to be smaller (in
terms of Vol and TDL) but similar in morphology to those
observed in the deep cortical layers of minke and hump-
back whales (Butti et al. 2014b). In the giraffe, however,
these neurons are located over a broader range of cortical
depths (600–2,900 lm). As in minke and humpback
whales, the giraffe horizontal pyramidal neurons express
roughly the same dendritic extent as pyramidal neurons,
with a basilar array that appears more extensive than that
observed in layer VI of several other species (Ferrer et al.
1986a, b). The axons of the giraffe horizontal neurons
travel parallel with the apical dendrite, much as depicted in
the dog and sheep (Figs. 6 and 9 in Ferrer et al. 1986a),
further indicating horizontal integration within the cortex.
In contrast to the horizontal pyramidal neuron, the crab-
like neuron appears to have no counterpart in the cetacean
Brain Struct Funct (2015) 220:2851–2872 2865
123

neocortex (Butti et al. 2014b), although such a limited
sample from a Golgi impregnation is far from conclusive.
At this point, we cannot rule out that these neurons may be
(a variant of) spiny stellate neurons (White and Rock 1980;
Lubke et al. 2000), and their location in the middle of the
visual cortex is consistent with this possibility. Similar,
albeit larger versions of these neurons have been docu-
mented in the elephant cerebral cortex (Jacobs et al. 2011).
Although precise function of these crab-like neurons
remains unknown, they resemble the bipolar neurons
(Fig. 9 in Ferrer et al. 1986b) and atypical pyramidal
neurons with multiple horizontal branches (Fig. 6 in Ferrer
et al. 1986b) described in the sheep and dog.
The qualitative characteristics of these spiny neurons in
the giraffe lead to two general observations. First, apical
dendritic morphology in the giraffe cortex closely resem-
bles that in cetaceans (Butti et al. 2014b) insofar as most
apical dendrites are either singular, or narrowly bifurcating
after considerable distance from the soma. This is markedly
different from the widely bifurcating, V-shaped apical
dendrites documented in the elephant (Jacobs et al. 2011,
Fig. 10). As such, at least some cetartiodactyls appear to fall
between the largely single apical dendritic architecture
exhibited by anthropoid primate and murid rodents (Esco-
bar et al. 1986; Meyer 1987; de Lima et al. 1990; Innocenti
and Vercelli 2010) and the widely bifurcating apical den-
dritic structure exhibited by elephants (Jacobs et al. 2011).
Second, despite many similarities in spiny neurons between
giraffes and cetaceans, there are also some clear differences
insofar as several spiny neuron types documented in ceta-
ceans do not appear in the present sample: (1) atypical
variations of a variety of documented pyramidal neurons
(i.e., inverted, flattened, multiapical, bitufted, and tri-tufted;
Ferrer and Perera 1988; Marino et al. 2007; Butti et al.
2014b), and (2) Sternzelle, a multipolar, apical-less neuron
that appears to be specific to the cetacean neocortex (Kraus
and Pilleri 1969b). Such neuromorphological differences
within cetartiodactyls, if real rather than the result of sam-
pling biases, should not be surprising as clear differences in
the complement of neuron morphological types have also
been documented in the neocortex within other clades (e.g.,
Afrotheria, Bianchi et al. 2011).
Aspiny neurons
The current findings are consistent with the observation
that the dendritic morphology of aspiny neurons appears
highly conserved among mammals (Hof et al. 1999;
Sherwood et al. 2009). Giraffe aspiny interneurons in the
present sample were characterized by several well-recog-
nized dendritic morphologies (e.g., multipolar, bitufted,
and neurogliaform), which have been identified in several
species (Ferrer et al. 1986a, b; Hassiotis and Ashwell 2003;
Povysheva et al. 2007; Bianchi et al. 2011; Jacobs et al.
2011), including cetaceans (Garey et al. 1985; Ferrer and
Perera 1988; Butti et al. 2014b). These morphologies were
similar across both primary motor and visual cortices.
Quantitatively, the Vol and TDL of aspiny neurons in the
giraffe were generally much smaller than in the humpback
whale (Butti et al. 2014b). Giraffe multipolar and bitufted
aspiny neurons had extensive dendritic radii
(*500–600 lm, Fig. 8g) that are generally longer than
documented in the rat (50–400 lm, Kawaguchi 1995), cat
(50–400 lm, Peters and Regidor 1981; Somogyi et al.
1983), and echidna (100–400 lm, Hassiotis and Ashwell
2003). In comparison to cetaceans, the giraffe aspiny
dendritic radius was longer than documented in the striped
dolphin (100–300 lm, Ferrer and Perea 1988), bottlenose
dolphin (*300 lm), and minke whale (*300–375 lm;
Butti et al. 2014b), and about the same as that observed in
the humpback whale (*470–575 lm, Butti et al. 2014b).
The giraffe aspiny dendritic radius is roughly comparable
to that observed in humans (*500–8,000 lm, Meyer 1987;
Kisvarday et al. 1990) and macaque monkeys (*500 lm,
Lund and Lewis 1993), but smaller than the 1,000-lmlength in the elephant (Jacobs et al. 2011).
Similar results obtained for the giraffe neurogliaform
neurons, which appear to be larger than reported in some
species (e.g., cat: Thompson and Bannister 2003; rat and
monkey: Povysheva et al. 2007) but smaller than those
observed in the elephant (Jacobs et al. 2011). In the
present sample and consistent with the observations of
Ferrer et al. (1986b), they exhibited many more primary
dendritic branches than did other aspiny neurons, but
their dendrites tended to be shorter. Comparison with
cetacean neurogliaform neurons is not possible because
there is only minimal reference to the possibility of this
neuronal type in cetaceans (Glezer and Morgane 1990).
Finally, the relatively large size of these giraffe inter-
neurons, which are presumably c-aminobutyric acid-
(GABA-) ergic (Kisvarday et al. 1986; Hof et al. 1996;
The Petilla Interneuron Nomenclature Group et al. 2008),
suggests the possibility of widespread inhibitory influ-
ences during cortical processing (Constantinidis et al.
2002).
Regional variation between giraffe motor and visual
cortices
Although spiny neurons in motor cortex tended to exhibit
greater dendritic extent and spine numbers than in visual
cortex, there were too few of each neuronal type to allow
for meaningful statistical comparisons. Even for pyrami-
dal neurons, the differences in distribution measures
among the four clusters demonstrated considerable vari-
ability in giraffe neuronal morphology. This conclusion
2866 Brain Struct Funct (2015) 220:2851–2872
123

was futher supported by the significant differences in the
decision tree results. The inability to fit models to the
current giraffe data thus suggests that there are multiple
sources of dendritic measure variability, and that the
present results may be due to actual neural differences
and/or may be artifacts of staining.
Quantitative comparison of pyramidal neurons
across species
To further our understanding of the quantitative morpho-
logical characteristics of giraffe cortical neurons, we
compared the current results with those from other species
Fig. 10 Neurolucida tracings of representative pyramidal neurons in
the frontal cortex of the elephant, visual cortex in humpback whale,
giraffe, and minke whale, and in anterior temporal cortex of
bottlenose dolphin. Note the widely bifurcating apical dendrite in
the elephant and the more narrowly bifurcating apical dendrites in
cetartioldactyls. Neurons were chosen to represent the approximate
averages for each species in terms of total dendritic length. Dependent
measures of typical pyramidal neurons across each species are
presented in bar graphs for relative Vol (a), total dendritic length,
TDL (b), mean segment length, MSL (c), dendritic segment count,
DSC (d), dendritic spine number, DSN (e), and dendritic spine
density, DSD (f). Note that the elephant data represent only
superficial pyramidal neurons. Quantitative dendritic measures (Vol,
TDL, MSL, DSC) indicate that the elephant and humpback whale
generally had more extensive dendrites than giraffes, whereas minke
whale and bottlenose dolphin had less extensive dendritic arbors.
Spine measures (DSN, DSD) were highest in the giraffe and elephant,
perhaps due to perfusion fixation and stain quality. Note that DSN and
DSD for the bottlenose dolphin are not included due to poor
impregnation. Scale bar 100 lm
Brain Struct Funct (2015) 220:2851–2872 2867
123

quantified with the same methodology. Specifically, we
compared the dendritic morphology of pyramidal neurons
in the giraffe with the same measurements obtained from
pyramidal neurons in different cortical regions of the
African elephant and three cetacean species (bottlenose
dolphin, minke whale, and humpback whale; see Table 4).
Although these are clearly not ideal comparisons due to the
number of uncontrolled factors (e.g., small sample size,
subjects of different ages, regional and associated func-
tional cortical variations, perfusion vs. immersion fixation),
methodologically similar quantitative analyses provide at
least a preliminary, relative measure for such comparisons
among these species.
A total of 260 pyramidal neurons were compared for
dendritic (Vol, TDL, MSL, DSC) and spine (DSN, DSD)
measures, as well as for soma size (Table 4). Results are
summarized graphically in Fig. 10. In terms of Vol, the
humpback whale had much higher values than the other
species, with the dolphin being the lowest (Fig. 10a). TDL
revealed the giraffe to be roughly in the middle, the ele-
phant and humpback whale at the upper end, and the minke
whale and bottlenose dolphin at the lower end (Fig. 10b).
MSL was lowest in the dolphin, but was much higher in the
elephant than in the other species (Fig. 10c), which is
consistent with previous observations suggesting that cor-
tical neurons in the elephant are characterized by less
branchy but particularly long dendrites (Jacobs et al. 2011).
For DSC, the humpback whale value was higher than all of
the other species, with the minke whale being lowest
(Fig. 10d). Elephant and especially giraffe pyramidal
neurons generally exhibited the highest spine values
(Fig. 10e, f), perhaps reflecting the quality of the perfusion
fixation used for these brains, and subsequent high stain
quality, over the immersion fixation for the cetacean brains
(Morest and Morest 2005).
Although dendritic systems may scale with brain size
within a particular lineage (Elston et al. 2006; Elston and
Manger 2014), and although we have previously docu-
mented a consistent positive correlation between soma size
and dendritic extent in humans (Jacobs et al. 2001, 2011),
individual dendritic and spine measures do not consistently
differentiate the species in the present sample. The current
data cannot resolve whether dendritic measures scale with
brain size across these diverse species, in part because (1) a
confluence of several dendritic/spine measures may be
needed to detect species differences (Jacobs et al. 2014),
and/or (2) dendritic and especially spine measures are
confounded by differential fixation and stain quality across
brains. Nevertheless, there does appear to be a positive
relationship between brain mass and soma size in some
studies (Haug 1987; Purves 1988; Changizi 2001; Sher-
wood et al. 2003). In the present sample, soma size and
brain mass increased in a similar manner (Table 4):
giraffe\ dolphin\minke whale\ elephant and hump-
back whale. Indeed, a Spearman’s rho correlation between
soma size and brain mass was positive (r(260) = 0.52,
p = 0.0001). Further, Spearman’s rho correlations between
soma size and dendritic measures were positive for all
measures except DSD (Vol: r(260) = 0.62, p = 0.0001;
TDL: r(260) = 0.49, p = 0.0001; MSL: r(260) = 0.34,
p = 0.0001; DSC: r(260) = 0.32, p = 0.0001; DSN:
r(260) = 0.20, p = 0.001; DSD: r(260) = -0.19,
p = 0.002). These findings contribute to existing data on
the relationship between neuronal measures and brain
Table 4 Demographics of species in pyramidal neuron comparisons arranged by brain mass (high to low)
Elephanta Humpback Whaleb Minke Whaleb Bottlenose Dolphinb Giraffe
Age/sex 20–30 year-old
adult males
(n = 2)
Juvenile male (n = 1) Young female
(n = 1)
Adult, unknown age/
gender (n = 1)
Sub-adult male
(n = 3)
Fixation methodc Perfusion Immersion (AT\ 8 h) Immersion
(AT\ 48 h)
Immersion (AT\ 2 h) Perfusion
Region sampledd RH visual and
frontal cortices
LH visual, frontal, anterior, and
posterior temporal cortices
LH visual and
motor cortices
LH visual and anterior
temporal cortices
RH motor and
visual cortices
MeanSoma depth (lm)e 794 ± 289 1,173 ± 327 1,222 ± 575 792 ± 289 988 ± 419
MeanBrain mass (g) 4,990 3,603 1,810 1,250 539
MeanSoma size (lm2)f 516 ± 123 524 ± 98 370 ± 84 357 ± 140 324 ± 96
nPyramidal neurons 40 20 24 33 143
a From Jacobs et al. (2011)b From Butti et al. (2014b)c AT autolysis timed RH right hemisphere, LH left hemispheree The soma depth (mean ± SD) in the elephant is less because only superficial (as opposed to deeper) pyramidal neurons were includedf Soma size is represented by mean ± SD
2868 Brain Struct Funct (2015) 220:2851–2872
123

mass, a multifaceted relationship complicated by func-
tional design principles and lineage-specific deviations
(Haug 1987; Kaas 2000; Changizi 2001; Elston et al. 2001;
Harrison et al. 2002; Wittenberg and Wang 2007).
In conclusion, the present study provides the first doc-
umentation of neuronal morphology in the giraffe neocor-
tex, which exhibits a variety of extensively spiny neuron
types arranged in a predominantly vertically oriented cor-
tical architecture. Several similarities appear to exist
between the giraffe and other cetartiodactyls. In particular,
giraffe cortices, like those in cetaceans, but not other art-
iodactyls, exhibit pyramidal neurons with either singular or
narrowly bifurcating apical dendritic shafts, and superficial
layers that contain extraverted neurons. However, clear
differences between giraffe and cetacean cortices are also
apparent in the relative presence/absence of Sternzelle,
neurogliaform neurons, crab-like neurons, and several
pyramidal neuron variants (e.g. the tri-tufted pyramidal
neuron). In these ways, giraffes may be more closely
aligned with other artiodactyls than they are to cetaceans,
although more comparative research is clearly required.
Quantitatively, pyramidal neuron morphometry tentatively
places giraffes in the middle of a cross-species comparison
for dendritic measures, with the elephant and the humpback
whale at the upper end, and the minke whale and dolphin at
the lower end. Nevertheless, data are limited at this point
because of methodological issues, with more extensive
neuromorphological studies across a variety of large brai-
ned mammals of different brain sizes required for a clearer
picture to emerge.
Acknowledgments Partial support for this work was provided by
Colorado College’s divisional research funds (B.J.), the James S.
McDonnell Foundation (Grant 22002078, to C.C.S., P.R.H.; Grant
220020293 to C.C.S.), National Science Foundation (BCS-0515484,
BCS-0824531 to C.C.S.), and the South African National Research
Foundation (P.R.M.; FA2005033100004). We would also like to
thank the Danish Cardiovascular Research Program, especially Emil
Toft-Brøndum, for allowing us to obtain the specimens of giraffe
brains.
References
Anderson K, Bones B, Robinson B, Hass C, Lee H, Ford K, Roberts
T-A, Jacobs B (2009) The morphology of supragranular
pyramidal neurons in the human insular cortex: a quantitative
Golgi study. Cereb Cortex 19:2131–2144
Badeer HS (1997) Is the flow in the giraffe’s jugular vein a ‘‘free’’
fall? Comp Biochem Physiol A 118:573–576
Badlangana NL, Bhagwandin A, Fuxe K, Manger PR (2007a)
Distribution and morphology of putative catecholaminergic and
serotonergic neurons in the medulla oblongata of a sub adult
giraffe, Giraffa camelopardalis. J Chem Neuroanat 34:69–79
Badlangana NL, Bhagwandin A, Fuxe K, Manger PR (2007b)
Observations on the giraffe central nervous system related to the
corticospinal tract, motor cortex and spinal cord: what difference
does a long neck make? Neurosci 148:522–534
Badlangana NL, Adams JW, Manger PR (2009) The giraffe (Giraffa
camelopardalis) cervical vertebral column: a heuristic example
in understanding evolutionary processes? Zool J Linn Soc
155:736–757
Barasa A (1960) Forma, grandezza e densita dei neuroni della
corteccia cerebrale in mammiferi di grandezza corporea differ-
ente. Z Zellforsch 53:69–89
Bashaw MJ (1993) Social behavior and communication in a heard of
captive giraffe. Dissertation, Georgia Institute of Technology
Bashaw MJ, Bloomsmith MA, Maple TL, Bercovitch FB (2007) The
structure of social relationships among captive female giraffe
(Giraffe camelopardalis). J Comp Psychol 121:46–53
Bercovitch FB, Berry PSM (2013) Herd composition, kinship and
fission-fusion social dynamics among wild giraffe. Afr J Ecol
51:206–216
Bercovitch FB, Bashaw MJ, del Castillo SM (2006) Sociosexual
behavior, male mating tactics, and the reproductive cycle of
giraffe Giraffa camelopardalis. Horm Behav 50:314–321
Betz W (1874) Anatomischer Nachweis zweier Gehirncentra. Zbl
med Wiss 12(578–580):595–599
Bianchi S, Bauernfeind AL, Gupta K, Stimpson CD, Spocter MA,
Bonar CJ, Manger PR, Hof PR, Jacobs B, Sherwood CC (2011)
Neocortical neuron morphology in Afrotheria: comparing the
rock hyrax with the African elephant. Ann NY Acad Sci
1225:37–46
Boddy AM, McGowen MR, Sherwood CC, Grossman LI, Goodman
M, Wildman DE (2012) Comparative analysis of encephalization
in mammals reveals relaxed constraints on anthropoid primate
and cetacean brain scaling. J Evol Biol 25:981–994
Bok ST (1959) Histonomy of the cerebral cortex. Elsevier,
Amsterdam
Bota M, Swanson LW (2007) The neuron classification problem.
Brain Res Rev 56:79–88
Braak H (1978) On magnopyramidal temporal fields in the human
brain—probable morphological counterparts of Wernicke’s
speech region. Anat Embryol 152:141–169
Braak H, Braak E (1976) The pyramidal cells of Betz within the
cingulate and precentral gigantopyramidal field in the human
brain: a Golgi and pigmentarchitectonic study. Cell Tiss Res
172:103–119
Braak H, Braak E (1985) Golgi preparations as a tool in neuropa-
thology with particular reference to investigations of the human
telencephalic cortex. Prog Neurobiol 25:93–139
Brodmann K (1909) Vergleichende Lokalisationlehre der Grosshirnr-
inde in ihren Prinzipien dargestellt auf Grund des Zellenbaues.
J. A. Barth, Leipzig
Butti C, Raghanti MA, Sherwood CC, Hof PR (2011) The neocortex
of cetaceans: cytoarchitecture and comparison with other aquatic
and terrestrial species. Ann NY Acad Sci 1225:47–58
Butti C, Fordyce ER, Raghanti MA, Gu X, Bonar CJ, Wicinski BA,
Wong EW, Roman J, Brake A, Eaves E, Spocter MA, Tang CY,
Jacobs B, Sherwood CC, Hof PR (2014a) The cerebral cortex of
the pygmy hippopotamus, Hexaprotodon liberiensis (Cetartio-
dactyla, Hippopotamidae): MRI, cytoarchitecture, and neuronal
morphology. Anat Rec 297:670–700
Butti C, Janeway CM, Townshend C, Ridgway SH, Manger PR,
Sherwood CC, Hof PR, Jacobs B (2014b) Neuronal morphology
in cetartiodactyls. I. A comparative Golgi analysis of neuronal
morphology in the bottlenose dolphin (Tursiops truncatus), the
minke whale (Balaenoptera acutorostrata), and the humpback
whale (Megaptera novaeangliae). Brain Struct Funct (submitted)
Bux F, Bhagwandin A, Fuxe K, Manger PR (2010) Organization of
cholinergic, putative catecholaminergic and serotonergic nuclei
Brain Struct Funct (2015) 220:2851–2872 2869
123

in the diencephalon, midbrain and pons of sub-adult male
giraffes. J Chem Neuroanat 39:189–203
Carter KD, Seddon JM, Frere CH, Carter JK, Goldizen AW (2012)
Fission-fusion dynamics in wild giraffes may be driven by
kinship, spatial overlap and individual social preferences. Anim
Behav 85:385–394
Changizi MA (2001) Principles underlying mammalian neocortical
scaling. Biol Cybern 84:207–215
Chan-Palay V, Palay SL, Billings-Gagliardi SM (1974) Meynert cells
in primate visual cortex. J Neurocytol 3:631–658
Clemo HR, Meredith MA (2012) Dendritic spine density in multi-
sensory versus primary sensory cortex. Synapse 66:714–724
Coe MJ (1967) ‘‘Necking’’ behavior in the giraffe. J Zool Lond
151:313–321
Coimbra JP, Hart NS, Collin SP, Manger PR (2013) Scene from
above: retinal ganglion cell topography and spatial resolving
power in the giraffe (Giraffa camelopardalis). J Comp Neurol
521:2042–2057
Constantinidis C, Williams GC, Goldman-Rakic PS (2002) A role for
inhibition in shaping the temporal flow of information in
prefrontal cortex. Nat Neurosci 5:175–180
Cozzi B, Povinelli M, Ballarin C, Granato A (2014) The brain of the
horse: weight and cephalization quotients. Brain Behav Evol
83:9–16
Crawford JM, Curtis DR (1966) Pharmacological studies on feline
Betz cells. J Physiol 186:121–138
Crile G, Quiring DP (1940) A record of the body weight and certain
organ and gland weights of 3690 animals. Ohio J Sci 40:219–259
de Lima AD, Voigt T, Morrison JH (1990) Morphology of the cells
within the inferior temporal gyrus that project to the prefrontal
cortex in the macaque monkey. J Comp Neurol 296:159–172
Deacon TW (1990) Rethinking mammalian brain evolution. Am Zool
30:629–705
DeFelipe J, Alonso-Nanclares L, Arellano JI (2002) Microstructure of
the neocortex: comparative aspects. J Neurocytol 31:299–316
DeFelipe J, Lopez-Cruz PL, Benavides-Piccione R, Bielza C,
Larranaga P, Anderson S, Burkhalter A, Cauli B, Fairen A,
Feldmeyer D, Fishell G, Fitzpatrick D, Freund TF, Gonzalez-
Burgos G, Hestrin S, Hill S, Hof PR, Huang J, Jones EG,
Kawaguchi Y, Kisvarday Z, Kubota Y, Lewis DA, Marın O,
Markram H, McBain CJ, Meyer HS, Monyer H, Nelson SB,
Rockland K, Rossier J, Rubenstein JLR, Rudy B, Scanziani M,
Shepherd GM, Sherwood CC, Staiger JF, Tamas G, Thomson A,
Wang Y, Yuste R, Ascoli GA (2013) New insights into the
classification and nomenclature of cortical GABAergic inter-
neurons. Nat Rev Neurosci 14:202–216
Dell L-H, Patzke N, Bhagwandin A, Bux F, Fuxe K, Barber G, Siegel
JM, Manger PR (2012) Organization and number of orexinergic
neurons in the hypothalamus of two species of Cetartiodactyla: a
comparison of giraffe (Giraffa camelopardalis) and harbour
porpoise (Phocoena phocoena). J Chem Neuroanat 44:98–109
Elston GN (2003) Cortex, cognition and the cell: new insights into the
pyramidal neuron and prefrontal function. Cereb Cortex
13:1124–1138
ElstonGN(2007)Specializationof theneocortical pyramidal cell during
primate evolution. In: Kass JH, Preuss TM (eds) Evolution of
nervous systems: a comprehensive reference, vol 4. Elsevier, New
York, pp 191–242
Elston GN, Manger P (2014) Pyramidal cells in V1 of African rodents
are bigger, more branched and more spiny than those in
primates. Front Neuroanat 8:4. doi:10.3389/fnana.2014.00004
Elston GN, Rosa MGP (1998a) Complex dendritic fields of pyramidal
cells in the frontal eye field of the macaque monkey: comparison
with parietal areas 7a and LIP. Neuroreport 9:127–131
Elston GN, Rosa MGP (1998b) Morphological variation of layer III
pyramidal neurones in the occipitotemporal pathway of the
macaque monkey visual cortex. Cereb Cortex 8:278–294
Elston GN, Benavides-Piccione R, DeFelipe J (2001) The pyramidal
cell in cognition: a comparative study in human and monkey.
J Neurosci 21:RC163
Elston GN, Benavides-Piccione R, Elston A, Zietsch B, Defelipe J,
Manger P, Casagrande V, Kaas JH (2006) Specializations of the
granular prefrontal cortex of primates: implications for cognitive
processing. Anat Rec 288:26–35
Escobar MI, Pimienta H, Caviness VS Jr, Jacobson M, Crandall JE,
Kosik KS (1986) Architecture of apical dendrites in the murine
neocortex: dual apical dendritic systems. Neuroscience
17:975–989
Fernandez MA, Vrba ES (2005) A complete estimate of the
phylogenetic relationships in Ruminantia: a dated species-levelsupertree of the extant ruminants. Biol Rev 80:269–302
Ferrer I (1987) The basic structure of the neocortex in insectivorous
bats (Miniopterus sthreibersi and Pipistrellus pipistrellus).
J Hirnforsch 28:237–243
Ferrer I (1989) The basic structure of the neocortex of the bat.
Neurosci Res 6:573–580
Ferrer I, Perera M (1988) Structure and nerve organization in the
cerebral cortex of the dolphin Stenella coeruleoalba a Golgi
study: with special attention to the primary auditory area. Anat
Embryol 178:161–173
Ferrer I, Fabrigues I, Condom E (1986a) A Golgi study of the sixth
layer of the cerebral cortex I. The lissencephalic brain of
Rodentia, Lagomorpha. Insectivora and Chiroptera. J Anat
145:217–234
Ferrer I, Fabrigues I, Condom E (1986b) A Golgi study of the sixth
layer of the cerebral cortex II. The gyrencephalic brain of
Carnivora. Artiodactyla and primates. J Anat 146:87–104
Friant M (1968) Developpement et morphologie du cerveau des
giraffidae (Okapi et Girafe) [The development and morphology
of the brain of giraffidae (okapi and giraffe)]. Acta Neurol Belg
68:483–498
Garey LJ, Winkllemann E, Brauer K (1985) Golgi and Nissl studies of
the visual cortex of the bottlenose dolphin. J Comp Neurol
240:305–321
Germroth P, Schwerdtfeger WK, Buhl EH (1989) Morphology of
identified entorhinal neurons projecting to the hippocampus. A
light microscopical study combining retrograde tracing and
intracellular injection. Neuroscience 30:683–691
Glezer II, Morgane PJ (1990) Ultrastructure of synapses and Golgi
analysis of neurons in neocortex of the lateral gyrus (visual
cortex) of the dolphin and pilot hale. Brain Res Bull 24:401–427
Graur D, Higgins DG (1994) Molecular evidence for the inclusion of
cetaceans within the order Artiodactyla. Mol Biol Evol
11:357–364
Harrison KH, Hof PR, Wang SS-H (2002) Scaling laws in the
mammalian neocortex: does form provide clues to function?
J Neurocytol 31:289–298
Hassanin A, Douzery EJP (2003) Molecular and morphological
phylogenies of Ruminantia and the alternative position of the
Moschidae. Syst Biol 52:206–228
Hassiotis M, Ashwell KWS (2003) Neuronal classes in the isocortex
of a monotreme, the Australian echidna (Tachyglossus aculea-
tus). Brain Behav Evol 61:6–27
Haug H (1987) Brain sizes, surfaces, and neuronal sizes of the cortex
cerebri: a stereological investigation of man and his variability
and a comparison with some mammals (primates, whales,
marsupials, insectivores, and one elephant). Am J Anat
180:126–142
2870 Brain Struct Funct (2015) 220:2851–2872
123

Hawkins DM, Kass GV (1982) Automatic interaction detection. In:
Hawkins D (ed) Topics in applied multivariate analysis.
University of Cambridge Press, Cambridge, pp 269–302
Hayes TL, Lewis DA (1995) Anatomical specialization of the anterior
motor speech area: hemispheric differences in magnopyramidal
neurons. Brain Lang 49:289–308
Hof PR, Sherwood CC (2005) Morphomolecular neuronal phenotypes
in the neocortex reflect phylogenetic relationships among certain
mammalian orders. Anat Rec 287:1153–1163
Hof PR, Sherwood CC (2007) The evolution of neuron classes in the
neocortex of mammals. In: Krubitzer LA, Kaas H (eds) The
evolution of nervous systems in mammals. Evolution of nervous
systems, vol 3. Academic Press, Oxford pp 113–124
Hof PR, Van der Gucht E (2007) Structure of the cerebral cortex of
the humpback whale, Megaptera novaeangliae (Cetacea, Mys-
ticeti, Balaenopteridae). Anat Rec 290:1–31
Hof PR, Bogaert YE, Rosenthal RE, Fiskum G (1996) Distribution of
neuronal populations containing neurofilament protein and
calcium-binding proteins in the canine neocortex: regional
analysis and cell typology. J Chem Neuroanat 11:81–98
Hof PR, Glezer II, Conde F, Flagg RA, Rubin MB, Nimchinsky EA,
Vogt Weisenhorn DM (1999) Cellular distribution of the
calcium-binding proteins parvalbumin, calbindin, and calretinin
in the neocortex of mammals: phylogenetic and developmental
patterns. J Chem Neuroanat 16:77–116
Hof PR, Nimchinsky EA, Young WG, Morrison JH (2000) Numbers
of meynert and layer IVB cells in area V1: a stereologic analysis
in young and aged macaque monkeys. J Comp Neurol
420:113–126
Hof PR, Chanis R, Marino L (2005) Cortical complexity in cetacean
brains. Anat Rec 287A:1142–1152
Horner CH, Arbuthnott E (1991) Methods of estimation of spine
density—are spines evenly distributed throughout the dendritic
field? J Anat 177:179–184
Innis AC (1958) The behavior of the giraffe, Giraffa camelopardalis,
in the eastern Transvaal. Proc Zool Soc Lond 131:245–278
Innocenti GM, Vercelli A (2010) Dendritic bundles, minicolumns,
columns, and cortical output units. Front Neuroanat 4:11. doi:10.
3389/neuro.05.011.2010
Jacobs B, Scheibel AB (1993) A quantitative dendritic analysis of
Wernicke’s area in humans I. Lifespan changes. J Comp Neurol
327:83–96
Jacobs B, Scheibel AB (2002) Regional dendritic variation in primate
cortical pyramidal cells. In: Schuz A, Miller R (eds) Cortical
areas: unity and diversity (conceptual advances in brain research
series). Taylor & Francis, London, pp 111–131
Jacobs B, Schall M, Scheibel AB (1993) A quantitative dendritic
analysis of Wernicke’s area in humans II. Gender, hemispheric,
and environmental factors. J Comp Neurol 327:97–111
Jacobs B, Driscoll L, Schall M (1997) Life-span dendritic and spine
changes in areas 10 and 18 of human cortex: a quantitative Golgi
study. J Comp Neurol 386:661–680
Jacobs B, Schall M, Prather M, Kapler E, Driscoll L, Baca S (2001)
Regional dendritic and spine variation in human cerebral cortex:
a quantitative Golgi study. Cereb Cortex 11:558–571
Jacobs B, Lubs J, Hannan M, Anderson K, Butti C, Sherwood CC,
Hof PR, Manger PR (2011) Neuronal morphology in the African
elephant (Loxodonta africana) neocortex. Brain Struct Funct
215:273–298
Jacobs B, Johnson N, Wahl D, Schall M, Maseko BC, Lewandowski
A, Raghanti MA, Wicinski B, Butti C, Hipkins WD, Bertelsen
MF, Reep RL, Hof PR, Sherwood CC, Manger PR (2014)
Comparative neuronal morphology of cerebellar cortex in
afrotherians (African elephant, Florida manatee), primates
(human, common chimpanzee), cetartiodactyls (humpback
whale, giraffe), and carnivores (Siberian tiger, clouded leopard).
Front Neuroanat 8:24. doi:10.3389/fnana.2011.00024
Kaas JH (2000) Why is brain size so important: design problems and
solutions as neocortex gets bigger or smaller. Brain Mind 1:7–23
Kaiserman-Abramof IR, Peters A (1972) Some aspects of the
morphology of Betz cells in the cerebral cortex of the cat. Brain
Res 43:527–546
Kawaguchi Y (1995) Physiological subgroups of nonpyramidal cells
with specific morphological characteristics in layer II/III of rat
frontal cortex. J Neurosci 15:2638–2665
Kisvarday ZF, Cowey A, Somogyi P (1986) Synaptic relationships of
a type of GABA-immunoreactive neuron (clutch cell), spiny
stellate cells and lateral geniculate nucleus afferents in layers
IVC of the monkey striate cortex. Neurosci 19:741–761
Kisvarday ZF, Gulyas A, Beroukas D, North JB, Chub IW, Somogyi
P (1990) Synapses, axonal and dendritic patterns of GABA-
immunoreactive neurons in human cerebral cortex. Brain
113:793–812
Kraus C, Pilleri G (1969a) Zur Feinstruktur der groben Pyramidenz-
ellen in der V. Cortexschicht der Cetacean (Delphinus delphins
und Balaenoptera borealis). Z Mikrosk Anat Forsch 80:89–99
Kraus C, Pilleri G (1969b) Zur Histologie der Grosshirnrinde von
Balaenoptera borealis (Cetacea, Mysticeti) Invest Cetacea
1:151–170
le Gros Clark WE (1942) The cells of Meynert in the visual cortex of
the monkey. J Anat 76:369–376
Lu D, He L, Xiang W, Ai W-M, Cao Y, Wang X-S, Pan A, Luo X-G,
Li Z, Yan X–X (2013) Somal and dendritic development of
human CA3 pyramidal neurons from midgestation to middle
childhood: a quantitative Golgi study. Anat Rec 296:123–132
Lubke J, Egger V, Sakmann B, Feldmeyer D (2000) Columnar
organization of dendrites and axons of single and synaptically
coupled excitatory spiny neurons in layer 4 of the rat barrel
cortex. J Neurosci 10:5300–5311
Lund JS, Lewis DA (1993) Local circuit neurons of the developing
mature macaque prefrontal cortex: Golgi and immunocytochem-
ical characteristics. J Comp Neurol 328:282–312
Manger PR, Cort J, Ebrahim N, Goodman A, Henning J, Karolia M,
Rodrigues S-L, Strkalj G (2008) Is 21st century neuroscience too
focused on the rat/mouse model of the brain function and
dysfunction? Front Neuroanat 2:5. doi:10.3389/neuro.05.005.2008
Manger PR, Pillay P, Maseko BC, Bhagwandin A, Gravett N, Moon
D-J, Jillani N, Hemingway J (2009) Acquisition of brains from
the African elephant (Loxodonta africana): perfusion-fixation
and dissection. J Neurosci Methods 179:16–21
Marino L, Connor RC, Fordyce RE, Herman LM, Hof PR, Lefebvre
L, Lusseau D, McCowan B, Nimchinsky EA, Pack AA, Rendell
L, Reidenberg JS, Reiss D, Uhen MD, Van der Gucht E,
Whitehead H (2007) Cetaceans have complex brains for
complex cognition. PLoS Biol 5:966–972
Masland RH (2004) Neuronal cell types. Curr Biol 14:R497–R500
Meyer G (1987) Forms and spatial arrangement of neurons in the
primary motor cortex of man. J Comp Neurol 262:402–428
Meynert T (1867) Der Bau der Gross-Hirnrinde und seiner ortlichen
Verschiedenheiten, nebst einen pathologisch-anatomisch Corol-
larium. Vierteljahrsschr Psychiatr 1(77–93):125–217
Miller MW (1988) Maturation of rat visual cortex: IV. The
generation, migration, morphogenesis and connectivity of atyp-
ical oriented pyramidal cells. J Comp Neurol 274:387–405
Mitchell G, Bobbitt JP, Devries S (2008) Cerebral perfusion pressure
in giraffe: modeling the effects of head-raising and -lowering.
J Theor Biol 252:98–108
Morest DK, Morest RR (2005) Perfusion-fixation of the brain with
chrome-osmium solutions for the rapid Golgi method. Am J
Anat 118:811–831
Brain Struct Funct (2015) 220:2851–2872 2871
123

Morgane PJ, Jacobs MS, Galaburda A (1985) Conservative features
of neocortical evolution in dolphin brain. Brain Behav Evol
26:176–184
Morgane PJ, Glezer LI, Jacobs MS (1988) Visual cortex of the
dolphin: an image analysis study. J Comp Neurol 273:3–25
Mountcastle VB (1997) The columnar organization of the neocortex.
Brain 120:701–722
Murphy WJ, Pevzner PA, O’Brien SJ (2004) Mammalian phyloge-
nomics comes of age. Trends Genet 20:631–639
Nelson SB, Sugino K, Hempel CM (2006) The problem of neuronal
cell types: a physiological genomics approach. Trends Neurosci
29:339–345
Ngowyang G (1932) Beschreibung einer Art von Specialzellen in der
Inselrinde. J Psychol Neurol 44:671–674
Nikaido M, Rooney AP, Okada N (1999) Phylogenetic relationships
among cetartiodactyls based on insertions of short and long
interspersed elements: hippopotamuses are the closest extant
relatives of whales. Proc Natl Acad Sci USA 96:10261–10266
Nilsson O, Booj S, Dahlstrom A, Hargens AR, Millard RW,
Pettersson KS (1988) Sympathetic innervation of the cardiovas-
cular system in the giraffe. Blood Vessels 25:299–307
Oelschlager HA (2008) The dolphin brain—a challenge for synthetic
neurobiology. Brain Res Bull 75:450–459
Perez-Barberıa FJ, Gordon IJ (2005) Gregariousness increases brain
size in ungulates. Oecologia 145:41–52
Peters A, Regidor J (1981) A reassessment of the forms of
nonpyramidal neurons in area 17 of cat visual cortex. J Comp
Neurol 203:685–716
Phillis JW, Limacher JJ (1974) Substance P excitation of cerebral
cortical Betz cells. Brain Res 69:158–163
Povysheva NV, Zaitsev AV, Kroner S, Krimer OA, Rotaru DC,
Gonzalez-Burgos G, Lewis DA, Krimer LS (2007) Electrophys-
iological differences between neurogliaform cells from monkey
and rat prefrontal cortex. J Neurophysiol 97:1030–1039
Price SA, Bininda-Edmonds ORP, Gittleman JL (2005) A complete
phylogeny of whales, dolphins and even-toed hoofed mammals
(cetartiodactyls). Biol Rev 80:445–473
Purves D (1988) Body and brain: a trophic theory of neural
connections. Harvard University Press, Cambridge
Radinsky L (1981) Brain evolution in extinct South American
ungulates. Brain Behav Evol 18:169–187
Ramon y Cajal S (1922) Studien uber die Sehrinde der Katze.
J Psychol Neurol 29:161–181
Rivara C, Sherwood C, Bouras C, Hof PR (2003) Stereological
characterization and spatial distribution patterns of Betz cells in
the human primary motor cortex. Anat Record 270:137–148
Roitman MF, Na E, Anderson G, Jones TA, Bernstein IL (2002)
Induction of a salt appetite alters dendritic morphology in
nucleus accumbens and sensitizes rats to amphetamine. J Neu-
rosci 22:RC225 (1–5)
Sanides F, Sanides D (1972) The ‘‘extraverted neurons’’ of the
mammalian cerebral cortex. Z Anat Entwickl-Gesch
136:272–293
Sasaki S, Iwata M (2001) Ultrastuctural study of Betz cells in the
primary motor cortex of human brain. J Anat 199:699–708
Scheibel ME, Scheibel AB (1978a) The dendritic structure of the
human Betz cell. In: Brazier MAB, Pets H (eds) Architectonics
of the cerebral cortex. Raven Press, New York, pp 43–57
Scheibel ME, Scheibel AB (1978b) The methods of Golgi. In:
Robertson RT (ed) Neuroanatomical research techniques. Aca-
demic Press, New York, pp 89–114
Sherwood CC, Lee PWH, Rivara CB, Holloway RL, Gilissen EPE,
Simmons RMT, Hakeem A, Allman JM, Erwin JM, Hof PR
(2003) Evolution of specialized pyramidal neurons in primate
visual and motor cortex. Brain Behav Evol 61:28–44
Sherwood CC, Stimpson CD, Butti C, Bonar CJ, Newton AL, Allman
JM, Hof PR (2009) Neocortical neuron types in Xenarthra and
Afrotheria: implications for brain evolution in mammals. Brain
Struct Funct 213:301–328
Shimamura M, Yasue H, Ohshima K, Abe H, Kato H, Kishiro T, Goto
M, Munechika I, Okada N (1997) Molecular evidence from
retroposons that whales form a clade within even-toed ungulates.
Nature 388:666–671
Sholl DA (1953) Dendritic organization of the neurons of the visual
and motor cortices of the cat. J Anat 87:387–406
Shultz S, Dunbar RIM (2006) Both social and ecological factors
predict ungulate brain size. Proc R Soc B 273:207–215
Solounias N (1999) The remarkable anatomy of the giraffe’s neck.
J Zool (London) 247:257–268
Somogyi P, Kisvarday ZF, Martin KAC, Whitteridge D (1983)
Synaptic connections of morphologically characterized large
basket cells in the striate cortex of cat. Neuroscience 10:261–294
Tarou LR, Bashaw MJ, Maple TL (2000) Social attachment in giraffe:
response to social separation. Zoo Biol 19:41–51
The Petilla Interneuron Nomenclature Group (PING) (2008) Petilla
terminology: nomenclature of features of GABAergic interneu-
rons of the cerebral cortex. Nat Rev Neurosci 9:557–568
Thompson AM, Bannister AP (2003) Interlaminar connections in the
neocortex. Cereb Cortex 13:5–14
Tyler CJ, Dunlop SA, Lund RD, Harman AM, Dann JF, Beazley LD
(1998) Anatomical comparison of the macaque and marsupial
visual cortex: common features that may reflect retention of
essential cortical elements. J Comp Neurol 400:449–468
Ursing BM, Arnason U (1998) Analyses of mitochondrial genomes
strongly support a hippopotamus-whale clade. Proc R Soc Lond
B265:2251–2255
Uylings HBM, Ruiz-Marcos A, van Pelt J (1986) The metric analysis
of three-dimensional dendritic tree patterns: a methodological
review. J Neurosci Methods 18:127–151
Valverde F (1971) Short axon neuronal subsystems in the visual
cortex of the monkey. Int J Neurosci 1:181–197
van Brederode JFM, Foehring RC, Spain WJ (2000) Morphological
and electrophysiological properties of atypically oriented layer 2
pyramidal cells of the juvenile rat neocortex. Neuroscience
101:851–861
Van der Jeugd HP, Prins HP (2000) Movements and group structure
of giraffe (Giraffa camelopardalis) in Lake Manyara National
Park, Tanzania. J Zool 251:15–21
von Bonin G (1938) Studies of the size of the cells in the cerebral
cortex. II. The motor area of man, cebus and cat. J Comp Neurol
69:381–390
Walshe FM (1942) The giant cells of Betz, the motor cortex and the
pyramidal tract: a critical review. Brain 65:409–461
White EL, Rock MP (1980) Three-dimensional aspects and synaptic
relationships of a Golgi-impregnated spiny stellate cell recon-
structed from serial thin sections. J Neurocytol 9:615–636
Williams RS, Ferrante RJ, Caviness VS Jr (1978) The Golgi rapid
method in clinical neuropathology: the morphologic conse-
quences of suboptimal fixation. J Neuropathol Exp Neurol
37:13–33
Wittenberg GM, Wang SS-H (2007) Evolution and scaling of
dendrites. In: Stuart G, Spruston N, Hausser M (eds) Dendrites.
Oxford University Press, New York, pp 43–67
Zeng H, Shen EH, Hohman JG, Oh SW, Bernard A, Royall JJ,
Glattfelder KJ, Sunkin SM, Morris JA, Guillozet-Bongaarts AL,
Smith KA, Ebbert AJ, Swanson B, Kuan L, Page DT, Overly
CC, Lein ES, Hawrylyca MJ, Hof PR, Hyde TM, Kleinman JE,
Jones AR (2012) Large-scale cellular-resolution gene profiling in
human neocortex reveals species-specific molecular signatures.
Cell 149:483–496
2872 Brain Struct Funct (2015) 220:2851–2872
123