attractor dynamics in a modular network model of neocortex
TRANSCRIPT
tnet.cls TFJI054B1-02-177414 May 26, 2006 21:57
Network: Computation in Neural Systemsxxx 2006; xxx: 1–24
Attractor dynamics in a modular network modelof neocortex
MIKAEL LUNDQVIST1, MARTIN REHN1, MIKAEL DJURFELDT1
& ANDERS LANSNER1,2
1Department of Numerical Analysis and Computer Science (NADA), Royal Institute of Technology,Sweden, and 2Stockholm University, Stockholm, Sweden
5
(Received xxx; revised xxx; accepted xxx) Q1
AbstractStarting from the hypothesis that the mammalian neocortex to a first approximation functions as anassociative memory of the attractor network type, we formulate a quantitative computational model ofneocortical layers 2/3. The model employs biophysically detailed multi-compartmental model neuronsand conductance based synapses and includes pyramidal cells and two types of inhibitory interneurons,i.e., regular spiking non-pyramidal cells and basket cells. The simulated network has a minicolumnaras well as a hypercolumnar modular structure and we propose that minicolumns rather than singlecells are the basic computational units in neocortex. The minicolumns are represented in full scale andsynaptic input to the different types of model neurons is carefully matched to reproduce experimentallymeasured values and to allow a quantitative reproduction of dynamic single cell behavior. Several keyphenomena seen experimentally in vitro and in vivo appear as emergent features of this model. It exhibitsa robust and fast attractor dynamics with pattern completion and pattern rivalry and it suggests anexplanation for the so-called attentional blink phenomenon. During assembly dynamics, the modelfaithfully reproduces several features of local UP states, as they have been experimentally observedin vitro, as well as oscillatory behavior similar to that observed in the neocortex.
10
15
20
Keywords: Q2
Introduction
Many different kinds of computational models of the cerebral cortex have been developedand investigated, ranging from bottom-up ones incorporating extensive biophysical detail, totop-down connectionist type models that mostly address issues at the level of gross cortical25plasticity and dynamics. Unfortunately, a gap exists between the two classes of models.Attempts to unify computational paradigms, methodology and results obtained with modelsof different types for the same system, e.g., the primary visual cortex, are still scarce. At thesame time, it is quite clear that in order to enable an understanding of high-level cognitivephenomena in terms of processes at the molecular and cellular level such an approach is30necessary.
Correspondence: Anders Lansner, Stockholm University, KTH, Nada, S-100 44 Stockholm, Sweden. Tel: 08-79062 10; Fax: 08-790 09 30; E-mail: [email protected]
ISSN: 0954-898X print / ISSN 1361-6536 online c© 2006 Taylor & FrancisDOI: 10.1080/09548980600774619
tnet.cls TFJI054B1-02-177414 May 26, 2006 21:57
2 M. Lundqvist et al.
In the last decades, we have seen a dramatic growth in quantitative experimental data im-posing increasingly strict constraints on models. This has triggered a significant convergenceof computational theories of cortical function. However, each one of these models is stillonly capable of addressing part of the complex functionality of the brain, focusing on, e.g., 35self-organization of neuronal response properties, learning and associative memory dynam-ics, distributed population coding or oscillatory phenomena related to perceptual processingand binding.
We will here apply a top-down view of the neocortex as an associative attractor memorynetwork, considering the underlying neuronal architecture together with the dynamics of 40processing and recall in such an associative memory. This view has its origin more thanfifty years back in Hebb’s theories of cell assemblies (see, e.g., Fuster 1995 for a review).It has been mathematically instantiated in the form of the Willshaw–Palm (Willshaw &Longuet-Higgins 1969; Palm 1982) and Little-Hopfield models (Hopfield 1982) and hassubsequently been elaborated and analyzed in great detail (Amit 1989; Hertz et al. 1991). 45The olfactory (piriform) cortex (Haberly & Bower 1989) as well as the hippocampus CA3field (Treves & Rolls 1994) have previously been perceived and modeled as prototypicalneuronal auto-associative attractor memory networks. More recently, persistent activity inan attractor memory of a similar kind has been suggested to underlie prefrontal workingmemory, although in that case the attractor itself and not the connectivity matrix is assumed 50to hold the memory (Compte et al. 2000).
The attractor memory paradigm of cortex has recently gained further experimental supportfrom in vitro experiments on brain slices (Cossart et al. 2003; Shu et al. 2003) where so-called UP states were observed. In a local UP state, which about 0.5% of the recordedpyramidal cells simultaneously enters, the cells depolarize some 10 mV and increase their 55spiking frequency to some 20 Hz. Such an UP state builds up in about 60 ms and lastsfor several hundreds of milliseconds. It has been suggested that attractor dynamics mayexplain these local UP states (Cossart et al. 2003). Cossart et al. (2003) also pointed outthe similarities between the local UP states and the persistent activity states seen in workingmemory of behaving monkeys. 60
Abstract attractor memory models of cortex have typically focused on fix-point dynamics ina network with a structured, learned connectivity matrix. In neural terms this corresponds toa dynamics on a timescale of some hundred milliseconds. In contrast, biophysically detailedmodels are typically implemented with an unstructured, random or center-surround (“bump-shaped”) connectivity and the dynamics at several different time scales—from milliseconds 65to seconds—are studied. The focus is often on the dynamics per se like oscillations and spiketiming without a strong connection to associative memory retrieval. Only by bridging thegap between such different types of models will we be able to organize and interpret theoverwhelming amounts of experimental data at different levels of granularity concerningcortical structure and function. As an example, starting at the network level from a theory 70of fix-point attractor dynamics, by introducing cellular level mechanisms like accumulatedafterhyperpolarization and synaptic depression, attractors may become quasi-stable and oneobtains continuously evolving dynamics (Sandberg et al. 2003).
In this spirit, in a previous series of papers we have demonstrated how it is possible toconnect a top-down view of auto-associative attractor memory with the details of layer 2/3 75cortical memory network architecture and dynamics (Lansner & Fransen 1992; Fransen &Lansner 1995; Fransen & Lansner 1998). We found that such a model could indeed performcritical cell assembly operations, i.e., pattern retrieval, completion and rivalry. In this paper,we continue the same line of reasoning and construct and examine a similar network modelthat is more faithful to neocortical neurobiology. 80
tnet.cls TFJI054B1-02-177414 May 26, 2006 21:57
Dynamics in a cortical model 3
On the network level, we have added a hypercolumnar structure on top of the previousminicolumnar one. The hypercolumns act as soft winner-take-all modules typically selectingone of its minicolumns to be active at a time via lateral inhibition. Further, the minicolumnsthemselves have been scaled up to full scale (relative to their layer 2/3 portions), while theminicolumns in each hypercolumn are subsampled. Due to the full scale minicolumns, we85could better reproduce the quantitative behavior and connectivity of its subparts, and eachsingle neuron sees approximately the same synaptic input as it would see in vivo. Further,we have included an additional type of inhibitory neuron, of the vertically projecting regularspiking type, so that both vertically and horizontally projecting, as well as fast and regular,spiking types of interneurons are now present in the model. Finally, we have added fast90pyramidal–pyramidal synaptic depression and suggest a role for its presence.
Model neurons and synapses
The cell models used in the simulations described here are conductance-based and multi-compartmental of intermediate complexity. They are to a large extent similar to those inthe previous network model (Fransen & Lansner 1995; Fransen & Lansner 1998). Tables of95neuron and synapse parameters can be found in the Appendix.
An important role of the model is to serve as a tool for exploring different possible experi-mental manipulations. In this work, we use conductance based biophysically detailed modelneurons and synapses in which the different ion channels and currents are explicitly repre-sented. This makes it easier to relate to experimental data and to perform informative in silico100experiments, like, e.g., blocking or knocking-out of a particular type of ion channel. This isnot equally straight-forward when using simpler neuron models (Gerstner 2002; Izhikevich2004), since in this case there is no direct mapping between ion channel properties andparameters.
The cells included are layer 2/3 pyramidal cells and two different types of inhibitory in-105terneurons, assumed to correspond to horizontally projecting basket cells and vertically pro-jecting double bouquet and/or bipolar cells (Kawaguchi & Kubota 1993; Douglas & Martin2004; Markram et al. 2004). Following Kawaguchi (1995), we will here refer to the lattertype as regular spiking non-pyramidal or RSNP cells.
The network connectivity is set up to store a number of memory patterns (attractor states)110such as would have resulted from long-term plasticity using a Hebbian learning rule (Sand-berg et al. 2002). The synaptic plasticity actually included in the model is restricted tofast synaptic depression of pyramidal to pyramidal synapses, on the same time scale as thenetwork dynamics studied.
Model neurons115
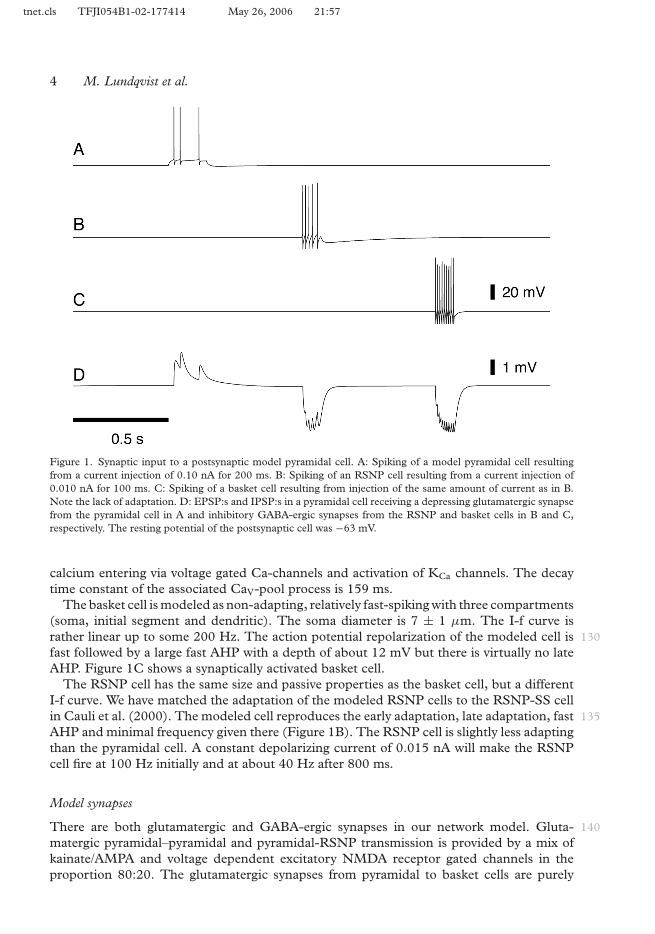
The pyramidal cell is modeled with six compartments (soma, initial segment, basal dendritecompartment and three consecutive apical dendrite compartments). The dendritic tree hasone apical and one basal branch separating synaptic input of different origin. The somadiameter is sampled from a distribution within 21 ± 2 µm in order to represent biologicalvariation of cell sizes within this population. This distribution in size, together with stochastic120noise and random local connections also prevents, e.g., synchronization artifacts due toidentical cell excitabilities. The modeled pyramidal cell is of a regularly spiking type. Ashort supra-threshold stimulation gives a relatively wide spike followed by an early and a lateafterhyperpolarization (AHP) separated by a small depolarizing afterpotential (Figure 1).At longer stimulations, the cell has a pronounced adaptation caused by accumulation of125
tnet.cls TFJI054B1-02-177414 May 26, 2006 21:57
4 M. Lundqvist et al.
Figure 1. Synaptic input to a postsynaptic model pyramidal cell. A: Spiking of a model pyramidal cell resultingfrom a current injection of 0.10 nA for 200 ms. B: Spiking of an RSNP cell resulting from a current injection of0.010 nA for 100 ms. C: Spiking of a basket cell resulting from injection of the same amount of current as in B.Note the lack of adaptation. D: EPSP:s and IPSP:s in a pyramidal cell receiving a depressing glutamatergic synapsefrom the pyramidal cell in A and inhibitory GABA-ergic synapses from the RSNP and basket cells in B and C,respectively. The resting potential of the postsynaptic cell was −63 mV.
calcium entering via voltage gated Ca-channels and activation of KCa channels. The decaytime constant of the associated CaV-pool process is 159 ms.
The basket cell is modeled as non-adapting, relatively fast-spiking with three compartments(soma, initial segment and dendritic). The soma diameter is 7 ± 1 µm. The I-f curve israther linear up to some 200 Hz. The action potential repolarization of the modeled cell is 130fast followed by a large fast AHP with a depth of about 12 mV but there is virtually no lateAHP. Figure 1C shows a synaptically activated basket cell.
The RSNP cell has the same size and passive properties as the basket cell, but a differentI-f curve. We have matched the adaptation of the modeled RSNP cells to the RSNP-SS cellin Cauli et al. (2000). The modeled cell reproduces the early adaptation, late adaptation, fast 135AHP and minimal frequency given there (Figure 1B). The RSNP cell is slightly less adaptingthan the pyramidal cell. A constant depolarizing current of 0.015 nA will make the RSNPcell fire at 100 Hz initially and at about 40 Hz after 800 ms.
Model synapses
There are both glutamatergic and GABA-ergic synapses in our network model. Gluta- 140matergic pyramidal–pyramidal and pyramidal-RSNP transmission is provided by a mix ofkainate/AMPA and voltage dependent excitatory NMDA receptor gated channels in theproportion 80:20. The glutamatergic synapses from pyramidal to basket cells are purely
tnet.cls TFJI054B1-02-177414 May 26, 2006 21:57
Dynamics in a cortical model 5
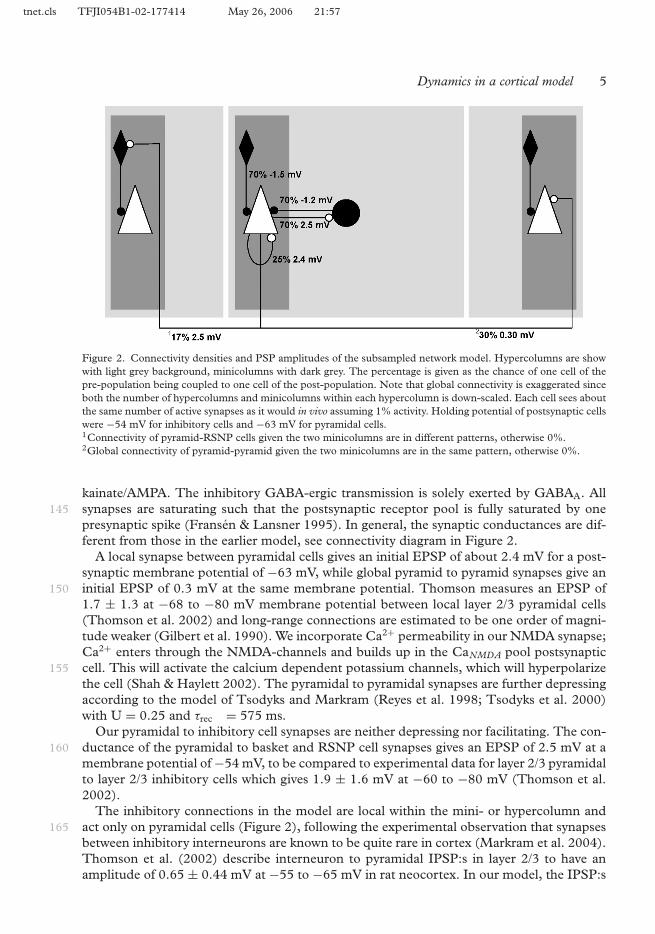
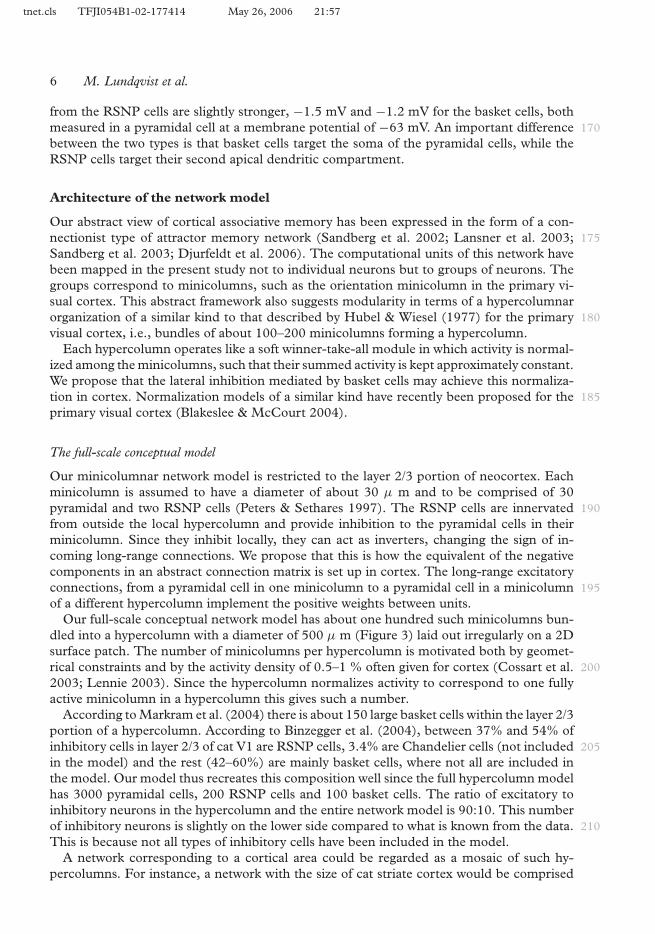
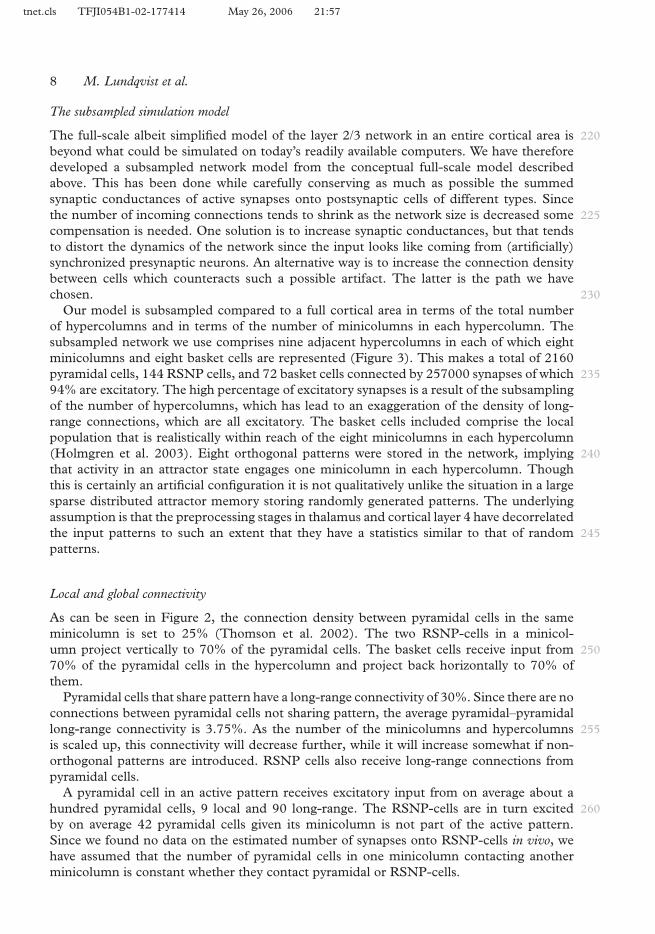
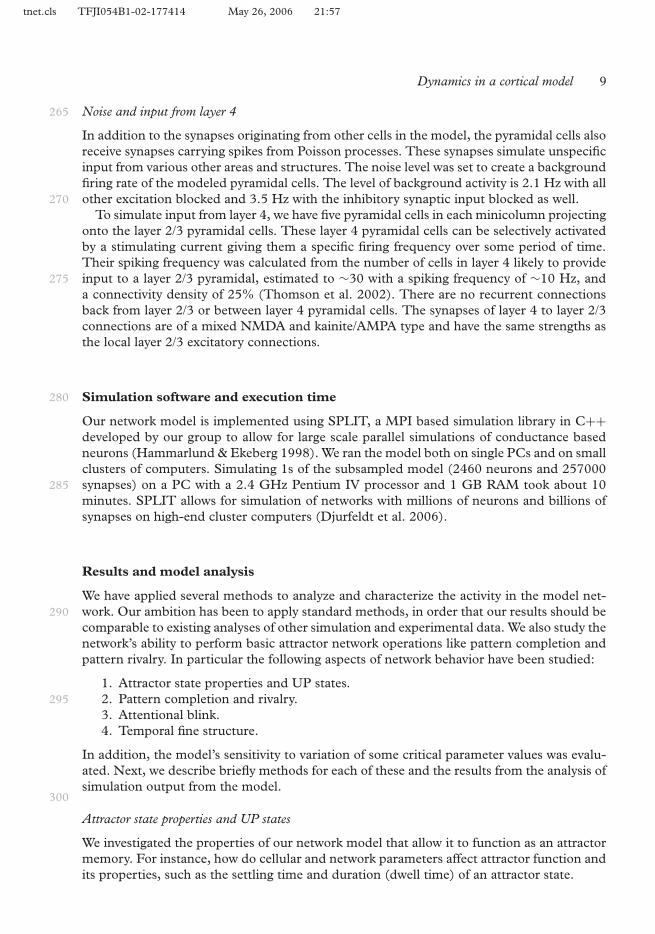
Figure 2. Connectivity densities and PSP amplitudes of the subsampled network model. Hypercolumns are showwith light grey background, minicolumns with dark grey. The percentage is given as the chance of one cell of thepre-population being coupled to one cell of the post-population. Note that global connectivity is exaggerated sinceboth the number of hypercolumns and minicolumns within each hypercolumn is down-scaled. Each cell sees aboutthe same number of active synapses as it would in vivo assuming 1% activity. Holding potential of postsynaptic cellswere −54 mV for inhibitory cells and −63 mV for pyramidal cells.1Connectivity of pyramid-RSNP cells given the two minicolumns are in different patterns, otherwise 0%.2Global connectivity of pyramid-pyramid given the two minicolumns are in the same pattern, otherwise 0%.
kainate/AMPA. The inhibitory GABA-ergic transmission is solely exerted by GABAA. Allsynapses are saturating such that the postsynaptic receptor pool is fully saturated by one145presynaptic spike (Fransen & Lansner 1995). In general, the synaptic conductances are dif-ferent from those in the earlier model, see connectivity diagram in Figure 2.
A local synapse between pyramidal cells gives an initial EPSP of about 2.4 mV for a post-synaptic membrane potential of −63 mV, while global pyramid to pyramid synapses give aninitial EPSP of 0.3 mV at the same membrane potential. Thomson measures an EPSP of1501.7 ± 1.3 at −68 to −80 mV membrane potential between local layer 2/3 pyramidal cells(Thomson et al. 2002) and long-range connections are estimated to be one order of magni-tude weaker (Gilbert et al. 1990). We incorporate Ca2+ permeability in our NMDA synapse;Ca2+ enters through the NMDA-channels and builds up in the CaNMDA pool postsynapticcell. This will activate the calcium dependent potassium channels, which will hyperpolarize155the cell (Shah & Haylett 2002). The pyramidal to pyramidal synapses are further depressingaccording to the model of Tsodyks and Markram (Reyes et al. 1998; Tsodyks et al. 2000)with U = 0.25 and τrec = 575 ms.
Our pyramidal to inhibitory cell synapses are neither depressing nor facilitating. The con-ductance of the pyramidal to basket and RSNP cell synapses gives an EPSP of 2.5 mV at a160membrane potential of −54 mV, to be compared to experimental data for layer 2/3 pyramidalto layer 2/3 inhibitory cells which gives 1.9 ± 1.6 mV at −60 to −80 mV (Thomson et al.2002).
The inhibitory connections in the model are local within the mini- or hypercolumn andact only on pyramidal cells (Figure 2), following the experimental observation that synapses165between inhibitory interneurons are known to be quite rare in cortex (Markram et al. 2004).Thomson et al. (2002) describe interneuron to pyramidal IPSP:s in layer 2/3 to have anamplitude of 0.65 ± 0.44 mV at −55 to −65 mV in rat neocortex. In our model, the IPSP:s
tnet.cls TFJI054B1-02-177414 May 26, 2006 21:57
6 M. Lundqvist et al.
from the RSNP cells are slightly stronger, −1.5 mV and −1.2 mV for the basket cells, bothmeasured in a pyramidal cell at a membrane potential of −63 mV. An important difference 170between the two types is that basket cells target the soma of the pyramidal cells, while theRSNP cells target their second apical dendritic compartment.
Architecture of the network model
Our abstract view of cortical associative memory has been expressed in the form of a con-nectionist type of attractor memory network (Sandberg et al. 2002; Lansner et al. 2003; 175Sandberg et al. 2003; Djurfeldt et al. 2006). The computational units of this network havebeen mapped in the present study not to individual neurons but to groups of neurons. Thegroups correspond to minicolumns, such as the orientation minicolumn in the primary vi-sual cortex. This abstract framework also suggests modularity in terms of a hypercolumnarorganization of a similar kind to that described by Hubel & Wiesel (1977) for the primary 180visual cortex, i.e., bundles of about 100–200 minicolumns forming a hypercolumn.
Each hypercolumn operates like a soft winner-take-all module in which activity is normal-ized among the minicolumns, such that their summed activity is kept approximately constant.We propose that the lateral inhibition mediated by basket cells may achieve this normaliza-tion in cortex. Normalization models of a similar kind have recently been proposed for the 185primary visual cortex (Blakeslee & McCourt 2004).
The full-scale conceptual model
Our minicolumnar network model is restricted to the layer 2/3 portion of neocortex. Eachminicolumn is assumed to have a diameter of about 30 µ m and to be comprised of 30pyramidal and two RSNP cells (Peters & Sethares 1997). The RSNP cells are innervated 190from outside the local hypercolumn and provide inhibition to the pyramidal cells in theirminicolumn. Since they inhibit locally, they can act as inverters, changing the sign of in-coming long-range connections. We propose that this is how the equivalent of the negativecomponents in an abstract connection matrix is set up in cortex. The long-range excitatoryconnections, from a pyramidal cell in one minicolumn to a pyramidal cell in a minicolumn 195of a different hypercolumn implement the positive weights between units.
Our full-scale conceptual network model has about one hundred such minicolumns bun-dled into a hypercolumn with a diameter of 500 µ m (Figure 3) laid out irregularly on a 2Dsurface patch. The number of minicolumns per hypercolumn is motivated both by geomet-rical constraints and by the activity density of 0.5–1 % often given for cortex (Cossart et al. 2002003; Lennie 2003). Since the hypercolumn normalizes activity to correspond to one fullyactive minicolumn in a hypercolumn this gives such a number.
According to Markram et al. (2004) there is about 150 large basket cells within the layer 2/3portion of a hypercolumn. According to Binzegger et al. (2004), between 37% and 54% ofinhibitory cells in layer 2/3 of cat V1 are RSNP cells, 3.4% are Chandelier cells (not included 205in the model) and the rest (42–60%) are mainly basket cells, where not all are included inthe model. Our model thus recreates this composition well since the full hypercolumn modelhas 3000 pyramidal cells, 200 RSNP cells and 100 basket cells. The ratio of excitatory toinhibitory neurons in the hypercolumn and the entire network model is 90:10. This numberof inhibitory neurons is slightly on the lower side compared to what is known from the data. 210This is because not all types of inhibitory cells have been included in the model.
A network corresponding to a cortical area could be regarded as a mosaic of such hy-percolumns. For instance, a network with the size of cat striate cortex would be comprised

tnet.cls TFJI054B1-02-177414 May 26, 2006 21:57
Dynamics in a cortical model 7
Figure 3. Structure of the layer 2/3 model network. A: The conceptual network comprises nine hypercolumns,each with a hundred minicolumns. This corresponds to a piece of cortex measuring about 1.5 by 1.8 mm. Eachcoloured dot represents a minicolumn and the eight blue minicolumns in each hypercolumn mark those actuallyincluded in the subsampled network. B: Composition of the subsampled hypercolumn. Only the layer 2/3 partswere simulated. The upper table gives the number and fraction of the different cell types. The lower table gives thesame numbers and fractions for a full size model hypercolumn.
4C/Art
of some 320000 minicolumns organized in around three thousand hypercolumns (Peters &Yilmaz 1993). It would consist of some 20 million neurons and hundred billion synaptic con-215nections. Such a network would have about a thousand active minicolumns in each pattern.The density of the long-range associative connectivity would be about 0.02‰ (Johansson2004; Johansson & Lansner 2004).
tnet.cls TFJI054B1-02-177414 May 26, 2006 21:57
8 M. Lundqvist et al.
The subsampled simulation model
The full-scale albeit simplified model of the layer 2/3 network in an entire cortical area is 220beyond what could be simulated on today’s readily available computers. We have thereforedeveloped a subsampled network model from the conceptual full-scale model describedabove. This has been done while carefully conserving as much as possible the summedsynaptic conductances of active synapses onto postsynaptic cells of different types. Sincethe number of incoming connections tends to shrink as the network size is decreased some 225compensation is needed. One solution is to increase synaptic conductances, but that tendsto distort the dynamics of the network since the input looks like coming from (artificially)synchronized presynaptic neurons. An alternative way is to increase the connection densitybetween cells which counteracts such a possible artifact. The latter is the path we havechosen. 230
Our model is subsampled compared to a full cortical area in terms of the total numberof hypercolumns and in terms of the number of minicolumns in each hypercolumn. Thesubsampled network we use comprises nine adjacent hypercolumns in each of which eightminicolumns and eight basket cells are represented (Figure 3). This makes a total of 2160pyramidal cells, 144 RSNP cells, and 72 basket cells connected by 257000 synapses of which 23594% are excitatory. The high percentage of excitatory synapses is a result of the subsamplingof the number of hypercolumns, which has lead to an exaggeration of the density of long-range connections, which are all excitatory. The basket cells included comprise the localpopulation that is realistically within reach of the eight minicolumns in each hypercolumn(Holmgren et al. 2003). Eight orthogonal patterns were stored in the network, implying 240that activity in an attractor state engages one minicolumn in each hypercolumn. Thoughthis is certainly an artificial configuration it is not qualitatively unlike the situation in a largesparse distributed attractor memory storing randomly generated patterns. The underlyingassumption is that the preprocessing stages in thalamus and cortical layer 4 have decorrelatedthe input patterns to such an extent that they have a statistics similar to that of random 245patterns.
Local and global connectivity
As can be seen in Figure 2, the connection density between pyramidal cells in the sameminicolumn is set to 25% (Thomson et al. 2002). The two RSNP-cells in a minicol-umn project vertically to 70% of the pyramidal cells. The basket cells receive input from 25070% of the pyramidal cells in the hypercolumn and project back horizontally to 70% ofthem.
Pyramidal cells that share pattern have a long-range connectivity of 30%. Since there are noconnections between pyramidal cells not sharing pattern, the average pyramidal–pyramidallong-range connectivity is 3.75%. As the number of the minicolumns and hypercolumns 255is scaled up, this connectivity will decrease further, while it will increase somewhat if non-orthogonal patterns are introduced. RSNP cells also receive long-range connections frompyramidal cells.
A pyramidal cell in an active pattern receives excitatory input from on average about ahundred pyramidal cells, 9 local and 90 long-range. The RSNP-cells are in turn excited 260by on average 42 pyramidal cells given its minicolumn is not part of the active pattern.Since we found no data on the estimated number of synapses onto RSNP-cells in vivo, wehave assumed that the number of pyramidal cells in one minicolumn contacting anotherminicolumn is constant whether they contact pyramidal or RSNP-cells.
tnet.cls TFJI054B1-02-177414 May 26, 2006 21:57
Dynamics in a cortical model 9
Noise and input from layer 4265
In addition to the synapses originating from other cells in the model, the pyramidal cells alsoreceive synapses carrying spikes from Poisson processes. These synapses simulate unspecificinput from various other areas and structures. The noise level was set to create a backgroundfiring rate of the modeled pyramidal cells. The level of background activity is 2.1 Hz with allother excitation blocked and 3.5 Hz with the inhibitory synaptic input blocked as well.270
To simulate input from layer 4, we have five pyramidal cells in each minicolumn projectingonto the layer 2/3 pyramidal cells. These layer 4 pyramidal cells can be selectively activatedby a stimulating current giving them a specific firing frequency over some period of time.Their spiking frequency was calculated from the number of cells in layer 4 likely to provideinput to a layer 2/3 pyramidal, estimated to ∼30 with a spiking frequency of ∼10 Hz, and275a connectivity density of 25% (Thomson et al. 2002). There are no recurrent connectionsback from layer 2/3 or between layer 4 pyramidal cells. The synapses of layer 4 to layer 2/3connections are of a mixed NMDA and kainite/AMPA type and have the same strengths asthe local layer 2/3 excitatory connections.
Simulation software and execution time280
Our network model is implemented using SPLIT, a MPI based simulation library in C++developed by our group to allow for large scale parallel simulations of conductance basedneurons (Hammarlund & Ekeberg 1998). We ran the model both on single PCs and on smallclusters of computers. Simulating 1s of the subsampled model (2460 neurons and 257000synapses) on a PC with a 2.4 GHz Pentium IV processor and 1 GB RAM took about 10285minutes. SPLIT allows for simulation of networks with millions of neurons and billions ofsynapses on high-end cluster computers (Djurfeldt et al. 2006).
Results and model analysis
We have applied several methods to analyze and characterize the activity in the model net-work. Our ambition has been to apply standard methods, in order that our results should be290comparable to existing analyses of other simulation and experimental data. We also study thenetwork’s ability to perform basic attractor network operations like pattern completion andpattern rivalry. In particular the following aspects of network behavior have been studied:
1. Attractor state properties and UP states.2. Pattern completion and rivalry.2953. Attentional blink.4. Temporal fine structure.
In addition, the model’s sensitivity to variation of some critical parameter values was evalu-ated. Next, we describe briefly methods for each of these and the results from the analysis ofsimulation output from the model.
300
Attractor state properties and UP states
We investigated the properties of our network model that allow it to function as an attractormemory. For instance, how do cellular and network parameters affect attractor function andits properties, such as the settling time and duration (dwell time) of an attractor state.
tnet.cls TFJI054B1-02-177414 May 26, 2006 21:57
10 M. Lundqvist et al.
To that end, we aggregated and low pass filtered the spike output of the pyramidal cells 305in a minicolumn and used this measure to determine whether the network was in an UP orDOWN state. We then characterized the states based on spike rate, membrane potential andthe nature of state transitions, and compare to experimental data.
One of our main hypotheses is that UP and DOWN states are expressions of the underlyingattractor dynamics: when an attractor is active its cells are in an UP state, when the attractor 310is not active its cells are in a DOWN state. To test this hypothesis, we studied the quantitativebehavior of the pyramidal cells during pattern retrieval in order to compare it to the UP andDOWN state behaviors seen in vitro.
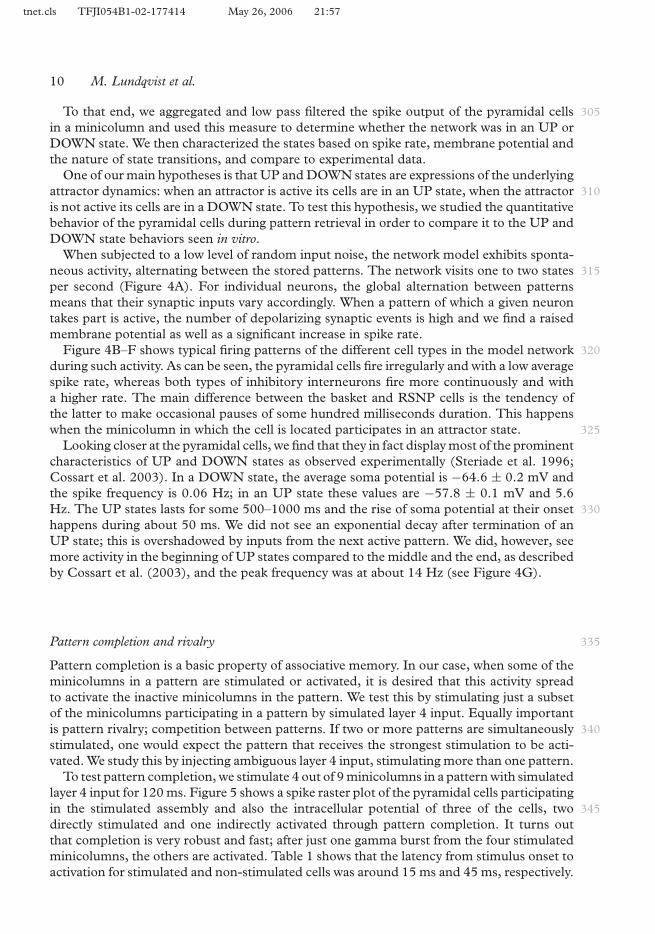
When subjected to a low level of random input noise, the network model exhibits sponta-neous activity, alternating between the stored patterns. The network visits one to two states 315per second (Figure 4A). For individual neurons, the global alternation between patternsmeans that their synaptic inputs vary accordingly. When a pattern of which a given neurontakes part is active, the number of depolarizing synaptic events is high and we find a raisedmembrane potential as well as a significant increase in spike rate.
Figure 4B–F shows typical firing patterns of the different cell types in the model network 320during such activity. As can be seen, the pyramidal cells fire irregularly and with a low averagespike rate, whereas both types of inhibitory interneurons fire more continuously and witha higher rate. The main difference between the basket and RSNP cells is the tendency ofthe latter to make occasional pauses of some hundred milliseconds duration. This happenswhen the minicolumn in which the cell is located participates in an attractor state. 325
Looking closer at the pyramidal cells, we find that they in fact display most of the prominentcharacteristics of UP and DOWN states as observed experimentally (Steriade et al. 1996;Cossart et al. 2003). In a DOWN state, the average soma potential is −64.6 ± 0.2 mV andthe spike frequency is 0.06 Hz; in an UP state these values are −57.8 ± 0.1 mV and 5.6Hz. The UP states lasts for some 500–1000 ms and the rise of soma potential at their onset 330happens during about 50 ms. We did not see an exponential decay after termination of anUP state; this is overshadowed by inputs from the next active pattern. We did, however, seemore activity in the beginning of UP states compared to the middle and the end, as describedby Cossart et al. (2003), and the peak frequency was at about 14 Hz (see Figure 4G).
Pattern completion and rivalry 335
Pattern completion is a basic property of associative memory. In our case, when some of theminicolumns in a pattern are stimulated or activated, it is desired that this activity spreadto activate the inactive minicolumns in the pattern. We test this by stimulating just a subsetof the minicolumns participating in a pattern by simulated layer 4 input. Equally importantis pattern rivalry; competition between patterns. If two or more patterns are simultaneously 340stimulated, one would expect the pattern that receives the strongest stimulation to be acti-vated. We study this by injecting ambiguous layer 4 input, stimulating more than one pattern.
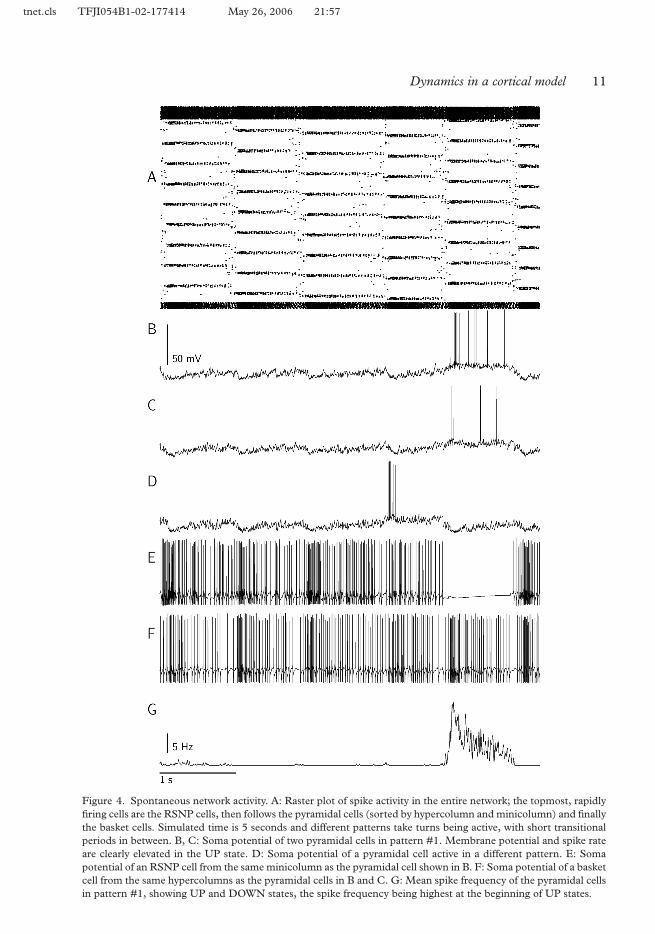
To test pattern completion, we stimulate 4 out of 9 minicolumns in a pattern with simulatedlayer 4 input for 120 ms. Figure 5 shows a spike raster plot of the pyramidal cells participatingin the stimulated assembly and also the intracellular potential of three of the cells, two 345directly stimulated and one indirectly activated through pattern completion. It turns outthat completion is very robust and fast; after just one gamma burst from the four stimulatedminicolumns, the others are activated. Table 1 shows that the latency from stimulus onset toactivation for stimulated and non-stimulated cells was around 15 ms and 45 ms, respectively.
tnet.cls TFJI054B1-02-177414 May 26, 2006 21:57
Dynamics in a cortical model 11
Figure 4. Spontaneous network activity. A: Raster plot of spike activity in the entire network; the topmost, rapidlyfiring cells are the RSNP cells, then follows the pyramidal cells (sorted by hypercolumn and minicolumn) and finallythe basket cells. Simulated time is 5 seconds and different patterns take turns being active, with short transitionalperiods in between. B, C: Soma potential of two pyramidal cells in pattern #1. Membrane potential and spike rateare clearly elevated in the UP state. D: Soma potential of a pyramidal cell active in a different pattern. E: Somapotential of an RSNP cell from the same minicolumn as the pyramidal cell shown in B. F: Soma potential of a basketcell from the same hypercolumns as the pyramidal cells in B and C. G: Mean spike frequency of the pyramidal cellsin pattern #1, showing UP and DOWN states, the spike frequency being highest at the beginning of UP states.
tnet.cls TFJI054B1-02-177414 May 26, 2006 21:57
12 M. Lundqvist et al.
Figure 5. Pattern completion when only part of a pattern is directly stimulated. Upper panel: Raster plot of thepyramidal cells from two different assemblies; one that is initially active (crosses) and one that is activated by anexternal stimulus (dots). Lower panel: Soma potentials for three pyramidal cells in the stimulated pattern. The uppertwo cells are from minicolumns that were directly stimulated; the third cell is taken from a recruited minicolumn.Stimulation is marked grey.
Similarly, we test for pattern rivalry by stimulating different numbers of minicolumns from 350two different assemblies. We find that the assembly with more stimulation becomes active;the others activity is terminated. Figure 6 shows a case where an assembly that receivesstimulation to four minicolumns wins over one receiving input to three, which is always theoutcome of this case. Table 1 shows that the latency from stimulus onset to activation ofthe winning assembly for stimulated and non-stimulated cells was around 40 ms and 60 ms, 355respectively. The suppressed assembly gets active only when the winning one has terminatedits activity.
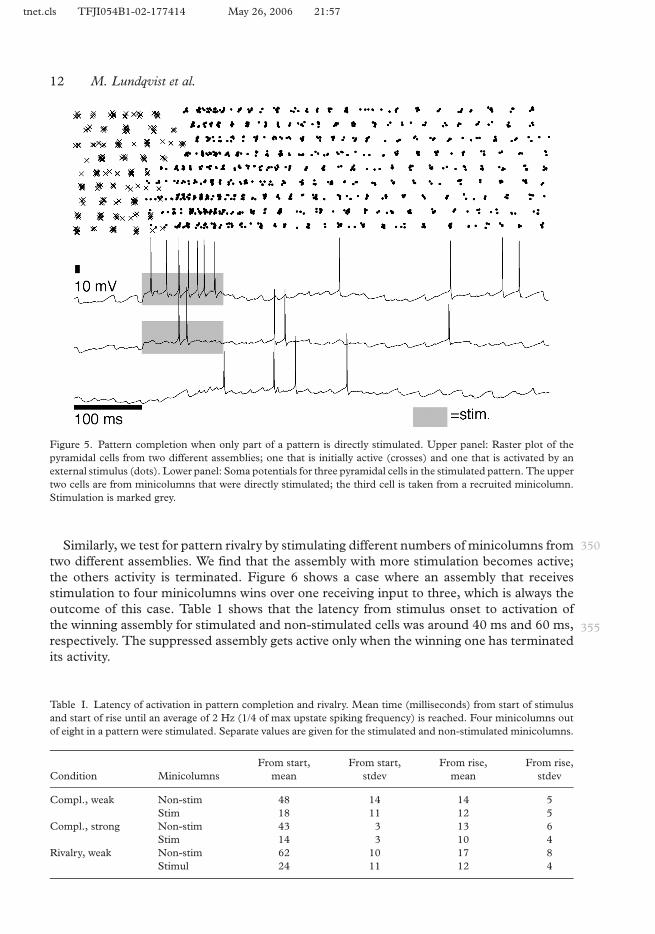
Table I. Latency of activation in pattern completion and rivalry. Mean time (milliseconds) from start of stimulusand start of rise until an average of 2 Hz (1/4 of max upstate spiking frequency) is reached. Four minicolumns outof eight in a pattern were stimulated. Separate values are given for the stimulated and non-stimulated minicolumns.
From start, From start, From rise, From rise,Condition Minicolumns mean stdev mean stdev
Compl., weak Non-stim 48 14 14 5Stim 18 11 12 5
Compl., strong Non-stim 43 3 13 6Stim 14 3 10 4
Rivalry, weak Non-stim 62 10 17 8Stimul 24 11 12 4

tnet.cls TFJI054B1-02-177414 May 26, 2006 21:57
Dynamics in a cortical model 13
Figure 6. Pattern rivalry, when parts of two patterns are simultaneously stimulated. Upper panel: Raster plot ofthe pyramidal cells from three different assemblies; one that is initially active (crosses) and two that are activatedby external stimuli (dots and stars). The “dot” pattern is winning the competition; the “star” pattern is beingsuppressed. Lower panel: Soma potentials from three pyramidal cells. The topmost cell is part of a directly stimulatedminicolumn in the winning pattern. The middle cell is from a recruited minicolumn, also in the winning pattern.The bottommost cell is from a directly stimulated minicolumn in the suppressed pattern. Stimulation is markedgrey.
We also tested some more intricate cases. What happens for example when two assembliesreceive exactly the same stimulation, but in one it is spread out over more minicolumns, i.e.,one of the inputs is more redundant than the other? We stimulated a total of 81 cells in each of360two different assemblies. Which of the two would win was now dependent on the distributionof the stimulation. For weaker stimulation, the assembly which had a more concentratedinput defeated the other one. If the strength of the input was increased, however, the onewith more spread-out input was the one that survived. This relation depended on the localconnectivity. If that was decreased from our standard 25% connectivity between pyramidal365cells in a minicolumn to 10%, the more concentrated input gained in effectiveness relative tothe more spread-out one. We can explain these results in the following way: When input wasweak, input concentrated to a group of cells with high connectivity helped the minicolumn tobecome active, and the activity spread from there once established locally. But if the strengthand intensity of the input was increased, the local connectivity and interaction became less370important. The stimulated minicolumn would then always be activated, but once that wasthe case, the further increase in activity level would not increase linearly to the increase ininput. This is because the stimulated pyramidal cells will drive the basket cells reciprocallyconnected to them. The stable activity level of a minicolumn is more or less fixed. Insteadthe spread-out activity would in this case activate a larger number of minicolumns and the375
tnet.cls TFJI054B1-02-177414 May 26, 2006 21:57
14 M. Lundqvist et al.
corresponding assembly would win. To complicate this static picture, there were also dynamiceffects such that an assembly that was recently active would be less easy to reactivate.
Input sensitivity and attentional blink
“Attentional blink” is a phenomenon studied by experimental psychologists (Shapiro et al.1994; Marois & Ivanoff 2005). Subjects are, for instance, told to look for two different target 380letters (T1, T2) in a flow of letters blinking on a screen at a steady pace. If this pace is quickenough and if T2 follows shortly after T1 (with a short stimulus onset asynchrony, SOA),T2 is not perceived. Similar phenomena can also be elicited in the auditory modality and itthus appears to be a general perceptual bottleneck. The neural basis of the attentional blinkeffect remains unclear, but it is correlated with the P300 peak in ERP, a neuro-physiological 385marker of working memory updating.
We suggest here that the attentional blink phenomenon is due to the subject’s workingmemory entering an attractor state in response to T1. The afferent activity triggered by theclosely following letter T2 is not able to terminate the newly entered attractor state. In themodel, this translates to layer 4 input being unable to terminate an active attractor state if it 390follows shortly after such a state was activated.
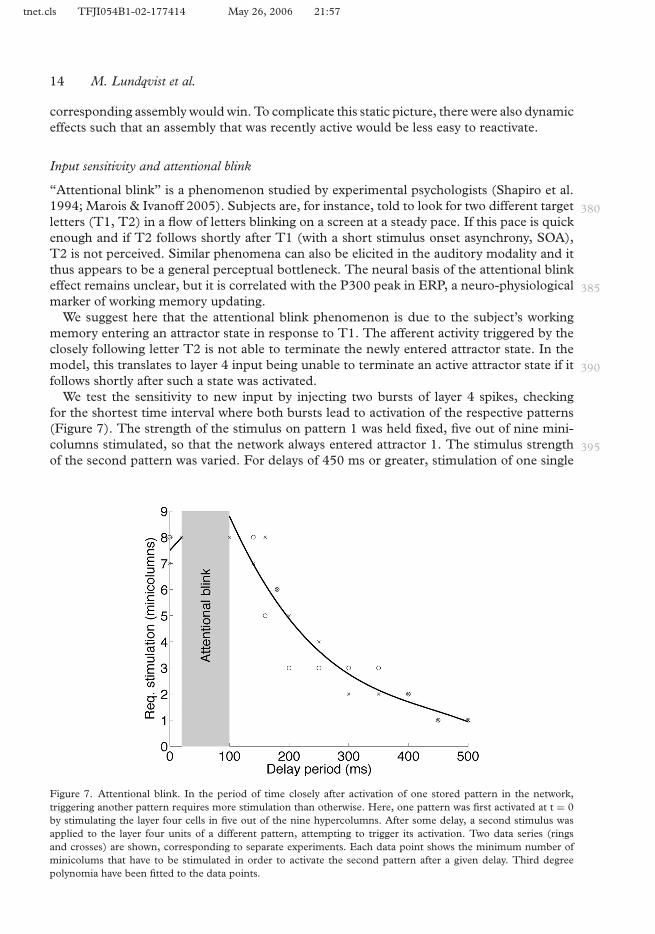
We test the sensitivity to new input by injecting two bursts of layer 4 spikes, checkingfor the shortest time interval where both bursts lead to activation of the respective patterns(Figure 7). The strength of the stimulus on pattern 1 was held fixed, five out of nine mini-columns stimulated, so that the network always entered attractor 1. The stimulus strength 395of the second pattern was varied. For delays of 450 ms or greater, stimulation of one single
Figure 7. Attentional blink. In the period of time closely after activation of one stored pattern in the network,triggering another pattern requires more stimulation than otherwise. Here, one pattern was first activated at t = 0by stimulating the layer four cells in five out of the nine hypercolumns. After some delay, a second stimulus wasapplied to the layer four units of a different pattern, attempting to trigger its activation. Two data series (ringsand crosses) are shown, corresponding to separate experiments. Each data point shows the minimum number ofminicolums that have to be stimulated in order to activate the second pattern after a given delay. Third degreepolynomia have been fitted to the data points.
tnet.cls TFJI054B1-02-177414 May 26, 2006 21:57
Dynamics in a cortical model 15
minicolumn sufficed to switch the network state to the second pattern. On the other hand, fordelays greater than 20 ms but smaller than 100 ms, the stimulus failed to trigger activation ofthe second pattern, even when all hypercolumns were stimulated. For delays less than 20 ms,the second stimulus was sometimes activated, thus entirely suppressing the first stimulus.400
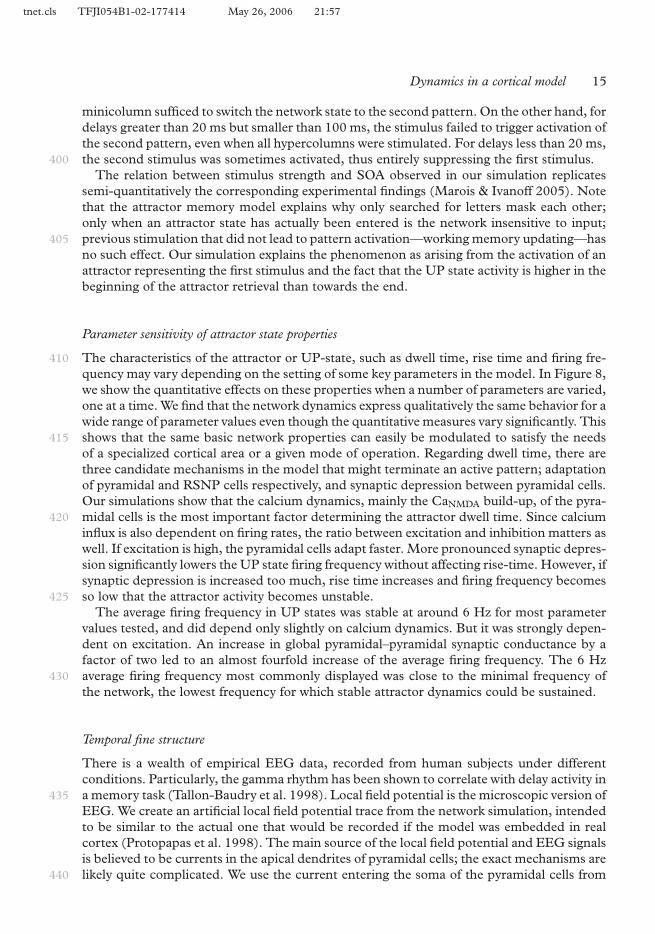
The relation between stimulus strength and SOA observed in our simulation replicatessemi-quantitatively the corresponding experimental findings (Marois & Ivanoff 2005). Notethat the attractor memory model explains why only searched for letters mask each other;only when an attractor state has actually been entered is the network insensitive to input;previous stimulation that did not lead to pattern activation—working memory updating—has405no such effect. Our simulation explains the phenomenon as arising from the activation of anattractor representing the first stimulus and the fact that the UP state activity is higher in thebeginning of the attractor retrieval than towards the end.
Parameter sensitivity of attractor state properties
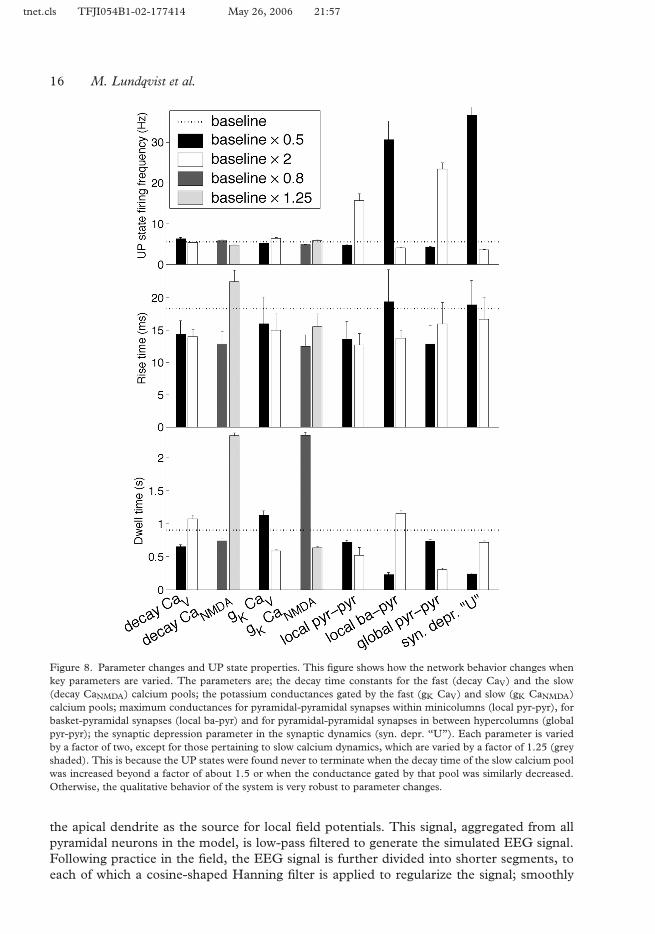
The characteristics of the attractor or UP-state, such as dwell time, rise time and firing fre-410quency may vary depending on the setting of some key parameters in the model. In Figure 8,we show the quantitative effects on these properties when a number of parameters are varied,one at a time. We find that the network dynamics express qualitatively the same behavior for awide range of parameter values even though the quantitative measures vary significantly. Thisshows that the same basic network properties can easily be modulated to satisfy the needs415of a specialized cortical area or a given mode of operation. Regarding dwell time, there arethree candidate mechanisms in the model that might terminate an active pattern; adaptationof pyramidal and RSNP cells respectively, and synaptic depression between pyramidal cells.Our simulations show that the calcium dynamics, mainly the CaNMDA build-up, of the pyra-midal cells is the most important factor determining the attractor dwell time. Since calcium420influx is also dependent on firing rates, the ratio between excitation and inhibition matters aswell. If excitation is high, the pyramidal cells adapt faster. More pronounced synaptic depres-sion significantly lowers the UP state firing frequency without affecting rise-time. However, ifsynaptic depression is increased too much, rise time increases and firing frequency becomesso low that the attractor activity becomes unstable.425
The average firing frequency in UP states was stable at around 6 Hz for most parametervalues tested, and did depend only slightly on calcium dynamics. But it was strongly depen-dent on excitation. An increase in global pyramidal–pyramidal synaptic conductance by afactor of two led to an almost fourfold increase of the average firing frequency. The 6 Hzaverage firing frequency most commonly displayed was close to the minimal frequency of430the network, the lowest frequency for which stable attractor dynamics could be sustained.
Temporal fine structure
There is a wealth of empirical EEG data, recorded from human subjects under differentconditions. Particularly, the gamma rhythm has been shown to correlate with delay activity ina memory task (Tallon-Baudry et al. 1998). Local field potential is the microscopic version of435EEG. We create an artificial local field potential trace from the network simulation, intendedto be similar to the actual one that would be recorded if the model was embedded in realcortex (Protopapas et al. 1998). The main source of the local field potential and EEG signalsis believed to be currents in the apical dendrites of pyramidal cells; the exact mechanisms arelikely quite complicated. We use the current entering the soma of the pyramidal cells from440
tnet.cls TFJI054B1-02-177414 May 26, 2006 21:57
16 M. Lundqvist et al.
Figure 8. Parameter changes and UP state properties. This figure shows how the network behavior changes whenkey parameters are varied. The parameters are; the decay time constants for the fast (decay CaV) and the slow(decay CaNMDA) calcium pools; the potassium conductances gated by the fast (gK CaV) and slow (gK CaNMDA)calcium pools; maximum conductances for pyramidal-pyramidal synapses within minicolumns (local pyr-pyr), forbasket-pyramidal synapses (local ba-pyr) and for pyramidal-pyramidal synapses in between hypercolumns (globalpyr-pyr); the synaptic depression parameter in the synaptic dynamics (syn. depr. “U”). Each parameter is variedby a factor of two, except for those pertaining to slow calcium dynamics, which are varied by a factor of 1.25 (greyshaded). This is because the UP states were found never to terminate when the decay time of the slow calcium poolwas increased beyond a factor of about 1.5 or when the conductance gated by that pool was similarly decreased.Otherwise, the qualitative behavior of the system is very robust to parameter changes.
the apical dendrite as the source for local field potentials. This signal, aggregated from allpyramidal neurons in the model, is low-pass filtered to generate the simulated EEG signal.Following practice in the field, the EEG signal is further divided into shorter segments, toeach of which a cosine-shaped Hanning filter is applied to regularize the signal; smoothly
tnet.cls TFJI054B1-02-177414 May 26, 2006 21:57
Dynamics in a cortical model 17
bringing it to zero at the beginning and end of the segments (Dressler et al. 2004). For each445subpart, the power spectrum is calculated, and these spectra are added together.
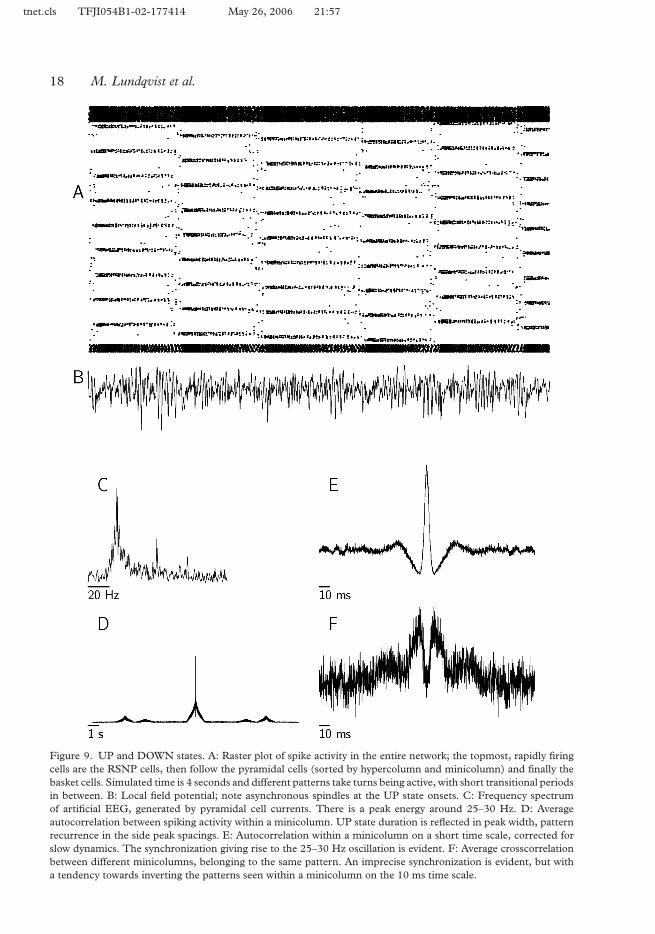
Looking at the artificial EEG (or local field potential) produced from spontaneous activity,the most prominent finding is that of a gamma-like oscillation with a frequency around 25–30 Hz (Figure 9B, 9C). This signal is almost exclusively generated by the activity in theUP states, consistent with experimental data, relating gamma patterns in human EEG to450memory matches. Similar oscillations have also been found in local field potentials of awakebehaving monkeys (Brovelli et al. 2004).
One standard measure to analyze spike recordings from multiple units is to form auto- andcrosscorrelograms of the spike trains. We apply this technique to create averaged crosscorrel-ograms for pairs of neurons belonging to the same minicolumn and for pairs participating in455the same pattern, but located in different minicolumns. We apply a correction, similar to theshift predictor, by subtracting from the raw correlations the correlogram for low pass filteredspike trains, removing correlations related to the gross temporal dynamics but preservingtemporal fine structure (Gerstein & Perkel 1969).
A very clear synchronization of pyramidal spikes within the minicolumn is evident from the460averaged crosscorrelogram between such local neurons. It shows a well defined central peak,with the peaks corresponding to one oscillatory period at about ±40 ms clearly visible andpeaks for two periods at ±80 ms being less prominent (Figure 9E). This synchronizationis the source of the gamma frequency apparent in the EEG. In Figure 9F, we see thatsynchronization is much weaker between different minicolumns, even those belonging to the465same cell assembly. This is consistent with what has been found experimentally (Steriadeet al. 1996). As in the case of the EEG signal, the temporal correlations found originate fromactivity in the UP state. On a longer time scale, we find a non-zero correlation, appearingafter about seven seconds. This relates to a pattern being reactivated after a DOWN period(Figure 9D). With a larger number of attractors in the system, these peaks can be expected470to disappear altogether.
We applied another standard technique, unitary event analysis, to study the network’sspiking behavior on a very fine time scale. This method calculates a “surprise” value for theprecise instantaneous spike patterns (Grun et al. 2002a, 2002b). Because of the large numberof neurons in our model, we chose a version of the method based on binning (Grun et al.4751999). Further, we extended the method by calculating a separate confidence interval forthe “surprise” measure, at each moment in time; otherwise unitary events would be foundexclusively at peak spike frequencies.
With this method, we find few bins containing significant surprise according to our refinedmeasure, provided the spike rate of the network is tracked sufficiently closely when calculating480the significance level. This means that on a very fine time scale, on the order of 1–3 ms, thepyramidal cells fire irregularly. The few unitary events found occur in the beginning andtowards the end of an attractor state period (not shown). One condition in which unitaryevents have been found experimentally is towards the end of the delay period in a delayedresponse task, but it remains to be determined if our results are related to that observation485(Riehle et al. 2000).
Discussion
We have developed and investigated a quantitative scale model of neocortical associative lay-ers 2/3, employing multi-compartmental and conductance based model neurons. The net-work modeled includes layer 2/3 pyramidal cells and two types of inhibitory interneurons,490
tnet.cls TFJI054B1-02-177414 May 26, 2006 21:57
18 M. Lundqvist et al.
Figure 9. UP and DOWN states. A: Raster plot of spike activity in the entire network; the topmost, rapidly firingcells are the RSNP cells, then follow the pyramidal cells (sorted by hypercolumn and minicolumn) and finally thebasket cells. Simulated time is 4 seconds and different patterns take turns being active, with short transitional periodsin between. B: Local field potential; note asynchronous spindles at the UP state onsets. C: Frequency spectrumof artificial EEG, generated by pyramidal cell currents. There is a peak energy around 25–30 Hz. D: Averageautocorrelation between spiking activity within a minicolumn. UP state duration is reflected in peak width, patternrecurrence in the side peak spacings. E: Autocorrelation within a minicolumn on a short time scale, corrected forslow dynamics. The synchronization giving rise to the 25–30 Hz oscillation is evident. F: Average crosscorrelationbetween different minicolumns, belonging to the same pattern. An imprecise synchronization is evident, but witha tendency towards inverting the patterns seen within a minicolumn on the 10 ms time scale.
tnet.cls TFJI054B1-02-177414 May 26, 2006 21:57
Dynamics in a cortical model 19
basket cells and RSNP cells, with distinctly different properties and roles in dynamic networkfunction. Glutamatergic synaptic transmission includes AMPA as well as NMDA receptorgated channels and our pyramidal to pyramidal synapses undergo significant synaptic depres-sion. The network has a distinct modular structure featuring minicolumns and hypercolumnsand its functional organization builds on a top-down perspective of cortical attractor mem-495ory. However, we expect many results obtained here to hold even for a network with a morediffuse modularization.
The present model represents an extension of a previous one (Fransen & Lansner 1998)which was based on a minicolumnar structure but lacking hypercolumns and basket cellfeedback inhibition. The most prominent effect of introducing the hypercolumns was a500marked reduction in pyramidal cell firing rates in an attractor state, from about 50–90 Hzdown to about 5–20 Hz, together with the emergence of prominent gamma oscillations.Yet, the associative memory and pattern processing capabilities of the network remainedqualitatively intact. One of the main aims of the current work was to investigate whethera recurrent network with connectivity, synaptic weights and firing rates seen in vivo could505sustain attractor dynamics. This was indeed found to be the case. Minicolumns enter clearon or off states while this switching between states is not always clearly visible on the cellularlevel. This conforms well to data on low in vivo firing rates (Abeles et al. 1990; Amit &Brunel 1997) and to a view of minicolumns rather than single cells as the units responsiblefor cortical memory and pattern processing.510
We investigated to what degree our model was capable of displaying sustained activityreminiscent of cortical UP states. We found that the recurrent mutual excitation betweenpyramidal cells in a distributed cell assembly (active attractor state) is sufficiently strongto support such activity, giving a depolarization plateau of about 10 mV. The UP statein the model terminates after a couple of hundred milliseconds, due to the build-up of515hyperpolarization via calcium activated potassium channels. An active cell assembly alsoproduces a powerful lateral inhibition that effectively prevents other assemblies to activate.As the active assembly terminates, the others are disinhibited and one of them may get active.In the absence of input the network displays a “free recall mode” in which the network statespontaneously jumps between different attractors with a frequency in the order of a few Hz.520This frequency is quite sensitive to several parameters that would most likely be affected by,e.g., neuromodulation. We speculate that this kind of quasi-stable attractor dynamics maybe a generator for phenomena seen in EEG recordings like the theta rhythm and corticalmicrostates (Lehmann et al. 1998).
In the presence of input, the model network performs some important pattern processing525operations like pattern completion, noise reduction and pattern rivalry. Despite the low firingrates of individual neurons, these operations occur robustly and on a time scale of sometens of milliseconds, i.e., within the time frames suggested by psychophysical experimentaldata relating to the corresponding operations (Thorpe et al. 1996). Even though in realitythere are several connected cortical areas involved in such visual processing, the process530itself would not be strictly serial. In a cascade of serially connected recurrent networks of IF-neurons, Panzeri et al. (2001) showed that recurrent networks contributed to the downstreamcalculations 15 ms after they received input. We observe here the same short latency perstage given strong and crisp stimulus conditions. For weak or incomplete input or in caseof rivalry, the latency increases to some 40–60 ms. Thus, the recurrent connections at each535stage does not necessarily make processing slower, but rather allows for a refined processingover time and it also buffers the result of the computation over a period of time as persistentactivity.
tnet.cls TFJI054B1-02-177414 May 26, 2006 21:57
20 M. Lundqvist et al.
We further propose and demonstrate that the model suggests a possible connection betweencognitive phenomena like the attentional blink and the dynamics of the underlying cortical 540attractor networks and properties of their constituent neurons and synapses. Obviously, thefull attentional blink phenomenon is quite complex and involves the interaction betweenseveral cortical areas. Building a more elaborate model comprised of network modules suchas the one studied here will be necessary in order to make progress towards a more completequantitative model of this fascinating phenomenon. 545
The attractors stored in our subsampled network were simple, consisting of the eightpossible orthogonal patterns. Due to the way activity is structured in the network and dueto the low overlap that would exist between cell assemblies generated from decorrelatedinput to layer 2/3 from earlier processing stages, we argue that the dynamics seen here is atleast qualitatively representative of that of a full-scale network. To verify this is, however, an 550important matter for further investigation.
We observed a fine-structure in the firing patterns, during an UP state, in the form of asynchronization of firing within a minicolumn. Because of the high level of mutual excitationwithin a minicolumn the system is easily kicked into co-activity. But since the pyramidalcells in each minicolumn are recurrently connected to a population of inhibitory basket cells, 555they are synchronized into a bursting behavior on the minicolumnar level. In this way, after-activity in a cell assembly can be maintained for several hundred milliseconds with an overlayof spike synchrony between local cells at a frequency around 20–30 Hz. We found evidence forweaker synchronization between distant minicolumns also showing up in the synthetic EEGas a collective high frequency oscillation of the entire active assembly. The synchronization 560observed was, however, transient and not necessary for the pattern processing operationsstudied. Yet, more subtle effects on network processing is likely to occur but were not furtherinvestigated here.
Our studies of the parameter sensitivity of the model demonstrated that its qualitative dy-namic behavior was quite robust, though quantitative changes, especially in UP-state dwell 565time and firing frequency could be significantly modulated. This part of our study can beinterpreted as a set of model predictions relating to how these features of cortical neurody-namics should depend on experimental pharmacological manipulation of the correspondingcellular and synaptic properties.
Our model is undoubtedly still incomplete and approximate in many respects. We regard 570it as scaffolding for building more extensive models of neocortex in which the other corticallayers and additional types of interneurons are explicitly represented. Peters & Yilmaz (1993)suggested that the cells in layer 2/3 together with the large pyramidal cells in layer 5 form abasic module of the cat striate cortex. One obvious way to extend our model is thus to addlayer 5 pyramidals to the minicolumns. Together with the intermediate range intracortical 575horizontal connections in layer 2/3, running up to some 3 mm horizontally (Stettler et al.2002), they form the long-range connectivity and the “excitatory core” of an active attractorstate. Another important addition would be a layer 4 model (Tao et al. 2004).
The size of the model is currently being scaled up significantly by the use of a parallelsimulator, running on a cluster computer (Hammarlund & Ekeberg 1998). This model 580comprises a large array of full-scale hypercolumns and will allow us to better representthe geometric extent and configuration of the cortical networks and to study in detail theinfluence on the dynamics of the spatial extent of a cell assembly over cortical areas. The firstsimulations of a network of the same type as described here but with eight million neuronsand four billion synapses has already been performed successfully (Djurfeldt et al. 2006). 585
Using such simulations as tools it will be possible, e.g., to build a full-scale virtual cor-tical slice and to simulate various pharmacological manipulation of the slice, e.g., raised
tnet.cls TFJI054B1-02-177414 May 26, 2006 21:57
Dynamics in a cortical model 21
extracellular potassium and block of GABAA and compare results with those experimentallyobtained. Further, by including in a large-scale geometrically accurate model of neocortexa measure of local field potential, energy consumption, etc. due to neuronal and synaptic590activation, it would be possible to synthesize along with EEG also MEG and fMRI signals.Such synthetic measures could then be related to the corresponding experimental data andvia the model be connected with cellular and synaptic physiology. Such tools would signif-icantly enhance our abilities to better understand the very intricate and powerful operationof the human neocortex.595
Conclusions
The primary aim of this study was to investigate the dynamics of a biophysical model ofa piece of neocortex with a long-range connectivity set up according to the principles sug-gested by abstract attractor memory models. We found that such a model indeed performsas an attractor memory, exhibiting pattern completion and rivalry. It displayed spontaneous600activity reminiscent of UP and DOWN states as well as a temporal fine structure of activitysimilar to phenomena experimentally observed. Future work includes adding further corticallayers, scaling up the network model by means of parallel simulation and synthesizing furtherexperimental signals like MEG and fMRI from the model.
Acknowledgements605
This work was partly supported by a grant from the Swedish Science Council (grant no621-2001-2548) and from the European Union (FACETS project, FP6-2004-IST-FETPI-015879). We are grateful to Dr Alex Kozlov for assistance with the use of the SPLIT simulatorand the initial setting up of the network specification file.
References610
Abeles M, Vaadia E, Bergman H. 1990. Firing patterns of single units in the prefrontal cortex and neural networkmodels. Network: Comput Neural Systems 1:13–25.
Amit D. 1989. Modeling brain function: The world of attractor neural networks. New York: Cambridge UniversityPress.
Amit DJ, Brunel N. 1997. Model of global spontaneous activity and local structured delay activity during delay615periods in the cerebral cortex. Cerebral Cortex 7:237–252.
Binzegger T, Douglas RJ, Martin KAC. 2004. A quantitative map of the circuit of cat primary visual cortex.J Neurosci 39:8441–8453.
Blakeslee B, McCourt ME. 2004. A unified theory of brightness contrast and assimilation incorporating orientedmultiscale spatial filtering and contrast normalization. Vision Res 44:2483–2503.620
Brovelli A, Ding M, Ledberg A, Chen Y, Nakamura R, Bressler SL. 2004. Beta oscillations in a large-scale senso-rimotor cortical network: directional influences revealed by Granger causality. PNAS 101:9849–9854.
Cauli B, Porter JT, Tsuzuki K, Rossier J, Quenet B, Audinat E. 2000. Classification of fusiform neocortical in-terneurons based on unsupervised clustering. PNAS 97:6144–6199.
Compte A, Brunel N, Goldman-Rakic PS, Wang X-J. 2000. Synaptic mechanisms and network dynamics underlying625visuospatial working memory in a cortical network model. Cerebral Cortex 10:910–923.
Cossart R, Aronov D, Yuste R. 2003. Attractor dynamics of network UP states in the neocortex. Nature 423:xx–xx. Q3Djurfeldt M, Johansson C, Ekeberg O, Rehn M, Lundqvist M, Lansner A. 2006. Massively parallel simulation
of brain-scale neuronal network models. Royal Institute of Technology, School of Computer Science andCommunication, Stockholm (TRITA-NA-P0513).630
Douglas RJ, Martin KAC. 2004. Neuronal circuits of the neocortex. Ann Rev Neurosci 27:419–451.Dressler O, Schneider G, Stockmanns G, Kochs EF. 2004. Awareness and the EEG power spectrum: analysis of
frequencies. Br J Anaesth 93:806–809.
tnet.cls TFJI054B1-02-177414 May 26, 2006 21:57
22 M. Lundqvist et al.
Fransen E, Lansner A. 1995. Low spiking rates in a population of mutually exciting pyramidal cells. Network:Comput Neural Systems 6:271–288. 635
Fransen E, Lansner A. 1998. A model of cortical associative memory based on a horizontal network of connectedcolumns. Network: Comput Neural Systems 9:235–264.
Fuster JM. 1995. Memory in the cerebreal cortex. Cambridge, MA: The MIT Press.Gerstein GL, Perkel DH. 1969. Simultaneously recorded trains of action potentials: analysis and functional inter-
pretation. Science 164:828–830. 640Gerstner W. 2002. Integrate-and-fire neurons and networks. In: Arbib MA, editor. The handbook of brain theory
and neural networks. Cambridge, MA: The MIT Press. pp 577-581.Gilbert CD, Hirsch JA, Wiesel TN. 1990. Lateral interactions in the visual cortex. Cold Spring Harbor Symposia
on Quantiative Biology, Cold Spring Harbor Laboratory Press. LV:663–676.Grun S, Diesmann M, Aertsen A. 2002a. Unitary events in multiple single-neuron spiking activity: I. Detection 645
and significance. Neural Comput 14:43–80.Grun S, Diesmann M, Aertsen A. 2002b. Unitary events in multiple single-neuron spiking activity: II. Detection
and significance. Neural Comput 14:81–119.Grun S, Diesmann M, Grammont F, Riehle A, Aertsen A. 1999. Detecting unitary events without discretization of
time. J Neurosci Methods 94:67–79. 650Haberly LB, Bower JM. 1989. Olfactory cortex: model circuit for the study of associative memory? TINS 12:258–
264.Hammarlund P, Ekeberg O. 1998. Large neural network simulations on multiple hardware platforms. J Comput
Neurosci 5:443–459.Hertz J, Krogh A, Palmer RG. 1991. Introduction to the theory of neural computation. Redwood City, California: 655
Addison-Wesley Publishing Company.Holmgren C, Harkany T, Svennenfors B, Zilberter Y. 2003. Pyramidal cell communication within local networks
in layer 2/3 of rat neocortex. J Physiol 551:139–153.Hopfield JJ. 1982. Neural networks and physical systems with emergent collective computational properties. PNAS
81:3088–3092. 660Hubel D, Wiesel TN. 1977. The functional architecture of the macaque visual cortex. The Ferrier lecture. Proc
Royal Soc B 198:1–59.Izhikevich EM. 2004. Which model to use for cortical spiking neurons? IEEE Trans Neural Networks 15:1063–
1070.Johansson C. 2004. Towards cortex isomorphic attractor neural networks. Department of Numerical Analysis and 665
Computer Science. Stockholm, Kungl. Tekniska Hogskolan.Johansson C, Lansner A. 2004. Towards cortex sized artificial nervous systems. LNAI 3213:959–966.Kawaguchi Y. 1995. Physiological subgroups of nonpyramidal cells with specific morphological characteristics in
layer lI/lll of rat frontal cortex. J Neurosci 15:2638–2655.Kawaguchi Y, Kubota Y. 1993. Correlation of Physiological subgroupings of nonpyramidal cells with parvalbumin- 670
and calbindinD28k-immunoreactive neurons in layer V of rat frontal cortex. J Neurophysiol 70:387–396.Lansner A, Fransen E, 1992. Modeling Hebbian cell assemblies comprised of cortical neurons. Network: Comput
Neural Systems 3:105–119.Lansner A, Fransen E, Sandberg A. 2003. Cell assembly dynamics in detailed and abstract attractor models of
cortical associative memory. Theory in Biosciences 122:19–36. 675Lehmann D, Strik WK, Henggeler B, Koenig T, Koukkou M. 1998. Brain electric microstates and momentary
conscious mind states as building blocks of spontaneous thinking: 1. Visual imagery and abstract thoughts.Int J Psychophysiol 29:1–11.
Lennie P. 2003. The cost of cortical computation. Curr Biol 13:493–497.Markram H, Toledo-Rodriguez M, Wang Y, Gupta A, Silberberg G, Wu C. 2004. Interneurons of the neocortical 680
inhibitory system. Nat Rev Neurosci 5:793–807.Marois R, Ivanoff J. 2005. Capacity limits of information processing in the brain. Trends in Cognitive Sciences
9:296–305.Palm G. 1982. Neural assemblies. An alternative approach to artificial intelligence. Berlin: Springer.Panzeri S, Rolls ET, Battaglia F, Lavis R. 2001. Speed of feedforward and recurrent processing in multilayer 685
networks of integrate-and-fire neurons. Network: Comput Neural Systems 12:423–440.Peters A, Sethares C. 1997. The organization of double bouquet cells in monkey striate cortex. J Neurocytology
26:779–797.Peters A, Yilmaz E. 1993. Neuronal organization in area 17 of cat visual cortex. Cereb Cortex 3:49–68.Protopapas AD, Vanier M, Bower JM. 1998. Chapter 12: Simulating large networks of neurons. In: Koch C, Segev 690
I, editors. Methods in neuronal modeling: From ions to networks, 2nd edition, Cambridge, MA: MIT Press.
tnet.cls TFJI054B1-02-177414 May 26, 2006 21:57
Dynamics in a cortical model 23
Riehle A, Grammont F, Diesmann M, Grun S. 2000. Dynamical changes and temporal precision of synchronizedspiking activity in monkey motor cortex during movement preparation. J Physiol Paris 94:569–582.
Sandberg A, Lansner A, Petersson K-M, Ekeberg O. 2002. Bayesian attractor networks with incremental learning.Network: Comput Neural Systems 13: 179–194.695
Sandberg A, Lansner A, Tegner J. 2003. A working memory model based on fast Hebbian learning. Network:Comput Neural Systems 14:789–802.
Shapiro KL, Raymond JE, Arnell KM. 1994. Attention to visual pattern information produces the attentional blinkin rapid serial visual presentation. J Exp Psychol Hum Percept Perform xx:xx–xx. Q4
Shu Y, Hasenstaub A, McCormick DA. 2003. Turning on and off recurrent balanced cortical activity. Nature700423:288–293.
Steriade M, Amzica F, Contreras D. 1996. Synchronization of fast (30–40 Hz) spontaneous cortical rhythms duringbrain activation. J Neurosci 16:392–417.
Stettler D, Das A, Bennett J, Gilbert C. 2002. Lateral connectivity and contextual interactions in macaque primaryvisual cortex. Neuron 14:739–750.705
Tallon-Baudry C, Bertrand O, Peronnet F, Pernier J. 1998. Induced g-band activity during the delay of a visualshort-term memory task in humans. J Neurosci 18:4244–4254.
Tao L, Shelley M, McLaughlin D, Shapley R. 2004. An egalitarian network model for the emergence of simple andcomplex cells in visual cortex. PNAS 101:366–371.
Thomson AM, West DC, Wang Y, Bannister AP. 2002. Synaptic connections and small circuits involving excitatory710and inhibitory neurons in layer 2-5 of adult rat and cat neocortex: Triple intracellular recordings and biocytinlabelling in vitro. Cerebal Cortex 12:936–953.
Thorpe S, Fize D, Marlot C. 1996. Speed of processing in the human visual system. Nature 381:520–522.Treves A, Rolls ET. 1994. Computational analysis of the role of the hippocampus in memory. Hippocampus 4:374–
391.715Willshaw DJ, Longuet-Higgins HC. 1969. Associative memory models. Machine Learning 5. Meltzer and Michie,
editors. Edinburgh: Edinburgh University Press.
Appendix
Cell and synapse parameters
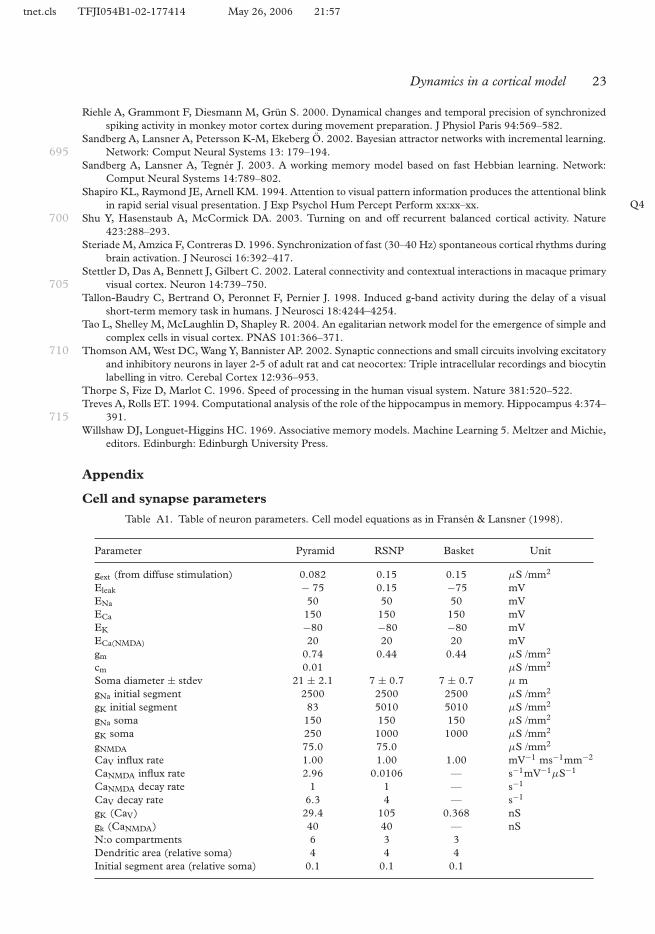
Table A1. Table of neuron parameters. Cell model equations as in Fransen & Lansner (1998).
Parameter Pyramid RSNP Basket Unit
gext (from diffuse stimulation) 0.082 0.15 0.15 µS /mm2
Eleak − 75 0.15 −75 mVENa 50 50 50 mVECa 150 150 150 mVEK −80 −80 −80 mVECa(NMDA) 20 20 20 mVgm 0.74 0.44 0.44 µS /mm2
cm 0.01 µS /mm2
Soma diameter ± stdev 21 ± 2.1 7 ± 0.7 7 ± 0.7 µ mgNa initial segment 2500 2500 2500 µS /mm2
gK initial segment 83 5010 5010 µS /mm2
gNa soma 150 150 150 µS /mm2
gK soma 250 1000 1000 µS /mm2
gNMDA 75.0 75.0 µS /mm2
CaV influx rate 1.00 1.00 1.00 mV−1 ms−1mm−2
CaNMDA influx rate 2.96 0.0106 — s−1mV−1µS−1
CaNMDA decay rate 1 1 — s−1
CaV decay rate 6.3 4 — s−1
gK (CaV) 29.4 105 0.368 nSgk (CaNMDA) 40 40 — nSN:o compartments 6 3 3Dendritic area (relative soma) 4 4 4Initial segment area (relative soma) 0.1 0.1 0.1

tnet.cls TFJI054B1-02-177414 May 26, 2006 21:57
24 M. Lundqvist et al.
Table A2. Table of synapse parameters. Synapse model equations as in Fransen & Lansner (1998). Parametersdescribing the synaptic depression are U and τrec. U is the fractional decrease of the maximum conductance aftera spike is received, and τrec is the characteristic time constant for recovery of the conductance.
Pre-post Type Duration s τ raise s τdecay s Erev mV U τ rec s Eslow mV
Pyr–Pyr Kainate/AMPA 0.0 0.0 0.006 0 0.25 0.575 –Pyr–Pyr NMDA 0.02 0.005 0.150 0 0.25 0.575 0.020Pyr–Basket Kainate/AMPA 0.0 0.0 0.006 0 – – –Pyr–RSNP Kainate/AMPA 0.0 0.0 0.006 0 — — —Pyr–RSNP NMDA 0.02 0.005 0.150 0 — — 0.020Basket GABA 0.0 0.0 0.006 –85 — — —RSNP GABA 0.0 0.0 0.006 —85 – — —

tnet.cls TFJI054B1-02-177414 May 26, 2006 21:57
Queries
Q1. Au: Pls. provide article dates (received; revised; accepted).Q2. Au: Pls. provide 3–5 article keywords.Q3. Au: Cossart et al. 2003. Please povide page extent.Q4. Au: Shapiro et al. 2004. Please provide volume and page extent.