the ncep climate forecast system reanalysis clivar workshop nov 1-3, 2010 bob kistler the...
TRANSCRIPT

THE NCEP CLIMATE FORECAST SYSTEM REANALYSISTHE NCEP CLIMATE FORECAST SYSTEM REANALYSIS
CLIVAR Workshop Nov 1-3, 2010CLIVAR Workshop Nov 1-3, 2010
Bob KistlerBob Kistler
THE ENVIRONMENTAL MODELING CENTERTHE ENVIRONMENTAL MODELING CENTER
IMSG/NCEP/NWS/NOAAIMSG/NCEP/NWS/NOAA

Acknowledge Previous Reanalyses
– NCEP/NCAR R1, R2– MERRA– ERA-15, ERA-40, ERA-Interim– NCEP NARR– 20th Century – JRA-25 (JRA-55)– Uccellini and Kocin Northeast Snowstorms

For a new Climate Forecast System (CFS) implementation
Two essential prerequisites:
A new Reanalysis of the atmosphere, ocean, seaice and land over the 31-year period (1979-2009) is required to provide consistent
initial conditions for:
A complete Reforecast of the new CFS over the 28-year period (1982-2009), in order to provide stable calibration and skill
estimates of the new system, for operational seasonal prediction at NCEP

• Time line
–2007 : assembly, ran CFSRR Lite
–2008:2009 CFSRR 6 stream execution
–2010: Hindcasts
–12Z Jan 18, 2011 CFS implementation

The NCEP Climate Forecast System Reanalysis
Suranjana Saha, Shrinivas Moorthi, Hua-Lu Pan, Xingren Wu, Jiande Wang, Sudhir Nadiga, Patrick Tripp, Robert Kistler, John Woollen, David Behringer, Haixia Liu, Diane Stokes, Robert Grumbine, George Gayno, Jun Wang, Yu-Tai Hou, Hui-ya Chuang, Hann-Ming H. Juang, Joe Sela, Mark Iredell, Russ Treadon, Daryl Kleist, Paul Van Delst, Dennis Keyser, John Derber, Michael Ek, Jesse Meng, Helin Wei, Rongqian Yang, Stephen Lord, Huug van den Dool, Arun Kumar, Wanqiu Wang, Craig Long, Muthuvel Chelliah, Yan Xue, Boyin Huang, Jae-Kyung Schemm, Wesley Ebisuzaki, Roger Lin, Pingping Xie, Mingyue Chen, Shuntai Zhou, Wayne Higgins, Cheng-Zhi Zou, Quanhua Liu, Yong Chen, Yong Han, Lidia Cucurull, Richard W. Reynolds, Glenn Rutledge, Mitch Goldberg
Bulletin of the American Meteorological SocietyVolume 91, Issue 8, pp 1015-1057. doi: 10.1175/2010BAMS3001.1

The NCEP Climate Forecast System Reanalysis
Suranjana Saha, Shrinivas Moorthi, Hua-Lu Pan, Xingren Wu, Jiande Wang, Sudhir Nadiga, Patrick Tripp, Robert Kistler, John Woollen, David Behringer, Haixia Liu, Diane Stokes, Robert Grumbine, George Gayno, Jun Wang, Yu-Tai Hou, Hui-ya Chuang, Hann-
Ming H. Juang, Joe Sela, Mark Iredell, Russ Treadon, Daryl Kleist, Paul Van Delst, Dennis Keyser, John Derber, Michael Ek, Jesse Meng, Helin Wei, Rongqian Yang, Stephen Lord, Huug van den Dool, Arun Kumar, Wanqiu Wang, Craig Long, Muthuvel Chelliah, Yan Xue, Boyin Huang, Jae-Kyung Schemm, Wesley Ebisuzaki, Roger Lin, Pingping Xie, Mingyue Chen, Shuntai Zhou, Wayne Higgins, Cheng-Zhi Zou, Quanhua Liu, Yong Chen, Yong Han, Lidia Cucurull, Richard W. Reynolds, Glenn Rutledge, Mitch Goldberg
Bulletin of the American Meteorological SocietyVolume 91, Issue 8, pp 1015-1057. doi: 10.1175/2010BAMS3001.1


THE HUMAN FACE OF CFSR Production
EMC CORE GROUP
24/7
GROUP
EMC SUPPORT
GROUP
CPC/EMC MONITORING
Suru Saha
Xingren Wu
Jiande Wang
Patrick Tripp
Sudhir Nadiga
Diane Stokes
Hui-ya Chuang
Mark Iredell
Jesse Meng
Ken Mitchell
Russ Treadon
Daryl Kleist
Glenn White
Yu-Tai Hou
Steve Lord
Helin Wei
Bob Grumbine
George Gayno
Jun Wang
Paul van Delst
Joe Sela
Hua-Lu Pan
Shrinivas Moorthi
Bob Kistler
Jack Woollen
Haixia Liu
Dave Behringer
Mike Ek
Dennis Keyser
Jesse Menge

CPC/EMC SCIENTISTS MONITORING CFSR Arun Kumar
Troposphere Surface Stratosphere Ocean/SeaIce
Muthuvel Chelliah Wanqiu Wang Craig Long Yan Xue
Jae Schemm Huug van den Dool Shuntai Zhou Boyin Huang
Wesley Ebisuzaki Kingtse Mo Roger Lin Jiande Wang
Suru Saha Yun Fan Xingren Wu
Augustin Vintzileos Glenn White Sudhir Nadiga
Hua-Lu Pan
Helin Wei
Ken Mitchell


For a new CFS implementation (contd)
1. Analysis Systems : Operational GDAS:Atmospheric (GADAS)-GSI Ocean-ice
(GODAS) and Land (GLDAS)
2. Atmospheric Model : Operational GFS
New Noah Land Model
3. Ocean Model : New MOM4 Ocean Model
New Sea Ice Model

For a new CFS implementation (contd)
1. An atmosphere at high horizontal resolution (spectral T382, ~38 km) and high vertical resolution (64 sigma-pressure hybrid levels)
2. An interactive ocean with 40 levels in the vertical, to a depth of 4737 m, and horizontal resolution of 0.25 degree at the tropics, tapering to a global resolution of 0.5 degree northwards and southwards of 10N and 10S respectively
3. An interactive 3 layer sea-ice model
4. An interactive land model with 4 soil levels

There are three main differences with the earlier two NCEP Global Reanalysis efforts:
Much higher horizontal and vertical resolution (T382L64) of the atmosphere (earlier efforts were made with T62L28 resolution)
The guess forecast was generated from a “coupled” atmosphere – ocean – seaice - land system
Radiance measurements from the historical satellites were assimilated in this Reanalysis
To conduct a Reanalysis with the atmosphere, ocean, seaice and land coupled to each other was a novelty, and will hopefully address important issues, such as the correlations between sea surface temperatures and precipitation in the
global tropics, etc.

12Z GSI 18Z GSI 0Z GSI
9-hr coupled T382L64 forecast guess (GFS + MOM4 + Noah)
12Z GODAS
0Z GLDAS
5-day T126L64 coupled forecast ( GFS + MOM4 + Noah )
6Z GSI
ONE DAY OF REANALYSIS
18Z GODAS 0Z GODAS 6Z GODAS
1 Jan 0Z 2 Jan 0 Z 3 Jan 0Z 4 Jan 0Z 5 Jan 0Z

• Atmospheric T382L64 (GSI) Analysis at 0,6,12 and 18Z, using radiance data from satellites, as well as all conventional data
• Ocean and Sea Ice Analysis (GODAS) at 0,6,12 and 18, constrained by daily analyses SST and ice concentration
• From each of the 4 cycles, a 9-hour coupled guess forecast (GFS at T382L64) is made with 30-minute coupling to the ocean (MOM4 at 1/4o equatorial, 1/2o global)
• Land (GLDAS) Analysis using observed precipitation with Noah Land Model at 0Z, (snow depth analysis constraint)
• Coupled 5-day forecast from every 0Z initial condition was made with the T126L64 GFS for a sanity check.
ONE DAY OF REANALYSIS

The vertical structure of model levels as a meridional cross section at 90E
R1 Troposphere CFSR Troposphere
R1 Stratosphere CFSR Stratosphere
Courtesy: Shrinivas Moorthi
28 levels 64 levels

• 3D Pressure grib (2.5 & 0.5 lat-lon): 27 variables
• 3D Isentropic (ipvanl, 2.5 & 0.5 lat-lon): 3 variables
• 2D Sfc. flux (T62 & T382 Gaussian): 32 variables
• 3D Ocean (2.5 & 0.5 lat-lon): 13 parameters
Hourly Timeseries
Details in BAMS supplement

37 Pressure (hPa) Levels: pgb (atmosphere)
1000 975 950 925 900 875 850 825 800 775 750 700 650 600 550 500 450 400 350 300 250 225 200 175 150 125 100 70 50 30 20 10 7 5 3 2
1
40 Levels (depth in meters): ocn (ocean)
4478 3972 3483 3016 2579 2174 1807 1479 1193 949 747 584 459 366 303 262 238 225 215 205 195 185 175 165 155 145 135 125
115105 95 85 75 65 55 45 35 25 15 5
16 Isentropic Levels (K): ipv
270 280 290 300 310 320 330 350 400 450 550 650 850 1000 1250 1500

Monthly mean hourly surface pressure with the daily mean subtracted for the month of March 1998
Courtesy: Huug van den Dool

The diurnal cycle of SST in the TAO data (blue line) , MPM data (red line) and CFSR (black line) for many locations in the Tropical Pacific. The amplitude of the diurnal cycle in CFSR is smaller than in the observed data, especially where the amplitude of the diurnal cycle is large. The CFSR diurnal cycle also looks serrated because of the relaxation to daily-averaged SSTs every six hours. Period of 2005-2006

Global Soil Moisture Fields in the NCEP CFSR
Soil Moisture Anomaly
R(GR2,OBS)=0.48 R(NARR,OBS)=0.67 R(CFSR,OBS)=0.61
[%] [%]
[mm] [mm]
CONUS
Illinois
GR2 NARR CFSROBS
The CFSR soil moisture climatology is consistent with GR2 and NARR on regional scale. The anomaly agrees with the
Illinois observations, correlation coefficient = 0.61.
Courtesy: Jesse Meng

Another innovative feature of the CFSR GSI is the use of the historical concentrations of carbon dioxide when the historical TOVS
instruments were retrofit into the CRTM.
Satellite Platform Mission Mean (ppmv)b
TIROS-N 337.10
NOAA-6 340.02
NOAA-7 342.96
NOAA-8 343.67
NOAA-9 355.01
NOAA-10 351.99
NOAA-11 363.03
NOAA-12 365.15
GEOS-8 367.54
GEOS-0 362.90
GEOS-10 370.27
NOAA-14 to NOAA-18 380.00
IASI METOP-A 389.00
NOAA-19 391.00
Courtesy: http://gaw.kishou.go.jp

Courtesy: Huug van den Dool
The linear trends are 0.66, 1.02 and 0.94K per 31 years for R1, CFSR and GHCN_CAMS respectively. (Keep in mind that straight lines may
not be perfectly portraying climate change trends).

5-day T126L64 forecast anomaly correlations
Courtesy: Bob Kistler
NH Yearly Averaged Anomaly Correlation0000 GMT 500 Hpa 120hr Forecasts
50
60
70
80
90
1979 1984 1989 1994 1999 2004 2009
Year
Ano
mal
y C
orre
latio
n (x
100)
NH CFSRR
NH GFS
NH CFSRR Lite
NH CFS R2
NH CDAS/R1
SH Yearly Averaged Anomaly Correlation0000 GMT 500 Hpa 120hr Forecasts
50
60
70
80
90
1979 1984 1989 1994 1999 2004 2009
Year
An
om
aly
Co
rre
latio
n (
x10
0)
SH CFSRR
SH GFS
SH CFSRR Lite
SH CFS R2
SH CDAS/R1

Forecast Skill of WH-MJO index

SST-Precipitation Relationship in CFSR Precipitation-SST lag anomaly correlation in tropical Western Pacific
simultaneous positive correlation in R1 and R2
Response of Prec. To SST increase : warming too quick in R1 and R2
Courtesy: Jiande Wang

Tropical Cyclone Processing• The first global reanalysis to assimilate historical tropical storm information
was the JRA-25 reanalysis (Onogi, et.al. 2007). It assimilated synthetic wind profiles (Fiorino, 2002) surrounding the historical storm locations of Newman, 1999.
• A unique feature of the CFSR is its approach to the analysis of historical tropical storm locations. The CFSR applied the NCEP tropical storm relocation package (Liu et. al., 1999), a key component of the operational GFS analysis and prediction of tropical storms.
• By relocating a tropical storm vortex to its observed location prior to the assimilation of storm circulation observations, distortion of the circulation by the mismatch of guess and observed locations is avoided.
• Fiorino (personal communication) provided the CFSR with the historical set of storm reports (provided to NCEP by the National Hurricane Center and the US Navy Joint Typhoon Warning Center) converted into the operational format.
• A measure of the ability of the assimilation system to depict observed tropical storms is to quantify whether or not a reported storm is detected in the guess forecast. A noticeable improvement starts in 2000 coincident with the full utilization of the ATOVS satellite instruments, such that between 90-95% of reported tropical storms are detected.
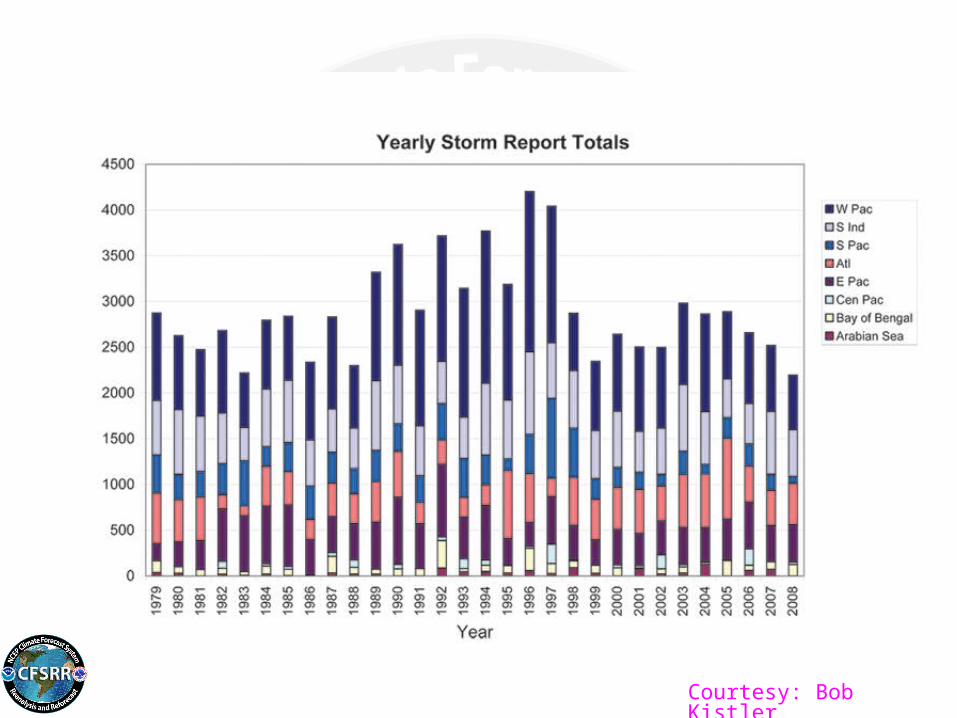
Courtesy: Bob Kistler

Courtesy: Bob Kistler

Problem Areas…• Multiple streams:
– Stratosphere • radiance bias correction
– Deep ocean– Deep soil
• Background errors– QBO– Tropical troposphere

Courtesy: Craig Long

•Conduct CFSRL: a ‘light’ (with a reduced horizontal resolution of T126) version of the reanalysis that was just completed. It will be done in a single stream to overcome the discontinuities found in the CFSR for the deep ocean, deep soil and the top of the atmosphere. It is possible that the CFSRL will be finished in 1 year, in time for CPC to use it when they change their climate normals to the last 30-year period from 1981-2010.
•A final activity to be conducted when the Reforecast project is complete is to apply the reanalysis system, as used here, to the historical period 1948-1978.
•The CFSR is the successor of R2, and when extended back to 1948, will also be the successor of R1. It is possible this will be done in one-stream ‘light’ mode.
Future Plans

THANK YOU

Hindcast Configuration for next CFS• 9-month hindcasts will be initiated from every 5th day and will be run from all 4 cycles of that
day, beginning from Jan 1 of each year, over a 28 year period from 1982-2009 This is required to calibrate the operational CPC longer-term seasonal predictions (ENSO, etc)
• There will also be a single 1 season (123-day) hindcast run, initiated from every 0 UTC cycle between these five days, over the 12 year period from 1999-2010. This is required to calibrate the operational CPC first season predictions for hydrological forecasts (precip, evaporation, runoff, streamflow, etc)
• In addition, there will be three 45-day (1-month) hindcast runs from every 6, 12 and 18 UTC cycles, over the 12-year period from 1999-2010. This is required for the operational CPC week3-week6 predictions of tropical circulations (MJO, PNA, etc)
• Total number of years of integration = 9447 years !!!!!
Jan 1
0 6 12 18
9 month run 1 season run 45 day run
Jan 2
0 6 12 18
Jan 3
0 6 12 18
Jan 4
0 6 12 18
Jan 5
0 6 12 18
Jan 6
0 6 12 18
Courtesy: Suru Saha

Operational Configuration for next CFS• There will be 4 control runs per day from the 0, 6, 12 and 18 UTC cycles of the CFS
real-time data assimilation system, out to 9 months.
• In addition to the control run of 9 months at the 0 UTC cycle, there will be 3 additional runs, out to one season. These 3 runs per cycle will be initialized as in current operations.
• In addition to the control run of 9 months at the 6, 12 and 18 UTC cycles, there will be 3 additional runs, out to 45 days. These 3 runs per cycle will be initialized as in current operations.
• There will be a total of 16 CFS runs every day, of which 4 runs will go out to 9 months, 3 runs will go out to 1 season and 9 runs will go out to 45 days.
0 UTC 6 UTC 18 UTC12 UTC
9 month run (4) 1 season run (3) 45 day run (9)Courtesy: Suru Saha