the nasdaq omx group, inc. · · 2015-06-04the nasdaq omx group, inc. ... information so that...
TRANSCRIPT

UNITED STATESSECURITIES AND EXCHANGE COMMISSION
Washington, D.C. 20549
FORM 10-KÈ ANNUAL REPORT PURSUANT TO SECTION 13 OR 15(d) OF THE SECURITIES EXCHANGE ACT OF 1934
For the fiscal year ended December 31, 2013OR
‘ TRANSITION REPORT PURSUANT TO SECTION 13 OR 15(d) OF THE SECURITIES EXCHANGE ACT OF 1934For the transition period from to
Commission file number: 000-32651
The NASDAQ OMX Group, Inc.(Exact name of registrant as specified in its charter)
Delaware 52-1165937(State or Other Jurisdiction ofIncorporation or Organization)
(I.R.S. EmployerIdentification No.)
One Liberty Plaza, New York, New York 10006(Address of Principal Executive Offices) (Zip Code)
Registrant’s telephone number, including area code:+1 212 401 8700
Securities registered pursuant to Section 12(b) of the Act:Title of each class Name of each exchange on which registered
Common Stock, $.01 par value per share The NASDAQ Stock MarketSecurities registered pursuant to Section 12(g) of the Act:
None
Indicate by check mark if the registrant is a well-known seasoned issuer, as defined in Rule 405 of the SecuritiesAct. Yes È No ‘
Indicate by check mark if the registrant is not required to file reports pursuant to Section 13 or Section 15(d) of the ExchangeAct. Yes ‘ No È
Indicate by check mark whether the registrant (1) has filed all reports required to be filed by Section 13 or 15(d) of theSecurities Exchange Act of 1934 during the preceding 12 months (or for such shorter period that the registrant was required to filesuch reports), and (2) has been subject to such filing requirements for the past 90 days. Yes È No ‘
Indicate by check mark whether the registrant has submitted electronically and posted on its corporate Web site, if any, everyInteractive Data File required to be submitted and posted pursuant to Rule 405 of Regulation S-T (§232.405 of this chapter) duringthe preceding 12 months (or for such shorter period that the registrant was required to submit and post such files). Yes È No ‘
Indicate by check mark if disclosure of delinquent filers pursuant to Item 405 of Regulation S-K (§229.405 of this chapter) isnot contained herein, and will not be contained, to the best of registrant’s knowledge, in definitive proxy or information statementsincorporated by reference in Part III of this Form 10-K or any amendment to this Form 10-K. È
Indicate by check mark whether the registrant is a large accelerated filer, an accelerated filer, a non-accelerated filer, or asmaller reporting company. See the definitions of “large accelerated filer,” “accelerated filer” and “smaller reporting company” inRule 12b-2 of the Exchange Act.
Large accelerated filer È Accelerated filer ‘
Non-accelerated filer ‘ (Do not check if a smaller reporting company) Smaller reporting company ‘
Indicate by check mark whether the registrant is a shell company (as defined in Rule 12b-2 of the ExchangeAct). Yes ‘ No È
As of June 28, 2013, the aggregate market value of the registrant’s common stock held by non-affiliates of the registrant wasapproximately $3.8 billion (this amount represents approximately 116.3 million shares of The NASDAQ OMX Group, Inc.’scommon stock based on the last reported sales price of $32.79 of the common stock on The NASDAQ Stock Market on such date).
Indicate the number of shares outstanding of each of the issuer’s classes of common stock, as of the latest practicable date.Class Outstanding at February 7, 2014
Common Stock, $.01 par value per share 169,427,722 shares
DOCUMENTS INCORPORATED BY REFERENCEDocument Parts Into Which Incorporated
Certain portions of the Definitive Proxy Statement for the2014 Annual Meeting of Stockholders
Part III


TABLE OF CONTENTS
Page
Part I.
Item 1. Business . . . . . . . . . . . . . . . . . . . . . . . . . . . . . . . . . . . . . . . . . . . . . . . . . . . . . . . . . . . . . . . . . . . 2
Item 1A. Risk Factors . . . . . . . . . . . . . . . . . . . . . . . . . . . . . . . . . . . . . . . . . . . . . . . . . . . . . . . . . . . . . . . . 20
Item 1B. Unresolved Staff Comments . . . . . . . . . . . . . . . . . . . . . . . . . . . . . . . . . . . . . . . . . . . . . . . . . . . 37
Item 2. Properties . . . . . . . . . . . . . . . . . . . . . . . . . . . . . . . . . . . . . . . . . . . . . . . . . . . . . . . . . . . . . . . . . . 37
Item 3. Legal Proceedings . . . . . . . . . . . . . . . . . . . . . . . . . . . . . . . . . . . . . . . . . . . . . . . . . . . . . . . . . . . 38
Item 4. Mine Safety Disclosures . . . . . . . . . . . . . . . . . . . . . . . . . . . . . . . . . . . . . . . . . . . . . . . . . . . . . . . 38
Part II.
Item 5. Market for Registrant’s Common Equity, Related Stockholder Matters and Issuer Purchasesof Equity Securities . . . . . . . . . . . . . . . . . . . . . . . . . . . . . . . . . . . . . . . . . . . . . . . . . . . . . . . . . . 39
Item 6. Selected Financial Data . . . . . . . . . . . . . . . . . . . . . . . . . . . . . . . . . . . . . . . . . . . . . . . . . . . . . . . 43
Item 7. Management’s Discussion and Analysis of Financial Condition and Results of Operations . . 44
Item 7A. Quantitative and Qualitative Disclosures About Market Risk . . . . . . . . . . . . . . . . . . . . . . . . . . 93
Item 8. Financial Statements and Supplementary Data . . . . . . . . . . . . . . . . . . . . . . . . . . . . . . . . . . . . . 93
Item 9. Changes in and Disagreements with Accountants on Accounting and Financial Disclosure . . 93
Item 9A. Controls and Procedures . . . . . . . . . . . . . . . . . . . . . . . . . . . . . . . . . . . . . . . . . . . . . . . . . . . . . . . 94
Item 9B. Other Information . . . . . . . . . . . . . . . . . . . . . . . . . . . . . . . . . . . . . . . . . . . . . . . . . . . . . . . . . . . . 96
Part III.
Item 10. Directors, Executive Officers and Corporate Governance . . . . . . . . . . . . . . . . . . . . . . . . . . . . . 96
Item 11. Executive Compensation . . . . . . . . . . . . . . . . . . . . . . . . . . . . . . . . . . . . . . . . . . . . . . . . . . . . . . 96
Item 12. Security Ownership of Certain Beneficial Owners and Management and Related StockholderMatters . . . . . . . . . . . . . . . . . . . . . . . . . . . . . . . . . . . . . . . . . . . . . . . . . . . . . . . . . . . . . . . . . . . . 96
Item 13. Certain Relationships and Related Transactions, and Director Independence . . . . . . . . . . . . . . 97
Item 14. Principal Accounting Fees and Services . . . . . . . . . . . . . . . . . . . . . . . . . . . . . . . . . . . . . . . . . . 97
Part IV.
Item 15. Exhibits, Financial Statement Schedules . . . . . . . . . . . . . . . . . . . . . . . . . . . . . . . . . . . . . . . . . . 98

About This Form 10-K
The NASDAQ OMX Group, Inc. is a holding company created by the business combination of The NasdaqStock Market, Inc. and OMX AB (publ) which was completed on February 27, 2008. Under the purchase methodof accounting, Nasdaq was treated as the accounting and legal acquirer in this business combination. As such,Nasdaq is the predecessor reporting entity of NASDAQ OMX and the results of operations of OMX are onlyincluded in NASDAQ OMX’s consolidated results of operations beginning February 27, 2008.
Throughout this Form 10-K, unless otherwise specified:
• “NASDAQ OMX,” “we,” “us” and “our” refer to The NASDAQ OMX Group, Inc.
• “The NASDAQ Stock Market” and “NASDAQ” refer to the registered national securities exchangeoperated by The NASDAQ Stock Market LLC.
• “OMX AB” refers to OMX AB (publ), as that entity operated prior to the business combination withNasdaq.
• “Nasdaq” refers to The Nasdaq Stock Market, Inc., as that entity operated prior to the businesscombination with OMX AB.
• “OMX” refers to OMX AB (publ) subsequent to the business combination with Nasdaq.
• “NASDAQ OMX Nordic” refers to collectively, NASDAQ OMX Clearing AB, NASDAQ OMXStockholm, NASDAQ OMX Copenhagen, NASDAQ OMX Helsinki and NASDAQ OMX Iceland.
• “NASDAQ OMX Nordic Clearing” refers to collectively, the clearing operations conducted throughNASDAQ OMX Nordic and NASDAQ OMX Commodities.
• “NASDAQ OMX Baltic” refers to collectively, NASDAQ OMX Tallinn, NASDAQ OMX Riga andNASDAQ OMX Vilnius.
• “PHLX” refers to the Philadelphia Stock Exchange, Inc. and its subsidiaries, as that entity operated priorto its acquisition by NASDAQ OMX.
• “NASDAQ OMX PHLX” refers to NASDAQ OMX PHLX LLC (formerly NASDAQ OMX PHLX,Inc.) subsequent to its acquisition by NASDAQ OMX.
• “SEK” or “Swedish Krona” refers to the lawful currency of Sweden.
* * * * * *
Aces®, Auto Workup®, Autospeed®, AXE®, BX Venture Market®, CCBN®, Directors Desk®, Dream It. DoIt®, E and Design®, eSpeed and Design®, eSpeed®, e-Speed®, eSpeed Elite®, eSpeed Filing®, eSpeedoMeter®,EVI®, FINQLOUD®, FTEN®, GlobeNewswire®, INET®, ITCH®, Kleos®, Market Intelligence Desk®, MarketMechanics®, MarketSite®, MYCCBN®, NASDAQ®, NASDAQ Biotechnology®, NASDAQ Capital Market®,NASDAQ Competitive VWAP®, NASDAQ Composite®, NASDAQ Composite Index®, NASDAQ ComputerIndex®, NASDAQ-Financial®, NASDAQ-Financial Index®, NASDAQ Financial-100 Index®, NASDAQ GlobalMarket®, NASDAQ Global Select Market®, NASDAQ Industrial Index®, NASDAQ Interact®, NASDAQInternet Index®, NASDAQ Market Analytix®, NASDAQ Market Center®, NASDAQ Market Forces®, NASDAQMarket Velocity®, NASDAQ MarketSite®, NASDAQ MAX®, NASDAQ National Market®, NASDAQ OMX®,NASDAQ OMX Advantage®, NASDAQ OMX Alpha Indexes®, NASDAQ OMX BX®, NASDAQ OMXFutures Exchange®, NASDAQ OMX Green Economy Index®, NASDAQ OMX Nordic®, NASDAQ Q-50Index®, NASDAQ Telecommunications Index®, NASDAQ TotalView®, NASDAQ Trade Up®, NASDAQTrader®, NASDAQ Transportation®, NASDAQ US ALL Market®, NASDAQ Volatility Guard®, NASDAQWorkstation®, NASDAQ Workstation II®, NASDAQ-100®, NASDAQ-100 European®, NASDAQ-100 Index®,NASDAQ-100 Index Tracking Stock®, NDX®, NFX World Currency®, NFX XL®, PHLX®, PORTALAlliance®, QQQ®, QView®, R3®, RX®, Shareholder.com®, Sidecar®, SX®, The NASDAQ OMX Group®, TheNASDAQ Stock Market®, The Stock Market for the Next 100 Years®, Trade Up® and UltraFeed® are significantregistered trademarks of The NASDAQ OMX Group, Inc. and its affiliates in the U.S. and other countries.
ii

“FINRA®” and “Trade Reporting Facility®” are registered trademarks of the Financial Industry RegulatoryAuthority, or FINRA.
All other trademarks and servicemarks used herein are the property of their respective owners.
* * * * * *
This Annual Report on Form 10-K includes market share and industry data that we obtained from industrypublications and surveys, reports of governmental agencies and internal company surveys. Industry publicationsand surveys generally state that the information they contain has been obtained from sources believed to bereliable, but we cannot assure you that this information is accurate or complete. We have not independentlyverified any of the data from third-party sources nor have we ascertained the underlying economic assumptionsrelied upon therein. Statements as to our market position are based on the most currently available market data.For market comparison purposes, The NASDAQ Stock Market data in this Annual Report on Form 10-K forinitial public offerings, or IPOs, is based on data generated internally by us, which includes best effortsunderwritings and closed-end funds; therefore, the data may not be comparable to other publicly-available IPOdata. Data in this Annual Report on Form 10-K for new listings of equity securities on The NASDAQ StockMarket is based on data generated internally by us, which includes best efforts underwritings, issuers thatswitched from other listing venues, closed-end funds and exchange traded funds, or ETFs. Data in this AnnualReport on Form 10-K for IPOs and new listings of equities securities on the exchanges that comprise NASDAQOMX Nordic and NASDAQ OMX Baltic also is based on data generated internally by us. IPOs and new listingsdata is presented as of period end. While we are not aware of any misstatements regarding industry datapresented herein, our estimates involve risks and uncertainties and are subject to change based on various factors,including those discussed in “Item 1A. Risk Factors” in this Annual Report on Form 10-K.
iii

[THIS PAGE INTENTIONALLY LEFT BLANK]

Forward-Looking Statements
The U.S. Securities and Exchange Commission, or SEC, encourages companies to disclose forward-lookinginformation so that investors can better understand a company’s future prospects and make informed investmentdecisions. This Annual Report on Form 10-K contains these types of statements. Words such as “anticipates,”“estimates,” “expects,” “projects,” “intends,” “plans,” “believes” and words or terms of similar substanceused in connection with any discussion of future expectations as to industry and regulatory developments orbusiness initiatives and strategies, future operating results or financial performance identify forward-lookingstatements. These include, among others, statements relating to:
• our 2014 outlook;
• the scope, nature or impact of acquisitions, divestitures, investments or other transactional activities;
• the integration of acquired businesses, including accounting decisions relating thereto;
• the effective dates for, and expected benefits of, ongoing initiatives, including strategic, technology, de-leveraging and capital return initiatives;
• the impact of pricing changes;
• tax matters;
• the cost and availability of liquidity; and
• the outcome of any litigation and/or government investigation or action to which we are or couldbecome a party and other contingencies.
Forward-looking statements involve risks and uncertainties. Factors that could cause actual results to differmaterially from those contemplated by the forward-looking statements include, among others, the following:
• our operating results may be lower than expected;
• loss of significant trading and clearing volume, market share or listed companies;
• economic, political and market conditions and fluctuations, including interest rate and foreign currencyrisk, inherent in U.S. and international operations;
• government and industry regulation;
• our ability to keep up with rapid technological advances;
• our ability to successfully integrate acquired businesses, including the fact that such integration may bemore difficult, time consuming or costly than expected, and our ability to realize synergies frombusiness combinations and acquisitions;
• covenants in our credit facilities, indentures and other agreements governing our indebtedness whichmay restrict the operation of our business; and
• adverse changes that may occur in the securities markets generally.
Most of these factors are difficult to predict accurately and are generally beyond our control. You shouldconsider the uncertainty and any risk related to forward-looking statements that we make. These risk factors aremore fully described under the caption “Item 1A. Risk Factors,” in this Annual Report on Form 10-K. You arecautioned not to place undue reliance on these forward-looking statements, which speak only as of the date ofthis report. You should carefully read this entire Annual Report on Form 10-K, including “Item 7. Management’sDiscussion and Analysis of Financial Condition and Results of Operations,” and the consolidated financialstatements and the related notes. Except as required by the federal securities laws, we undertake no obligation toupdate any forward-looking statement, release publicly any revisions to any forward-looking statements orreport the occurrence of unanticipated events. For any forward-looking statements contained in any document,we claim the protection of the safe harbor for forward-looking statements contained in the Private SecuritiesLitigation Reform Act of 1995.
1

Part I
Item 1. Business
Overview
We are a leading global exchange group that delivers trading, clearing, exchange technology, regulatory,securities listing, and public company services across six continents. Our global offerings are diverse and includetrading and clearing across multiple asset classes, market data products, financial indexes, capital formationsolutions, financial services, corporate solutions and market technology products and services. Our technologypowers markets across the globe, supporting derivatives trading, clearing and settlement, cash equity trading,fixed income trading and many other functions.
In the U.S., we operate The NASDAQ Stock Market, a registered national securities exchange. TheNASDAQ Stock Market is the largest single cash equities securities market in the U.S. in terms of listedcompanies and in the world in terms of share value traded. As of December 31, 2013, The NASDAQ StockMarket was home to 2,637 listed companies with a combined market capitalization of approximately $7.0trillion. In addition, in the U.S. we operate two additional cash equities trading markets, three options marketsand an electronic platform for trading of U.S. Treasuries.
In Europe, we operate exchanges in Stockholm (Sweden), Copenhagen (Denmark), Helsinki (Finland), andIceland as NASDAQ OMX Nordic, and exchanges in Tallinn (Estonia), Riga (Latvia) and Vilnius (Lithuania) asNASDAQ OMX Baltic. Collectively, the exchanges that comprise NASDAQ OMX Nordic and NASDAQ OMXBaltic offer trading in cash equities, bonds, structured products and ETFs, as well as trading and clearing ofderivatives and clearing of resale and repurchase agreements. Through NASDAQ OMX First North, our Nordicand Baltic operations also offer alternative marketplaces for smaller companies. As of December 31, 2013, theexchanges that comprise NASDAQ OMX Nordic and NASDAQ OMX Baltic, together with NASDAQ OMXFirst North, were home to 758 listed companies with a combined market capitalization of approximately $1.3trillion. We also operate NASDAQ OMX Armenia.
In addition, NASDAQ OMX Commodities operates the world’s largest power derivatives exchangeregulated in Norway and one of Europe’s largest carbon exchanges. We also operate NOS Clearing ASA, orNOS Clearing, a leading Norway-based clearinghouse primarily for over-the-counter, or OTC, traded derivativesfor the freight market and seafood derivatives market. In the U.K., we operate NASDAQ OMX NLX, a newLondon-based market for trading of listed short-term and long-term European (Euro and Sterling denominated)interest rate derivative products.
In some of the countries where we operate exchanges, we also provide investment firm, clearing, settlementand central depository services.
History and Structure
Nasdaq was founded in 1971 as a wholly-owned subsidiary of FINRA (then known as the NationalAssociation of Securities Dealers, Inc.). Beginning in 2000, FINRA restructured and broadened ownership inNasdaq by selling shares to FINRA members, investment companies and issuers listed on The NASDAQ StockMarket.
In connection with this restructuring, Nasdaq applied to the SEC to register The NASDAQ Stock Market asa national securities exchange. FINRA fully divested its ownership of Nasdaq in 2006, and The NASDAQ StockMarket became fully operational as an independent registered national securities exchange in 2007. In 2006,Nasdaq also reorganized its operations into a holding company structure. As a result, our exchange licenses andexchange and broker-dealer operations are held by our subsidiaries.
2

On February 27, 2008, Nasdaq and OMX AB combined their businesses pursuant to an agreement withBorse Dubai Limited, a Dubai company, or Borse Dubai, and Nasdaq was renamed The NASDAQ OMX Group,Inc. This transformational combination resulted in the expansion of our business from a U.S.-based exchangeoperator to a global exchange company offering technology that powers our own exchanges and markets as wellas more than 70 marketplaces in 50 countries.
Also in 2008, we expanded our business through the acquisitions of the Philadelphia Stock Exchange, Inc.,or PHLX, and the Boston Stock Exchange, Incorporated, or BSX. These acquisitions allowed us to extend ourpresence in the derivatives markets and we currently operate three separate options markets. In addition, we haveused the licenses acquired in these acquisitions to launch two additional U.S. cash equities markets. In 2010, wealso grew our Market Services offerings with the acquisition of FTEN, Inc., or FTEN, a leading provider of Real-Time Risk Management, or RTRM, solutions for the financial securities market.
We also have expanded into the business of trading and clearing commodities products in recent years. In2008, we acquired the clearing, international derivatives and consulting subsidiaries of Nord Pool ASA, or NordPool. As a result of this acquisition, we launched NASDAQ OMX Commodities, which offers energy and carbonderivatives products. In 2010, we acquired a derivatives trading market through the purchase of the remainingbusinesses of Nord Pool. In July 2012, we acquired NOS Clearing, a leading Norway-based clearinghouseprimarily for OTC traded derivatives for the freight market and seafood derivatives market.
In August 2010, we acquired SMARTS Group Holdings Pty Ltd, or SMARTS, a leading technologyprovider of surveillance solutions to exchanges, regulators and brokers. In May 2012, we acquired a 72%ownership interest in BWise Beheer B.V. and its subsidiaries, or BWise, a Netherlands-based service providerthat offers enterprise governance, risk management and compliance software and services to help companiestrack, measure and manage key organizational risks. These acquisitions have expanded our Market Technologybusiness.
In recent years, we have significantly grown our Corporate Solutions business, which provides customersupport services, products and programs to companies including companies listed on our exchanges, throughorganic growth and numerous acquisitions. Most recently, in 2013, we acquired the Investor Relations, PublicRelations and Multimedia Solutions businesses of Thomson Reuters, or the TR Corporate Solutions businesses.
In 2013, we further expanded our Market Services and Information Services businesses by acquiring fromBGC Partners, Inc. and certain of its affiliates, or BGC, certain assets and assumed certain liabilities, including100% of the equity interests in eSpeed Technology Services, L.P., eSpeed Technology Services Holdings, LLC,Kleos Managed Services, L.P. and Kleos Managed Services Holdings, LLC; the eSpeed brand name; variousassets comprising the fully electronic portion of BGC’s benchmark U.S. Treasury brokerage, market data and co-location service businesses, or eSpeed.
Products and Services
Since January 1, 2013, we manage, operate and provide our products and services in four businesssegments: Market Services, Listing Services, Information Services and Technology Solutions. All prior periodsegment disclosures have been recast to reflect our change in reportable segments. Certain other prior yearamounts have been reclassified to conform to the current year presentation. Of our total 2013 revenues lesstransaction rebates, brokerage, clearance and exchange fees of $1,895 million, 41.0% was from our MarketServices segment, 12.0% was from our Listing Services segment, 23.3% was from our Information Servicessegment and 23.7% was from our Technology Solutions segment. Of our total 2012 revenues less transactionrebates, brokerage, clearance and exchange fees of $1,674 million, 45.4% was from our Market Servicessegment, 13.4% was from our Listing Services segment, 24.2% was from our Information Services segment and17.0% was from our Technology Solutions segment. Of our total 2011 revenues less transaction rebates,brokerage, clearance and exchange fees of $1,690 million, 47.6% was from our Market Services segment, 14.0%was from our Listing Services segment, 23.1% was from our Information Services segment and 15.3% was fromour Technology Solutions segment.
3

Prior to January 1, 2013, we managed, operated and provided our products and services in three businesssegments: Market Services, Issuer Services and Market Technology.
See Note 19, “Business Segments,” to the consolidated financial statements for additional financialinformation about our segments and geographic data.
Market Services
Our Market Services segment includes our derivative trading and clearing, cash equity trading, fixed incometrading, and access and broker services businesses. We offer trading on multiple exchanges and facilities acrossseveral asset classes, including derivatives, commodities, cash equity, debt, structured products and ETFs. Inaddition, in some of the countries where we operate exchanges, we also provide investment firm, clearing,settlement and central depository services. Our transaction-based platforms provide market participants with theability to access, process, display and integrate orders and quotes for cash equity securities, derivatives and ETFs.The platforms allow the routing and execution of buy and sell orders as well as the reporting of transactions forcash equity securities, derivatives and ETFs, providing fee-based revenues.
In addition, eSpeed’s electronic benchmark U.S. Treasury brokerage and co-location service businesses arepart of our Market Services segment.
U.S. Derivative Trading and Clearing. In the U.S., we operate The NASDAQ Options Market, NASDAQOMX PHLX and NASDAQ OMX BX Options for the trading of equity options, ETF options, index options andforeign currency options. During the year ended December 31, 2013, our options markets had an averagecombined market share of approximately 27.9% in the U.S. equity options market, consisting of approximately18.2% at NASDAQ OMX PHLX, 8.7% at The NASDAQ Options Market and 1.0% at NASDAQ OMX BXOptions. Together, the combined market share of 27.9% represented the largest share of the U.S. equity optionsmarket and ETF options market. Our options trading platforms provide trading opportunities to both retailinvestors, algorithmic trading firms and market makers, who tend to prefer electronic trading, and institutionalinvestors, who typically pursue more complex trading strategies and often trade on the floor.
European Derivative Trading and Clearing. NASDAQ OMX Stockholm offers trading in derivatives, suchas stock options and futures, index options and futures and fixed-income options and futures. NASDAQ OMXClearing AB offers clearing services for fixed-income options and futures, stock options and futures, indexoptions and futures, and interest rate swaps by serving as the central counterparty, or CCP. NASDAQ OMXClearing also operates a clearing service for the resale and repurchase agreement market. As a result of anagreement between the Swedish Money Market Council and NASDAQ OMX, a large portion of the SwedishInterbank resale and repurchase agreement market is cleared through NASDAQ OMX Clearing.
NASDAQ OMX Commodities offers trading and clearing of international power derivatives, carbon andother commodities products. NASDAQ OMX Commodities has over 300 members across a wide range of energyproducers and consumers, as well as financial institutions. NASDAQ OMX Commodities offers clearing servicesfor energy derivative and carbon product contracts by serving as the CCP.
We also operate NOS Clearing, a Norway-based clearinghouse primarily for OTC traded derivatives for thefreight market and seafood derivatives market.
In 2013, we launched a new London-based trading venue, NASDAQ OMX NLX, offering a range of bothshort-term interest rate and long-term interest rate euro-and sterling-based listed derivative products.
U.S. Cash Equity Trading. The NASDAQ Stock Market is the largest single pool of liquidity for tradingU.S.-listed cash equities, matching an average of approximately 15.6% of all U.S. cash equities volume for 2013.
4

In the U.S., we also operate two additional cash equities markets, NASDAQ OMX BX and NASDAQ OMXPSX. With these markets, we offer a second and third quote within the U.S. cash equities marketplace, providingour customers enhanced trading choices and price flexibility. All of our cash equities exchanges are run on ourINET trading system, providing customers additional cash equity securities markets using familiar technologydesigned to provide fast and efficient trading. In accessing these markets, our customers can leverage existinginfrastructure, reducing incremental costs when connecting. In 2013, NASDAQ OMX BX matched an average ofapproximately 2.5% and NASDAQ OMX PSX matched an average of approximately 0.7% of all U.S. cashequities volume.
Our fully electronic U.S. transaction-based platforms provide members with the ability to access, process,display and integrate orders and quotes in cash equity securities. Market participants include market makers,broker-dealers, alternative trading systems, or ATSs, and registered securities exchanges. These services areoffered for NASDAQ-listed and non-NASDAQ-listed securities. Specifically, our platforms:
• provide a comprehensive display of the interest by market participants at the highest price a participantis willing to buy a security (best bid) and also the lowest price a participant is willing to sell that security(best offer);
• provide subscribers quotes, orders and total anonymous interest at every price level for exchange-listedsecurities and critical data for the Opening Cross, Closing Cross, Halt Cross and IPO Cross; and
• provide anonymity to market participants (i.e., participants do not know the identity of the firmdisplaying the order unless that firm chooses to reveal its identity), which can contribute to improvedpricing for securities by reducing the potential market impact that transactions by investors whosetrading activity, if known, may influence others.
All U.S. registered national securities exchanges and securities associations are required to establish atransaction reporting plan for the central collection of price and volume information concerning trades executedin those markets. Trades executed on our cash equities exchanges are automatically reported under theappropriate transaction reporting plan. Currently, market participants are not charged for the reporting of most ofthese trades. Our cash equities exchanges, however, earn revenues for all of these trades in the form of sharedmarket information revenues under the Joint Self-Regulatory Organization Plan Governing the Collection,Consolidation, and Dissemination of Quotation and Transaction Information for NASDAQ-Listed SecuritiesTraded on Exchanges on an Unlisted Trading Privileges Basis, or the UTP Plan, for NASDAQ-listed securitiesand under the Consolidated Tape and Consolidated Quotation Plans for securities listed on the New York StockExchange, or NYSE, NYSE MKT and other exchanges.
Through The FINRA/NASDAQ Trade Reporting Facility, or FINRA/NASDAQ TRF, we collect reports oftrades executed by broker-dealers outside of our exchanges. The FINRA/NASDAQ TRF collects trade reports asa facility of FINRA. A large percentage of these trades results from orders that broker-dealers have matchedinternally and is submitted to the FINRA/NASDAQ TRF for reporting purposes only. The FINRA/NASDAQTRF charges market participants for locked-in reporting of most trades, but it shares back most revenues earnedfrom shared market information with respect to the trades. The FINRA/NASDAQ TRF also generates revenuesby providing trade comparison to broker dealers by matching and locking-in the two parties to a trade that theyhave submitted to the FINRA/NASDAQ TRF for reporting and clearing.
In addition to trade reporting and trade comparison services, we provide clearing firms with riskmanagement services to assist them in monitoring their exposure to their correspondent brokers.
European Cash Equity Trading. NASDAQ OMX Nordic’s operations comprise the exchanges in Stockholm(Sweden), Copenhagen (Denmark), Helsinki (Finland), and Iceland. These exchanges offer trading for cashequities and bonds. Our platform allows the exchanges to share the same trading system, which enables efficientcross-border trading and settlement, cross membership and a single source for Nordic market data. The Nordic
5

exchanges also offer trading in Nordic securities such as cash equities and depository receipts, warrants,convertibles, rights, fund units, ETFs, bonds and other interest-related products. Settlement and registration ofcash trading takes place in Sweden, Finland, Denmark and Iceland via the local central securities depositories.
NASDAQ OMX Baltic operations comprise the exchanges in Tallinn (Estonia), Riga (Latvia) and Vilnius(Lithuania). As of December 31, 2013, NASDAQ OMX owns NASDAQ OMX Tallinn and has a majorityownership in NASDAQ OMX Vilnius and NASDAQ OMX Riga. In addition, NASDAQ OMX Tallinn owns thecentral securities depository in Estonia, NASDAQ OMX Riga owns the central securities depository in Latvia,and NASDAQ OMX Helsinki and NASDAQ OMX Vilnius jointly own the central securities depository inLithuania.
The exchanges that comprise NASDAQ OMX Baltic offer their members trading, clearing, payment andcustody services. Issuers, primarily large local companies, are offered listing and a distribution network for theirsecurities. The securities traded are mainly cash equities, bonds and treasury bills. Clearing, payment and custodyservices are offered through the central securities depositories in Estonia, Latvia and Lithuania. In addition, inEstonia and Latvia, NASDAQ OMX offers registry maintenance of fund units included in obligatory pensionfunds, and in Estonia, NASDAQ OMX offers the maintenance of shareholder registers for listed companies. TheBaltic central securities depositories offer a complete range of cross-border settlement services.
Fixed Income Trading
In June 2013, we acquired eSpeed, an electronic platform for trading U.S. Treasuries. The electronic tradingplatform provides real-time institutional trading of benchmark U.S. Treasury securities, one the of largest andmost liquid fixed-income cash markets in the world. Through eSpeed, we provide trading access to the U.S.Treasury securities market with an array of trading instruments to meet various investment goals and access todata products and business solutions across the fixed income spectrum.
Access and Broker Services
Access Services. We provide market participants with a wide variety of alternatives for connecting to andaccessing our markets for a fee. Shifting connectivity from proprietary networks to third-party networks hassignificantly reduced technology and network costs and increased our systems’ scalability without affectingperformance or reliability.
Our U.S. marketplaces may be accessed via a number of different protocols used for quoting, order entry,trade reporting, DROP functionality and connectivity to various market data feeds. We also offer the NASDAQWorkstation, a browser-based, front-end interface that allows market participants to view market data and enterorders, quotes and trade reports. In addition, we offer a variety of add-on compliance tools to help firms complywith regulatory requirements.
We provide co-location services to market participants, whereby firms may lease cabinet space and power tohouse their own equipment and servers within our data center. These participants are charged monthly fees forcabinet space, connectivity and support. Additionally, we offer a number of wireless connectivity routes betweenselect data centers using millimeter wave and microwave technology. We also earn revenues from annual andmonthly exchange membership and registration fees.
The access services business also includes TradeGuard, a leading risk management solution for the financialsecurities market. As a market leader in risk management, TradeGuard provides broker-dealers and their clientsthe ability to manage risk more effectively in real-time, which leads to better utilization of capital as well asimproved regulatory compliance.
In 2013, we launched FinQloud, a secure cloud computing platform powered by Amazon Web Services thatprovides a cost-effective and efficient way to manage and store financial and other data.
6

Broker Services. Our broker services operations offer technology and customized securities administrationsolutions to financial participants in the Nordic market. Broker services provides services through a registeredsecurities company that is regulated by the Swedish Financial Supervisory Authority, or SFSA. Servicesprimarily consist of flexible back-office systems, which allow customers to entirely or partly outsource theircompany’s back-office functions.
We offer customer and account registration, business registration, clearing and settlement, corporate actionhandling for reconciliations and reporting to authorities. Available services also include direct settlement with theNordic central securities depositories, real-time updating and communication via the Society for WorldwideInterbank Financial Telecommunication, or SWIFT, to deposit banks.
Listing Services
Our Listing Services segment includes our U.S. and European listing services businesses. We offer capitalraising solutions to over 3,300 companies around the globe representing over $8.0 trillion in total market value asof December 31, 2013.
We operate a variety of listing platforms around the world to provide multiple global capital raisingsolutions for private and public companies. Our main listing markets are The NASDAQ Stock Market and theexchanges that comprise NASDAQ OMX Nordic and NASDAQ OMX Baltic. We offer a consolidated globallisting application to companies to enable them to apply for listing on The NASDAQ Stock Market and theexchanges that comprise NASDAQ OMX Nordic and NASDAQ OMX Baltic, as well as NASDAQ Dubai.
U.S. Listings
Companies listed on The NASDAQ Stock Market represent a diverse array of industries including, amongothers, health care, consumer products, telecommunication services, information technology, financial services,industrials and energy.
Companies seeking to list securities on The NASDAQ Stock Market must meet minimum listingrequirements, including specified financial and corporate governance criteria. Once listed, companies must meetcontinued listing standards. The NASDAQ Stock Market currently has three listing tiers: The NASDAQ GlobalSelect Market, The NASDAQ Global Market and The NASDAQ Capital Market. All three market tiers maintainrigorous listing and corporate governance standards (both initial and ongoing).
As of December 31, 2013, a total of 2,637 companies listed securities on The NASDAQ Stock Market, with1,482 listings on The NASDAQ Global Select Market, 610 on The NASDAQ Global Market and 545 on TheNASDAQ Capital Market.
We aggressively pursue new listings from companies, including those undergoing IPOs as well ascompanies seeking to switch from alternative exchanges. In 2013, The NASDAQ Stock Market attracted 239new listings. Included in these listings were 126 IPOs, 52% of U.S. IPOs in 2013. The new listings werecomprised of the following:
Total New Listings on The NASDAQ Stock Market . . . . . . . . . . . . . . . . . . . . . . . . . . . . . . . . . . . 239Switches from NYSE/NYSE MKT . . . . . . . . . . . . . . . . . . . . . . . . . . . . . . . . . . . . . . . . . . . . . 31IPOs . . . . . . . . . . . . . . . . . . . . . . . . . . . . . . . . . . . . . . . . . . . . . . . . . . . . . . . . . . . . . . . . . . . . . 126Upgrades from OTC . . . . . . . . . . . . . . . . . . . . . . . . . . . . . . . . . . . . . . . . . . . . . . . . . . . . . . . . 39ETFs, Structured Products and Other Listings . . . . . . . . . . . . . . . . . . . . . . . . . . . . . . . . . . . . 43
In 2013, a total of 31 NYSE- or NYSE MKT-listed companies switched to The NASDAQ Stock Market,representing approximately $47 billion in market capitalization, including VimpelCom, Marriott Internationaland Amdocs Limited. In addition, American Airlines Group, a newly formed company from the merger of AMRCorporation and US Airways Group, Inc., listed on NASDAQ.
7

In March 2013, we formed a joint venture with SharesPost, Inc., or SharesPost, creating, The NASDAQPrivate Market, LLC, or NPM, a marketplace for private growth companies. We own a majority interest in NPM,combining NASDAQ OMX’s resources, market and operating expertise with SharesPost’s web-based platform.Subject to regulatory approvals, NPM is expected to launch in the first quarter of 2014.
European Listings
We also offer listings on the exchanges that comprise NASDAQ OMX Nordic and NASDAQ OMX Baltic.For smaller companies and growth companies, we offer access to the financial markets through the NASDAQOMX First North alternative marketplaces. As of December 31, 2013, a total of 758 companies listed securitieson our Nordic and Baltic exchanges and NASDAQ OMX First North.
Our European listing customers include companies, funds and governments. Customers issue securities inthe form of cash equities, depository receipts, warrants, ETFs, convertibles, rights, options, bonds or fixed-income related products. In 2013, a total of 34 new companies were listed on our Nordic and Baltic exchangesand NASDAQ OMX First North.
Information Services
Our Information Services segment includes our Market Data Products and our Index Licensing and Servicesbusinesses.
Market Data Products
Our Market Data Products business includes our U.S. and European market data products and index dataproducts businesses.
U.S. Market Data Products. Our market data products enhance transparency and provide criticalinformation to professional and non-professional investors. We collect, process and create information and earnrevenues as a distributor of our own, as well as select, third-party content. We provide varying levels of quoteand trade information to market participants and to data distributors, who in turn provide subscriptions for thisinformation. Our systems enable distributors to gain direct access to our market depth, index values, mutual fundvaluation, order imbalances, market sentiment and other analytical data. Revenues from U.S. market dataproducts are subscription-based and are generated primarily based on the number of data subscribers anddistributors of our data.
We distribute this proprietary market information to both market participants and non-participants through anumber of proprietary products. We use our broad distribution network of more than 2,000 market datadistributors to deliver data regarding our market depth, index values, mutual fund valuation, order imbalances,market sentiment and other analytical data.
We offer a range of proprietary data products, including NASDAQ TotalView, our flagship market depthquote product. TotalView shows subscribers quotes, orders and total anonymous interest at every price level inThe NASDAQ Stock Market for NASDAQ-listed securities and critical data for the Opening, Closing, Halt andIPO Crosses. We also offer TotalView products for our NASDAQ OMX BX and NASDAQ OMX PSX markets.TotalView is offered through distributors to professional subscribers for a monthly fee per terminal and to non-professional subscribers for a lower monthly fee per terminal. We also offer TotalView enterprise licenses tofacilitate broad based distribution of this data. In addition, we charge the distributor a monthly distributor fee.
We operate several other proprietary services and data products to provide market information, includingNASDAQ Basic, a low cost Level 1 feed, eSpeed that delivers US Treasury data and Ultrafeed, a normalizedhigh speed feed of North American equity, options, futures, indexes and mutual fund market data.
8

Our U.S. market data products business also includes revenues from U.S. tape plans. The NASDAQ StockMarket operates as the exclusive Securities Information Processor, or SIP, for the UTP Plan for the collectionand dissemination of best bid and offer information and last transaction information from markets that quote andtrade in NASDAQ-listed securities. The NASDAQ Stock Market, NASDAQ OMX BX and NASDAQ OMXPSX are participants in the UTP Plan and share in the net distribution of revenue according to the plan on thesame terms as the other plan participants. In the role as the Securities Information Processor, The NASDAQStock Market collects and disseminates quotation and last sale information for all transactions in NASDAQ-listed securities whether traded on The NASDAQ Stock Market or other exchanges. We sell this information tomarket participants and to data distributors, who then provide the information to subscribers. After deductingcosts associated with our role as an exclusive Securities Information Processor, as permitted under the revenuesharing provision of the UTP Plan, we distribute the tape revenues to the respective UTP Plan participants,including The NASDAQ Stock Market, NASDAQ OMX BX and NASDAQ OMX PSX, based on a formularequired by Regulation NMS that takes into account both trading and quoting activity. In addition, all quotes andtrades in NYSE- and NYSE MKT-listed securities are reported and disseminated in real time, and as such, weshare in the tape revenues for information on NYSE- and NYSE MKT-listed securities.
European Market Data Products. The exchanges that comprise NASDAQ OMX Nordic and NASDAQOMX Baltic, as well as NASDAQ OMX Commodities, offer European market data products and services. Thesedata products and services provide critical market transparency to professional and non-professional investorswho participate in European marketplaces and, at the same time, give investors greater insight into these markets.
European market data products and services are based on the trading information from the exchanges thatcomprise NASDAQ OMX Nordic and NASDAQ OMX Baltic, as well as NASDAQ OMX Commodities, for thefollowing classes of assets: cash equities, bonds, derivatives and commodities. We provide varying levels ofquote and trade information to market participants and to data distributors, who in turn provide subscriptions forthis information. Revenues from European market data products are subscription-based and are generatedprimarily based on the number of data subscribers and distributors of our data.
We provide a wide range of data products including products in real-time, some with a time delay or inbatch delivery. These products and services are packaged for market professionals as well as for privateindividuals, and include real-time information on market depth, specific transactions and share-price trends, thecompilation and calculation of reference information such as indexes and the presentation of statistics.
Significant European market data products include Nordic Equity TotalView, Nordic Derivative TotalViewITCH, and Nordic Fixed Income Level 2.
Index Data Products. Index data products are based on NASDAQ OMX indexes and consist of our GlobalIndex Data Service, which delivers real time index values throughout the trading day, and Global Index Watch,which delivers weightings and components data, corporate actions and a breadth of additional data.
Index Licensing and Services
We are a leading index provider and develop and license NASDAQ OMX branded indexes, associatedderivatives and financial products as part of our Index Licensing and Services business. License fees for ourtrademark licenses vary by product based on a percentage of underlying assets, dollar value of a productissuance, number of products or number of contracts traded. We also license cash-settled options, futures andoptions on futures on our indexes.
At the end of 2013, NASDAQ OMX indexes were the basis for over 9,000 structured products with almost$1.5 trillion of notional value. NASDAQ OMX indexes are now the basis for 148 exchange traded products withover $92.0 billion in assets under management. Our flagship index, the NASDAQ-100 Index, includes the top100 non-financial securities listed on The NASDAQ Stock Market.
9

During 2013, the Global Index Group launched the second phase of the NASDAQ Global Index Family,which includes approximately 21,000 indexes. The NASDAQ Global Index Family represents more than 98% ofthe global equity investable marketplace. The family consists of global securities broken down by marketsegment, region, country, size and sector. The NASDAQ Global Index Family covers 45 countries and 9,000securities.
Technology Solutions
Our Technology Solutions segment includes our Corporate Solutions and Market Technology businesses.
Corporate Solutions
Our Corporate Solutions business serves corporate clients, including companies listed on our exchanges. Wehelp organizations manage the two-way flow of information with their audiences through our suite of advancedtechnology, analytics and consultative services. Our products and services allow clients to attract, inform andinfluence shareholders, customers, employees, regulators and the media.
In 2013, we acquired the Thomson Reuters Corporate Solutions businesses which were integrated into ourCorporate Solutions business.
We provide Corporate Solutions products and services in the following key areas:
• Investor Relations. We offer investor relations content, analytics, advisory services and communicationstools. Our solutions make it easier for companies to interact and communicate with analysts andinvestors while meeting corporate governance and disclosure requirements.
• Corporate Communications. We offer solutions to help clients identify, reach, monitor and measuretheir public relations program. We provide traditional and social media contacts data, backed by over100 research analysts. Our press release distribution, webcasting and media players allow clients toreach global audiences cost-effectively. Our suite of technology solutions and expert analysts helpclients monitor key news media for their brand, reputation, products, as well as industry competitors,and measure the success of their communications programs.
• Digital Media. We offer a range of services to reach internal and external audiences, includingwebcasting, webinars, media player, and investor relations websites. Our global scale provides regionalexpertise and local language support as well as proprietary distribution channels and access to ournetwork of publishing partners.
• Secure Collaboration. We offer a secure collaboration platform for board of directors or any teamcollaborating on confidential initiatives.
• Governance, Risk and Compliance. We provide enterprise governance, risk and compliance softwaresolutions that harness disparate business processes and content to promote efficiency, transparency andcontrol.
Market Technology
Powering more than 70 marketplaces in 50 countries, we are a leading global technology solutions providerand partner to exchanges, clearing organizations and central securities depositories.
Our systems solutions offer support trading, clearing, settlement, surveillance and information disseminationto markets with wide-ranging requirements, from the leading markets in the U.S., Europe and Asia to smallerAfrican markets. Our solutions can handle a wide array of assets, including cash equities, currencies, variousinterest-bearing securities, commodities, energy products and derivatives.
10

NASDAQ OMX’s market technology is utilized by, among others, the Australian Securities Exchange,ICAP, Bolsa de Valores de Colombia, The Egyptian Exchange, Hong Kong Exchanges and Clearing, SIX SwissExchange, Singapore Exchanges, Tokyo Commodity Exchange, Osaka Securities Exchange, Bursa Malaysia andSBI Japannext.
Our trading and market data solutions are utilized by exchanges, alternative-trading venues, banks andsecurities brokers with marketplace offerings of their own. In the post-trade stage, we offer integrated systemssolutions for clearing (risk management) and settlement (settlement and delivery) of both cash equities andderivatives to clearing organizations around the world.
A central part of many projects is facility management and systems integration. Through our integrationservices, we can assume responsibility for projects involving migration to a new system and the establishment ofentirely new marketplaces. We also offer operation and support for the applications, systems platforms, networksand other components included in a turn-key information technology solution and advisory services.
We also offer broker services through SMARTS. SMARTS Broker is a managed service designed forbrokers and other market participants to assist them in complying with market rules, regulations and internalmarket surveillance policies.
Finally, through BWise, we offer enterprise governance, risk management and compliance software andservices to help companies track, measure and manage key organizational risks.
Technology
Technology plays a key role in ensuring the growth, reliability and regulation of financial markets. In 2012,NASDAQ OMX established an enterprise-wide operational excellence program. This program continued into2013 with the development and implementation of several technology policies and programs which continue tostrengthen the way we develop, deploy and maintain technology products in the marketplace.
The foundation for NASDAQ OMX’s core technology is INET. The INET technology is used acrossNASDAQ OMX’s U.S. and European markets. INET is also a key building block of our Market Technologyofferings, Genium INET and X-stream INET. Genium INET and X-stream INET both combine innovativefunctionality with a modular approach to manage change and create new advantages for existing and newcustomers
We continuously improve our core technology with a focus on improving capacity, reliability, resiliency andmarket integrity.
Intellectual Property
We own or have licensed rights to trade names, trademarks, domain names and service marks that we use inconjunction with our operations and services. We have registered many of our most important trademarks in theUnited States and in foreign countries. For example, our primary “NASDAQ” mark is a registered trademark inthe United States and in over 50 other countries worldwide and the OMX trademark also has been registeredworldwide. We also have trademark registrations for the most important trade names of NASDAQ OMX Nordicand our operations in Europe. Many of these trademarks are registered in a number of countries. Examples ofregistered trademarks used in our European operations include: OMX, GENIUM, Genium INET, SECUR,CLICK XT and EXIGO.
To support our business objectives and benefit from our investments in research and development, weactively seek protection for our innovations by filing patent applications to protect inventions arising frominvestments in products, systems, software and services. We believe that our patents and patent applications are
11

important for maintaining the competitive differentiation of our products, systems, software and services,enhancing our ability to access technology of third parties and maximizing our return on research anddevelopment investments.
Over time, we have accumulated a robust portfolio of issued patents in the U.S., Europe and in other parts ofthe world. We currently hold rights to patents relating to certain aspects of products, systems, software andservices, but we primarily rely on the innovative skills, technical competence and marketing abilities of ourpersonnel. Hence, no single patent is in itself essential to us as a whole or any of our principal business areas.
We also maintain copyright protection in our NASDAQ-branded materials.
Competition
Market Services
Derivative Trading and Clearing. In derivatives trading and clearing, competition comes in the form oftrading and clearing that takes place OTC, usually through banks and brokerage firms, or through trading andclearing competition with other exchanges.
Our principal competitors for trading options in the U.S. include the Chicago Board Options Exchange, Inc.,or CBOE, the International Securities Exchange Holdings, Inc., or ISE, NYSE ARCA, NYSE Amex, BATsOptions, C2 Options Exchange and the BOX Options Exchange Group, LLC and MIAX Options. Competition isfocused on providing market participants with greater functionality, trading system stability, customer service,efficient pricing, and speed of execution. The intense competition for exchange traded options results in the needto continuously review our technology offerings and pricing.
Exchange based competition for trading in European derivatives continues to occur mainly where there iscompetition in trading for the underlying equities and our competition for options on European equities isprimarily with EUREX Group, or EUREX, NYSE Liffe, Turquoise and, to a limited extent, the U.S. optionsexchanges. Such competition is limited to options on a small number of equity securities although thesesecurities tend to be among the most active. In addition to exchange based competition in derivatives, wecontinue to face competition from OTC derivative markets.
The competitive significance in Europe of varied alternative trading venues is likely to increase in thefuture, with the regulatory environment in Europe becoming more favorable to alternative trading venues as aresult of the reforms required by the update to Markets in Financial Instruments Directive, or MiFID II and abroader effort to increase competition in financial services. To this end we have launched NASDAQ OMX NLX,offering an alternative to current incumbent markets in short-term and long-term European interest rate derivativeproducts. As trading in Europe evolves, competition for trading volumes in derivatives will likely increase. Bothcurrent and potential competition require us to constantly reassess our pricing and product offerings in order toremain competitive.
Regulations such as MiFID II and the European Infrastructure Regulation, or EMIR, are alteringcompetition in the clearing business in Europe. The EMIR requirements are changing the way we structure andoperate our clearing business.
Cash Equity Trading. The cash equity securities markets are intensely competitive. As a result of theconditions in the U.S. and Europe, we experience competition in our core trading activities such as executionservices, quoting and trading capabilities, and reporting services. In late 2013, IntercontinentalExchange, or ICE,acquired NYSE Euronext. In addition, BATS and Direct Edge recently completed a merger. These transactionshave the potential to affect the competitive environment we face in both the U.S. and Europe.
12

We compete in the U.S. against ICE, BATS Global Markets, Inc., Direct Edge, regional exchanges andATSs. Competition also comes from broker-dealers and from OTC trading in the U.S. and elsewhere. The U.S.marketplace continues to evolve as less heavily regulated broker-owned trading systems and ATSs, knowncollectively as dark pools, expand in number and activity. While many of the new entrants may have limitedliquidity, some may attract significant levels of cash equity order volume through aggressive pricing,interconnections with other systems, and from volume originating with broker-dealer owners and investors. InEurope, our major competitors include BATS Chi-X Europe, ICE, Deutsche Börse, the London Stock ExchangeGroup plc, or LSE, and multilateral trading facilities, or MTFs, such as Turquoise. The European landscape iscontinuing to adapt to the competitive forces released by MiFID. Throughout Europe, new MTFs have beencreated with the most prominent MTFs based in the United Kingdom and attracting a significant share ofelectronically matched volume. MTFs continue to grow their business in shares listed on our Nordic exchanges.Electronic trading systems interested in pursuing block business also remain active in Europe. While the state ofcompetition in Europe remains evolutionary, the level of competition faced by incumbent national exchangesremains intense.
Fixed Income Trading. Today, many U.S. fixed-income instruments enjoy some form of electronic trading,but the move to ‘electronify’ the fixed income space is still developing with some products still trading almostexclusively among voice brokers. Expanding the products further in the fixed income space could be faced withcompetitive forces from the voice broker community or other new electronic platform operators. Currently, othercompetitors in U.S. Treasury benchmark trading are ICAP’s BrokerTec platform and Dealerweb. While buildinga U.S. Treasury benchmark trading business is complex, time-consuming and expensive, the risk of competitionand declining market share in the space is significant.
Listing Services
Our primary competitor for larger company listings in the U.S. is NYSE. The NASDAQ Stock Market alsocompetes with NYSE MKT for listing of smaller companies. In addition, now that the BATS/Direct Edge mergerhas been completed, new competition may arise in listings. The NASDAQ Stock Market also competes withlocal and overseas markets for listings by companies that choose to list outside of their home country.
The listings business in Europe is characterized by the large number of exchanges competing for new orsecondary listings. Each country has one or more national exchanges which are often the first choice ofcompanies in the respective countries. For those considering an alternative, the European exchanges that attractthe most overseas listings are LSE, NYSE Euronext, Deutsche Börse and the exchanges that comprise NASDAQOMX Nordic.
In addition to the larger exchanges, companies are able to consider smaller markets and quoting facilities,such as LSE’s Alternative Investment Market, Euronext’s Alternext, Deutsche Börse’s Entry Standard, BorsaItaliana’s Expandi Market, PLUS Markets plc, the Pink Sheets LLC and the Over-the-Counter Bulletin Board, orOTCBB. Other exchanges in Sweden include the Nordic Growth Market and Aktietorget, which primarily servecompanies with small market capitalizations.
Information Services
Market Data Products. The market data business in the U.S. includes both proprietary and consolidated dataproducts. Proprietary data products are made up exclusively of data derived from each exchange’s systems.Consolidated data products are distributed by SEC-mandated consolidators (one for NASDAQ-listed stocks andanother for NYSE and other-listed stocks) that share the revenue among the exchanges that contribute data. InEurope, all market data products are proprietary as there is no official data consolidator. Competition in themarket data business is intensely competitive and is influenced by rapidly changing technology and the creationof new product and service offerings.
13

The sale of our proprietary data products in both the U.S. and Europe is under competitive threat fromalternative exchanges and trading venues that offer similar products. Our market data business competes withother exchanges and third party vendors in providing information to market participants. Some of our majorcompetitors for proprietary data products are ICE, ICAP and S&P Dow Jones.
The consolidated market data business is under competitive pressure from other securities exchanges thattrade NASDAQ-listed securities. Current SEC regulations permit these regional exchanges and FINRA’sAlternative Display Facility to quote and trade NASDAQ-listed securities. The UTP Plan entitles theseexchanges, FINRA’s Alternative Display Facility, and the trade reporting facilities to a share of UTP Plan tapefees, based on the formula required by Regulation NMS that takes into account both trading and quoting activity.In addition, The NASDAQ Stock Market similarly competes for the tape fees from the sale of information onNYSE and NYSE MKT-listed securities for those respective tape plans. Participants in the tape plans have usedtape fee revenues to establish payment for order flow arrangements with their members and customers.
Index Licensing and Services. The NASDAQ Stock Market is subject to intense competition for the listingof financial products from other exchanges. The indexes on which these products are based face competitionfrom indexes created by a large number of index providers. For example, there are a number of indexes that aimto track the technology sector and thereby compete with the NASDAQ-100 Index and the NASDAQ CompositeIndex. We face competition from investment banks, dedicated index providers, markets and other productdevelopers in designing products that meet investor needs.
Technology Solutions
Corporate Solutions. The landscape of corporate solutions competitors is varied and highly fragmented. Inthe investor relations space, there are many regional competitors with few global providers. However, otherexchanges have recently begun to partner or buy assets in order to provide investor relations services tocustomers alongside their core listing services. The competitive landscape for public relations services includeslarge providers of traditional wire services, full-service providers that span distribution and targeting, monitoringand analytics, and a large number of regional or niche providers. In multimedia and webcasting, competition ishighly fragmented and served by a number of firms who address various needs for enterprise buyers and typicallyoffer managed or self-service capabilities. In governance and secure collaboration, the competitive landscape isbifurcated with few competitors who serve corporate boards and deal teams. We believe customers areincreasingly looking for single source providers who can address a broad range of needs within a single platform.Some of the competitors to the corporate solutions business include Ipreo, Cision, PR Newswire, Business Wire,ON24, BoardVantage, Diligent, Intralinks and Merrill Datasite.
Market Technology. The traditional model, where each exchange or exchange-related business developed itsown technology internally sometimes aided by consultants, is evolving as many operators recognize the costsavings made possible by buying technology already developed. Two types of competitors are emerging: otherexchanges providing solutions, including ICE and LSE, and pure technology providers focused on the exchangeindustry. These organizations offer a range of off-the-shelf technology including trading, clearing, settlement,depository and information dissemination. They also offer customization and operation expertise.
Regulation
We are subject to extensive regulation in the United States and Europe.
U.S. Regulation
U.S. federal securities laws establish a system of cooperative regulation of securities markets, marketparticipants and listed companies. Self-regulatory organizations, or SROs, conduct the day-to-day administration
14

and regulation of the nation’s securities markets under the close supervision of, and subject to extensiveregulation, oversight and enforcement by, the SEC. SROs, such as national securities exchanges, are registeredwith the SEC.
This regulatory framework applies to our U.S. business in the following ways:
• regulation of our registered national securities exchanges; and
• regulation of our U.S. broker-dealer subsidiaries.
The rules and regulations that apply to our business are focused primarily on safeguarding the integrity ofthe securities markets and of market participants and investors generally. Accordingly, our Board of Directors,officers, and employees must give due regard to the preservation of the independence of the self-regulatoryfunction of each of our SROs and to their obligations to investors and the general public, and may not take anyactions that would interfere with the effectuation of decisions by the boards of directors of any of our SROsrelating to their regulatory functions, or that would interfere with the ability of any of our SROs to carry out theirresponsibilities under the Securities Exchange Act of 1934, or Exchange Act. Although the rules and regulationsthat apply to our business are not focused on the protection of our stockholders, we believe that regulationimproves the quality of exchanges and, therefore, our company. U.S. federal securities laws and the rules thatgovern our operations are subject to frequent change.
National Securities Exchanges. SROs in the securities industry are an essential component of the regulatoryscheme of the Exchange Act for providing fair and orderly markets and protecting investors. The Exchange Actand the rules thereunder, as well as each SRO’s own rules, impose on the SROs many regulatory and operationalresponsibilities, including the day-to-day responsibilities for market and broker-dealer oversight. Before it maypermit the registration of a national securities exchange as an SRO, the SEC must determine, among other things,that the exchange has a set of rules that is consistent with the requirements of the Exchange Act. Moreover, anSRO is responsible for enforcing compliance by its members, and persons associated with its members, with theprovisions of the Exchange Act, the rules and regulations thereunder, and the rules of the SRO, including rulesand regulations governing the business conduct of its members.
NASDAQ OMX currently operates three cash equities and three options markets in the United States. Weoperate The NASDAQ Stock Market and The NASDAQ Options Market pursuant to The NASDAQ StockMarket’s SRO license; NASDAQ OMX BX and NASDAQ OMX BX Options pursuant to NASDAQ OMX BX’sSRO license; and NASDAQ OMX PSX and the NASDAQ OMX PHLX options market pursuant to NASDAQOMX PHLX’s SRO license. As SROs, each entity has separate rules pertaining to its broker-dealer members andlisted companies. Broker-dealers that choose to become members of The NASDAQ Stock Market, NASDAQOMX PHLX, and/or NASDAQ OMX BX are subject to the rules of those exchanges.
All of our U.S. national securities exchanges are subject to SEC oversight, as prescribed by the ExchangeAct, including periodic and special examinations by the SEC. Our exchanges also are potentially subject toregulatory or legal action by the SEC or other interested parties at any time in connection with alleged regulatoryviolations. We also are subject to Section 17 of the Exchange Act, which imposes record-keeping requirements,including the requirement to make records available to the SEC for examination. We have been subject to anumber of routine reviews and inspections by the SEC or external auditors in the ordinary course and we havebeen and may in the future be subject to SEC enforcement proceedings. To the extent such actions or reviews andinspections result in regulatory or other changes, we may be required to modify the manner in which we conductour business which may adversely affect our business.
Section 19 of the Exchange Act provides that our exchanges must submit to the SEC proposed changes toany of the SROs’ rules, practices and procedures, including revisions to provisions of our certificate ofincorporation and by-laws that constitute SRO rules. The SEC will typically publish such proposed changes forpublic comment, following which the SEC may approve or disapprove the proposal, as it deems appropriate. SECapproval requires a finding by the SEC that the proposal is consistent with the requirements of the Exchange Act
15

and the rules and regulations thereunder. Pursuant to the requirements of the Exchange Act, our exchanges mustfile with the SEC, among other things, all proposals to change their pricing structure.
Pursuant to regulatory services agreements between FINRA and our SROs, FINRA provides certainregulatory services to the markets operated or regulated by The NASDAQ Stock Market, NASDAQ OMX PHLXand NASDAQ OMX BX, including the regulation of trading activity and surveillance and investigativefunctions. Nevertheless, we have a direct regulatory role in conducting certain real-time market monitoring,certain equity surveillance not involving cross-market activity and most options surveillance, rulemaking andsome membership functions through our MarketWatch department. We refer suspicious trading behaviordiscovered by our regulatory staff to FINRA for further investigation. Our SROs retain ultimate regulatoryresponsibility for all regulatory activities performed under regulatory agreements by FINRA, and for fulfilling allregulatory obligations for which FINRA does not have responsibility under the regulatory services agreements.
In addition to its other SRO responsibilities, The NASDAQ Stock Market, as a listing market, also isresponsible for overseeing each listed company’s compliance with NASDAQ’s financial and corporategovernance standards. Our Listing Qualifications department evaluates applications submitted by issuersinterested in listing their securities on NASDAQ to determine whether the quantitative and qualitative listingstandards have been satisfied. Once securities are listed, the Listing Qualifications department monitors eachissuer’s on-going compliance with NASDAQ’s continued listing standards.
Broker-dealer regulation. NASDAQ OMX’s broker-dealer subsidiaries are subject to regulation by theSEC, the SROs and the various state securities regulators. Nasdaq Execution Services, LLC currently operates asour routing broker for sending orders from The Nasdaq Stock Market, NASDAQ OMX BX and NASDAQ OMXPSX to other venues for execution. NASDAQ Options Services, LLC performs a comparable function withrespect to routing of orders from The NASDAQ Options Market, NASDAQ OMX BX Options and NASDAQOMX PHLX. In the first half of 2014, subject to regulatory approvals, NASDAQ Options Services, LLC willcease acting as the routing broker for our options exchanges and Nasdaq Execution Services, LLC will operate asthe routing broker for both our U.S. cash equity and options exchanges, In June 2013, Execution Access LLC, apreviously inactive broker-dealer and indirect subsidiary of NASDAQ OMX, was repurposed and approved byFINRA to operate as the broker-dealer for our fixed income business, including eSpeed’s electronic tradingplatform for U.S. Treasuries.
Nasdaq Execution Services is registered as a broker-dealer with the SEC and in all 50 states, the District ofColumbia and Puerto Rico. It is also a member of The NASDAQ Stock Market, NASDAQ OMX BX, NASDAQOMX PHLX, BATS-Y Exchange, BATS-Z Exchange, CBOE, Chicago Stock Exchange, EDGA Exchange,EDGX Exchange, FINRA, National Stock Exchange, NYSE, NYSE MKT and NYSE Arca.
NASDAQ Options Services is registered as a broker-dealer with the SEC and in all 50 states, the District ofColumbia and Puerto Rico. It is also a member of The NASDAQ Stock Market, NASDAQ OMX PHLX,NASDAQ OMX BX Options, BATS-Z Exchange, BOX, CBOE, C2 Options Exchange, FINRA, ISE, NFA,Miami International Stock Exchange, NYSE MKT and NYSE Arca.
Execution Access LLC is registered as a broker-dealer with the SEC, FINRA and 22 states based onbusiness requirements. Execution Access LLC operates a transparent central limit order book known as eSpeedto trade in U.S. Treasury securities. Execution Access LLC is an introducing broker for trades matched on theeSpeed trading platform. The trades, once matched, are submitted to our fully disclosed clearing broker forclearance and settlement.
The SEC, FINRA and the exchanges adopt rules and examine broker-dealers and require strict compliancewith their rules and regulations. The SEC, SROs and state securities commissions may conduct administrativeproceedings which can result in censures, fines, the issuance of cease-and-desist orders or the suspension orexpulsion of a broker-dealer, its officers or employees. The SEC and state regulators may also instituteproceedings against broker-dealers seeking an injunction or other sanction. The SEC and SRO rules cover many
16
aspects of a broker-dealer’s business, including capital structure and withdrawals, sales methods, trade practicesamong broker-dealers, use and safekeeping of customers’ funds and securities, record-keeping, the financing ofcustomers’ purchases, broker-dealer and employee registration and the conduct of directors, officers andemployees. All broker-dealers have an SRO that is assigned by the SEC as the broker-dealer’s designatedexamining authority, or DEA. The DEA is responsible for examining a broker-dealer for compliance with theSEC’s financial responsibility rules. FINRA is the current DEA for Nasdaq Execution Services, NASDAQOptions Services and Execution Access LLC.
As registered broker-dealer subsidiaries, Nasdaq Execution Services, NASDAQ Options Services andExecution Access LLC are subject to regulatory requirements intended to ensure their general financialsoundness and liquidity, which require that they comply with certain minimum capital requirements. The SECand FINRA impose rules that require notification when net capital falls below certain predefined criteria, dictatethe ratio of debt to equity in the regulatory capital composition of a broker-dealer and constrain the ability of abroker-dealer to expand its business under certain circumstances. Additionally, the Uniform Net Capital Rule andFINRA rules impose certain requirements that may have the effect of prohibiting a broker-dealer fromdistributing or withdrawing capital and requiring prior notice to the SEC and FINRA for certain withdrawals ofcapital.
As of December 31, 2013, NASDAQ Execution Services, NASDAQ Options Services and ExecutionAccess LLC were in compliance with all of the applicable capital requirements.
Regulatory contractual relationships with FINRA. The NASDAQ Stock Market, NASDAQ OMX PHLX,NASDAQ OMX PSX and NASDAQ OMX BX have signed a series of regulatory service agreements coveringthe services FINRA provides to the respective SROs. Under these agreements, FINRA personnel act as ouragents in performing the regulatory functions outlined above, and FINRA bills us a fee for these services. Theseagreements have enabled us to reduce our headcount while ensuring that the markets for which we areresponsible are properly regulated. However, our SROs retain ultimate regulatory responsibility for all regulatoryactivities performed under these agreements by FINRA. In addition, our options markets have entered into a jointagreement with the other options exchanges for conducting insider trading surveillance. Our SROs continue tomonitor the activities conducted under the agreement and continue to have regulatory responsibility in this area.
Exchange Act Rule 17d-2 permits SROs to enter into agreements, commonly called Rule 17d-2 agreements,approved by the SEC with respect to enforcement of common rules relating to common members. Our SROshave entered into several such agreements under which FINRA assumes regulatory responsibility for specificscovered by the agreement:
• agreements with FINRA covering the enforcement of common rules, the majority of which relate to theregulation of The NASDAQ Stock Market, NASDAQ OMX BX and the members of these exchanges;
• joint industry agreements with FINRA covering responsibility for enforcement of insider trading rules;
• joint industry agreement with FINRA covering enforcement of rules related to cash equity salespractices and certain other non-market related rules; and
• joint industry agreement covering enforcement of rules related to options sales practices.
Regulation NMS and Options Intermarket Linkage Plan. We are subject to Regulation NMS for our cashequities markets, and our options markets have joined the Options Intermarket Linkage Plan. These are designedto facilitate the routing of orders among exchanges to create a national market system as mandated by theExchange Act. One of the principal purposes of a national market system is to assure that brokers may executeinvestors’ orders at the best market price. Both Regulation NMS and the Options Intermarket Linkage Planrequire that exchanges avoid trade-throughs, locking or crossing of markets and provide market participants withelectronic access to the best prices among the markets for the applicable cash equity or options order.
17

In addition, Regulation NMS requires that every national securities exchange on which an NMS stock istraded and every national securities association act jointly pursuant to one or more national market system plansto disseminate consolidated information, including a national best bid and national best offer, on quotations fortransactions in NMS stocks, and that such plan or plans provide for the dissemination of all consolidatedinformation for an individual NMS stock through a single plan processor. The UTP Plan was filed with andapproved by the SEC as a national market system plan in accordance with the Exchange Act and RegulationNMS to provide for the collection, consolidation and dissemination of such information for NASDAQ-listedsecurities. NASDAQ serves as the SIP for the UTP Plan. As the SIP, NASDAQ performs and dischargesregulatory functions and responsibilities that are necessary for the members of the UTP Plan to discharge theregulatory functions related to the operation of a national market system that have been delegated to them underthe Exchange Act and Regulation NMS. To fulfill its obligations as the SIP, NASDAQ has designed,implemented, maintained, and operated a data processing and communications system, hardware, and softwareand communications infrastructure to provide processing for the UTP Plan.
CFTC Regulation. Prior to 2014, we also operated NASDAQ Futures Exchange, or NQF (formerly NASDAQOMX Futures Exchange), a designated contract market under the Commodity Exchange Act and subject toregulatory oversight by the U.S. Commodity Futures Trading Commission, or CFTC, an independent agency withthe mandate to regulate commodity futures and option markets in the U.S. On January 1, 2014, NQF became adormant designated contract market under CFTC rules and ceased listing futures contracts for trading. NQF hasapplied to reinstate its designation and, subject to regulatory approval, is anticipated to resume operations in 2014.
The Dodd-Frank Wall Street Reform and Consumer Protection Act, or Dodd-Frank Act, also has resulted inincreased CFTC regulation of some of our subsidiaries outside the United States and their customers.
European Regulation
Regulation of our markets in the European Union and European Economic Area focuses on issues relatingto financial services, listing and trading of securities and market abuse. At the end of 2012, new regulationsrelating to CCP services and OTC derivatives transactions were adopted that will affect our clearinghouses inEurope. As the regulatory environment continues to change and related opportunities arise, we intend to continueproduct development, and ensure that the exchanges and clearinghouses that comprise NASDAQ OMX Nordicand NASDAQ OMX Baltic maintain favorable liquidity and offer efficient trading.
Confidence in capital markets is paramount for trading to function properly. NASDAQ OMX Nordic carriesout market surveillance through an independent unit that is separate from the business operations. Thesurveillance work is organized into two functions: one for the listing of instruments and surveillance ofcompanies (issuer surveillance) and one for surveillance of trading (trading surveillance). The real-time tradingsurveillance for the Finnish, Icelandic, Danish and Swedish markets has been centralized to Stockholm. InIceland, the surveillance activities are carried out by specially appointed persons. In addition, there are specialpersonnel who carry out surveillance activities at each of the three Baltic exchanges and at NASDAQ OMX OsloASA with respect to the trading of commodities derivatives. There are three surveillance committees atNASDAQ OMX Nordic, one at each NASDAQ OMX Nordic exchange in Sweden, Finland and Denmark. Thesecommittees have an advisory role in relation to surveillance matters. In Sweden and Finland, decisions to list newcompanies are made by the listing committees of the exchanges. In Denmark and Iceland, listing decisions aremade by the President of the exchange, a duty delegated by the board of NASDAQ OMX Copenhagen andNASDAQ OMX Iceland, respectively.
If there is suspicion that a listed company or member has acted in breach of exchange regulations, the matteris dealt with by the market regulation division. Serious breaches are considered by the respective disciplinarycommittee in Sweden and Finland. In Denmark, all matters are dealt with by the surveillance department. InIceland, enforcement committees handle all breaches of exchange regulations, while disciplinary committeeshandle the determination of fines. Suspected insider trading is reported to the appropriate authorities in therespective country or countries.
18

The entities that operate trading venues in the Nordic and Baltic countries are each subject to localregulation. In Sweden, general supervision of the exchange market operated by NASDAQ OMX Stockholm iscarried out by the SFSA, while NASDAQ OMX Clearing’s role as CCP in the clearing of derivatives is overseenby the SFSA and the Swedish central bank, Riksbanken. Additionally, as a function of the Swedish two-tiersupervisory model, certain surveillance in relation to the exchange market is carried out by us, acting through oursurveillance division.
NASDAQ OMX Stockholm’s exchange activities are regulated primarily by the Swedish Securities MarketsAct 2007:528, or SSMA, which sets up basic requirements regarding the board of the exchange and its sharecapital, and which also outlines the conditions on which exchange licenses are issued. The SSMA also providesthat any changes to the exchange’s articles of association following initial registration must be approved by theSFSA. NASDAQ OMX Clearing AB holds the license as a CCP.
In December 2012, the European Commission adopted nine implementing technical standards tocomplement the obligations defined under EMIR which became effective in August 2012. As a consequence ofEMIR, NASDAQ OMX Clearing and like other European CCPs is currently applying to reauthorize their CCPoperations.
With respect to ongoing operations, the SSMA requires exchanges to conduct their activities in an honest,fair and professional manner, and in such a way as to maintain public confidence in the securities markets. Whenoperating a regulated market, an exchange must apply the principles of free access (i.e., that each person whichmeets the requirements established by law and by the exchange may participate in trading), neutrality (i.e., thatthe exchange’s rules for the regulated market are applied in a consistent manner to all those who participate intrading) and transparency (i.e., that the participants must be given speedy, simultaneous and correct informationconcerning trading and that the general public must be given the opportunity to access this information).Additionally, the exchange operator must identify and manage the risks that may arise in its operations, usesecure technical systems and identify and handle the conflicts of interest that may arise between the exchange orits owners’ interests and the interest in safeguarding effective risk management and secure technical systems.Similar requirements are set up by the SSMA and EMIR in relation to clearing operations.
The SSMA also contains the framework for both the SFSA’s supervisory work in relation to exchanges andclearinghouses and the surveillance to be carried out by the exchanges themselves. The latter includes therequirement that an exchange should have “an independent surveillance function with sufficient resources andpowers to meet the exchange’s obligations.” That requires the exchange to, among other things, supervise tradingand price information, compliance with laws, regulations and good market practice, participant compliance withtrading participation rules, financial instrument compliance with relevant listing rules and the extent to whichissuers meet their obligation to submit regular financial information to relevant authorities.
The regulatory environment in the other Nordic and Baltic countries in which a NASDAQ OMX entity has atrading venue is broadly similar to the regulatory environment in Sweden. Since 2005, there has been aMemorandum of Understanding between the SFSA and the main supervisory authorities in Norway, Denmarkand Finland, which looks to safeguard effective and comprehensive supervision of the exchanges comprisingNASDAQ OMX Nordic and the systems operated by it, and to ensure a common supervisory approach.
Employees
As of December 31, 2013, NASDAQ OMX had 3,365 employees, including staff employed at consolidatedentities where we have a controlling financial interest. Of the total employees, 1,535 were based in the U.S. and1,830 were based outside of the U.S. None of our U.S. employees are subject to collective bargaining agreementsor is represented by a union. Approximately 88 employees based in Denmark and Finland are covered by localunion agreements.
19

NASDAQ OMX Website and Availability of SEC Filings
We file periodic reports, proxy statements and other information with the SEC. The public may read andcopy any materials we file with the SEC at the SEC’s Public Reference Room at 100 F Street, NE, Washington,DC 20549. The public may obtain information on the operation of the Public Reference Room by calling the SECat 1-800-SEC-0330. The SEC maintains an Internet site that contains reports, proxy and information statements,and other information regarding issuers that file electronically with the SEC (such as us). The address of that siteis http://www.sec.gov.
Our website is www.nasdaqomx.com. Information on our website is not a part of this Form 10-K. We willmake available free of charge on our website, or provide a link to, our Forms 10-K, Forms 10-Q and Forms 8-Kand any amendments to these documents, that are filed or furnished pursuant to Section 13(a) or 15(d) of theExchange Act as soon as reasonably practicable after we electronically file such material with, or furnish it to,the SEC. To access these filings, go to NASDAQ OMX’s website and click on “Investor Relations,” then under“Financial Information” click on “SEC Filings.”
We use our website, www.nasdaqomx.com, as a means of disclosing material non-public information andfor complying with disclosure obligations under Regulation FD.
Item 1A. Risk Factors.
The risks and uncertainties described below are not the only ones facing us. Additional risks anduncertainties not presently known to us or that we currently believe to be immaterial may also adversely affectour business. If any of the following risks actually occur, our business, financial condition, or operating resultscould be adversely affected.
Risks Relating to our Business
Our industry is highly competitive.
We face intense competition from other exchanges and markets for market share of trading activity andlistings. In addition, our market data, index licensing, corporate solutions and market technology businesses facesignificant competition from other market participants. This competition includes both product and pricecompetition and has continued to increase as a result of the creation of new execution and listing venues in theUnited States and Europe. Increased competition may result in a decline in our share of trading activity, listingsand demand for the products we offer, thereby adversely affecting our operating results.
The liberalization and globalization of world markets has resulted in greater mobility of capital, greaterinternational participation in local markets and more competition. As a result, both in the U.S. and in othercountries, the competition among exchanges and other execution venues has become more intense. In the lastseveral years, many marketplaces in both Europe and the U.S. have demutualized to provide greater flexibilityfor future growth. The securities industry also has experienced consolidation, creating a more intense competitiveenvironment. Regulatory changes, such as MiFID, also have facilitated the entry of new participants in the EUthat compete with our European markets. The regulatory environment, both in the U.S. and in Europe, isstructured to maintain this environment of intense competition. In addition, a high proportion of business in thesecurities markets is becoming concentrated in a smaller number of institutions and our revenue may thereforebecome concentrated in a smaller number of customers.
We also compete globally with other regulated exchanges and markets, ATSs, MTFs and other traditionaland non-traditional execution venues. Some of these competitors also are our customers. Our exchangecompetitors include ICE, LSE, Deutsche Börse and a number of other exchanges in the U.S. and around theworld. These exchanges offer a range of services comparable to those offered by our exchanges and generallycompete with us in providing trade executions, trade reporting, market data, listings, regulation, index, andtechnology services. Public ATSs in the U.S. and MTFs in Europe are broker-dealer operated systems that offertrade execution services, typically at very low cost. Other competing execution venues include broker-dealer
20

owned systems such as dark-pools and internalization engines that may or may not be registered as ATSs orMTFs. Like ATSs and MTFs, these venues also compete with us by offering low cost executions and differ frompublic ATSs and MTFs in the degree of transparency they offer and in restrictions on who may access thesesystems.
Competitors may develop market trading platforms that are more competitive than ours. Competitors mayenter into strategic partnerships, mergers or acquisitions that could make their trading, listings, clearing or databusinesses more competitive than ours. In November 2013, ICE completed its acquisition of NYSE Euronext.ICE has also indicated its intent to spin off Euronext via an IPO. In early 2014, BATS merged with Direct Edge,creating a holding company with four equity platforms that currently execute roughly the same amount ofvolume as NASDAQ OMX’s three U.S. equity platforms. These transactions have the potential to affect thecompetitive environment we face in both the U.S. and Europe. If we are unable to compete successfully in thisenvironment, our business, financial condition and operating results will be adversely affected.
Price competition has affected and could continue to affect our business.
We face intense price competition in all areas of our business. In particular, the trading industry ischaracterized by intense price competition. We have in the past lowered prices, and in the U.S., increased rebatesfor trade executions to attempt to gain or maintain market share. These strategies have not always beensuccessful and have at times hurt operating performance. Additionally, we have also been, and may once againbe, required to adjust pricing to respond to actions by competitors, which could adversely impact operatingresults. We are also subject to potential price competition from new competitors and from new and existingregulated markets and MTFs. We also compete with respect to the pricing of market data and with respect toproducts for pre-trade book data and for post-trade last sale data. In the future, our competitors may offer rebatesfor quotes and trades on their systems. In addition, our listing, index licensing and technology solutions pricing issubject to competitive pressures. If we are unable to compete successfully in respect to the pricing of our servicesand products, our business, financial condition and operating results may be adversely affected.
Economic conditions and market factors, which are beyond our control, may adversely affect our business andfinancial condition.
Our business performance is impacted by a number of factors, including general economic conditions inboth the U.S. and Europe, market volatility, and other factors that are generally beyond our control. To the extentthat global or national economic conditions weaken, our business is likely to be negatively impacted. Adversemarket conditions could reduce customer demand for our services and the ability of our customers, lenders andother counterparties to meet their obligations to us. Poor economic conditions may result in a decline in tradingvolume, deterioration of the economic welfare of our listed companies and a reduction in the demand for ourproducts, including our market data, indexes, corporate solutions and market technology. Trading volume isdriven primarily by general market conditions and declines in trading volume may affect our market share andimpact our pricing. In addition, our Market Services businesses receive revenues from a relatively small amountof customers concentrated in the financial industry, so any event that impacts one or more customers or thefinancial industry in general could impact our revenues.
The number of listings on our markets is primarily influenced by factors such as investor demand, the globaleconomy, available sources of financing, and tax and regulatory policies. Adverse conditions may jeopardize theability of our listed companies to comply with the continued listing requirements of our exchanges.
Market data revenues also may be significantly affected by global economic conditions. Professionalsubscriptions to our market data are at risk if staff reductions occur in financial services companies, which couldresult in significant reductions in our market data professional user revenue. In addition, adverse marketconditions may cause reductions in the number of non-professional investors with investments in the market.
21

A reduction in trading volumes, market share of trading, the number of our listed companies, or demand formarket data or technology products due to economic conditions or other market factors could adversely affect ourbusiness, financial condition and operating results.
A decline in trading and clearing volume will decrease our trading and clearing revenues.
Trading and clearing volumes are directly affected by economic, political and market conditions, broadtrends in business and finance, unforeseen market closures or other disruptions in trading, the level and volatilityof interest rates, inflation, changes in price levels of securities and the overall level of investor confidence. Inrecent years, trading and clearing volumes across our markets have fluctuated significantly depending on marketconditions and other factors beyond our control. Current initiatives being considered by regulators andgovernments, such as restrictions on algorithmic (high-frequency) trading, could have a material adverse effecton overall trading and clearing volumes. Because a significant percentage of our revenues is tied directly to thevolume of securities traded and cleared on our markets, it is likely that a general decline in trading and clearingvolumes would lower revenues and may adversely affect our operating results if we are unable to offset fallingvolumes through pricing changes. Declines in trading and clearing volumes may also impact our market share orpricing structures and adversely affect our business and financial condition.
Our market share of trading has declined and may continue to decline.
Our matched market share in NASDAQ-listed securities executed on NASDAQ declined from 46.1% in2007 to 24.5% in 2013, and our combined matched market share in all U.S.-listed securities executed on all ofour platforms declined from 29.1% in 2007 to 18.8% in 2013. In addition, as a result of the adoption of MiFID, anumber of MTFs have launched, thereby significantly increasing competition in Europe. As a result, our matchedmarket share in securities listed on our exchanges comprising NASDAQ OMX Nordic and NASDAQ OMXBaltic has declined from 100% in 2007 to 68.6% in 2013.
If our total market share in these securities continues to decrease relative to our competitors, our venues maybe viewed as less attractive sources of liquidity. If growth in overall trading volume of these securities does notoffset continued declines in our market share, or if our exchanges are perceived to be less liquid, then ourbusiness, financial condition and operating results could be adversely affected.
Since some of our exchanges offer clearing services in addition to trading services, a decline in market shareof trading could lead to a decline in clearing revenues. Declines in market share also could result in issuersviewing the value of a listing on our exchanges as less attractive, thereby adversely affecting our listing business.Finally, declines in market share of NASDAQ-listed securities could lower NASDAQ’s share of tape poolrevenues under the consolidated data plans, thereby reducing the revenues of our market data business.
System limitations or failures could harm our business.
Our businesses depend on the integrity and performance of the technology, computer and communicationssystems supporting them. If our systems cannot expand to cope with increased demand or otherwise fail toperform, we could experience unanticipated disruptions in service, slower response times and delays in theintroduction of new products and services. These consequences could result in trading outages, lower tradingvolumes, financial losses, decreased customer service and satisfaction and regulatory sanctions. Our marketshave experienced systems failures and delays in the past and could experience future systems failures and delays.
Although we currently maintain and expect to maintain multiple computer facilities that are designed toprovide redundancy and back-up to reduce the risk of system disruptions and have facilities in place that areexpected to maintain service during a system disruption, such systems and facilities may prove inadequate. Iftrading volumes increase unexpectedly or other unanticipated events occur, we may need to expand and upgradeour technology, transaction processing systems and network infrastructure. We do not know whether we will beable to accurately project the rate, timing or cost of any increases, or expand and upgrade our systems andinfrastructure to accommodate any increases in a timely manner.
22

While we have programs in place to identify and minimize our exposure to vulnerabilities and work incollaboration with the technology industry to share corrective measures with our business partners, we cannotguarantee that such events will not occur in the future. Any system issue that causes an interruption in services,decreases the responsiveness of our services or otherwise affects our services could impair our reputation,damage our brand name and negatively impact our business, financial condition and operating results.
Our role in the global marketplace may place us at greater risk for a cyber attack or other security incidents.
Our systems and operations are vulnerable to damage or interruption from security breaches, hacking, datatheft, denial of service attacks, human error, natural disasters, power loss, fire, sabotage, terrorism, computerviruses, intentional acts of vandalism and similar events. Given our position in the global securities industry, wemay be more likely than other companies to be a direct target, or an indirect casualty, of such events. In February2011, we announced that, through our normal security monitoring systems, we detected suspicious files on ourU.S. servers. The files were immediately removed and we believe there has been no evidence that any customerinformation was accessed or acquired by third parties.
While we continue to employ resources to monitor our systems and protect our infrastructure, thesemeasures may prove insufficient depending upon the attack or threat posed. Any system issue, whether as a resultof an intentional breach or a natural disaster, could damage our reputation and cause us to lose customers,experience lower trading volume, incur significant liabilities or otherwise have a negative impact on ourbusiness, financial condition and operating results. We also could incur significant expense in addressing any ofthese problems and in addressing related data security and privacy concerns.
The success of our business depends on our ability to keep up with rapid technological and other competitivechanges affecting our industry. Specifically, we must complete development of, successfully implement andmaintain electronic trading platforms that have the functionality, performance, capacity, reliability and speedrequired by our business and our regulators, as well as by our customers.
The markets in which we compete are characterized by rapidly changing technology, evolving industry andregulatory standards, frequent enhancements to existing products and services, the adoption of new services andproducts and changing customer demands. We may not be able to keep up with rapid technological and othercompetitive changes affecting our industry. For example, we must continue to enhance our electronic tradingplatforms to remain competitive as well as to address our regulatory responsibilities, and our business will benegatively affected if our electronic trading platforms fail to function as expected. If we are unable to developour electronic trading platforms to include other products and markets, or if our electronic trading platforms donot have the required functionality, performance, capacity, reliability and speed required by our business and ourregulators, as well as by our customers, we may not be able to compete successfully. Further, our failure toanticipate or respond adequately to changes in technology and customer preferences, especially in our technologysolution businesses, or any significant delays in product development efforts, could have a material adverseeffect on our business, financial condition and operating results.
We may experience losses and liabilities as a result of systems issues that arose during the Facebook, Inc.IPO.
In connection with the IPO by Facebook on May 18, 2012, systems issues were experienced at the openingof trading of Facebook shares. Certain of our members may have been disadvantaged by such systems issues,which have subsequently been remedied. We announced a program for voluntary accommodations to qualifyingmembers, which was approved by the SEC in March 2013, and we paid all valid claims submitted through theprogram in December 2013. As a result of the systems issues, we have been sued by retail investors and tradingfirms in certain putative class actions, many of which have been consolidated into a single action, as well as infive other lawsuits by individual investors. The plaintiffs have asserted claims for negligence, gross negligence,fraud, and violations of Section 20(a) of the Act and Rule 10b-5, promulgated under the Act. In addition, a
23

member organization filed a demand for arbitration seeking indemnification for alleged losses associated with theFacebook IPO. We believe that these lawsuits and arbitration demand are without merit and intend to defendthem vigorously.
In addition, as previously disclosed, the SEC completed an investigation into the Facebook matter. Pursuantto our offer of settlement, which the Commission accepted, our subsidiaries, The NASDAQ Stock Market LLCand NASDAQ Execution Services LLC, agreed to implement several measures aimed at preventing futureviolations of the Act and the rules and regulations promulgated thereunder. We fully implemented and providedthe SEC with a certification of our compliance with these undertakings by December 31, 2013 as agreed. Inaddition, The NASDAQ Stock Market LLC paid a $10 million penalty to the United States Treasury.
While we are unable to predict the outcome of the pending litigation or arbitration, an unfavorable outcomein one or more of these matters could have a material adverse effect on us. Pending the resolution of thesematters, we expect to incur significant additional expenses in defending the arbitration and lawsuits.
Our role as exclusive processor for NASDAQ-listed stocks is under review.
On August 22, 2013, we experienced an outage in the exclusive processor system we maintain and operateon behalf of all exchanges that trade NASDAQ stocks which resulted in a market-wide trading halt lastingapproximately three hours. Following this system outage, the Commission and others are evaluating allinfrastructure that is critical to the national market system, including the processor systems. We have proposedupgrades that are designed to make those systems more robust and resilient, the cost of such upgrades to be bornecollectively by all exchanges that trade NASDAQ stocks. The failure of other exchanges to adopt these upgradescould impact the proper function of the processor and impose further risk on us and the industry. If future outagesoccur or the processor systems fail to function properly while we are operating the systems, it could have anadverse effect on our business, reputation, financial condition or operating results.
Additionally, the contract for future maintenance and operation of the processor systems will shortly besubject to a competitive bidding process. We may choose not to bid for the contract or may fail to obtain thatcontract if we do bid. Although we do not expect any material adverse effect on our business if we no longer actas the SIP in the future, we could be impacted in ways that we have not foreseen.
We may not be able to successfully integrate acquired businesses, which may result in an inability to realizethe anticipated benefits of our acquisitions.
In May 2013, we acquired the TR Corporate Solutions businesses, and in June 2013, we acquired eSpeed. In2013, we also formed NPM. We must rationalize, coordinate and integrate the operations of these and otheracquired businesses. This process involves complex technological, operational and personnel-related challenges,which are time-consuming and expensive and may disrupt our business. The difficulties, costs and delays thatcould be encountered may include:
• difficulties, costs or complications in combining the companies’ operations, including technologyplatforms, which could lead to us not achieving the synergies we anticipate;
• incompatibility of systems and operating methods;
• reliance on a deal partner for transition services, including billing services;
• inability to use capital assets efficiently to develop the business of the combined company;
• the difficulty of complying with government-imposed regulations in the U.S. and abroad, which may beconflicting;
• resolving possible inconsistencies in standards, controls, procedures and policies, business cultures andcompensation structures;
24

• the diversion of management’s attention from ongoing business concerns and other strategicopportunities;
• difficulties in operating acquired businesses in parallel with similar businesses that we operatedpreviously;
• difficulties in operating businesses we have not operated before;
• difficulty of integrating multiple acquired businesses simultaneously;
• the retention of key employees and management;
• the implementation of disclosure controls, internal controls and financial reporting systems at non-U.S.subsidiaries to enable us to comply with U.S. generally accepted accounting principles, or U.S. GAAP,and U.S. securities laws and regulations, including the Sarbanes Oxley Act of 2002, required as a resultof our status as a reporting company under the Exchange Act;
• the coordination of geographically separate organizations;
• the coordination and consolidation of ongoing and future research and development efforts;
• possible tax costs or inefficiencies associated with integrating the operations of a combined company;
• pre-tax restructuring and revenue investment costs;
• the retention of strategic partners and attracting new strategic partners; and
• negative impacts on employee morale and performance as a result of job changes and reassignments.
For these reasons, we may not achieve the anticipated financial and strategic benefits from our acquisitionsand initiatives. Any actual cost savings and synergies may be lower than we expect and may take a longer time toachieve than we anticipate, and we may fail to realize the anticipated benefits of acquisitions.
We will need to invest in our operations to maintain and grow our business and to integrate acquisitions, andwe may need additional funds, which may not be readily available.
We depend on the availability of adequate capital to maintain and develop our business. Although webelieve that we can meet our current capital requirements from internally generated funds, cash on hand andavailable borrowings under our existing credit facilities, if the capital and credit markets experience volatility,access to capital or credit may not be available on terms acceptable to us or at all. Limited access to capital orcredit in the future could have an impact on our ability to refinance debt, maintain our credit rating, meet ourregulatory capital requirements, engage in strategic initiatives, make acquisitions or strategic investments in othercompanies or react to changing economic and business conditions. If we are unable to fund our capital or creditrequirements, it could have an adverse effect on our business, financial condition and operating results.
In addition to our debt obligations, we will need to continue to invest in our operations for the foreseeablefuture to integrate acquired businesses and to fund new initiatives. If we do not achieve the expected operatingresults, we will need to reallocate our cash resources. This may include borrowing additional funds to servicedebt payments, which may impair our ability to make investments in our business or to integrate acquiredbusinesses.
Should we need to raise funds through issuing additional equity, our equity holders will suffer dilution.Should we need to raise funds through incurring additional debt, we may become subject to covenants even morerestrictive than those contained in our existing credit facilities, the indentures governing our notes and our otherdebt instruments. Furthermore, if adverse economic conditions occur, we could experience decreased revenuesfrom our operations which could affect our ability to satisfy financial and other restrictive covenants to which weare subject under our existing indebtedness.
25

We operate in a highly regulated industry and may be subject to censures, fines and enforcement proceedingsif we fail to comply with regulatory obligations.
We operate in a highly regulated industry and are subject to extensive regulation in the U.S. and Europe.The securities trading industry is subject to significant regulatory oversight and could be subject to increasedgovernmental and public scrutiny in the future in response to global conditions and events. In the U.S., ourmarkets and broker-dealer subsidiaries are regulated by the SEC, FINRA or CFTC and, in the Nordics, Balticsand UK, our markets are subject to local and/or European Union regulation. As a result, our regulated marketsare subject to audits, investigations, administrative proceedings and enforcement actions relating to compliancewith applicable rules and regulations. Regulators have broad powers to impose fines, penalties or censure, issuecease-and-desist orders, prohibit operations, revoke licenses or registrations and impose other sanctions on ourexchanges, broker-dealers and markets for violations of applicable requirements.
In 2013, the SEC completed an investigation into the Facebook matter and accepted our offer of settlementwhich included a monetary penalty and an agreement to implement certain measures aimed at preventing futureviolations of the Act and the rules and regulations promulgated thereunder. See Item 3, “Legal Proceedings.” Inthe future, we could be subject to SEC or other regulatory investigations or enforcement proceedings that couldresult in substantial sanctions, including revocation of our operating licenses. Any such investigations orproceedings, whether successful or unsuccessful, could result in substantial costs, the diversion of resources,including management time, and potential harm to our reputation, which could have a material adverse effect onour business, results of operations or financial condition. In addition, our exchanges could be required to modifyor restructure their regulatory functions in response to any changes in the regulatory environment, or they may berequired to rely on third parties to perform regulatory and oversight functions, each of which may require us toincur substantial expenses and may harm our reputation if our regulatory services are deemed inadequate.
The regulatory framework under which we operate and new regulatory requirements or new interpretations ofexisting regulatory requirements could require substantial time and resources for compliance, which couldmake it difficult and costly for us to operate our business.
Under current U.S. federal securities laws, changes in the rules and operations of our markets, including ourpricing structure, must be reviewed and in many cases explicitly approved by the SEC. The SEC may approve,disapprove, or recommend changes to proposals that we submit. In addition, the SEC may delay either theapproval process or the initiation of the public comment process. Any delay in approving changes, or the alteringof any proposed change, could have an adverse effect on our business, financial condition and operating results.We must compete not only with ATSs that are not subject to the same SEC approval process but also with otherexchanges that may have lower regulation and surveillance costs than us. There is a risk that trading will shift toexchanges that charge lower fees because, among other reasons, they spend significantly less on regulation.
In addition, our registered broker-dealer subsidiaries are subject to regulation by the SEC, FINRA and otherself-regulatory organizations. These subsidiaries are subject to regulatory requirements intended to ensure theirgeneral financial soundness and liquidity, which require that they comply with certain minimum capitalrequirements. The SEC and FINRA impose rules that require notification when a broker-dealer’s net capital fallsbelow certain predefined criteria, dictate the ratio of debt to equity in the regulatory capital composition of abroker-dealer and constrain the ability of a broker-dealer to expand its business under certain circumstances.Additionally, the Uniform Net Capital Rule and FINRA rules impose certain requirements that may have theeffect of prohibiting a broker-dealer from distributing or withdrawing capital and requiring prior notice to theSEC and FINRA for certain withdrawals of capital. Any failure to comply with these broker-dealer regulationscould have a material adverse effect on the operation of our business, financial condition and operating results.
Our non-U.S. business is subject to regulatory oversight in all the countries in which we operate regulatedbusinesses, such as exchanges or central securities depositories. The countries in which we currently operate orshare ownership in regulated businesses include Sweden, Finland, Denmark, Iceland, Estonia, Lithuania, Latvia,
26

Norway, Armenia, Switzerland, the Netherlands and the United Kingdom. In all the aforementioned countries,we have received authorization from the relevant authorities to conduct our regulated business activities. Theauthorities may revoke this authorization if we do not suitably carry out our regulated business activities. Theauthorities are also entitled to request that we adopt measures in order to ensure that we continue to fulfill theauthorities’ requirements.
Furthermore, we hold interests in other regulated entities, and certain of our customers operate in a highlyregulated industry. Regulatory authorities could impose regulatory changes that could impact the ability of ourcustomers to use our exchanges. The loss of a significant number of customers or a reduction in trading activityon any of our exchanges as a result of such changes could have a material adverse effect on our business,financial condition and operating results.
Regulatory changes and changes in market structure could have a material adverse effect on our business.
Regulatory changes adopted by the SEC or other regulators of our markets, and regulatory changes that ourmarkets may adopt in fulfillment of their regulatory obligations, could materially affect our business operations.In recent years, there has been increased regulatory and governmental focus on issues affecting the securitiesmarkets, including market structure and technological oversight. The SEC, FINRA and the national securitiesexchanges have introduced several initiatives to ensure the oversight, integrity and resilience of markets.
In 2013, the SEC proposed Regulation Systems, Compliance and Integrity (Regulation SCI) which, ifadopted as proposed, would update and extend the SEC’s oversight of technology and establish newrequirements on U.S. exchanges, ATSs, plan processors and clearing agencies concerning the design,development, testing, maintenance and surveillance of technology systems that are integral to their operations.Also in 2013, the SEC implemented a plan for FINRA and the national securities exchanges to institute a limitup-limit down system designed to reduce short-term volatility in equity trading by preventing trades in individualexchange-listed stocks from occurring outside of a specified price band. In 2012, the SEC required nationalsecurities exchanges and FINRA to establish a market-wide consolidated audit trail (CAT) to improve regulators’ability to monitor trading activity. We are currently working with FINRA and the other national securitiesexchanges in developing a plan to create a consolidated audit trail. At the end of 2012, new regulations relating toCCP services and OTC derivatives transactions were adopted that are affecting our clearinghouses in Europe.
In addition, the SEC has taken regulatory actions in connection with issues described in its 2010 conceptrelease on market structure, as well as the events of the May 6, 2010 “flash crash.” In 2011, the SECimplemented a new short sale restriction that triggers when a security declines 10% from its previous close andexpanded its existing single stock trading pause to include all Regulation NMS securities. Any potential rulesconcerning trading halts during volatile markets, market access, algorithmic (high-frequency) trading, alternativetrading systems (such as dark pools), trading increments and other market structure issues could change thecompetitive landscape and have a material impact on our business.
During the coming year, it is likely that there will be additional changes in the regulatory environment inwhich we operate our businesses, including further measures taken by government regulators and the SROs toaddress recent incidents involving exchanges, plan processors or market participants that have resulted indisrupted trading or operations, although we cannot predict the nature of these changes or their impact on ourbusiness at this time. The European Parliament continues its review of MiFID that could affect our operations inEurope. In addition, actions on any of the specific regulatory issues currently under review in the U.S. andEurope such as SRO status, short selling, co-location, algorithmic (high-frequency) trading, market halts, themarket data business, derivatives clearing, market transparency, taxes on stock transactions, restrictions onproprietary trading by certain of our customers and other related proposals could have a material impact on ourbusiness. In the U.S., the CFTC and SEC also will continue to take actions to fully implement the Dodd-FrankAct, a comprehensive banking and financial services reform package.
27

While we support regulatory efforts to review and improve market structure, resilience and integrity, theadoption of these proposed regulatory changes and future reforms could impose significant costs and obligationson the operation of our U.S. exchanges and processor systems and have other impacts on our business.
Regulatory changes or future court rulings may have an adverse impact on our revenue from proprietarymarket data products.
Regulatory and legal developments could reduce the amount of revenue that we earn from our proprietarymarket data products. In the U.S., we generally are required to file with the SEC to establish or modify the feesthat we charge for our market data products. In recent years, certain industry groups have objected to the abilityof exchanges to charge for certain market data products. We have defeated two challenges in federal appealscourt but an additional challenge is currently pending at the SEC. If the results of that challenge are detrimentalto our U.S. exchanges’ ability to charge for market data, there could be a negative impact on our revenues. Wecannot predict whether, or in what form, any regulatory changes will be implemented, or their potential impacton our business. A determination by the SEC, for example, to link market data fees to marginal costs, to take amore active role in the market data rate-setting process, or to reduce the current levels of market data fees couldhave an adverse effect on our market data revenues.
Our European exchanges currently offer market data to customers on a non-discriminatory and reasonablecommercial basis. It is expected that the future MiFID II directive will result in a definition of the term“reasonable commercial basis”. There is a risk that the final wording of this definition may influence the fees forEuropean market data adversely. In addition any future actions by the European Commission or European courtdecisions could affect our ability to offer market data products in the same manner that we do today therebycausing an adverse effect on our European market data revenues.
Stagnation or decline in the initial public offering market could have an adverse effect on our revenues.
The market for initial public offerings is dependent on the prosperity of companies and the availability ofrisk capital. Stagnation or decline in the initial public offering market will impact the number of new listings onThe NASDAQ Stock Market and the exchanges comprising NASDAQ OMX Nordic and NASDAQ OMX Baltic,and thus our related revenues. We recognize revenue from new listings on The NASDAQ Stock Market on astraight-line basis over an estimated six-year service period. As a result, a stagnant market for initial publicofferings could cause a decrease in deferred revenues for future years. Furthermore, as initial public offerings aretypically actively traded following their offering date, a prolonged decrease in the number of initial publicofferings could negatively impact the growth of our transactions revenues.
Any reduction in our credit rating could increase the cost of our funding from the capital markets.
Our long-term debt is currently rated investment grade by two of the major rating agencies. These ratingagencies regularly evaluate us and their ratings of our long-term debt are based on a number of factors, includingour financial strength as well as factors not entirely within our control, including conditions affecting thefinancial services industry generally. There can be no assurance that we will maintain our current ratings. Ourfailure to maintain those ratings could adversely affect the cost and other terms upon which we are able to obtainfunding and increase our cost of capital. A reduction in credit ratings would also result in increases in the cost ofour outstanding debt as the interest rate on the outstanding amounts under our credit facilities, our 5.25% seniornotes due 2018, and our 3.875% senior notes due 2021 fluctuates based on our credit ratings.
Damage to our reputation or brand name could have a material adverse effect on our businesses.
One of our competitive strengths is our strong reputation and brand name. Various issues may give rise toreputational risk, including issues relating to:
• our ability to maintain the security of our data and systems;
28

• the quality and reliability of our technology platforms and systems;
• the ability to fulfill our regulatory obligations;
• the ability to execute our business plan, key initiatives or new business ventures and the ability to keepup with changing customer demand;
• the representation of our business in the media;
• the accuracy of our financial statements and other financial and statistical information;
• the accuracy of our financial guidance or other information provided to our investors;
• the quality of our corporate governance structure;
• the quality of our products, including the reliability of our transaction-based business, the accuracy ofthe quote and trade information provided by our market data business and the accuracy of calculationsused by our Global Index Group for indexes and unit investment trusts;
• the quality of our disclosure controls or internal controls over financial reporting, including any failuresin supervision;
• extreme price volatility on our markets, such as that seen with the “flash crash” on May 6, 2010;
• any negative publicity surrounding our listed companies; and
• any misconduct, fraudulent activity or theft by our employees or other persons formerly or currentlyassociated with us.
Damage to our reputation could cause some issuers not to list their securities on our exchanges, as well asreduce the trading volume on our exchanges or cause us to lose customers in our market data, index or markettechnology businesses. This, in turn, may have a material adverse effect on our business, financial condition andoperating results.
We may incur goodwill, intangible asset or other long-lived asset impairment charges in the future.
Our business acquisitions typically result in the recording of goodwill and intangible assets, and therecorded values of those assets may become impaired in the future. As of December 31, 2013, goodwill totaledapproximately $6.2 billion and intangible assets, net of accumulated amortization, totaled approximately $2.4billion. The determination of the value of such goodwill and intangible assets requires management to makeestimates and assumptions that affect our consolidated financial statements.
We assess goodwill and intangible assets as well as other long-lived assets, including equity methodinvestments, property and equipment and other assets for impairment by applying a fair value based test byanalyzing historical performance, capital requirements and projected cash flows on an annual basis or morefrequently if indicators of impairment arise. Considerable management judgment is necessary to evaluate theimpact of operating and macroeconomic changes and to estimate cash flows. Although there are inherentuncertainties in this assessment process, the estimates and assumptions we use are consistent with our internalplanning. There was no impairment of goodwill for the years ended December 31, 2013, 2012 and 2011.However, disruptions to our business, such as economic weakness and unexpected significant declines inoperating results, may result in an impairment charge related to our goodwill, intangible assets or otherlong-lived assets in the future. A significant impairment charge in the future could have a material adverse effecton our operating results.
We may experience fluctuations in our operating results, which may adversely affect the market price of ourcommon stock.
The financial services industry is risky and unpredictable and is directly affected by many national andinternational factors beyond our control, including:
• economic, political and geopolitical market conditions;
29

• natural disasters, terrorism, war or other catastrophes;
• broad trends in industry and finance;
• changes in price levels and volatility in the stock markets;
• the level and volatility of interest rates;
• changes in government monetary or tax policy;
• other legislative and regulatory changes;
• the perceived attractiveness of the U.S. or European capital markets; and
• inflation.
Any one of these factors could have a material adverse effect on our business, financial condition andoperating results by causing a substantial decline in the financial services markets and reducing trading volumes.In particular, our U.S. business operations are heavily concentrated on the East Coast, and our European businessoperations are heavily concentrated in Stockholm. Any event that affects either of those geographic areas couldpotentially affect our ability to operate our businesses.
Additionally, since borrowings under our credit facilities bear interest at variable rates, any increase ininterest rates on debt that we have not fixed using interest rate hedges will increase our interest expense andreduce our cash flow. Other than variable rate debt, we believe our business has relatively large fixed costs andlow variable costs, which magnifies the impact of revenue fluctuations on our operating results. As a result, adecline in our revenue may lead to a relatively larger impact on operating results. A substantial portion of ouroperating expenses will be related to personnel costs, regulation and corporate overhead, none of which can beadjusted quickly and some of which cannot be adjusted at all. Our operating expense levels will be based on ourexpectations for future revenue. If actual revenue is below management’s expectations, or if our expensesincrease before revenues do, both revenues less transaction rebates, brokerage, clearance and exchange fees andoperating results would be materially and adversely affected. Because of these factors, it is possible that ouroperating results or other operating metrics may fail to meet the expectations of stock market analysts andinvestors. If this happens, the market price of our common stock may be adversely affected.
We are exposed to credit risk from third parties, including customers, counterparties and clearing agents.
We are exposed to credit risk from third parties, including customers, counterparties and clearing agents.These parties may default on their obligations to us due to bankruptcy, lack of liquidity, operational failure orother reasons.
We clear or stand as riskless principal to a range of equity-related and fixed-income-related derivativeproducts, commodities and resale and repurchase agreements. We assume the counterparty risk for alltransactions that are cleared through our markets and guarantee that our cleared contracts will be honored. Weenforce minimum financial and operational criteria for membership eligibility, require members and investors toprovide collateral, and maintain established risk policies and procedures to ensure that the counterparty risks areproperly monitored and pro-actively managed; however, none of these measures provides absolute assuranceagainst experiencing financial losses from defaults by our counterparties on their obligations. No guarantee canbe given that the collateral provided will at all times be sufficient. Although we maintain clearing capitalresources to serve as an additional layer of protection to help ensure that we are able to meet our obligations,these resources may not be sufficient.
In addition, one of our broker-dealer subsidiaries, Execution Access, has a clearing arrangement withCantor Fitzgerald & Co., or Cantor Fitzgerald. As of December 31, 2013, we have contributed $19 million ofclearing deposits to Cantor Fitzgerald in connection with this clearing arrangement. Some of the trading activityin Execution Access is cleared by Cantor Fitzgerald through the Fixed Income Clearing Corporation, or FICC,and the balance is cleared non-FICC. Execution Access assumes the counterparty risk of clients that do not clear
30

through FICC. Counterparty risk of clients exists for Execution Access between the trade date and settlementdate of the individual transactions, which is one business day. All of Execution Access’ obligations under theclearing arrangement with Cantor Fitzgerald are guaranteed by NASDAQ OMX. Some of the non-FICCcounterparties are required to post collateral, provide principal letters, or provide other forms of creditenhancement to Execution Access for the purpose of mitigating counterparty risk. Although we believe that thepotential for us to be required to make payments under these arrangements is mitigated through the pledgedcollateral and our risk management policies, no guarantee can be provided that these arrangements will at alltimes be sufficient.
We also have credit risk related to transaction and subscription-based revenues that are billed to customerson a monthly or quarterly basis, in arrears. Credit losses such as those described above could adversely affect ourconsolidated financial position and results of operations.
Our leverage limits our financial flexibility, increases our exposure to weakening economic conditions andmay adversely affect our ability to obtain additional financing.
In connection with acquisitions and share repurchases, we incurred a significant amount of indebtedness.Our indebtedness as of December 31, 2013 was approximately $2.6 billion. We also may borrow up to anadditional $655 million under a revolver that is part of our credit facilities.
Our leverage could:
• reduce funds available to us for operations and general corporate purposes or for capital expenditures asa result of the dedication of a substantial portion of our consolidated cash flow from operations to thepayment of principal and interest on our indebtedness;
• increase our exposure to a continued downturn in general economic conditions;
• place us at a competitive disadvantage compared with our competitors with less debt; and
• affect our ability to obtain additional financing in the future for refinancing indebtedness, acquisitions,working capital, capital expenditures or other purposes.
In addition, we must comply with the covenants in our credit facilities. Among other things, these covenantsrestrict our ability to grant liens, incur additional indebtedness, pay dividends and conduct transactions withaffiliates. Failure to meet any of the covenant terms of our credit facilities could result in an event of default. Ifan event of default occurs, and we are unable to receive a waiver of default, our lenders may increase ourborrowing costs, restrict our ability to obtain additional borrowings and accelerate all amounts outstanding. Ourcredit facilities allow us to pay cash dividends on our common stock as long as certain leverage ratios aremaintained.
We are subject to litigation risks and other liabilities.
Many aspects of our business potentially involve substantial liability risks. Although under current law weare immune from private suits arising from conduct within our regulatory authority and from acts andforbearances incident to the exercise of our regulatory authority, this immunity only covers certain of ouractivities in the U.S., and we could be exposed to liability under national and local laws, court decisions and rulesand regulations promulgated by regulatory agencies.
Some of our other liability risks arise under the laws and regulations relating to the insurance, tax,intellectual property, anti-money laundering, technology export, foreign asset controls and foreign corruptpractices areas. Liability could also result from disputes over the terms of a trade, claims that a system failure ordelay cost a customer money, claims we entered into an unauthorized transaction or claims that we provided
31

materially false or misleading statements in connection with a securities transaction. As we intend to defend anysuch litigation actively, significant legal expenses could be incurred. Although we carry insurance that may limitour risk of damages in some cases, we still may sustain uncovered losses or losses in excess of availableinsurance that would affect our financial condition and results of operations.
We have self-regulatory obligations and also operate for-profit businesses, and these two roles may createconflicts of interest.
We have obligations to regulate and monitor activities on our markets and ensure compliance withapplicable law and the rules of our markets by market participants and listed companies. In the U.S., the SECstaff has expressed concern about potential conflicts of interest of “for-profit” markets performing the regulatoryfunctions of a self-regulatory organization. Although our U.S. cash equities and options exchanges outsource asubstantial portion of their market regulation functions to FINRA, we do perform regulatory functions and bearregulatory responsibility related to our listed companies and our markets. Any failure by us to diligently andfairly regulate our markets or to otherwise fulfill our regulatory obligations could significantly harm ourreputation, prompt SEC scrutiny and adversely affect our business and reputation.
Our Nordic and Baltic exchanges also monitor trading and compliance with listing standards. They monitorthe listing of cash equities and other financial instruments. The prime objective of such monitoring activities is topromote confidence in the exchanges among the general public and to ensure fair and orderly functioningmarkets. The monitoring functions within the exchanges comprising NASDAQ OMX Nordic and NASDAQOMX Baltic are the responsibility of the surveillance departments or other surveillance personnel. Thesurveillance departments or personnel are intended to strengthen the integrity of and confidence in theseexchanges and to avoid conflicts of interest. Any failure to diligently and fairly regulate the Nordic and Balticexchanges could significantly harm our reputation, prompt scrutiny from regulators and adversely affect ourbusiness and reputation.
Failure to attract and retain key personnel may adversely affect our ability to conduct our business.
Our future success depends, in large part, upon our ability to attract and retain highly qualified professionalpersonnel. Competition for key personnel in the various localities and business segments in which we operate isintense. Our ability to attract and retain key personnel, in particular senior officers, will be dependent on anumber of factors, including prevailing market conditions and compensation packages offered by companiescompeting for the same talent. There is no guarantee that we will have the continued service of key employeeswho we rely upon to execute our business strategy and identify and pursue strategic opportunities and initiatives.In particular, we may have to incur costs to replace senior officers or other key employees who leave, and ourability to execute our business strategy could be impaired if we are unable to replace such persons in a timelymanner.
We are highly dependent on the continued services of Robert Greifeld, our Chief Executive Officer, andother senior officers and key employees who possess extensive financial markets knowledge and technologyskills. We do not have employment agreements with some of these key senior officers. We do not maintain“key person” life insurance policies on any of our senior officers, managers, key employees or technicalpersonnel. The loss of the services of these persons for any reason, as well as any negative market or industryperception arising from those losses, could have a material adverse effect on our business, financial condition andoperating results.
Failure to protect our intellectual property rights, or allegations that we have infringed on the intellectualproperty rights of others, could harm our brand-building efforts and ability to compete effectively.
To protect our intellectual property rights, we rely on a combination of trademark laws, copyright laws,patent laws, trade secret protection, confidentiality agreements and other contractual arrangements with our
32

affiliates, clients, strategic partners and others. The protective steps that we take may be inadequate to determisappropriation of our proprietary information. We may be unable to detect the unauthorized use of, or takeappropriate steps to enforce, our intellectual property rights.
We have registered, or applied to register, our trademarks in the United States and in over 50 foreignjurisdictions and have pending U.S. and foreign applications for other trademarks. We also maintain copyrightprotection on our branded materials and pursue patent protection for software products, inventions and otherprocesses developed by us. We also hold a number of patents, patent applications and licenses in the UnitedStates and other foreign jurisdictions. Effective trademark, copyright, patent and trade secret protection may notbe available in every country in which we offer our services. Failure to protect our intellectual propertyadequately could harm our brand and affect our ability to compete effectively. Further, defending our intellectualproperty rights could result in the expenditure of significant financial and managerial resources.
Third parties may assert intellectual property rights claims against us, which may be costly to defend, couldrequire the payment of damages and could limit our ability to use certain technologies, trademarks or otherintellectual property. Any intellectual property claims, with or without merit, could be expensive to litigate orsettle and could divert management resources and attention. Successful challenges against us could require us tomodify or discontinue our use of technology or business processes where such use is found to infringe or violatethe rights of others, or require us to purchase licenses from third parties, any of which could adversely affect ourbusiness, financial condition and operating results.
We rely on third parties to perform certain functions, and our business could be adversely affected if thesethird parties fail to perform as expected.
We rely on third parties for regulatory, data center and other services. For example, we have a contractualarrangement with FINRA pursuant to which FINRA performs certain regulatory functions on our behalf. We alsoare highly reliant on third-party data centers provided by Verizon. To the extent that FINRA, Verizon or anyother vendor or third-party service provider experiences difficulties, materially changes their businessrelationship with us or is unable for any reason to perform their obligations, our business or our reputation maybe materially adversely affected.
We also rely on members of our trading community to maintain markets and add liquidity. To the extentthat any of our largest members experiences difficulties, materially changes its business relationship with us or isunable for any reason to perform market making activities, our business or our reputation may be materiallyadversely affected.
We are a holding company that depends on cash flow from our subsidiaries to meet our obligations, and anyrestrictions on our subsidiaries’ ability to pay dividends or make other payments to us may have a materialadverse effect on our results of operations and financial condition.
We are a holding company with no direct operating businesses other than the equity interests of oursubsidiaries. We require dividends and other payments from our subsidiaries to meet cash requirements.Minimum capital requirements mandated by regulatory authorities having jurisdiction over some of our regulatedsubsidiaries indirectly restrict the amount of dividends paid upstream. If our subsidiaries are unable to paydividends and make other payments to us when needed, we may be unable to satisfy our obligations, whichwould have a material adverse effect on our business, financial condition and operating results.
Future acquisitions, investments, partnerships and joint ventures may require significant resources and/orresult in significant unanticipated losses, costs or liabilities.
Over the past several years, acquisitions have been significant factors in our growth. Although we cannotpredict our rate of growth as the result of acquisitions with complete accuracy, we believe that additional
33

acquisitions and investments or entering into partnerships and joint ventures will be important to our growthstrategy. Many of the other potential purchasers of assets in our industry have greater financial resources than wehave. Therefore, we cannot be sure that we will be able to complete future acquisitions on terms favorable to us.
We may finance future acquisitions by issuing additional equity and/or debt. The issuance of additionalequity in connection with any such transaction could be substantially dilutive to existing shareholders. Theissuance of additional debt could increase our leverage substantially. In addition, announcement orimplementation of future transactions by us or others could have a material effect on the price of our commonstock. We could face financial risks associated with incurring additional debt, particularly if the debt results insignificant incremental leverage. Additional debt may reduce our liquidity, curtail our access to financingmarkets, impact our standing with credit agencies and increase the cash flow required for debt service. Anyincremental debt incurred to finance an acquisition could also place significant constraints on the operation of ourbusiness.
Furthermore, any future acquisitions of businesses or facilities could entail a number of additional risks,including:
• problems with effective integration of operations;
• the inability to maintain key pre-acquisition business relationships;
• increased operating costs;
• the diversion of our management team from its other operations;
• problems with regulatory bodies;
• exposure to unanticipated liabilities;
• difficulties in realizing projected efficiencies, synergies and cost savings; and
• changes in our credit rating and financing costs.
Changes in tax laws, regulations or policies could have a material adverse effect on our financial results.
Like other corporations, we are subject to taxes at the federal, state and local levels, as well as in non-U.S.jurisdictions. Changes in tax laws, regulations or policies could result in us having to pay higher taxes, whichwould in turn reduce our net income.
In addition, some of our subsidiaries are subject to tax in the jurisdictions in which they are organized oroperate. In computing our tax obligation in these jurisdictions, we take various tax positions on matters that arenot entirely free from doubt. We cannot assure you that upon review of these positions the applicable authoritieswill agree with our positions. A successful challenge by a tax authority could result in additional tax imposed onour subsidiaries.
Our non-U.S. business operates in various international markets, particularly emerging markets, that aresubject to greater political, economic and social uncertainties than developed countries.
The operations of our non-U.S. business are subject to the risk inherent in international operations, includingbut not limited to, risks with respect to operating in Iceland, the Baltics, Central and Eastern Europe, the MiddleEast, Australia and Asia. Some of these economies may be subject to greater political, economic and socialuncertainties than countries with more developed institutional structures. Political, economic or social events ordevelopments in one or more of these countries could adversely affect our operations and financial results.
We have invested substantial capital in system platforms, and a failure to successfully implement such systemscould adversely affect our business.
In our technology operations, we have invested substantial amounts in the development of system platformsand in the rollout of our platforms. Although investments are carefully planned, there can be no assurance that
34

the demand for such platforms will justify the related investments and that the future levels of transactionsexecuted on these platforms will be sufficient to generate an acceptable return on such investments. If we fail togenerate adequate revenue from planned system platforms, or if we fail to do so within the envisioned timeframe,it could have an adverse effect on our results of operations and financial condition.
Because we have operations in several countries, we are exposed to currency risk.
We have operations in the U.S., the Nordic and Baltic countries, Australia and many other foreign countries.We therefore have significant exposure to exchange rate movements between the Euro, Swedish Krona,Danish Krone, Norwegian Krone, British Pound Sterling, Australian Dollar and other foreign currencies towardsthe U.S. dollar. Significant inflation or disproportionate changes in foreign exchange rates with respect to one ormore of these currencies could occur as a result of general economic conditions, acts of war or terrorism, changesin governmental monetary or tax policy or changes in local interest rates. These exchange rate differences willaffect the translation of our non-U.S. results of operations and financial condition into U.S. dollars as part of thepreparation of our consolidated financial statements.
If our risk management methods are not effective, our business, reputation and financial results may beadversely affected.
We have methods to identify, monitor and manage our risks, including oversight of risk management byNASDAQ OMX’s Risk Committee, which is comprised of employees of NASDAQ OMX. However, thesemethods may not be fully effective. Some of our risk management methods may depend upon evaluation ofinformation regarding markets, customers or other matters. That information may not in all cases be accurate,complete, up-to-date or properly evaluated. If our methods are not effective or we are not successful inmonitoring or evaluating the risks to which we are or may be exposed, our business, reputation, financialcondition and operating results could be materially adversely affected.
Charges to earnings resulting from acquisition, restructuring and integration costs may materially adverselyaffect the market value of our common stock.
In accordance with U.S. GAAP, we are accounting for the completion of our acquisitions using the purchasemethod of accounting. We are allocating the total estimated purchase prices to net tangible assets, amortizableintangible assets and indefinite-lived intangibles, and based on their fair values as of the date of completion ofthe acquisitions, recording the excess of the purchase price over those fair values as goodwill. Our financialresults, including earnings per share, or EPS, could be adversely affected by a number of financial adjustmentsrequired by U.S. GAAP including the following:
• we may incur additional amortization expense over the estimated useful lives of certain of the intangibleassets acquired in connection with acquisitions during such estimated useful lives;
• we may have additional depreciation expense as a result of recording purchased tangible assets at fairvalue, in accordance with U.S. GAAP, as compared to book value as recorded;
• to the extent the value of goodwill or intangible assets becomes impaired, we may be required to incurmaterial charges relating to the impairment of those assets; and
• we may incur certain adjustments to reflect the financial condition and operating results under U.S.GAAP and U.S. dollars.
Risks Relating to an Investment in Our Common Stock
Volatility in our stock price could adversely affect our stockholders.
The market price of our common stock is volatile. Broad market and industry factors may adversely affectthe market price of our common stock, regardless of our actual operating performance. Factors that could causefluctuations in our stock price may include, among other things:
• actual or anticipated variations in our quarterly operating results;
35

• changes in financial estimates by us or by any securities analysts who might cover our common stock;
• conditions or trends in our industry, including trading volumes, regulatory changes or changes in thesecurities marketplace;
• conditions or trends in the credit markets;
• announcements by us or our competitors of significant acquisitions, strategic partnerships ordivestitures;
• announcements of investigations or regulatory scrutiny of our operations or lawsuits filed against us;
• additions or departures of key personnel; and
• purchases or sales of our common stock, including purchases or sales of our common stock by ourdirectors, officers, significant stockholders or strategic investors.
Decisions to declare future dividends on our common stock will be at the discretion of our board of directorsbased upon a review of relevant considerations. Accordingly, there can be no guarantee that we will pay futuredividends to our stockholders.
In 2013, our board of directors declared quarterly cash dividend payments of $0.13 per share of outstandingcommon stock. Future declarations of quarterly dividends and the establishment of future record and paymentdates are subject to approval by NASDAQ OMX’s board of directors. The board’s determination to declaredividends will depend upon our profitability and financial condition, contractual restrictions, restrictions imposedby applicable law and other factors that the board deems relevant. Based on an evaluation of these factors, theboard of directors may determine not to declare future dividends at all or to declare future dividends at a reducedamount. Accordingly, there can be no guarantee that we will pay future dividends to our stockholders.
The market price of our common stock could be negatively affected by sales of substantial amounts of ourcommon stock in the public markets.
Sales of a substantial number of shares of our common stock in the public markets, or the perception thatthese sales might occur, could cause the market price of our common stock to decline or could impair our abilityto raise capital through a future sale of, or pay for acquisitions using, our equity securities. As of December 31,2013, there were 169,357,084 shares of our common stock outstanding. All of our common stock is freelytransferable, except shares held by our “affiliates,” as defined in Rule 144 under the Securities Act.
The number of freely transferable shares of our common stock will increase upon any exercise ofoutstanding options pursuant to NASDAQ OMX’s Equity Incentive Plan, or Equity Plan. There were 3,153,801options exercisable as of December 31, 2013 at a weighted average exercise price of $26.59.
Provisions of our certificate of incorporation, by-laws, exchange rules (including provisions included toaddress SEC concerns) and Delaware law could delay or prevent a change in control of us and entrenchcurrent management.
Our organizational documents place restrictions on the voting rights of certain stockholders. The holders ofour common stock are entitled to one vote per share on all matters to be voted upon by the stockholders exceptthat no person may exercise voting rights in respect of any shares in excess of 5% of the then outstanding sharesof our common stock. Any change to the 5% voting limitation would require SEC approval.
In response to the SEC’s concern about a concentration of our ownership, the rules of our U.S. exchangesinclude a rule prohibiting any member or any person associated with a member of the exchange from beneficiallyowning more than 20% of our outstanding voting interests. SEC consent would be required before any investorcould obtain more than a 20% voting interest in us. The rules of our U.S. exchanges also require the SEC’sapproval of any business ventures with one of our members, subject to exceptions.
36

Our organizational documents contain provisions that may be deemed to have an anti-takeover effect andmay delay, deter or prevent a change of control of us, such as a tender offer or takeover proposal that might resultin a premium over the market price for our common stock. Additionally, certain of these provisions make it moredifficult to bring about a change in the composition of our board of directors, which could result in entrenchmentof current management.
Our certificate of incorporation and by-laws:
• require supermajority stockholder approval to remove directors;
• do not permit stockholders to act by written consent or to call special meetings;
• require certain advance notice for director nominations and actions to be taken at annual meetings;
• require supermajority stockholder approval with respect to certain amendments to our certificate ofincorporation and by-laws (including in respect of the provisions set forth above); and
• authorize the issuance of undesignated preferred stock, or “blank check” preferred stock, which could beissued by our board of directors without stockholder approval.
Section 203 of the Delaware General Corporation Law imposes restrictions on mergers and other businesscombinations between us and any holder of 15% or more (or, in some cases, a holder who previously held 15%or more) of our common stock. In general, Delaware law prohibits a publicly held corporation from engaging in a“business combination” with an “interested stockholder” for three years after the stockholder becomes aninterested stockholder, unless the corporation’s board of directors and stockholders approve the businesscombination in a prescribed manner.
Item 1B. Unresolved Staff Comments.
None.
Item 2. Properties.
The following is a description of our principal properties.
Location Use
Size(approximate,in square feet) Type of possession
New York, New York Location of MarketSite 25,000 LeaseNew York, New York U.S. headquarters 115,000 Subleased from FINRA with
17,931 square feet leasedback to FINRA
New York, New York General office space 53,000 Subleased to third partiesNew York, New York General office space 48,000 LeasePhiladelphia, Pennsylvania Location of NASDAQ OMX PHLX 94,000 LeaseRockville, Maryland General office space 48,000 LeaseShelton, Connecticut General office space 29,000 LeaseStockholm, Sweden European headquarters 296,000 LeaseLondon, England General office space 71,000 LeaseHelsinki, Finland General office space 19,800 LeaseCopenhagen, Denmark General office space 23,900 Lease
We also maintain local headquarters in each of the other European countries where we operate an exchangeand office space in countries in which we conduct sales and operations, including Armenia, Australia, Belgium,Canada, China, Estonia, France, Germany, Hong Kong, Iceland, India, Italy, Japan, Latvia, Lithuania,Netherlands, Norway, Philippines, Singapore, South Korea and Spain.
37

In addition to the above, we currently lease administrative, sales and disaster preparedness facilities inCalifornia, Colorado, Illinois, Massachusetts, Missouri, Oregon, Texas and Washington, DC.
Generally, our properties are not earmarked for use by a particular segment. Instead, most of our propertiesare used by two or more segments. We believe the facilities we occupy are adequate for the purposes for whichthey are currently used and are well-maintained. As of December 31, 2013, approximately 260,864 square feet ofspace was available for sublease.
Item 3. Legal Proceedings.
As previously disclosed, we became a party to several legal and regulatory proceedings in 2012 and 2013relating to the Facebook IPO that occurred on May 18, 2012. We believe that the legal actions filed againstNASDAQ OMX are without merit and intend to defend them vigorously.
As described in our Annual Report on Form 10-K for the year ended December 31, 2012, we are named as adefendant in a consolidated matter captioned In re Facebook, Inc., IPO Securities and Derivative Litigation,MDL No. 2389 (S.D.N.Y.). On April 30, 2013, lead plaintiffs in the consolidated matter filed a consolidatedamended complaint, naming our Chief Executive Officer and our prior Chief Information Officer as newdefendants in connection with their roles in the Facebook IPO. The amended complaint alleges that each violatedSection 20(a) of the Act and Rule 10b-5, promulgated under the Act. By opinion and order entered December 16,2013, the District Court for the Southern District of New York granted in part and denied in part our motion todismiss the consolidated amended complaint. The court held that the doctrine of self-regulatory organizationimmunity bars plaintiffs’ negligence and securities laws claims to the extent they arise from our decisions not tohalt trading or cancel trades on the day of the Facebook IPO, but not to the extent they arise from the design,promotion, and testing of our technology systems in advance of the IPO. The court also held that the economicloss doctrine does not bar plaintiffs’ negligence claims, and that the consolidated amended complaint pleadsplaintiffs’ securities laws claims sufficiently to withstand a motion to dismiss. We are appealing the ruling on themotion to dismiss to the Second Circuit Court of Appeals.
In our Quarterly Report on Form 10-Q for the period ended March 31, 2013, we identified a demand forarbitration from a member organization seeking indemnification for alleged losses associated with theFacebook IPO. On June 18, 2013, the District Court for the Southern District of New York granted a preliminaryinjunction enjoining the arbitration, and the member organization has appealed the order granting the injunctionto the Second Circuit Court of Appeals.
Also as previously disclosed, the staff of the SEC’s Division of Enforcement conducted an investigationrelating to the systems issues experienced with the Facebook IPO. On May 29, 2013, the Commission acceptedour offer of settlement, resolving this matter. As part of the settlement, our subsidiaries, The NASDAQ StockMarket LLC and NASDAQ Execution Services LLC, agreed to implement several measures aimed at preventingfuture violations of the Act and the rules and regulations promulgated thereunder. We fully implemented andprovided the SEC with a certification of our compliance with these undertakings by December 31, 2013 asagreed. In addition, The NASDAQ Stock Market LLC paid a $10 million penalty to the United States Treasury.
Except as disclosed above and in prior reports filed under the Act, we are not currently a party to anylitigation or proceeding that we believe could have a material adverse effect on our business, consolidatedfinancial condition, or operating results. However, from time to time, we have been threatened with, or named asa defendant in, lawsuits or involved in regulatory proceedings.
Item 4. Mine Safety Disclosures.
Not applicable.
38

Part II
Item 5. Market for Registrant’s Common Equity, Related Stockholder Matters and Issuer Purchases ofEquity Securities.
Market Information
Our common stock has been listed on The NASDAQ Stock Market (formerly The Nasdaq National Market)since February 10, 2005, under the ticker symbol “NDAQ.” From July 1, 2002 through February 9, 2005, ourcommon stock traded on the OTCBB under the symbol “NDAQ.”
The following chart lists the quarterly high and low sales prices for shares of our common stock for fiscalyears 2013 and 2012. These prices are between dealers and do not include retail markups, markdowns or otherfees and commissions and may not represent actual transactions.
High Low
Fiscal 2013Fourth quarter . . . . . . . . . . . . . . . . . . . . . . . . . . . . . . . . . . . . . . . . . . . . . . . . . . $40.64 $31.76Third quarter . . . . . . . . . . . . . . . . . . . . . . . . . . . . . . . . . . . . . . . . . . . . . . . . . . . 34.41 29.51Second quarter . . . . . . . . . . . . . . . . . . . . . . . . . . . . . . . . . . . . . . . . . . . . . . . . . . 33.43 27.47First quarter . . . . . . . . . . . . . . . . . . . . . . . . . . . . . . . . . . . . . . . . . . . . . . . . . . . . 32.89 25.27
Fiscal 2012Fourth quarter . . . . . . . . . . . . . . . . . . . . . . . . . . . . . . . . . . . . . . . . . . . . . . . . . . $26.80 $22.63Third quarter . . . . . . . . . . . . . . . . . . . . . . . . . . . . . . . . . . . . . . . . . . . . . . . . . . . 24.50 21.58Second quarter . . . . . . . . . . . . . . . . . . . . . . . . . . . . . . . . . . . . . . . . . . . . . . . . . . 26.12 21.03First quarter . . . . . . . . . . . . . . . . . . . . . . . . . . . . . . . . . . . . . . . . . . . . . . . . . . . . 27.34 24.14
As of February 7, 2014, we had approximately 586 holders of record of our common stock. As ofFebruary 7, 2014, the closing price of our common stock was $37.54.
Dividends
For each quarter in 2013 and for the second, third and fourth quarters of 2012, the Company paid a quarterlycash dividend of $0.13 per share and expects to pay quarterly cash dividends in the future, subject to approval bythe board of directors. There were no dividends declared or paid during the first quarter of 2012. Our creditfacilities allow us to pay cash dividends on our common stock as long as certain leverage ratios are maintained.
Issuer Purchases of Equity Securities
Share Repurchase Programs
In the third quarter of 2012, our board of directors authorized the repurchase of up to $300 million of ouroutstanding common stock. These purchases may be made from time to time at prevailing market prices in openmarket purchases, privately-negotiated transactions, block purchase techniques or otherwise, as determined byour management. The purchases will be funded from existing cash balances. The share repurchase program maybe suspended, modified or discontinued at any time.
During 2013, we repurchased 321,000 shares of our common stock at an average price of $31.12, for anaggregate purchase price of $10 million. The shares repurchased under the share repurchase program areavailable for general corporate purposes. In April 2013, we announced that the share repurchase program istemporarily suspended. As of December 31, 2013, the remaining amount for share repurchases under theprogram authorized in the third quarter of 2012 was $215 million.
39

Employee Transactions
During the fiscal quarter ended December 31, 2013, we purchased shares from employees in connectionwith the settlement of income tax and related benefit withholding obligations arising from the vesting ofrestricted stock grants.
The table below represents repurchases made by or on behalf of us or any “affiliated purchaser” of ourcommon stock during the fiscal quarter ended December 31, 2013:
Period
(a) TotalNumber of
SharesPurchased
(b) AveragePrice PaidPer Share
(c) Total Number ofShares
Purchased as Partof Publicly Announced
Plans or Programs
(d) Maximum DollarValue of Sharesthat May Yet Be
Purchased Under thePlans or Programs
(in millions)
October 2013Share repurchase program . . . . . . . . . . . . . . . . — $ — — $215Employee transactions . . . . . . . . . . . . . . . . . . . 3,138 $33.06 N/A N/A
November 2013Share repurchase program . . . . . . . . . . . . . . . . — $ — — $215Employee transactions . . . . . . . . . . . . . . . . . . . 2,367 $35.35 N/A N/A
December 2013Share repurchase program . . . . . . . . . . . . . . . . — $ — — $215Employee transactions . . . . . . . . . . . . . . . . . . . 191,128 $39.80 N/A N/A
Total Fiscal Quarter EndedDecember 31, 2013
Share repurchase program . . . . . . . . . . . . . . . . — $ — — $215
Employee transactions . . . . . . . . . . . . . . . . . . . 196,633 $39.64 N/A N/A
40

PERFORMANCE GRAPH
The following graph compares the total return of our common stock to the NASDAQ Composite StockIndex and the Standard & Poor’s, or S&P, 500 Stock Index and a selected peer group for the past five years.
In 2013, we changed our peer group, which is comprised of the following companies, collectively, referredto as the new peer group:
• ASX Limited;
• CBOE Holdings Inc.;
• CME Group Inc.;
• Deutsche Börse AG;
• ICE;
• LSE; and
• TMX Group Limited.
ASX Limited, CBOE Holdings Inc. and TMX Group Limited were added to the new peer group because webelieve the changes result in a peer group that is more comparable to our business. NYSE Euronext was omittedfrom the new peer group since it was acquired by ICE in 2013.
For the year ended December 31, 2012, the peer group was comprised of the following companies,collectively referred to as the old peer group:
• CME Group Inc.;
• Deutsche Börse AG;
• ICE;
• LSE; and
• NYSE Euronext.
41

The figures represented below assume an initial investment of $100 in the common stock or index at theclosing price on December 31, 2008 and the reinvestment of all dividends.
COMPARISON OF 5 YEAR CUMULATIVE TOTAL RETURN*Among The NASDAQ OMX Group, Inc., the S&P 500 Index, the NASDAQ Composite Index,
Old Peer Group, and New Peer Group
The NASDAQ OMX Group, Inc.
NASDAQ Composite
S&P 500
Old Peer Group
New Peer Group
*$100 invested on 12/31/08 in stock or index, including reinvestment of dividends.Fiscal year ending December 31.
Copyright© 2014 S&P, a division of The McGraw-Hill Companies Inc. All rights reserved.
12/1312/1212/08 12/09 12/10 12/11
$0
$50
$100
$150
$200
$250
$300
12/08 12/09 12/10 12/11 12/12 12/13
The NASDAQ OMX Group, Inc. . . . . . . . . . . . . . $100.00 $ 80.21 $ 96.03 $ 99.19 $102.85 $166.40NASDAQ Composite . . . . . . . . . . . . . . . . . . . . . . 100.00 144.88 170.58 171.30 199.99 283.39S&P 500 . . . . . . . . . . . . . . . . . . . . . . . . . . . . . . . . 100.00 126.46 145.51 148.59 172.37 228.19Old Peer Group . . . . . . . . . . . . . . . . . . . . . . . . . . . 100.00 143.14 138.54 116.80 134.02 216.38New Peer Group . . . . . . . . . . . . . . . . . . . . . . . . . . 100.00 143.86 145.25 126.50 145.57 223.25
42

Item 6. Selected Financial Data.
The following table sets forth selected financial data on a historical basis for NASDAQ OMX. Thefollowing information should be read in conjunction with the consolidated financial statements and notes theretoof NASDAQ OMX included elsewhere in this Form 10-K.
Selected Financial Data
Year Ended December 31,
2013(1) 2012(1) 2011(1) 2010(1) 2009
(in millions, except share and per share amounts)
Statements of Income Data:Total revenues(2) . . . . . . . . . . . . . . . . $ 3,211 $ 3,120 $ 3,438 $ 3,197 $ 3,410Cost of revenues(2) . . . . . . . . . . . . . . . (1,316) (1,446) (1,748) (1,675) (1,957)
Revenues less transaction rebates,brokerage, clearance and exchangefees . . . . . . . . . . . . . . . . . . . . . . . . 1,895 1,674 1,690 1,522 1,453
Total operating expenses . . . . . . . . . . 1,207 984 994 891 850Operating income . . . . . . . . . . . . . . . 688 690 696 631 603Net income attributable to NASDAQ
OMX . . . . . . . . . . . . . . . . . . . . . . . 385 352 387 395 266Net income applicable to common
stockholders . . . . . . . . . . . . . . . . . . 385 352 387 394 266Per share information:
Basic earnings per share . . . . . . $ 2.30 $ 2.09 $ 2.20 $ 1.94 $ 1.30
Diluted earnings per share . . . . . $ 2.25 $ 2.04 $ 2.15 $ 1.91 $ 1.25
Cash dividends declared percommon share(3) . . . . . . . . . . $ 0.52 $ 0.39 $ — $ — $ —
Weighted-average common sharesoutstanding for earnings per share:
Basic . . . . . . . . . . . . . . . . . . . . . 166,932,103 168,254,653 176,331,819 202,975,623 204,698,277Diluted . . . . . . . . . . . . . . . . . . . . 171,266,146 172,587,870 180,011,247 206,514,655 214,537,907
December 31,
2013 2012 2011 2010 2009
(in millions)
Balance Sheets Data:Cash and cash equivalents and
financial investments . . . . . . . . . . . $ 587 $ 720 $ 785 $ 568 $ 902Total assets(4)(5)(6) . . . . . . . . . . . . . . . . 12,577 9,132 14,091 16,207 10,722Total long-term liabilities . . . . . . . . . 3,593 2,905 3,067 3,247 2,909Total equity . . . . . . . . . . . . . . . . . . . . 6,184 5,209 4,986 4,729 4,944
(1) We completed several acquisitions during the years ended December 31, 2013, 2012, 2011 and 2010 andincluded the financial results of such acquisitions in our consolidated financial statements from therespective acquisition dates.
(2) We record execution revenues from transactions on a gross basis as revenues and record related expenses ascost of revenues.
(3) The $0.52 cash dividends declared per common share for 2013 reflect a quarterly dividend of $0.13 pershare on our outstanding common stock. The $0.39 cash dividends declared per common share for 2012reflect a quarterly dividend of $0.13 per share on our outstanding common stock in June, September andDecember of 2012.
43

(4) Total assets included resale agreements, at contract value of $3.7 billion at December 31, 2011 and $3.4billion at December 31, 2010. In September 2010, we launched a clearing service for the resale andrepurchase agreement market.
(5) Total assets decreased $5.0 billion at December 31, 2012 as compared to December 31, 2011, primarily dueto our new clearing structure which significantly changed the nature and extent of the risk of loss toNASDAQ OMX Clearing in the event of a member default. As a result, we no longer record derivativepositions or resale and repurchase agreements in the Consolidated Balance Sheet.
(6) Total assets increased $3.4 billion at December 31, 2013 as compared to December 31, 2012, primarily dueto an increase in default funds and margin deposits, reflecting the implementation of our collateralmanagement process for our Nordic Clearing business in 2013, and an increase in goodwill and intangibleassets associated with the acquisitions of the TR Corporate Solutions businesses and eSpeed in 2013.
Item 7. Management’s Discussion and Analysis of Financial Condition and Results of Operations.
The following discussion and analysis of the financial condition and results of operations of NASDAQOMX should be read in conjunction with our consolidated financial statements and related notes included in thisForm 10-K, as well as the discussion under “Item 1A. Risk Factors.”
Business Overview
The NASDAQ OMX Group, Inc. was formed from the combination of the businesses of Nasdaq and OMXAB on February 27, 2008. Under the purchase method of accounting, Nasdaq was treated as the accounting andlegal acquirer in the business combination with OMX AB.
We are a leading global exchange group that delivers trading, clearing, exchange technology, regulatory,securities listing, and public company services across six continents. Our global offerings are diverse and includetrading and clearing across multiple asset classes, market data products, financial indexes, capital formationsolutions, financial services, corporate solutions and market technology products and services. Our technologypowers markets across the globe, supporting derivatives trading, clearing and settlement, cash equity trading,fixed income trading and many other functions.
We completed the following acquisitions during 2010, 2011, 2012 and 2013:
• The assets of North American Energy Credit and Clearing Corp., March 2010;
• A derivatives trading market through the purchase of the remaining business of Nord Pool, May 2010;
• SMARTS, August 2010;
• FTEN, December 2010;
• ZVM, December 2010;
• Glide Technologies, October 2011;
• The business of RapiData, December 2011;
• NOS Clearing, July 2012;
• The index business of Mergent, Inc., including Indxis, December 2012;
• The TR Corporate Solutions businesses, May 2013; and
• eSpeed, June 2013.
These acquisitions have been treated as purchases for accounting purposes, with NASDAQ OMX treated asthe acquirer. We also purchased a 22% equity interest in the European Multilateral Clearing Facility N.V., orEMCF, in January 2009. In December 2013, EMCF merged with EuroCCP, creating EuroCCP N.V., a newcombined clearinghouse. NASDAQ OMX currently has a 25% equity interest in EuroCCP N.V. Additionally, we
44

purchased a 72% ownership interest in BWise in May 2012 and a 25% equity interest in The Order Machine, orTOM, in April 2013. In March 2013, we formed a joint venture with SharesPost creating NPM. The financialresults of these transactions are included in the consolidated financial results beginning on the date of eachacquisition or strategic initiative.
Business Environment
We serve listed companies, market participants and investors by providing derivative, commodities, cashequity, and fixed income markets, thereby facilitating economic growth and corporate entrepreneurship. Weprovide market technology to exchanges, clearing organizations and central securities depositories around theworld. We also offer companies and other organizations access to innovative products and software solutions andservices that increase transparency, mitigate risk, improve board efficiency and facilitate better corporategovernance. In broad terms, our business performance is impacted by a number of drivers includingmacroeconomic events affecting the risk and return of financial assets, investor sentiment, government andprivate sector demands for capital, the regulatory environment for capital markets, and changing technologyparticularly in the financial services industry. Our future revenues and net income will continue to be influencedby a number of domestic and international economic trends including:
• Trading volumes, particularly in U.S. and European derivative and cash equity securities, which aredriven primarily by overall macroeconomic conditions;
• The number of companies seeking equity financing, which is affected by factors such as investordemand, the global economy, availability of diverse sources of financing as well as tax and regulatorypolicies;
• The demand for information about, or access to, our markets, which is dependent on the products wetrade, our importance as a liquidity center, and the quality and pricing of our data and access services;
• The demand by companies and other organizations for the products sold by our Corporate Solutionsbusiness, which is largely driven by the overall state of the economy and the attractiveness of ourofferings;
• The demand for licensed exchange traded products and other financial products based on our indices aswell as changes to the underlying assets associated with existing licensed financial products;
• The challenges created by the automation of market data consumption, including competition and thequickly evolving nature of the market data business;
• The outlook of our technology customers for capital market activity;
• Continuing pressure in transaction fee pricing due to intense competition in the U.S. and Europe;
• Competition for listings and trading related to pricing, product features and service offerings;
• Regulatory changes imposed upon certain types of instruments, transactions, or capital marketparticipants; and
• Technological advancements and customers’ demand for speed, efficiency, and reliability.
Currently our business drivers are defined by investors’ and companies’ cautiously optimistic outlook aboutthe pace of global economic recovery. Although some major market indices reached record levels in 2013,European equity markets have not performed as well and remain below their pre-financial crisis highs. As theglobal economy continues to avoid the intermittent crisis environments of 2010 through 2012, we areexperiencing modest growth in many of our non-transactional businesses. Since a number of significantstructural issues continue to confront the global economy, instability could return at any time, resulting in anincreased level of market volatility, oscillating trading volumes, and a return of market uncertainty. In contrast,
45

many of the largest customers of our transactional businesses continue to adapt their business models as theyaddress the implementation of regulatory changes initiated following the global financial crisis, leading to lowertrading volumes. In 2013, the U.S. and European cash equity trading businesses and the European derivativetrading and clearing business experienced a decrease in volumes due to lower overall industry trading volumes.Steady performances by major stock market indices and consistently low volatility throughout 2013 helped toboost the U.S. IPO market. Additional impacts on our business drivers included the international enactment andimplementation of new legislative and regulatory initiatives, and the continued rapid evolution and deploymentof new technology in the financial services industry. The business environment that influenced our financialperformance for 2013 may be characterized as follows:
• A strong pace of new equity issuance in the U.S. in 2013 with 126 IPOs on The NASDAQ StockMarket, up from 72 in 2012. IPO activity improved in the Nordics with 14 IPOs in 2013 compared to sixIPOs in 2012 on the exchanges that comprise NASDAQ OMX Nordic and NASDAQ OMX Baltic;
• Average daily matched equity options volume for our three U.S. options exchanges increased 3.3% in2013 compared to 2012, while overall average daily U.S. options volume increased 0.7%. The increasein our average daily matched options volume was driven by an increase in our combined matchedmarket share for our three U.S. options exchanges of 0.7 percentage points as well as a slight increase inoverall U.S. options volume;
• Average daily matched share volume for all of our U.S. cash equity markets decreased by 13.1%, whileaverage daily U.S. share volume fell by 3.9% relative to 2012. Volatility, often a driver of volumelevels, was lower in 2013 than 2012. Losses in matched share volume were due to both lower U.S.consolidated volume and a decrease in matched market share from 20.8% in 2012 (NASDAQ 17.0%;NASDAQ OMX BX 2.7%; NASDAQ OMX PSX 1.1%) to 18.8% in 2013 (NASDAQ 15.6%;NASDAQ OMX BX 2.5%; NASDAQ OMX PSX 0.7%);
• Continuous cost focus in the industry has further increased the growth of our NASDAQ Basic product,which is a low cost alternative to the consolidated tape. The number of NASDAQ Basic subscribersincreased 128% in 2013 compared to 2012;
• An increase in Information Services revenues of 8.9% in 2013 relative to 2012, primarily due toincreases in both U.S. market data products and index licensing and services revenues;
• A 4.4% decrease relative to 2012 in the average daily number of cash equity trades on our Nordic andBaltic exchanges;
• A 6.9% increase relative to 2012 in the SEK value of cash equity transactions on our Nordic and Balticexchanges;
• A decline of 1.0% experienced by our Nordic and Baltic exchanges relative to 2012 in the number oftraded and cleared options, futures and fixed-income contracts (excluding Finnish option contractstraded on Eurex);
• Intense competition among U.S. exchanges and dealer-owned systems for trading volume and strongcompetition between multilateral trading facilities and exchanges in Europe for trading volume;
• Globalization of exchanges, customers and competitors extending the competitive horizon beyondnational markets; and
• Market trends requiring continued investment in technology to meet customers’ demands for speed,capacity, and reliability as markets adapt to a global financial industry, as increasing numbers of newcompanies are created, and as emerging countries show ongoing interest in developing their financialmarkets.
46

Financial Summary
The following table summarizes our financial performance for the year ended December 31, 2013 whencompared with the same period in 2012. The comparability of our results of operations between reported periodsis impacted by the acquisitions of eSpeed on June 28, 2013 and the TR Corporate Solutions businesses onMay 31, 2013. See “Acquisition of eSpeed for Trading of U.S. Treasuries” and “Acquisition of the InvestorRelations, Public Relations and Multimedia Solutions Businesses of Thomson Reuters,” of Note 4, “Acquisitionsand Divestiture,” to the consolidated financial statements for further discussion.
Year Ended December 31,
Percentage Change2013 2012
(in millions)
Revenues less transaction rebates, brokerage, clearanceand exchange fees . . . . . . . . . . . . . . . . . . . . . . . . . . . . . $1,895 $1,674 13.2%
Operating expenses . . . . . . . . . . . . . . . . . . . . . . . . . . . . . . 1,207 984 22.7%Operating income . . . . . . . . . . . . . . . . . . . . . . . . . . . . . . . 688 690 (0.3)%Interest expense . . . . . . . . . . . . . . . . . . . . . . . . . . . . . . . . . (111) (97) 14.4%Gain on sale of investment security . . . . . . . . . . . . . . . . . 30 — #Asset impairment charges . . . . . . . . . . . . . . . . . . . . . . . . . (14) (40) (65.0)%Loss on divestiture of business . . . . . . . . . . . . . . . . . . . . . — (14) #Income before income taxes . . . . . . . . . . . . . . . . . . . . . . . 600 548 9.5%Income tax provision . . . . . . . . . . . . . . . . . . . . . . . . . . . . . 216 199 8.5%Net income attributable to NASDAQ OMX . . . . . . . . . . . $ 385 $ 352 9.4%Diluted earnings per share . . . . . . . . . . . . . . . . . . . . . . . . $ 2.25 $ 2.04 10.3%
# Denotes a variance greater than 100.0%.
In countries with currencies other than the U.S. dollar, revenues and expenses are translated using monthlyaverage exchange rates. The following discussion of results of operations isolates the impact of year-over-yearforeign currency fluctuations to better measure the comparability of operating results between periods. Operatingresults excluding the impact of foreign currency fluctuations are calculated by translating the current period’sresults by the prior period’s exchange rates.
Impacts associated with fluctuations in foreign currency are discussed in more detail under “Item 7A.Quantitative and Qualitative Disclosures about Market Risk.” For the year ended December 31, 2013,approximately 34.8% of our revenues less transaction rebates, brokerage, clearance and exchange fees and 29.0%of our operating income were derived in currencies other than the U.S. dollar, primarily the Swedish Krona,Euro, Norwegian Krone, Danish Krone and British Pound.
The following summarizes significant changes in our financial performance for the year endedDecember 31, 2013 when compared with the same period in 2012:
• Revenues less transaction rebates, brokerage, clearance and exchange fees increased $221 million, or13.2%, to $1,895 million in 2013, compared with $1,674 million in 2012, reflecting an operationalincrease of $206 million and a favorable impact from foreign exchange of $15 million. The increase inoperational revenues was primarily due to an:
• increase in Corporate Solutions revenues of $141 million, reflecting higher revenues resulting fromthe acquisition of the TR Corporate Solutions businesses in May 2013;
• increase in fixed income trading revenues less brokerage, clearance and exchange fees of $35million, reflecting the acquisition of eSpeed;
• increase in Market Data Products revenues of $22 million, primarily from U.S. market dataproducts;
47

• increase in Market Technology revenues of $20 million, primarily from higher change request andadvisory revenues and software as a service revenues; and
• increase in Index Licensing and Services revenues of $11 million, partially offset by a;
• decrease in cash equity trading revenues less transaction rebates, brokerage, clearance and exchangefees of $22 million.
• Operating expenses increased $223 million, or 22.7%, to $1,207 million in 2013, compared with $984million in 2012, reflecting an operational increase of $214 million and an unfavorable impact fromforeign exchange of $9 million. The increase in operational expenses was primarily due to additionaloverall expense associated with our acquisitions of the TR Corporate Solutions businesses in May 2013and eSpeed in June 2013, our voluntary accommodation program, higher merger and strategic initiativesexpense, and expenses paid with respect to an SEC matter, partially offset by a decrease in restructuringcharges.
• Interest expense increased $14 million, or 14.4%, to $111 million in 2013, compared with $97 million in2012, primarily due to the issuance of our €600 million aggregate principal amount of 3.875% seniorunsecured notes due June 2021, or the 2021 Notes, in June 2013. See “3.875% Senior UnsecuredNotes,” of Note 9, “Debt Obligations,” to the consolidated financial statements for further discussion.
• Gain on sale of investment security of $30 million in 2013 related to the sale of our available-for-saleinvestment security in Dubai Financial Market PJSC, or DFM.
• Asset impairment charges in 2013 of $14 million related to certain acquired intangible assets associatedwith customer relationships ($7 million) and a certain trade name ($7 million). In 2012, assetimpairment charges of $40 million were related to certain acquired intangible assets associated withtechnology ($19 million), customer relationships ($6 million), and a certain trade name ($3 million), aswell as an other-than-temporary impairment charge of $12 million related to our equity interest inEMCF.
• Loss on divestiture of business in 2012 of $14 million related to the sale of International DerivativesClearing Group, LLC, or IDCG. See “2012 Divestiture,” of Note 4, “Acquisitions and Divestiture,” tothe consolidated financial statements for further discussion.
• Income tax provision increased $17 million, or 8.5%, in 2013 compared with 2012, primarily due to theincrease in income before income taxes in 2013 compared with 2012.
These current and prior year items are discussed in more detail below.
Excluding our voluntary accommodation program expense, gain on sale of investment security, merger andstrategic initiatives expense, expenses paid with respect to an SEC matter, asset impairment charges,restructuring charges, loss on divestiture of business and other items that are not reflective of our core businessperformance, net of taxes, non-GAAP consolidated net income attributable to NASDAQ OMX for the year endedDecember 31, 2013 was $445 million, or $2.60 per diluted share, compared with $432 million, or $2.50 perdiluted share, for the year ended December 31, 2012. See “Non-GAAP Financial Measures” below for furtherdiscussion.
2014 Outlook
For the sixth year in a row, more share value traded on The NASDAQ Stock Market than on any othersingle cash equities exchange in the world. The economic environment remained stable in 2013, althoughuncertainty remains throughout the global economy and the debate over future fiscal policy in the U.S. continues.By traditional measures, it was also a difficult year for the exchange business. After reaching an all-time high in2009, U.S. cash equity trading volume fell for a fourth consecutive year. For the last six years, trading volume inthe U.S. and around the world has been driven by volatility associated with the global financial crisis, rather thanthe prospects for economic growth. While the economic view may be that the worst of the financial crisis has
48

passed, robust economic growth has yet to develop. Consequently, NASDAQ OMX has intentionally structuredits organization to account for the highly cyclical nature of our industry. By diversifying our earnings through thesale of Corporate Solutions, Access Services, Market Technology and Market Data products, and by deliveringon cost savings, NASDAQ OMX has been able to provide stable revenues and operating income during thesetough conditions. Should 2014 present an equally difficult environment, we believe our organization is positivelypositioned to compete.
We launched several important initiatives during 2013 that we expect to benefit us during the challengingand competitive economic environment anticipated for 2014. In May 2013, we completed our acquisition of theTR Corporate Solutions businesses, which provide insight, analytics and communications solutions. Thesecomplementary businesses are being integrated into our Corporate Solutions business, which is part of ourTechnology Solutions segment, to create a differentiated client experience through a comprehensive portfolio oftechnology-driven solutions to more than 10,000 clients worldwide. We continue to leverage the opportunities inour Corporate Solutions and Market Technology businesses by offering new products to our expanding customerbase and by strengthening our direct relationships with those customers.
Additionally, in June 2013 we acquired the eSpeed platform, which operates a fully executable central limitorder book for electronic trading in benchmark U.S. Treasuries, one of the largest and most liquid cash marketsin the world, enabling us to enter new markets with a low-cost platform available to both existing and newclients, while creating additional sales opportunities for both our Market Services and Market Data Productsbusinesses.
During 2013, the U.S. IPO market experienced its best year since the 2008 financial crisis. In April 2012,President Obama signed into law the Jumpstart Our Business Startups Act, or JOBS Act, which is intended toencourage companies to seek access to public capital through an IPO. While the long-term effects of the billremain to be seen, the overall increase in IPOs this year compared to 2011 and 2012 may be a positive sign for2014. We expect the demand for public equity capital from companies experiencing the gradual return of globaleconomic growth and the strong broad market returns during 2013 could support a robust IPO market if thesetrends continue. Furthermore, an improved outlook for equity investments and the number of private companiesseeking capital could positively impact the IPO pipeline in 2014.
During 2014, we expect to confront changes in both the competitive and regulatory environments. In November2013, ICE completed its acquisition of NYSE Euronext. ICE has also indicated its intent to spin off Euronext via anIPO. In early 2014, BATS merged with Direct Edge, creating a holding company with four equity platforms thatcurrently execute roughly the same amount of volume as NASDAQ OMX’s three U.S. equity platforms. Thesetransactions have the potential to affect the competitive environment we face in both the U.S. and Europe.
European regulators are currently considering a number of new policies affecting the operation andinfrastructure of the financial markets. The implementation of EMIR is changing the way we structure andoperate the Nordic clearinghouse. We expect the requirements of EMIR to be finalized in 2014. Also, the updateto MiFID II is expected to be completed in 2014 with final implementation by 2016. Finally, our clients areconfronting significant regulatory changes in both the U.S. and Europe as regulations resulting from legislationin the aftermath of the financial crisis are implemented. We expect global markets to continue to be marked bysignificant change in 2014, driven primarily by regulatory initiatives in the U.S. and Europe. These policychanges could result in the continued fragmentation of cash equity markets into additional venues, and tradingcould continue to migrate from exchanges to OTC systems, particularly in the U.S. Conversely, trading in OTCderivatives could begin to move onto exchanges and other execution facilities.
Any further expansion of the global economy in the year ahead may be positive for our business drivers andour operations. We believe that our aggressive steps in meeting our cost, revenue, and technology objectives overthe last three years will enable us to benefit from any improving economic conditions in 2014. We will continueto look for opportunities to further diversify our business with enhanced product offerings and/or acquisitionsthat are complementary to our existing businesses.
49

Business Segments
Since January 1, 2013, we manage, operate and provide our products and services in four businesssegments: Market Services, Listing Services, Information Services and Technology Solutions. All prior periodsegment disclosures have been recast to reflect our change in reportable segments. Certain other prior yearamounts have been reclassified to conform to the current year presentation.
Prior to January 1, 2013, we managed, operated and provided our products and services in three businesssegments: Market Services, Issuer Services and Market Technology.
Our reportable segments are as follows.
Market Services
Our Market Services segment includes our derivative trading and clearing, cash equity trading, fixed incometrading, and access and broker services businesses. We offer trading on multiple exchanges and facilities acrossseveral asset classes, including derivatives, cash equities, debt, commodities, structured products and ETFs. Inaddition, in some of the countries where we operate exchanges, we also provide investment firm, clearing,settlement and central depository services. In addition, eSpeed’s electronic benchmark U.S. Treasury brokerageand co-location service businesses are part of our Market Services segment. See “Acquisition of eSpeed forTrading of U.S. Treasuries,” of Note 4, “Acquisitions and Divestiture,” to the consolidated financial statementsfor further discussion.
Listing Services
Our Listing Services segment includes our U.S. and European Listing Services businesses. We offer capitalraising solutions to over 3,300 companies around the globe representing over $8.0 trillion in total market value asof December 31, 2013.
We operate a variety of listing platforms around the world to provide multiple global capital raisingsolutions for private and public companies. Our main listing markets are The NASDAQ Stock Market and theexchanges that comprise NASDAQ OMX Nordic and NASDAQ OMX Baltic. We offer a consolidated globallisting application to companies to enable them to apply for listing on The NASDAQ Stock Market and theexchanges that comprise NASDAQ OMX Nordic and NASDAQ OMX Baltic, as well as NASDAQ Dubai.
Information Services
Our Information Services segment includes our Market Data Products and our Index Licensing and Servicesbusinesses.
Our Market Data Products business delivers historical and real-time market data to 2.5 million financialprofessionals and individual investors globally. In addition, eSpeed’s market data business is part of ourInformation Services segment. See “Acquisition of eSpeed for Trading of U.S. Treasuries,” of Note 4,“Acquisitions and Divestiture,” to the consolidated financial statements for further discussion.
Our Index Licensing and Services business has been creating innovative and transparent indexes since 1971.As of December 31, 2013, there are over 9,000 structured products based on NASDAQ OMX indexes, spanningdifferent geographies and asset classes with almost $1.5 trillion of notional value.
Technology Solutions
Our Technology Solutions segment includes our Corporate Solutions and Market Technology businesses.
Our Corporate Solutions business provides customer support services, products and programs to customers,including companies listed on our exchanges. Through Corporate Solutions offerings, companies gain access to
50

innovative products and software solutions and services that ease transparency, mitigate risk, improve boardefficiency and facilitate better corporate governance. In May 2013, we acquired the TR Corporate Solutionsbusinesses. See “Acquisition of the Investor Relations, Public Relations and Multimedia Solutions Businesses ofThomson Reuters,” of Note 4, “Acquisitions and Divestiture,” to the consolidated financial statements for furtherdiscussion. With the acquisition of the TR Corporate Solutions businesses, Corporate Solutions revenuesprimarily include subscription and transaction-based income from products in the following key areas:Governance, Investor Relations, Multimedia Solutions and Public Relations businesses.
Our Market Technology business is a leading global technology solutions provider and partner toexchanges, clearing organizations and central securities depositories. Our technology business is also the saleschannel for our complete global offering to other marketplaces.
Market Technology provides technology solutions for trading, clearing, settlement, surveillance andinformation dissemination to markets with wide-ranging requirements, from the leading markets in the U.S.,Europe and Asia to smaller African markets. Our solutions can handle a wide array of assets including cashequities, currencies, various interest-bearing securities, commodities, energy products and derivatives. MarketTechnology also provides governance, risk and compliance software solutions.
Our management allocates resources, assesses performance and manages these businesses as four separatesegments. See Note 19, “Business Segments,” to the consolidated financial statements for further discussion.
Sources of Revenues and Cost of Revenues
Market Services Revenues
Derivative Trading and Clearing Revenues
U.S. Derivative Trading and Clearing
U.S. derivative trading and clearing revenues are variable, based on traded and cleared volumes, andrecognized when executed or when contacts are cleared. The principal types of derivative contracts traded on ourU.S. options exchanges are equity options, ETF options, index options and currency options. In the U.S., werecord execution revenues from transactions on a gross basis as revenues and record related expenses as cost ofrevenues.
For U.S. derivative trading, we credit a portion of the per share execution charge to the market participantthat provides the liquidity and record the transaction rebate as a cost of revenues in the Consolidated Statementsof Income. These transaction rebates are paid on a monthly basis and the amounts due are included in accountspayable and accrued expenses in the Consolidated Balance Sheets.
Also, we pay Section 31 fees to the SEC for supervision and regulation of securities markets. We pass thesecosts along to our customers through our derivative trading and clearing fees. We collect the fees as a pass-through charge from organizations executing eligible trades on our options exchanges and we recognize theseamounts in U.S. derivative trading and clearing cost of revenues when incurred. Section 31 fees received areincluded in cash and cash equivalents in the Consolidated Balance Sheets at the time of receipt and, as requiredby law, the amount due to the SEC is remitted semiannually and recorded as Section 31 fees payable to the SECin the Consolidated Balance Sheets until paid. Since the amount recorded as revenues is equal to the amountrecorded as cost of revenues, there is no impact on our revenues less transaction rebates, brokerage, clearanceand exchange fees. As we hold the cash received until payment to the SEC, we earn interest income on therelated cash balances.
European Derivative Trading and Clearing
European derivative trading and clearing revenues are variable, based on the volume and value of traded andcleared contracts, and recognized when executed or when contracts are cleared. The principal types of derivativecontracts traded and cleared are stock options and futures, index options and futures, international power
51

derivatives, carbon and other commodity products, and fixed-income options and futures. We also generateclearing revenues for OTC traded derivatives for the freight market and seafood derivatives market, interest rateswaps, and resale and repurchase agreements. These clearing revenues are based on the value and length of thecontract and are recognized when cleared. In addition, NASDAQ OMX Commodities members are billed anannual fee which is recognized ratably over the following 12-month period.
NASDAQ OMX Commodities and the exchanges that comprise NASDAQ OMX Nordic and NASDAQOMX Baltic do not have any revenue sharing agreements or cost of revenues, such as transaction rebates andbrokerage, clearance and exchange fees.
Cash Equity Trading Revenues
U.S. Cash Equity Trading
U.S. cash equity trading revenues are variable, based on individual customer share volumes, and recognizedas transactions occur. We charge transaction fees for executing cash equity trades in NASDAQ-listed and otherlisted securities on our U.S. cash equity exchanges, as well as on orders that are routed to other market venues forexecution. Similar to U.S. derivative trading and clearing, we record cash equity trading revenues fromtransactions on a gross basis as revenues and record related expenses as cost of revenues, as we have certain riskassociated with trade execution. For further discussion see “U.S. Derivative Trading and Clearing” above.
For The NASDAQ Stock Market and NASDAQ OMX PSX, we credit a portion of the per share executioncharge to the market participant that provides the liquidity and for NASDAQ OMX BX, we credit a portion ofthe per share execution charge to the market participant that takes the liquidity. We record these credits astransaction rebates that are included in cost of revenues in the Consolidated Statements of Income. Thesetransaction rebates are paid on a monthly basis and the amounts due are included in accounts payable andaccrued expenses in the Consolidated Balance Sheets.
As discussed under U.S. derivative trading and clearing, we also pay Section 31 fees to the SEC forsupervision and regulation of securities markets. We pass these costs along to our customers through our cashequity trading fees. We collect the fees as a pass-through charge from organizations executing eligible trades onour cash equity platforms and we recognize these amounts in cost of revenues when incurred.
European Cash Equity Trading
We charge transaction fees for executing trades on the exchanges that comprise NASDAQ OMX Nordic andNASDAQ OMX Baltic. These transaction fees are charged per executed order and as per value traded.
The exchanges that comprise NASDAQ OMX Nordic and NASDAQ OMX Baltic do not have any revenuesharing agreements or cost of revenues, such as transaction rebates and brokerage, clearance and exchange fees.
Fixed Income Trading Revenues
We operate eSpeed, an electronic trading platform for U.S. Treasuries. The electronic trading platformprovides real-time institutional trading of benchmark U.S. Treasury securities. Customer contracts may be on afixed or variable rate basis. Revenues from customers with a fixed rate basis are recognized ratably over thecontract period. Revenues from customers with a variable rate basis are based upon individual customer sharevolume and are recognized as revenues as the transaction occurs.
Access and Broker Services Revenues
Access Services
We generate revenues by providing market participants with several alternatives for accessing our marketsfor a fee. The type of connectivity is determined by the level of functionality a customer needs. As a result,
52

Access Services revenues vary depending on the type of connection provided to customers. We provide co-location services to market participants whereby firms may lease space for equipment within our data center.These participants are charged monthly fees for cabinet space, connectivity and support. We also earn revenuesfrom annual and monthly exchange membership and registration fees. Revenues for providing access to ourmarkets, co-location services and revenues for monthly exchange membership and registration fees arerecognized on a monthly basis as the service is provided. Revenues from annual fees for exchange membershipand registration fees are recognized ratably over the following 12-month period.
Access Services revenues also include revenues from the RTRM solutions we provide to the financialsecurities market. As a market leader in RTRM, we provide broker-dealers and their clients the ability to managerisk more effectively in real-time, which leads to better utilization of capital as well as improved regulatorycompliance. Revenues for these services are primarily based on subscription agreements with customers. Mostcontracts include professional services, implementation fees, monthly subscription fees from customers accessingon-demand services, and customer support. Implementation fees are recognized upon completion of theimplementation. Monthly professional services, subscription, and usage fees are recognized in the month theservice is provided.
Broker Services
Our Broker Services operations offer technology and customized securities administration solutions tofinancial participants in the Nordic markets. The primary services offered are flexible back-office systems whichallow customers to entirely or partly outsource their company’s back-office functions. Revenues from brokerservices are based on a fixed basic fee for administration or licensing, maintenance and operations, and a variableportion that depends on the number of transactions completed. Broker Services revenues are recognized on acontinuous basis as services are rendered.
Listing Services Revenues
U.S. Listing Services Revenues
Listing Services revenues in the U.S. include annual renewal fees, listing of additional shares fees and initiallisting fees. Annual renewal fees are recognized ratably over the following 12-month period. Listing of additionalshares fees and initial listing fees are recognized on a straight-line basis over estimated service periods, which arefour and six years, respectively, based on our historical listing experience and projected future listing duration.
European Listing Services Revenues
European listing fees, which are comprised of revenues derived from annual fees received from companieslisted on our Nordic and Baltic exchanges and NASDAQ OMX First North, are directly related to the listedcompanies’ market capitalization on a trailing 12-month basis. These revenues are recognized ratably over thefollowing 12-month period.
Information Services Revenues
Market Data Products Revenues
Market Data Products revenues are earned from U.S. and European proprietary market data products andindex data products. In the U.S., we also earn revenues from U.S. tape plans.
U.S. Market Data Products
We collect and process information and earn revenues as a distributor of our own data and select third-partycontent. We provide varying levels of quote and trade information to market participants and to data distributors,who in turn sell subscriptions for this information to the public. We earn revenues primarily based on the number
53

of data subscribers and distributors of our data. U.S. Market Data revenues are recognized on a monthly basis.These revenues, which are subscription based, are recorded net of amounts due under revenue sharingarrangements with market participants.
Revenues from U.S. tape plans include eligible UTP Plan revenues that are shared among UTP Planparticipants and are presented on a net basis. Under the revenue sharing provision of the UTP Plan, we arepermitted to deduct costs associated with acting as the exclusive Securities Information Processor from the totalamount of tape revenues collected. After these costs are deducted from the tape revenues, we distribute to therespective UTP Plan participants, including The NASDAQ Stock Market, NASDAQ OMX BX and NASDAQOMX PSX, their share of tape revenues based on a formula, required by Regulation NMS, that takes into accountboth trading and quoting activity. In addition, all quotes and trades in NYSE- and NYSE MKT-listed securitiesare reported and disseminated in real time, and as such, we share in the tape revenues for information on NYSE-and NYSE MKT-listed securities. Revenues from net U.S. tape plans are recognized on a monthly basis.
European Market Data Products
European Market Data Products revenues are based on the trading information from the exchanges thatcomprise NASDAQ OMX Nordic and NASDAQ OMX Baltic, as well as NASDAQ OMX Commodities, for thefollowing classes of securities: cash equities, bonds, derivatives and commodities. We provide varying levels ofquote and trade information to market participants and to data distributors, who in turn provide subscriptions forthis information. Revenues from European market data are subscription-based, are generated primarily based onthe number of data subscribers and distributors of our data and are recognized on a monthly basis.
Market Data Products Revenue Sharing
The most significant component of Market Data Products revenues presented on a net basis is the UTP Planrevenue sharing in the U.S. All indicators of gross vs. net reporting under U.S. GAAP have been considered inanalyzing the appropriate presentation of UTP Plan revenue sharing. However, the following are the primaryindicators of net reporting:
• Primary Obligor: We are the Securities Information Processor for the UTP Plan, in addition to being aparticipant in the UTP Plan. In our unique role as Securities Information Processor, we facilitate thecollection and dissemination of revenues on behalf of the UTP Plan participants. As a participant, weshare in the net distribution of revenues according to the plan on the same terms as all other planparticipants.
• Risk of Loss/Credit Risk: Risk of loss on the revenue is shared equally among plan participantsaccording to the UTP Plan.
• Price Latitude: The operating committee of the UTP Plan, which is comprised of representatives fromeach of the participants, including us solely in our capacity as a UTP Plan participant, is responsible forsetting the level of fees to be paid by distributors and subscribers and taking action in accordance withthe provisions of the UTP Plan, subject to SEC approval.
The exchanges that comprise NASDAQ OMX Nordic and NASDAQ OMX Baltic do not have any marketdata revenue sharing agreements.
Index Data Products
Index Data Products revenues are generated from our NASDAQ OMX indexes and consist of Global IndexData Services, which deliver real time index values throughout the trading day, and Global Index Watch, whichdelivers weightings and components data, corporate actions and a breadth of additional data. We earn revenuesprimarily based on the number of data subscribers and distributors of our data. These revenues, which aresubscription based, are recognized on a monthly basis.
54

Index Licensing and Services Revenues
We develop and license NASDAQ OMX branded indexes, associated derivatives and financial products aspart of our Global Index Group business. Revenues primarily include license fees from these branded indexes,associated derivatives and financial products in the U.S. and abroad. We also generate revenues by licensing andlisting third-party structured products and third-party sponsored ETFs. We primarily have two types of licenseagreements: transaction-based licenses and asset-based licenses. Transaction-based licenses are generallyrenewable long-term agreements. Customers are charged based on transaction volume or a minimum contractamount, or both. If a customer is charged based on transaction volume, we recognize revenue when thetransaction occurs. If a customer is charged based on a minimum contract amount, we recognize revenue on apro-rata basis over the licensing term. Asset-based licenses are also generally long-term agreements. Customersare charged based on a percentage of assets under management for licensed products, per the agreement, on amonthly or quarterly basis. These revenues are recorded on a monthly or quarterly basis over the term of thelicense agreement.
Technology Solutions Revenues
Corporate Solutions Revenues
Corporate Solutions revenues primarily include subscription and transaction-based income from ourGovernance, Investor Relations, Multimedia Solutions and Public Relations businesses. Subscription-basedrevenues earned by these businesses are recognized ratably over the contract period, generally one to two years inlength. As part of the subscription agreements, customers can also be charged usage fees based upon actual usageof the services provided. Revenues from usage fees and other services are recognized when earned. Revenuesfrom transaction-based services, such as webcasting and wire distribution, are recorded as the services areprovided and delivered.
Market Technology Revenues
Market Technology provides technology solutions for trading, clearing, settlement surveillance andinformation dissemination, as well as governance, risk and compliance solutions. Revenues primarily consist ofsoftware, license and support revenues, change request and advisory revenues, and software as a servicerevenues.
For most solutions, we enter into multiple-element sales arrangements to provide technology solutions andservices to our customers. In order to recognize revenues associated with each individual element of a multiple-element sales arrangement separately, we are required to establish the existence of vendor specific objectiveevidence, or VSOE, of fair value for each element. When VSOE for individual elements of an arrangementcannot be established, revenue is generally deferred and recognized over either the final element of thearrangement or the entire term of the arrangement for which the services will be delivered.
We also enter into revolving subscription agreements which allow customers to connect to our servers toaccess certain services. These revenues are recognized ratably over the subscription term.
Software, License and Support
Software, license and support revenues are derived from the system solutions developed and sold byNASDAQ OMX and are generally entered into in multiple-element sales arrangements. After we have developedand sold a system solution, the customer licenses the right to use the software and may require post contractsupport and other services, such as facility management. Facility management revenues are derived whenNASDAQ OMX assumes responsibility for the continuous operation of a system platform for a customer andreceives facility management revenues which can be both fixed and volume-based. Revenues for license, supportand facility management services are generally deferred and recognized over either the final element of the
55

arrangement or the entire term of the arrangement for which the services will be delivered, unless VSOE can beestablished for each element of the contract. We record the deferral of revenue associated with multiple-elementsales arrangements in deferred revenue and non-current deferred revenue and the deferral of costs in other currentassets and other non-current assets in the Consolidated Balance Sheets.
Software, license and support revenues also include delivery project revenues which are derived from theinstallation phase of the system solutions developed and sold by NASDAQ OMX. The majority of our deliveryprojects involve individual adaptations to the specific requirements of the customer, such as those relating tofunctionality and capacity. We may customize our software technology and make significant modifications to thesoftware to meet the needs of our customers, and as such, we account for these arrangements under contractaccounting. Under contract accounting, when VSOE for valuing certain elements of an arrangement cannot beestablished, total revenues, as well as costs incurred, are deferred until the customization and significantmodifications are complete and are then recognized over the post contract support period. We record the deferralof this revenue in deferred revenue and non-current deferred revenue and the deferral of costs in other currentassets and other non-current assets in the Consolidated Balance Sheets.
Change Request and Advisory
Change request and advisory revenues include configuration, customer specific adaptations andmodifications of the system solutions sold by NASDAQ OMX after delivery has occurred. Change request andadvisory revenues are recognized as revenues when earned.
Software As a Service
Software as a service revenues are derived from subscription based arrangements, where customers pay afee to access our servers to access certain services. These services include broker compliance solutions targetingbrokers throughout the world, as well as governance, risk and compliance services.
56

NASDAQ OMX’s Operating Results
Key Drivers
The following table includes key drivers for our Market Services, Listing Services, and TechnologySolutions segments. In evaluating the performance of our business, our senior management closely watches thesekey drivers.
Year Ended December 31,
2013 2012 2011
Market ServicesDerivative Trading and ClearingU.S. Equity OptionsTotal industry average daily volume (in millions) . . . . . . . . . . . . . . . . . . . . . . . 14.8 14.7 16.8NASDAQ OMX PHLX matched market share . . . . . . . . . . . . . . . . . . . . . . . . . 18.2% 21.3% 23.1%The NASDAQ Options Market matched market share . . . . . . . . . . . . . . . . . . . 8.7% 5.5% 4.6%NASDAQ OMX BX Options Market matched market share . . . . . . . . . . . . . . 1.0% 0.4% —
Total market share . . . . . . . . . . . . . . . . . . . . . . . . . . . . . . . . . . . . . . . . . . . . . . . 27.9% 27.2% 27.7%NASDAQ OMX Nordic and NASDAQ OMX BalticAverage Daily Volume:Options, futures and fixed-income contracts . . . . . . . . . . . . . . . . . . . . . . . . . . . 408,820 412,841 458,547Finnish option contracts traded on Eurex . . . . . . . . . . . . . . . . . . . . . . . . . . . . . . 110,286 85,022 99,394NASDAQ OMX CommoditiesPower contracts cleared (TWh)(1) . . . . . . . . . . . . . . . . . . . . . . . . . . . . . . . . . . . . 1,680 1,703 1,747Cash Equity TradingNASDAQ securitiesTotal average daily share volume (in billions) . . . . . . . . . . . . . . . . . . . . . . . . . . 1.76 1.75 2.02Matched market share executed on NASDAQ . . . . . . . . . . . . . . . . . . . . . . . . . 24.5% 25.6% 27.7%Matched market share executed on NASDAQ OMX BX . . . . . . . . . . . . . . . . . 2.5% 2.7% 2.0%Matched market share executed on NASDAQ OMX PSX . . . . . . . . . . . . . . . . 0.7% 1.4% 1.1%Market share reported to the FINRA/NASDAQ Trade Reporting Facility . . . . 36.3% 32.3% 30.9%
Total market share(2) . . . . . . . . . . . . . . . . . . . . . . . . . . . . . . . . . . . . . . . . . . . . . . 64.0% 62.0% 61.7%New York Stock Exchange, or NYSE, securitiesTotal average daily share volume (in billions) . . . . . . . . . . . . . . . . . . . . . . . . . . 3.37 3.64 4.34Matched market share executed on NASDAQ . . . . . . . . . . . . . . . . . . . . . . . . . 11.7% 12.9% 13.4%Matched market share executed on NASDAQ OMX BX . . . . . . . . . . . . . . . . . 2.3% 2.6% 2.2%Matched market share executed on NASDAQ OMX PSX . . . . . . . . . . . . . . . . 0.5% 0.7% 0.7%Market share reported to the FINRA/NASDAQ Trade Reporting Facility . . . . 32.6% 29.8% 27.7%
Total market share(2) . . . . . . . . . . . . . . . . . . . . . . . . . . . . . . . . . . . . . . . . . . . . . . 47.1% 46.0% 44.0%NYSE MKT and regional securitiesTotal average daily share volume (in billions) . . . . . . . . . . . . . . . . . . . . . . . . . . 1.06 1.05 1.47Matched market share executed on NASDAQ . . . . . . . . . . . . . . . . . . . . . . . . . 13.4% 17.0% 18.7%Matched market share executed on NASDAQ OMX BX . . . . . . . . . . . . . . . . . 2.9% 2.8% 1.9%Matched market share executed on NASDAQ OMX PSX . . . . . . . . . . . . . . . . 1.4% 1.9% 1.8%Market share reported to the FINRA/NASDAQ Trade Reporting Facility . . . . 31.7% 29.3% 25.9%
Total market share(2) . . . . . . . . . . . . . . . . . . . . . . . . . . . . . . . . . . . . . . . . . . . . . . 49.4% 51.0% 48.3%Total U.S.-listed securitiesTotal average daily share volume (in billions) . . . . . . . . . . . . . . . . . . . . . . . . . . 6.19 6.44 7.84Matched share volume (in billions) . . . . . . . . . . . . . . . . . . . . . . . . . . . . . . . . . . 292.9 334.1 419.6Matched market share executed on NASDAQ . . . . . . . . . . . . . . . . . . . . . . . . . 15.6% 17.0% 18.1%Matched market share executed on NASDAQ OMX BX . . . . . . . . . . . . . . . . . 2.5% 2.7% 2.1%Matched market share executed on NASDAQ OMX PSX . . . . . . . . . . . . . . . . 0.7% 1.1% 1.0%
Total market share . . . . . . . . . . . . . . . . . . . . . . . . . . . . . . . . . . . . . . . . . . . . . . . 18.8% 20.8% 21.2%NASDAQ OMX Nordic and NASDAQ OMX Baltic securitiesAverage daily number of equity trades . . . . . . . . . . . . . . . . . . . . . . . . . . . . . . . 309,967 324,322 370,295Total average daily value of shares traded (in billions) . . . . . . . . . . . . . . . . . . . $ 4.3 $ 3.9 $ 5.1Total market share . . . . . . . . . . . . . . . . . . . . . . . . . . . . . . . . . . . . . . . . . . . . . . . 68.6% 68.7% 73.1%
57

Year Ended December 31,
2013 2012 2011
Listing ServicesInitial public offerings
NASDAQ . . . . . . . . . . . . . . . . . . . . . . . . . . . . . . . . . . . . . . . . . . . . . . . . . . 126 72 78Exchanges that comprise NASDAQ OMX Nordic and NASDAQ OMX
Baltic . . . . . . . . . . . . . . . . . . . . . . . . . . . . . . . . . . . . . . . . . . . . . . . . . . . 14 6 9New listings
NASDAQ(3) . . . . . . . . . . . . . . . . . . . . . . . . . . . . . . . . . . . . . . . . . . . . . . . . 239 158 151Exchanges that comprise NASDAQ OMX Nordic and NASDAQ OMX
Baltic(4) . . . . . . . . . . . . . . . . . . . . . . . . . . . . . . . . . . . . . . . . . . . . . . . . . . 34 18 34Number of listed companies
NASDAQ(5) . . . . . . . . . . . . . . . . . . . . . . . . . . . . . . . . . . . . . . . . . . . . . . . . 2,637 2,577 2,680Exchanges that comprise NASDAQ OMX Nordic and NASDAQ OMX
Baltic(6) . . . . . . . . . . . . . . . . . . . . . . . . . . . . . . . . . . . . . . . . . . . . . . . . . . 758 754 776Technology SolutionsMarket TechnologyOrder intake (in millions)(7) . . . . . . . . . . . . . . . . . . . . . . . . . . . . . . . . . . . . . . . . $ 322 $ 259 $ 134Total order value (in millions)(8) . . . . . . . . . . . . . . . . . . . . . . . . . . . . . . . . . . . . $ 655 $ 546 $ 458
(1) Primarily transactions executed on Nord Pool and reported for clearing to NASDAQ OMX Commoditiesmeasured by TWh and one thousand metric tons of carbon dioxide (1000 tCO2).
(2) Includes transactions executed on NASDAQ’s, NASDAQ OMX BX’s and NASDAQ OMX PSX’s systemsplus trades reported through the FINRA/NASDAQ TRF.
(3) New listings include IPOs, including those completed on a best efforts basis, issuers that switched fromother listing venues, closed-end funds and separately listed ETFs.
(4) New listings include IPOs and represent companies listed on the exchanges that comprise NASDAQ OMXNordic and NASDAQ OMX Baltic and companies on the alternative markets of NASDAQ OMX FirstNorth.
(5) Number of listed companies for NASDAQ at period end, including separately listed ETFs.(6) Represents companies listed on the exchanges that comprise NASDAQ OMX Nordic and NASDAQ OMX
Baltic and companies on the alternative markets of NASDAQ OMX First North at period end.(7) Total contract value of orders signed during the period.(8) Represents total contract value of signed orders that are yet to be recognized as revenue. Market Technology
deferred revenue as discussed in Note 8, “Deferred Revenue,” to the consolidated financial statements,represents cash payments received that are yet to be recognized as revenue for these signed orders.
58

Segment Operating Results
Of our total 2013 revenues less transaction rebates, brokerage, clearance and exchange fees of $1,895 million,41.0% was from our Market Services segment, 12.0% was from our Listing Services segment, 23.3% was from ourInformation Services segment and 23.7% was from our Technology Solutions segment. Of our total 2012 revenuesless transaction rebates, brokerage, clearance and exchange fees of $1,674 million, 45.4% was from our MarketServices segment, 13.4% was from our Listing Services segment, 24.2% was from our Information Servicessegment and 17.0% was from our Technology Solutions segment. Of our total 2011 revenues less transactionrebates, brokerage, clearance and exchange fees of $1,690 million, 47.6% was from our Market Services segment,14.0% was from our Listing Services segment, 23.1% was from our Information Services segment and 15.3% wasfrom our Technology Solutions segment.
The following table shows our revenues by segment, cost of revenues for our Market Services segment andtotal revenues less transaction rebates, brokerage, clearance and exchange fees:
Year Ended December 31, Percentage Change
2013 2012 2011 2013 vs. 2012 2012 vs. 2011
(in millions)
Market Services . . . . . . . . . . . . . . . . . . . . . . . . . . . . . . . $ 2,092 $ 2,206 $ 2,553 (5.2)% (13.6)%Cost of revenues . . . . . . . . . . . . . . . . . . . . . . . . . . . . . . . (1,316) (1,446) (1,748) (9.0)% (17.3)%
Market Services revenues less transaction rebates,brokerage, clearance and exchange fees . . . . . . . . . . 776 760 805 2.1% (5.6)%
Listing Services . . . . . . . . . . . . . . . . . . . . . . . . . . . . . . . 228 224 236 1.8% (5.1)%Information Services . . . . . . . . . . . . . . . . . . . . . . . . . . . 442 406 391 8.9% 3.8%Technology Solutions . . . . . . . . . . . . . . . . . . . . . . . . . . . 449 284 258 58.1% 10.1%
Total revenues less transaction rebates, brokerage,clearance and exchange fees . . . . . . . . . . . . . . . . . . . $ 1,895 $ 1,674 $ 1,690 13.2% (0.9)%
59

MARKET SERVICES
The following table shows total revenues less transaction rebates, brokerage, clearance and exchange feesfrom our Market Services segment:
Year Ended December 31, Percentage Change
2013 2012 2011 2013 vs. 2012 2012 vs. 2011
(in millions)Market Services Revenues:Derivative Trading and Clearing Revenues:U.S. derivative trading and clearing(1) . . . . . . . . . . . . . . $ 467 $ 458 $ 471 2.0% (2.8)%Cost of revenues:
Transaction rebates . . . . . . . . . . . . . . . . . . . . . . . . . (259) (250) (257) 3.6% (2.7)%Brokerage, clearance and exchange fees(1) . . . . . . . (33) (34) (29) (2.9)% 17.2%
Total U.S. derivative trading and clearing cost ofrevenues . . . . . . . . . . . . . . . . . . . . . . . . . . . . . . . (292) (284) (286) 2.8% (0.7)%
U.S. derivative trading and clearing revenues lesstransaction rebates, brokerage, clearance andexchange fees . . . . . . . . . . . . . . . . . . . . . . . . . . . 175 174 185 0.6% (5.9)%
European derivative trading and clearing . . . . . . . . . . . 118 117 128 0.9% (8.6)%
Total derivative trading and clearing revenuesless transaction rebates, brokerage,clearance and exchange fees . . . . . . . . . . . . . . 293 291 313 0.7% (7.0)%
Cash Equity Trading Revenues:U.S. cash equity trading(2) . . . . . . . . . . . . . . . . . . . . . . . 1,129 1,294 1,617 (12.8)% (20.0)%Cost of revenues:
Transaction rebates . . . . . . . . . . . . . . . . . . . . . . . . . (743) (854) (1,087) (13.0)% (21.4)%Brokerage, clearance and exchange fees(2) . . . . . . . (279) (308) (375) (9.4)% (17.9)%
Total U.S. cash equity cost of revenues . . . . . . . . . (1,022) (1,162) (1,462) (12.0)% (20.5)%
U.S. cash equity trading revenues less transactionrebates, brokerage, clearance and exchangefees . . . . . . . . . . . . . . . . . . . . . . . . . . . . . . . . . . . 107 132 155 (18.9)% (14.8)%
European cash equity trading . . . . . . . . . . . . . . . . . . . . . 86 80 95 7.5% (15.8)%
Total cash equity trading revenues lesstransaction rebates, brokerage, clearanceand exchange fees . . . . . . . . . . . . . . . . . . . . . . . 193 212 250 (9.0)% (15.2)%
Fixed Income Trading Revenues:Fixed income trading . . . . . . . . . . . . . . . . . . . . . . . . . . . 37 — — # —Cost of revenues:
Brokerage, clearance and exchange fees . . . . . . . . (2) — — # —
Total fixed income trading revenues lessbrokerage, clearance and exchange fees . . . . 35 — — # —
Access and Broker Services Revenues . . . . . . . . . . . . 255 257 242 (0.8)% 6.2%
Total Market Services revenues lesstransaction rebates, brokerage,clearance and exchange fees . . . . . . . . . . $ 776 $ 760 $ 805 2.1% (5.6)%
# Denotes a variance greater than 100.0%.(1) Includes Section 31 fees of $27 million in 2013, $32 million in 2012 and $26 million in 2011. Section 31
fees are recorded as U.S. derivative trading and clearing revenues with a corresponding amount recorded incost of revenues.
60

(2) Includes Section 31 fees of $243 million in 2013, $277 million in 2012 and $304 million in 2011. Section 31fees are recorded as U.S. cash equity trading revenues with a corresponding amount recorded in cost ofrevenues.
Market Services
Market Services revenues less transaction rebates, brokerage, clearance and exchange fees increased in 2013compared with 2012 and decreased in 2012 compared with 2011. The increase in 2013 was primarily due toadditional revenues less brokerage, clearance and exchange fees from our fixed income trading business whichwe acquired in June 2013 and a favorable impact from foreign exchange of $6 million, partially offset by adecline in cash equity trading revenues less brokerage, clearance and exchange fees. The decrease in 2012 wasprimarily due to a decline in cash equity trading revenues less transaction rebates, brokerage, clearance, andexchange fees, a decline in derivative trading and clearing revenues less transaction rebates, brokerage, clearanceand exchange fees, and an unfavorable impact from foreign exchange of $12 million. Partially offsetting thedecrease was an increase in Access Services revenues.
U.S. Derivative Trading and Clearing Revenues
Both the U.S. derivative trading and clearing revenues and revenues less transaction rebates, brokerage,clearance and exchange fees increased in 2013 compared to 2012 and decreased in 2012 compared to 2011. Theincreases in 2013 were primarily due to an overall increase in our market share due to the mix of our marketshare between our three U.S. options exchanges and slightly higher industry trading volumes. The increase inU.S. derivative trading revenues was partially offset by a decrease in Section 31 pass-through fee revenue. Thedecreases in 2012 were primarily due to declines in industry trading volumes and declines in market share on theNASDAQ OMX PHLX market, partially offset by increases in revenue capture per traded contract, increases inmarket share on the NASDAQ Options Market and the inclusion of the NASDAQ OMX BX Options market,launched in June 2012.
Section 31 fees are recorded as derivative trading and clearing revenues with a corresponding amountrecorded as cost of revenues. We are assessed these fees from the SEC and pass them through to our customers inthe form of incremental fees. Since the amount recorded as revenues is equal to the amount recorded as cost ofrevenues, there is no impact on our revenues less transaction rebates, brokerage, clearance and exchange fees.Section 31 fees were $27 million in 2013, $32 million in 2012 and $26 million in 2011. The decrease in 2013compared to 2012 was primarily due to lower pass-through fee rates. The increase in 2012 compared to 2011 wasprimarily due to higher pass-through fee rates, partially offset by a decrease in industry trading volumes.
Transaction rebates, in which we credit a portion of the per share execution charge to the market participant,increased in 2013 compared to 2012 and decreased in 2012 compared with 2011. The increase in 2013 wasprimarily due to an overall increase in our combined market share and slightly higher industry trading volumes.The decrease in 2012 was primarily due to a decrease in industry trading volumes and a decrease in market share,partially offset by an increase in overall rebate capture rates.
Brokerage, clearance and exchange fees decreased in 2013 compared with 2012 and increased in 2012compared with 2011. The decrease in 2013 was primarily due to lower Section 31 pass-through fees partiallyoffset by an increase in routing costs. The increase in 2012 was primarily due to an increase in Section 31 pass-through fees.
61

European Derivative Trading and Clearing Revenues
The following table shows revenues from European derivative trading and clearing:
Year Ended December 31, Percentage Change
2013 2012 2011 2013 vs. 2012 2012 vs. 2011
(in millions)
European Derivative Trading and Clearing Revenues:Options and futures contracts . . . . . . . . . . . . . . . . . . . . . $ 45 $ 44 $ 55 2.3% (20.0)%Energy, carbon and other commodity products . . . . . . . 51 46 45 10.9% 2.2%Fixed-income products . . . . . . . . . . . . . . . . . . . . . . . . . . 15 22 22 (31.8)% —Other revenues and fees . . . . . . . . . . . . . . . . . . . . . . . . . 7 5 6 40.0% (16.7)%
Total European Derivative Trading andClearing revenues . . . . . . . . . . . . . . . . . . . . . . . $118 $117 $128 0.9% (8.6)%
European derivative trading and clearing revenues increased in 2013 compared with 2012 and decreased in2012 compared with 2011. The increase in 2013 was primarily due to higher revenues in our energy, carbon andother commodity products primarily due to the acquisition of NOS Clearing in July 2012 and a favorable impactfrom foreign exchange of $2 million, partially offset by lower revenues on our fixed-income products primarilydue to the impact of NLX trading incentives. The decrease in 2012 was primarily due to lower trading activity forindex options and futures contracts and an unfavorable impact from foreign exchange of $5 million.
U.S. Cash Equity Trading Revenues
U.S. cash equity trading revenues less transaction rebates, brokerage, clearance and exchange fees decreasedin both 2013 compared to 2012 and 2012 compared with 2011. The decreases were primarily due to declines inindustry trading volumes and declines in our matched market share. The 2012 period also includes income of$11 million from open positions relating to the operations of the exchange.
U.S. cash equity trading revenues decreased in both 2013 compared to 2012 and 2012 compared to 2011.The decreases were primarily due to declines in industry trading volumes and our matched market share, and adecrease in Section 31 pass-through fee revenues.
Similar to U.S. derivative trading and clearing, we record Section 31 fees as U.S. cash equity tradingrevenues with a corresponding amount recorded as cost of revenues. We are assessed these fees from the SECand pass them through to our customers in the form of incremental fees. Since the amount recorded as revenuesis equal to the amount recorded as cost of revenues, there is no impact on our revenues less transaction rebates,brokerage, clearance and exchange fees. Section 31 fees were $243 million in 2013, $277 million in 2012 and$304 million in 2011. The decrease in 2013 compared with 2012 was primarily due to lower dollar volume tradedon the NASDAQ and NASDAQ OMX BX trading systems and lower pass-through fee rates. The decrease in2012 compared with 2011 was primarily due to lower dollar value traded on the NASDAQ and NASDAQ OMXBX trading systems, partially offset by higher pass-through fee rates.
For NASDAQ and NASDAQ OMX PSX, we credit a portion of the per share execution charge to themarket participant that provides the liquidity and for NASDAQ OMX BX, we credit a portion of the per shareexecution charge to the market participant that takes the liquidity. These transaction rebates decreased in both2013 compared with 2012 and 2012 compared with 2011 primarily due to a decline in industry trading volumesand our matched market share.
Brokerage, clearance and exchange fees decreased in both 2013 compared to 2012 and 2012 compared with2011 primarily due to a decrease in Section 31 pass-through fees and a decrease in the amount of volume routedby NASDAQ due to declines in industry trading volumes and our matched market share. Brokerage, clearanceand exchange fees in 2012 also include income of $11 million from open positions relating to the operations ofthe exchange.
62

European Cash Equity Trading Revenues
European cash equity trading revenues include trading revenues from equity products traded on theNASDAQ OMX Nordic and NASDAQ OMX Baltic exchanges. European cash equity trading revenues increasedin 2013 compared to 2012 and decreased in 2012 compared to 2011. The increase in 2013 was primarily due tohigher average value of shares traded, higher average pricing and a favorable impact from foreign exchange of$3 million. The decrease in 2012 was primarily due to a decline in trading activity and an unfavorable impactfrom foreign exchange of $5 million.
Fixed Income Trading Revenues
Fixed income trading revenues less brokerage, clearance and exchange fees includes transaction feesgenerated from our eSpeed electronic benchmark U.S. Treasury trading platform that was acquired on June 28,2013. See “Acquisition of eSpeed for Trading of U.S. Treasuries,” of Note 4, “Acquisitions and Divestiture,” tothe consolidated financial statements for further discussion.
Access and Broker Services Revenues
Access and Broker Services revenues decreased in 2013 compared with 2012 and increased in 2012compared with 2011. The decrease in 2013 was primarily due to declines in customer demand for networkconnectivity services, partially offset by increased revenues from the addition of eSpeed hosting revenues andnew products. The increase in 2012 was primarily due to increased demand for services and revenues from newproducts.
LISTING SERVICES
The following table shows revenues from our Listing Services segment:
Year Ended December 31, Percentage Change
2013 2012 2011 2013 vs. 2012 2012 vs. 2011
(in millions)
Listing Services Revenues:U.S. listing services . . . . . . . . . . . . . . . . . . . . . . . . . . . . $ 173 $ 174 $ 181 (0.6)% (3.9)%European listing services . . . . . . . . . . . . . . . . . . . . . . . . 55 50 55 10.0% (9.1)%
Total Listing Services revenues . . . . . . . . . . . . . $ 228 $ 224 $ 236 1.8% (5.1)%
Listing Services
Listing Services revenues increased in 2013 compared with 2012 and decreased in 2012 compared with2011. The increase in 2013 was due to an increase in European listing services revenues resulting from highermarket capitalization and a favorable impact from foreign exchange of $2 million. The decrease in 2012 was dueto decreases in both U.S. listing services and European listing services revenues. The decrease in U.S. listingservices revenues was primarily due to a decrease in annual renewal revenues resulting from a decline in thenumber of listed companies from 2,680 as of December 31, 2011 to 2,577 as of December 31, 2012. Thedecrease in European listing services revenues was primarily due to an unfavorable impact from foreignexchange of $3 million, as well as a decrease in the number of listed companies from 776 as of December 31,2011 to 754 as of December 31, 2012.
63

INFORMATION SERVICES
The following table shows revenues from our Information Services segment:
Year Ended December 31, Percentage Change
2013 2012 2011 2013 vs. 2012 2012 vs. 2011
(in millions)
Information Services Revenues:Market Data Product Revenues:
U.S. market data products . . . . . . . . . . . . . . . . . . . . . . . $ 264 $ 244 $ 229 8.2% 6.6%European market data products . . . . . . . . . . . . . . . . . . . 77 74 80 4.1% (7.5)%Index data products . . . . . . . . . . . . . . . . . . . . . . . . . . . . 27 25 24 8.0% 4.2%
Total Market Data Products revenues . . . . . . . . . . . 368 343 333 7.3% 3.0%Index Licensing and Services revenues . . . . . . . . . . . . . . . 74 63 58 17.5% 8.6%
Total Information Services revenues . . . . . . . . . $ 442 $ 406 $ 391 8.9% 3.8%
Information Services
Information Services revenues increased in both 2013 compared with 2012 and 2012 compared with 2011primarily due to increases in U.S. market data products and Index Licensing and Services revenues.
U.S. Market Data Products Revenues
U.S. market data products revenues increased in both 2013 compared to 2012 and 2012 compared to 2011.The increase in 2013 was primarily due to an increase in audit collections, higher demand for proprietary dataproducts, pricing changes, and an increase in revenues due to the acquisition of eSpeed which was completed onJune 28, 2013. See “Acquisition of eSpeed for Trading of U.S. Treasuries,” of Note 4, “Acquisitions andDivestiture,” to the consolidated financial statements for further discussion. The increase in 2012 was primarilydue to higher customer demand for proprietary data products and pricing changes.
European Market Data Products Revenues
European market data products revenues increased in 2013 compared with 2012 and decreased in 2012compared with 2011. The increase in 2013 was primarily due to a favorable impact from foreign exchange of$3 million. The decrease in 2012 was primarily due to an unfavorable impact from foreign exchange of$4 million and a decline in user populations.
Index Data Products Revenues
Index data products revenues increased in both 2013 compared with 2012 and 2012 compared with 2011.The increase in 2013 was primarily due to higher audit collections.
Index Licensing and Services Revenues
Index Licensing and Services revenues increased in both 2013 compared with 2012 and 2012 comparedwith 2011. The increase in 2013 was primarily due to our acquisition of the index business of Mergent, Inc.,including Indxis, in December 2012 and an increase in the value of underlying assets associated with NASDAQOMX-licensed ETFs and other financial products due to product growth and newly executed product licenses.The increase in 2012 was primarily due to an increase in the value of underlying assets associated withNASDAQ OMX-licensed ETFs and other financial products due to product growth and newly executed productlicenses, partially offset by lower futures and options volumes.
64
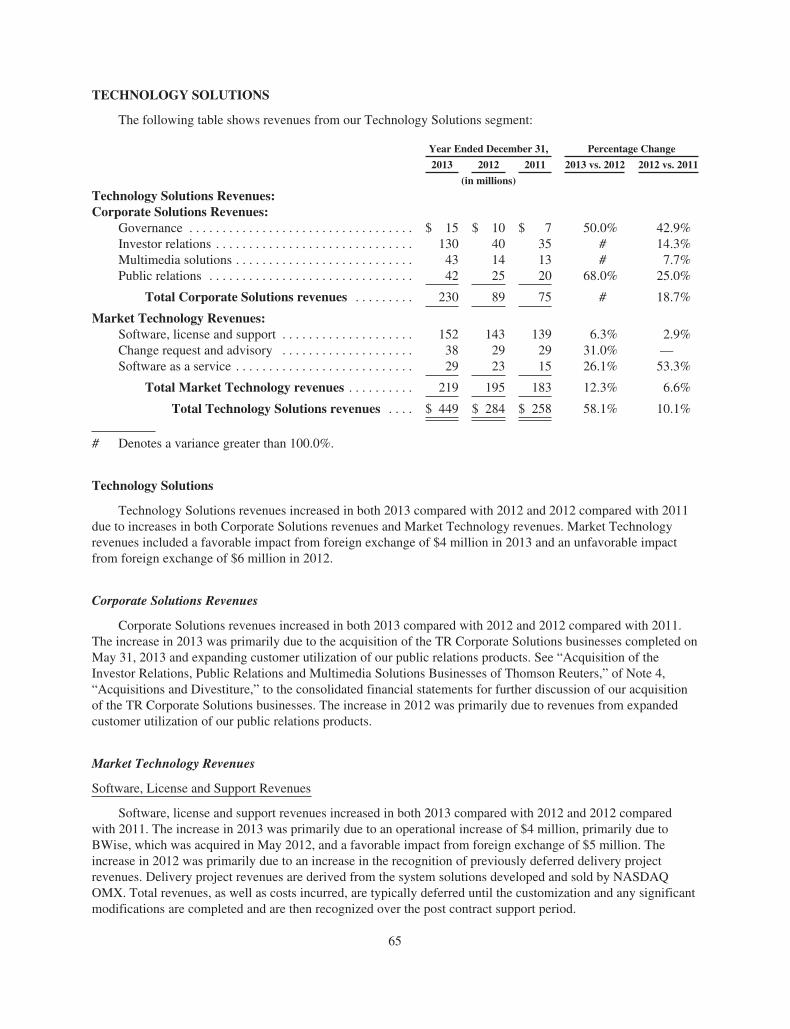
TECHNOLOGY SOLUTIONS
The following table shows revenues from our Technology Solutions segment:
Year Ended December 31, Percentage Change
2013 2012 2011 2013 vs. 2012 2012 vs. 2011
(in millions)
Technology Solutions Revenues:Corporate Solutions Revenues:
Governance . . . . . . . . . . . . . . . . . . . . . . . . . . . . . . . . . . $ 15 $ 10 $ 7 50.0% 42.9%Investor relations . . . . . . . . . . . . . . . . . . . . . . . . . . . . . . 130 40 35 # 14.3%Multimedia solutions . . . . . . . . . . . . . . . . . . . . . . . . . . . 43 14 13 # 7.7%Public relations . . . . . . . . . . . . . . . . . . . . . . . . . . . . . . . 42 25 20 68.0% 25.0%
Total Corporate Solutions revenues . . . . . . . . . 230 89 75 # 18.7%
Market Technology Revenues:Software, license and support . . . . . . . . . . . . . . . . . . . . 152 143 139 6.3% 2.9%Change request and advisory . . . . . . . . . . . . . . . . . . . . 38 29 29 31.0% —Software as a service . . . . . . . . . . . . . . . . . . . . . . . . . . . 29 23 15 26.1% 53.3%
Total Market Technology revenues . . . . . . . . . . 219 195 183 12.3% 6.6%
Total Technology Solutions revenues . . . . $ 449 $ 284 $ 258 58.1% 10.1%
# Denotes a variance greater than 100.0%.
Technology Solutions
Technology Solutions revenues increased in both 2013 compared with 2012 and 2012 compared with 2011due to increases in both Corporate Solutions revenues and Market Technology revenues. Market Technologyrevenues included a favorable impact from foreign exchange of $4 million in 2013 and an unfavorable impactfrom foreign exchange of $6 million in 2012.
Corporate Solutions Revenues
Corporate Solutions revenues increased in both 2013 compared with 2012 and 2012 compared with 2011.The increase in 2013 was primarily due to the acquisition of the TR Corporate Solutions businesses completed onMay 31, 2013 and expanding customer utilization of our public relations products. See “Acquisition of theInvestor Relations, Public Relations and Multimedia Solutions Businesses of Thomson Reuters,” of Note 4,“Acquisitions and Divestiture,” to the consolidated financial statements for further discussion of our acquisitionof the TR Corporate Solutions businesses. The increase in 2012 was primarily due to revenues from expandedcustomer utilization of our public relations products.
Market Technology Revenues
Software, License and Support Revenues
Software, license and support revenues increased in both 2013 compared with 2012 and 2012 comparedwith 2011. The increase in 2013 was primarily due to an operational increase of $4 million, primarily due toBWise, which was acquired in May 2012, and a favorable impact from foreign exchange of $5 million. Theincrease in 2012 was primarily due to an increase in the recognition of previously deferred delivery projectrevenues. Delivery project revenues are derived from the system solutions developed and sold by NASDAQOMX. Total revenues, as well as costs incurred, are typically deferred until the customization and any significantmodifications are completed and are then recognized over the post contract support period.
65

Change Request and Advisory Revenues
Change request and advisory revenues increased in 2013 compared to 2012 and were flat in 2012 comparedwith 2011. The increase in 2013 was primarily due to an increase in advisory revenues from BWise, which wasacquired in May 2012, and an increase in change requests.
Software As a Service Revenues
Software as a service revenues increased in both 2013 compared to 2012 and 2012 compared with 2011. Theincreases were primarily due to an increase in broker compliance revenues reflecting increased customerdemand. The increase in 2013 was partially offset by an unfavorable impact from foreign exchange of $2 million.
Total Order Value
As of December 31, 2013, total order value, which represents the total contract value of orders signed thatare yet to be recognized as revenues, was $655 million. Market Technology deferred revenue, included in thetotal Technology Solutions deferred revenue of $152 million, represents cash payments received that are yet tobe recognized as revenue for these signed orders. See Note 8, “Deferred Revenue,” to the consolidated financialstatements for further discussion. The recognition and timing of these revenues depends on many factors,including those that are not within our control. As such, the following table of Market Technology revenues to berecognized in the future represents our best estimate:
Total Order Value
(in millions)Fiscal year ended:2014 . . . . . . . . . . . . . . . . . . . . . . . . . . . . . . . . . . . . . . . $ 1742015 . . . . . . . . . . . . . . . . . . . . . . . . . . . . . . . . . . . . . . . 1622016 . . . . . . . . . . . . . . . . . . . . . . . . . . . . . . . . . . . . . . . 1172017 . . . . . . . . . . . . . . . . . . . . . . . . . . . . . . . . . . . . . . . 982018 . . . . . . . . . . . . . . . . . . . . . . . . . . . . . . . . . . . . . . . 562019 and thereafter . . . . . . . . . . . . . . . . . . . . . . . . . . . 48
Total . . . . . . . . . . . . . . . . . . . . . . . . . . . . . . . . . . . . . . . $ 655
Expenses
Operating Expenses
The following table shows our operating expenses:
Year Ended December 31, Percentage Change
2013 2012 2011 2013 vs. 2012 2012 vs. 2011
(in millions)Compensation and benefits . . . . . . . . . . . . . . . . . . . . . . . . $ 539 $ 454 $ 458 18.7% (0.9)%Marketing and advertising . . . . . . . . . . . . . . . . . . . . . . . . . 30 26 24 15.4% 8.3%Depreciation and amortization . . . . . . . . . . . . . . . . . . . . . . 122 104 109 17.3% (4.6)%Professional and contract services . . . . . . . . . . . . . . . . . . . 151 107 91 41.1% 17.6%Computer operations and data communications . . . . . . . . 82 60 65 36.7% (7.7)%Occupancy . . . . . . . . . . . . . . . . . . . . . . . . . . . . . . . . . . . . . 98 93 91 5.4% 2.2%Regulatory . . . . . . . . . . . . . . . . . . . . . . . . . . . . . . . . . . . . . 30 34 35 (11.8)% (2.9)%Merger and strategic initiatives . . . . . . . . . . . . . . . . . . . . . 22 4 38 # (89.5)%Restructuring charges . . . . . . . . . . . . . . . . . . . . . . . . . . . . . 9 44 — (79.5)% #General, administrative and other . . . . . . . . . . . . . . . . . . . 80 58 83 37.9% (30.1)%Voluntary accommodation program . . . . . . . . . . . . . . . . . 44 — — # —
Total operating expenses . . . . . . . . . . . . . . . . . . . . . $ 1,207 $ 984 $ 994 22.7% (1.0)%
# Denotes a variance greater than 100.0%.
66

Total operating expenses increased $223 million in 2013 compared with 2012 and decreased $10 million in2012 compared with 2011. The increase in 2013 reflects an operational increase of $214 million and unfavorableimpact from foreign exchange of $9 million. The operational increase in 2013 was primarily due to additionaloverall expense associated with our acquisitions of the TR Corporate Solutions businesses in May 2013 andeSpeed in June 2013, the voluntary accommodation program expense, higher merger and strategic initiativesexpense, and expenses paid with respect to an SEC matter, partially offset by a decrease in restructuring charges.The decrease in 2012 reflects a favorable impact from foreign exchange of $17 million, partially offset by anincrease in operating expenses of $7 million. The operational increase of $7 million in 2012 was primarily due torestructuring actions taken during 2012 and an increase in professional and contract services expense, partiallyoffset by decreases in merger and strategic initiatives expense and general, administrative and other expense.
Compensation and benefits expense increased in 2013 compared with 2012 and decreased in 2012 comparedwith 2011. The increase in 2013 was primarily due to an operational increase of $81 million and an unfavorableimpact from foreign exchange of $4 million. The operational increase primarily reflects additional salary expensedue to our acquisitions of the TR Corporate Solutions businesses in May 2013, eSpeed in June 2013, BWise inMay 2012 and NOS Clearing in July 2012, as well as higher compensation expense reflecting increased financialperformance. Partially offsetting these increases were lower salary costs due to workforce reductions of 257positions across our organization related to restructuring actions beginning in the first quarter of 2012 through thefirst quarter of 2013. The decrease in 2012 was primarily due to a favorable impact from foreign exchange of$8 million and lower compensation expense reflecting reduced financial performance and restructuring activities,partially offset by an increase in salary expense, primarily due to our acquisitions of Glide Technologies inOctober 2011, BWise in May 2012 and NOS Clearing in July 2012. Headcount, including staff employed atconsolidated entities where we have a controlling financial interest, increased to 3,365 employees atDecember 31, 2013 from 2,506 at December 31, 2012 and increased to 2,506 employees at December 31, 2012from 2,433 employees at December 31, 2011. The increased headcount in 2013 compared to 2012 was primarilydue to our acquisitions of the TR Corporate Solutions businesses and eSpeed. The increase in headcount in 2012compared to 2011 was primarily due to our acquisitions of BWise and NOS Clearing, partially offset byworkforce reductions of 226 positions across our organization related to restructuring actions in 2012. SeeNote 3, “Restructuring Charges,” to the consolidated financial statements for a discussion of our restructuringcharges incurred in 2012.
Marketing and advertising expense increased in both 2013 compared with 2012 and 2012 compared with2011. The increase in 2013 was primarily due to increased advertising on behalf of new issuers and the increasein 2012 was primarily due to increased advertising primarily featuring listed issuers.
Depreciation and amortization expense increased in 2013 compared with 2012 and decreased in 2012compared with 2011. The increase in 2013 was primarily due to additional amortization expense associated withacquired intangible assets, primarily relating to our acquisitions of the TR Corporate Solutions businesses in May2013 and eSpeed in June 2013, as well as increased depreciation expense associated with technology assetsplaced in service in 2013. The decrease in 2012 was primarily due to the write-off of certain acquired intangibleassets associated with technology ($19 million), customer relationships ($6 million), and a certain trade name($3 million), the write-off and disposal of leasehold improvements, asset impairments related to restructuringactivities, primarily consisting of fixed assets and capitalized software which have been retired, and a favorableimpact from foreign exchange of $2 million, partially offset by additional depreciation and amortization expenseas a result of our acquisitions, primarily BWise in May 2012.
Professional and contract services expense increased in both 2013 compared with 2012 and 2012 comparedwith 2011. The increase in 2013 was primarily due to revenue-related costs incurred as a result of our acquisitionof the TR Corporate Solutions businesses, costs incurred for special legal expenses, and the launch of newinitiatives. The revenue-related costs are primarily due to the production and delivery of webcast events as wellas other events and services. The increase in 2012 was primarily due to costs incurred for special legal expenses,as well as incremental spending for professional and contract services, partially offset by a favorable impact fromforeign exchange of $2 million.
67

Computer operations and data communications expense increased in 2013 compared with 2012 anddecreased in 2012 compared with 2011. The increase in 2013 was primarily due to additional expense as a resultof our acquisitions of the TR Corporate Solutions businesses in May 2013 and eSpeed in June 2013, as well ashigher communication line costs. The decrease in 2012 was primarily due to a value added tax, or VAT, refundrelating to prior periods and a favorable impact from foreign exchange of $1 million, partially offset byadditional computer operations and data communications expense as a result of our acquisitions, primarily GlideTechnologies in October 2011 and BWise in May 2012.
Occupancy expense increased in both 2013 compared with 2012 and 2012 compared with 2011. Theincrease in 2013 was primarily due to additional costs related to our acquisition of the TR Corporate Solutionsbusinesses. The increase in 2012 was primarily due to additional occupancy expense as a result of ouracquisitions, primarily BWise in May 2012, as well as a $3 million sublease loss reserve charge on space wecurrently occupy due to an increase in net rental costs, partially offset by a favorable impact from foreignexchange of $1 million.
Merger and strategic initiatives expense was $22 million in 2013 compared with $4 million in 2012 and$38 million in 2011. Merger and strategic initiatives expense for 2013 primarily related to our acquisitions of theTR Corporate Solutions businesses and eSpeed, partially offset by a credit of $23 million associated with areceivable under a tax sharing agreement with an unrelated party and the remeasurement of a contingent purchaseprice liability related to the BWise acquisition due to changes in the anticipated performance of BWise. Mergerand strategic initiatives expense for 2012 primarily related to our agreement with Thomson Reuters to acquire itsInvestor Relations, Public Relations and Multimedia Solutions businesses and costs related to other acquisitionsand strategic initiatives, partially offset by a gain on our acquisition of NOS Clearing in July 2012. Merger andstrategic initiatives expense for 2011 primarily related to costs incurred for advisors, bank commitment fees,legal and other professional services related to our joint proposal to acquire NYSE Euronext, as well as costsrelated to our acquisition of Glide Technologies in October 2011.
Restructuring charges were $9 million in 2013 and $44 million in 2012. Our restructuring program wascompleted in the first quarter of 2013. See Note 3, “Restructuring Charges,” to the consolidated financialstatements for a discussion of our restructuring charges recorded during 2013 and 2012.
General, administrative and other expense increased in 2013 compared with 2012 and decreased in 2012compared with 2011. The increase in 2013 was primarily due to expenses paid with respect to an SEC matter of$10 million, additional expenses related to the acquisitions of the TR Corporate Solutions businesses in May2013 and eSpeed in June 2013, the launch of new initiatives, and an unfavorable impact from foreign exchangeof $3 million. For further discussion of the SEC matter, see “Litigation,” of Note 18, “Commitments,Contingencies and Guarantees,” to the consolidated financial statements. The decrease in 2012 was primarily dueto a pre-tax charge recorded in 2011 of $25 million related to the write-off of a portion of the unamortizedbalance of debt issuance costs and debt discount related to the repayment of $335 million of the aggregateprincipal amount outstanding of our 2.50% convertible senior notes due August 15, 2013, or the 2013Convertible Notes, that was completed in October 2011, and a pre-tax charge of $6 million recorded in 2011related to the write-off of the remaining unamortized balance of debt issuance costs related to our $700 millionsenior unsecured term loan facility that was repaid in September 2011. General, administrative and other expenseincluded a favorable impact from foreign exchange of $3 million in 2012.
Voluntary accommodation program expense of $44 million in 2013 relates to the one-time program forvoluntary accommodations to qualifying members of up to $62 million, for which a liability was recorded as theprogram was approved by the SEC in March 2013. This program expanded the pool available to compensatemembers of The NASDAQ Stock Market for qualified losses arising directly from the system issues experiencedwith the Facebook IPO that occurred on May 18, 2012. In October 2013, NASDAQ OMX announced thecompletion of initial review by The Market Regulation Department of FINRA of all claims submitted byqualifying members. Thereafter, NASDAQ OMX informed claimants that FINRA would be conductingadditional analysis with regard to one category of claims. Upon the completion of this additional analysis, the
68

total value of valid submitted claims was determined to be $44 million. NASDAQ OMX submitted to the SEC afiling that provided a report on the administration of the voluntary accommodation program. After the filingbecame effective, our liability was reduced to $44 million and payment of valid claims totaling $44 million wasmade in the fourth quarter of 2013.
Non-operating Income and Expenses
The following table shows our non-operating income and expenses:
Year Ended December 31, Percentage Change
2013 2012 2011 2013 vs. 2012 2012 vs. 2011
(in millions)
Interest income . . . . . . . . . . . . . . . . . . . . . . . . . . . . . . . . . $ 9 $ 10 $ 11 (10.0)% (9.1)%Interest expense . . . . . . . . . . . . . . . . . . . . . . . . . . . . . . . . . (111) (97) (119) 14.4% (18.5)%
Net interest expense . . . . . . . . . . . . . . . . . . . . . . . . . (102) (87) (108) 17.2% (19.4)%Gain on sale of investment security . . . . . . . . . . . . . . . . . 30 — — # —Asset impairment charges . . . . . . . . . . . . . . . . . . . . . . . . . (14) (40) (18) (65.0)% #Dividend and investment income . . . . . . . . . . . . . . . . . . . — — 1 — #Loss on divestiture of business . . . . . . . . . . . . . . . . . . . . . — (14) — # #Net income (loss) from unconsolidated investees . . . . . . . (2) (1) 2 # #
Total non-operating expenses . . . . . . . . . . . . . . . . . . $ (88) $ (142) $ (123) (38.0)% 15.4%
# Denotes a variance equal to or greater than 100.0%.
Total non-operating expenses were $88 million in 2013 compared with $142 million in 2012 and$123 million in 2011. Total non-operating expenses for 2013 primarily include net interest expense of$102 million and asset impairment charges of $14 million, partially offset by a gain on the sale of our available-for-sale investment security in DFM of $30 million. Total non-operating expenses for 2012 primarily include netinterest expense of $87 million, asset impairment charges of $40 million and a loss on divestiture of business of$14 million. Total non-operating expenses for 2011 primarily include net interest expense of $108 million and animpairment charge of $18 million on our available-for-sale investment security in DFM.
Interest Income
Interest income decreased in both 2013 compared with 2012 and 2012 compared with 2011. The decreaseswere primarily due decreases in cash and cash equivalents.
Interest Expense
Interest expense for 2013 was $111 million, and was comprised of $101 million of interest expense,$3 million of non-cash expense associated with accretion of debt discounts, $3 million of non-cash debt issuanceamortization expense, and $4 million of other bank and investment-related fees. Interest expense increased in2013 compared with 2012 primarily due to the issuance of the 2021 Notes in June 2013.
Interest expense for 2012 was $97 million, and was comprised of $86 million of interest expense, $4 millionof non-cash expense associated with accretion of debt discounts, $3 million of non-cash debt issuanceamortization expense, and $4 million of other bank and investment-related fees. Interest expense decreased in2012 compared with 2011 due to lower average outstanding debt obligations in 2012 primarily resulting from theextinguishment of $335 million of our 2013 Convertible Notes in the fourth quarter of 2011, as well as loweraverage interest rates.
See Note 9, “Debt Obligations,” to the consolidated financial statements for further discussion of our debtobligations.
69

Gain on Sale of Investment Security
In the fourth quarter of 2013, we sold an available-for-sale investment security for $48 million and recordeda gain on the sale of $30 million, which is net of costs directly related to the sale, primarily broker fees.
Asset Impairment Charges
Asset impairment charges of $14 million in 2013 relate to non-cash intangible asset impairment chargesrelated to certain acquired intangible assets associated with customer relationships ($7 million) and a certaintrade name ($7 million). See “Intangible Asset Impairment Charges,” of Note 5, “Goodwill and PurchasedIntangible Assets,” to the consolidated financial statements for further discussion.
In the second quarter of 2012, we recorded non-cash intangible asset impairment charges totaling$28 million related to certain acquired intangible assets associated with technology ($19 million), customerrelationships ($6 million) and a certain trade name ($3 million). See “Intangible Asset Impairment Charges,” ofNote 5, “Goodwill and Purchased Intangible Assets,” to the consolidated financial statements for furtherdiscussion. In the first quarter of 2012, we also recorded a non-cash other-than-temporary impairment charge of$12 million related to our equity interest in EMCF. See “Equity Method Investments,” of Note 6, “Investments,”to the consolidated financial statements for further discussion.
In the fourth quarter of 2011, we recorded a non-cash, other-than-temporary impairment charge of$18 million related to our available-for-sale investment security in DFM.
Loss on Divestiture of Businesses
In August 2012, we sold IDCG and recorded a loss of $14 million. See “2012 Divestiture,” of Note 4,“Acquisitions and Divestiture,” for further discussion.
Net Income (Loss) from Unconsolidated Investees
Net loss from unconsolidated investees of $2 million in 2013 and $1 million in 2012 and net income fromconsolidated investees of $2 million in 2011 was related to our share in the earnings and losses of our equitymethod investments.
Tax Matters
NASDAQ OMX’s income tax provision was $216 million in 2013 compared with $199 million in 2012 and$190 million in 2011. The overall effective tax rate was 36.0% in 2013, 36.3% in 2012 and 33.2% in 2011. Thelower effective tax rate in 2013 when compared to 2012 was primarily due to a reversal of a valuation allowanceassociated with our available-for-sale investment security in DFM, a shift in the geographic mix of earnings andlosses, and a reduction in the tax rate in Sweden. In 2013, we also recorded a lower increase in tax expenseassociated with deferred tax assets and liabilities due to the impact of changes in tax rates in various jurisdictionswithin the U.S. and outside the U.S., compared to the impact recorded in 2012. Partially offsetting the decrease intax expense is the derecognition of a previously recognized tax benefit as a result of new information received in2013, as well as expenses associated with investments in certain jurisdictions for which we are not able torecognize a tax benefit. The higher effective tax rate in 2012 when compared to 2011 was primarily due to theimpact to deferred tax assets and deferred tax liabilities resulting from changes in tax rates in variousjurisdictions within the U.S. and outside the U.S., adjustments related to our 2005 – 2011 tax return liabilitieswhich resulted in an increase to the tax provision and a shift in the geographic mix of earnings and losses. Theseincreases are partially offset by a permanent tax benefit associated with certain taxable foreign exchangerevaluation losses which are not reflected in pre-tax earnings.
The effective tax rate may vary from period to period depending on, among other factors, the geographicand business mix of earnings and losses. These same and other factors, including history of pre-tax earnings andlosses, are taken into account in assessing the ability to realize deferred tax assets.
70

In order to recognize and measure our unrecognized tax benefits, management determines whether a taxposition is more likely than not to be sustained upon examination, including resolution of any related appeals orlitigation processes, based on the technical merits of the position. Once it is determined that a position meets therecognition thresholds, the position is measured to determine the amount of benefit to be recognized in theconsolidated financial statements. Interest and/or penalties related to income tax matters are recognized inincome tax expense.
NASDAQ OMX and its eligible subsidiaries file a consolidated U.S. federal income tax return andapplicable state and local income tax returns and non-U.S. income tax returns. Federal income tax returns for theyears 2007 through 2010 are currently under audit by the Internal Revenue Service and we are subject toexamination for 2011 and 2012. Several state tax returns are currently under examination by the respective taxauthorities for the years 2005 through 2010 and we are subject to examination for 2011 and 2012. Non-U.S. taxreturns are subject to examination by the respective tax authorities for the years 2006 through 2012. Weanticipate that the amount of unrecognized tax benefits at December 31, 2013 will significantly decrease in thenext twelve months as we expect to settle certain tax audits. The final outcome of such audits cannot yet bedetermined. We anticipate that such adjustments will not have a material impact on our consolidated financialposition or results of operations.
In the fourth quarter of 2010, we received an appeal from the Finnish Tax Authority challenging certaininterest expense deductions claimed by NASDAQ OMX in Finland for the year 2008. The appeal also demandedcertain penalties be paid with regard to the company’s tax return filing position. In October 2012, the FinnishAppeals Board disagreed with the company’s tax return filing position for years 2009 through 2011, even thoughthe tax return position with respect to this deduction was previously reviewed and approved by the Finnish TaxAuthority. NASDAQ OMX has appealed the ruling by the Finnish Appeals Board to the Finnish AdministrativeCourt. Through December 31, 2013, we have recorded tax benefits of $18 million associated with this filingposition. Of this amount we have paid $12 million to the Finnish tax authorities. We have also paid $11 millionin interest and penalties. In 2014 we will pay $6 million which represents the benefit taken in 2013. We expectthe Finnish Administrative Court to agree with our position and, if so, NASDAQ OMX will receive a refund of$29 million.
From 2009 through 2012, we recorded tax benefits associated with certain interest expense incurred inSweden. Our position is supported by a 2011 ruling we received from the Swedish Supreme AdministrativeCourt. However, under new legislation effective January 1, 2013, limitations are imposed on certain forms ofinterest expense. Since the new legislation is unclear with regards to our ability to continue to claim such interestdeductions, NASDAQ OMX has filed an application for an advance tax ruling with the Swedish Tax Council forAdvance Tax Rulings. We expect to receive a favorable response from the Swedish Tax Council for AdvanceTax Rulings. Since January 1, 2013, we have recorded tax benefits of $16 million, or $0.09 per diluted share,related to this matter. We expect to record recurring quarterly tax benefits of $4 million to $5 million with respectto this issue for the foreseeable future.
In December 2012, the Swedish Tax Agency approved our 2010 amended value added tax, or VAT, taxreturn and we received a cash refund for the amount claimed. In 2013, we filed VAT tax returns for 2011 and2012 and utilized the same approach which was approved for the 2010 filing. However, even though the VATreturn position was previously reviewed and approved by the Swedish Tax Agency, we were informed by theSwedish Tax Agency that our VAT refund claims for 2011 and 2012 are not valid. However, they will not seekreimbursement of the 2010 refund. We will appeal the finding by the Swedish Tax Agency. ThroughDecember 31, 2013, we have recorded benefits of $14 million associated with this position.
Net Loss Attributable to Noncontrolling Interests
Net loss attributable to noncontrolling interests was $1 million in 2013, $3 million in 2012 and $4 million in2011. The losses in 2012 and 2011 were primarily attributable to noncontrolling interests in IDCG.
71

Non-GAAP Financial Measures
In addition to disclosing results determined in accordance with U.S. GAAP, we also have provided non-GAAP net income attributable to NASDAQ OMX and non-GAAP diluted earnings per share. Management usesthis non-GAAP information internally, along with U.S. GAAP information, in evaluating our performance and inmaking financial and operational decisions.
We believe our presentation of these measures provides investors with greater transparency andsupplemental data relating to our financial condition and results of operations. In addition, we believe thepresentation of these measures is useful to investors for period-to-period comparison of results as the itemsdescribed below do not reflect operating performance. These measures are not in accordance with, or analternative to, U.S. GAAP, and may be different from non-GAAP measures used by other companies. Investorsshould not rely on any single financial measure when evaluating our business. We recommend investors reviewthe U.S. GAAP financial measures included in this Annual Report on Form 10-K, including our consolidatedfinancial statements and the notes thereto. When viewed in conjunction with our U.S. GAAP results and theaccompanying reconciliation, we believe these non-GAAP measures provide greater transparency and a morecomplete understanding of factors affecting our business than U.S. GAAP measures alone. Our management usesthese measures to evaluate operating performance, and management decisions during the reporting period aremade by excluding certain items that we believe have less significance on, or do not impact, the day-to-dayperformance of our business. We understand that analysts and investors regularly rely on non-GAAP financialmeasures, such as non-GAAP net income and non-GAAP diluted earnings per share, to assess operatingperformance. We use non-GAAP net income attributable to NASDAQ OMX and non-GAAP diluted earnings pershare because they more clearly highlight trends in our business that may not otherwise be apparent when relyingsolely on U.S. GAAP financial measures, since these measures eliminate from our results specific financial itemsthat have less bearing on our operating performance. Non-GAAP net income attributable to NASDAQ OMX forthe periods presented below is calculated by adjusting net income attributable to NASDAQ OMX for charges orgains related to acquisition and divestiture transactions, integration activities related to acquisitions, othersignificant infrequent charges or gains and their related income tax effects that are not related to our corebusiness. We do not believe these items are representative of our future operating performance since thesecharges were not consistent with our normal operating performance.
Non-GAAP adjustments for the year ended December 31, 2013 primarily related to the following:
(i) voluntary accommodation program expense of $44 million, (ii) gain on sale of investment security of$30 million related to the sale of our available-for-sale investment security in DFM, (iii) merger and strategicinitiatives costs of $22 million reflecting $45 million of merger and strategic initiative costs primarily associatedwith our acquisitions of eSpeed and the TR Corporate Solutions businesses, partially offset by a credit of$23 million associated with a receivable under a tax sharing agreement with an unrelated party—this credit isoffset in item (viii) below, (iv) expenses paid with respect to an SEC matter of $10 million—for furtherdiscussion of the SEC matter, see “Litigation,” of Note 18, “Commitments, Contingencies and Guarantees,” tothe consolidated financial statements, (v) asset impairment charges of $14 million related to certain acquiredintangible assets associated with customer relationships and a certain trade name, (vi) restructuring charges of $9million—for further discussion, see Note 3, “Restructuring Charges,” to the consolidated financial statements,(vii) special legal expense of $3 million, (viii) adjustment to the income tax provision of $17 million to reflectthese non-GAAP adjustments, and (ix) significant tax adjustments, net of $8 million due to the derecognition of apreviously recognized tax benefit and an increase in net deferred tax liabilities resulting from changes in tax ratesin various jurisdictions.
Non-GAAP adjustments for the year ended December 31, 2012 primarily related to the following:
(i) income from open positions relating to the operations of the exchange of $11 million, (ii) merger andstrategic initiatives costs of $4 million related to recent acquisitions and other strategic initiatives, net of gain onacquisition of NOS Clearing, (iii) loss on divestiture of business of $14 million related to the sale of IDCG,(iv) asset impairment charges of $40 million related to certain acquired intangible assets totaling $28 million as
72

well as an other-than-temporary impairment charge related to our equity method interest in EMCF of$12 million, (v) restructuring charges of $44 million related to workforce reductions of $23 million, facilities-related charges of $10 million, asset impairment charges of $9 million and $2 million of other charges,(vi) special legal expense of $7 million, (vii) adjustment to the income tax provision of $32 million to reflectthese non-GAAP adjustments, and (viii) significant tax adjustments, net of $14 million due to the impact todeferred tax assets and deferred tax liabilities resulting from changes in tax rates in various jurisdictions withinthe U.S. and outside the U.S., adjustments related to our 2005 – 2011 tax return liabilities which resulted in anincrease to the tax provision, partially offset by a permanent tax benefit associated with certain taxable foreignexchange revaluation losses which are not reflected in pre-tax earnings.
Non-GAAP adjustments for the year ended December 31, 2011 primarily related to the following:
(i) merger and strategic initiatives costs of $38 million, primarily costs for advisors, bank commitment fees,legal and other professional services, related to our joint proposal to acquire NYSE Euronext, as well as costsrelated to recent acquisitions and other strategic initiatives, (ii) an asset impairment charge of $18 million relatedto our available-for-sale investment security in DFM, (iii) debt extinguishment and refinancing charges of $31million, related to the repayment of the 2013 Convertible Notes and the repayment of our $700 million seniorunsecured term loan facility, (iv) an adjustment to the income tax provision of $28 million to reflect these non-GAAP adjustments, and (v) significant tax adjustments, net of $5 million due to the impact of changes in taxlaws in certain jurisdictions where NASDAQ OMX operates.
The following table represents reconciliations between U.S. GAAP net income and diluted earnings pershare and non-GAAP net income and diluted earnings per share:
Year EndedDecember 31, 2013
Year EndedDecember 31, 2012
Year EndedDecember 31, 2011
NetIncome
DilutedEarnings Per
ShareNet
Income
DilutedEarnings Per
ShareNet
Income
DilutedEarnings Per
Share
(in millions, except share and per share amounts)U.S. GAAP net income attributable to
NASDAQ OMX and diluted earnings pershare . . . . . . . . . . . . . . . . . . . . . . . . . . . . . . . . $385 $ 2.25 $352 $ 2.04 $387 $ 2.15
Non-GAAP adjustments:Income from open positions relating to the
operations of the exchange . . . . . . . . . . . . . — — (11) (0.06) — —Voluntary accommodation program . . . . . . . . 44 0.26 — — — —Gain on sale of investment security . . . . . . . . . (30) (0.18) — — — —Merger and strategic initiatives . . . . . . . . . . . . 22 0.13 4 0.02 38 0.21SEC matter . . . . . . . . . . . . . . . . . . . . . . . . . . . . 10 0.06 — — — —Loss on divestiture of business . . . . . . . . . . . . — — 14 0.08 — —Asset impairment charges . . . . . . . . . . . . . . . . 14 0.08 40 0.23 18 0.10Restructuring charges . . . . . . . . . . . . . . . . . . . 9 0.05 44 0.26 — —Special legal expense . . . . . . . . . . . . . . . . . . . . 3 0.02 7 0.04 — —Extinguishment of debt . . . . . . . . . . . . . . . . . . — — — — 31 0.17Other . . . . . . . . . . . . . . . . . . . . . . . . . . . . . . . . (3) (0.02) — — 4 0.03Adjustment to the income tax provision to
reflect non-GAAP adjustments(1) . . . . . . . . . (17) (0.10) (32) (0.19) (28) (0.16)Significant tax adjustments, net . . . . . . . . . . . . 8 0.05 14 0.08 5 0.03
Total non-GAAP adjustments, net of tax . . 60 0.35 80 0.46 68 0.38
Non-GAAP net income attributable toNASDAQ OMX and diluted earnings pershare . . . . . . . . . . . . . . . . . . . . . . . . . . . . . . . . $445 $ 2.60 $432 $ 2.50 $455 $ 2.53
Weighted-average common shares outstandingfor diluted earnings per share . . . . . . . . . . . . . 171,266,146 172,587,870 180,011,247
73

(1) We determine the tax effect of each item based on the tax rules in the respective jurisdiction where thetransaction occurred.
Liquidity and Capital Resources
While global markets and economic conditions continue to improve from adverse levels experienced duringthe past several years, investors and lenders remain cautious about the pace of the global economic recovery.This lack of confidence in the prospects for growth could result in sporadic increases in market volatility andlackluster trading volumes, which could in turn affect our ability to obtain additional funding from lenders.Currently, our cost and availability of funding remain healthy.
Historically, we have funded our operating activities and met our commitments through cash generated byoperations, augmented by the periodic issuance of our common stock in the capital markets and by issuing debtobligations. In June 2013, NASDAQ OMX issued the 2021 Notes. We used the majority of the net proceeds fromthe offering of the 2021 Notes to fund the cash consideration payable by us for the acquisition of eSpeed andrelated expenses. We used the remaining proceeds from the 2021 Notes for general corporate purposes. As partof the acquisition of eSpeed, NASDAQ OMX has contingent future obligations to issue 992,247 shares ofNASDAQ OMX common stock annually approximating certain tax benefits associated with the transaction of$484 million. Such contingent future issuances of NASDAQ OMX common stock will be paid ratably through2027 if NASDAQ OMX achieves a designated revenue target in each such year. The contingent future issuancesof NASDAQ OMX common stock are subject to anti-dilution protections and acceleration upon certain events.
In addition to these cash sources, we have a $750 million revolving credit commitment (including aswingline facility and letter of credit facility) under our senior unsecured five-year credit facility. In May 2013,we borrowed $50 million under the revolving credit commitment. We used cash on hand and a drawdown fromthe revolving credit commitment to fund the acquisition of the TR Corporate Solutions businesses and relatedexpenses. In the third quarter of 2013, we borrowed an additional $70 million under the revolving creditcommitment and used the proceeds and cash on hand to pay down our 2013 Convertible Notes that matured inAugust 2013. In 2013, we repaid $151 million of the revolving credit commitment. As of December 31, 2013,availability under the revolving credit commitment was $655 million. See “2011 Credit Facility,” of Note 9,“Debt Obligations,” to the consolidated financial statements for further discussion. For further discussion of ouracquisitions of eSpeed and the TR Corporate Solutions businesses, see “Acquisition of eSpeed for Trading ofU.S. Treasuries,” and “Acquisition of the Investor Relations, Public Relations and Multimedia SolutionsBusinesses of Thomson Reuters,” of Note 4, “Acquisitions and Divestiture,” to the consolidated financialstatements.
In the near term, we expect that our operations will provide sufficient cash to fund our operating expenses,capital expenditures, debt repayments, any share repurchases, and any dividends. Working capital (calculated ascurrent assets less current liabilities) was $363 million at December 31, 2013, compared with $474 million atDecember 31, 2012, a decrease of $111 million primarily due to a decline in cash and cash equivalents andfinancial investments at fair value.
Principal factors that could affect the availability of our internally-generated funds include:
• deterioration of our revenues in any of our business segments;
• changes in our working capital requirements; and
• an increase in our expenses.
Principal factors that could affect our ability to obtain cash from external sources include:
• operating covenants contained in our credit facility that limit our total borrowing capacity;
• increases in interest rates applicable to our floating rate loans under our credit facility;
74

• credit rating downgrades, which could limit our access to additional debt;
• a decrease in the market price of our common stock; and
• volatility in the public debt and equity markets.
In connection with an increase in indebtedness to finance the acquisition of eSpeed, S&P affirmed the creditrating of NASDAQ OMX at BBB and NASDAQ OMX Clearing AB at A+ and placed both NASDAQ OMX andNASDAQ OMX Clearing AB on negative outlook. Moody’s affirmed the credit rating of NASDAQ OMX atBaa3.
The following sections discuss the effects of changes in our financial assets, debt obligations, clearing andbroker-dealer net capital requirements, and cash flows on our liquidity and capital resources.
Financial Assets
The following table summarizes our financial assets:
December 31,2013
December 31,2012
(in millions)
Cash and cash equivalents . . . . . . . . . . . . . . . . . . . . . . . . . . . . . $425 $497Restricted cash . . . . . . . . . . . . . . . . . . . . . . . . . . . . . . . . . . . . . . 84 85Non-current restricted cash . . . . . . . . . . . . . . . . . . . . . . . . . . . . — 25Financial investments, at fair value . . . . . . . . . . . . . . . . . . . . . . 162 223
Total financial assets . . . . . . . . . . . . . . . . . . . . . . . . . . . . . . . . . $671 $830
Cash and Cash Equivalents and Restricted Cash
Cash and cash equivalents include cash in banks and all non-restricted highly liquid investments withoriginal maturities of three months or less at the time of purchase. The balance retained in cash and cashequivalents is a function of anticipated or possible short-term cash needs, prevailing interest rates, our investmentpolicy, and alternative investment choices. As of December 31, 2013, our cash and cash equivalents of$425 million were primarily invested in money market funds. In the long-term, we may use both internallygenerated funds and external sources to satisfy our debt obligations and other long-term liabilities. Cash and cashequivalents as of December 31, 2013 decreased $72 million from December 31, 2012 primarily due to net cashused in investing activities, partially offset by net cash provided by operating activities and financing activities.See “Cash Flow Analysis” below for further discussion.
Current restricted cash, which was $84 million as of December 31, 2013 and $85 million as ofDecember 31, 2012, is not available for general use by us due to regulatory and other requirements and isclassified as restricted cash in the Consolidated Balance Sheets. As of December 31, 2013 and December 31,2012, current restricted cash primarily includes cash held for regulatory purposes at NASDAQ OMX Stockholmand NOS Clearing. Non-current restricted cash of $25 million at December 31, 2012 was segregated forNASDAQ OMX Commodities Clearing Company, or NOCC, to improve its liquidity position and was notavailable for general use. As a result of a strategic alliance with Natural Gas Exchange Inc., or NGX, this cashwas no longer needed for liquidity purposes and was released from NOCC. See Note 16, “Clearing Operations,”to the consolidated financial statements for further discussion.
Repatriation of Cash
Our cash and cash equivalents held outside of the U.S. in various foreign subsidiaries totaled $186 millionas of December 31, 2013 and $198 million as of December 31, 2012. The remaining balance held in the U.S.totaled $239 million as of December 31, 2013 and $299 million as of December 31, 2012.
75

Unremitted earnings of subsidiaries outside of the U.S. are used to finance our international operations andare generally considered to be indefinitely reinvested. It is not our current intent to change this position.However, the majority of cash held outside the U.S. is available for repatriation, but under current law, couldsubject us to additional U.S. income taxes, less applicable foreign tax credits.
Share Repurchase Program
In the third quarter of 2012, our board of directors authorized the repurchase of up to $300 million of ouroutstanding common stock. These purchases may be made from time to time at prevailing market prices in openmarket purchases, privately-negotiated transactions, block purchase techniques or otherwise, as determined byour management. The purchases are funded from existing cash balances. The share repurchase program may besuspended, modified or discontinued at any time. In April 2013, we announced that the share repurchase programis temporarily suspended.
During 2013, we repurchased 321,000 shares of our common stock at an average price of $31.12, for anaggregate purchase price of $10 million. The shares repurchased under the share repurchase program areavailable for general corporate purposes. As of December 31, 2013, the remaining amount for share repurchasesunder the program authorized in the third quarter of 2012 was $215 million.
Cash Dividends on Common Stock
In 2013, we paid quarterly cash dividends of $0.13 per share on our outstanding common stock. See “CashDividends on Common Stock,” of Note 13, “NASDAQ OMX Stockholders’ Equity,” to the consolidatedfinancial statements for further discussion of the dividends.
In January 2014, the board of directors declared a regular quarterly cash dividend of $0.13 per share on ouroutstanding common stock. The dividend is payable on March 28, 2014 to shareholders of record at the close ofbusiness on March 14, 2014. Future declarations of quarterly dividends and the establishment of future recordand payment dates are subject to approval by the board of directors.
Financial Investments, at Fair Value
Our financial investments, at fair value totaled $162 million as of December 31, 2013 and $223 million as ofDecember 31, 2012 and are primarily comprised of trading securities, mainly Swedish government debtsecurities. Of these securities, $140 million as of December 31, 2013 and $134 million as of December 31, 2012are assets utilized to meet regulatory capital requirements primarily for clearing operations at NASDAQ OMXNordic Clearing. At December 31, 2012 this balance also included our available-for-sale investment security inDFM valued at $22 million. In the fourth quarter of 2013, we sold this investment security and recognized a gainon the sale of $30 million, which is included in gain on sale of investment security in the ConsolidatedStatements of Income for the year ended December 31, 2013. The $30 million gain represents cash proceedsreceived of $48 million less the adjusted cost basis of $18 million. See Note 6, “Investments,” to the consolidatedfinancial statements for further discussion of our trading securities and available-for-sale investment security.
76

Debt Obligations
The following table summarizes our debt obligations by contractual maturity:
Maturity DateDecember 31,
2013December 31,
2012
(in millions)
2.50% convertible senior notes . . . . . . . . . . . . . . . . . . . . . . . . . Repaid August 2013 $ — $ 914.00% senior unsecured notes (net of discount) . . . . . . . . . . . . January 2015 400 399$1.2 billion senior unsecured five-year credit facility:
$450 million senior unsecured term loan facility . . . . . . . September 2016 349 394$750 million revolving credit commitment . . . . . . . . . . . September 2016 95 126
5.25% senior unsecured notes (net of discount) . . . . . . . . . . . . January 2018 368 3685.55% senior unsecured notes (net of discount) . . . . . . . . . . . . January 2020 598 5983.875% senior unsecured notes (net of discount) . . . . . . . . . . . June 2021 824 —
Total debt obligations . . . . . . . . . . . . . . . . . . . . . . . . . . . . . . . . 2,634 1,976Less current portion . . . . . . . . . . . . . . . . . . . . . . . . . . . . . . . . . (45) (136)
Total long-term debt obligations . . . . . . . . . . . . . . . . . . . . . . . . $2,589 $1,840
In addition to the $750 million revolving credit commitment, we also have other credit facilities related toour clearinghouses in order to meet liquidity and regulatory requirements. At December 31, 2013, these creditfacilities, which are available in multiple currencies, primarily Swedish Krona, totaled $312 million($219 million in available liquidity and $93 million to satisfy regulatory requirements), of which $11 million wasutilized. At December 31, 2012, these credit facilities, which are available in multiple currencies, primarilySwedish Krona, totaled $310 million ($217 million in available liquidity and $93 million to satisfy regulatoryrequirements), none of which was utilized.
At December 31, 2013, we were in compliance with the covenants of all of our debt obligations.
See Note 9, “Debt Obligations,” to the consolidated financial statements for further discussion of our debtobligations.
Clearing and Broker-Dealer Net Capital Requirements
Clearing Operations Regulatory Capital Requirements
We are required to maintain minimum levels of regulatory capital for our clearing operations for NASDAQOMX Nordic Clearing and NOS Clearing. The level of regulatory capital required to be maintained is dependentupon many factors, including market conditions and creditworthiness of the counterparty. At December 31, 2013,our required regulatory capital consisted of $94 million of Swedish government debt securities, that are includedin financial investments, at fair value in the Consolidated Balance Sheets and $68 million of cash that is includedin restricted cash in the Consolidated Balance Sheets.
In addition, we have available credit facilities of $93 million which can be utilized to satisfy our regulatorycapital requirements. See “Debt Obligations” above for further discussion.
Broker-Dealer Net Capital Requirements
Our broker-dealer subsidiaries, Nasdaq Execution Services, NASDAQ Options Services and ExecutionAccess, are subject to regulatory requirements intended to ensure their general financial soundness and liquidity.These requirements obligate these subsidiaries to comply with minimum net capital requirements. AtDecember 31, 2013, Nasdaq Execution Services was required to maintain minimum net capital of $0.3 millionand had total net capital of approximately $15.7 million, or $15.4 million in excess of the minimum amountrequired. At December 31, 2013, NASDAQ Options Services also was required to maintain minimum net capitalof $0.3 million and had total net capital of approximately $3.5 million, or $3.2 million in excess of the minimum
77

amount required. At December 31, 2013, Execution Access was required to maintain minimum net capital of$0.8 million and had total net capital of $43.2 million, or $42.4 million in excess of the minimum amountrequired.
Other Capital Requirements
NASDAQ Options Services also is required to maintain a $2 million minimum level of net capital under ourclearing arrangement with The Options Clearing Corporation, or OCC.
Cash Flow Analysis
The following tables summarize the changes in cash flows:
Year Ended December 31,
Percentage Change2013 2012
(in millions)
Net cash provided by (used in):Operating activities . . . . . . . . . . . . . . . . . . . . . . . . . . . . . . . . . . . . . . . . $ 574 $ 594 (3.4)%Investing activities . . . . . . . . . . . . . . . . . . . . . . . . . . . . . . . . . . . . . . . . (1,189) (128) #Financing activities . . . . . . . . . . . . . . . . . . . . . . . . . . . . . . . . . . . . . . . . 547 (485) #Effect of exchange rate changes on cash and cash equivalents . . . . . . (4) 10 #
Net decrease in cash and cash equivalents . . . . . . . . . . . . . . . . . . . . . . (72) (9) #Cash and cash equivalents at the beginning of period . . . . . . . . . . . . . 497 506 (1.8)%
Cash and cash equivalents at the end of period . . . . . . . . . . . . . . . . . . $ 425 $ 497 (14.5)%
# Denotes a variance greater than 100.0%.
Net Cash Provided by Operating Activities
The following items impacted our net cash provided by operating activities for the year ended December 31,2013:
• Net income of $384 million, plus:
• Items to reconcile net income to cash provided by operating activities of $177 million comprisedprimarily of $122 million of depreciation and amortization expense, $47 million of share-basedcompensation expense, deferred income taxes of $28 million and $14 million of asset retirementsand impairment charges, partially offset by gain on sale of investment security of $30 million andexcess tax benefits related to share-based compensation of $16 million.
• Increase in accounts payable and accrued expenses of $51 million primarily due to recent acquisitions,the timing of payments and an increase in interest payable related to our debt obligations.
• Increase in accrued personnel costs of $39 million primarily due to our 2013 incentive compensationaccrual and an increase in employee headcount, partially offset by the payment of our 2012 incentivecompensation in the first quarter of 2013.
Partially offset by a:
• Increase in accounts receivable, net of $55 million primarily due to recent acquisitions and the timing ofcollections and activity.
• Decrease in Section 31 fees payable to the SEC of $15 million primarily due to a decrease in Section 31fee rates.
78

The following items impacted our net cash provided by operating activities for the year ended December 31,2012:
• Net income of $349 million, plus:
• Items to reconcile net income to cash provided by operating activities of $251 million comprisedprimarily of $104 million of depreciation and amortization expense, $46 million of share-basedcompensation expense, $40 million related to asset retirements and impairment charges, $16 millionof restructuring charges, deferred income taxes of $16 million, and a loss on divestiture of businessof $14 million.
• Decrease in other assets of $71 million primarily due to the release of restricted cash resulting from thesale of IDCG.
Partially offset by a:
• Increase in receivables, net of $30 million primarily due to an increase in receivables across multiplebusinesses relating to timing of collections and activity, partially offset by a decrease in income taxreceivables.
• Decrease in accrued personnel costs of $27 million primarily due to the payment of our 2011 incentivecompensation in the first quarter of 2012, partially offset by the 2012 accrual.
• Decrease in other liabilities of $17 million primarily reflecting the release of escrow amounts related tocertain acquisitions and the utilization of sublease reserve balances.
• Decrease in Section 31 fees payable to the SEC of $9 million primarily due to lower dollar value tradedon the NASDAQ and NASDAQ OMX BX trading systems, partially offset by higher Section 31 feerates in 2012.
Net Cash Used in Investing Activities
Net cash used in investing activities for the year ended December 31, 2013 primarily consisted of cashutilized to fund the acquisitions of eSpeed and the TR Corporate Solutions businesses, purchases of tradingsecurities, purchases of property and equipment, and cash paid for equity and cost method investments, partiallyoffset by proceeds from sales and redemptions of trading securities and proceeds from the sale of our available-for-sale investment security.
Net cash used in investing activities for the year ended December 31, 2012 primarily consisted of purchasesof trading securities, cash used for acquisitions and purchases of property and equipment, partially offset byproceeds from sales and redemptions of trading securities.
Net Cash Provided by (Used in) Financing Activities
Net cash provided by financing activities for the year ended December 31, 2013 primarily consisted ofproceeds of $895 million received from the issuance of the 2021 Notes and a partial utilization under ourrevolving credit commitment, partially offset by payments of debt obligation totaling $289 million consisting ofrepayment of our 2013 Convertible Notes totaling $93 million, repayment of $151 million on our revolvingcredit commitment and required quarterly principal payments totaling $45 million made on our $450 millionfunded term loan, or the 2016 Term Loan, and $87 million related to cash dividends paid on our common stock.
Net cash used in financing activities for the year ended December 31, 2012 primarily consisted of$275 million of cash used in connection with our share repurchase programs, repayment of debt obligations of$145 million consisting of an optional prepayment of $100 million on our revolving credit commitment andrequired quarterly principal payments totaling $45 million on the 2016 Term Loan, and $65 million related tocash dividends paid on our common stock.
79

For further discussion of our acquisitions, see Note 4, “Acquisitions and Divestiture,” to the consolidatedfinancial statements. For further discussion of our debt obligations, see Note 9, “Debt Obligations,” to theconsolidated financial statements. For further discussion of our share repurchase program, see “Share RepurchaseProgram,” of Note 13, “NASDAQ OMX Stockholders’ Equity,” to the consolidated financial statements.
Contractual Obligations and Contingent Commitments
NASDAQ OMX has contractual obligations to make future payments under debt obligations by contractmaturity, minimum rental commitments under non-cancelable operating leases, net and other obligations. Thefollowing table shows these contractual obligations as of December 31, 2013:
Payments Due by Period
Contractual Obligations Total Less than 1 year 1-3 years 3-5 years More than 5 years
(in millions)
Debt obligations by contract maturity(1) . . . . . . . . $3,239 $152 $ 986 $530 $1,571Minimum rental commitments under
non-cancelable operating leases, net(2) . . . . . . . 450 78 149 84 139Other obligations(3) . . . . . . . . . . . . . . . . . . . . . . . . 33 18 15 — —
Total . . . . . . . . . . . . . . . . . . . . . . . . . . . . . . . . . . . $3,722 $248 $1,150 $614 $1,710
(1) Our debt obligations include both principal and interest obligations. At December 31, 2013, an interest rateof 1.54% was used to compute the amount of the contractual obligations for interest on the 2016 Term Loanand an interest rate of 1.34% was used to compute the amount of the contractual obligations for interest onour revolving credit commitment. All other debt obligations were calculated on a 360-day basis at thecontractual fixed rate multiplied by the aggregate principal amount at December 31, 2013. See Note 9,“Debt Obligations,” to the consolidated financial statements for further discussion.
(2) We lease some of our office space and equipment under non-cancelable operating leases with third partiesand sublease office space to third parties. Some of our leases contain renewal options and escalation clausesbased on increases in property taxes and building operating costs.
(3) In connection with our acquisitions of FTEN, Glide Technologies and the index business of Mergent, Inc.,including Indxis, we entered into escrow agreements to secure the payment of post-closing adjustments andto ensure other closing conditions. At December 31, 2013, these agreements provide for future payments of$12 million and are included in other current liabilities in the Consolidated Balance Sheets. In addition,other obligations include future transition service agreement payments associated with the acquisition of theTR Corporate Solutions businesses and estimated amounts related to the purchase of the remaining 28%ownership interest in BWise.
Off-Balance Sheet Arrangements
Default Fund Contributions and Margin Deposits Received for Clearing Operations
Default Fund Contributions
Clearing members’ eligible contributions may include cash and non-cash contributions. Cash contributionsare invested by NASDAQ OMX Nordic Clearing in accordance with its investment policies and are included indefault funds and margin deposits in the Consolidated Balance Sheets. However, non-cash contributions, whichinclude highly rated government debt securities that must meet the investment policies of NASDAQ OMXNordic Clearing and NOS Clearing, as well as pledged cash, are pledged assets that are not recorded in ourConsolidated Balance Sheets as NASDAQ OMX Nordic Clearing and NOS Clearing do not take legal ownershipof these assets and the risks and rewards remain with the clearing members. These pledged assets are held at anominee account in NASDAQ OMX Nordic Clearing’s name or NOS Clearing’s name for the benefit of theclearing members and are immediately accessible by NASDAQ OMX Nordic Clearing or NOS Clearing in theevent of default. The pledged asset balances may fluctuate over time due to changes in the amount of deposits
80

required and whether members choose to provide cash or non-cash contributions. See Note 16, “ClearingOperations,” to the consolidated financial statements for further discussion of our clearing operations and defaultfund contributions.
Margin Deposits Received for Clearing Operations
NASDAQ OMX Nordic Clearing and NOS Clearing
NASDAQ OMX Nordic Clearing and NOS Clearing each require all clearing members to provide collateral,which may consist of cash and eligible securities, in a pledged bank account and/or an on-demand guarantee, toguarantee performance on the clearing members’ open positions, or initial margin. In addition, clearing membersmust also provide collateral to cover the daily margin call as needed, which is in addition to the initial margin.Pledged collateral is maintained at a third-party custodian bank or deposit bank account for the benefit of theclearing members and is immediately accessible by NASDAQ OMX Nordic Clearing or NOS Clearing in theevent of default. The pledged margin deposits are not recorded in our Consolidated Balance Sheets as all risksand rewards of collateral ownership, including interest, belong to the counterparty. Clearing member pledgedcollateral related to our clearing operations was $9.5 billion as of December 31, 2013 and $6.7 billion as ofDecember 31, 2012. In April 2013, NASDAQ OMX Nordic Clearing implemented a new collateral managementprocess. With the implementation of this collateral management process, NASDAQ OMX Nordic Clearing nowmaintains and manages all cash deposits related to margin collateral and records these cash deposits in defaultfunds and margin deposits in the Consolidated Balance Sheets as both a current asset and current liability. Thecollateral procedures related to eligible pledged assets remain the same.
NASDAQ OMX Nordic Clearing and NOS Clearing mark-to-market all outstanding contracts at least daily,requiring payment from clearing members whose positions have lost value and making payments to clearingmembers whose positions have gained value. The mark-to-market process helps identify any clearing membersthat may not be able to satisfy their financial obligations in a timely manner which helps NASDAQ OMX NordicClearing and NOS Clearing manage the risk of a clearing member defaulting due to exceptionally large losses. Inthe event of a default, NASDAQ OMX Nordic Clearing or NOS Clearing can access these margin deposits tocover the defaulting member’s losses.
U.S. Clearing
In the third quarter of 2013, NOCC entered into a strategic alliance with NGX. Together NGX and NOCCprovide a solution for transacting in physical energy in the U.S. NGX offers trading and clearing services for thealliance and NOCC contributes account management, product development, and scheduling resources. SinceNGX is now the counterparty to all transactions and clearing arrangements, NOCC transferred all positions toNGX, returned collateral to customers, terminated its letters of credit from banks, and cancelled all contracts withcustomers.
Prior to the alliance with NGX, NOCC, through riskless principal trading and clearing, was the legalcounterparty for each customer position traded and NOCC thereby guaranteed the fulfillment of each of itscustomer’s transactions.
Market participants at NOCC were required to meet certain minimum financial standards to mitigate the riskthat they became unable to satisfy their obligations and provided collateral to cover the daily margin call asneeded. Customer pledged cash collateral held by NOCC, which was $33 million at December 31, 2012, wasincluded in default funds and margin deposits as both a current asset and current liability in the ConsolidatedBalance Sheets, as the risks and rewards of collateral ownership, including interest income, belonged to NOCC.
Guarantees Issued and Credit Facilities Available
In addition to the collateral pledged by clearing members discussed above, we have obtained financialguarantees and credit facilities which are guaranteed by us through counter indemnities, to provide further
81

liquidity and default protection. Financial guarantees issued to us totaled $20 million at December 31, 2013 and$7 million at December 31, 2012. At December 31, 2013, credit facilities, which are available in multiplecurrencies, primarily Swedish Krona, totaled $312 million ($219 million in available liquidity and $93 million tosatisfy regulatory requirements), $11 million of which was utilized. At December 31, 2012, these facilitiestotaled $310 million ($217 million in available liquidity and $93 million to satisfy regulatory requirements), noneof which was utilized.
Execution Access has a clearing arrangement with Cantor Fitzgerald. As of December 31, 2013, we havecontributed $19 million of clearing deposits to Cantor Fitzgerald in connection with this clearing arrangement.These deposits are recorded in other current assets in our consolidated balance sheets. Some of the tradingactivity in Execution Access is cleared by Cantor Fitzgerald through FICC, and the balance is cleared non-FICC.Execution Access assumes the counterparty risk of clients that do not clear through FICC. Counterparty risk ofclients exists for Execution Access between the trade date and settlement date of the individual transactions,which is one business day. All of Execution Access’ obligations under the clearing arrangement with CantorFitzgerald are guaranteed by NASDAQ OMX. Some of the non-FICC counterparties are required to postcollateral, provide principal letters, or provide other forms of credit enhancement to Execution Access for thepurpose of mitigating counterparty risk.
We believe that the potential for us to be required to make payments under these arrangements is mitigatedthrough the pledged collateral and our risk management policies. Accordingly, no contingent liability is recordedin the Consolidated Balance Sheets for these arrangements.
Leases
We lease some of our office space and equipment under non-cancelable operating leases with third partiesand sublease office space to third parties. Some of our lease agreements contain renewal options and escalationclauses based on increases in property taxes and building operating costs.
Other Guarantees
We have provided other guarantees of $16 million as of December 31, 2013 and $18 million atDecember 31, 2012. These guarantees primarily related to obligations for our rental and leasing contracts. Inaddition, for certain Market Technology contracts, we have provided performance guarantees of $2 million as ofDecember 31, 2013 and $5 million at December 31, 2012 related to the delivery of software technology andsupport services. We have received financial guarantees from various financial institutions to support theseguarantees.
We believe that the potential for us to be required to make payments under these arrangements is unlikely.Accordingly, no contingent liability is recorded in the Consolidated Balance Sheets for the above guarantees.
In connection with the launch of NASDAQ OMX NLX, we have entered into agreements with certainmembers which may require us to make payments if certain financial goals are achieved. Since these paymentsare not currently probable and the amount cannot be quantified as of December 31, 2013, no contingent liabilityis recorded in the Consolidated Balance Sheets for these payments.
Routing Brokerage Activities
Our broker-dealer subsidiaries, Nasdaq Execution Services and NASDAQ Options Services, provideguarantees to securities clearinghouses and exchanges under their standard membership agreements, whichrequire members to guarantee the performance of other members. If a member becomes unable to satisfy itsobligations to a clearinghouse or exchange, other members would be required to meet its shortfalls. To mitigatethese performance risks, the exchanges and clearinghouses often require members to post collateral, as well asmeet certain minimum financial standards. Nasdaq Execution Services’ and NASDAQ Options Services’maximum potential liability under these arrangements cannot be quantified. However, we believe that the
82

potential for Nasdaq Execution Services and NASDAQ Options Services to be required to make payments underthese arrangements is unlikely. Accordingly, no contingent liability is recorded in the Consolidated BalanceSheets for these arrangements.
Quantitative and Qualitative Disclosures About Market Risk
Market risk represents the potential for losses that may result from changes in the market value of afinancial instrument due to changes in market conditions. As a result of our operating, investing and financingactivities, we are exposed to market risks such as interest rate risk and foreign currency exchange rate risk. Weare also exposed to credit risk as a result of our normal business activities.
We have implemented policies and procedures to measure, manage, monitor and report risk exposures,which are reviewed regularly by management and the board of directors. We identify risk exposures and monitorand manage such risks on a daily basis.
We perform sensitivity analyses to determine the effects of market risk exposures. We may use derivativeinstruments solely to hedge financial risks related to our financial positions or risks that are incurred during thenormal course of business. We do not use derivative instruments for speculative purposes.
Interest Rate Risk
The following table summarizes our financial assets and liabilities that are subject to interest rate risk as ofDecember 31, 2013:
FinancialAssets
FinancialLiabilities(1)
Negative impact of a100bp adverse shift
in interest rate(2)
(in millions)
Floating rate positions(3) . . . . . . . . . . . . . . . . . . . . . . . . . . . . . . . . . . . $ 2,592 $ 2,405 $ 3Fixed rate positions(4) . . . . . . . . . . . . . . . . . . . . . . . . . . . . . . . . . . . . . 40 2,195 —
(1) Represents total contractual debt obligations and amounts related to default fund contributions and margindeposits.
(2) Annualized impact of a 100 basis point parallel adverse shift in the yield curve.(3) Includes floating rate and fixed interest rates with a maturity or reset date due within 12 months.(4) Financial assets primarily consist of Swedish government debt securities, which are classified as trading
investment securities, with an average duration of 1.3 years.
We are exposed to cash flow risk on floating rate financial assets of $2,592 million and financial liabilitiesof $2,405 million at December 31, 2013. When interest rates on financial assets of floating rate positionsdecrease, net interest income decreases. When interest rates on financial liabilities of floating rate positionsincrease, net interest expense increases. Based on December 31, 2013 positions, each 1.0% adverse change ininterest rate would impact annual pre-tax income by $3 million related to our floating rate positions.
We are exposed to price risk on our fixed rate financial assets, which totaled $40 million at December 31,2013 and have an average duration of 1.3 years. The net effect of a parallel shift of 1.0% of the interest ratecurve, taking into account the change in fair value and the increase in interest income, would have an immaterialimpact on annual pre-tax income related to our fixed rate positions.
Foreign Currency Exchange Rate Risk
As a leading global exchange group, we are subject to foreign currency translation risk. For the year endedDecember 31, 2013, approximately 34.8% of our revenues less transaction rebates, brokerage, clearance andexchange fees and 29.0% of our operating income were derived in currencies other than the U.S. dollar, primarilythe Swedish Krona, Euro, Norwegian Krone, Danish Krone and British Pound. For the year ended December 31,
83

2012, approximately 34.8% of our revenues less transaction rebates, brokerage, clearance and exchange fees and26.5% of our operating income were derived in currencies other than the U.S. dollar, primarily the SwedishKrona, Euro, Norwegian Krone and Danish Krone.
Our primary exposure to foreign currency denominated revenues less transaction rebates, brokerage,clearance and exchange fees and operating income for the years ended December 31, 2013 and 2012 is presentedin the following table:
SwedishKrona Euro
NorwegianKrone
DanishKrone
BritishPound
Other ForeignCurrencies
(in millions, except currency rate)
Twelve months ended December 31, 2013Average foreign currency rate to the U.S.
dollar . . . . . . . . . . . . . . . . . . . . . . . . . . . . . 0.1536 1.3285 0.1703 0.1781 1.5647 #Percentage of revenues less transaction
rebates, brokerage, clearance andexchange fees . . . . . . . . . . . . . . . . . . . . . . 20.1% 4.3% 2.7% 2.5% 1.7% 3.5%
Percentage of operating income . . . . . . . . . . 19.9% 3.7% 4.3% 4.6% (2.6)% (0.9)%Impact of a 10% adverse currency
fluctuation on revenues less transactionrebates, brokerage, clearance andexchange fees . . . . . . . . . . . . . . . . . . . . . . $ (38) $ (8) $ (5) $ (5) $ (3) $ (7)
Impact of a 10% adverse currencyfluctuation on operating income . . . . . . . . $ (14) $ (2) $ (3) $ (3) $ (2) $ (1)
SwedishKrona Euro
NorwegianKrone
DanishKrone
Other ForeignCurrencies
Twelve months ended December 31, 2012Average foreign currency rate to the U.S. dollar . . . . . . 0.1478 1.2864 0.1720 0.1728 #Percentage of revenues less transaction rebates,
brokerage, clearance and exchange fees . . . . . . . . . . 21.8% 4.0% 2.8% 2.5% 3.7%Percentage of operating income . . . . . . . . . . . . . . . . . . 20.2% 4.2% 3.3% 3.6% (4.8)%Impact of a 10% adverse currency fluctuation on
revenues less transaction rebates, brokerage,clearance and exchange fees . . . . . . . . . . . . . . . . . . . $ (36) $ (7) $ (5) $ (4) $ (6)
Impact of a 10% adverse currency fluctuation onoperating income . . . . . . . . . . . . . . . . . . . . . . . . . . . . $ (14) $ (3) $ (2) $ (8) $ (9)
# Represents multiple foreign currency rates.
Our investments in foreign subsidiaries are exposed to volatility in currency exchange rates throughtranslation of the foreign subsidiaries’ net assets or equity to U.S. dollars. Substantially all of our foreignsubsidiaries operate in functional currencies other than the U.S. dollar. Fluctuations in currency exchange ratesmay create volatility in our results of operations as we are required to translate the balance sheets and operationalresults of these foreign currency denominated subsidiaries into U.S. dollars for consolidated reporting. Thetranslation of foreign subsidiaries’ non-U.S. dollar balance sheets into U.S. dollars for consolidated reportingresults in a cumulative translation adjustment which is recorded in accumulated other comprehensive loss withinstockholders’ equity in the Consolidated Balance Sheets.
84

Our primary exposure to net assets in foreign currencies as of December 31, 2013 is presented in thefollowing table:
NetAssets
Impact of a10%
AdverseCurrency
Fluctuation
(in millions)Swedish Krona(1) . . . . . . . . . . . . . . . . . . . . . . . . . . . . . . . . . . $4,272 $(427)Norwegian Krone . . . . . . . . . . . . . . . . . . . . . . . . . . . . . . . . . 297 (30)British Pound(1) . . . . . . . . . . . . . . . . . . . . . . . . . . . . . . . . . . . 171 (17)Euro . . . . . . . . . . . . . . . . . . . . . . . . . . . . . . . . . . . . . . . . . . . 160 (16)Australian Dollar . . . . . . . . . . . . . . . . . . . . . . . . . . . . . . . . . 98 (10)
(1) Includes goodwill of $3,510 million and intangible assets, net of $1,063 million.
Credit Risk
Credit risk is the potential loss due to the default or deterioration in credit quality of customers orcounterparties. We are exposed to credit risk from third parties, including customers, counterparties and clearingagents. These parties may default on their obligations to us due to bankruptcy, lack of liquidity, operationalfailure or other reasons. We limit our exposure to credit risk by rigorously evaluating the counterparties withwhich we make investments and execute agreements. The financial investment portfolio objective is to invest insecurities to preserve principal while maximizing yields, without significantly increasing risk. Credit riskassociated with investments is minimized substantially by ensuring that these financial assets are placed withgovernments which have investment grade ratings, well-capitalized financial institutions and other creditworthycounterparties.
Our subsidiaries Nasdaq Execution Services and NASDAQ Options Services may be exposed to credit risk,due to the default of trading counterparties, in connection with the routing services they provide for our tradingcustomers. System trades in cash equities routed to other market centers for members of our cash equityexchanges are routed by Nasdaq Execution Services for clearing to the National Securities Clearing Corporation,or NSCC. In this function, Nasdaq Execution Services is to be neutral by the end of the trading day, but may beexposed to intraday risk if a trade extends beyond the trading day and into the next day, thereby leaving NasdaqExecution Services susceptible to counterparty risk in the period between accepting the trade and routing it to theclearinghouse. In this interim period, Nasdaq Execution Services is not novating like a clearing broker butinstead is subject to the short-term risk of counterparty failure before the clearinghouse enters the transaction.Once the clearinghouse officially accepts the trade for novation, Nasdaq Execution Services is legally removedfrom risk. System trades in derivative contracts for the opening and closing cross and trades routed to othermarket centers are cleared by NASDAQ Options Services, as a member of the OCC. For these trades, novation isdone at the end of the trading day, and settlement is complete by 10:00 am on the following day.
Pursuant to the rules of the NSCC and Nasdaq Execution Services’ clearing agreement, Nasdaq ExecutionServices is liable for any losses incurred due to a counterparty or a clearing agent’s failure to satisfy itscontractual obligations, either by making payment or delivering securities. Pursuant to the rules of the OCC andNASDAQ Options Services’ clearing agreement, NASDAQ Options Services is liable for any losses incurreddue to a counterparty or a clearing agent’s failure to satisfy its contractual obligations, either by making paymentor delivering securities. Adverse movements in the prices of securities and derivative contracts that are subject tothese transactions can increase our credit risk. However, we believe that the risk of material loss is limited, asNasdaq Execution Services’ and NASDAQ Options Services’ customers are not permitted to trade on margin andNSCC and OCC rules limit counterparty risk on self-cleared transactions by establishing credit limits and capitaldeposit requirements for all brokers that clear with NSCC and OCC. Historically, neither Nasdaq ExecutionServices nor NASDAQ Options Services has incurred a liability due to a customer’s failure to satisfy itscontractual obligations as counterparty to a system trade. Credit difficulties or insolvency, or the perceived
85

possibility of credit difficulties or insolvency, of one or more larger or visible market participants could alsoresult in market-wide credit difficulties or other market disruptions.
Execution Access has a clearing arrangement with Cantor Fitzgerald. As of December 31, 2013, we havecontributed $19 million of clearing deposits to Cantor Fitzgerald in connection with this clearing arrangement.These deposits are recorded in other current assets in our Consolidated Balance Sheets. Some of the tradingactivity in Execution Access is cleared by Cantor Fitzgerald through FICC, and the balance is cleared non-FICC.Execution Access assumes the counterparty risk of clients that do not clear through FICC. Counterparty risk ofclients exists for Execution Access between the trade date and settlement date of the individual transactions,which is one business day. All of Execution Access’ obligations under the clearing arrangement with CantorFitzgerald are guaranteed by NASDAQ OMX. Some of the non-FICC counterparties will be required to postcollateral, provide principal letters, or provide other forms of credit enhancement to Execution Access for thepurpose of mitigating counterparty risk.
We are exposed to credit risk through our clearing operations with NASDAQ OMX Nordic Clearing andNOS Clearing. See “Default Fund Contributions and Margin Deposits Received for Clearing Operations,” of“Off-Balance Sheet Arrangements,” above, as well as Note 16, “Clearing Operations” for further discussion.
We also have credit risk related to transaction and subscription-based revenues that are billed to customerson a monthly or quarterly basis, in arrears. Our potential exposure to credit losses on these transactions isrepresented by the receivable balances in our Consolidated Balance Sheets. On an ongoing basis, we review andevaluate changes in the status of our counterparties’ creditworthiness.
Credit losses such as those described above could adversely affect our consolidated financial position andresults of operations.
Critical Accounting Policies and Estimates
The preparation of Consolidated Financial Statements in conformity with U.S. GAAP requires managementto use judgment in making estimates and assumptions that affect the reported amounts of assets and liabilities,disclosure of contingent assets and liabilities and the reported amounts of revenues and expenses. The followingcritical accounting policies are based on, among other things, judgments and assumptions made by managementthat include inherent risk and uncertainties. Management’s estimates are based on the relevant informationavailable at the end of each period. For a summary of our significant accounting policies, including theaccounting policies discussed below, see Note 2, “Summary of Significant Accounting Policies,” to theconsolidated financial statements for further discussion.
Revenue Recognition
Listing Services Revenues
U.S. Listing Services
Listing Services revenues in the U.S. include annual renewal fees, listing of additional shares fees and initiallisting fees. Annual renewal fees do not require any judgments or assumptions by management as these amountsare recognized ratably over the following 12-month period. However, listing of additional shares fees and initiallisting fees are recognized on a straight-line basis over estimated service periods, which are four and six years,respectively, based on our historical listing experience and projected future listing duration. Unamortizedbalances are recorded as deferred revenue in the Consolidated Balance Sheets.
Technology Solutions Revenues
Market Technology Revenues
Revenues primarily consist of software, license and support revenues, change request and advisoryrevenues, and software as a service revenues.
86

For most solutions, we enter into multiple-element sales arrangements to provide technology solutions andservices to our customers. In order to recognize revenues associated with each individual element of a multiple-element sales arrangement separately, we are required to establish the existence of VSOE of fair value for eachelement. When VSOE for individual elements of an arrangement cannot be established, revenue is generallydeferred and recognized over either the final element of the arrangement or the entire term of the arrangement forwhich the services will be delivered.
We also enter into revolving subscription agreements which allow customers to connect to our servers toaccess certain services. These revenues are recognized ratably over the subscription term.
Software, license and support revenues are derived from the system solutions developed and sold byNASDAQ OMX that are generally entered into in multiple-element sales arrangements. After we have developedand sold a system solution, the customer licenses the right to use the software and may require post contractsupport and other services, such as facility management. Facility management revenues are derived whenNASDAQ OMX assumes responsibility for the continuous operation of a system platform for a customer andreceives facility management revenues which can be both fixed and volume-based. Revenues for license, supportand facility management services are generally deferred and recognized over either the final element of thearrangement or the entire term of the arrangement for which the services will be delivered, unless VSOE can beestablished for each element of the contract. We record the deferral of revenue associated with multiple-elementsales arrangements in deferred revenue and non-current deferred revenue and the deferral of costs in other currentassets and other non-current assets in the Consolidated Balance Sheets.
Software, license and support revenues also include delivery project revenues which are derived from theinstallation phase of the system solutions developed and sold by NASDAQ OMX. The majority of our deliveryprojects involve individual adaptations to the specific requirements of the customer, such as those relating tofunctionality and capacity. We may customize our software technology and make significant modifications to thesoftware to meet the needs of our customers, and as such, we account for these arrangements under contractaccounting. Under contract accounting, when VSOE for valuing certain elements of an arrangement cannot beestablished, total revenues, as well as costs incurred, are deferred until the customization and significantmodifications are complete and are then recognized over the post contract support period. We record the deferralof this revenue in deferred revenue and non-current deferred revenue and the deferral of costs in other currentassets and other non-current assets in the Consolidated Balance Sheets.
Change request and advisory revenues and software as a service revenues do not require any judgments orassumptions by management as these amounts are recognized as revenues when earned.
Goodwill and Related Impairment
Goodwill represents the excess of purchase price over the value assigned to the net tangible and identifiableintangible assets of a business acquired. Goodwill is allocated to our reporting units based on the assignment ofthe fair values of each reporting unit of the acquired company. We test goodwill for impairment at the reportingunit level annually, or in interim periods if certain events occur indicating that the carrying amount may beimpaired, such as changes in the business climate, poor indicators of operating performance or the sale ordisposition of a significant portion of a reporting unit. For purposes of performing our goodwill impairment test,our six reporting units are the Market Services segment, the Listing Services segment, the two businessescomprising the Information Services segment: Market Data Products and Index Licensing and Services, and thetwo businesses comprising the Technology Solutions segment: Corporate Solutions and Market Technology. Wetest for impairment during the fourth quarter of our fiscal year using carrying amounts as of October 1. Inconducting the 2013 annual impairment test for goodwill, we first performed a qualitative assessment todetermine whether it was more likely than not that the fair value of a reporting unit was less than the carryingamount as a basis for determining whether it was necessary to perform the two-step quantitative goodwillimpairment test described in Financial Accounting Standards Board, or FASB, Accounting StandardsCodification, or ASC, Topic 350, “Intangibles–Goodwill and Other,” or ASC Topic 350. The more-likely-than-
87

not threshold is defined as having a likelihood of more than 50 percent. If, after assessing the totality of events orcircumstances, we determine that it is more likely than not that the fair value of a reporting unit is less than itscarrying amount, then the two-step quantitative test for goodwill impairment is performed for the appropriatereporting units. Otherwise, we conclude that no impairment is indicated and the two-step quantitative test forgoodwill impairment is not performed.
In conducting the qualitative assessment, we analyzed actual and projected growth trends for each reportingunit, as well as historical performance versus plan and the results of prior quantitative tests performed.Additionally, each reporting unit assesses critical areas that may impact their business, including macroeconomicconditions and the related impact, market related exposures, competitive changes, new or discontinued products,changes in key personnel, and other potential risks to their projected financial results.
If required, the quantitative goodwill impairment test is a two-step process performed at the reporting unitlevel. First, the fair value of each reporting unit is compared to its corresponding carrying amount, includinggoodwill. The fair value of each reporting unit is estimated using a combination of discounted cash flowvaluation, which incorporates assumptions regarding future growth rates, terminal values, and discount rates, aswell as guideline public company valuations, incorporating relevant trading multiples of comparable companiesand other factors. The estimates and assumptions used consider historical performance and are consistent withthe assumptions used in determining future profit plans for each reporting unit, which are approved by our boardof directors. If the first step results in the carrying amount exceeding the fair value of the reporting unit, then asecond step must be completed in order to determine the amount of goodwill impairment that should be recorded,if any. In the second step, the implied fair value of the reporting unit’s goodwill is determined by allocating thereporting unit’s fair value to all of its assets and liabilities other than goodwill in a manner similar to a purchaseprice allocation. The implied fair value of the goodwill that results from the application of this second step is thencompared to the carrying amount of the goodwill and an impairment charge is recorded for any difference.
For our annual test of goodwill impairment in 2013, we considered the results of our quantitative testperformed in January 2013, due to the realignment of our reportable segments, which indicated that the fair valueof each reporting unit was in excess of its carrying amount. We also considered future financial projections,current market conditions, and any changes in the carrying amount of the reporting units.
At the time of our 2013 annual impairment test, our goodwill balance was $6,191 million, of which $3,439million was attributable to our Market Services segment, $137 million was attributable to our Listing Servicessegment, $2,021 million was attributable to our Information Services segment and $594 million was attributableto our Technology Solutions segment.
We utilized the qualitative screen for our Listing Services, Market Data Products, Index Licensing andServices and Market Technology reporting units, as the excesses of their fair values over their respective carryingamounts were significant. In conducting the qualitative assessment for these four reporting units, we evaluatedfuture financial projections by management to determine if there were any changes in the key inputs used todetermine the fair values of each reporting unit. We also considered the qualitative factors in ASC Topic 350, aswell as other relevant events and circumstances. Based on the results of the qualitative assessment for eachreporting unit, we concluded based on a preponderance of positive indicators and the weight of such indicatorsthat the fair values of our Listing Services, Market Data Products, Index Licensing and Services and MarketTechnology reporting units are more likely than not greater than their respective carrying amounts and as a result,quantitative analyses were not needed. Therefore, no further testing of goodwill for impairment was performedfor these reporting units for the year ended December 31, 2013.
Due to declining cash equity trading volumes and the purchase of eSpeed in June 2013, we bypassed thequalitative assessment for the Market Services reporting unit. In addition, due to the acquisition of the TRCorporate Solutions businesses in May 2013, we bypassed the qualitative assessment for the Corporate Solutionsreporting unit. We performed step one of the quantitative goodwill impairment test for both of these reportingunits and determined that the fair values of our Market Services and Corporate Solutions reporting units
88

exceeded their carrying amounts. As a result, no goodwill impairment was recorded. The fair value of our MarketServices and Corporate Solutions reporting units was determined using a combination of two equally weightedvaluation methods, a market approach and an income approach. The market approach estimates fair value byapplying revenues, earnings and cash flow multiples to the Market Services and Corporate Solutions reportingunits’ operating performance. The multiples are derived from comparable publicly-traded companies with similaroperating and investment characteristics to our Market Services and Corporate Solutions reporting units. Themarket approach requires management’s judgment to determine several valuation inputs, including the selectionof comparable companies and control premium. The control premium is based on recent transactions in themarketplace. Under the income approach, we estimated future cash flows of our Market Services and CorporateSolutions reporting units based on internally generated forecasts of future financial performance. We determineda long-term growth rate for the terminal year period based on historical and expected inflation rates as well asmanagement’s estimate of the long-term growth of the business. We then discounted the projected cash flowsusing a weighted average cost of capital of 11.1% for Market Services and 11.7% for Corporate Solutions.
The fair value of our Market Services reporting unit exceeded its carrying amount by less than 10%.Holding all other assumptions constant at the testing date, a 5% decrease in the estimated free cash flows of thisreporting unit would not reduce the estimated fair value below the carrying amount. However, holding all otherassumptions constant, a 35 basis point increase in the discount rate used in the testing of this reporting unit wouldreduce the estimated fair value below its carrying amount by 1%, indicating a possible impairment. Because steptwo of the impairment test was not required for this reporting unit, it is not possible at this time to determine if adecrease in our valuation inputs would result in an impairment charge, or if such a charge would be material.
The fair value of our Corporate Solutions reporting unit also exceeded its carrying amount by less than 10%.Holding all other assumptions constant at the testing date, a 5% decrease in the estimated free cash flows of thisreporting unit would not reduce the estimated fair value below the carrying amount. However, holding all otherassumptions constant, a 20 basis point increase in the discount rate used in the testing of this reporting unit wouldreduce the estimated fair value below its carrying amount by 1%, indicating a possible impairment. Because steptwo of the impairment test was not required for this reporting unit, it is not possible at this time to determine if adecrease in our valuation inputs would result in an impairment charge, or if such a charge would be material.
Although we believe our estimates of fair value are reasonable, the determination of certain valuation inputsis subject to management’s judgment. Changes in these inputs could materially affect the results of ourimpairment review. If our forecasts of cash flows generated by our Market Services and Corporate Solutionsreporting units or other key inputs are negatively revised in the future, the estimated fair value of the MarketServices and Corporate Solutions reporting units would be adversely impacted, potentially leading to animpairment in the future that could materially affect our operating results.
Subsequent to our annual impairment test, no indications of an impairment were identified.
Indefinite-Lived Intangible Assets and Related Impairment
Intangible assets deemed to have indefinite useful lives are not amortized but instead are tested forimpairment at least annually and more frequently whenever events or changes in circumstances indicate that thefair value of the asset may be less than its carrying amount. The fair value of indefinite-lived intangible assets isprimarily determined on the basis of estimated discounted value, using the relief from royalty approach for tradenames and the Greenfield Approach for exchange and clearing registrations and licenses, both of whichincorporate assumptions regarding future revenue projections and discount rates. Similar to goodwill impairmenttesting, we test for impairment of indefinite-lived intangible assets during the fourth quarter of our fiscal yearusing carrying amounts as of October 1. In conducting the 2013 annual impairment test for indefinite-livedintangible assets, we first performed a qualitative assessment to determine whether it was more likely than notthat the fair value of an indefinite-lived intangible asset was less than the carrying amount as a basis fordetermining whether it was necessary to perform the quantitative impairment test described in ASC Topic 350.The more-likely-than-not threshold is defined as having a likelihood of more than 50 percent. If, after assessing
89

the totality of events or circumstances, we determine that it is more likely than not that the fair value of anindefinite-lived intangible asset is less than its carrying amount, then the quantitative test for indefinite-livedintangible assets impairment is performed for the appropriate intangible assets. If the carrying amount of theindefinite-lived intangible asset exceeds its fair value, an impairment charge is recorded for the difference.
Other Long-Lived Assets and Related Impairment
We also assess potential impairments to our other long-lived assets, including finite-lived intangible assets,equity method investments, property and equipment and other assets, when there is evidence that events orchanges in circumstances indicate that the carrying amount of an asset may not be recovered. An impairment lossis recognized when the carrying amount of the long-lived asset exceeds its fair value and is not recoverable. Thecarrying amount of a long-lived asset is not recoverable if it exceeds the sum of the undiscounted cash flowsexpected to result from the use and eventual disposition of the asset. We evaluate our equity and cost methodinvestments for other-than-temporary declines in value by considering a variety of factors such as the earningscapacity of the investment and the fair value of the investment compared to its carrying amount. In addition, forinvestments where the market value is readily determinable, we consider the underlying stock price as anadditional factor. Any required impairment loss is measured as the amount by which the carrying amount of along-lived asset exceeds its fair value and is recorded as a reduction in the carrying amount of the related assetand a charge to operating results.
Amortization Periods of Intangible Assets with Finite-Lives
Intangible assets, net, primarily include exchange and clearing registrations, customer relationships, tradenames, licenses and technology. Intangible assets with finite-lives are amortized on a straight-line basis over theiraverage estimated useful lives as follows:
• Technology: 2—5 years
• Customer relationships: 9—30 years
• Other: 2—10 years
The estimated useful life of developed and new technology is based on the likely duration of benefits to bederived from the technology. We consider such factors as the migration cycle for re-platforming existingtechnologies and the development of future generations of technology. We also give consideration to the pace ofthe technological changes in the industries in which we sell our products.
The estimated useful life of customer relationships is determined based on an analysis of the historicalattrition rates of customers and an analysis of the legal, regulatory, contractual, competitive, economic, or otherfactors that limit the useful life of customer relationships.
See Note 4, “Acquisitions and Divestitures,” and Note 5, “Goodwill and Purchased Intangible Assets,” tothe consolidated financial statements for further discussion of intangible assets.
Income Taxes
Estimates and judgments are required in the calculation of certain tax liabilities and in the determination ofthe recoverability of certain deferred tax assets, which arise from net operating loss carryforwards, tax creditcarryforwards and temporary differences between the tax and financial statement recognition of revenue andexpense. Our deferred tax assets are reduced by a valuation allowance if it is more likely than not that someportion or all of the recorded deferred tax assets will not be realized in future periods. Management is required todetermine whether a tax position is more likely than not to be sustained upon examination, including resolutionof any related appeals or litigation processes, based on the technical merits of the position. Once it is determinedthat a position meets the recognition thresholds, the position is measured to determine the amount of benefit to berecognized in the consolidated financial statements. Interest and/or penalties related to income tax matters arerecognized in income tax expense.
90

In assessing the need for a valuation allowance, we consider all available evidence including past operatingresults, the existence of cumulative losses in the most recent fiscal years, estimates of future taxable income andthe feasibility of tax planning strategies. In the event that we change our determination as to the amount ofdeferred tax assets that can be realized, we will adjust our valuation allowance with a corresponding impact tothe provision for income taxes in the period in which such determination is made.
In addition, the calculation of our tax liabilities involves uncertainties in the application of tax regulations inthe U.S. and other tax jurisdictions. We recognize potential liabilities for anticipated tax audit issues in suchjurisdictions based on our estimate of whether, and the extent to which, additional taxes and interest may be due.While we believe that our tax liabilities reflect the probable outcome of identified tax uncertainties, it isreasonably possible that the ultimate resolution of any tax matter may be greater or less than the amount accrued.If events occur and the payment of these amounts ultimately proves unnecessary, the reversal of the liabilitieswould result in tax benefits being recognized in the period when we determine the liabilities are no longernecessary. If our estimate of tax liabilities proves to be less than the ultimate assessment, a further charge toexpense would result.
Pension and Post-Retirement Benefits
Pension and other post-retirement benefit plan information for financial reporting purposes is developedusing actuarial valuations. We assess our pension and other post-retirement benefit plan assumptions on a regularbasis. In evaluating these assumptions, we consider many factors, including evaluation of the discount rate,expected rate of return on plan assets, healthcare cost trend rate, retirement age assumption, our historicalassumptions compared with actual results and analysis of current market conditions and asset allocations. SeeNote 11, “Employee Benefits,” to the consolidated financial statements for further discussion.
Discount rates used for pension and other post-retirement benefit plan calculations are evaluated annuallyand modified to reflect the prevailing market rates at the measurement date of a high-quality fixed-income debtinstrument portfolio that would provide the future cash flows needed to pay the benefits included in the benefitobligations as they come due. Actuarial assumptions are based upon management’s best estimates and judgment.
The expected rate of return on plan assets for our U.S. pension plans represents our long-term assessment ofreturn expectations which may change based on significant shifts in economic and financial market conditions.The long-term rate of return on plan assets is derived from return assumptions based on targeted allocations forvarious asset classes. While we consider the pension plans’ recent performance and other economic growth andinflation factors, which are supported by long-term historical data, the return expectations for the targeted assetcategories represents a long-term prospective return.
Share-Based Compensation
The accounting for share-based compensation requires the measurement and recognition of compensationexpense for all share-based awards made to employees based on estimated fair values. Share-based awards, orequity awards, include employee stock options, restricted stock and performance share units, or PSUs. Restrictedstock awards generally refer to restricted stock units.
We estimate the fair value of PSUs granted under our total shareholder return, or TSR, program using theMonte Carlo simulation model, as these awards contain a market condition. Assumptions used in the MonteCarlo simulation model include the weighted average risk-free rate and the expected volatility. The risk-freeinterest rate for periods within the expected life of the award is based on the U.S. Treasury yield curve in effect atthe time of grant. We use historic volatility for PSU awards issued under the TSR program, as implied volatilitydata could not be obtained for all the companies in the peer groups used for relative performance measurementwithin the TSR program.
See Note 12, “Share-Based Compensation,” to the consolidated financial statements for further discussion.
91

Software Costs
We capitalize and amortize significant purchased application software and operational software that are anintegral part of computer hardware on the straight-line method over their estimated useful lives, generally fiveyears. We expense other purchased software as incurred.
Certain costs incurred in connection with developing or obtaining internal use software are capitalized. Wecapitalize internal and third party costs incurred in connection with the development of internal use software.
Under our Technology Solutions segment, costs of computer software to be sold, leased, or otherwisemarketed as a separate product or as part of a product or process are capitalized after the product has reachedtechnological feasibility. Technological feasibility is established upon completion of a detail program design or,in its absence, completion. Thereafter, all software production costs shall be capitalized. Prior to reachingtechnological feasibility, all costs are charged to expense. Capitalized costs are amortized on a straight-line basisover the remaining estimated economic life of the product and are included in depreciation and amortizationexpense in the Consolidated Statements of Income.
Foreign Currency Translation
Foreign denominated assets and liabilities are remeasured into the functional currency at exchange rates ineffect at the balance sheet date through the income statement. Gains or losses resulting from foreign currencytransactions are remeasured using the rates on the dates on which those elements are recognized during theperiod, and are included in general, administrative and other expense in the Consolidated Statements of Income.
Translation gains or losses resulting from translating our subsidiaries’ financial statements from the localfunctional currency to the reporting currency, net of tax, are included in accumulated other comprehensive losswithin stockholders’ equity in the Consolidated Balance Sheets. Assets and liabilities are translated at the balancesheet date while revenues and expenses are recorded at the date the transaction occurs or at an applicable averagerate.
Deferred taxes are not provided on cumulative translation adjustments where we expect earnings of aforeign subsidiary to be indefinitely reinvested. The income tax effect of currency translation adjustments relatedto foreign subsidiaries that are not considered indefinitely reinvested is recorded as a component of deferredtaxes with an offset to accumulated other comprehensive loss within stockholders’ equity in the ConsolidatedBalance Sheets.
Recently Adopted and Issued Accounting Pronouncements
For the year ended December 31, 2013, we have not adopted any new accounting pronouncements that hada material impact on our consolidated financial statements. In addition, we have reviewed all recently issued, butnot yet effective, accounting pronouncements and do not believe the future adoption of any such pronouncementswill have a material impact on our financial position or results of its operations.
92

Summarized Quarterly Financial Data (Unaudited)
1st Qtr2013
2nd Qtr2013
3rd Qtr2013
4th Qtr2013
(in millions, except per share amounts)
Total revenues . . . . . . . . . . . . . . . . . . . . . . . . . . . . . . . . . . . . . . . . . . . . . . . . . . $ 744 $ 814 $ 805 $ 849Cost of revenues . . . . . . . . . . . . . . . . . . . . . . . . . . . . . . . . . . . . . . . . . . . . . . . . . (326) (363) (299) (329)
Revenues less transaction rebates, brokerage, clearance and exchange fees . . . 418 451 506 520Total operating expenses . . . . . . . . . . . . . . . . . . . . . . . . . . . . . . . . . . . . . . . . . . 328 292 304 282
Operating income . . . . . . . . . . . . . . . . . . . . . . . . . . . . . . . . . . . . . . . . . . . . . . . . 90 159 202 238
Net income attributable to NASDAQ OMX . . . . . . . . . . . . . . . . . . . . . . . . . . . $ 42 $ 88 $ 113 $ 141
Basic earnings per share . . . . . . . . . . . . . . . . . . . . . . . . . . . . . . . . . . . . . . . . . . . $0.26 $0.53 $0.68 $0.84
Diluted earnings per share . . . . . . . . . . . . . . . . . . . . . . . . . . . . . . . . . . . . . . . . . $0.25 $0.52 $0.66 $0.81
Cash dividends declared per common share . . . . . . . . . . . . . . . . . . . . . . . . . . . $0.13 $0.13 $0.13 $0.13
1st Qtr2012
2nd Qtr2012
3rd Qtr2012
4th Qtr2012
(in millions, except per share amounts)
Total revenues . . . . . . . . . . . . . . . . . . . . . . . . . . . . . . . . . . . . . . . . . . . . . . . . . . $ 804 $ 815 $ 746 $ 755Cost of revenues . . . . . . . . . . . . . . . . . . . . . . . . . . . . . . . . . . . . . . . . . . . . . . . . . (390) (388) (334) (333)
Revenues less transaction rebates, brokerage, clearance and exchange fees . . . 414 427 412 422Total operating expenses . . . . . . . . . . . . . . . . . . . . . . . . . . . . . . . . . . . . . . . . . . 243 252 242 247
Operating income . . . . . . . . . . . . . . . . . . . . . . . . . . . . . . . . . . . . . . . . . . . . . . . . 171 175 170 175
Net income attributable to NASDAQ OMX . . . . . . . . . . . . . . . . . . . . . . . . . . . $ 85 $ 93 $ 89 $ 85
Basic earnings per share . . . . . . . . . . . . . . . . . . . . . . . . . . . . . . . . . . . . . . . . . . . $0.49 $0.55 $0.53 $0.52
Diluted earnings per share . . . . . . . . . . . . . . . . . . . . . . . . . . . . . . . . . . . . . . . . . $0.48 $0.53 $0.52 $0.50
Cash dividends declared per common share . . . . . . . . . . . . . . . . . . . . . . . . . . . $ — $0.13 $0.13 $0.13
Item 7A. Quantitative and Qualitative Disclosures About Market Risk.
Information about quantitative and qualitative disclosures about market risk is incorporated herein byreference from “Item 7. Management’s Discussion and Analysis of Financial Condition and Results ofOperations—Quantitative and Qualitative Disclosures About Market Risk.”
Item 8. Financial Statements and Supplementary Data.
NASDAQ OMX’s consolidated financial statements, including Consolidated Balance Sheets as ofDecember 31, 2013 and 2012, Consolidated Statements of Income for the years ended December 31, 2013, 2012and 2011, Consolidated Statements of Comprehensive Income for the years ended December 31, 2013, 2012 and2011, Consolidated Statements of Changes in Equity for the years ended December 31, 2013, 2012 and 2011,Consolidated Statements of Cash Flows for the years ended December 31, 2013, 2012 and 2011 and notes to ourconsolidated financial statements, together with a report thereon of Ernst & Young LLP, dated February 24,2014, are attached hereto as pages F-1 through F-70 and incorporated by reference herein.
Item 9. Changes in and Disagreements with Accountants on Accounting and Financial Disclosure.
None.
93

Item 9A. Controls and Procedures.
(a). Disclosure controls and procedures. NASDAQ OMX’s management, with the participation ofNASDAQ OMX’s Chief Executive Officer, and Chief Financial Officer and Executive Vice President, CorporateStrategy, has evaluated the effectiveness of NASDAQ OMX’s disclosure controls and procedures (as defined inRule 13a-15(e) and Rule 15d-15(e) under the Exchange Act) as of the end of the period covered by this report.Based upon that evaluation, NASDAQ OMX’s Chief Executive Officer, and Chief Financial Officer andExecutive Vice President, Corporate Strategy have concluded that, as of the end of such period, NASDAQOMX’s disclosure controls and procedures are effective.
(b). Internal controls over financial reporting. On May 31, 2013, NASDAQ OMX acquired the TRCorporate Solutions businesses and on June 28, 2013, NASDAQ OMX acquired eSpeed. Management hasconsidered these transactions material to the results of operations, cash flows and financial position from the dateof the acquisitions through December 31, 2013, and believes that the internal controls and procedures of bothacquisitions have a material effect on internal controls over financial reporting. In accordance with SECguidance, management has elected to exclude the TR Corporate Solutions businesses and eSpeed from itsDecember 31, 2013 assessment of and report on internal controls over financial reporting. NASDAQ OMX iscurrently in the process of incorporating the internal controls and procedures of TR Corporate Solutionsbusinesses and eSpeed into the internal controls over financial reporting for our assessment of and report oninternal controls over financial reporting for December 31, 2014. There have been no other changes in NASDAQOMX’s internal controls over financial reporting (as defined in Rule 13a-15(f) and Rule 15d-15(f) under theExchange Act) that occurred during NASDAQ OMX’s 2013 fiscal year that have materially affected, or arereasonably likely to materially affect, NASDAQ OMX’s internal controls over financial reporting.
Management’s Report on Internal Control Over Financial Reporting
Management is responsible for the preparation and integrity of the consolidated financial statementsappearing in the reports that we file with the SEC. The consolidated financial statements were prepared inconformity with U.S. generally accepted accounting principles and include amounts based on management’sestimates and judgments.
Management is also responsible for establishing and maintaining adequate internal control over NASDAQOMX’s financial reporting. Although there are inherent limitations in the effectiveness of any system of internalcontrol over financial reporting, we maintain a system of internal control that is designed to provide reasonableassurance as to the fair and reliable preparation and presentation of the consolidated financial statements, as wellas to safeguard assets from unauthorized use or disposition that could have a material effect on the financialstatements.
Our management assessed the effectiveness of our internal control over financial reporting as ofDecember 31, 2013, based on criteria established in Internal Control—Integrated Framework issued by theCommittee of Sponsoring Organizations of the Treadway Commission (COSO) (1992 framework). Thisevaluation included review of the documentation of controls, evaluation of the design effectiveness of controls,testing of the operating effectiveness of controls and a conclusion on this evaluation. Based on its assessment,our management believes that, as of December 31, 2013, our internal control over financial reporting is effective.
Management’s assessment of and conclusion on the effectiveness of internal control over financial reportingdid not include, in accordance with SEC guidance, the internal controls of the acquired TR Corporate Solutionsbusinesses and eSpeed which are included in the 2013 consolidated financial statements and in 2013 reflect totalassets constituting 14% of consolidated total assets including 19% of goodwill and intangible assets, net, 2% ofconsolidated total liabilities and approximately 9% of the total revenues less transaction rebates, brokerage,clearance and exchange fees, of consolidated results.
Ernst & Young LLP, an independent registered public accounting firm, has issued an attestation report onNASDAQ OMX’s internal control over financial reporting, which is included herein.
94

Report of Independent Registered Public Accounting Firm
The Board of Directors and Stockholders of The NASDAQ OMX Group, Inc.
We have audited The NASDAQ OMX Group, Inc.’s internal control over financial reporting as ofDecember 31, 2013, based on criteria established in Internal Control—Integrated Framework issued by theCommittee of Sponsoring Organizations of the Treadway Commission (1992 framework) (the COSO criteria). TheNASDAQ OMX Group, Inc.’s management is responsible for maintaining effective internal control over financialreporting, and for its assessment of the effectiveness of internal control over financial reporting included in theaccompanying Management’s Report on Internal Control Over Financial Reporting. Our responsibility is to expressan opinion on the company’s internal control over financial reporting based on our audit.
We conducted our audit in accordance with the standards of the Public Company Accounting OversightBoard (United States). Those standards require that we plan and perform the audit to obtain reasonable assuranceabout whether effective internal control over financial reporting was maintained in all material respects. Ouraudit included obtaining an understanding of internal control over financial reporting, assessing the risk that amaterial weakness exists, testing and evaluating the design and operating effectiveness of internal control basedon the assessed risk, and performing such other procedures as we considered necessary in the circumstances. Webelieve that our audit provides a reasonable basis for our opinion.
A company’s internal control over financial reporting is a process designed to provide reasonable assuranceregarding the reliability of financial reporting and the preparation of financial statements for external purposes inaccordance with generally accepted accounting principles. A company’s internal control over financial reportingincludes those policies and procedures that (1) pertain to the maintenance of records that, in reasonable detail,accurately and fairly reflect the transactions and dispositions of the assets of the company; (2) provide reasonableassurance that transactions are recorded as necessary to permit preparation of financial statements in accordancewith generally accepted accounting principles, and that receipts and expenditures of the company are being madeonly in accordance with authorizations of management and directors of the company; and (3) provide reasonableassurance regarding prevention or timely detection of unauthorized acquisition, use, or disposition of thecompany’s assets that could have a material effect on the financial statements.
Because of its inherent limitations, internal control over financial reporting may not prevent or detectmisstatements. Also, projections of any evaluation of effectiveness to future periods are subject to the risk thatcontrols may become inadequate because of changes in conditions, or that the degree of compliance with thepolicies or procedures may deteriorate.
As indicated in the accompanying Management’s Report on Internal Control Over Financial Reporting,management’s assessment of and conclusion on the effectiveness of internal control over financial reporting didnot include the internal controls of the acquired TR Corporate Solutions businesses and eSpeed which areincluded in the 2013 consolidated financial statements of The NASDAQ OMX Group, Inc. and constituted 14%of consolidated total assets, including 19% of goodwill and intangibles, net and 2% of consolidated liabilities asof December 31, 2013 and approximately 9% of the total revenues less transaction rebates, brokerage, clearanceand exchange fees for the year then ended. Our audit of internal control over financial reporting of TheNASDAQ OMX Group, Inc. also did not include an evaluation of the internal control over financial reporting ofthe acquired TR Corporate Solutions businesses and eSpeed.
In our opinion, The NASDAQ OMX Group, Inc. maintained, in all material respects, effective internalcontrol over financial reporting as of December 31, 2013, based on the COSO criteria.
We also have audited, in accordance with the standards of the Public Company Accounting Oversight Board(United States), the consolidated balance sheets of The NASDAQ OMX Group, Inc. as of December 31, 2013and 2012, and the related consolidated statements of income, comprehensive income, changes in equity, and cashflows for each of the three years in the period ended December 31, 2013 of The NASDAQ OMX Group, Inc. andour report dated February 24, 2014 expressed an unqualified opinion thereon.
/s/ Ernst & Young LLP
New York, New YorkFebruary 24, 2014
95
Item 9B. Other Information.
None.
Part III
Item 10. Directors, Executive Officers and Corporate Governance.
Information about NASDAQ OMX’s directors, as required by Item 401 of Regulation S-K, is incorporatedby reference from the discussion under the caption “Proposal I: Election of Directors” in NASDAQ OMX’sproxy statement for the 2014 Annual Meeting of Stockholders, or the Proxy. Information about NASDAQOMX’s executive officers, as required by Item 401 of Regulation S-K, is incorporated by reference from thediscussion under the caption “Executive Officers of NASDAQ OMX” in the Proxy. Information about Section 16reports, as required by Item 405 of Regulation S-K, is incorporated by reference from the discussion under thecaption “Section 16(a) Beneficial Ownership Reporting Compliance” in the Proxy. Information about NASDAQOMX’s code of ethics, as required by Item 406 of Regulation S-K, is incorporated by reference from thediscussion under the caption “NASDAQ OMX’s Corporate Governance” in the Proxy. Information aboutNASDAQ OMX’s nomination procedures, audit committee and audit committee financial experts, as required byItems 407(c)(3), 407(d)(4) and 407(d)(5) of Regulation S-K, is incorporated by reference from the discussionunder the caption “NASDAQ OMX’s Corporate Governance” in the Proxy.
Item 11. Executive Compensation.
Information about NASDAQ OMX’s director and executive compensation, as required by Items 402,407(e)(4) and 407(e)(5) of Regulation S-K, is incorporated by reference from the discussion under the captions“Director Compensation,” “Compensation Discussion and Analysis,” “Management Compensation CommitteeReport,” “Management Compensation Committee Interlocks and Insider Participation” and “ExecutiveCompensation” in the Proxy.
Item 12. Security Ownership of Certain Beneficial Owners and Management and Related StockholderMatters.
Information about security ownership of certain beneficial owners and management, as required by Item 403of Regulation S-K, is incorporated by reference from the discussion under the caption “Security Ownership ofCertain Beneficial Owners and Management” in the Proxy.
96
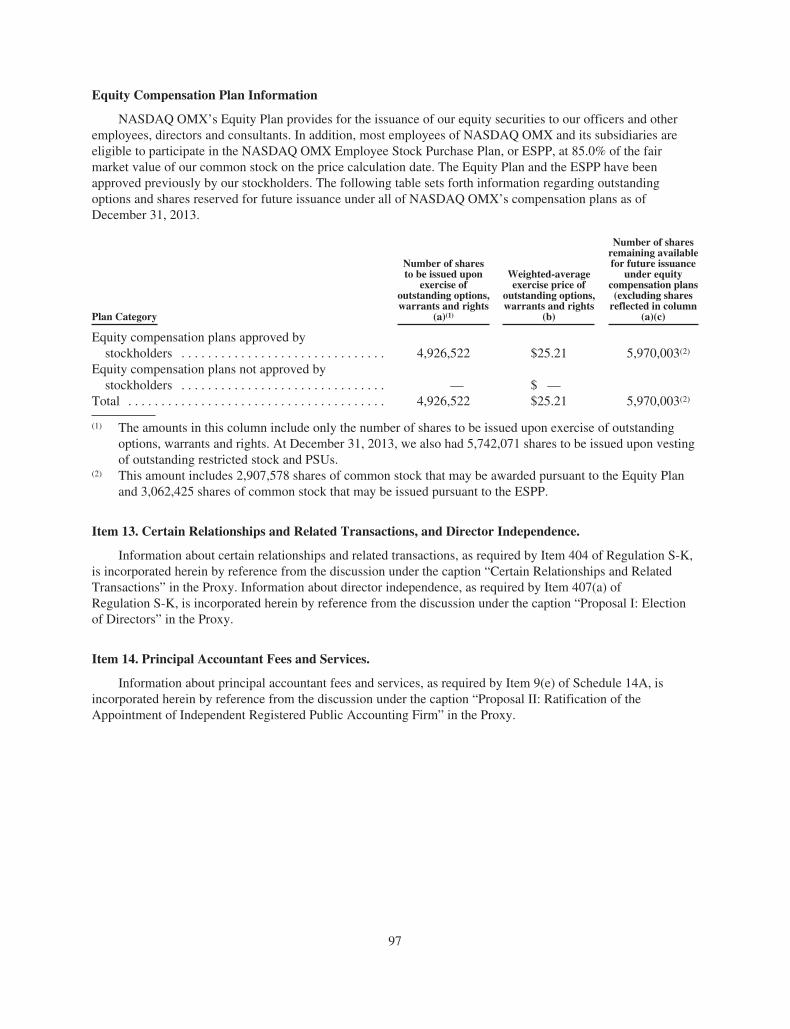
Equity Compensation Plan Information
NASDAQ OMX’s Equity Plan provides for the issuance of our equity securities to our officers and otheremployees, directors and consultants. In addition, most employees of NASDAQ OMX and its subsidiaries areeligible to participate in the NASDAQ OMX Employee Stock Purchase Plan, or ESPP, at 85.0% of the fairmarket value of our common stock on the price calculation date. The Equity Plan and the ESPP have beenapproved previously by our stockholders. The following table sets forth information regarding outstandingoptions and shares reserved for future issuance under all of NASDAQ OMX’s compensation plans as ofDecember 31, 2013.
Plan Category
Number of sharesto be issued upon
exercise ofoutstanding options,warrants and rights
(a)(1)
Weighted-averageexercise price of
outstanding options,warrants and rights
(b)
Number of sharesremaining availablefor future issuance
under equitycompensation plans(excluding shares
reflected in column(a)(c)
Equity compensation plans approved bystockholders . . . . . . . . . . . . . . . . . . . . . . . . . . . . . . . 4,926,522 $25.21 5,970,003(2)
Equity compensation plans not approved bystockholders . . . . . . . . . . . . . . . . . . . . . . . . . . . . . . . — $ —
Total . . . . . . . . . . . . . . . . . . . . . . . . . . . . . . . . . . . . . . . 4,926,522 $25.21 5,970,003(2)
(1) The amounts in this column include only the number of shares to be issued upon exercise of outstandingoptions, warrants and rights. At December 31, 2013, we also had 5,742,071 shares to be issued upon vestingof outstanding restricted stock and PSUs.
(2) This amount includes 2,907,578 shares of common stock that may be awarded pursuant to the Equity Planand 3,062,425 shares of common stock that may be issued pursuant to the ESPP.
Item 13. Certain Relationships and Related Transactions, and Director Independence.
Information about certain relationships and related transactions, as required by Item 404 of Regulation S-K,is incorporated herein by reference from the discussion under the caption “Certain Relationships and RelatedTransactions” in the Proxy. Information about director independence, as required by Item 407(a) ofRegulation S-K, is incorporated herein by reference from the discussion under the caption “Proposal I: Electionof Directors” in the Proxy.
Item 14. Principal Accountant Fees and Services.
Information about principal accountant fees and services, as required by Item 9(e) of Schedule 14A, isincorporated herein by reference from the discussion under the caption “Proposal II: Ratification of theAppointment of Independent Registered Public Accounting Firm” in the Proxy.
97

Part IV
Item 15. Exhibits, Financial Statement Schedules.
(a)(1) Financial Statements
See “Index to Consolidated Financial Statements and Schedule.”
(a)(2) Financial Statement Schedules
See “Index to Consolidated Financial Statements and Schedule.”
All other schedules for which provision is made in the applicable accounting regulations of the Securitiesand Exchange Commission are not required under the related instructions or are inapplicable and therefore havebeen omitted.
(a)(3) Exhibits
Exhibit Index
ExhibitNumber
2.1 Purchase Agreement, dated as of April 1, 2013, among The NASDAQ OMX Group, Inc., BGCPartners, Inc., BGC Holdings, L.P., BGC Partners, L.P., and, solely for purposes of certain sectionsthereof, Cantor Fitzgerald, L.P. (incorporated herein by reference to Exhibit 2.1 to the QuarterlyReport on Form 10-Q for the quarter ended June 30, 2013 filed on August 8, 2013).
2.2 Asset Purchase Agreement, dated as of May 17, 2013, among NASDAQ OMX CorporateSolutions, LLC, Thomson Reuters (Markets) LLC, Thomson Reuters Global Resources, and,solely for purposes of certain sections thereof, The NASDAQ OMX Group, Inc. and ThomsonReuters Corporation (incorporated herein by reference to Exhibit 2.2 to the Quarterly Report onForm 10-Q for the quarter ended June 30, 2013 filed on August 8, 2013).
3.1 Amended and Restated Certificate of Incorporation of NASDAQ OMX (incorporated herein byreference to Exhibit 3.1 to the Current Report on Form 8-K filed on January 28, 2014).
3.1.1 Certificate of Elimination of NASDAQ OMX’s Series A Convertible Preferred Stock(incorporated herein by reference to Exhibit 3.1.1 to the Current Report on Form 8-K filed onJanuary 28, 2014).
3.2 By-Laws of NASDAQ OMX (incorporated herein by reference to Exhibit 3.2 to the CurrentReport on Form 8-K filed on January 28, 2014).
4.1 Form of Common Stock certificate (incorporated herein by reference to Exhibit 4.1 to theRegistration Statement on Form 10 filed on April 30, 2001).
4.2 The NASDAQ OMX Group Inc.’s Stockholders’ Agreement, dated as of February 27, 2008,between The NASDAQ OMX Group, Inc. and Borse Dubai Limited (incorporated herein byreference to Exhibit 10.2 to the Current Report on Form 8-K filed on March 3, 2008).
4.2.1 First Amendment to The NASDAQ OMX Group Inc.’s Stockholders’ Agreement, dated as ofFebruary 19, 2009, between The NASDAQ OMX Group, Inc. and Borse Dubai Limited(incorporated herein by reference to Exhibit 4.10.1 to the Annual Report on Form 10-K for theyear ended December 31, 2008 filed on February 26, 2009).
98

ExhibitNumber
4.3 Registration Rights Agreement, dated as of February 27, 2008, among The NASDAQ OMXGroup, Inc., Borse Dubai Limited and Borse Dubai Nasdaq Share Trust (incorporated herein byreference to Exhibit 10.3 to the Current Report on Form 8-K filed on March 3, 2008).
4.3.1 First Amendment to Registration Rights Agreement, dated as of February 19, 2009, among TheNASDAQ OMX Group, Inc., Borse Dubai Limited and Borse Dubai Nasdaq Share Trust(incorporated herein by reference to Exhibit 4.11.1 to the Annual Report on Form 10-K for theyear ended December 31, 2008 filed on February 26, 2009).
4.4 Indenture, dated as of January 15, 2010, between NASDAQ OMX and Wells Fargo Bank, NationalAssociation, as Trustee (incorporated herein by reference to Exhibit 4.1 to the Current Report onForm 8-K filed on January 19, 2010).
4.5 First Supplemental Indenture, dated as of January 15, 2010, among NASDAQ OMX and WellsFargo Bank, National Association, as Trustee (incorporated herein by reference to Exhibit 4.2 tothe Current Report on Form 8-K filed on January 19, 2010).
4.6 Second Supplemental Indenture, dated as of December 17, 2010, among NASDAQ OMX andWells Fargo Bank, National Association, as Trustee (incorporated herein by reference toExhibit 4.1 to the Current Report on Form 8-K filed on December 21, 2010).
4.7 NASDAQ Stockholders’ Agreement, dated as of December 16, 2010, between The NASDAQOMX Group, Inc. and Investor AB (incorporated herein by reference to Exhibit 4.12 to the AnnualReport on Form 10-K for the year ended December 31, 2010 filed on February 24, 2011).
4.8 Indenture, dated as of June 7, 2013, between The NASDAQ OMX Group, Inc. and Wells FargoBank, National Association, as Trustee (incorporated herein by reference to Exhibit 4.1 to theCurrent Report on Form 8-K filed on June 10, 2013).
4.9 Supplemental Indenture, dated as of June 7, 2013, among The NASDAQ OMX Group, Inc., WellsFargo Bank, National Association, as Trustee, Deutsche Bank AG, London Branch, as payingagent, and Deutsche Bank Luxembourg S.A., as registrar and transfer agent (incorporated hereinby reference to Exhibit 4.2 to the Current Report on Form 8-K filed on June 10, 2013).
4.10 Registration Rights Agreement, dated as of June 28, 2013, by and among The NASDAQ OMXGroup, Inc., BGC Partners, Inc., BGC Holdings, L.P. and BGC Partners, L.P. (incorporated hereinby reference to Exhibit 10.1 to the Current Report on Form 8-K filed on July 1, 2013).
10.1 Amended and Restated Board Compensation Policy, effective on October 17, 2013.*
10.2 The NASDAQ OMX Group, Inc. 2010 Executive Corporate Incentive Plan, effective as ofJanuary 1, 2010 (incorporated herein by reference to Exhibit 10.1 to the Quarterly Report onForm 10-Q for the quarter ended June 30, 2010 filed on August 4, 2010).*
10.3 Form of NASDAQ OMX Non-Qualified Stock Option Award Certificate (incorporated herein byreference to Exhibit 10.3 to the Annual Report on Form 10-K for the year ended December 31,2010 filed on February 24, 2011).*
10.4 Form of NASDAQ OMX Restricted Unit Award Certificate (employees) (incorporated herein byreference to Exhibit 10.4 to the Annual Report on Form 10-K for the year ended December 31,2010 filed on February 24, 2011).*
10.5 Form of NASDAQ OMX Restricted Stock Unit Award Certificate (directors) (incorporated hereinby reference to Exhibit 10.1 to the Quarterly Report on Form 10-Q for the quarter endedSeptember 30, 2013 filed on November 7, 2013).*
99

ExhibitNumber
10.6 Form of NASDAQ OMX One-Year Performance Share Unit Agreement (incorporated herein byreference to Exhibit 10.2 to the Quarterly Report on Form 10-Q for the quarter endedSeptember 30, 2013 filed on November 7, 2013).*
10.7 Form of NASDAQ OMX Three-Year Performance Share Unit Agreement (incorporated herein byreference to Exhibit 10.3 to the Quarterly Report on Form 10-Q for the quarter endedSeptember 30, 2013 filed on November 7, 2013).*
10.8 Amended and Restated Supplemental Executive Retirement Plan, dated as of December 17, 2008(incorporated herein by reference to Exhibit 10.6 to the Annual Report on Form 10-K for the yearended December 31, 2008 filed on February 26, 2009).*
10.8.1 Amendment No. 1 to Amended and Restated Supplemental Executive Retirement Plan, effective asof December 31, 2008 (incorporated herein by reference to Exhibit 10.6.1 to the Annual Report onForm 10-K for the year ended December 31, 2008 filed on February 26, 2009).*
10.9 The NASDAQ OMX Group, Inc. Supplemental Employer Retirement Contribution Plan, dated asof December 17, 2008 (incorporated herein by reference to Exhibit 10.7 to the Annual Report onForm 10-K for the year ended December 31, 2008 filed on February 26, 2009).*
10.10 Employment Agreement between NASDAQ OMX and Robert Greifeld, effective as ofFebruary 22, 2012 (incorporated herein by reference to Exhibit 10.1 to the Current Report onForm 8-K filed on February 28, 2012).*
10.10.1 Memorandum of Understanding between NASDAQ OMX and Robert Greifeld, effective as ofDecember 11, 2012 (incorporated herein by reference to Exhibit 10.10.1 to the Annual Report onForm 10-K filed on February 24, 2013).*
10.11 Nonqualified Stock Option Agreement between Nasdaq and Robert Greifeld reflectingDecember 13, 2006 grant (incorporated herein by reference to Exhibit 10.13 to the Annual Reporton Form 10-K for the year ended December 31, 2007 filed on February 25, 2008).*
10.12 Nonqualified Stock Option Agreement between NASDAQ OMX and Robert Greifeld reflectingJune 30, 2009 grant (incorporated herein by reference to Exhibit 10.11 to the Annual Report onForm 10-K for the year ended December 31, 2009 filed on February 18, 2010).*
10.13 Form of Amended and Restated Letter Agreement, effective as of December 31, 2008, betweenNASDAQ OMX and Certain Executive Officers (incorporated herein by reference to Exhibit 10.12to the Annual Report on Form 10-K for the year ended December 31, 2008 filed on February 26,2009).*
10.14 The NASDAQ OMX Group, Inc. Change in Control Severance Plan for Executive Vice Presidentsand Senior Vice Presidents, effective November 26, 2013 (incorporated herein by reference toExhibit 10.1 to the Current Report on Form 8-K filed on November 29, 2013).*
10.15 Employment Agreement between Nasdaq and Edward Knight, effective as of December 29, 2000(incorporated herein by reference to Exhibit 10.14 to the Annual Report on Form 10-K for the yearended December 31, 2002 filed on March 31, 2003).*
10.15.1 First Amendment to Employment Agreement between Nasdaq and Edward Knight, effectiveFebruary 1, 2002 (incorporated herein by reference to Exhibit 10.14.1 to the Annual Report onForm 10-K for the year ended December 31, 2002 filed on March 31, 2003).*
10.15.2 Second Amendment to Employment Agreement between NASDAQ OMX and Edward Knight,effective as of December 31, 2008 (incorporated herein by reference to Exhibit 10.13.2 to theAnnual Report on Form 10-K for the year ended December 31, 2008 filed on February 26, 2009).*
100
ExhibitNumber
10.15.3 Third Amendment to Employment Agreement between NASDAQ OMX and Edward Knight,effective as of February 22, 2012 (incorporated herein by reference to Exhibit 10.2 to the CurrentReport on Form 8-K filed on February 28, 2012).*
10.16 Employment Agreement, dated as of June 24, 2008, between OMX AB and Hans-Ole Jochumsen(incorporated herein by reference to Exhibit 10.18 to the Annual Report on Form 10-K for the yearended December 31, 2009 filed on February 18, 2010).*
10.17 Credit Agreement, dated as of September 19, 2011, among NASDAQ OMX, Bank of America,N.A., Merrill Lynch, Pierce, Fenner & Smith Incorporated, J.P. Morgan Securities, Inc., NordeaBank AB (publ.), Merchant Banking, Skandinaviska Enskilda Banken AB (publ.) UBS SecuritiesLLC and Wells Fargo Securities, LLC (incorporated herein by reference to Exhibit 4.1 to theCurrent Report on Form 8-K filed on September 22, 2011).
10.17.1 Amendment No. 1, dated as of June 12, 2013, to the Credit Agreement by and among TheNASDAQ OMX Group, Inc., as borrower, Bank of America, N.A., as Administrative Agent,Swingline Lender and Issuing Bank, and the Lenders party thereto (incorporated herein byreference to Exhibit 10.1 to the Quarterly Report on Form 10-Q for the quarter ended June 30,2013 filed on August 8, 2013).
11 Statement regarding computation of per share earnings (incorporated herein by reference fromNote 14 to the consolidated financial statements under Part II, Item 9 of this Form 10-K).
12.1 Computation of Ratio of Earnings to Fixed Charges.
21.1 List of all subsidiaries.
23.1 Consent of Ernst & Young.
24.1 Powers of Attorney.
31.1 Certification of Chief Executive Officer pursuant to Section 302 of the Sarbanes-Oxley Act of2002 (“Sarbanes-Oxley”).
31.2 Certification of Chief Financial Officer and Executive Vice President, Corporate Strategy pursuantto Section 302 of Sarbanes-Oxley.
32.1 Certifications Pursuant to 18 U.S.C. Section 1350, as adopted pursuant to Section 906 ofSarbanes-Oxley.
101.INS XBRL Instance Document**
101.SCH XBRL Taxonomy Extension Schema
101.CAL XBRL Taxonomy Extension Calculation Linkbase
101.DEF Taxonomy Extension Definition Linkbase
101.LAB XBRL Taxonomy Extension Label Linkbase
101.PRE XBRL Taxonomy Extension Presentation Linkbase
* Management contract or compensatory plan or arrangement.** The following materials from The NASDAQ OMX Group, Inc. Annual Report on Form 10-K for the year
ended December 31, 2013, formatted in XBRL (eXtensible Business Reporting Language); (i) ConsolidatedStatements of Income for the years ended December 31, 2013, 2012 and 2011; (ii) Consolidated BalanceSheets at December 31, 2013 and December 31, 2012; (iii) Consolidated Statements of ComprehensiveIncome for the years ended December 31, 2013, 2012 and 2011; (iv) Consolidated Statements of Changes inEquity for the years ended December 31, 2013, 2012 and 2011: (v) Consolidated Statements of Cash Flowsfor the years ended December 31, 2013, 2012 and 2011; and (vi) notes to consolidated financial statements.
101

(b) Exhibits:
See Item 15(a)(3) above.
(c) Financial Statement Schedules:
See Item 15(a)(2) above.
102

SIGNATURES
Pursuant to the requirements of Section 13 or 15(d) of the Securities Exchange Act of 1934, the registranthas duly caused this report to be signed on its behalf by the undersigned, thereunto duly authorized, onFebruary 24, 2014.
THE NASDAQ OMX GROUP, INC.
By: /S/ ROBERT GREIFELD
Name: Robert GreifeldTitle: Chief Executive Officer
Pursuant to the requirements of the Securities Exchange Act of 1934, this report has been signed below bythe following persons on behalf of the registrant and in the capacities indicated as of February 24, 2014.
Name Title
/S/ ROBERT GREIFELD
Robert Greifeld
Chief Executive Officer and Director(Principal Executive Officer)
/S/ LEE SHAVEL
Lee Shavel
Chief Financial Officer and Executive Vice President,Corporate Strategy
(Principal Financial Officer)
/S/ RONALD HASSEN
Ronald Hassen
Senior Vice President and Controller(Principal Accounting Officer)
*Börje Ekholm
Chairman of the Board
*Steven D. Black
Director
*Glenn H. Hutchins
Director
*Essa Kazim
Director
*John D. Markese
Director
*Ellyn A. McColgan
Director
*Thomas F. O’Neill
Director
103

Name Title
*James S. Riepe
Director
*Michael R. Splinter
Director
*Lars Wedenborn
Director
* Pursuant to Power of Attorney
By: /S/ EDWARD S. KNIGHT
Edward S. KnightAttorney-in-Fact
104

THE NASDAQ OMX GROUP, INC.
INDEX TO CONSOLIDATED FINANCIAL STATEMENTS AND SCHEDULE
The following consolidated financial statements and schedule of The NASDAQ OMX Group, Inc. and itssubsidiaries are presented herein on the page indicated:
Report of Independent Registered Public Accounting Firm . . . . . . . . . . . . . . . . . . . . . . . . . . . . . . . . . . . . . . . F-2Consolidated Balance Sheets . . . . . . . . . . . . . . . . . . . . . . . . . . . . . . . . . . . . . . . . . . . . . . . . . . . . . . . . . . . . . . . F-3Consolidated Statements of Income . . . . . . . . . . . . . . . . . . . . . . . . . . . . . . . . . . . . . . . . . . . . . . . . . . . . . . . . . F-4Consolidated Statements of Comprehensive Income . . . . . . . . . . . . . . . . . . . . . . . . . . . . . . . . . . . . . . . . . . . . F-5Consolidated Statements of Changes in Equity . . . . . . . . . . . . . . . . . . . . . . . . . . . . . . . . . . . . . . . . . . . . . . . . . F-6Consolidated Statements of Cash Flows . . . . . . . . . . . . . . . . . . . . . . . . . . . . . . . . . . . . . . . . . . . . . . . . . . . . . . F-8Notes to Consolidated Financial Statements . . . . . . . . . . . . . . . . . . . . . . . . . . . . . . . . . . . . . . . . . . . . . . . . . . . F-9Financial Statement Schedule: Schedule II—Valuation and Qualifying Accounts . . . . . . . . . . . . . . . . . . . . . 1
F-1
Report of Independent Registered Public Accounting Firm
The Board of Directors and Stockholders of The NASDAQ OMX Group, Inc.
We have audited the accompanying consolidated balance sheets of The NASDAQ OMX Group, Inc. (the“Company”) as of December 31, 2013 and 2012, and the related consolidated statements of income,comprehensive income, changes in equity, and cash flows for each of the three years in the period endedDecember 31, 2013. Our audits also included the financial statement schedule listed in the Index underItem 15(a)(2). These financial statements and schedule are the responsibility of the Company’s management. Ourresponsibility is to express an opinion on these financial statements and schedule based on our audits.
We conducted our audits in accordance with the standards of the Public Company Accounting OversightBoard (United States). Those standards require that we plan and perform the audit to obtain reasonable assuranceabout whether the financial statements are free of material misstatement. An audit includes examining, on a testbasis, evidence supporting the amounts and disclosures in the financial statements. An audit also includesassessing the accounting principles used and significant estimates made by management, as well as evaluatingthe overall financial statement presentation. We believe that our audits provide a reasonable basis for ouropinion.
In our opinion, the financial statements referred to above present fairly, in all material respects, theconsolidated financial position of The NASDAQ OMX Group, Inc. at December 31, 2013 and 2012, and theconsolidated results of its operations and its cash flows for each of the three years in the period endedDecember 31, 2013, in conformity with U.S. generally accepted accounting principles. Also, in our opinion, therelated financial statement schedule, when considered in relation to the basic financial statements taken as awhole, presents fairly in all material respects the information set forth therein.
We also have audited, in accordance with the standards of the Public Company Accounting Oversight Board(United States), The NASDAQ OMX Group, Inc.’s internal control over financial reporting as of December 31,2013, based on criteria established in Internal Control-Integrated Framework issued by the Committee ofSponsoring Organizations of the Treadway Commission (1992 framework) and our report dated February 24,2014 expressed an unqualified opinion thereon.
/s/ Ernst & Young LLP
New York, New YorkFebruary 24, 2014
F-2

The NASDAQ OMX Group, Inc.
Consolidated Balance Sheets(in millions, except share and par value amounts)
December 31,2013
December 31,2012
AssetsCurrent assets:
Cash and cash equivalents . . . . . . . . . . . . . . . . . . . . . . . . . . . . . . . . . . . . . . . . . . . . . . . . . . . . . . . . . . . . . . . . $ 425 $ 497Restricted cash . . . . . . . . . . . . . . . . . . . . . . . . . . . . . . . . . . . . . . . . . . . . . . . . . . . . . . . . . . . . . . . . . . . . . . . . . 84 85Financial investments, at fair value . . . . . . . . . . . . . . . . . . . . . . . . . . . . . . . . . . . . . . . . . . . . . . . . . . . . . . . . . 162 223Receivables, net . . . . . . . . . . . . . . . . . . . . . . . . . . . . . . . . . . . . . . . . . . . . . . . . . . . . . . . . . . . . . . . . . . . . . . . . 393 333Deferred tax assets . . . . . . . . . . . . . . . . . . . . . . . . . . . . . . . . . . . . . . . . . . . . . . . . . . . . . . . . . . . . . . . . . . . . . . 12 33Default funds and margin deposits . . . . . . . . . . . . . . . . . . . . . . . . . . . . . . . . . . . . . . . . . . . . . . . . . . . . . . . . . . 1,961 209Other current assets . . . . . . . . . . . . . . . . . . . . . . . . . . . . . . . . . . . . . . . . . . . . . . . . . . . . . . . . . . . . . . . . . . . . . . 126 112
Total current assets . . . . . . . . . . . . . . . . . . . . . . . . . . . . . . . . . . . . . . . . . . . . . . . . . . . . . . . . . . . . . . . . . . . . . . . . . . 3,163 1,492Non-current restricted cash . . . . . . . . . . . . . . . . . . . . . . . . . . . . . . . . . . . . . . . . . . . . . . . . . . . . . . . . . . . . . . . . . . . . — 25Property and equipment, net . . . . . . . . . . . . . . . . . . . . . . . . . . . . . . . . . . . . . . . . . . . . . . . . . . . . . . . . . . . . . . . . . . . 268 211Non-current deferred tax assets . . . . . . . . . . . . . . . . . . . . . . . . . . . . . . . . . . . . . . . . . . . . . . . . . . . . . . . . . . . . . . . . 404 294Goodwill . . . . . . . . . . . . . . . . . . . . . . . . . . . . . . . . . . . . . . . . . . . . . . . . . . . . . . . . . . . . . . . . . . . . . . . . . . . . . . . . . . 6,186 5,335Intangible assets, net . . . . . . . . . . . . . . . . . . . . . . . . . . . . . . . . . . . . . . . . . . . . . . . . . . . . . . . . . . . . . . . . . . . . . . . . . 2,386 1,650Other non-current assets . . . . . . . . . . . . . . . . . . . . . . . . . . . . . . . . . . . . . . . . . . . . . . . . . . . . . . . . . . . . . . . . . . . . . . 170 125
Total assets . . . . . . . . . . . . . . . . . . . . . . . . . . . . . . . . . . . . . . . . . . . . . . . . . . . . . . . . . . . . . . . . . . . . . . . . . . . . . . . . $12,577 $ 9,132
LiabilitiesCurrent liabilities:
Accounts payable and accrued expenses . . . . . . . . . . . . . . . . . . . . . . . . . . . . . . . . . . . . . . . . . . . . . . . . . . . . . $ 228 $ 172Sections 31 fees payable to SEC . . . . . . . . . . . . . . . . . . . . . . . . . . . . . . . . . . . . . . . . . . . . . . . . . . . . . . . . . . . . 82 97Accrued personnel costs . . . . . . . . . . . . . . . . . . . . . . . . . . . . . . . . . . . . . . . . . . . . . . . . . . . . . . . . . . . . . . . . . . 154 111Deferred revenue . . . . . . . . . . . . . . . . . . . . . . . . . . . . . . . . . . . . . . . . . . . . . . . . . . . . . . . . . . . . . . . . . . . . . . . . 151 139Other current liabilities . . . . . . . . . . . . . . . . . . . . . . . . . . . . . . . . . . . . . . . . . . . . . . . . . . . . . . . . . . . . . . . . . . . 141 119Deferred tax liabilities . . . . . . . . . . . . . . . . . . . . . . . . . . . . . . . . . . . . . . . . . . . . . . . . . . . . . . . . . . . . . . . . . . . 38 35Default funds and margin deposits . . . . . . . . . . . . . . . . . . . . . . . . . . . . . . . . . . . . . . . . . . . . . . . . . . . . . . . . . . 1,961 209Current portion of debt obligations . . . . . . . . . . . . . . . . . . . . . . . . . . . . . . . . . . . . . . . . . . . . . . . . . . . . . . . . . . 45 136
Total current liabilities . . . . . . . . . . . . . . . . . . . . . . . . . . . . . . . . . . . . . . . . . . . . . . . . . . . . . . . . . . . . . . . . . . . . . . . 2,800 1,018Debt obligations . . . . . . . . . . . . . . . . . . . . . . . . . . . . . . . . . . . . . . . . . . . . . . . . . . . . . . . . . . . . . . . . . . . . . . . . . . . . 2,589 1,840Non-current deferred tax liabilities . . . . . . . . . . . . . . . . . . . . . . . . . . . . . . . . . . . . . . . . . . . . . . . . . . . . . . . . . . . . . . 708 713Non-current deferred revenue . . . . . . . . . . . . . . . . . . . . . . . . . . . . . . . . . . . . . . . . . . . . . . . . . . . . . . . . . . . . . . . . . . 143 156Other non-current liabilities . . . . . . . . . . . . . . . . . . . . . . . . . . . . . . . . . . . . . . . . . . . . . . . . . . . . . . . . . . . . . . . . . . . 153 196
Total liabilities . . . . . . . . . . . . . . . . . . . . . . . . . . . . . . . . . . . . . . . . . . . . . . . . . . . . . . . . . . . . . . . . . . . . . . . . . . . . . 6,393 3,923
Commitments and contingencies
EquityNASDAQ OMX stockholders’ equity:
Common stock, $0.01 par value, 300,000,000 shares authorized, shares issued: 214,419,155 atDecember 31, 2013 and 213,426,908 at December 31, 2012; shares outstanding: 169,357,084 atDecember 31, 2013 and 165,605,838 at December 31, 2012 . . . . . . . . . . . . . . . . . . . . . . . . . . . . . . . . . . . . 2 2
Preferred stock, 30,000,000 shares authorized, series A convertible preferred stock: shares issued:1,600,000 at December 31, 2013 and December 31, 2012; shares outstanding: none at December 31,2013 and December 31, 2012 . . . . . . . . . . . . . . . . . . . . . . . . . . . . . . . . . . . . . . . . . . . . . . . . . . . . . . . . . . . . — —
Additional paid-in capital . . . . . . . . . . . . . . . . . . . . . . . . . . . . . . . . . . . . . . . . . . . . . . . . . . . . . . . . . . . . . . . . . 4,278 3,771Common stock in treasury, at cost: 45,062,071 shares at December 31, 2013 and 47,821,070 shares at
December 31, 2012 . . . . . . . . . . . . . . . . . . . . . . . . . . . . . . . . . . . . . . . . . . . . . . . . . . . . . . . . . . . . . . . . . . . . (1,005) (1,058)Accumulated other comprehensive loss . . . . . . . . . . . . . . . . . . . . . . . . . . . . . . . . . . . . . . . . . . . . . . . . . . . . . . (67) (185)Retained earnings . . . . . . . . . . . . . . . . . . . . . . . . . . . . . . . . . . . . . . . . . . . . . . . . . . . . . . . . . . . . . . . . . . . . . . . 2,976 2,678
Total NASDAQ OMX stockholders’ equity . . . . . . . . . . . . . . . . . . . . . . . . . . . . . . . . . . . . . . . . . . . . . . . . . . . . . . 6,184 5,208Noncontrolling interests . . . . . . . . . . . . . . . . . . . . . . . . . . . . . . . . . . . . . . . . . . . . . . . . . . . . . . . . . . . . . . . . . . . . . . — 1
Total equity . . . . . . . . . . . . . . . . . . . . . . . . . . . . . . . . . . . . . . . . . . . . . . . . . . . . . . . . . . . . . . . . . . . . . . . . . . . . . . . . 6,184 5,209
Total liabilities and equity . . . . . . . . . . . . . . . . . . . . . . . . . . . . . . . . . . . . . . . . . . . . . . . . . . . . . . . . . . . . . . . . . . . . $12,577 $ 9,132
See accompanying notes to consolidated financial statements.
F-3

The NASDAQ OMX Group, Inc.
Consolidated Statements of Income(in millions, except per share amounts)
Year Ended December 31,
2013 2012 2011
Revenues:Market Services . . . . . . . . . . . . . . . . . . . . . . . . . . . . . . . . . . . . . . . . . . . . . . . . . . . . . $ 2,092 $ 2,206 $ 2,553Listing Services . . . . . . . . . . . . . . . . . . . . . . . . . . . . . . . . . . . . . . . . . . . . . . . . . . . . . 228 224 236Information Services . . . . . . . . . . . . . . . . . . . . . . . . . . . . . . . . . . . . . . . . . . . . . . . . . 442 406 391Technology Solutions . . . . . . . . . . . . . . . . . . . . . . . . . . . . . . . . . . . . . . . . . . . . . . . . . 449 284 258
Total revenues . . . . . . . . . . . . . . . . . . . . . . . . . . . . . . . . . . . . . . . . . . . . . . . . . . 3,211 3,120 3,438
Cost of revenues:Transaction rebates . . . . . . . . . . . . . . . . . . . . . . . . . . . . . . . . . . . . . . . . . . . . . . . . . . . (1,002) (1,104) (1,344)Brokerage, clearance and exchange fees . . . . . . . . . . . . . . . . . . . . . . . . . . . . . . . . . . (314) (342) (404)
Total cost of revenues . . . . . . . . . . . . . . . . . . . . . . . . . . . . . . . . . . . . . . . . . . . . (1,316) (1,446) (1,748)
Revenues less transaction rebates, brokerage, clearance and exchange fees . . . 1,895 1,674 1,690
Operating expenses:Compensation and benefits . . . . . . . . . . . . . . . . . . . . . . . . . . . . . . . . . . . . . . . . . . . . 539 454 458Marketing and advertising . . . . . . . . . . . . . . . . . . . . . . . . . . . . . . . . . . . . . . . . . . . . . 30 26 24Depreciation and amortization . . . . . . . . . . . . . . . . . . . . . . . . . . . . . . . . . . . . . . . . . . 122 104 109Professional and contract services . . . . . . . . . . . . . . . . . . . . . . . . . . . . . . . . . . . . . . . 151 107 91Computer operations and data communications . . . . . . . . . . . . . . . . . . . . . . . . . . . . 82 60 65Occupancy . . . . . . . . . . . . . . . . . . . . . . . . . . . . . . . . . . . . . . . . . . . . . . . . . . . . . . . . . 98 93 91Regulatory . . . . . . . . . . . . . . . . . . . . . . . . . . . . . . . . . . . . . . . . . . . . . . . . . . . . . . . . . 30 34 35Merger and strategic initiatives . . . . . . . . . . . . . . . . . . . . . . . . . . . . . . . . . . . . . . . . . 22 4 38Restructuring charges . . . . . . . . . . . . . . . . . . . . . . . . . . . . . . . . . . . . . . . . . . . . . . . . . 9 44 —General, administrative and other . . . . . . . . . . . . . . . . . . . . . . . . . . . . . . . . . . . . . . . 80 58 83Voluntary accommodation program . . . . . . . . . . . . . . . . . . . . . . . . . . . . . . . . . . . . . 44 — —
Total operating expenses . . . . . . . . . . . . . . . . . . . . . . . . . . . . . . . . . . . . . . . . . 1,207 984 994
Operating income . . . . . . . . . . . . . . . . . . . . . . . . . . . . . . . . . . . . . . . . . . . . . . . . . . . 688 690 696Interest income . . . . . . . . . . . . . . . . . . . . . . . . . . . . . . . . . . . . . . . . . . . . . . . . . . . . . . 9 10 11Interest expense . . . . . . . . . . . . . . . . . . . . . . . . . . . . . . . . . . . . . . . . . . . . . . . . . . . . . (111) (97) (119)Gain on sale of investment security . . . . . . . . . . . . . . . . . . . . . . . . . . . . . . . . . . . . . . 30 — —Asset impairment charges . . . . . . . . . . . . . . . . . . . . . . . . . . . . . . . . . . . . . . . . . . . . . (14) (40) (18)Dividend and investment income . . . . . . . . . . . . . . . . . . . . . . . . . . . . . . . . . . . . . . . . — — 1Loss on divestiture of business . . . . . . . . . . . . . . . . . . . . . . . . . . . . . . . . . . . . . . . . . — (14) —Net income (loss) from unconsolidated investees . . . . . . . . . . . . . . . . . . . . . . . . . . . (2) (1) 2
Income before income taxes . . . . . . . . . . . . . . . . . . . . . . . . . . . . . . . . . . . . . . . . . . 600 548 573Income tax provision . . . . . . . . . . . . . . . . . . . . . . . . . . . . . . . . . . . . . . . . . . . . . . . . . 216 199 190
Net income . . . . . . . . . . . . . . . . . . . . . . . . . . . . . . . . . . . . . . . . . . . . . . . . . . . . . . . . . 384 349 383Net loss attributable to noncontrolling interests . . . . . . . . . . . . . . . . . . . . . . . . . . . . 1 3 4
Net income attributable to NASDAQ OMX . . . . . . . . . . . . . . . . . . . . . . . . . . . . . $ 385 $ 352 $ 387
Per share information:Basic earnings per share . . . . . . . . . . . . . . . . . . . . . . . . . . . . . . . . . . . . . . . . . . . . . . . $ 2.30 $ 2.09 $ 2.20
Diluted earnings per share . . . . . . . . . . . . . . . . . . . . . . . . . . . . . . . . . . . . . . . . . . . . . $ 2.25 $ 2.04 $ 2.15
Cash dividends declared per common share . . . . . . . . . . . . . . . . . . . . . . . . . . . . . . . $ 0.52 $ 0.39 $ —
See accompanying notes to consolidated financial statements.
F-4

The NASDAQ OMX Group, Inc.
Consolidated Statements of Comprehensive Income(in millions)
Year Ended December 31,
2013 2012 2011
Net income . . . . . . . . . . . . . . . . . . . . . . . . . . . . . . . . . . . . . . . . . . . . . . . . . . . . . . . . . . . . . $384 $349 $ 383Other comprehensive income (loss):
Net unrealized holding gains (losses) on available-for-sale investment securities:Unrealized holding gains (losses) arising during period . . . . . . . . . . . . . . . . . . 26 4 (15)Reclassification adjustment for (gains) losses realized in net income on
available-for-sale investment securities . . . . . . . . . . . . . . . . . . . . . . . . . . . . . (30) — 18
Total . . . . . . . . . . . . . . . . . . . . . . . . . . . . . . . . . . . . . . . . . . . . . . . . . . . . . . . . . . . . . . (4) 4 3
Foreign currency translation gains (losses):Net foreign currency translation gains (losses) . . . . . . . . . . . . . . . . . . . . . . . . . (17) 262 (120)Income tax benefit (expense) . . . . . . . . . . . . . . . . . . . . . . . . . . . . . . . . . . . . . . . 127 (95) 40
Total . . . . . . . . . . . . . . . . . . . . . . . . . . . . . . . . . . . . . . . . . . . . . . . . . . . . . . . . . . . . . . 110 167 (80)
Employee benefit plans:Employee benefit plan adjustment gains (losses) . . . . . . . . . . . . . . . . . . . . . . . . 21 (10) (2)Income tax benefit (expense) . . . . . . . . . . . . . . . . . . . . . . . . . . . . . . . . . . . . . . . (9) 4 1
Total . . . . . . . . . . . . . . . . . . . . . . . . . . . . . . . . . . . . . . . . . . . . . . . . . . . . . . . . . . . . . . 12 (6) (1)
Total other comprehensive income (loss), net of tax . . . . . . . . . . . . . . . . . . . . . 118 165 (78)
Comprehensive income . . . . . . . . . . . . . . . . . . . . . . . . . . . . . . . . . . . . . . . . . . . . . . . . . . 502 514 305
Comprehensive loss attributable to noncontrolling interests . . . . . . . . . . . . . . . . . . . 1 3 4
Comprehensive income attributable to NASDAQ OMX . . . . . . . . . . . . . . . . . . . . . . . $503 $517 $ 309
See accompanying notes to consolidated financial statements.
F-5

The NASDAQ OMX Group, Inc.
Consolidated Statements of Changes in Equity(in millions, except share amounts)
Number ofCommon
SharesOutstanding
CommonStock at
Par Value
AdditionalPaid-inCapital
CommonStock In
Treasury atCost
AccumulatedOther
ComprehensiveLoss
RetainedEarnings
NoncontrollingInterests Total
Balance at December 31, 2010 . . . . . . . . . . . . . . . . . . . 175,782,683 $ 2 $3,780 $ (796) $(272) $2,004 $ 11 $4,729Net income (loss) . . . . . . . . . . . . . . . . . . . . . . . . . . . . . — — — — — 387 (4) 383Foreign currency translation, net of tax of $40 . . . . . . — — — — (80) — — (80)Employee benefit plan adjustments, net of tax of
$1 . . . . . . . . . . . . . . . . . . . . . . . . . . . . . . . . . . . . . . . — — — — (1) — — (1)Unrealized holding losses on available-for-sale
securities, net of reclassification for losses realizedin net income . . . . . . . . . . . . . . . . . . . . . . . . . . . . . . . — — — — 3 — — 3
Share repurchase program . . . . . . . . . . . . . . . . . . . . . . (3,983,481) — — (100) — — — (100)Tender offer related to the 2013 Convertible Notes . . . — — (9) — — — — (9)Amortization and vesting of restricted stock and
PSUs . . . . . . . . . . . . . . . . . . . . . . . . . . . . . . . . . . . . . 632,682 — 14 8 — — — 22Stock options amortization and exercises, net . . . . . . . 1,030,721 — (5) 22 — — — 17Other issuances of common stock, net . . . . . . . . . . . . . 90,334 — 13 6 — — — 19Sale of subsidiary shares to noncontrolling interests
and other adjustments . . . . . . . . . . . . . . . . . . . . . . . . — — — — — — 3 3
Balance at December 31, 2011 . . . . . . . . . . . . . . . . . . . 173,552,939 $ 2 $3,793 $ (860) $(350) $2,391 $ 10 $4,986Net income (loss) . . . . . . . . . . . . . . . . . . . . . . . . . . . . . — — — — — 352 (3) 349Foreign currency translation, net of tax of $95 . . . . . . — — — — 167 — — 167Employee benefit plan adjustments, net of tax of
$4 . . . . . . . . . . . . . . . . . . . . . . . . . . . . . . . . . . . . . . . — — — — (6) — — (6)Unrealized holding gains on available-for-sale
securities . . . . . . . . . . . . . . . . . . . . . . . . . . . . . . . . . . — — — — 4 — — 4Cash dividends declared per common share . . . . . . . . . — — — — — (65) — (65)Share repurchase program . . . . . . . . . . . . . . . . . . . . . . (11,544,457) — — (275) — — — (275)Amortization and vesting of restricted stock and
PSUs . . . . . . . . . . . . . . . . . . . . . . . . . . . . . . . . . . . . . 1,997,516 — (8) 44 — — — 36Stock options amortization and exercises, net . . . . . . . 2,051,066 — (22) 45 — — — 23Other purchases of common stock, net . . . . . . . . . . . . . (451,226) — 8 (12) — — — (4)Sale of subsidiary shares to noncontrolling interests
and other adjustments . . . . . . . . . . . . . . . . . . . . . . . . — — — — — — (6) (6)
Balance at December 31, 2012 . . . . . . . . . . . . . . . . . . . 165,605,838 $ 2 $3,771 $(1,058) $(185) $2,678 $ 1 $5,209
F-6

Number ofCommon
SharesOutstanding
CommonStock at
Par Value
AdditionalPaid-inCapital
CommonStock In
Treasury atCost
AccumulatedOther
ComprehensiveLoss
RetainedEarnings
NoncontrollingInterests Total
Net income (loss) . . . . . . . . . . . . . . . . . . . . . . . . . . . . . . . . . . . . . . . — $— $ — $ — $— $ 385 $ (1) $ 384Foreign currency translation, net of tax of $127 . . . . . . . . . . . . . . . — — — — 110 — — 110Employee benefit plan adjustments, net of tax of $9 . . . . . . . . . . . . — — — — 12 — — 12Unrealized holding gains on available-for-sale securities, net of
reclassification for gains realized in net income . . . . . . . . . . . . . — — — — (4) — — (4)Cash dividends declared per common share . . . . . . . . . . . . . . . . . . — — — — — (87) — (87)Share repurchase program . . . . . . . . . . . . . . . . . . . . . . . . . . . . . . . . (321,000) — — (10) — — — (10)Amortization and vesting of restricted stock and PSUs . . . . . . . . . 779,614 — 23 17 — — — 40Stock options amortization and exercises, net . . . . . . . . . . . . . . . . . 2,346,220 — (20) 52 — — — 32Other issuances of common stock, net . . . . . . . . . . . . . . . . . . . . . . . (45,835) — 20 (6) — — — 14Purchase price related to issuance of NASDAQ OMX common
stock—eSpeed acquisition . . . . . . . . . . . . . . . . . . . . . . . . . . . . . . 992,247 — 484 — — — — 484
Balance at December 31, 2013 . . . . . . . . . . . . . . . . . . . . . . . . . . . . 169,357,084 $ 2 $4,278 $(1,005) $ (67) $2,976 $ — $6,184
See accompanying notes to consolidated financial statements.
F-7

The NASDAQ OMX Group, Inc.
Consolidated Statements of Cash Flows(in millions)
Year EndedDecember 31,
2013 2012 2011
Cash flows from operating activities:Net income . . . . . . . . . . . . . . . . . . . . . . . . . . . . . . . . . . . . . . . . . . . . . . . . . . . . . . . . . . . . . . . . . . . . . . . . . . . . . . . . . $ 384 $ 349 $ 383Adjustments to reconcile net income to net cash provided by operating activities:
Depreciation and amortization . . . . . . . . . . . . . . . . . . . . . . . . . . . . . . . . . . . . . . . . . . . . . . . . . . . . . . . . . . . . . . 122 104 109Share-based compensation . . . . . . . . . . . . . . . . . . . . . . . . . . . . . . . . . . . . . . . . . . . . . . . . . . . . . . . . . . . . . . . . . 47 46 36Excess tax benefits related to share-based compensation . . . . . . . . . . . . . . . . . . . . . . . . . . . . . . . . . . . . . . . . . . (16) (7) (10)Gain on sale of investment security . . . . . . . . . . . . . . . . . . . . . . . . . . . . . . . . . . . . . . . . . . . . . . . . . . . . . . . . . . (30) — —Provision for bad debts . . . . . . . . . . . . . . . . . . . . . . . . . . . . . . . . . . . . . . . . . . . . . . . . . . . . . . . . . . . . . . . . . . . . 5 6 4Deferred income taxes . . . . . . . . . . . . . . . . . . . . . . . . . . . . . . . . . . . . . . . . . . . . . . . . . . . . . . . . . . . . . . . . . . . . 28 16 4Charges related to debt extinguishment and refinancing . . . . . . . . . . . . . . . . . . . . . . . . . . . . . . . . . . . . . . . . . . — — 31Non-cash restructuring charges . . . . . . . . . . . . . . . . . . . . . . . . . . . . . . . . . . . . . . . . . . . . . . . . . . . . . . . . . . . . . . 1 16 —Loss on divestiture of business . . . . . . . . . . . . . . . . . . . . . . . . . . . . . . . . . . . . . . . . . . . . . . . . . . . . . . . . . . . . . . — 14 —Asset retirements and impairment charges . . . . . . . . . . . . . . . . . . . . . . . . . . . . . . . . . . . . . . . . . . . . . . . . . . . . . 14 40 25Net (income) loss from unconsolidated investees . . . . . . . . . . . . . . . . . . . . . . . . . . . . . . . . . . . . . . . . . . . . . . . . 2 1 (2)Amortization of debt issuance costs . . . . . . . . . . . . . . . . . . . . . . . . . . . . . . . . . . . . . . . . . . . . . . . . . . . . . . . . . . 3 3 6Accretion of debt discounts . . . . . . . . . . . . . . . . . . . . . . . . . . . . . . . . . . . . . . . . . . . . . . . . . . . . . . . . . . . . . . . . . 3 4 13Other non-cash items included in net income . . . . . . . . . . . . . . . . . . . . . . . . . . . . . . . . . . . . . . . . . . . . . . . . . . . (2) 8 (10)
Net change in operating assets and liabilities, net of effects of acquisitions and divestiture:Receivables, net . . . . . . . . . . . . . . . . . . . . . . . . . . . . . . . . . . . . . . . . . . . . . . . . . . . . . . . . . . . . . . . . . . . . . . . . . (55) (30) (11)Other assets . . . . . . . . . . . . . . . . . . . . . . . . . . . . . . . . . . . . . . . . . . . . . . . . . . . . . . . . . . . . . . . . . . . . . . . . . . . . . 8 71 69Accounts payable and accrued expenses . . . . . . . . . . . . . . . . . . . . . . . . . . . . . . . . . . . . . . . . . . . . . . . . . . . . . . 51 1 24Section 31 fees payable to SEC . . . . . . . . . . . . . . . . . . . . . . . . . . . . . . . . . . . . . . . . . . . . . . . . . . . . . . . . . . . . . (15) (9) 24Accrued personnel costs . . . . . . . . . . . . . . . . . . . . . . . . . . . . . . . . . . . . . . . . . . . . . . . . . . . . . . . . . . . . . . . . . . . 39 (27) 10Deferred revenue . . . . . . . . . . . . . . . . . . . . . . . . . . . . . . . . . . . . . . . . . . . . . . . . . . . . . . . . . . . . . . . . . . . . . . . . . (33) 5 (14)Other liabilities . . . . . . . . . . . . . . . . . . . . . . . . . . . . . . . . . . . . . . . . . . . . . . . . . . . . . . . . . . . . . . . . . . . . . . . . . . 18 (17) (22)
Net cash provided by operating activities . . . . . . . . . . . . . . . . . . . . . . . . . . . . . . . . . . . . . . . . . . . . . . . . . . . . . . . . 574 594 669
Cash flows from investing activities:Purchases of trading securities . . . . . . . . . . . . . . . . . . . . . . . . . . . . . . . . . . . . . . . . . . . . . . . . . . . . . . . . . . . . . . . . . . (410) (301) (533)Proceeds from sales and redemptions of trading securities . . . . . . . . . . . . . . . . . . . . . . . . . . . . . . . . . . . . . . . . . . . . 452 372 501Proceeds from sale of available-for-sale investment security . . . . . . . . . . . . . . . . . . . . . . . . . . . . . . . . . . . . . . . . . . . 48 — —Purchase of equity and cost method investments . . . . . . . . . . . . . . . . . . . . . . . . . . . . . . . . . . . . . . . . . . . . . . . . . . . . (43) — —Acquisitions of businesses, net of cash and cash equivalents acquired . . . . . . . . . . . . . . . . . . . . . . . . . . . . . . . . . . . (1,121) (112) (26)Purchases of property and equipment . . . . . . . . . . . . . . . . . . . . . . . . . . . . . . . . . . . . . . . . . . . . . . . . . . . . . . . . . . . . . (115) (87) (88)
Net cash used in investing activities . . . . . . . . . . . . . . . . . . . . . . . . . . . . . . . . . . . . . . . . . . . . . . . . . . . . . . . . . . . . . (1,189) (128) (146)
Cash flows from financing activities:Payments of debt obligations . . . . . . . . . . . . . . . . . . . . . . . . . . . . . . . . . . . . . . . . . . . . . . . . . . . . . . . . . . . . . . . . . . . (289) (145) (948)Proceeds from debt obligations, net of debt issuance costs . . . . . . . . . . . . . . . . . . . . . . . . . . . . . . . . . . . . . . . . . . . . 895 — 700Cash paid for repurchase of common stock . . . . . . . . . . . . . . . . . . . . . . . . . . . . . . . . . . . . . . . . . . . . . . . . . . . . . . . . (10) (275) (100)Cash dividends . . . . . . . . . . . . . . . . . . . . . . . . . . . . . . . . . . . . . . . . . . . . . . . . . . . . . . . . . . . . . . . . . . . . . . . . . . . . . . (87) (65) —Issuances of common stock, net of treasury stock purchases . . . . . . . . . . . . . . . . . . . . . . . . . . . . . . . . . . . . . . . . . . . 23 (3) 10Excess tax benefits related to share-based compensation . . . . . . . . . . . . . . . . . . . . . . . . . . . . . . . . . . . . . . . . . . . . . . 16 7 10Other financing activities . . . . . . . . . . . . . . . . . . . . . . . . . . . . . . . . . . . . . . . . . . . . . . . . . . . . . . . . . . . . . . . . . . . . . . (1) (4) 3
Net cash provided by (used in) financing activities . . . . . . . . . . . . . . . . . . . . . . . . . . . . . . . . . . . . . . . . . . . . . . . . 547 (485) (325)
Effect of exchange rate changes on cash and cash equivalents . . . . . . . . . . . . . . . . . . . . . . . . . . . . . . . . . . . . . . . . . (4) 10 (7)
Net increase (decrease) in cash and cash equivalents . . . . . . . . . . . . . . . . . . . . . . . . . . . . . . . . . . . . . . . . . . . . . . . . . (72) (9) 191Cash and cash equivalents at beginning of period . . . . . . . . . . . . . . . . . . . . . . . . . . . . . . . . . . . . . . . . . . . . . . . . . . . 497 506 315
Cash and cash equivalents at end of period . . . . . . . . . . . . . . . . . . . . . . . . . . . . . . . . . . . . . . . . . . . . . . . . . . . . . . . . $ 425 $ 497 $ 506
Supplemental Disclosure Cash Flow InformationCash paid for:
Interest . . . . . . . . . . . . . . . . . . . . . . . . . . . . . . . . . . . . . . . . . . . . . . . . . . . . . . . . . . . . . . . . . . . . . . . . . . . . . . . . . $ 79 $ 80 $ 86Income taxes, net of refund . . . . . . . . . . . . . . . . . . . . . . . . . . . . . . . . . . . . . . . . . . . . . . . . . . . . . . . . . . . . . . . . . $ 157 $ 177 $ 129
Non-cash investing activities:Purchase price related to issuance of NASDAQ OMX common stock—eSpeed acquisition . . . . . . . . . . . . . . $ 484 $ — $ —Investment in LCH Clearnet Group Limited . . . . . . . . . . . . . . . . . . . . . . . . . . . . . . . . . . . . . . . . . . . . . . . . . . . $ — $ 37 $ —
See accompanying notes to consolidated financial statements.
F-8

The NASDAQ OMX Group, Inc.
Notes to Consolidated Financial Statements
1. Organization and Nature of Operations
We are a leading global exchange group that delivers trading, clearing, exchange technology, regulatory,securities listing, and public company services across six continents. Our global offerings are diverse and includetrading and clearing across multiple asset classes, market data products, financial indexes, capital formationsolutions, financial services, corporate solutions and market technology products and services. Our technologypowers markets across the globe, supporting derivatives trading, clearing and settlement, cash equity trading,fixed income trading and many other functions.
In the U.S., we operate The NASDAQ Stock Market, a registered national securities exchange. TheNASDAQ Stock Market is the largest single cash equities securities market in the U.S. in terms of listedcompanies and in the world in terms of share value traded. As of December 31, 2013, The NASDAQ StockMarket was home to 2,637 listed companies with a combined market capitalization of approximately$7.0 trillion. In addition, in the U.S. we operate two additional cash equities trading markets, three optionsmarkets and an electronic platform for trading of U.S. Treasuries.
In Europe, we operate exchanges in Stockholm (Sweden), Copenhagen (Denmark), Helsinki (Finland), andIceland as NASDAQ OMX Nordic, and exchanges in Tallinn (Estonia), Riga (Latvia) and Vilnius (Lithuania) asNASDAQ OMX Baltic. Collectively, the exchanges that comprise NASDAQ OMX Nordic and NASDAQ OMXBaltic offer trading in cash equities, bonds, structured products and ETFs, as well as trading and clearing ofderivatives and clearing of resale and repurchase agreements. Through NASDAQ OMX First North, our Nordicand Baltic operations also offer alternative marketplaces for smaller companies. As of December 31, 2013, theexchanges that comprise NASDAQ OMX Nordic and NASDAQ OMX Baltic, together with NASDAQ OMXFirst North, were home to 758 listed companies with a combined market capitalization of approximately$1.3 trillion. We also operate NASDAQ OMX Armenia.
In addition, NASDAQ OMX Commodities operates the world’s largest power derivatives exchangeregulated in Norway and one of Europe’s largest carbon exchanges. We also operate NOS Clearing, a leadingNorway-based clearinghouse primarily for OTC traded derivatives for the freight market and seafood derivativesmarket. In the U.K., we operate NASDAQ OMX NLX, a new London-based market for trading of listed short-term and long-term European (Euro and Sterling denominated) interest rate derivative products.
In some of the countries where we operate exchanges, we also provide investment firm, clearing, settlementand central depository services.
2. Summary of Significant Accounting Policies
Basis of Presentation and Principles of Consolidation
The consolidated financial statements are prepared in accordance with U.S. GAAP. The financial statementsinclude the accounts of NASDAQ OMX, its wholly-owned subsidiaries and other entities in which NASDAQOMX has a controlling financial interest. All significant intercompany accounts and transactions have beeneliminated in consolidation. When we do not have a controlling interest in an entity but exercise significantinfluence over the entity’s operating and financial policies, such investment is accounted for under the equitymethod of accounting. We recognize our share of earnings or losses of an equity method investee based on ourownership percentage. As permitted under U.S. GAAP, for certain equity method investments for which financialinformation is not sufficiently timely for us to apply the equity method of accounting currently, we record ourshare of the earnings or losses of the investee from the most recently available financial statements on a lag. SeeNote 6, “Investments,” for further discussion of our equity method investments.
F-9
The NASDAQ OMX Group, Inc.
Notes to Consolidated Financial Statements—(Continued)
Changes in Reportable Segments and Reclassifications
Since January 1, 2013, we manage, operate and provide our products and services in four businesssegments: Market Services, Listing Services, Information Services and Technology Solutions. All prior periodsegment disclosures have been recast to reflect our change in reportable segments. See Note 19, “BusinessSegments,” for additional information about our segments.
Prior to January 1, 2013, we managed, operated and provided our products and services in three businesssegments: Market Services, Issuer Services and Market Technology.
Certain other prior year amounts have been reclassified to conform to the current year presentation.
Subsequent Events
We have evaluated subsequent events through the issuance date of this Annual Report on Form 10-K.
Use of Estimates
The preparation of consolidated financial statements in conformity with U.S. GAAP requires managementto make estimates and assumptions that affect the reported amounts and the disclosure of contingent amounts inthe consolidated financial statements and accompanying notes. Actual results could differ from those estimates.
Foreign Currency
Foreign denominated assets and liabilities are remeasured into the functional currency at exchange rates ineffect at the balance sheet date and recorded through the income statement. Gains or losses resulting from foreigncurrency transactions are remeasured using the rates on the dates on which those elements are recognized duringthe period, and are included in general, administrative and other expense in the Consolidated Statements ofIncome.
Translation gains or losses resulting from translating our subsidiaries’ financial statements from the localfunctional currency to the reporting currency, net of tax, are included in accumulated other comprehensive losswithin stockholders’ equity in the Consolidated Balance Sheets. Assets and liabilities are translated at the balancesheet date while revenues and expenses are translated at the date the transaction occurs or at an applicableaverage rate.
Deferred taxes are not provided on cumulative translation adjustments where we expect earnings of aforeign subsidiary to be indefinitely reinvested. The income tax effect of currency translation adjustments relatedto foreign subsidiaries that are not considered indefinitely reinvested is recorded as a component of deferredtaxes with an offset to accumulated other comprehensive loss within stockholders’ equity in the ConsolidatedBalance Sheets.
Cash and Cash Equivalents
Cash and cash equivalents include cash in banks and all non-restricted highly liquid investments withoriginal maturities of three months or less at the time of purchase. Such equivalent investments included in cashand cash equivalents in the Consolidated Balance Sheets were $178 million as of December 31, 2013 and$339 million as of December 31, 2012. Cash equivalents are carried at cost plus accrued interest, whichapproximates fair value due to the short maturities of these investments.
F-10

The NASDAQ OMX Group, Inc.
Notes to Consolidated Financial Statements—(Continued)
Restricted Cash
Current restricted cash, which was $84 million as of December 31, 2013 and $85 million as ofDecember 31, 2012, is not available for general use by us due to regulatory and other requirements and isclassified as restricted cash in the Consolidated Balance Sheets. As of December 31, 2013 and December 31,2012, current restricted cash primarily includes cash held for regulatory purposes for our trading and clearingbusinesses.
Non-current restricted cash of $25 million as of December 31, 2012 was segregated for NOCC to improveits liquidity position and was not available for general use. As a result of a strategic alliance with NGX, this cashwas no longer needed for liquidity purposes and was released from NOCC. See Note 16, “Clearing Operations,”for further discussion.
Financial Investments
Financial investments, at fair value are primarily comprised of trading securities, mainly Swedishgovernment debt securities. As of December 31, 2012, this balance also included our available-for-saleinvestment security in DFM. In the fourth quarter of 2013, we sold this investment security and recognized a gainon the sale of $30 million, which is included in gain on sale of investment security in the ConsolidatedStatements of Income for the year ended December 31, 2013. Trading securities are bought principally to meetregulatory capital requirements for NASDAQ OMX Nordic Clearing’s operations and are generally sold in thenear term. Changes in fair value of trading securities are included in dividend and investment income in theConsolidated Statements of Income. Equity securities that are classified as available-for-sale investmentsecurities are carried at fair value with unrealized gains and losses, net of tax, reported in accumulated othercomprehensive loss within stockholders’ equity. Realized gains and losses on these securities are included inearnings upon disposition of the securities using the specific identification method. In addition, realized lossesare recognized when management determines that a decline in value is other than temporary, which requiresjudgment regarding the amount and timing of recovery. For equity securities, we also consider the extent towhich cost exceeds fair value, the duration of that difference, management’s judgment about the issuer’s currentand prospective financial condition, as well as our intent and ability to hold the security until recovery of theunrealized losses. In addition, for equity securities we also consider the performance of the investee’s stock pricein relation to industry indexes and review the investee’s credit profile.
Fair value of both trading and available-for-sale investment securities is generally obtained from third partypricing sources. When available, quoted market prices are used to determine fair value. If quoted market pricesare not available, fair values are estimated using pricing models with observable market inputs. The inputs to thevaluation models vary by the type of security being priced but are typically benchmark yields, reported trades,broker-dealer quotes, and prices of similar assets. Pricing models generally do not entail material subjectivitybecause the methodologies employed use inputs observed from active markets. See Note 15, “Fair Value ofFinancial Instruments,” for further discussion of fair value measures.
Receivables, net
Our receivables are concentrated with our member firms, market data distributors, listed companies andtechnology solutions customers. Receivables are shown net of a reserve for uncollectible accounts. The reservefor bad debts is maintained at a level that management believes to be sufficient to absorb estimated losses in theaccounts receivable portfolio. The reserve is increased by the provision for bad debts which is charged againstoperating results and decreased by the amount of charge-offs, net of recoveries. The amount charged againstoperating results is based on several factors including, but not limited to, a continuous assessment of thecollectability of each account, the length of time a receivable is past due and our historical experience with the
F-11

The NASDAQ OMX Group, Inc.
Notes to Consolidated Financial Statements—(Continued)
particular customer. In circumstances where a specific customer’s inability to meet its financial obligations isknown (i.e., bankruptcy filings), we record a specific provision for bad debts against amounts due to reduce thereceivable to the amount we reasonably believe will be collected. Due to changing economic, business andmarket conditions, we review the reserve for bad debts monthly and make changes to the reserve through theprovision for bad debts as appropriate. If circumstances change (i.e., higher than expected defaults or anunexpected material adverse change in a major customer’s ability to pay), our estimates of recoverability couldbe reduced by a material amount. The total reserve netted against receivables in the Consolidated Balance Sheetswas $9 million as of December 31, 2013 and $5 million as of December 31, 2012.
Default Funds and Margin Deposits
NASDAQ OMX Nordic Clearing members’ eligible contributions may include cash and non-cashcontributions. Clearing members’ cash contributions are included in default funds and margin deposits in theConsolidated Balance Sheets as both a current asset and a current liability. These balances may fluctuate overtime due to changes in the amount of deposits required and whether members choose to provide cash or non-cashcontributions. Non-cash contributions include highly rated government debt securities that must meet specificcriteria approved by NASDAQ OMX Nordic Clearing. Non-cash contributions are pledged assets that are notrecorded in the Consolidated Balance Sheets as NASDAQ OMX Nordic Clearing does not take legal ownershipof these assets and the risks and rewards remain with the clearing members.
As of December 31, 2012, NOCC customer pledged cash collateral was also included in default funds andmargin deposits as both a current asset and current liability in the Consolidated Balance Sheets, as the risks andrewards of collateral ownership, including interest income, belonged to NOCC.
Derivative Financial Instruments and Hedging Activities
We may hold derivative financial instruments that are designated and qualify for hedge accounting.Derivative financial instruments, which are designated or qualify for hedge accounting, are recognized in thebalance sheets at fair value as either assets or liabilities. The fair value of our derivative financial instruments isdetermined using either market quotes or valuation models that are based upon the net present value of estimatedfuture cash flows and incorporate current market data inputs. We report our derivative assets in either othercurrent assets or other non-current assets and our derivative liabilities in either other current liabilities or othernon-current liabilities in the Consolidated Balance Sheets depending on the terms of the contract. Anyineffectiveness is recorded in earnings. The accounting for the change in the fair value of a derivative financialinstrument depends on its intended use and the resulting hedge designation, if any. As of December 31, 2013,2012 and 2011, there were no derivative financial instruments that were designated or qualified for hedgeaccounting. There was no material ineffectiveness recorded in earnings for each of the three years endedDecember 31, 2013.
Derivative Financial Instruments that Qualify for Hedge Accounting
Derivative financial instruments that are entered into for hedging purposes are designated as such when weenter into the contract. For all derivative financial instruments that are designated for hedging activities, weformally document all of the hedging relationships between the hedge instruments and the hedged items at theinception of the relationships. We also formally document our risk management objectives and strategies forentering into the hedge transactions. We formally assess, at inception and on a quarterly basis, whetherderivatives designated as hedges are highly effective in offsetting the fair value or cash flows of hedged items. Ifit is determined that a derivative is no longer highly effective as a hedge, we will discontinue the application ofhedge accounting. We did not enter into any derivative hedges that were designated for hedge accounting duringthe years ended December 31, 2013, 2012 and 2011.
F-12

The NASDAQ OMX Group, Inc.
Notes to Consolidated Financial Statements—(Continued)
Non-Designated Derivatives
We also use derivatives as economic hedges that are not designed as accounting hedges or do not qualify forhedge accounting treatment. For such derivative financial instruments, changes in fair value are reported incurrent period earnings.
We use foreign exchange forward contracts to manage foreign currency exposure of intercompany loans.These contracts are not designated as hedges for financial reporting purposes. The change in fair value of thesecontracts is recognized in general, administrative and other expense in the Consolidated Statements of Incomeand offsets the foreign currency impact recognized on the intercompany loans.
As of December 31, 2013 and 2012, the fair value amounts of our derivative instruments were immaterial.
Net Investment Hedges
Net assets of our foreign subsidiaries are exposed to volatility in foreign currency exchange rates. We mayutilize net investment hedges to offset the translation adjustment arising from re-measuring our investment inforeign subsidiaries.
Our 2021 Notes have been designated as a hedge of our net investment in certain foreign subsidiaries tomitigate the foreign exchange risk associated with certain investments in these subsidiaries. Any increase ordecrease related to the translation of the 2021 Notes into U.S. dollars is recorded within accumulated othercomprehensive loss in the Consolidated Balance Sheets for the year ended December 31, 2013. See “3.875%Senior Unsecured Notes,” of Note 9, “Debt Obligations,” for further discussion. As of December 31, 2012, therewere no outstanding net investment hedges.
Property and Equipment, net
Property and equipment, including leasehold improvements, are carried at cost less accumulateddepreciation and amortization. Depreciation and amortization are recognized over the estimated useful lives ofthe related assets. Estimated useful lives range from 10 to 40 years for buildings and improvements, 2 to 5 yearsfor data processing equipment and software and 5 to 10 years for furniture and equipment. Leaseholdimprovements are amortized over the shorter of their estimated useful lives or the remaining term of the relatedlease. Depreciation and amortization are computed using the straight-line method. See Note 7, “Property andEquipment, net,” for further discussion.
Goodwill
Goodwill represents the excess of purchase price over the value assigned to the net tangible and identifiableintangible assets of a business acquired. Goodwill is allocated to our reporting units based on the assignment ofthe fair values of each reporting unit of the acquired company. We test goodwill for impairment at the reportingunit level annually, or in interim periods if certain events occur indicating that the carrying amount may beimpaired, such as changes in the business climate, poor indicators of operating performance or the sale ordisposition of a significant portion of a reporting unit. For purposes of performing our goodwill impairment test,our six reporting units are the Market Services segment, the Listing Services segment, the two businessescomprising the Information Services segment: Market Data Products and Index Licensing and Services, and thetwo businesses comprising the Technology Solutions segment: Corporate Solutions and Market Technology. Wetest for impairment during the fourth quarter of our fiscal year using carrying amounts as of October 1. Inconducting the 2013 annual impairment test for goodwill, we first performed a qualitative assessment todetermine whether it was more likely than not that the fair value of a reporting unit was less than the carryingamount as a basis for determining whether it was necessary to perform the two-step quantitative goodwill
F-13

The NASDAQ OMX Group, Inc.
Notes to Consolidated Financial Statements—(Continued)
impairment test described in ASC Topic 350. The more-likely-than-not threshold is defined as having alikelihood of more than 50 percent. If, after assessing the totality of events or circumstances, we determine that itis more likely than not that the fair value of a reporting unit is less than its carrying amount, then the two-stepquantitative test for goodwill impairment is performed for the appropriate reporting units. Otherwise, weconclude that no impairment is indicated and the two-step quantitative test for goodwill impairment is notperformed.
In conducting the qualitative assessment, we analyze actual and projected growth trends for each reportingunit, as well as historical performance versus plan and the results of prior quantitative tests performed.Additionally, each reporting unit assesses critical areas that may impact their business, including macroeconomicconditions and the related impact, market related exposures, competitive changes, new or discontinued products,changes in key personnel, or any other potential risks to their projected financial results.
If required, the quantitative goodwill impairment test is a two-step process performed at the reporting unitlevel. First, the fair value of each reporting unit is compared to its corresponding carrying amount, includinggoodwill. The fair value of each reporting unit is estimated using a combination of a discounted cash flowvaluation, which incorporates assumptions regarding future growth rates, terminal values, and discount rates, aswell as a guideline public company valuation, incorporating relevant trading multiples of comparable companiesand other factors. The estimates and assumptions used consider historical performance and are consistent withthe assumptions used in determining future profit plans for each reporting unit, which are approved by our boardof directors. If the first step results in the carrying amount exceeding the fair value of the reporting unit, then asecond step must be completed in order to determine the amount of goodwill impairment that should be recorded,if any. In the second step, the implied fair value of the reporting unit’s goodwill is determined by allocating thereporting unit’s fair value to all of its assets and liabilities other than goodwill in a manner similar to a purchaseprice allocation. The implied fair value of the goodwill that results from the application of this second step is thencompared to the carrying amount of the goodwill and an impairment charge is recorded for any difference.
There was no impairment of goodwill for the years ended December 31, 2013, 2012 and 2011. However,events such as economic weakness or unexpected significant declines in operating results of reporting units mayresult in goodwill impairment charges in the future.
Intangible Assets, net
Intangible assets, net, primarily include exchange and clearing registrations, customer relationships, tradenames, licenses and technology. Intangible assets with finite lives are amortized on a straight-line basis over theiraverage estimated useful lives as follows:
• Technology: 2—5 years
• Customer relationships: 9—30 years
• Other: 2—10 years
Intangible assets deemed to have indefinite useful lives are not amortized but instead are tested forimpairment at least annually and more frequently whenever events or changes in circumstances indicate that thefair value of the asset may be less than its carrying amount. The fair value of indefinite-lived intangible assets isprimarily determined on the basis of estimated discounted value, using the relief from royalty approach for tradenames and the Greenfield Approach for exchange and clearing registrations and licenses, both of whichincorporate assumptions regarding future revenue projections and discount rates. Similar to goodwill impairmenttesting, we test for impairment of indefinite-lived intangible assets during the fourth quarter of our fiscal yearusing carrying amounts as of October 1. In conducting the 2013 annual impairment test for indefinite-lived
F-14

The NASDAQ OMX Group, Inc.
Notes to Consolidated Financial Statements—(Continued)
intangible assets, we first performed a qualitative assessment to determine whether it was more likely than notthat the fair value of an indefinite-lived intangible asset was less than the carrying amount as a basis fordetermining whether it was necessary to perform the quantitative impairment test described in ASC Topic 350.The more-likely-than-not threshold is defined as having a likelihood of more than 50 percent. If, after assessingthe totality of events or circumstances, we determine that it is more likely than not that the fair value of anindefinite-lived intangible asset is less than its carrying amount, then the quantitative test for indefinite-livedintangible assets impairment is performed for the appropriate intangible assets. If the carrying amount of theindefinite-lived intangible asset exceeds its fair value, an impairment charge is recorded for the difference. Forfinite-lived intangible assets subject to amortization, impairment is considered upon certain “triggering events”and is recognized if the carrying amount is not recoverable and exceeds the fair value of the intangible asset.
Valuation of Other Long-Lived Assets
We also assess potential impairments to our other long-lived assets, including property and equipment, whenthere is evidence that events or changes in circumstances indicate that the carrying amount of an asset may not berecoverable. The carrying amount of a long-lived asset is not recoverable if it exceeds the sum of the undiscountedcash flows expected to result from the use and eventual disposition of the asset. Any required impairment loss ismeasured as the amount by which the carrying amount of a long-lived asset exceeds its fair value and is recorded asa reduction in the carrying amount of the related asset and a charge to operating results.
Equity Method Investments
In general, the equity method of accounting is used when we own 20% to 50% of the outstanding votingstock of a company and when we are able to exercise significant influence over the operating and financialpolicies of a company. We have certain investments in which we have determined that we have significantinfluence and as such account for the investments under the equity method of accounting. We record our pro-ratashare of earnings or losses each period and record any dividends as a reduction in the investment balance. Weevaluate our equity method investments for other-than-temporary declines in value by considering a variety offactors such as the earnings capacity of the investment and the fair value of the investment compared to itscarrying amount. In addition, for investments where the market value is readily determinable, we consider theunderlying stock price. If the estimated fair value of the investment is less than the carrying amount andmanagement considers the decline in value to be other than temporary, the excess of the carrying amount overthe estimated fair value is recognized in the financial statements as an impairment.
Cost Method Investments
In general, the cost method of accounting is used when we own less than 20% of the outstanding votingstock of a company which does not have a readily determinable fair value and when we are not able to exercisesignificant influence over the operating and financial policies of a company. Under the cost method ofaccounting, investments are carried at cost and are adjusted only for other-than-temporary declines in fair value,certain distributions, and additional investments.
Revenue Recognition and Cost of Revenues
Market Services Revenues
Derivative, Trading and Clearing Revenues
U.S. Derivative Trading and Clearing
U.S. derivative trading and clearing revenues are variable, based on traded and cleared volumes, andrecognized when executed or when contracts are cleared. The principal types of derivative contracts traded on
F-15

The NASDAQ OMX Group, Inc.
Notes to Consolidated Financial Statements—(Continued)
our U.S. options exchanges are equity options, ETF options, index options and currency options. We recordderivative trading and clearing revenues from transactions on a gross basis as revenues and record relatedexpenses as cost of revenues, as we have certain risk associated with trade execution.
For U.S. derivative trading, we credit a portion of the per share execution charge to the market participantthat provides the liquidity and record these transaction rebates as cost of revenues in the Consolidated Statementsof Income. These transaction rebates are paid on a monthly basis and the amounts due are included in accountspayable and accrued expenses in the Consolidated Balance Sheets.
Also, we pay Section 31 fees to the SEC for supervision and regulation of securities markets. We pass thesecosts along to our customers through our derivative trading and clearing fees. We collect the fees as a pass-through charge from organizations executing eligible trades on our options exchanges and we recognize theseamounts in U.S. derivative trading and clearing cost of revenues when incurred. Section 31 fees received areincluded in cash and cash equivalents in the Consolidated Balance Sheets at the time of receipt and, as requiredby law, the amount due to the SEC is remitted semiannually and recorded as Section 31 fees payable to the SECin the Consolidated Balance Sheets until paid. Since the amount recorded as revenues is equal to the amountrecorded as cost of revenues, there is no impact on our revenues less transaction rebates, brokerage, clearanceand exchange fees. As we hold the cash received until payment to the SEC, we earn interest income on therelated cash balances.
Under our Limitation of Liability Rule and procedures, we, subject to certain caps, provide compensationfor losses directly resulting from the systems’ actual failure to correctly process an order, quote, message or otherdata into our platform. We do not record a liability for any potential claims that may be submitted under theLimitation of Liability Rule unless they meet the provisions required in accordance with U.S. GAAP. As such,losses arising as a result of the rule are accrued and charged to expense only if the loss is probable and estimable.
European Derivative Trading and Clearing Revenues
European derivative trading and clearing revenues are variable, based on the volume and value of traded andcleared contracts, and recognized when executed or when contracts are cleared. The principal types of derivativecontracts traded and cleared are stock options and futures, index options and futures, international powerderivatives, carbon and other commodity products, and fixed-income options and futures. We also generateclearing revenues for OTC traded derivatives for the freight market and seafood derivatives market, interest rateswaps, and resale and repurchase agreements. These clearing revenues are based on the value and length of thecontract and are recognized when cleared. In addition, NASDAQ OMX Commodities members are billed anannual fee which is recognized ratably over the following 12-month period.
NASDAQ OMX Commodities and the exchanges that comprise NASDAQ OMX Nordic and NASDAQOMX Baltic do not have any revenue sharing agreements or cost of revenues, such as transaction rebates andbrokerage, clearance and exchange fees.
Cash Equity Trading Revenues
U.S. Cash Equity Trading
U.S. cash equity trading revenues are variable, based on individual customer share volumes, and recognizedas transactions occur. We charge transaction fees for executing cash equity trades on our U.S. cash equityexchanges, as well as on orders that are routed to other market venues for execution. Similar to U.S. derivativetrading and clearing, we record cash equity trading revenues from transactions on a gross basis as revenues andrecord related expenses as cost of revenues, as we have certain risk associated with trade execution.
F-16
The NASDAQ OMX Group, Inc.
Notes to Consolidated Financial Statements—(Continued)
For The NASDAQ Stock Market and NASDAQ OMX PSX, we credit a portion of the per share executioncharge to the market participant that provides the liquidity and for NASDAQ OMX BX, we credit a portion ofthe per share execution charge to the market participant that takes the liquidity. We record these credits astransaction rebates that are included in cost of revenues in the Consolidated Statements of Income. Thesetransaction rebates are paid on a monthly basis and the amounts due are included in accounts payable andaccrued expenses in the Consolidated Balance Sheets.
As discussed under U.S. derivatives trading and clearing, we also pay Section 31 fees to the SEC forsupervision and regulation of securities markets. We pass these costs along to our customers through our cashequity trading fees. We collect the fees as a pass-through charge from organizations executing eligible trades onour cash equity platforms, and we recognize these amounts in cost of revenues when incurred.
As discussed above, in the U.S., under our Limitation of Liability Rule and procedures, we, subject tocertain caps, provide compensation for losses directly resulting from the systems’ actual failure to correctlyprocess an order, quote, message or other data into our platform.
European Cash Equity Trading
We charge transaction fees for executing trades on the exchanges that comprise NASDAQ OMX Nordic andNASDAQ OMX Baltic. These transaction fees are charged per executed order and as per value traded.
The exchanges that comprise NASDAQ OMX Nordic and NASDAQ OMX Baltic do not have cost ofrevenues, such as transaction rebates and brokerage, clearance and exchange fees.
Fixed Income Trading Revenues
We operate eSpeed, an electronic trading platform for U.S. Treasuries. The electronic trading platformprovides real-time institutional trading of benchmark U.S. Treasury securities. Customer contracts may be on afixed or variable rate basis. Revenues from customers with a fixed rate basis are recognized ratably over thecontract period. Revenues from customers with a variable rate basis are based upon individual customer sharevolume and are recognized as revenues as the transaction occurs.
Access and Broker Services Revenues
Access Services
We generate revenues by providing market participants with several alternatives for accessing our marketsfor a fee. The type of connectivity is determined by the level of functionality a customer needs. As a result,Access Services revenues vary depending on the type of connection provided to customers. We provide co-location services to market participants whereby firms may lease space for equipment within our data center.These participants are charged monthly fees for cabinet space, connectivity and support. We also earn revenuesfrom annual and monthly exchange membership and registration fees. Revenues for providing access to ourmarkets, co-location services and revenues for monthly exchange membership and registration fees arerecognized on a monthly basis as the service is provided. Revenues from annual fees for exchange membershipand registration fees are recognized ratably over the following 12-month period.
Access Services revenues also include revenues from the RTRM solutions we provide to the financialsecurities market. As a market leader in RTRM, we provide broker-dealers and their clients the ability to managerisk more effectively in real-time, which leads to better utilization of capital as well as improved regulatorycompliance. Revenues for these services are primarily based on subscription agreements with customers. Mostcontracts include professional services, implementation fees, monthly subscription fees from customers accessing
F-17

The NASDAQ OMX Group, Inc.
Notes to Consolidated Financial Statements—(Continued)
on-demand services, and customer support. Implementation fees are recognized upon completion of theimplementation. Monthly professional services, subscription, and usage fees are recognized in the month theservice is provided.
Broker Services
Our Broker Services operations offer technology and customized securities administration solutions tofinancial participants in the Nordic markets. The primary services consist of flexible back-office systems whichallow customers to entirely or partly outsource their company’s back-office functions. Revenues from brokerservices are based on a fixed basic fee for administration or licensing, maintenance and operations, and a variableportion that depends on the number of transactions completed. Broker Services revenues are recognized on acontinuous basis as services are rendered.
Listing Services Revenues
U.S. Listing Services Revenues
Listing Services revenues in the U.S. include annual renewal fees, listing of additional shares fees and initiallisting fees. Annual renewal fees are recognized ratably over the following 12-month period. Listing of additionalshares fees and initial listing fees are recognized on a straight-line basis over estimated service periods, which arefour and six years, respectively, based on our historical listing experience and projected future listing duration.
European Listing Services Revenues
European listing fees, which are comprised of revenues derived from annual fees received from listedcompanies on our Nordic and Baltic exchanges and NASDAQ OMX First North, are directly related to the listedcompanies’ market capitalization on a trailing 12-month basis. These revenues are recognized ratably over thefollowing 12-month period.
Information Services Revenues
Market Data Products Revenues
Market Data Products revenues are earned from U.S. and European market data products and index dataproducts. In the U.S., we also earn revenues from U.S. tape plans.
U.S. Market Data Products
We collect and process information and earn revenues as a distributor of our own market data and selectthird-party content. We provide varying levels of quote and trade information to market participants and to datadistributors, who in turn sell subscriptions for this information to the public. We earn revenues primarily basedon the number of data subscribers and distributors of our data. U.S. Market Data revenues are recognized on amonthly basis. These revenues, which are subscription based, are recorded net of amounts due under revenuesharing arrangements with market participants.
U.S. Market Data Products also includes revenues from U.S. tape plans including eligible UTP Planrevenues that are shared among UTP Plan participants and are presented on a net basis. See “Market DataProducts Revenue Sharing” below for further discussion of net reporting. Under the revenue sharing provision ofthe UTP Plan, we are permitted to deduct costs associated with acting as the exclusive Securities InformationProcessor from the total amount of tape revenues collected. After these costs are deducted from the taperevenues, we distribute to the respective UTP Plan participants, including The NASDAQ Stock Market,NASDAQ OMX BX and NASDAQ OMX PSX, their share of tape revenues based on a formula, required by
F-18

The NASDAQ OMX Group, Inc.
Notes to Consolidated Financial Statements—(Continued)
Regulation NMS, that takes into account both trading and quoting activity. In addition, all quotes and trades inNYSE- and NYSE MKT-listed securities are reported and disseminated in real time, and as such, we share in thetape revenues for information on NYSE- and NYSE MKT-listed securities. Revenues from net U.S. tape plansare recognized on a monthly basis.
European Market Data Products
European Market Data Products revenues are based on the trading information from the exchanges thatcomprise NASDAQ OMX Nordic and NASDAQ OMX Baltic, as well as NASDAQ OMX Commodities, for thefollowing classes of securities: cash equities, bonds, derivatives and commodities. We provide varying levels ofquote and trade information to market participants and to data distributors, who in turn provide subscriptions forthis information. Revenues from European market data are subscription-based, are generated primarily based onthe number of data subscribers and distributors of our data and are recognized on a monthly basis.
Market Data Products Revenue Sharing
The most significant component of Market Data Products revenues presented on a net basis is the UTP Planrevenue sharing in the U.S. All indicators of gross vs. net reporting under U.S. GAAP have been considered inanalyzing the appropriate presentation of UTP Plan revenue sharing. However, the following are the primaryindicators of net reporting:
• Primary Obligor: We are the Securities Information Processor for the UTP Plan, in addition to being aparticipant in the UTP Plan. In our unique role as Securities Information Processor, we facilitate thecollection and dissemination of revenues on behalf of the UTP Plan participants. As a participant, weshare in the net distribution of revenues according to the plan on the same terms as all other planparticipants.
• Risk of Loss/Credit Risk: Risk of loss on the revenue is shared equally among plan participantsaccording to the UTP Plan.
• Price Latitude: The operating committee of the UTP Plan, which is comprised of representatives fromeach of the participants, including us solely in our capacity as a UTP Plan participant, is responsible forsetting the level of fees to be paid by distributors and subscribers and taking action in accordance withthe provisions of the UTP Plan, subject to SEC approval.
The exchanges that comprise NASDAQ OMX Nordic and NASDAQ OMX Baltic do not have any marketdata revenue sharing agreements.
Index Data Products
Index Data Products revenues are generated from our NASDAQ OMX indexes and consist of Global IndexData Services, which deliver real time index values throughout the trading day, and Global Index Watch, whichdelivers weightings and components data, corporate actions and a breadth of additional data. We earn revenuesprimarily based on the number of data subscribers and distributors of our data. These revenues, which aresubscription based, are recognized on a monthly basis.
Index Licensing and Services Revenues
We develop and license NASDAQ OMX branded indexes, associated derivatives and financial products aspart of our Index Licensing and Services business. Revenues primarily include license fees from these brandedindexes, associated derivatives and financial products in the U.S. and abroad. We also generate revenues bylicensing and listing third-party structured products and third-party sponsored ETFs. We primarily have two
F-19

The NASDAQ OMX Group, Inc.
Notes to Consolidated Financial Statements—(Continued)
types of license agreements: transaction-based licenses and asset-based licenses. Transaction-based licenses aregenerally renewable long-term agreements. Customers are charged based on transaction volume or a minimumcontract amount, or both. If a customer is charged based on transaction volume, we recognize revenue when thetransaction occurs. If a customer is charged based on a minimum contract amount, we recognize revenue on apro-rata basis over the licensing term. Asset-based licenses are also generally long-term agreements. Customersare charged based on a percentage of assets under management for licensed products, per the agreement, on amonthly or quarterly basis. These revenues are recorded on a monthly or quarterly basis over the term of thelicense agreement.
Technology Solutions Revenues
Corporate Solutions Revenues
Corporate Solutions revenues primarily include subscription and transaction-based income from ourGovernance, Investor Relations, Multimedia Solutions and Public Relations businesses. Subscription-basedrevenues earned by these businesses are recognized ratably over the contract period, generally one to two years inlength. As part of customer subscription agreements, customers can also be charged usage fees based upon actualusage of the services provided. Revenues from usage fees and other services are recognized when earned.Revenues from transaction-based services such as webcasting and wire distribution are recorded as the servicesare provided and delivered.
Market Technology Revenues
Market Technology provides technology solutions for trading, clearing, settlement surveillance andinformation dissemination, as well as governance, risk and compliance solutions. Revenues primarily consist ofsoftware, license and support revenues, change request and advisory revenues, and software as a servicerevenues.
For most solutions, we enter into multiple-element sales arrangements to provide technology solutions andservices to our customers. In order to recognize revenues associated with each individual element of a multiple-element sales arrangement separately, we are required to establish the existence of VSOE of fair value for eachelement. When VSOE for individual elements of an arrangement cannot be established, revenue is generallydeferred and recognized over either the final element of the arrangement or the entire term of the arrangement forwhich the services will be delivered.
We also enter into revolving subscription agreements which allow customers to connect to our servers toaccess certain services. These revenues are recognized ratably over the subscription term.
Software, License and Support
Software, license and support revenues are derived from the system solutions developed and sold byNASDAQ OMX and are generally entered into in multiple-element sales arrangements. After we have developedand sold a system solution, the customer licenses the right to use the software and may require post contractsupport and other services, such as facility management. Facility management revenues are derived whenNASDAQ OMX assumes responsibility for the continuous operation of a system platform for a customer andreceives facility management revenues which can be both fixed and volume-based. Revenues for license, supportand facility management services are generally deferred and recognized over either the final element of thearrangement or the entire term of the arrangement for which the services will be delivered, unless VSOE can beestablished for each element of the contract. We record the deferral of revenue associated with multiple-elementsales arrangements in deferred revenue and non-current deferred revenue and the deferral of costs in other currentassets and other non-current assets in the Consolidated Balance Sheets.
F-20

The NASDAQ OMX Group, Inc.
Notes to Consolidated Financial Statements—(Continued)
Software, license and support revenues also include delivery project revenues which are derived from theinstallation phase of the system solutions developed and sold by NASDAQ OMX. The majority of our deliveryprojects involve individual adaptations to the specific requirements of the customer, such as those relating tofunctionality and capacity. We may customize our software technology and make significant modifications to thesoftware to meet the needs of our customers, and as such, we account for these arrangements under contractaccounting. Under contract accounting, when VSOE for valuing certain elements of an arrangement cannot beestablished, total revenues, as well as costs incurred, are deferred until the customization and significantmodifications are complete and are then recognized over the post contract support period. We record the deferralof this revenue in deferred revenue and non-current deferred revenue and the deferral of costs in other currentassets and other non-current assets in the Consolidated Balance Sheets.
Change Request and Advisory
Change request and advisory revenues include configuration, customer specific adaptations andmodifications of the system solutions sold by NASDAQ OMX after delivery has occurred. Change request andadvisory revenues are recognized as revenues when earned.
Software As a Service
Software as a service revenues are derived from subscription based arrangements, where customers pay arecurring fee to access our servers to access certain services. These services include broker compliance solutionstargeting brokers throughout the world, as well as governance, risk and compliance services.
Earnings Per Share
We present both basic and diluted EPS. Basic EPS is computed by dividing net income attributable toNASDAQ OMX by the weighted average number of common shares outstanding for the period. Diluted EPS iscomputed by dividing net income attributable to NASDAQ OMX by the weighted-average number of commonshares and common share equivalents outstanding during the period and reflects the assumed conversion of alldilutive securities, which primarily consist of convertible notes, employee stock options, restricted stock andPSUs. Common share equivalents are excluded from the computation in periods for which they have an anti-dilutive effect. Stock options for which the exercise price exceeds the average market price over the period areanti-dilutive and, accordingly, are excluded from the calculation. See Note 14, “Earnings Per Share,” for furtherdiscussion.
Treasury Stock
We account for the purchase of treasury stock under the cost method with the shares of stock repurchasedreflected as a reduction to NASDAQ OMX stockholders’ equity and included in common stock in treasury, atcost in the Consolidated Balance Sheets. When treasury shares are reissued, they are recorded at the average costof the treasury shares acquired.
Pension and Post-Retirement Benefits
Pension and other post-retirement benefit plan information for financial reporting purposes is developedusing actuarial valuations. We assess our pension and other post-retirement benefit plan assumptions on a regularbasis. In evaluating these assumptions, we consider many factors, including evaluation of the discount rate,expected rate of return on plan assets, healthcare cost trend rate, retirement age assumption, our historicalassumptions compared with actual results and analysis of current market conditions and asset allocations. SeeNote 11, “Employee Benefits,” for further discussion.
F-21

The NASDAQ OMX Group, Inc.
Notes to Consolidated Financial Statements—(Continued)
Discount rates used for pension and other post-retirement benefit plan calculations are evaluated annuallyand modified to reflect the prevailing market rates at the measurement date of a high-quality fixed-income debtinstrument portfolio that would provide the future cash flows needed to pay the benefits included in the benefitobligations as they come due. Actuarial assumptions are based upon management’s best estimates and judgment.
The expected rate of return on plan assets for our U.S. pension plans represents our long-term assessment ofreturn expectations which may change based on significant shifts in economic and financial market conditions.The long-term rate of return on plan assets is derived from return assumptions based on targeted allocations forvarious asset classes. While we consider the pension plans’ recent performance and other economic growth andinflation factors, which are supported by long-term historical data, the return expectations for the targeted assetcategories represent a long-term prospective return.
Share-Based Compensation
Accounting for share-based compensation requires the measurement and recognition of compensationexpense for all equity awards based on estimated fair values. We recognize compensation expense for equityawards on a straight-line basis over the requisite service period of the award. See Note 12, “Share-BasedCompensation,” for further discussion.
Advertising Costs
We expense advertising costs, which include media advertising and production costs, in the periods in whichthe costs are incurred. Media advertising and production costs included as marketing and advertising expense inthe Consolidated Statements of Income totaled $7 million in 2013, $6 million in 2012 and $7 million for 2011.
Software Costs
Significant purchased application software and operational software that are an integral part of computerhardware are capitalized and amortized on a straight-line basis over their estimated useful lives, generally fiveyears. All other purchased software is charged to expense as incurred. We develop systems solutions for bothinternal and external use.
Certain costs incurred in connection with developing or obtaining internal use software are capitalized.Unamortized capitalized software development costs are included in data processing equipment and software,within property and equipment, net in the Consolidated Balance Sheets. Amortization of costs capitalized isincluded in depreciation and amortization expense in the Consolidated Statements of Income.
Certain costs of computer software to be sold, leased, or otherwise marketed as a separate product or as partof a product or process are capitalized after the product has reached technological feasibility. Technologicalfeasibility is established upon completion of a detailed program design or, in its absence, completion. Thereafter,all software production costs are capitalized. Prior to reaching technological feasibility, all costs are charged toexpense. Capitalized costs are amortized on a straight-line basis over the remaining estimated economic life ofthe product and are included in depreciation and amortization expense in the Consolidated Statements of Income.
Leases
We expense rent from non-cancellable operating leases, net of sublease income, on a straight line basis,based on future minimum lease payments. The net costs are included in occupancy expense in the ConsolidatedStatements of Income. See Note 17, “Leases,” for further discussion.
F-22
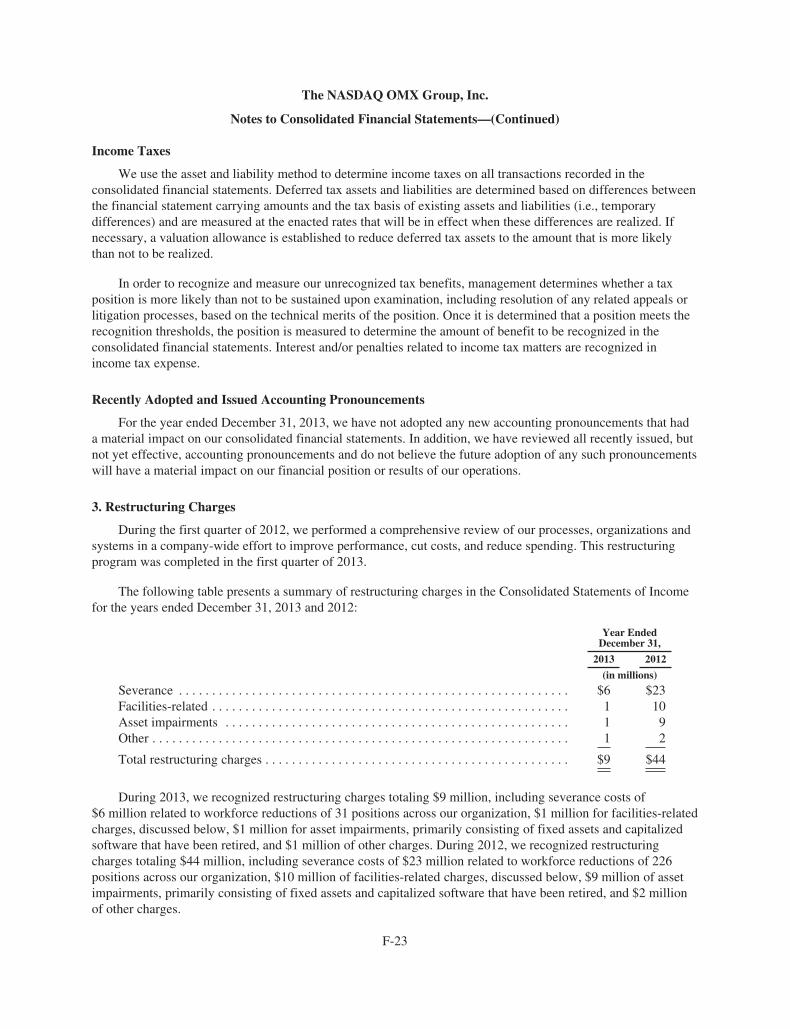
The NASDAQ OMX Group, Inc.
Notes to Consolidated Financial Statements—(Continued)
Income Taxes
We use the asset and liability method to determine income taxes on all transactions recorded in theconsolidated financial statements. Deferred tax assets and liabilities are determined based on differences betweenthe financial statement carrying amounts and the tax basis of existing assets and liabilities (i.e., temporarydifferences) and are measured at the enacted rates that will be in effect when these differences are realized. Ifnecessary, a valuation allowance is established to reduce deferred tax assets to the amount that is more likelythan not to be realized.
In order to recognize and measure our unrecognized tax benefits, management determines whether a taxposition is more likely than not to be sustained upon examination, including resolution of any related appeals orlitigation processes, based on the technical merits of the position. Once it is determined that a position meets therecognition thresholds, the position is measured to determine the amount of benefit to be recognized in theconsolidated financial statements. Interest and/or penalties related to income tax matters are recognized inincome tax expense.
Recently Adopted and Issued Accounting Pronouncements
For the year ended December 31, 2013, we have not adopted any new accounting pronouncements that hada material impact on our consolidated financial statements. In addition, we have reviewed all recently issued, butnot yet effective, accounting pronouncements and do not believe the future adoption of any such pronouncementswill have a material impact on our financial position or results of our operations.
3. Restructuring Charges
During the first quarter of 2012, we performed a comprehensive review of our processes, organizations andsystems in a company-wide effort to improve performance, cut costs, and reduce spending. This restructuringprogram was completed in the first quarter of 2013.
The following table presents a summary of restructuring charges in the Consolidated Statements of Incomefor the years ended December 31, 2013 and 2012:
Year EndedDecember 31,
2013 2012
(in millions)
Severance . . . . . . . . . . . . . . . . . . . . . . . . . . . . . . . . . . . . . . . . . . . . . . . . . . . . . . . . . . . $6 $23Facilities-related . . . . . . . . . . . . . . . . . . . . . . . . . . . . . . . . . . . . . . . . . . . . . . . . . . . . . . 1 10Asset impairments . . . . . . . . . . . . . . . . . . . . . . . . . . . . . . . . . . . . . . . . . . . . . . . . . . . . 1 9Other . . . . . . . . . . . . . . . . . . . . . . . . . . . . . . . . . . . . . . . . . . . . . . . . . . . . . . . . . . . . . . . 1 2
Total restructuring charges . . . . . . . . . . . . . . . . . . . . . . . . . . . . . . . . . . . . . . . . . . . . . . $9 $44
During 2013, we recognized restructuring charges totaling $9 million, including severance costs of$6 million related to workforce reductions of 31 positions across our organization, $1 million for facilities-relatedcharges, discussed below, $1 million for asset impairments, primarily consisting of fixed assets and capitalizedsoftware that have been retired, and $1 million of other charges. During 2012, we recognized restructuringcharges totaling $44 million, including severance costs of $23 million related to workforce reductions of 226positions across our organization, $10 million of facilities-related charges, discussed below, $9 million of assetimpairments, primarily consisting of fixed assets and capitalized software that have been retired, and $2 millionof other charges.
F-23

The NASDAQ OMX Group, Inc.
Notes to Consolidated Financial Statements—(Continued)
Restructuring Reserve
Severance
The accrued severance balance totaled $3 million at December 31, 2013 and $8 million at December 31,2012 and is included in current liabilities in the Consolidated Balance Sheets. The majority of the remainingaccrued severance balance will be paid during the first quarter of 2014. During 2013, $11 million of severancewas paid.
Facilities-related
The facilities-related charges of $1 million for 2013 relate to lease rent accruals for facilities we no longeroccupy due to facilities consolidation. The facilities-related charges of $10 million for 2012 relate to lease rentaccruals for facilities we no longer occupy due to facilities consolidation of $5 million and the write-off anddisposal of leasehold improvements and other assets. The lease rent costs included in the facilities-relatedcharges are equal to the future costs associated with the facility, net of estimated proceeds from any futuresublease agreements that could be reasonably obtained, based on management’s estimate. We will continue toevaluate these estimates in future periods, and thus, there may be additional charges or reversals relating to thesefacilities. The facilities-related restructuring reserve will be paid over several years until the leases expire. Thefacilities-related reserve balance, which totaled $1 million at December 31, 2013 and $3 million at December 31,2012, is included in other current liabilities and other non-current liabilities in the Consolidated Balance Sheets.
4. Acquisitions and Divestiture
We completed the following acquisitions and strategic initiatives in 2013, 2012 and 2011. Financial resultsof each transaction are included in our Consolidated Statements of Income from the date of each acquisition orstrategic initiative.
2013 Acquisitions
PurchaseConsideration
Total Net Assets(Liabilities)Acquired
PurchasedIntangible Assets Goodwill
(in millions)
eSpeed . . . . . . . . . . . . . . . . . . . . . . . . . . . . . . . . . . . . . . $1,239 $ 5 $715 $519TR Corporate Solutions businesses . . . . . . . . . . . . . . . . 366 (37) 91 312
The amounts in the table above represent the preliminary allocation of the purchase price and are subject torevision during the remainder of the measurement period, a period not to exceed 12 months from the acquisitiondate. Adjustments to the provisional values during the measurement period will be recorded as of the date ofacquisition. Comparative information for periods after acquisition but before the period in which the adjustmentsare identified will be adjusted to reflect the effects of the adjustments as if they were taken into account as of theacquisition date. Changes to amounts recorded as assets and liabilities may result in a corresponding adjustmentto goodwill. There were no adjustments to the provisional values for the above acquisitions during 2013.
Acquisition of eSpeed for Trading of U.S. Treasuries
On June 28, 2013, we acquired eSpeed from BGC for $1.2 billion. We acquired net assets, at fair value,totaling $5 million and purchased intangible assets of $715 million which consisted of $578 million for theeSpeed trade name, $121 million in customer relationships and $16 million in technology. The eSpeed businessesare part of our Market Services and Information Services segments.
F-24

The NASDAQ OMX Group, Inc.
Notes to Consolidated Financial Statements—(Continued)
The purchase price consisted of $755 million in cash and contingent future annual issuances of992,247 shares of NASDAQ OMX common stock approximating certain tax benefits associated with thetransaction of $484 million. Such contingent future issuances of NASDAQ OMX common stock will be paidratably over 15 years if NASDAQ OMX achieves a designated revenue target in each such year. The contingentfuture issuances of NASDAQ OMX common stock are subject to anti-dilution protections and acceleration uponcertain events.
NASDAQ OMX used the majority of the net proceeds from the issuance of the 2021 Notes to fund the cashconsideration paid by us for the acquisition of eSpeed. See “3.875% Senior Unsecured Notes,” of Note 9, “DebtObligations,” for further discussion.
Intangible Assets
The following table presents the details of the purchased intangible assets acquired in the acquisition ofeSpeed. All purchased intangible assets with finite lives are amortized using the straight-line method. See Note 5,“Goodwill and Purchased Intangible Assets,” for further discussion.
Value
EstimatedAverage Remaining
Useful Life
(in millions) (in years)
Intangible assets:Trade name:
Market Services . . . . . . . . . . . . . . . . . . . . . . . . . . . . . . . . . . . . . . . . . . . . . . . . $528 IndefiniteInformation Services . . . . . . . . . . . . . . . . . . . . . . . . . . . . . . . . . . . . . . . . . . . . 50 Indefinite
Total trade name . . . . . . . . . . . . . . . . . . . . . . . . . . . . . . . . . . . . . . . . . . . . . . . . . . . 578
Customer relationships:Market Services . . . . . . . . . . . . . . . . . . . . . . . . . . . . . . . . . . . . . . . . . . . . . . . . 105 13 yearsInformation Services . . . . . . . . . . . . . . . . . . . . . . . . . . . . . . . . . . . . . . . . . . . . 16 13 years
Total customer relationships . . . . . . . . . . . . . . . . . . . . . . . . . . . . . . . . . . . . . . . . . . 121
Technology:Market Services . . . . . . . . . . . . . . . . . . . . . . . . . . . . . . . . . . . . . . . . . . . . . . . . 14 5 yearsInformation Services . . . . . . . . . . . . . . . . . . . . . . . . . . . . . . . . . . . . . . . . . . . . 2 5 years
Total technology . . . . . . . . . . . . . . . . . . . . . . . . . . . . . . . . . . . . . . . . . . . . . . . . . . . 16
Total intangible assets . . . . . . . . . . . . . . . . . . . . . . . . . . . . . . . . . . . . . . . . . . . . . . . $715
Below is a discussion of the methods used to determine the fair value of eSpeed’s intangible assets, as wellas a discussion of the estimated average remaining useful life of each intangible asset. The carrying amounts ofall other assets and liabilities were deemed to approximate their estimated fair values.
Trade Name
NASDAQ OMX has incorporated eSpeed into two reporting segments—Market Services and InformationServices. The eSpeed trade name was valued as used in each of these reporting segments. The trade name isrecognized in the industry and carries a reputation for quality. As such, eSpeed and related brands’ reputation andpositive recognition embodied in the trade name are valuable assets to NASDAQ OMX. The trade name wasconsidered the primary asset acquired in this transaction. In valuing the acquired trade name, we used the income
F-25

The NASDAQ OMX Group, Inc.
Notes to Consolidated Financial Statements—(Continued)
approach, specifically the excess earnings method. The excess earnings method examines the economic returnscontributed by the identified tangible and intangible assets of a company, and then isolates the excess return thatis attributable to the intangible asset being valued.
A discount rate of 10% was utilized, which reflects the amount of risk associated with the hypothetical cashflows generated by the eSpeed trade name in the future. In developing a discount rate for the trade name, weestimated a weighted average cost of capital for the overall business and we employed this rate when discountingthe cash flows. The resulting discounted cash flows were then tax-effected at a rate of 40.0%, and a discountedtax amortization benefit was added to the fair value of the asset under the assumption that the trade name wouldbe amortized for tax purposes over a period of 15 years for both Market Services and Information Services.
We have estimated the useful life of the trade name to be indefinite. The useful life was based on severalfactors including the number of years the name has been in service, its popularity within the industry, and ourintention to continue its use.
Customer Relationships
Customer relationships represent the non-contractual and contractual relationships that eSpeed has with itscustomers. The eSpeed customer relationships were valued using the income approach, specifically the with-and-without method. The with-and-without method is commonly used when the cash flows of a business can beestimated with and without the asset in place. The premise associated with this valuation technique is that thevalue of an asset is represented by the differences in the subject business’ cash flows under scenarios where(a) the asset is present and is used in operations (with); and (b) the asset is absent and not used in operations(without). Cash flow differentials are then discounted to present value to arrive at an estimate of fair value for theasset.
We estimated that without current customer relationships, it would take approximately 4-5 years for thecustomer base to grow from 10% of current revenues to 100% of revenues. We also made estimates related tocompensation levels and other expenses such as sales and marketing that would be incurred as the business wasramped up through year 5, which is the year the customer base would be expected to reach the level that currentlyexists.
A discount rate of 10%, which reflects the estimated weighted average cost of capital for the overallbusiness, was utilized when discounting the cash flows. The resulting discounted cash flows were then tax-effected at a rate of 40.0%, and a discounted tax amortization benefit was added to the fair value of the assetunder the assumption that the customer relationships would be amortized for tax purposes over a period of15 years.
Based on the historical behavior of the customers and a parallel analysis of the customers using the excessearnings method, we have estimated the remaining useful life to be 13 years for the acquired customerrelationships.
Technology
The fair value of the eSpeed acquired developed technology was valued using the income approach,specifically the relief from royalty method, or RFRM. The RFRM is used to estimate the cost savings that accrueto the owner of an intangible asset who would otherwise have to pay royalties or license fees on revenues earnedthrough the use of the asset. The royalty rate is applied to the projected revenue over the expected remaining lifeof the intangible asset to estimate royalty savings. The net after-tax royalty savings are calculated for each year inthe remaining economic life of the intangible asset and discounted to present value.
F-26

The NASDAQ OMX Group, Inc.
Notes to Consolidated Financial Statements—(Continued)
To determine the royalty rate we searched for and identified market transactions and royalty rates forcomparable technology. Due to the limited data, we relied on our estimates and benchmarked the estimatedexcess earnings of eSpeed to determine a range of royalty rates that would be reasonable for the use of itsintangible assets based on a profit split methodology. Profit split theory states that a reasonable marketparticipant would be willing and able to make revenue based royalty payments of 25 to 33 percent of theiroperating profit to receive the rights to certain licensable intellectual property necessary for conducting business.Conversely, the owner of such intellectual property would save that amount or be relieved from making thoseroyalty payments. By analyzing these profit splits at 25 and 33 percent, we estimated supportable royalty ratesfor the technology and selected a pre-tax royalty rate of 5%.
A discount rate of 10% was utilized, which reflects the estimated weighted average cost of capital for theoverall business and we employed this rate when discounting the cash flows. The resulting discounted cash flowswere then tax-effected at a rate of 40.0%, and a discounted tax amortization benefit was added to the fair value ofthe asset under the assumption that the technology would be amortized for tax purposes over a period of 15 yearsfor both Market Services and Information Services.
We have estimated the remaining useful life to be 5 years for the acquired developed technology.
Acquisition of the Investor Relations, Public Relations and Multimedia Solutions Businesses of ThomsonReuters
On May 31, 2013, we acquired the TR Corporate Solutions businesses, which provide insight, analytics andcommunications solutions, for $390 million ($366 million cash paid plus $24 million in working capitaladjustments). We acquired net liabilities, at fair value, totaling $37 million and purchased intangible assets of$91 million which consisted of $89 million in customer relationships and $2 million in technology. The TRCorporate Solutions businesses are part of our Corporate Solutions business within our Technology Solutionssegment.
NASDAQ OMX used cash on hand and borrowed $50 million under the revolving credit commitment tofund this acquisition. See “2011 Credit Facility,” of Note 9, “Debt Obligations,” for further discussion.
Intangible Assets
The following table presents the details of the purchased intangible assets acquired in the acquisition of theTR Corporate Solutions businesses. All purchased intangible assets with finite lives are amortized using thestraight-line method. See Note 5, “Goodwill and Purchased Intangible Assets,” for further discussion.
Value
EstimatedAverage Remaining
Useful Life
(in millions) (in years)
Intangible assets:Customer relationships . . . . . . . . . . . . . . . . . . . . . . . . . . . . . . . . $89 9-14 yearsTechnology . . . . . . . . . . . . . . . . . . . . . . . . . . . . . . . . . . . . . . . . . 2 2-5 years
Total intangible assets . . . . . . . . . . . . . . . . . . . . . . . . . . . . . . . . . . . . . $91
Below is a discussion of the methods used to determine the fair value of the purchased intangible assetsacquired in the acquisition of the TR Corporate Solutions businesses, as well as a discussion of the estimatedaverage remaining useful life of each intangible asset. The carrying amounts of all other assets and liabilitieswere deemed to approximate their estimated fair values.
F-27

The NASDAQ OMX Group, Inc.
Notes to Consolidated Financial Statements—(Continued)
Customer Relationships
Customer relationships represent the non-contractual and contractual relationships that each of the TRCorporate Solutions businesses has with its customers and represented a key intangible asset in this transaction.Customer relationships were identified and valued individually for each of the TR Corporate Solutionsbusinesses using the income approach, specifically an excess earnings method. This valuation method relied onassumptions regarding projected revenues, attrition rates, and operating cash flows for each of the TR CorporateSolutions businesses.
We assumed annual revenue attrition of 10.0% for the customers for each of the TR Corporate Solutionsbusinesses, as well as charges for contributory assets. Operating expenses associated with maintaining the assetswere applied to the attrition adjusted revenues. For the five years following 2016, operating margins wereadjusted in order to reach a normalized operating margin level that included an estimate for the fixed costs for thebusinesses. From 2021 onward, the operating margin was held constant at a normalized level. The tax-effectedcash flows were discounted at a rate of 11% to 11.5% based on the risk associated with the hypothetical cashflows generated by the customer base for each specific business line.
The cash flows were then tax-effected at a rate of 40.0%, and a discounted tax amortization benefit wasadded to the fair value of the assets under the assumption that the customer relationships would be amortized fortax purposes over a period of 15 years.
The estimated remaining useful life captured 90.0% of the present value of the cash flows generated by eachcustomer relationship.
Technology
The fair values of the acquired developed technologies were valued using the income approach, specificallythe RFRM, as discussed above under technology relating to eSpeed.
To determine the royalty rate we searched for and identified market transactions and royalty rates forcomparable technology and relied on our estimates and expectations surrounding the relative importance of theacquired developed technologies, competing technologies, foreseeable shifts in the market, and expected royaltypayments for comparable technologies. We also performed a profit split analysis, as described above intechnology relating to eSpeed, for each separate acquired technology in order to estimate an acceptable royaltyrate. Based on the information obtained and the profit spilt analysis, we selected a pre-tax royalty rate of 1.5% forthe webhosting technology and 0.5% for the public relations and multimedia solutions technologies.
A discount rate of 11% was utilized based on the risk associated with the hypothetical cash flows generatedby the developed technologies and we employed this rate when discounting the cash flows. The resultingdiscounted cash flows were then tax-effected at a rate of 40.0%, and a discounted tax amortization benefit wasadded to the fair value of the asset under the assumption that the developed technology would be amortized fortax purposes over a period of 15 years.
We have estimated the remaining useful life to be 2-5 years for the acquired developed technology.
Formation of The NASDAQ Private Market Joint Venture
In March 2013, we formed a joint venture with SharesPost creating NPM, a marketplace for private growthcompanies. We own a majority interest in NPM, combining NASDAQ OMX’s resources, market and operatingexpertise with SharesPost’s web-based platform. Subject to regulatory approvals, NPM is expected to launch inthe first quarter of 2014. NPM is part of our U.S. Listing Services business within our Listing Services segment.
F-28

The NASDAQ OMX Group, Inc.
Notes to Consolidated Financial Statements—(Continued)
EMCF and EuroCCP Merger
In December 2013, EMCF merged with EuroCCP, creating EuroCCP N.V., a new combined clearinghouse.NASDAQ OMX previously had a 22% equity interest in EMCF and, upon completion of the merger, currentlyhas a 25% equity interest in EuroCCP N.V. EuroCCP N.V. combined the risk management and customer serviceorganization of EuroCCP with the technology and operations infrastructure of EMCF. We account for ourinvestment in EuroCCP N.V. under the equity method of accounting. We purchased the additional ownershipinterest in EuroCCP N.V. for an immaterial amount. See “Equity Method Investments,” of Note 6,“Investments,” for further discussion of our equity method investments.
Acquisition of Dutch Cash Equities and Equity Derivatives Trading Venue
In April 2013, we acquired a 25% equity interest in TOM, a Dutch cash equities and equity derivativestrading venue, for an immaterial amount. The terms of the transaction also provide us an option to acquire anadditional 25.1% of the remaining shares at a future date. This transaction expanded our derivatives presence inEurope and is part of our Market Services segment. We account for our investment in TOM under the equitymethod of accounting. See “Equity Method Investments,” of Note 6, “Investments,” for further discussion of ourequity method investments.
2012 Acquisitions
PurchaseConsideration
Total Net Assets(Liabilities) Acquired
PurchasedIntangible Assets Goodwill
(in millions)
NOS Clearing(1) . . . . . . . . . . . . . . . . . . . . . . . . . . . . $40 $ 43 $ 1 $—BWise . . . . . . . . . . . . . . . . . . . . . . . . . . . . . . . . . . . 77 (11) 35 53
(1) In the third quarter of 2012, we recognized a gain of $4 million on our acquisition of NOS Clearing, whichis included in merger and strategic initiatives expense in the Consolidated Statements of Income.
Acquisition of NOS Clearing
In July 2012, we acquired NOS Clearing for approximately $40 million (233 million Norwegian Krone) incash. NOS Clearing is a leading Norway-based clearinghouse primarily for OTC traded derivatives for the freightmarket and seafood derivatives market. We acquired net assets of $43 million, primarily restricted cash related toregulatory capital. The purchased intangible assets totaling $1 million consisted of customer relationships. NOSClearing is part of our European derivative trading and clearing business within our Market Services segment.
Acquisition of BWise
In May 2012, we acquired a 72% ownership interest in BWise, a Netherlands-based service provider thatoffers enterprise governance, risk management and compliance software and services to help companies track,measure and manage key organizational risks for approximately $57 million (47 million Euros) in cash. We haveagreed to purchase the remaining 28% ownership interest in BWise in two separate transactions, resulting in100% ownership by the first half of 2015 for a total purchase price of approximately $77 million (62 millionEuros). We acquired net liabilities of $2 million and recorded a current deferred tax liability of $1 million and anon-current deferred tax liability of $8 million related to purchased intangible assets, resulting in total netliabilities acquired of $11 million. The total deferred tax liabilities of $9 million represent the tax effect of thedifference between the estimated assigned fair value of the acquired intangible assets ($35 million) and the taxbasis ($0) of such assets multiplied by BWise’s effective tax rate of 25%. The purchased intangible assets of
F-29

The NASDAQ OMX Group, Inc.
Notes to Consolidated Financial Statements—(Continued)
$35 million consisted of $23 million in customer relationships, $7 million in technology and $5 million for theBWise trade name. BWise is part of our Market Technology business within our Technology Solutions segment.
Due to changes in the anticipated performance of BWise, the estimated amount of future expectedcontingent purchase price obligations is $12 million at December 31, 2013 with payment dates throughMarch 31, 2015. As a result, an $8 million reduction was recorded to merger and strategic initiatives expense inthe Consolidated Statements of Income for 2013.
Acquisition of the Index Business of Mergent, Inc., including Indxis
In December 2012, we acquired the index business of Mergent, Inc., including Indxis, for $15 million incash. The $5 million in intangible assets, $9 million in goodwill and $1 million in net assets resulting from thisacquisition are included in our Index Licensing and Services business within our Information Services segment.
We finalized the allocation of the purchase price for BWise in the second quarter of 2013, NOS Clearing inthe third quarter of 2013 and the index business of Mergent, Inc., including Indxis, in the fourth quarter of 2013.There were no adjustments to the provisional values for the above acquisitions during 2013.
2011 Acquisitions
Acquisition of Glide Technologies
PurchaseConsideration
Total Net Assets(Liabilities) Acquired
PurchasedIntangible Assets Goodwill
(in millions)
Glide Technologies . . . . . . . . . . . . . . . . . . . . . . . . . $22 $(2) $4 $20
In October 2011, we acquired Glide Technologies, a London-based service provider specializing incorporate communications and reputation management solutions, for $22 million in cash. We acquired netliabilities, at fair value, totaling $1 million and recorded a non-current deferred tax liability of $1 million relatedto purchased intangible assets, resulting in total net liabilities acquired of $2 million. The purchased intangibleassets totaling $4 million consisted of technology and customer relationships. Glide Technologies is part of ourCorporate Solutions business within our Technology Solutions segment.
We finalized the allocation of the purchase price for Glide Technologies in the fourth quarter of 2012. Therewere no adjustments to the provisional values for this acquisition during the year ended 2012.
Acquisition of the Business of RapiData
In December 2011, we acquired the business of RapiData LLC, a leading provider of machine-readableeconomic news to trading firms and financial institutions, for an immaterial amount. Through RapiData, wedeliver U.S. government and other economic news directly from the source to customers interested in receivinginformation in an electronic feed. This service is part of our Market Data business within our InformationServices segment.
Pro Forma Results and Acquisition-related Costs
The consolidated financial statements for the years ended December 31, 2013, 2012 and 2011 include thefinancial results of the above 2013, 2012 and 2011 acquisitions from the date of each acquisition. Pro formafinancial results for the acquisitions completed in 2013, 2012 and 2011 have not been presented since theseacquisitions both individually and in the aggregate were not material to our financial results.
F-30

The NASDAQ OMX Group, Inc.
Notes to Consolidated Financial Statements—(Continued)
Acquisition-related costs for the transactions described above were expensed as incurred and are included inmerger and strategic initiatives expense in the Consolidated Statements of Income.
2012 Divestiture
In August 2012, we sold our majority-owned subsidiary IDCG to LCH Clearnet Group, Limited, or LCH. Underthe terms of the transaction, NASDAQ OMX received ordinary shares of LCH valued at 19 Euros per share, resultingin NASDAQ OMX having a 3.7% pro forma ownership in LCH at that time. We recorded a $14 million loss, which isincluded in loss on divestiture of business in the Consolidated Statements of Income for the year ended December 31,2012. IDCG was part of our U.S. derivative trading and clearing business within our Market Services segment.
5. Goodwill and Purchased Intangible Assets
Goodwill
The following table presents the changes in goodwill by business segment during the year endedDecember 31, 2013:
MarketServices
ListingServices
InformationServices
TechnologySolutions Total
(in millions)Balance at December 31, 2012 . . . . . . . . . . . . . . . . . . . . . . . $2,955 $136 $1,964 $280 $5,335Goodwill acquired . . . . . . . . . . . . . . . . . . . . . . . . . . . . . . . . . 470 — 49 312 831Foreign currency translation adjustment . . . . . . . . . . . . . . . . 8 — 6 6 20
Balance at December 31, 2013 . . . . . . . . . . . . . . . . . . . . . . . $3,433 $136 $2,019 $598 $6,186
As of December 31, 2013, the amount of goodwill that is expected to be deductible for tax purposes infuture periods is $878 million, of which $501 million is related to our acquisition of eSpeed and $299 million isrelated to our acquisition of the TR Corporate Solutions businesses.
The goodwill acquired for Market Services and Information Services shown above relates to our acquisitionof eSpeed in June 2013. The goodwill acquired for Technology Solutions shown above relates to our acquisitionof the TR Corporate Solutions businesses. See “2013 Acquisitions,” of Note 4, “Acquisitions and Divestiture,”for further discussion.
Purchased Intangible Assets
The following table presents details of our total purchased intangible assets, both finite- and indefinite-lived:
December 31, 2013 December 31, 2012
GrossAmount
AccumulatedAmortization
NetAmount
Weighted-AverageUsefulLife (inYears)
GrossAmount
AccumulatedAmortization
NetAmount
Weighted-AverageUsefulLife (inYears)
(in millions) (in millions)Finite-Lived Intangible AssetsTechnology . . . . . . . . . . . . . . . . . . . . . $ 39 $ (12) $ 27 5 $ 26 $ (10) $ 16 5Customer relationships . . . . . . . . . . . . 1,075 (292) 783 19 871 (238) 633 21Other . . . . . . . . . . . . . . . . . . . . . . . . . . 5 (3) 2 8 6 (2) 4 8Foreign currency translation
adjustment . . . . . . . . . . . . . . . . . . . . 3 — 3 6 (1) 5
Total finite-lived intangibleassets . . . . . . . . . . . . . . . . . . . . $1,122 $(307) $ 815 $ 909 $(251) $ 658
F-31

The NASDAQ OMX Group, Inc.
Notes to Consolidated Financial Statements—(Continued)
December 31, 2013 December 31, 2012
GrossAmount
AccumulatedAmortization
NetAmount
Weighted-AverageUsefulLife (inYears)
GrossAmount
AccumulatedAmortization
NetAmount
Weighted-AverageUsefulLife (inYears)
(in millions) (in millions)
Indefinite-Lived Intangible AssetsExchange and clearing registrations . . $ 790 $ — $ 790 $ 790 $ — $ 790Trade names . . . . . . . . . . . . . . . . . . . . . 756 — 756 185 — 185Licenses . . . . . . . . . . . . . . . . . . . . . . . . 51 — 51 51 — 51Foreign currency translation
adjustment . . . . . . . . . . . . . . . . . . . . (26) — (26) (34) — (34)
Total indefinite-lived intangibleassets . . . . . . . . . . . . . . . . . . . . $1,571 $ — $1,571 $ 992 $ — $ 992
Total intangible assets . . . . . . . . . . . . . $2,693 $(307) $2,386 $1,901 $(251) $1,650
Amortization expense for purchased finite-lived intangible assets was $63 million for the year endedDecember 31, 2013, $52 million for the year ended December 31, 2012 and $55 million for the year endedDecember 31, 2011. The increase in amortization expense in 2013 compared to 2012 was primarily due toamortization expense on identifiable finite-lived intangible assets purchased in connection with the acquisitionsof eSpeed and the TR Corporate Solutions businesses offset by lower amortization expense on certain intangibleassets that were impaired in the first quarter of 2013 as discussed below. The decrease in amortization expense in2012 compared to 2011 was primarily due to lower amortization expense on certain intangible assets that wereimpaired in the second quarter of 2012 as discussed below, partially offset by amortization expense onidentifiable finite-lived intangible assets purchased in connection with the acquisition of BWise in May 2012.
The estimated future amortization expense (excluding the impact of foreign currency translation adjustmentsof $3 million as of December 31, 2013) of purchased finite-lived intangible assets as of December 31, 2013 is asfollows:
(in millions)
2014 . . . . . . . . . . . . . . . . . . . . . . . . . . . . . . . . . . . . . . . . . . . . . . . . . . . . . . . . . . . . . . . . . . . . $ 712015 . . . . . . . . . . . . . . . . . . . . . . . . . . . . . . . . . . . . . . . . . . . . . . . . . . . . . . . . . . . . . . . . . . . . 692016 . . . . . . . . . . . . . . . . . . . . . . . . . . . . . . . . . . . . . . . . . . . . . . . . . . . . . . . . . . . . . . . . . . . . 672017 . . . . . . . . . . . . . . . . . . . . . . . . . . . . . . . . . . . . . . . . . . . . . . . . . . . . . . . . . . . . . . . . . . . . 652018 . . . . . . . . . . . . . . . . . . . . . . . . . . . . . . . . . . . . . . . . . . . . . . . . . . . . . . . . . . . . . . . . . . . . 612019 and thereafter . . . . . . . . . . . . . . . . . . . . . . . . . . . . . . . . . . . . . . . . . . . . . . . . . . . . . . . . 479
Total . . . . . . . . . . . . . . . . . . . . . . . . . . . . . . . . . . . . . . . . . . . . . . . . . . . . . . . . . . . . . . . . . . . $812
Intangible Asset Impairment Charges
During 2013, we recorded non-cash intangible asset impairment charges totaling $14 million related tocertain acquired intangible assets associated with customer relationships ($7 million) and a certain trade name($7 million). These impairments resulted primarily from changes in the forecasted revenues associated with theacquired customer list of FTEN. The fair value of customer relationships was determined using the incomeapproach, specifically the multi-period excess earnings method. The fair value of the trade name was determinedusing the income approach, specifically the RFRM. These charges are recorded in asset impairment charges inthe Consolidated Statements of Income for 2013. These impairment charges related to our Market Services
F-32

The NASDAQ OMX Group, Inc.
Notes to Consolidated Financial Statements—(Continued)
segment. However, for segment reporting purposes, these charges were allocated to corporate items based on thedecision that these charges should not be used to evaluate the segment’s operating performance.
In the second quarter of 2012, we recorded non-cash intangible asset impairment charges totaling$28 million related to certain acquired finite-lived intangible assets associated with technology ($19 million),customer relationships ($6 million), and certain trade names ($3 million). These impairments resulted primarilyfrom the replacement of certain acquired technology, as well as changes in the forecasted revenues associatedwith the acquired customer list of certain businesses. The fair value of technology and trademarks wasdetermined using the income approach, specifically the RFRM. The fair value of customer relationships wasdetermined using the income approach, specifically the multi-period excess earnings method. These charges wererecorded in asset impairment charges in the Consolidated Statements of Income for 2012. Of the total impairmentcharge recorded during the second quarter of 2012, $17 million related to our Market Services segment and$11 million related to our Technology Solutions segment. However, for segment reporting purposes, thesecharges were allocated to corporate items based on the decision that these charges should not be used to evaluatethe segments’ operating performance.
6. Investments
Trading Securities
Trading securities, which are included in financial investments, at fair value in the Consolidated BalanceSheets, were $162 million at December 31, 2013 and $201 million as of December 31, 2012. These securities areprimarily comprised of Swedish government debt securities, of which $140 million as of December 31, 2013 and$134 million as of December 31, 2012 are assets utilized to meet regulatory capital requirements primarily forour clearing operations at NASDAQ OMX Nordic Clearing.
Available-for-Sale Investment Security
Investment in DFM
In the fourth quarter of 2013, we sold our available-for-sale investment security in DFM for $48 million andrecorded a gain on the sale of $30 million, which is net of costs directly related to the sale, primarily broker fees.The gain is included in gain on sale of investment security in the Consolidated Statements of Income for the yearended December 31, 2013. As of December 31, 2012, our available-for-sale investment security in DFM wasincluded in financial investments, at fair value in the Consolidated Balance Sheets. The adjusted cost basis of thissecurity was $18 million and the fair value was $22 million. The gross change between the adjusted cost basisand fair value as of December 31, 2012 of $4 million was reflected as an unrealized holding gain in accumulatedother comprehensive loss in the Consolidated Balance Sheets.
Equity Method Investments
The carrying amounts of our equity method investments totaled $30 million as of December 31, 2013 and$13 million as of December 31, 2012 and are included in other non-current assets in the Consolidated BalanceSheets. At December 31, 2013, our equity method investments consisted primarily of our equity interests inEuroCCP N.V. and TOM. At December 31, 2012, our equity method investments consisted primarily of ourequity interest in EMCF. See “EMCF and EuroCCP Merger,” and “Acquisition of Dutch Cash Equities andEquity Derivatives Trading Venue,” of Note 4, “Acquisitions and Divestiture,” for further discussion. Income(loss) recognized from our equity interest in the earnings and losses of these equity method investments was a netloss of $2 million for the year ended December 31, 2013, a net loss of $1 million for the year endedDecember 31, 2012 and a net gain of $2 million for the year ended December 31, 2011.
F-33

The NASDAQ OMX Group, Inc.
Notes to Consolidated Financial Statements—(Continued)
In the first quarter of 2012, we recorded a non-cash, other-than-temporary impairment charge on our equityinvestment in EMCF of $12 million due to a decline in operations at EMCF during the three months endedMarch 31, 2012. This loss is included in asset impairment charges in the Consolidated Statements of Income forthe year ended December 31, 2012.
Income (loss) recognized from our equity method investments is included in net income (loss) fromunconsolidated investees in the Consolidated Statements of Income.
Cost Method Investment
The carrying amount of our cost method investment totaled $65 million as of December 31, 2013 and $37million as of December 31, 2012 and is included in other non-current assets in the Consolidated Balance Sheets.Our cost method investment represents our ownership interest in LCH which was 5% as of December 31, 2013and 3.7% as of December 31, 2012. The increase in our ownership interest of 1.3% was the result of ourparticipation in LCH’s capital raise in May 2013, undertaken by LCH to meet increased regulatory capitalrequirements. We paid $28 million in cash for this additional investment. We account for this investment as acost method investment as we do not control and do not exercise significant influence over LCH and there is noreadily determinable fair value of LCH’s shares since they are not publicly traded. See “2012 Divestiture,” ofNote 4, “Acquisitions and Divestitures,” for further discussion.
7. Property and Equipment, net
The following table presents our major categories of property and equipment, net:
Year Ended December 31,
2013 2012
(in millions)
Data processing equipment and software . . . . . . . . . . . . . . . . . . . . . . . . . . . . . . . . . . . . . . $ 511 $ 409Furniture, equipment and leasehold improvements . . . . . . . . . . . . . . . . . . . . . . . . . . . . . . 216 203
Total property and equipment . . . . . . . . . . . . . . . . . . . . . . . . . . . . . . . . . . . . . . . . . . . . . . . 727 612Less: accumulated depreciation and amortization . . . . . . . . . . . . . . . . . . . . . . . . . . . . . . . (459) (401)
Total property and equipment, net . . . . . . . . . . . . . . . . . . . . . . . . . . . . . . . . . . . . . . . $ 268 $ 211
Depreciation and amortization expense for property and equipment was $59 million for the year endedDecember 31, 2013, $52 million for the year ended December 31, 2012 and $54 million for the year endedDecember 31, 2011. The increase in depreciation and amortization expense in 2013 compared to 2012 was due toan increase in assets placed in service during 2013 primarily related to software. The decrease in depreciation andamortization expense in 2012 compared to 2011 is primarily due to our restructuring actions taken in 2012 whichincluded the write-off and disposal of leasehold improvements and asset impairments primarily consisting offixed assets and capitalized software which have been retired, partially offset by depreciation and amortization onassets placed into service in 2012. See Note 3, “Restructuring Charges,” for further discussion of ourrestructuring actions. These amounts are included in depreciation and amortization expense in the ConsolidatedStatements of Income.
As of December 31, 2013 and 2012, we do not own any real estate properties.
F-34

The NASDAQ OMX Group, Inc.
Notes to Consolidated Financial Statements—(Continued)
8. Deferred Revenue
Deferred revenue represents cash payments received that are yet to be recognized as revenue. AtDecember 31, 2013, we estimate that our deferred revenue, which is primarily related to Listing Services andTechnology Solutions revenues, will be recognized in the following years:
InitialListing
Revenues
Listing ofAdditional
Shares Revenues
AnnualRenewal and Other
Revenues
TechnologySolutions
Revenues(1) Total
(in millions)
Fiscal year ended:2014 . . . . . . . . . . . . . . . . . . . . . . . . . . . . . . . . $ 11 $ 33 $ 25 $ 82 $ 1512015 . . . . . . . . . . . . . . . . . . . . . . . . . . . . . . . . 10 23 1 30 642016 . . . . . . . . . . . . . . . . . . . . . . . . . . . . . . . . 8 14 — 24 462017 . . . . . . . . . . . . . . . . . . . . . . . . . . . . . . . . 6 5 — 11 222018 . . . . . . . . . . . . . . . . . . . . . . . . . . . . . . . . 4 — — 5 92019 and thereafter . . . . . . . . . . . . . . . . . . . . . 2 — — — 2
$ 41 $ 75 $ 26 $ 152 $ 294
(1) The timing of recognition of our deferred Technology Solutions revenues is dependent upon the completionof customization and any significant modifications made pursuant to existing Market Technology contractsand the timing of Corporate Solutions subscription-based contracts. As such, as it relates to MarketTechnology revenues, the timing represents our best estimate.
The changes in our deferred revenue during the years ended December 31, 2013 and 2012 are reflected inthe following table.
InitialListing
Revenues
Listing ofAdditional
Shares Revenues
AnnualRenewal and Other
Revenues
TechnologySolutions
Revenues(2) Total
(in millions)
Balance at January 1, 2013 . . . . . . . . . . . . . . . $ 36 $ 78 $ 32 $ 149 $ 295Additions(1) . . . . . . . . . . . . . . . . . . . . . . . . . . . 17 38 247 245 547Amortization(1) . . . . . . . . . . . . . . . . . . . . . . . . . (12) (41) (247) (254) (554)Translation adjustment . . . . . . . . . . . . . . . . . . — — (6) 12 6
Balance at December 31, 2013 . . . . . . . . . . . . $ 41 $ 75 $ 26 $ 152 $ 294
Balance at January 1, 2012 . . . . . . . . . . . . . . . $ 39 $ 86 $ 25 $ 128 $ 278Additions(1) . . . . . . . . . . . . . . . . . . . . . . . . . . . 11 31 213 98 353Amortization(1) . . . . . . . . . . . . . . . . . . . . . . . . . (14) (39) (208) (85) (346)Translation adjustment . . . . . . . . . . . . . . . . . . — — 2 8 10
Balance at December 31, 2012 . . . . . . . . . . . . $ 36 $ 78 $ 32 $ 149 $ 295
(1) The additions and amortization for initial listing revenues, listing of additional shares revenues and annualrenewal and other revenues primarily reflect revenues from our U.S. listing services business.
(2) Technology Solutions deferred revenues primarily include revenues from our Market Technology deliveredclient contracts in the support phase charged during the period and our Corporate Solutions subscriptionbased contracts. For our Market Technology contracts, where customization and significant modifications tothe software are made to meet the needs of our customers, total revenues, as well as costs incurred, aredeferred until significant modifications are completed and delivered. Once delivered, deferred revenue andthe related deferred costs are recognized over the post contract support period. For these Market Technology
F-35
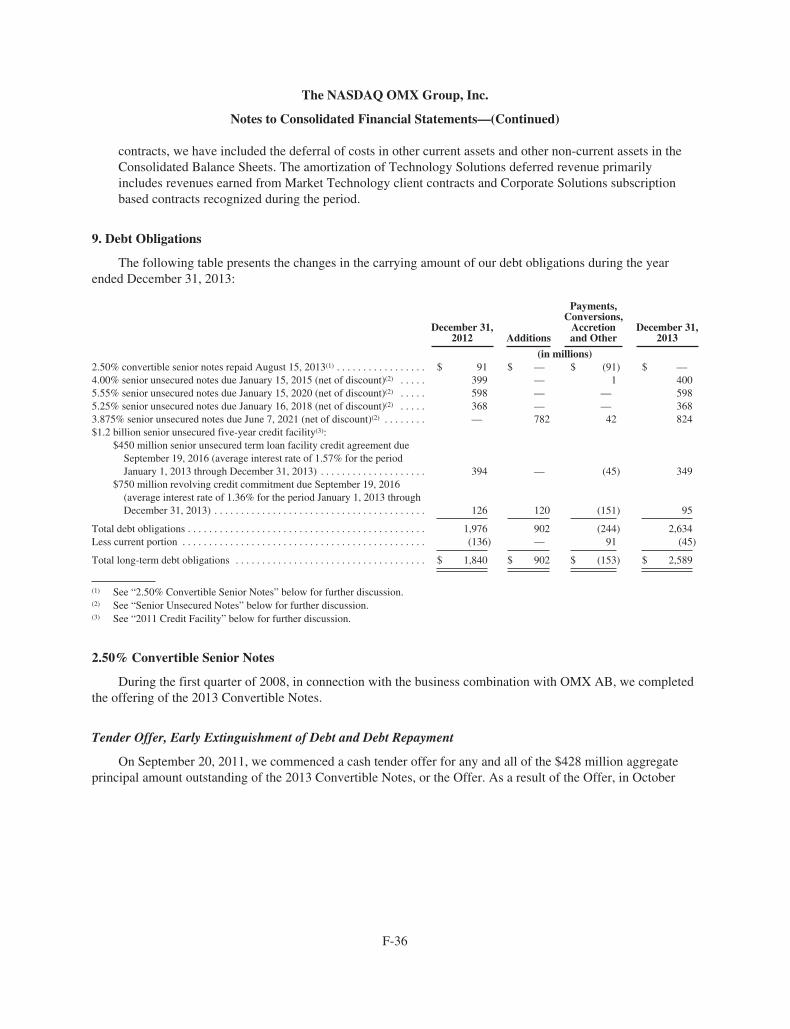
The NASDAQ OMX Group, Inc.
Notes to Consolidated Financial Statements—(Continued)
contracts, we have included the deferral of costs in other current assets and other non-current assets in theConsolidated Balance Sheets. The amortization of Technology Solutions deferred revenue primarilyincludes revenues earned from Market Technology client contracts and Corporate Solutions subscriptionbased contracts recognized during the period.
9. Debt Obligations
The following table presents the changes in the carrying amount of our debt obligations during the yearended December 31, 2013:
December 31,2012 Additions
Payments,Conversions,
Accretionand Other
December 31,2013
(in millions)2.50% convertible senior notes repaid August 15, 2013(1) . . . . . . . . . . . . . . . . . $ 91 $ — $ (91) $ —4.00% senior unsecured notes due January 15, 2015 (net of discount)(2) . . . . . 399 — 1 4005.55% senior unsecured notes due January 15, 2020 (net of discount)(2) . . . . . 598 — — 5985.25% senior unsecured notes due January 16, 2018 (net of discount)(2) . . . . . 368 — — 3683.875% senior unsecured notes due June 7, 2021 (net of discount)(2) . . . . . . . . — 782 42 824$1.2 billion senior unsecured five-year credit facility(3):
$450 million senior unsecured term loan facility credit agreement dueSeptember 19, 2016 (average interest rate of 1.57% for the periodJanuary 1, 2013 through December 31, 2013) . . . . . . . . . . . . . . . . . . . . 394 — (45) 349
$750 million revolving credit commitment due September 19, 2016(average interest rate of 1.36% for the period January 1, 2013 throughDecember 31, 2013) . . . . . . . . . . . . . . . . . . . . . . . . . . . . . . . . . . . . . . . . 126 120 (151) 95
Total debt obligations . . . . . . . . . . . . . . . . . . . . . . . . . . . . . . . . . . . . . . . . . . . . . 1,976 902 (244) 2,634Less current portion . . . . . . . . . . . . . . . . . . . . . . . . . . . . . . . . . . . . . . . . . . . . . . (136) — 91 (45)
Total long-term debt obligations . . . . . . . . . . . . . . . . . . . . . . . . . . . . . . . . . . . . $ 1,840 $ 902 $ (153) $ 2,589
(1) See “2.50% Convertible Senior Notes” below for further discussion.(2) See “Senior Unsecured Notes” below for further discussion.(3) See “2011 Credit Facility” below for further discussion.
2.50% Convertible Senior Notes
During the first quarter of 2008, in connection with the business combination with OMX AB, we completedthe offering of the 2013 Convertible Notes.
Tender Offer, Early Extinguishment of Debt and Debt Repayment
On September 20, 2011, we commenced a cash tender offer for any and all of the $428 million aggregateprincipal amount outstanding of the 2013 Convertible Notes, or the Offer. As a result of the Offer, in October
F-36

The NASDAQ OMX Group, Inc.
Notes to Consolidated Financial Statements—(Continued)
2011, we recorded a pre-tax charge of $25 million consisting of the write-off of the associated unamortized debtdiscount of $22 million, debt issuance costs of $2 million, as well as other costs of $1 million. This charge wasrecorded in general, administrative and other expense in the Consolidated Statements of Income for 2011. The2013 Convertible Notes purchased pursuant to the Offer were cancelled and are no longer outstanding.
The tender offer and early extinguishment of debt discussed above resulted in a remaining aggregateprincipal amount outstanding of the 2013 Convertible Notes of $93 million as of December 31, 2012. We repaidthe remaining outstanding balance of the 2013 Convertible Notes in August 2013.
Interest Expense
Interest expense recognized on the 2013 Convertible Notes in the Consolidated Statements of Income for theyears ended December 31, 2013, 2012 and 2011 is as follows:
Year EndedDecember 31,
2013 2012 2011
(in millions)
Components of interest expense recognized on the 2013 Convertible NotesAccretion of debt discount . . . . . . . . . . . . . . . . . . . . . . . . . . . . . . . . . . . . . . . . . . . . . . . . . . . . . $ 2 $ 3 $ 13Contractual interest . . . . . . . . . . . . . . . . . . . . . . . . . . . . . . . . . . . . . . . . . . . . . . . . . . . . . . . . . . . 1 3 9
Total interest expense recognized on the 2013 Convertible Notes . . . . . . . . . . . . . . . . . . . . . . $ 3 $ 6 $ 22
Senior Unsecured Notes
4.00% and 5.55% Senior Unsecured Notes
In January 2010, NASDAQ OMX issued $1 billion of senior unsecured notes, or the Notes. The Notes wereissued at a discount in two separate series consisting of $400 million aggregate principal amount of 4.00% seniornotes due 2015, or the 2015 Notes, and $600 million aggregate principal amount of 5.55% senior notes due 2020,or the 2020 Notes. As a result of the discount, the proceeds received from the issuance were less than theaggregate principal amounts. As of December 31, 2013, the balance of $400 million for the 2015 Notes and thebalance of $598 million for the 2020 Notes reflect the aggregate principal amounts, less the unamortized debtdiscount. The unamortized debt discount will be accreted through interest expense over the life of the Notes.
The 2015 Notes pay interest semiannually at a rate of 4.00% per annum until January 15, 2015, and the2020 Notes pay interest semiannually at a rate of 5.55% per annum until January 15, 2020. The Notes are generalunsecured obligations of ours and rank equally with all of our existing and future unsubordinated obligations.The Notes are not guaranteed by any of our subsidiaries. The Notes were issued under indentures that, amongother things, limit our ability to consolidate, merge or sell all or substantially all of our assets, create liens, andenter into sale and leaseback transactions.
Debt Issuance Costs
We incurred debt issuance and other costs of $8 million in connection with the issuance of the Notes. Thesecosts, which are capitalized and included in other non-current assets in the Consolidated Balance Sheets, are beingamortized over the life of the debt obligations. Amortization expense, which is recorded as additional interestexpense for these costs, was $1 million for each of the three years ended December 31, 2013, 2012 and 2011.
F-37

The NASDAQ OMX Group, Inc.
Notes to Consolidated Financial Statements—(Continued)
5.25% Senior Unsecured Notes
In December 2010, NASDAQ OMX issued $370 million of 5.25% senior unsecured notes due January 16,2018, or the 2018 Notes. We applied the net proceeds from the 2018 Notes of $367 million and cash on hand of$3 million to repay in full all amounts outstanding under a former bridge facility, as well as related fees.
The 2018 Notes were issued at a discount. As a result of the discount, the proceeds received from theissuance were less than the aggregate principal amount. As of December 31, 2013, the balance of $368 millionreflects the aggregate principal amount, less the unamortized debt discount. The unamortized debt discount willbe accreted through interest expense over the life of the 2018 Notes.
The 2018 Notes pay interest semiannually at a rate of 5.25% per annum until January 16, 2018 and such ratemay vary with NASDAQ OMX’s debt rating up to a rate not to exceed 7.25%. The 2018 Notes are generalunsecured obligations of ours and rank equally with all of our existing and future unsubordinated obligations.They are not guaranteed by any of our subsidiaries. The 2018 Notes were issued under indentures that amongother things, limit our ability to consolidate, merge or sell all or substantially all of our assets, create liens, andenter into sale and leaseback transactions. In addition, upon a change of control triggering event (as defined inthe indenture), the terms require us to repurchase all or part of each holder’s notes for cash equal to 101% of theaggregate principal amount purchased plus accrued and unpaid interest, if any.
Debt Issuance Costs
We incurred debt issuance costs of $3 million in connection with the issuance of the 2018 Notes. These costs,which are capitalized and included in other non-current assets in the Consolidated Balance Sheets, are beingamortized over the life of the debt obligation. Amortization expense, which is recorded as additional interestexpense for these costs, was immaterial for each of the three years ended December 31, 2013, 2012 and 2011.
3.875% Senior Unsecured Notes
In June 2013, NASDAQ OMX issued the 2021 Notes at a discount. As a result of the discount, the proceedsreceived from the issuance were less than the aggregate principal amount. As of December 31, 2013, the balanceof $824 million reflects the aggregate principal amount, less the unamortized debt discount. The unamortizeddebt discount will be accreted through interest expense over the life of the 2021 Notes.
The 2021 Notes pay interest annually at a rate of 3.875% per annum until June 7, 2021 and such rate mayvary with NASDAQ OMX’s debt rating up to a rate not to exceed 5.875%. The 2021 Notes are generalunsecured obligations of ours and rank equally with all of our existing and future unsubordinated obligations.They are not guaranteed by any of our subsidiaries. The 2021 Notes were issued under indentures that amongother things, limit our ability to consolidate, merge or sell all or substantially all of our assets, create liens, andenter into sale and leaseback transactions. In addition, upon a change of control triggering event (as defined inthe indenture), the terms require us to repurchase all or part of each holder’s notes for cash equal to 101% of theaggregate principal amount purchased plus accrued and unpaid interest, if any.
The 2021 Notes have been designated as a hedge of our net investment in certain foreign subsidiaries tomitigate the foreign exchange risk associated with certain investments in these subsidiaries. The increase of $42million noted in the “Payments, Conversions, Accretion and Other” column in the table above reflects thetranslation of the 2021 Notes into U.S. dollars and is recorded in accumulated other comprehensive loss in theConsolidated Balance Sheets for the year ended December 31, 2013.
We used the majority of the net proceeds from the offering of the 2021 Notes to fund the cash considerationpayable by us for the acquisition of eSpeed and related expenses. We used the remaining proceeds for general
F-38

The NASDAQ OMX Group, Inc.
Notes to Consolidated Financial Statements—(Continued)
corporate purposes. See “Acquisition of eSpeed for Trading of U.S. Treasuries,” of Note 4, “Acquisitions andDivestiture,” for further discussion of our acquisition of eSpeed.
Debt Issuance Costs
We incurred debt issuance and other costs of $7 million in connection with the issuance of the 2021 Notes.These costs, which are capitalized and included in other non-current assets in the Consolidated Balance Sheets,are being amortized over the life of the debt obligations. Amortization expense, which is recorded as additionalinterest expense for these costs, was $1 million for 2013.
Credit Facilities
2011 Credit Facility
In September 2011, NASDAQ OMX entered into a $1.2 billion senior unsecured five-year credit facilitywhich matures on September 19, 2016, or the 2011 Credit Facility. The 2011 Credit Facility consists of the 2016Term Loan of $450 million and a $750 million revolving credit commitment (including a swingline facility andletter of credit facility). NASDAQ OMX applied the $450 million in proceeds from the 2016 Term Loan to repayin full the remaining $450 million principal amount outstanding on a former credit facility.
In October 2011, we borrowed $250 million under the revolving credit commitment and utilized cash onhand of $96 million in order to fund the purchase of the 2013 Convertible Notes tendered in the Offer. InNovember 2011, we made an optional prepayment of $24 million and in March 2012 we made an optionalprepayment of $100 million on the revolving credit commitment. As a result, availability under the revolvingcredit commitment was $624 million as of December 31, 2012.
In May 2013, we borrowed $50 million under the revolving credit commitment to fund part of theacquisition of the TR Corporate Solutions businesses. See “Acquisition of the Investor Relations, PublicRelations and Multimedia Solutions Businesses of Thomson Reuters,” of Note 4, “Acquisitions and Divestiture,”for further discussion of our acquisition of the TR Corporate Solutions businesses. During the third quarter of2013, we borrowed an additional $70 million under the revolving credit commitment and used the fundsborrowed and cash on hand to pay down our 2013 Convertible Notes that matured in August 2013. During 2013,we repaid $151 million of the amount drawn on the revolving credit commitment. As of December 31, 2013,availability under the revolving credit commitment was $655 million.
The loans under the 2011 Credit Facility have a variable interest rate based on either the London InterbankOffered Rate, or LIBOR, or the Federal Funds Rate, plus an applicable margin that varies with NASDAQ OMX’sdebt rating.
Under the 2011 Credit Facility, we are required to pay quarterly principal payments equal to 2.50% of theaggregate original principal amounts borrowed under the 2016 Term Loan. In both 2013 and 2012, we maderequired quarterly principal payments totaling $45 million on the 2016 Term Loan.
The 2011 Credit Facility contains financial and operating covenants. Financial covenants include an interestexpense coverage ratio and a maximum leverage ratio. Operating covenants include limitations on NASDAQOMX’s ability to incur additional indebtedness, grant liens on assets, enter into affiliate transactions and paydividends. Our credit facilities allow us to pay cash dividends on our common stock as long as certain leverageratios are maintained. The 2011 Credit Facility also contains customary affirmative covenants, including accessto financial statements, notice of defaults and certain other material events, maintenance of business andinsurance, and events of default, including cross-defaults to our material indebtedness.
F-39

The NASDAQ OMX Group, Inc.
Notes to Consolidated Financial Statements—(Continued)
NASDAQ OMX is permitted to repay borrowings under the 2011 Credit Facility at any time in whole or inpart, without penalty. We are also required to repay loans outstanding under the 2011 Credit Facility with netcash proceeds from sales of property and assets of NASDAQ OMX and its subsidiaries (excluding inventorysales and other sales in the ordinary course of business) and casualty and condemnation proceeds, in each casesubject to specified exceptions and thresholds.
Debt Issuance Costs
We incurred debt issuance and other costs of $5 million in connection with the entry into the 2011 CreditFacility. These costs, which are capitalized and included in other non-current assets in the Consolidated BalanceSheets, are being amortized over the life of the 2011 Credit Facility. Amortization expense, which is recorded asadditional interest expense for these costs, was $1 million for both 2013 and 2012 and was immaterial for 2011.
Other Credit Facilities
In addition to the revolving credit commitment under our 2011 Credit Facility discussed above, we havecredit facilities related to our clearinghouses in order to meet liquidity and regulatory requirements. AtDecember 31, 2013, these credit facilities, which are available in multiple currencies, primarily Swedish Krona,totaled $312 million ($219 million in available liquidity and $93 million to satisfy regulatory requirements), ofwhich $11 million was utilized. At December 31, 2012, these credit facilities, which are available in multiplecurrencies, primarily Swedish Krona, totaled $310 million ($217 million in available liquidity and $93 million tosatisfy regulatory requirements), none of which was utilized.
Debt Covenants
At December 31, 2013, we were in compliance with the covenants of all of our debt obligations.
10. Income Taxes
The income tax provision consists of the following amounts:
Year Ended December 31,
2013 2012 2011
(in millions)Current income taxes:
Federal . . . . . . . . . . . . . . . . . . . . . . . . . . . . . . . . . . . . . . . . . . . . . . . . . . . . . . . $ 134 $ 130 $ 129State . . . . . . . . . . . . . . . . . . . . . . . . . . . . . . . . . . . . . . . . . . . . . . . . . . . . . . . . . 21 37 34Foreign . . . . . . . . . . . . . . . . . . . . . . . . . . . . . . . . . . . . . . . . . . . . . . . . . . . . . . . 33 16 23
Total current income taxes . . . . . . . . . . . . . . . . . . . . . . . . . . . . . . . . . . . . . . . . 188 183 186
Deferred income taxes:Federal . . . . . . . . . . . . . . . . . . . . . . . . . . . . . . . . . . . . . . . . . . . . . . . . . . . . . . . 13 (10) (18)State . . . . . . . . . . . . . . . . . . . . . . . . . . . . . . . . . . . . . . . . . . . . . . . . . . . . . . . . . 11 6 —Foreign . . . . . . . . . . . . . . . . . . . . . . . . . . . . . . . . . . . . . . . . . . . . . . . . . . . . . . . 4 20 22
Total deferred income taxes . . . . . . . . . . . . . . . . . . . . . . . . . . . . . . . . . . . . . . . 28 16 4
Total income tax provision . . . . . . . . . . . . . . . . . . . . . . . . . . . . . . . . . . . . . . . . $ 216 $ 199 $ 190
U.S. federal taxes have not been provided on undistributed earnings of certain non-U.S. subsidiaries to theextent such earnings will be reinvested abroad for an indefinite period of time. At December 31, 2013, thecumulative amount of undistributed earnings in these subsidiaries is approximately $167 million. We have theintent and ability to indefinitely reinvest the undistributed earnings of our non-U.S. subsidiaries.
F-40

The NASDAQ OMX Group, Inc.
Notes to Consolidated Financial Statements—(Continued)
A reconciliation of the income tax provision, based on the U.S. federal statutory rate, to our actual incometax provision for the years ended December 31, 2013, 2012 and 2011 is as follows:
Year Ended December 31,
2013 2012 2011
(in millions)
Federal income tax provision at the statutory rate . . . . . . . . . . . . . . . . . . . . . . . . . . 35.0% 35.0% 35.0%State income tax provision, net of federal effect . . . . . . . . . . . . . . . . . . . . . . . . . . . 2.9% 4.2% 3.3%Non-U.S. subsidiary earnings . . . . . . . . . . . . . . . . . . . . . . . . . . . . . . . . . . . . . . . . . . (4.4)% (6.3)% (6.3)%Change in deferred taxes due to change in tax rate(1) . . . . . . . . . . . . . . . . . . . . . . . . 0.6% 2.3% 0.5%Change in unrecognized tax benefits . . . . . . . . . . . . . . . . . . . . . . . . . . . . . . . . . . . . 4.8% 2.6% 1.0%Other, net . . . . . . . . . . . . . . . . . . . . . . . . . . . . . . . . . . . . . . . . . . . . . . . . . . . . . . . . . (2.9)% (1.5)% (0.3)%
Actual income tax provision(1) . . . . . . . . . . . . . . . . . . . . . . . . . . . . . . . . . . . . . . . . . 36.0% 36.3% 33.2%
(1) The higher effective tax rate in 2012 when compared to 2011 was primarily due to the impact to deferred taxassets and deferred tax liabilities resulting from changes in tax rates in various jurisdictions within the U.S.and outside the U.S., adjustments related to our 2005 – 2011 tax return liabilities which resulted in anincrease to the tax provision and a shift in the geographic mix of earnings and losses. These increases arepartially offset by a permanent tax benefit associated with certain taxable foreign exchange revaluationlosses which are not reflected in pre-tax earnings.
The temporary differences, which give rise to our deferred tax assets and (liabilities), consisted of thefollowing:
December 31,
2013 2012
(in millions)
Deferred tax assets:Deferred revenues . . . . . . . . . . . . . . . . . . . . . . . . . . . . . . . . . . . . . . . . . . . . . . . . . . . . . . $ 36 $ 39U.S. federal net operating loss . . . . . . . . . . . . . . . . . . . . . . . . . . . . . . . . . . . . . . . . . . . . 1 10Foreign net operating loss . . . . . . . . . . . . . . . . . . . . . . . . . . . . . . . . . . . . . . . . . . . . . . . . 105 95State net operating loss . . . . . . . . . . . . . . . . . . . . . . . . . . . . . . . . . . . . . . . . . . . . . . . . . . 1 4Compensation and benefits . . . . . . . . . . . . . . . . . . . . . . . . . . . . . . . . . . . . . . . . . . . . . . . 84 112Foreign currency translation . . . . . . . . . . . . . . . . . . . . . . . . . . . . . . . . . . . . . . . . . . . . . . 231 103Lease reserves . . . . . . . . . . . . . . . . . . . . . . . . . . . . . . . . . . . . . . . . . . . . . . . . . . . . . . . . . 11 14Tax credits . . . . . . . . . . . . . . . . . . . . . . . . . . . . . . . . . . . . . . . . . . . . . . . . . . . . . . . . . . . . 10 17Other . . . . . . . . . . . . . . . . . . . . . . . . . . . . . . . . . . . . . . . . . . . . . . . . . . . . . . . . . . . . . . . . 17 14
Gross deferred tax assets . . . . . . . . . . . . . . . . . . . . . . . . . . . . . . . . . . . . . . . . . . . . . . . . . 496 408
Deferred tax liabilities:Amortization of software development costs and depreciation . . . . . . . . . . . . . . . . . . . (91) (58)Amortization of acquired intangible assets . . . . . . . . . . . . . . . . . . . . . . . . . . . . . . . . . . . (631) (647)Compensation and benefits . . . . . . . . . . . . . . . . . . . . . . . . . . . . . . . . . . . . . . . . . . . . . . . (12) (18)Other . . . . . . . . . . . . . . . . . . . . . . . . . . . . . . . . . . . . . . . . . . . . . . . . . . . . . . . . . . . . . . . . (12) (25)
Gross deferred tax liabilities . . . . . . . . . . . . . . . . . . . . . . . . . . . . . . . . . . . . . . . . . . . . . . . . . . (746) (748)
Net deferred tax liabilities before valuation allowance . . . . . . . . . . . . . . . . . . . . . . . . . . . . . . (250) (340)
Less: valuation allowance . . . . . . . . . . . . . . . . . . . . . . . . . . . . . . . . . . . . . . . . . . . . . . . . . . . . (80) (81)
Net deferred tax liabilities . . . . . . . . . . . . . . . . . . . . . . . . . . . . . . . . . . . . . . . . . . . . . . . . . . . . $ (330) $ (421)
F-41

The NASDAQ OMX Group, Inc.
Notes to Consolidated Financial Statements—(Continued)
A valuation allowance has been established with regards to the tax benefits primarily associated with certainnet operating losses, as it is more likely than not that these benefits will not be realized in the future.
In 2013, our U.S. federal net operating loss of $1 million related to the acquisition of FTEN will expire in2030. Our foreign net operating loss of $105 million, as of December 31, 2013, includes $58 million that willexpire in years 2018 through 2023 and $47 million that has no expiration date. Also, our state net operating lossof $1 million, as of December 31, 2013, will expire in years 2014 through 2033. Our tax credits of $10 millioninclude $7 million related to U.S. research and development credits that will expire in years 2018 through 2027,and $3 million related to non-U.S. tax credits that will expire in years 2014 through 2017.
The following represents the domestic and foreign components of income before income tax provision:
Year Ended December 31,
2013 2012 2011
(in millions)
Domestic . . . . . . . . . . . . . . . . . . . . . . . . . . . . . . . . . . . . . . . . . . . . . . . . . . . . . . . . . . $362 $355 $321Foreign . . . . . . . . . . . . . . . . . . . . . . . . . . . . . . . . . . . . . . . . . . . . . . . . . . . . . . . . . . . 238 193 252
Income before income tax provision . . . . . . . . . . . . . . . . . . . . . . . . . . . . . . . . . . . . $600 $548 $573
In 2013, 2012 and 2011, we recorded income tax benefits of $16 million, $7 million and $10 million,respectively, primarily related to share-based compensation. These amounts were recorded as additional paid-in-capital in the Consolidated Balance Sheets.
We are subject to examination by federal, state and local, and foreign tax authorities. We regularly assessthe likelihood of additional assessments by each jurisdiction and have established tax reserves that we believe areadequate in relation to the potential for additional assessments. We believe that the resolution of tax matters willnot have a material effect on our financial condition but may be material to our operating results for a particularperiod and the effective tax rate for that period.
As of December 31, 2013 and 2012, there are $52 million and $27 million of unrecognized tax benefits thatif recognized would affect our effective tax rate.
A reconciliation of the beginning and ending amount of unrecognized tax benefits is as follows:
Year EndedDecember 31,
2013 2012
(in millions)
Beginning balance . . . . . . . . . . . . . . . . . . . . . . . . . . . . . . . . . . . . . . . . . . . . . . . . . . . . . . . . . . . . . . $ 32 $ 18Additions as a result of tax positions taken in prior periods . . . . . . . . . . . . . . . . . . . . . . . . . . . . . . 17 16Additions as a result of tax positions taken in the current period . . . . . . . . . . . . . . . . . . . . . . . . . . 11 3Reductions related to settlements with taxing authorities . . . . . . . . . . . . . . . . . . . . . . . . . . . . . . . . (1) (5)Reductions as a result of lapses of the applicable statute of limitations . . . . . . . . . . . . . . . . . . . . . (1) —
Ending balance . . . . . . . . . . . . . . . . . . . . . . . . . . . . . . . . . . . . . . . . . . . . . . . . . . . . . . . . . . . . . . . . $ 58 $ 32
Our policy is to recognize interest and/or penalties related to income tax matters in income tax expense. Asof December 31, 2013, we had accrued $8 million for interest and penalties, net of tax effect. As of December 31,2012, we had accrued $5 million for interest and penalties, net of tax effect.
F-42

The NASDAQ OMX Group, Inc.
Notes to Consolidated Financial Statements—(Continued)
NASDAQ OMX and its eligible subsidiaries file a consolidated U.S. federal income tax return andapplicable state and local income tax returns and non-U.S. income tax returns. Federal income tax returns for theyears 2007 through 2010 are currently under audit by the Internal Revenue Service. In 2013, we derecognized apreviously recognized tax benefit associated with the audit of the federal income tax returns for the years 2007through 2010, resulting in an increase to tax expense of $19 million. This amount is offset by a credit tooperating expenses of $19 million associated with a receivable under a tax sharing agreement with an unrelatedparty. We also recorded an increase to tax expense of $8 million associated with the $19 million receivable. Thisamount is partially offset by a credit to operating expenses of $4 million associated with a receivable under a taxsharing agreement with an unrelated party. We are subject to examination for 2011 and 2012 by the InternalRevenue Service. Several state tax returns are currently under examination by the respective tax authorities forthe years 2005 through 2010 and we are subject to examination for 2011 and 2012. Non-U.S. tax returns aresubject to examination by the respective tax authorities for the years 2006 through 2012. We anticipate that theamount of unrecognized tax benefits at December 31, 2013 will significantly decrease in the next twelve monthsas we expect to settle certain tax audits. The final outcome of such audits cannot yet be determined. Weanticipate that such adjustments will not have a material impact on our consolidated financial position or resultsof operations.
In the fourth quarter of 2010, we received an appeal from the Finnish Tax Authority challenging certaininterest expense deductions claimed by NASDAQ OMX in Finland for the year 2008. The appeal also demandedcertain penalties be paid with regard to the company’s tax return filing position. In October 2012, the FinnishAppeals Board disagreed with the company’s tax return filing position for years 2009 through 2011, even thoughthe tax return position with respect to this deduction was previously reviewed and approved by the Finnish TaxAuthority. NASDAQ OMX has appealed the ruling by the Finnish Appeals Board to the Finnish AdministrativeCourt. Through December 31, 2013, we have recorded tax benefits of $18 million associated with this filingposition. Of this amount we have paid $12 million to the Finnish tax authorities. We have also paid $11 millionin interest and penalties. In 2014 we will pay $6 million which represents the benefit taken in 2013. We expectthe Finnish Administrative Court to agree with our position and, if so, NASDAQ OMX will receive a refund of$29 million.
From 2009 through 2012, we recorded tax benefits associated with certain interest expense incurred inSweden. Our position is supported by a 2011 ruling we received from the Swedish Supreme AdministrativeCourt. However, under new legislation effective January 1, 2013, limitations are imposed on certain forms ofinterest expense. Since the new legislation is unclear with regards to our ability to continue to claim such interestdeductions, NASDAQ OMX has filed an application for an advance tax ruling with the Swedish Tax Council forAdvance Tax Rulings. We expect to receive a favorable response from the Swedish Tax Council for AdvanceTax Rulings. Since January 1, 2013, we have recorded tax benefits of $16 million, or $0.09 per diluted share,related to this matter. We expect to record recurring quarterly tax benefits of $4 million to $5 million with respectto this issue for the foreseeable future.
Other Tax Matters
In December 2012, the Swedish Tax Agency approved our 2010 amended VAT tax return and we received acash refund for the amount claimed. In 2013, we filed VAT tax returns for 2011 and 2012 and utilized the sameapproach which was approved for the 2010 filing. However, even though the VAT return position was previouslyreviewed and approved by the Swedish Tax Agency, we were informed by the Swedish Tax Agency that ourVAT refund claims for 2011 and 2012 are not valid. However, they will not seek reimbursement of the 2010refund. We will appeal the finding by the Swedish Tax Agency. Through December 31, 2013, we have recordedbenefits of $14 million associated with this position.
F-43

The NASDAQ OMX Group, Inc.
Notes to Consolidated Financial Statements—(Continued)
11. Employee Benefits
U.S. Defined-Benefit Pension and Supplemental Executive Retirement Plans
We maintain non-contributory, defined-benefit pension plans, non-qualified supplemental executiveretirement plans, or SERPs, for certain senior executives and post-retirement benefit plans for eligible employeesin the U.S., collectively referred to as the NASDAQ OMX Benefit Plans.
Our pension plans and SERPs are frozen. Future service and salary for all participants do not count towardan accrual of benefits under the pension plans and SERPs.
Components of Net Periodic Benefit Cost
The following table sets forth the components of net periodic pension, SERP and post-retirement benefitscosts from the NASDAQ OMX Benefit Plans recognized in compensation and benefits expense in theConsolidated Statements of Income:
Year Ended December 31,
2013 2012 2011
(in millions)
Components of net periodic benefit cost:Interest cost . . . . . . . . . . . . . . . . . . . . . . . . . . . . . . . . . . . . . . . . . . . . . . . . . . $ 5 $ 6 $ 6Expected return on plan assets . . . . . . . . . . . . . . . . . . . . . . . . . . . . . . . . . . . (5) (5) (5)Recognized net actuarial loss . . . . . . . . . . . . . . . . . . . . . . . . . . . . . . . . . . . . 4 3 3Curtailment loss . . . . . . . . . . . . . . . . . . . . . . . . . . . . . . . . . . . . . . . . . . . . . . 2 — —
Net periodic benefit cost . . . . . . . . . . . . . . . . . . . . . . . . . . . . . . . . . . . . . . . $ 6 $ 4 $ 4
F-44

The NASDAQ OMX Group, Inc.
Notes to Consolidated Financial Statements—(Continued)
Benefit Obligations and Funded Status
The following table provides a reconciliation of the changes in the benefit obligation, the plan assets and thefunded status of the NASDAQ OMX Benefit Plans:
2013 2012
Pension SERPPost-
retirement Total Pension SERPPost-
retirement Total
(in millions)
Change in benefit obligationBenefit obligation at beginning of year . . $104 $ 33 $ 4 $141 $ 86 $ 30 $ 11 $127Interest cost . . . . . . . . . . . . . . . . . . . . . . . . 4 1 — 5 4 2 — 6Actuarial (gains) losses . . . . . . . . . . . . . . — — (1) (1) 1 — (7) (6)Benefits paid . . . . . . . . . . . . . . . . . . . . . . . (2) (2) — (4) (4) (2) — (6)Settlements . . . . . . . . . . . . . . . . . . . . . . . . (5) — — (5) — — — —(Gains) losses due to change in discount
rate . . . . . . . . . . . . . . . . . . . . . . . . . . . . (15) (3) — (18) 17 3 — 20Loss due to change in mortality rate . . . . 5 1 — 6 — — — —
Benefit obligation at end of year . . . . . . 91 30 3 124 104 33 4 141
Change in plan assetsFair value of plan assets at beginning of
year . . . . . . . . . . . . . . . . . . . . . . . . . . . . 75 — — 75 62 — — 62Actual return on plan assets . . . . . . . . . . . 6 — — 6 7 — — 7Company contributions . . . . . . . . . . . . . . 1 2 — 3 10 2 — 12Benefits paid . . . . . . . . . . . . . . . . . . . . . . . (2) (2) — (4) (4) (2) — (6)Settlements . . . . . . . . . . . . . . . . . . . . . . . . (5) — — (5) — — — —
Fair value of plan assets at end ofyear . . . . . . . . . . . . . . . . . . . . . . . . . . . . 75 — — 75 75 — — 75
Underfunded status of the plans . . . . . . (16) (30) (3) (49) (29) (33) (4) (66)
Accumulated benefit obligation . . . . . . $ 91 $ 30 $ 3 $124 $104 $ 33 $ 4 $141
The total underfunded status of the NASDAQ OMX Benefit Plans of $49 million at December 31, 2013 and$66 million at December 31, 2012 is included in other non-current liabilities and accrued personnel costs in theConsolidated Balance Sheets. No plan assets are expected to be returned to us during the year endingDecember 31, 2014.
Actuarial Assumptions
The following tables provide the weighted-average actuarial assumptions for the NASDAQ OMX BenefitPlans.
Weighted-average assumptions used to determine benefit obligations at the end of the fiscal year:
2013 2012
Discount rate:Pension . . . . . . . . . . . . . . . . . . . . . . . . . . . . . . . . . . . . . . . . . . . . . . . . . . . . . . . . . . . 4.90% 4.00%SERP . . . . . . . . . . . . . . . . . . . . . . . . . . . . . . . . . . . . . . . . . . . . . . . . . . . . . . . . . . . . . 4.90% 4.00%Post-retirement . . . . . . . . . . . . . . . . . . . . . . . . . . . . . . . . . . . . . . . . . . . . . . . . . . . . . 4.90% 4.00%
F-45

The NASDAQ OMX Group, Inc.
Notes to Consolidated Financial Statements—(Continued)
Weighted-average assumptions used to determine net benefit cost for the fiscal year:
2013 2012 2011
Discount rate:Pension . . . . . . . . . . . . . . . . . . . . . . . . . . . . . . . . . . . . . . . . . . . . . 4.00% 5.00% 5.25%SERP . . . . . . . . . . . . . . . . . . . . . . . . . . . . . . . . . . . . . . . . . . . . . . 4.00% 5.00% 5.25%Post-retirement . . . . . . . . . . . . . . . . . . . . . . . . . . . . . . . . . . . . . . . 4.00% 5.00% 5.25%
Expected return on plan assets:Pension . . . . . . . . . . . . . . . . . . . . . . . . . . . . . . . . . . . . . . . . . . . . . 7.75% 7.75% 8.00%SERP . . . . . . . . . . . . . . . . . . . . . . . . . . . . . . . . . . . . . . . . . . . . . . N/A N/A N/APost-retirement . . . . . . . . . . . . . . . . . . . . . . . . . . . . . . . . . . . . . . . N/A N/A N/A
N/A—Not applicable
The assumptions above are used to develop the benefit obligations at fiscal year-end and to develop the netperiodic benefit cost for the subsequent fiscal year. Therefore, the assumptions used to determine benefitobligations were established at each year-end while the assumptions used to determine net periodic benefit costfor each year are established at the end of each previous year.
The net periodic benefit obligations and the net periodic benefit cost are based on actuarial assumptions thatare reviewed on an annual basis. We revise these assumptions based on an annual evaluation of long-term trends,as well as market conditions, which may have an impact on the cost of providing retirement benefits.
For 2014, the weighted-average assumed healthcare cost trend rate used for post-retirement measurementpurposes for the NASDAQ OMX Benefit Plans is 8.0%. A one percent increase or decrease in the assumedhealthcare cost trend would have an immaterial effect on the post-retirement service and interest cost and post-retirement benefit obligation for our plans.
Plan Assets of the NASDAQ OMX Benefit Plans
NASDAQ OMX’s Pension and 401(k) Committee, which is comprised of employees of NASDAQ OMX,has oversight responsibility for the plan assets of the NASDAQ OMX Benefit Plans. The investment policy andstrategy of the plan assets, which was adopted by NASDAQ OMX’s Pension and 401(k) Committee, is toprovide for preservation of principal, both in nominal and real terms, in order to meet the long-term spendingneeds of the NASDAQ OMX Benefit Plans. We invest in securities per the target allocations stated below. Targetallocations may change based on certain funded levels. Approximated allocations for plan assets as ofDecember 31, 2013 were as follows:
Target Allocation
Equity securities . . . . . . . . . . . . . . . . . . . . . . . . . . . . . . . . . . . . . . . . . . . . . . 40%Fixed income securities . . . . . . . . . . . . . . . . . . . . . . . . . . . . . . . . . . . . . . . . . 44%Other investment strategies and cash . . . . . . . . . . . . . . . . . . . . . . . . . . . . . . 16%
Total allocation . . . . . . . . . . . . . . . . . . . . . . . . . . . . . . . . . . . . . . . . . . . 100%
Asset allocations are reviewed quarterly and adjusted, as appropriate, to remain within target allocations.The investment policy is reviewed on an annual basis, with the advice of an investment consultant, to determineif the policy or asset allocation targets should be changed.
F-46

The NASDAQ OMX Group, Inc.
Notes to Consolidated Financial Statements—(Continued)
The fair value of the plan assets for the NASDAQ OMX Benefit Plans at December 31, 2013, by assetcategory and fair value hierarchy, are as follows:
Total Benefit Plan Assetsas of
December 31, 2013
Fair Value Measurements(1)
Level 1 Level 2 Level 3
(in millions)
Equity securities(2) . . . . . . . . . . . . . . . . . . . . . . . . . . . . . . . $ 30 $ — $ 30 $ —Fixed income securities(3) . . . . . . . . . . . . . . . . . . . . . . . . . 32 3 29 —Other investment strategies and cash(4) . . . . . . . . . . . . . . . 13 3 — 10
Total benefit plan assets . . . . . . . . . . . . . . . . . . . . . . $ 75 $ 6 $ 59 $ 10
(1) See Note 15, “Fair Value of Financial Instruments,” for further discussion of fair value measurements.(2) Includes securities held in various classes of domestic, international and emerging market equities.(3) Includes investments in U.S. fixed income and emerging markets debt.(4) Includes cash, securities held in multi-strategy hedge funds, and securities held in real estate funds.
Securities held in multi-strategy hedge funds are held in multiple asset classes and include investments inequity and fixed income securities. Securities held in real estate funds include investments in a real estateexchange traded fund and an open-end commingled fund.
As of December 31, 2012, total benefit plan assets of $75 million were held entirely in cash and cashequivalents due to a transition between investment managers and classified under Level 1 of the fair valuehierarchy.
The change in Level 3 plan assets for the year ended December 31, 2013 is as follows:
December 31, 2012(1) Purchases Net unrealized gains December 31, 2013
(in millions)
Other investment strategies:Real estate investment . . . . . . . . . . . . . $— $2 $— $ 2Hedge fund investment . . . . . . . . . . . . — 7 1 8
Total other investment strategies . . . . . $— $9 $ 1 $10
(1) There were no Level 3 plan assets as of December 31, 2012.
All Level 3 pension plan assets are valued by our independent third party investment plan manager. TheLevel 3 plan assets in the real estate investment are valued using various valuation techniques which include theincome capitalization approach, the sales comparison approach and the cost approach. The Level 3 plan assets inthe hedge fund investment are valued based on the net asset value of the underlying investments.
The expected rate of return on plan assets for the NASDAQ OMX Benefit Plans represents our long-termassessment of return expectations which may change based on significant shifts in economic and financial marketconditions. The long-term rate of return on plan assets is derived from return assumptions determined based on assetclasses held and weighted based on the current target allocation for each class. Over the long term, our investmentsin equity securities are expected to return between 7% and 10%, investments in fixed income securities are expectedto return between 2% and 7%, other investment strategies are expected to return between 6% and 7%, and cash isexpected to return between 1% and 2%. While we considered the NASDAQ OMX Benefit Plans’ recentperformance and other economic growth and inflation factors, which are supported by long-term historical data, thereturn expectations for each of these asset categories represents a long-term prospective return. Based on historicalexperience, the NASDAQ OMX Pension and 401(k) Committee expects that the plans’ asset managers overall willprovide a modest (1% per annum) premium to their respective market benchmark indexes.
F-47

The NASDAQ OMX Group, Inc.
Notes to Consolidated Financial Statements—(Continued)
Accumulated Other Comprehensive Income (Loss)
Accumulated other comprehensive income (loss), as of December 31, 2013, consisted of the followingamounts that have yet to be recognized in net periodic benefit costs for the NASDAQ OMX Benefit Plans:
Pension SERPPost-
retirement Total
(in millions)
Unrecognized net actuarial gain (loss) . . . . . . . . . . . . . . . . . . . . . . . . $ (29) $ (1) $ 8 $ (22)Income tax benefit (expense) . . . . . . . . . . . . . . . . . . . . . . . . . . . . . . . 12 — (3) 9
Employee benefit plan adjustments, net of tax . . . . . . . . . . . . . . . . . . $ (17) $ (1) $ 5 $ (13)
Estimated Future Benefit Payments
We expect to make the following benefit payments to participants in the next ten fiscal years under theNASDAQ OMX Benefit Plans:
Pension SERPPost-
retirement Total
(in millions)
Fiscal Year Ended:2014 . . . . . . . . . . . . . . . . . . . . . . . . . . . . . . . . . . . . . . . . . . . . . . . $ 3 $ 3 $ — $ 62015 . . . . . . . . . . . . . . . . . . . . . . . . . . . . . . . . . . . . . . . . . . . . . . . 4 3 — 72016 . . . . . . . . . . . . . . . . . . . . . . . . . . . . . . . . . . . . . . . . . . . . . . . 4 2 — 62017 . . . . . . . . . . . . . . . . . . . . . . . . . . . . . . . . . . . . . . . . . . . . . . . 4 12 — 162018 . . . . . . . . . . . . . . . . . . . . . . . . . . . . . . . . . . . . . . . . . . . . . . . 5 2 — 72019 through 2023 . . . . . . . . . . . . . . . . . . . . . . . . . . . . . . . . . . . . 26 8 1 35
$ 46 $ 30 $ 1 $ 77
Non—U.S. Benefit Plans
Most employees outside the U.S. are covered by local retirement plans or by applicable social laws. Benefitsunder social laws are generally expensed in the periods in which the costs are incurred. These costs are includedin compensation and benefits expense in the Consolidated Statements of Income and were $19 million in 2013,$18 million in 2012 and $14 million in 2011.
As part of the acquisition of certain subsidiaries of Nord Pool, we assumed the obligation for severalpension plans providing benefits for these employees. Employees covered under these pension plans are entitledto defined future pension benefits based on the number of years of employment and pay at retirement age. Themeasurement date of the plan obligations is December 31. The projected benefit obligation was $11 million atDecember 31, 2013 and $12 million at December 31, 2012. The fair value of the plan assets was $12 million atDecember 31, 2013 and $9 million at December 31, 2012. The overfunded status of the plans was $1 million atDecember 31, 2013 and the underfunded status of the plans was $3 million at December 31, 2012. We recorded again of $7 million in 2013 for these plans primarily due to a change in actuarial assumptions. The benefit cost forthese plans was immaterial in 2012 and $2 million in 2011.
U.S. Defined Contribution Savings Plan
We sponsor a voluntary defined contribution savings plan, or 401(k) Plan, for U.S. employees. Employeesare immediately eligible to make contributions to the plan and are also eligible for an employer contribution
F-48

The NASDAQ OMX Group, Inc.
Notes to Consolidated Financial Statements—(Continued)
match at an amount equal to 100.0% of the first 4.0% of eligible employee contributions. Effective January 1,2014, we increased our employer contribution match dollar for dollar to 6.0% of eligible employee contributions.Savings plan expense included in compensation and benefits expense in the Consolidated Statements of Incomewas $6 million in 2013, $5 million in 2012 and $4 million in 2011.
We have a profit-sharing contribution feature to our 401(k) plan which allows eligible U.S. employees toreceive employer retirement contributions, or ERCs, when we meet our annual corporate goals. In addition, wehave a supplemental ERC for select highly compensated employees whose ERCs are limited by the annualInternal Revenue Service compensation limit. ERC expense recorded in compensation and benefits expense inthe Consolidated Statements of Income was $5 million in 2013, 2012 and 2011.
In December 2013, we announced changes to the ERC program. In 2014, we will reduce the basic ERCcontribution for all plan participants and effective January 1, 2015, the ERC plan will be discontinued and nofuture contributions will be made.
Employee Stock Purchase Plan
We have an ESPP under which approximately 3.1 million shares of our common stock have been reservedfor future issuance as of December 31, 2013.
Our ESPP allows eligible U.S. and non-U.S. employees to purchase a limited number of shares of ourcommon stock at six-month intervals, called offering periods, at 85.0% of the lower of the fair market value onthe first or the last day of each offering period. The 15.0% discount given to our employees is included incompensation and benefits expense in the Consolidated Statements of Income.
Under our ESPP, employees may purchase shares having a value not exceeding 10.0% of their annualcompensation, subject to applicable annual Internal Revenue Service limitations. During 2013, employeespurchased 271,843 shares at a weighted-average price of $24.12, during 2012, employees purchased 289,923shares at a weighted-average price of $19.34 and during 2011, employees purchased 246,850 shares at aweighted-average price of $20.64 under the ESPP. We recorded compensation expense of $3 million in 2013, $2million in 2012 and $1 million in 2011 for the 15.0% discount that is given to our employees.
12. Share-Based Compensation
We have a share-based compensation program that provides our board of directors broad discretion increating employee equity incentives. Share-based awards, or equity awards, granted under this program includestock options, restricted stock, and PSUs. Grants of equity awards are designed to reward employees for theirlong-term contributions and provide incentives for them to remain with us. For accounting purposes, we considerPSUs to be a form of restricted stock.
Restricted stock is generally time-based and vests over three—to five-year periods beginning on the date ofthe grant. Stock options are also generally time-based and expire ten years from the grant date. Stock option andrestricted stock awards generally include performance-based accelerated vesting features based on achievementof specific levels of corporate performance. If NASDAQ OMX exceeds the applicable performance parameters,the grants vest on the third anniversary of the grant date, if NASDAQ OMX meets the applicable performanceparameters, the grants vest on the fourth anniversary of the grant date, and if NASDAQ OMX does not meet theapplicable performance parameters, the grants vest on the fifth anniversary of the grant date.
PSUs are based on performance measures that impact the amount of shares that each recipient will receiveupon vesting. PSUs are granted at the fair market value of our stock on the grant date and compensation cost isrecognized over the performance period and, in certain cases, an additional vesting period. For each grant of
F-49

The NASDAQ OMX Group, Inc.
Notes to Consolidated Financial Statements—(Continued)
PSUs, an employee may receive from 0% to 150% of the target amount granted, depending on the achievementof performance measures. We report the target number of PSUs granted, unless we have determined that it ismore likely than not, based on the actual achievement of performance measures, that an employee will receive adifferent amount of shares underlying the PSUs, in which case we report the amount of shares the employee islikely to receive.
We also have a performance-based long-term incentive program for our chief executive officer, executivevice presidents and senior vice presidents that focuses on TSR. This program represents 100% of our chiefexecutive officer’s and executive vice presidents’ long-term stock-based compensation and 50% of our seniorvice presidents’ long-term stock-based compensation. Under the program, each individual receives PSUs with athree-year cumulative performance period that vest at the end of the performance period. Performance will bedetermined by comparing NASDAQ OMX’s TSR to two peer groups, each weighted 50%. The first peer groupconsists of exchange companies, and the second peer group consists of all companies in the Standard & Poor 500Index. NASDAQ OMX’s relative performance ranking against each of these groups will determine the finalnumber of shares delivered to each individual under the program. The payout under this program will be between0% and 200% of the number of PSUs granted and will be determined by NASDAQ OMX’s overall performanceagainst both peer groups. However, if NASDAQ OMX’s TSR is negative for the three-year performance period,regardless of TSR ranking, the payout will not exceed 100% of the number of PSUs granted. We estimate the fairvalue of PSU’s granted under the TSR program using the Monte Carlo simulation model, as these awards containa market condition. The following weighted-average assumptions were used to determine the weighted-averagefair values of the PSU awards granted under the TSR program for the year ended December 31, 2013 andDecember 31, 2012:
Year EndedDecember 31,
2013 2012
Weighted-average risk free interest rate . . . . . . . . . . . . . . . . . . . . . . . . . . . . . . . . . . . . . . . . . . 0.45% 0.34%Expected volatility(1) . . . . . . . . . . . . . . . . . . . . . . . . . . . . . . . . . . . . . . . . . . . . . . . . . . . . . . . . . 31.4% 32.9%Weighted-average fair value at grant date . . . . . . . . . . . . . . . . . . . . . . . . . . . . . . . . . . . . . . . . $43.81 $22.50
(1) We use historic volatility for PSU awards issued under the TSR program, as implied volatility data couldnot be obtained for all the companies in the peer groups used for relative performance measurement withinthe TSR program.
Summary of 2013 Equity Awards
In July 2013, we granted restricted stock to most active employees. The restricted stock granted included aperformance-based accelerated vesting feature based on achievement of specific levels of corporate performance,as described above. In 2013, we achieved the applicable performance parameters, and therefore, we will continueto expense the grant over the four-year vesting period.
Also in July 2013, certain officers received grants of 800,152 PSUs. Of these PSUs granted, 530,823 unitsare subject to the performance measures and vesting schedules of the TSR program as discussed above, and theremaining 269,329 units are subject to a one year performance period and generally vest ratably on an annualbasis from December 31, 2014 through December 31, 2016.
During 2012, certain grants of PSUs with a one-year performance period exceeded the applicableperformance parameters. As a result, an additional 28,028 units were considered granted during 2013.
F-50

The NASDAQ OMX Group, Inc.
Notes to Consolidated Financial Statements—(Continued)
Summary of 2012 Equity Awards
In May 2012, we granted restricted stock to most active employees. The restricted stock granted included aperformance-based accelerated vesting feature based on achievement of specific levels of corporate performance,as described above. In 2012, we achieved the applicable performance parameters, and therefore, we will continueto expense the grant over the four-year vesting period.
Also in May 2012, certain officers received grants of 1,072,446 PSUs. Of these PSUs granted, 701,470 unitsare subject to the performance measure and vesting schedule under the TSR program discussed above, and theremaining 370,976 units are subject to a one year performance period and generally vest ratably on an annualbasis from December 31, 2013 through December 31, 2015.
During 2011, certain grants of PSUs with a one-year performance period exceeded the applicableperformance parameters. As a result, an additional 251,224 units were considered granted during 2012. Inaddition, certain grants of PSUs issued in 2009 with a three-year performance period exceeded the applicableperformance parameters. As a result, an additional 40,000 units were considered granted in February 2012.
Summary of 2011 Equity Awards
In March 2011, we granted non-qualified stock options and/or restricted stock to most active employees.Both the stock options and restricted stock granted included a performance-based accelerated vesting featurebased on achievement of specific levels of corporate performance, as described above. In 2011, we exceeded theapplicable performance parameters, and therefore, we will expense the grant over a three-year vesting period.
During 2011, certain officers received grants of a target amount of 632,368 PSUs. Of these PSUs granted,100,000 units are subject to a three-year performance period and vest at the end of the performance period. Theremaining 532,368 units were subject to a one-year performance period and generally will vest ratably on anannual basis from December 31, 2012 through December 31, 2014.
See “Summary of Stock Option Activity” and “Summary of Restricted Stock and PSU Activity” below forfurther discussion.
Common Shares Available Under Our Equity Plan
As of December 31, 2013, we had approximately 2.9 million shares of common stock authorized for futureissuance under our Equity Plan.
Summary of Share-Based Compensation Expense
The following table shows the total share-based compensation expense resulting from equity awards and the15.0% discount for the ESPP for the years ended December 31, 2013, 2012 and 2011 in the ConsolidatedStatements of Income:
Year Ended December 31,
2013 2012 2011
(in millions)
Share-based compensation expense before income taxes . . . . . . . . . . . . . . . . . . . . . . . . . $ 47 $ 46 $ 36Income tax benefit . . . . . . . . . . . . . . . . . . . . . . . . . . . . . . . . . . . . . . . . . . . . . . . . . . . . . . . (19) (18) (14)
Share-based compensation expense after income taxes . . . . . . . . . . . . . . . . . . . . . . . . . . . $ 28 $ 28 $ 22
F-51

The NASDAQ OMX Group, Inc.
Notes to Consolidated Financial Statements—(Continued)
We estimated the fair value of stock option awards using the Black-Scholes valuation model. No stockoption awards were granted during 2013 and 2012. The following assumptions were utilized for the year endedDecember 31, 2011:
2011
Expected life (in years) . . . . . . . . . . . . . . . . . . . . . . . . . . . . . . . . . . . . . . . . . . . . . . . . . . . . . . . . 5Weighted-average risk free interest rate . . . . . . . . . . . . . . . . . . . . . . . . . . . . . . . . . . . . . . . . . . . 2.16%Expected volatility . . . . . . . . . . . . . . . . . . . . . . . . . . . . . . . . . . . . . . . . . . . . . . . . . . . . . . . . . . . . 27.0%Dividend yield . . . . . . . . . . . . . . . . . . . . . . . . . . . . . . . . . . . . . . . . . . . . . . . . . . . . . . . . . . . . . . . —Weighted-average fair value at grant date . . . . . . . . . . . . . . . . . . . . . . . . . . . . . . . . . . . . . . . . . . $7.06
Our computation of expected life was based on historical exercise patterns. The interest rate for periodswithin the expected life of the award was based on the U.S. Treasury yield curve in effect at the time of grant.Our computation of expected volatility was based on a market-based implied volatility. At the time of the 2011grant, it was not our policy to declare or pay cash dividends on our common stock.
Summary of Stock Option Activity
A summary of stock option activity for the years ended December 31, 2013, 2012 and 2011 is as follows:
Stock Options Outstanding
Number of StockOptions
Weighted-Average
Exercise Price
Outstanding at December 31, 2010 . . . . . . . . . . . . . . . . . . . . . . . . . . . . . . . . . . . . . 10,112,842 $16.92Granted(1) . . . . . . . . . . . . . . . . . . . . . . . . . . . . . . . . . . . . . . . . . . . . . . . . . . . . . . . . . 1,267,430 25.28Exercised . . . . . . . . . . . . . . . . . . . . . . . . . . . . . . . . . . . . . . . . . . . . . . . . . . . . . . . . . (1,030,721) 9.68Forfeited or expired . . . . . . . . . . . . . . . . . . . . . . . . . . . . . . . . . . . . . . . . . . . . . . . . . (425,516) 26.85
Outstanding at December 31, 2011 . . . . . . . . . . . . . . . . . . . . . . . . . . . . . . . . . . . . . 9,924,035 $18.33Exercised . . . . . . . . . . . . . . . . . . . . . . . . . . . . . . . . . . . . . . . . . . . . . . . . . . . . . . . . . (2,051,066) 7.37Forfeited or expired . . . . . . . . . . . . . . . . . . . . . . . . . . . . . . . . . . . . . . . . . . . . . . . . . (327,192) 23.41
Outstanding at December 31, 2012 . . . . . . . . . . . . . . . . . . . . . . . . . . . . . . . . . . . . . 7,545,777 $21.10Exercised . . . . . . . . . . . . . . . . . . . . . . . . . . . . . . . . . . . . . . . . . . . . . . . . . . . . . . . . . (2,346,220) 12.05Forfeited or expired . . . . . . . . . . . . . . . . . . . . . . . . . . . . . . . . . . . . . . . . . . . . . . . . . (273,035) 24.32
Outstanding at December 31, 2013 . . . . . . . . . . . . . . . . . . . . . . . . . . . . . . . . . . . . . 4,926,522 $25.21
(1) Stock options granted in 2011 primarily reflect our company-wide equity grants issued in March 2011,which include a performance-based accelerated vesting feature based on achievement of specific levels ofcorporate performance, as described above.
We received net cash proceeds of $28 million from the exercise of approximately 2,346,220 stock optionsfor the year ended December 31, 2013, received net cash proceeds of $15 million from the exercise ofapproximately 2,051,066 stock options for the year ended December 31, 2012 and received net cash proceeds of$10 million from the exercise of approximately 1,030,721 stock options for the year ended December 31, 2011.We present excess tax benefits from the exercise of stock options, if any, as financing activities in theConsolidated Statements of Cash Flows.
F-52

The NASDAQ OMX Group, Inc.
Notes to Consolidated Financial Statements—(Continued)
The following table summarizes significant ranges of outstanding and exercisable stock options as ofDecember 31, 2013:
Outstanding Exercisable
Range of Exercise Prices
Number ofStock
Options
Weighted-Average
RemainingContractual
Term(in years)
Weighted-Average
Exercise Price
AggregateIntrinsic
Value(in millions)
NumberExercisable
Weighted-Average
RemainingContractual
Term(in years)
Weighted-AverageExercise
Price
AggregateIntrinsic
Value(in millions)
$6.29-$19.74 . . . . . . . . . . 304,168 1.03 $ 7.84 $10 301,932 0.99 $ 7.76 $10$19.75-$25.01 . . . . . . . . . 2,010,519 5.82 20.61 39 1,159,676 5.58 21.03 22$25.02-$35.91 . . . . . . . . . 1,367,775 6.37 25.29 20 448,133 4.78 25.30 6$35.92-$45.59 . . . . . . . . . 1,244,060 3.01 36.81 4 1,244,060 3.01 36.81 4
Total . . . . . . . . . . . . 4,926,522 4.97 $25.21 $73 3,153,801 4.01 $26.59 $42
The aggregate intrinsic value in the above table represents the total pre-tax intrinsic value (i.e., thedifference between our closing stock price on December 31, 2013 of $39.80 and the exercise price, times thenumber of shares) based on stock options with an exercise price less than NASDAQ OMX’s closing price of$39.80 as of December 31, 2013, which would have been received by the option holders had the option holdersexercised their stock options on that date. This amount can change based on the fair market value of our commonstock. The total number of in-the-money stock options exercisable as of December 31, 2013 was 3.0 million. Asof December 31, 2012, 5.3 million outstanding stock options were exercisable and the weighted-average exerciseprice was $20.52.
Total fair value of stock options vested was immaterial for the year ended December 31, 2013 and $11million for the year ended December 31, 2012. The total pre-tax intrinsic value of stock options exercised was$48 million during 2013, $35 million during 2012 and $15 million during 2011.
At December 31, 2013, $1 million of total unrecognized compensation cost related to stock options isexpected to be recognized over a weighted-average period of 1 year.
F-53

The NASDAQ OMX Group, Inc.
Notes to Consolidated Financial Statements—(Continued)
Summary of Restricted Stock and PSU Activity
The following table summarizes our restricted stock and PSU activity for the years ended December 31,2013, 2012 and 2011:
Restricted Stock PSUs
Number ofAwards
Weighted-Average
Grant DateFair Value
Number ofAwards
Weighted-Average
Grant DateFair Value
Unvested balances at December 31, 2010 . . . . . . . . . . . . . . . . 2,759,091 $ 22.00 1,098,629 $ 24.25Granted . . . . . . . . . . . . . . . . . . . . . . . . . . . . . . . . . . . . . . . . . . . 1,393,373(1) 25.31 651,510(2) 25.14Vested . . . . . . . . . . . . . . . . . . . . . . . . . . . . . . . . . . . . . . . . . . . (353,235) 24.26 (279,447) 28.70Forfeited . . . . . . . . . . . . . . . . . . . . . . . . . . . . . . . . . . . . . . . . . . (427,896) 22.28 (155,512) 27.94
Unvested balances at December 31, 2011 . . . . . . . . . . . . . . . . 3,371,333 $ 23.10 1,315,180 $ 23.33Granted . . . . . . . . . . . . . . . . . . . . . . . . . . . . . . . . . . . . . . . . . . . 1,478,855(1) 23.62 1,363,670(2) 23.28Vested . . . . . . . . . . . . . . . . . . . . . . . . . . . . . . . . . . . . . . . . . . . (1,295,030) 23.39 (702,486) 23.74Forfeited . . . . . . . . . . . . . . . . . . . . . . . . . . . . . . . . . . . . . . . . . . (350,970) 23.29 (96,565) 23.30
Unvested balances at December 31, 2012 . . . . . . . . . . . . . . . . 3,204,188 $ 23.20 1,879,799 $ 23.14Granted . . . . . . . . . . . . . . . . . . . . . . . . . . . . . . . . . . . . . . . . . . . 1,182,870(1) 32.69 828,180(2) 39.68Vested . . . . . . . . . . . . . . . . . . . . . . . . . . . . . . . . . . . . . . . . . . . (266,724) 23.77 (512,890) 22.68Forfeited . . . . . . . . . . . . . . . . . . . . . . . . . . . . . . . . . . . . . . . . . . (293,864) 24.40 (279,488) 25.77
Unvested balances at December 31, 2013 . . . . . . . . . . . . . . . . 3,826,470 $ 25.96 1,915,601 $ 30.03
(1) Restricted stock granted in 2013, 2012 and 2011 primarily reflect our company wide grants, which include aperformance-based accelerated vesting feature based on achievement of specific levels of corporateperformance, as described above.
(2) PSUs granted in 2013, 2012 and 2011 primarily reflect awards issued to certain officers, as described above.
At December 31, 2013, $80 million of total unrecognized compensation cost related to restricted stock andPSUs is expected to be recognized over a weighted-average period of 1.7 years.
13. NASDAQ OMX Stockholders’ Equity
Common Stock
At December 31, 2013, 300,000,000 shares of our common stock were authorized, 214,419,155 shares wereissued and 169,357,084 shares were outstanding. The holders of common stock are entitled to one vote per share,except that our certificate of incorporation limits the ability of any person to vote in excess of 5.0% of the then-outstanding shares of NASDAQ OMX common stock. This limitation does not apply to persons exempted fromthis limitation by our board of directors prior to the time such person owns more than 5.0% of the then-outstanding shares of NASDAQ OMX common stock.
Common Stock in Treasury, at Cost
We held 45,062,071 shares of common stock in treasury as of December 31, 2013 and 47,821,070 shares asof December 31, 2012. The decrease during the year ended December 31, 2013 was primarily due to shares ofcommon stock in treasury reissued under our share-based compensation program, partially offset by our sharerepurchase program. See “Share Repurchase Program” below for further discussion of our share repurchaseprograms and Note 12, “Share-Based Compensation,” for further discussion of our share-based compensationprogram.
F-54

The NASDAQ OMX Group, Inc.
Notes to Consolidated Financial Statements—(Continued)
Share Repurchase Program
In the third quarter of 2012, our board of directors authorized the repurchase of up to $300 million of ouroutstanding common stock, of which $225 million was available as of December 31, 2012. These purchases maybe made from time to time at prevailing market prices in open market purchases, privately-negotiatedtransactions, block purchase techniques or otherwise, as determined by our management. The purchases arefunded from existing cash balances. The share repurchase program may be suspended, modified or discontinuedat any time. In April 2013, we announced that the share repurchase program is temporarily suspended.
During 2013, we repurchased 321,000 shares of our common stock at an average price of $31.12, for anaggregate purchase price of $10 million. The shares repurchased under the share repurchase program areavailable for general corporate purposes. As of December 31, 2013, the remaining amount authorized for sharerepurchases under the program was $215 million.
Other Repurchases of Common Stock
For the year ended December 31, 2013, we repurchased 318,058 shares of our common stock in settlementof employee tax withholding obligations due upon the vesting of restricted stock.
Preferred Stock
Our certificate of incorporation authorizes the issuance of 30,000,000 shares of preferred stock, par value$0.01 per share, issuable from time to time in one or more series. At December 31, 2013 and 2012, 1,600,000shares of series A convertible preferred stock were issued and none were outstanding.
Cash Dividends on Common Stock
During 2013, our board of directors declared the following cash dividends:
Declaration Date
DividendPer Common
Share Record Date Total Amount(1) Payment Date
(in millions)
January 31, 2013 . . . . . . . . . . . . . . . . . $0.13 March 14, 2013 $21 March 28, 2013April 24, 2013 . . . . . . . . . . . . . . . . . . . $0.13 June 14, 2013 $22 June 28, 2013July 24, 2013 . . . . . . . . . . . . . . . . . . . . $0.13 September 13, 2013 $22 September 27, 2013October 21, 2013 . . . . . . . . . . . . . . . . . $0.13 December 13, 2013 $22 December 27, 2013
(1) These amounts were recorded in retained earnings in the Consolidated Balance Sheets at December 31,2013.
In January 2014, pursuant to delegated authority, the board of directors declared a regular quarterly cashdividend of $0.13 per share on our outstanding common stock. The dividend is payable on March 28, 2014 toshareholders of record at the close of business on March 14, 2014. Future declarations of quarterly dividends andthe establishment of future record and payment dates are subject to approval by the board of directors.
F-55

The NASDAQ OMX Group, Inc.
Notes to Consolidated Financial Statements—(Continued)
Accumulated Other Comprehensive Loss
The following table outlines the components of accumulated other comprehensive loss:
UnrealizedHoldingGains on
Available-For-SaleInvestmentSecurities
ForeignCurrency
TranslationAdjustments(1)
EmployeeBenefit Plan
Adjustments(2)
AccumulatedOther
ComprehensiveLoss
(in millions)Gross balance, December 31, 2012 . . . . . . . . . . . $ 4 $ (265) $ (43) $ (304)Income taxes . . . . . . . . . . . . . . . . . . . . . . . . . . . . . 1 100 18 119
Net balance, December 31, 2012 . . . . . . . . . . . . . $ 5 $ (165) $ (25) $ (185)
Gross balance, December 31, 2013 . . . . . . . . . . . $ — $ (282) $ (22) $ (304)Income taxes . . . . . . . . . . . . . . . . . . . . . . . . . . . . . 1 227 9 237
Net balance, December 31, 2013 . . . . . . . . . . . . . $ 1 $ (55) $ (13) $ (67)
(1) Amounts include cumulative gains and losses on foreign currency translation adjustments from non-U.S.subsidiaries for which the functional currency is other than the U.S. dollar.
(2) Amounts primarily represent unrecognized net actuarial gains (losses) related to the NASDAQ OMXBenefit Plans.
14. Earnings Per Share
The following table sets forth the computation of basic and diluted earnings per share:
Year Ended December 31,
2013 2012 2011
(in millions, except share and per share amounts)Numerator:Net income attributable to common shareholders . . . . . . . . . . . . . $ 385 $ 352 $ 387
Denominator:Weighted-average common shares outstanding for basic
earnings per share(1) . . . . . . . . . . . . . . . . . . . . . . . . . . . . . . . . . . 166,932,103 168,254,653 176,331,819
Weighted-average effect of dilutive securities:Employee equity awards . . . . . . . . . . . . . . . . . . . . . . . . . . . . 3,969,766 4,317,577 3,644,946Issuance of common stock related to the acquisition of
eSpeed(2) . . . . . . . . . . . . . . . . . . . . . . . . . . . . . . . . . . . . . . 364,277 — —3.75% convertible notes(3) . . . . . . . . . . . . . . . . . . . . . . . . . . . — 15,640 34,482
Weighted-average common shares outstanding for dilutedearnings per share . . . . . . . . . . . . . . . . . . . . . . . . . . . . . . . . . . . 171,266,146 172,587,870 180,011,247
Basic and diluted earnings per share:Basic earnings per share . . . . . . . . . . . . . . . . . . . . . . . . . . . . . . . . $ 2.30 $ 2.09 $ 2.20
Diluted earnings per share . . . . . . . . . . . . . . . . . . . . . . . . . . . . . . . $ 2.25 $ 2.04 $ 2.15
(1) The decrease in the weighted-average common shares outstanding for basic and diluted earnings per shareprimarily reflects the weighted-average impact of purchases related to our share repurchase programs madein 2013, 2012 and 2011. See “Share Repurchase Program,” of Note 13, “NASDAQ OMX Stockholders’Equity,” for further discussion.
F-56

The NASDAQ OMX Group, Inc.
Notes to Consolidated Financial Statements—(Continued)
(2) See “Acquisition of eSpeed for Trading of U.S. Treasuries,” of Note 4, “Acquisition and Divestiture,” forfurther discussion.
(3) In June 2012, the remaining $0.5 million of our 3.75% convertible notes outstanding was converted into34,482 shares of common stock in accordance with the terms of the notes.
Stock options to purchase 4,926,522 shares of common stock and 5,742,071 shares of restricted stock andPSUs were outstanding at December 31, 2013. For the year ended December 31, 2013, we included 3,677,618 ofthe outstanding stock options and 5,238,843 shares of restricted stock and PSUs in the computation of dilutedearnings per share, on a weighted-average basis, as their inclusion was dilutive. The remaining stock options andshares of restricted stock and PSUs are antidilutive, and as such, they were properly excluded.
Stock options to purchase 7,545,777 shares of common stock and 5,083,987 shares of restricted stock andPSUs were outstanding at December 31, 2012. For the year ended December 31, 2012, we included 4,313,316 ofthe outstanding stock options and 4,142,097 shares of restricted stock and PSUs in the computation of dilutedearnings per share, on a weighted-average basis, as their inclusion was dilutive. The remaining stock options andshares of restricted stock and PSUs are antidilutive, and as such, they were properly excluded.
Stock options to purchase 9,924,035 shares of common stock, 4,686,513 shares of restricted stock andPSUs, and convertible notes convertible into 34,482 shares of common stock were outstanding at December 31,2011. For the year ended December 31, 2011, we included 6,506,899 of the outstanding stock options and4,053,698 shares of restricted stock and PSUs in the computation of diluted earnings per share, on a weighted-average basis, as their inclusion was dilutive. The remaining stock options and shares of restricted stock andPSUs are antidilutive, and as such, they were properly excluded.
15. Fair Value of Financial Instruments
Fair Value Measurement—Definition and Hierarchy
Fair value is defined as the price that would be received to sell an asset or paid to transfer a liability, or theexit price, in an orderly transaction between market participants at the measurement date. Fair valuemeasurement establishes a hierarchy of valuation techniques based on whether the inputs to those valuationtechniques are observable or unobservable. Observable inputs reflect market data obtained from independentsources, while unobservable inputs reflect NASDAQ OMX’s market assumptions. These two types of inputscreate the following fair value hierarchy:
• Level 1—Quoted prices for identical instruments in active markets.
• Level 2—Quoted prices for similar instruments in active markets; quoted prices for identical or similarinstruments in markets that are not active; and model-derived valuations whose inputs are observable orwhose significant value drivers are observable.
• Level 3—Instruments whose significant value drivers are unobservable.
This hierarchy requires the use of observable market data when available.
F-57

The NASDAQ OMX Group, Inc.
Notes to Consolidated Financial Statements—(Continued)
There were no transfers of assets between Level 1 and Level 2 of the fair value hierarchy as ofDecember 31, 2013 and 2012. The following table presents for each of the above hierarchy levels, our financialassets that are measured at fair value on a recurring basis as of December 31, 2013 and 2012. We did not haveany financial liabilities measured at fair value on a recurring basis as of December 31, 2013 and 2012.
December 31, 2013
Total Level 1 Level 2 Level 3
(in millions)
Financial Assets Measured at Fair Value on a Recurring BasisFinancial investments, at fair value(1) . . . . . . . . . . . . . . . . . . . . . . . . . . $ 162 $ 162 $ — $ —Default fund and margin deposit investments(2) . . . . . . . . . . . . . . . . . . 1,867 774 1,093 —
Total . . . . . . . . . . . . . . . . . . . . . . . . . . . . . . . . . . . . . . . . . . . . . . . $ 2,029 $ 936 $ 1,093 $ —
December 31, 2012
Total Level 1 Level 2 Level 3
(in millions)
Financial Assets Measured at Fair Value on a Recurring BasisFinancial investments, at fair value(1) . . . . . . . . . . . . . . . . . . . . . . . . . . . $ 223 $ 223 $ — $ —Default fund and margin deposit investments(2) . . . . . . . . . . . . . . . . . . . 175 175 — —
Total . . . . . . . . . . . . . . . . . . . . . . . . . . . . . . . . . . . . . . . . . . . . . . . . . . . . $ 398 $ 398 $ — $ —
(1) As of December 31, 2013, balance is comprised of trading securities, mainly Swedish government debtsecurities, of $162 million. As of December 31, 2012, balance is primarily comprised of trading securities,mainly Swedish government debt securities, of $201 million. Of these securities, $140 million as ofDecember 31, 2013 and $134 million as of December 31, 2012 are assets utilized to meet regulatory capitalrequirements primarily for clearing operations at NASDAQ OMX Nordic Clearing. As of December 31,2012, this balance also included our available-for-sale investment security in DFM which had a fair value of$22 million. In the fourth quarter of 2013 we sold this investment security. See Note 6, “Investments,” forfurther discussion of our trading investment securities and available-for-sale investment security.
(2) Default fund and margin deposit investments include cash contributions invested by NASDAQ OMXNordic Clearing, in accordance with its investment policy, either in highly rated government debt securitiesor reverse repurchase agreements with highly rated government debt securities as collateral. Of the totalbalance of $1,961 million recorded in the Consolidated Balance Sheets as of December 31, 2013,$1,093 million of cash contributions have been invested in reverse repurchase agreements and $774 millionof cash contributions have been invested in highly rated government debt securities and term deposits. Theremainder of this balance is held in cash. As of December 31, 2012, $175 million of cash contributions wereinvested in highly rated government debt securities. See Note 16, “Clearing Operations,” for furtherdiscussion of default fund contributions and margin deposits.
Financial Instruments Not Measured at Fair Value on a Recurring Basis
Some of our financial instruments are not measured at fair value on a recurring basis but are recorded atamounts that approximate fair value due to their liquid or short-term nature. Such financial assets and financialliabilities include: cash and cash equivalents, restricted cash, receivables, net, certain other current assets, non-current restricted cash, accounts payable and accrued expenses, Section 31 fees payable to SEC, accruedpersonnel costs, and certain other current liabilities.
In addition, our investment in LCH is carried at cost. See “Cost Method Investments,” of Note 6,“Investments,” for further discussion.
F-58

The NASDAQ OMX Group, Inc.
Notes to Consolidated Financial Statements—(Continued)
We also consider our debt obligations to be financial instruments. The fair value of our debt, utilizingdiscounted cash flow analyses for our floating rate debt and prevailing market rates for our fixed rate debt, was$2.8 billion at December 31, 2013 and $2.1 billion at December 31, 2012. The discounted cash flow analyses arebased on borrowing rates currently available to us for debt with similar terms and maturities. Our fixed rate andour floating rate debt is categorized as Level 2 in the fair value hierarchy. For further discussion of our debtobligations, see Note 9, “Debt Obligations.”
16. Clearing Operations
Nordic Clearing
NASDAQ OMX Nordic Clearing is authorized and supervised as a European multi-asset clearinghouse bythe SFSA and is authorized to conduct clearing operations in Norway by the Norwegian Ministry of Finance. Theclearinghouse acts as the CCP for exchange and OTC trades in equity derivatives, fixed income derivatives,physical power, power derivatives, carbon derivatives, and resale and repurchase contracts.
Through our clearing operations in the financial markets, which include the resale and repurchase market,and the commodities markets, NASDAQ OMX Nordic Clearing is the legal counterparty for, and guarantees thefulfillment of, each contract cleared. These contracts are not used by NASDAQ OMX Nordic Clearing for thepurpose of trading on its own behalf. As the legal counterparty of each transaction, NASDAQ OMX NordicClearing bears the counterparty risk between the purchaser and seller in the contract. In its guarantor role,NASDAQ OMX Nordic Clearing has precisely equal and offsetting claims to and from clearing members onopposite sides of each contract, standing as an intermediary on every contract cleared. In accordance with therules and regulations of NASDAQ OMX Nordic Clearing, clearing members’ open positions are aggregated tocreate a single portfolio for which default fund and margin collateral requirements are calculated. See “DefaultFund Contributions and Margin Deposits” below for further discussion of NASDAQ OMX Nordic Clearing’sdefault fund and margin requirements.
NASDAQ OMX Nordic Clearing maintains three member sponsored default funds: one related to financialmarkets, one related to commodities markets, and a mutualized fund. Under this structure, NASDAQ OMXNordic Clearing and its clearing members must contribute to the total regulatory capital related to the clearingoperations of NASDAQ OMX Nordic Clearing. This structure applies an initial separation of default fundcontributions for the financial and commodities markets in order to create a buffer for each market’s counterpartyrisks. Simultaneously, a mutualized default fund provides capital efficiencies to NASDAQ OMX NordicClearing with regard to total regulatory capital required. See “Default Fund Contributions” below for furtherdiscussion of NASDAQ OMX Nordic Clearing’s default fund. Power of assessment and a liability waterfall alsohave been implemented. See “Power of Assessment” and “Liability Waterfall” below for further discussion.These requirements ensure the alignment of risk between NASDAQ OMX Nordic Clearing and its clearingmembers.
Default Fund Contributions and Margin Deposits
As of December 31, 2013, clearing member default fund contributions and margin deposits were as follows:
December 31, 2013
CashContributions(1)(2)
Non-CashContributions
TotalContributions
(in millions)
Default fund contributions . . . . . . . . . . . . . . . . . . . . . . . . . . . . . . . . $ 246 $ 112 $ 358Margin deposits . . . . . . . . . . . . . . . . . . . . . . . . . . . . . . . . . . . . . . . . . 1,715 8,998 10,713
Total . . . . . . . . . . . . . . . . . . . . . . . . . . . . . . . . . . . . . . . . . . . . . . . . . $ 1,961 $ 9,110 $ 11,071
F-59

The NASDAQ OMX Group, Inc.
Notes to Consolidated Financial Statements—(Continued)
(1) As of December 31, 2013, in accordance with its investment policy, NASDAQ OMX Nordic Clearing hasinvested cash contributions of $1,093 million in reverse repurchase agreements and $774 million in highlyrated government debt securities. The remainder of this balance is held in cash and term deposits.
(2) Pursuant to clearing member agreements, we pay interest on cash contributions to clearing members.
Default Fund Contributions
Contributions made to the default funds are proportional to the exposures of each clearing member. When aclearing member is active in both the financial and commodities markets, contributions must be made to bothmarkets’ default funds. Clearing members’ eligible contributions may include cash and non-cash contributions.Cash contributions received are invested by NASDAQ OMX Nordic Clearing, in accordance with its investmentpolicy, either in highly rated government debt securities or reverse repurchase agreements with highly ratedgovernment debt securities as collateral. Clearing members’ cash contributions are included in default funds andmargin deposits in the Consolidated Balance Sheets as both a current asset and a current liability. Non-cashcontributions include highly rated government debt securities that must meet specific criteria approved byNASDAQ OMX Nordic Clearing. Non-cash contributions are pledged assets that are not recorded in theConsolidated Balance Sheets as NASDAQ OMX Nordic Clearing does not take legal ownership of these assetsand the risks and rewards remain with the clearing members. These balances may fluctuate over time due tochanges in the amount of deposits required and whether members choose to provide cash or non-cashcontributions. Assets pledged are held at a nominee account in NASDAQ OMX Nordic Clearing’s name for thebenefit of the clearing members and are immediately accessible by NASDAQ OMX Nordic Clearing in the eventof a default. In addition to clearing members’ required contributions to the default funds, NASDAQ OMXNordic Clearing is also required to contribute capital to the default funds and overall regulatory capital asspecified under its clearinghouse rules. As of December 31, 2013, NASDAQ OMX Nordic Clearing committedcapital totaling $94 million to the member sponsored default funds and overall regulatory capital, in the form ofgovernment debt securities, which are recorded as financial investments, at fair value in the ConsolidatedBalance Sheets. The combined regulatory capital of the clearing members and NASDAQ OMX Nordic Clearingwill serve to secure the obligations of a clearing member and may be used to cover losses sustained by a clearingmember in the event of a default.
Other Capital Contributions by NASDAQ OMX Nordic Clearing
NASDAQ OMX Nordic Clearing maintains a $93 million credit facility which may be utilized in certainsituations to satisfy regulatory requirements, none of which was utilized as of December 31, 2013.
Margin Deposits
NASDAQ OMX Nordic Clearing requires all clearing members to provide collateral, which may consist ofcash and non-cash contributions, to guarantee performance on the clearing members’ open positions, or initialmargin. In addition, clearing members must also provide collateral to cover the daily margin call as needed,which is in addition to the initial margin. See “Default Fund Contributions” above for further discussion of cashand non-cash contributions.
In April 2013, NASDAQ OMX Nordic Clearing implemented a new collateral management process. Withthe implementation of this new process, NASDAQ OMX Nordic Clearing now maintains and manages all cashdeposits related to margin collateral. Since all risks and rewards of collateral ownership, including interest,belong to NASDAQ OMX Nordic Clearing, these cash deposits are recorded in default funds and margindeposits in the Consolidated Balance Sheets as both a current asset and current liability. Prior to theimplementation of the new collateral management process, all collateral was maintained at a third-party
F-60

The NASDAQ OMX Group, Inc.
Notes to Consolidated Financial Statements—(Continued)
custodian bank for the benefit of the clearing members and was immediately accessible by NASDAQ OMXNordic Clearing in the event of a default. The pledged margin collateral was not recorded in our ConsolidatedBalance Sheets as all risks and rewards of collateral ownership, including interest, belonged to the counterparty.Assets pledged are held at a nominee account in NASDAQ OMX Nordic Clearing’s name for the benefit of theclearing members and are immediately accessible by NASDAQ OMX Nordic Clearing in the event of a default.
NASDAQ OMX Nordic Clearing marks to market all outstanding contracts at least daily, requiring paymentfrom clearing members whose positions have lost value and making payments to clearing members whosepositions have gained value. The mark-to-market process helps identify any clearing members that may not beable to satisfy their financial obligations in a timely manner allowing NASDAQ OMX Nordic Clearing theability to mitigate the risk of a clearing member defaulting due to exceptionally large losses. In the event of adefault, NASDAQ OMX Nordic Clearing can access the defaulting member’s margin deposits to cover thedefaulting member’s losses.
Regulatory Capital and Risk Management Calculations
NASDAQ OMX Nordic Clearing manages risk through a comprehensive counterparty risk managementframework, which is comprised of policies, procedures, standards and resources. The level of regulatory capitalis determined in accordance with NASDAQ OMX Nordic Clearing’s regulatory capital policy, as approved bythe SFSA. Regulatory capital calculations are continuously updated through a proprietary capital-at-riskcalculation model that establishes the appropriate level of capital.
As mentioned above, NASDAQ OMX Nordic Clearing is the legal counterparty for each contract traded andthereby guarantees the fulfillment of each contract. NASDAQ OMX Nordic Clearing accounts for this guaranteeas a performance guarantee. We determine the fair value of the performance guarantee by considering dailysettlement of contracts and other margining and default fund requirements, the risk management program,historical evidence of default payments, and the estimated probability of potential default payouts. Thecalculation is determined using proprietary risk management software that simulates gains and losses based onhistorical market prices, extreme but plausible market scenarios, volatility and other factors present at that pointin time for those particular unsettled contracts. Based on this analysis, the estimated liability was nominal and noliability was recorded as of December 31, 2013.
The market value of derivative contracts outstanding prior to netting was as follows:
December 31, 2013
(in millions)
Commodity forwards and options(1)(2) . . . . . . . . . . . . . . . . . . . . . . . . . . . . . . . . . . . . . $ 1,795Fixed-income options and futures(2)(3) . . . . . . . . . . . . . . . . . . . . . . . . . . . . . . . . . . . . . 311Stock options and futures(2)(3) . . . . . . . . . . . . . . . . . . . . . . . . . . . . . . . . . . . . . . . . . . . 307Index options and futures(2)(3) . . . . . . . . . . . . . . . . . . . . . . . . . . . . . . . . . . . . . . . . . . . 237
Total . . . . . . . . . . . . . . . . . . . . . . . . . . . . . . . . . . . . . . . . . . . . . . . . . . . . . . . . . . . . . . . $ 2,650
(1) We determined the fair value of our forward contracts using standard valuation models that were based onmarket-based observable inputs including LIBOR rates and the spot price of the underlying instrument.
(2) We determined the fair value of our option contracts using standard valuation models that were based onmarket-based observable inputs including implied volatility, interest rates and the spot price of theunderlying instrument.
(3) We determined the fair value of our futures contracts based upon quoted market prices and average quotedmarket yields.
F-61

The NASDAQ OMX Group, Inc.
Notes to Consolidated Financial Statements—(Continued)
The total number of derivative contracts cleared through NASDAQ OMX Nordic Clearing for the yearsended December 31, 2013 and 2012 was as follows:
December 31, 2013 December 31, 2012
Commodity forwards and options(1) . . . . . . . . . . . . . . . . . . . . . . . . . . . . . . . . 675,442 879,737Fixed-income options and futures . . . . . . . . . . . . . . . . . . . . . . . . . . . . . . . . . . 22,834,003 32,915,646Stock options and futures . . . . . . . . . . . . . . . . . . . . . . . . . . . . . . . . . . . . . . . . 23,583,178 29,480,517Index options and futures . . . . . . . . . . . . . . . . . . . . . . . . . . . . . . . . . . . . . . . . 29,960,888 42,262,577
Total . . . . . . . . . . . . . . . . . . . . . . . . . . . . . . . . . . . . . . . . . . . . . . . . . . . . . . . . . 77,053,511 105,538,477
(1) The total volume in cleared power related to commodity contracts was 1,680 Terawatt hours (TWh) for theyear ended December 31, 2013 and 1,703 TWh for the year ended December 31, 2012.
The outstanding contract value of resale and repurchase agreements was $4.1 billion as of December 31,2013. The total number of contracts cleared was 4,634,564 for the year ended December 31, 2013 and was3,601,969 for the year ended December 31, 2012.
Power of Assessment
To further strengthen the contingent financial resources of the clearinghouse, NASDAQ OMX NordicClearing has power of assessment that provides the ability to collect additional funds from its clearing membersto cover a defaulting member’s remaining obligations up to the limits established under the terms of theclearinghouse rules. The power of assessment corresponds to 100% of the clearing member’s aggregatecontribution to the financial market’s and commodities market’s default funds.
Liability Waterfall
The liability waterfall is the priority order in which the capital resources would be utilized in the event of adefault where the defaulting clearing member’s collateral would not be sufficient to cover the cost to settle itsportfolio. If a default occurs and the defaulting clearing member’s collateral, including cash deposits and pledgedassets, is depleted, then capital is utilized in the following amount and order:
• junior capital contributed by NASDAQ OMX Nordic Clearing, which totaled $22 million atDecember 31, 2013;
• a loss sharing pool related only to the financial market that is contributed to by clearing members andonly applies if the defaulting member’s portfolio includes interest rate swap products;
• specific market default fund where the loss occurred, either financial or commodities market, whichincludes capital contributions of both the clearing members and NASDAQ OMX Nordic Clearing on apro-rata basis;
• senior capital contributed by NASDAQ OMX Nordic Clearing, calculated in accordance withclearinghouse rules to be $23 million at December 31, 2013; and
• mutualized default fund, which includes capital contributions of both the clearing members andNASDAQ OMX Nordic Clearing on a pro-rata basis.
If additional funds are needed after utilization of the mutualized default fund, then NASDAQ OMX NordicClearing will utilize its power of assessment and additional capital contributions will be required by non-defaulting members up to the limits established under the terms of the clearinghouse rules.
F-62

The NASDAQ OMX Group, Inc.
Notes to Consolidated Financial Statements—(Continued)
NOS Clearing
NOS Clearing is a leading Norway-based clearinghouse primarily for OTC traded derivatives for the freightmarket and seafood derivative market. NOS Clearing acts as a CCP with a clearinghouse license from theNorwegian Ministry of Finance and is under supervision of the Financial Supervisory Authority of Norway.
Through its clearing operations, NOS Clearing is the legal counterparty for, and guarantees the fulfillmentof, each contract cleared. These contracts are not used by NOS Clearing for the purpose of trading on its ownbehalf. As the legal counterparty of each transaction, NOS Clearing bears the counterparty risk between thepurchaser and seller in the contract. In its guarantor role, NOS Clearing has precisely equal and offsetting claimsto and from clearing members on opposite sides of each contract, standing as an intermediary on every contractcleared. In accordance with the rules and regulations of NOS Clearing, clearing members’ open positions areaggregated to create a single portfolio for which margin collateral requirements are calculated. The market valueof derivative contracts outstanding, prior to netting, was $53 million as of December 31, 2013. The total numberof derivative contracts cleared through NOS Clearing was 2,101,634 for the year ended December 31, 2013 and1,778,414 for the year ended December 31, 2012.
NOS Clearing has implemented member sponsored default funds for its markets. Under this structure, NOSClearing and its clearing members must contribute to the total regulatory capital related to the clearing operationsof NOS Clearing. A liability waterfall has also been implemented, which helps to ensure the alignment of riskbetween NOS Clearing and its clearing members in the event of default.
As of December 31, 2013, NOS Clearing committed capital to the default funds in the form of cash totaling$42 million. This committed capital is reflected as restricted cash in the Consolidated Balance Sheets. Clearingmembers’ pledged default fund contributions and margin collateral totaled $534 million as of December 31, 2013and is not recorded in our Consolidated Balance Sheets as all risks and rewards of collateral ownership, includinginterest, belong to the counterparty.
U.S. Clearing
In the third quarter of 2013, NOCC entered into a strategic alliance with NGX. Together NGX and NOCCprovide a solution for transacting in physical energy in the U.S. NGX offers trading and clearing services for thealliance and NOCC contributes account management, product development, and scheduling resources. SinceNGX is now the counterparty to all transactions and clearing arrangements, NOCC transferred all positions toNGX, returned collateral to customers, terminated its letters of credit from banks, and cancelled all contracts withcustomers.
Prior to the alliance with NGX, NOCC, through riskless principal trading and clearing, was the legalcounterparty for each customer position traded and NOCC thereby guaranteed the fulfillment of each of itscustomer’s transactions.
Market participants at NOCC were required to meet certain minimum financial standards to mitigate the riskthat they became unable to satisfy their obligations and provided collateral to cover the daily margin call asneeded. Customer pledged cash collateral held by NOCC, which was $33 million at December 31, 2012, wasincluded in default funds and margin deposits as both a current asset and current liability in the ConsolidatedBalance Sheets, as the risks and rewards of collateral ownership, including interest income, belonged to NOCC.
17. Leases
We lease office space and equipment under non-cancelable operating leases with third parties. Some of our leasescontain renewal options and escalation clauses based on increases in property taxes and building operating costs.
F-63

The NASDAQ OMX Group, Inc.
Notes to Consolidated Financial Statements—(Continued)
As of December 31, 2013, future minimum lease payments under non-cancelable operating leases (net ofsublease income) are as follows:
Gross LeaseCommitments
SubleaseIncome
Net LeaseCommitments
(in millions)Year ending December 31:
2014 . . . . . . . . . . . . . . . . . . . . . . . . . . . . . . . . . . . . . . . . . . . . . . . . . . . $ 83 $ 5 $ 782015 . . . . . . . . . . . . . . . . . . . . . . . . . . . . . . . . . . . . . . . . . . . . . . . . . . . 81 3 782016 . . . . . . . . . . . . . . . . . . . . . . . . . . . . . . . . . . . . . . . . . . . . . . . . . . . 74 3 712017 . . . . . . . . . . . . . . . . . . . . . . . . . . . . . . . . . . . . . . . . . . . . . . . . . . . 46 2 442018 . . . . . . . . . . . . . . . . . . . . . . . . . . . . . . . . . . . . . . . . . . . . . . . . . . . 42 2 40Thereafter . . . . . . . . . . . . . . . . . . . . . . . . . . . . . . . . . . . . . . . . . . . . . . . 152 13 139
Total future minimum lease payments . . . . . . . . . . . . . . . . . . . . . . . . . . . . . $ 478 $ 28 $ 450
Rent expense for operating leases (net of sublease income of $3 million in 2013 and $4 million in 2012 and2011) was $84 million in 2013, $83 million in 2012 and $87 million in 2011.
18. Commitments, Contingencies and Guarantees
Guarantees Issued and Credit Facilities Available
In addition to the default fund contributions and margin collateral pledged by clearing members discussed inNote 16, “Clearing Operations,” we have obtained financial guarantees and credit facilities which are guaranteedby us through counter indemnities, to provide further liquidity and default protection related to our clearingbusinesses. Financial guarantees issued to us totaled $20 million at December 31, 2013 and $7 million atDecember 31, 2012. At December 31, 2013, credit facilities, which are available in multiple currencies, primarilySwedish Krona, totaled $312 million ($219 million in available liquidity and $93 million to satisfy regulatoryrequirements), $11 million of which was utilized. At December 31, 2012, these facilities totaled $310 million($217 million in available liquidity and $93 million to satisfy regulatory requirements), none of which wasutilized.
Execution Access has a clearing arrangement with Cantor Fitzgerald. As of December 31, 2013, we havecontributed $19 million of clearing deposits to Cantor Fitzgerald in connection with this clearing arrangement.These deposits are recorded in other current assets in our consolidated balance sheets. Some of the tradingactivity in Execution Access is cleared by Cantor Fitzgerald through FICC and the balance is cleared non-FICC.Execution Access assumes the counterparty risk of clients that do not clear through FICC. Counterparty risk ofclients exists for Execution Access between the trade date and the settlement date of the individual transactions,which is one business day. All of Execution Access’ obligations under the clearing arrangement with CantorFitzgerald are guaranteed by NASDAQ OMX. Some of the non-FICC counterparties are required to postcollateral, provide principal letters, or provide other forms of credit enhancement to Execution Access for thepurpose of mitigating counterparty risk.
We believe that the potential for us to be required to make payments under these arrangements is mitigatedthrough the pledged collateral and our risk management policies. Accordingly, no contingent liability is recordedin the Consolidated Balance Sheets for these arrangements.
Lease Commitments
We lease some of our office space and equipment under non-cancelable operating leases with third partiesand sublease office space to third parties. Some of our lease agreements contain renewal options and escalationclauses based on increases in property taxes and building operating costs.
F-64

The NASDAQ OMX Group, Inc.
Notes to Consolidated Financial Statements—(Continued)
Other Guarantees
We have provided other guarantees of $16 million as of December 31, 2013 and $18 million atDecember 31, 2012. These guarantees are primarily related to obligations for our rental and leasing contracts. Inaddition, for certain Market Technology contracts, we have provided performance guarantees of $2 million as ofDecember 31, 2013 and $5 million as of December 31, 2012 related to the delivery of software technology andsupport services. We have received financial guarantees from various financial institutions to support the aboveguarantees.
We believe that the potential for us to be required to make payments under these arrangements is unlikely.Accordingly, no contingent liability is recorded in the Consolidated Balance Sheets for the above guarantees.
Other Commitments
In connection with our acquisition of BWise, we have agreed to purchase the remaining 28% ownershipinterest in two separate transactions, resulting in 100% ownership by the first half of 2015. As of December 31,2013, the estimated amount of these payments totaled $12 million. See “Acquisition of BWise,” of Note 4,“Acquisitions and Divestiture,” for further discussion.
In connection with the launch of NASDAQ OMX NLX, we have entered into agreements with certainmembers which may require us to make payments if certain financial goals are achieved. Since these paymentsare not currently probable and the amount cannot be quantified as of December 31, 2013, no contingent liabilityis recorded in the Consolidated Balance Sheets for these payments.
Voluntary Accommodation Program
In connection with the initial public offering by Facebook on May 18, 2012, systems issues wereexperienced at the opening of trading of Facebook shares. We announced a one-time program for voluntaryaccommodations to qualifying members of up to $62 million, for which a liability was recorded as this programwas approved by the SEC in March 2013. This program expanded the pool available for qualified losses arisingdirectly from the system issues.
In October 2013, NASDAQ OMX announced the completion of initial review by The Market RegulationDepartment of FINRA of all claims submitted by qualifying members. Thereafter, NASDAQ OMX informedclaimants that FINRA would be conducting additional analysis with regard to one category of claims. Upon thecompletion of this additional analysis, the total value of valid submitted claims was determined to be $44 million.NASDAQ OMX submitted to the SEC a filing that provided a report on the administration of the voluntaryaccommodation program. After the filing became effective, our liability was reduced to $44 million and paymentof valid claims totaling $44 million was made in the fourth quarter of 2013.
Escrow Agreements
In connection with our acquisitions of FTEN, Glide Technologies, and the index business of Mergent, Inc.,including Indxis, we entered into escrow agreements to secure the payments of post-closing adjustments and toensure other closing conditions. At December 31, 2013, these escrow agreements provide for future payments of$12 million and are included in other current liabilities and other non-current liabilities in the ConsolidatedBalance Sheets.
Routing Brokerage Activities
Our broker-dealer subsidiaries, Nasdaq Execution Services and NASDAQ Options Services, provideguarantees to securities clearinghouses and exchanges under their standard membership agreements, which
F-65

The NASDAQ OMX Group, Inc.
Notes to Consolidated Financial Statements—(Continued)
require members to guarantee the performance of other members. If a member becomes unable to satisfy itsobligations to a clearinghouse or exchange, other members would be required to meet its shortfalls. To mitigatethese performance risks, the exchanges and clearinghouses often require members to post collateral, as well asmeet certain minimum financial standards. Nasdaq Execution Services’ and NASDAQ Options Services’maximum potential liability under these arrangements cannot be quantified. However, we believe that thepotential for Nasdaq Execution Services and NASDAQ Options Services to be required to make payments underthese arrangements is unlikely. Accordingly, no contingent liability is recorded in the Consolidated BalanceSheets for these arrangements.
Litigation
As previously disclosed, we became a party to several legal and regulatory proceedings in 2012 and 2013relating to the Facebook IPO that occurred on May 18, 2012. We believe that the legal actions filed againstNASDAQ OMX are without merit and intend to defend them vigorously.
As described in our Annual Report on Form 10-K for the year ended December 31, 2012, we are named as adefendant in a consolidated matter captioned In re Facebook, Inc., IPO Securities and Derivative Litigation,MDL No. 2389 (S.D.N.Y.). On April 30, 2013, lead plaintiffs in the consolidated matter filed a consolidatedamended complaint, naming our Chief Executive Officer and our prior Chief Information Officer as newdefendants in connection with their roles in the Facebook IPO. The amended complaint alleges that each violatedSection 20(a) of the Securities Exchange Act of 1934, or the Act, and Rule 10b-5, promulgated under the Act. Byopinion and order entered December 16, 2013, the District Court for the Southern District of New York grantedin part and denied in part our motion to dismiss the consolidated amended complaint. The court held that thedoctrine of self-regulatory organization immunity bars plaintiffs’ negligence and securities laws claims to theextent they arise from our decisions not to halt trading or cancel trades on the day of the Facebook IPO, but not tothe extent they arise from the design, promotion, and testing of our technology systems in advance of the IPO.The court also held that the economic loss doctrine does not bar plaintiffs’ negligence claims, and that theconsolidated amended complaint pleads plaintiffs’ securities laws claims sufficiently to withstand a motion todismiss. We are appealing the ruling on the motion to dismiss to the Second Circuit Court of Appeals.
In our Quarterly Report on Form 10-Q for the period ended March 31, 2013, we identified a demand forarbitration from a member organization seeking indemnification for alleged losses associated with the FacebookIPO. On June 18, 2013, the District Court for the Southern District of New York granted a preliminary injunctionenjoining the arbitration, and the member organization has appealed the order granting the injunction to theSecond Circuit Court of Appeals.
Also as previously disclosed, the staff of the SEC’s Division of Enforcement conducted an investigationrelating to the systems issues experienced with the Facebook IPO. On May 29, 2013, the Commission acceptedour offer of settlement, resolving this matter. As part of the settlement, our subsidiaries, The NASDAQ StockMarket LLC and NASDAQ Execution Services LLC, agreed to implement several measures aimed at preventingfuture violations of the Act and the rules and regulations promulgated thereunder. We fully implemented andprovided the SEC with a certification of our compliance with these undertakings by December 31, 2013 asagreed. In addition, The NASDAQ Stock Market LLC paid a $10 million penalty to the United States Treasury.
Except as disclosed above and in prior reports filed under the Act, we are not currently a party to anylitigation or proceeding that we believe could have a material adverse effect on our business, consolidatedfinancial condition, or operating results. However, from time to time, we have been threatened with, or named asa defendant in, lawsuits or involved in regulatory proceedings.
F-66

The NASDAQ OMX Group, Inc.
Notes to Consolidated Financial Statements—(Continued)
Tax Audits
We are engaged in ongoing discussions and audits with taxing authorities on various tax matters, theresolutions of which are uncertain. Currently, there are matters that may lead to assessments, some of which maynot be resolved for several years. Based on currently available information, we believe we have adequatelyprovided for any assessments that could result from those proceedings where it is more likely than not that wewill be assessed. We review our positions on these matters as they progress.
19. Business Segments
Since January 1, 2013, we manage, operate and provide our products and services in four businesssegments: Market Services, Listing Services, Information Services and Technology Solutions. All prior periodsegment disclosures have been recast to reflect our change in reportable segments.
Prior to January 1, 2013, we managed, operated and provided our products and services in three businesssegments: Market Services, Issuer Services and Market Technology.
Certain other prior year amounts have been reclassified to conform to the current year presentation.
Our Market Services segment includes our derivative trading and clearing, cash equity trading, fixed incometrading, and access and broker services businesses. We offer trading on multiple exchanges and facilities acrossseveral asset classes, including derivatives, cash equity, debt, commodities, structured products and ETFs. Inaddition, in some of the countries where we operate exchanges, we also provide investment firm, clearing,settlement and central depository services. Our transaction-based platforms provide market participants with theability to access, process, display and integrate orders and quotes for cash equity securities, derivatives and ETFs.The platforms allow the routing and execution of buy and sell orders as well as the reporting of transactions forcash equity securities, derivatives and ETFs, providing fee-based revenues. In addition, eSpeed’s electronicbenchmark U.S. Treasury brokerage and co-location service businesses are part of our Market Services segment.See “Acquisition of eSpeed for Trading of U.S. Treasuries,” of Note 4, “Acquisitions and Divestiture,” forfurther discussion.
Our Listing Services segment includes our U.S. and European Listing Services businesses. We operate avariety of listing platforms around the world to provide multiple global capital raising solutions for private andpublic companies. Our main listing markets are The NASDAQ Stock Market and the exchanges that compriseNASDAQ OMX Nordic and NASDAQ OMX Baltic. We offer a consolidated global listing application tocompanies to enable them to apply for listing on The NASDAQ Stock Market and the exchanges that compriseNASDAQ OMX Nordic and NASDAQ OMX Baltic, as well as NASDAQ Dubai.
Our Information Services segment includes our Market Data Products and Index Licensing and Servicesbusinesses. Our Market Data Products business sells and distributes quote and trade information to marketparticipants and data distributers. Our market data products enhance transparency and provide criticalinformation to professional and non-professional investors. Our Index Licensing and Services business developsand licenses NASDAQ OMX branded indexes, associated derivatives, and financial products and also providescustom calculation services for third-party clients. In addition, eSpeed’s market data business is part of ourInformation Services segment. See “Acquisition of eSpeed for Trading of U.S. Treasuries,” of Note 4,“Acquisitions and Divestiture,” for further discussion.
Our Technology Solutions segment includes our Corporate Solutions and Market Technology businesses.Our Corporate Solutions business provides customer support services, products and programs to customers,including companies listed on our exchanges. Through Corporate Solutions offerings, companies gain access toinnovative products and software solutions and services that ease transparency, mitigate risk, maximize board
F-67

The NASDAQ OMX Group, Inc.
Notes to Consolidated Financial Statements—(Continued)
efficiency and facilitate better corporate governance. In 2013, we acquired the TR Corporate Solutionsbusinesses. See “Acquisition of the Investor Relations, Public Relations and Multimedia Solutions Businesses ofThomson Reuters,” of Note 4, “Acquisitions and Divestiture,” for further discussion. With the acquisition of theTR Corporate Solutions businesses, Corporate Solutions revenues primarily include product revenues from thefollowing key areas: Governance, Investor Relations, Multimedia Solutions and Public Relations businesses. OurMarket Technology business is a leading global technology solutions provider and partner to exchanges, clearingorganizations and central securities depositories. Our technology business is also the sales channel for ourcomplete global offering to other marketplaces. Market Technology provides technology solutions for trading,clearing, settlement, surveillance and information dissemination to markets with wide-ranging requirements,from the leading markets in the U.S., Europe and Asia to smaller African markets. Our solutions can handle awide array of assets including cash equities, currencies, various interest-bearing securities, commodities, energyproducts and derivatives. Market Technology also provides broker services and enterprise governance, riskmanagement and compliance software and services.
Our management allocates resources, assesses performance and manages these businesses as four separatesegments. We evaluate the performance of our segments based on several factors, of which the primary financialmeasure is operating income. Results of individual businesses are presented based on our managementaccounting practices and our management structure. Certain amounts are allocated to corporate items in ourmanagement reports based on the decision that those activities should not be used to evaluate the segment’soperating performance. These amounts include, but are not limited to, amounts related to our voluntaryaccommodation program, expenses paid with respect to an SEC matter, restructuring actions, mergers andstrategic initiatives, and financing activities. See below for further discussion.
F-68

The NASDAQ OMX Group, Inc.
Notes to Consolidated Financial Statements—(Continued)
The following table presents certain information regarding these operating segments for the years endedDecember 31, 2013, 2012 and 2011.
MarketServices
ListingServices
InformationServices
TechnologySolutions
Corporate Itemsand Eliminations Consolidated
(in millions)
2013Total revenues . . . . . . . . . . . . . . . . . . . . . . . . . $ 2,092 $228 $ 442 $ 449 $— $ 3,211Cost of revenues . . . . . . . . . . . . . . . . . . . . . . . (1,316) — — — — (1,316)
Revenues less transaction rebates, brokerage,clearance and exchange fees . . . . . . . . . . . . 776 228 442 449 — 1,895
Depreciation and amortization . . . . . . . . . . . . . 79 3 11 29 — 122Operating income (loss)(1) . . . . . . . . . . . . . . . . 322 92 321 39 (86) 688Total assets(2) . . . . . . . . . . . . . . . . . . . . . . . . . . 7,789 262 2,557 1,108 861 12,577Purchase of property and equipment . . . . . . . . 47 5 9 54 — 1152012Total revenues . . . . . . . . . . . . . . . . . . . . . . . . . $ 2,206 $224 $ 406 $ 284 $— $ 3,120Cost of revenues . . . . . . . . . . . . . . . . . . . . . . . (1,446) — — — — (1,446)
Revenues less transaction rebates, brokerage,clearance and exchange fees . . . . . . . . . . . . 760 224 406 284 — 1,674
Depreciation and amortization . . . . . . . . . . . . . 73 4 10 17 — 104Operating income (loss)(3) . . . . . . . . . . . . . . . . 322 94 296 22 (44) 690Total assets(2) . . . . . . . . . . . . . . . . . . . . . . . . . . 4,981 254 2,456 625 816 9,132Purchase of property and equipment . . . . . . . . 52 4 8 23 — 872011Total revenues . . . . . . . . . . . . . . . . . . . . . . . . . $ 2,553 $236 $ 391 $ 258 $— $ 3,438Cost of revenues . . . . . . . . . . . . . . . . . . . . . . . (1,748) — — — — (1,748)
Revenues less transaction rebates, brokerage,clearance and exchange fees . . . . . . . . . . . . 805 236 391 258 — 1,690
Depreciation and amortization . . . . . . . . . . . . . 74 4 9 19 3 109Operating income (loss)(4) . . . . . . . . . . . . . . . . 344 102 282 35 (67) 696Total assets(2) . . . . . . . . . . . . . . . . . . . . . . . . . . 10,007 242 2,356 594 892 14,091Purchase of property and equipment . . . . . . . . 54 5 8 19 2 88
(1) The 2013 corporate items and eliminations primarily include:
• Expense related to our voluntary accommodation program of $44 million;
• Merger and strategic initiatives expense of $22 million;
• Expenses paid with respect to an SEC matter of $10 million; and
• Restructuring charges of $9 million.
(2) Total assets increased $3.4 billion at December 31, 2013 as compared to December 31, 2012 primarily dueto an increase in default funds and margin deposits, reflecting the implementation of our collateralmanagement process at NASDAQ OMX Nordic Clearing in 2013 and an increase in goodwill and intangibleassets associated with the acquisitions of the TR Corporate Solutions businesses and eSpeed in 2013. Totalassets decreased $5.0 billion at December 31, 2012 as compared to December 31, 2011 primarily due to ournew clearing structure which significantly changed the nature and extent of the risk of loss to NASDAQ
F-69

The NASDAQ OMX Group, Inc.
Notes to Consolidated Financial Statements—(Continued)
OMX Nordic Clearing in the event of a member default. As a result, we no longer record derivativepositions or resale and repurchase agreements in the Consolidated Balance Sheet.
(3) The 2012 corporate items and eliminations primarily include:
• Costs associated with restructuring charges of $44 million. See Note 3, “Restructuring Charges,” forfurther discussion;
• Special legal expenses of $7 million from the proposed voluntary accommodation program and otherexpenses related to the systems issues experienced at the time of the Facebook IPO; and
• Merger and strategic initiative costs of $4 million, partially offset by;
• Income from open positions of $11 million relating to the operations of the exchange.
(4) The 2011 corporate items and eliminations primarily include:
• Merger and strategic initiative costs of $38 million primarily related to costs incurred for advisors, bankcommitment fees, legal and other professional services related to our joint proposal to acquire NYSEEuronext, as well as costs related to our acquisition of Glide Technologies in October 2011; and
• Debt extinguishment and refinancing charges of $31 million. See “2.50% Convertible Senior Notes,”and “2011 Credit Facility,” of Note 9, “Debt Obligations,” for further discussion.
For further discussion of our segments’ results, see “Item 7. Management’s Discussion and Analysis ofFinancial Condition and Results of Operations—Segment Operating Results.”
Geographic Data
The following table presents revenues and property and equipment, net by geographic area for 2013, 2012and 2011. Revenues are classified based upon the location of the customer. Property and equipment informationis based on the physical location of the assets.
TotalRevenues
Property andEquipment,
Net
(in millions)
2013:United States . . . . . . . . . . . . . . . . . . . . . . . . . . . . . . . . . . . . . . . . . . . . . . . . . . . . . . . . . . . $ 2,386 $ 166All other countries(1) . . . . . . . . . . . . . . . . . . . . . . . . . . . . . . . . . . . . . . . . . . . . . . . . . . . . . . 825 102
Total . . . . . . . . . . . . . . . . . . . . . . . . . . . . . . . . . . . . . . . . . . . . . . . . . . . . . . . . . . . . . . $ 3,211 $ 268
2012:United States . . . . . . . . . . . . . . . . . . . . . . . . . . . . . . . . . . . . . . . . . . . . . . . . . . . . . . . . . . . $ 2,423 $ 131All other countries(1) . . . . . . . . . . . . . . . . . . . . . . . . . . . . . . . . . . . . . . . . . . . . . . . . . . . . . . 697 80
Total . . . . . . . . . . . . . . . . . . . . . . . . . . . . . . . . . . . . . . . . . . . . . . . . . . . . . . . . . . . . . . $ 3,120 $ 211
2011:United States . . . . . . . . . . . . . . . . . . . . . . . . . . . . . . . . . . . . . . . . . . . . . . . . . . . . . . . . . . . $ 2,707 $ 125All other countries(1) . . . . . . . . . . . . . . . . . . . . . . . . . . . . . . . . . . . . . . . . . . . . . . . . . . . . . . 731 68
Total . . . . . . . . . . . . . . . . . . . . . . . . . . . . . . . . . . . . . . . . . . . . . . . . . . . . . . . . . . . . . . $ 3,438 $ 193
(1) Property and equipment, net for all other countries primarily includes assets held in Sweden.
No single customer accounted for 10.0% or more of our revenues in 2013, 2012 and 2011.
F-70

Schedule II—Valuation and Qualifying AccountsThree Years Ended December 31, 2013
(in millions)
Reserve for Bad Debts
2013 2012 2011
Balance at beginning of period . . . . . . . . . . . . . . . . . . . . . . . . . . . . . . . . . . . . . . . . . . . . . $ 5 $ 3 $ 3Additions:
Charges to income . . . . . . . . . . . . . . . . . . . . . . . . . . . . . . . . . . . . . . . . . . . . . . . . . . . 5 6 4Recoveries of amounts previously written-off . . . . . . . . . . . . . . . . . . . . . . . . . . . . . — — 1
Deductions:Charges for which reserves were provided . . . . . . . . . . . . . . . . . . . . . . . . . . . . . . . . (1) (4) (5)
Balance at end of period . . . . . . . . . . . . . . . . . . . . . . . . . . . . . . . . . . . . . . . . . . . . . . . . . . $ 9 $ 5 $ 3
1

[THIS PAGE INTENTIONALLY LEFT BLANK]

