the most challenging places to live with asthma - aafa.org · the most challenging places to live...
TRANSCRIPT
The Most Challenging Places to Live With ASTHMA
8201 Corporate Drive • Suite 1000 • Landover, MD 20785 • 202-466-7643 • aafa.org
asthmacapitals.com©2018 Asthma and Allergy Foundation of America
2
Asthma Has a Profound Effect on People and Communities Nationwide – A Message From AAFA
The Asthma and Allergy Foundation of America (AAFA) analyzes data from across the continental United States and ranks the 100 largest cities where it is challenging to live with asthma. Fourteen years after releasing our first report, we have changed the focus for our 2018 Asthma Capitals™ report to measure the most critical of health outcomes – asthma prevalence, emergency room visits due to asthma attacks and asthma mortality.
Ten people die every day from asthma. That’s 10 too many. Most of these deaths are preventable with proper management, access to adequate medical care, housing improvements and better air quality. Yet, asthma still remains one of the most prevalent chronic diseases in our nation. It is also one of the most costly diseases – with an estimated annual cost to society of $82 billion.
AAFA publishes this report to help those who live in Asthma Capitals recognize, prevent and manage asthma symptoms. This report also helps highlight how communities can make improvements to better serve their residents and visitors with asthma. By using the information in this report, communities can see areas where they can direct their focus to make improvements and reduce the impact of asthma.
AAFA commits to working on behalf of individuals with asthma. We focus our efforts on saving lives and improving the quality of life for people with asthma and allergic diseases through support, education, advocacy and research. We will continue to promote public policy initiatives that improve and protect quality of life and treatment options for those affected by asthma.
Together with patients, caregivers, researchers, payers, scientists, clinicians, industry and policymakers, we can improve communities and make a difference to reduce unnecessary loss of life and improve the quality of life for children and adults with asthma.
Sincerely,
Kenneth Mendez, President and CEO Melanie Carver, Vice President of Community Health and Services

asthmacapitals.com©2018 Asthma and Allergy Foundation of America
3
Table of ContentsBackground and Introduction . . . . . . . . . . . . . . . . . . . . . . . . . . . . . . . . . . . . . . . . 4
The Top 20 Most Challenging Places to Live With Asthma . . . . . . . . . . . . . . . . . . . . . . . 5
Asthma Health Outcomes . . . . . . . . . . . . . . . . . . . . . . . . . . . . . . . . . . . . . . . . . . 6 Estimated Asthma Prevalence . . . . . . . . . . . . . . . . . . . . . . . . . . . . . . . . . . . . . 6 Emergency Department Visits . . . . . . . . . . . . . . . . . . . . . . . . . . . . . . . . . . . . . 8 Asthma-Related Mortality . . . . . . . . . . . . . . . . . . . . . . . . . . . . . . . . . . . . . . . .10
Risk Factors That Can Worsen Asthma or Influence Asthma Rates . . . . . . . . . . . . . . . . . . 13 Poverty . . . . . . . . . . . . . . . . . . . . . . . . . . . . . . . . . . . . . . . . . . . . . . . . . . 13 Lack of Health Insurance . . . . . . . . . . . . . . . . . . . . . . . . . . . . . . . . . . . . . . . . 17 Poor Air Quality . . . . . . . . . . . . . . . . . . . . . . . . . . . . . . . . . . . . . . . . . . . . . 18 Pollen . . . . . . . . . . . . . . . . . . . . . . . . . . . . . . . . . . . . . . . . . . . . . . . . . . . 21 Asthma Quick-Relief Medicine Use . . . . . . . . . . . . . . . . . . . . . . . . . . . . . . . . . 24 Asthma Long-Term Controller Medicine Use . . . . . . . . . . . . . . . . . . . . . . . . . . . . 26 Smoking Laws . . . . . . . . . . . . . . . . . . . . . . . . . . . . . . . . . . . . . . . . . . . . . 28 Access to Specialists . . . . . . . . . . . . . . . . . . . . . . . . . . . . . . . . . . . . . . . . . . 29
Regional Focus . . . . . . . . . . . . . . . . . . . . . . . . . . . . . . . . . . . . . . . . . . . . . . . . 31 Northeast Mid-Atlantic Asthma Belt . . . . . . . . . . . . . . . . . . . . . . . . . . . . . . . . . . 31 Ohio-Lake Erie Asthma Belt . . . . . . . . . . . . . . . . . . . . . . . . . . . . . . . . . . . . . 33
Chart: The Top 100 Most Challenging Places to Live With Asthma . . . . . . . . . . . . . . . . . 35
Methodology . . . . . . . . . . . . . . . . . . . . . . . . . . . . . . . . . . . . . . . . . . . . . . . . 39
Acknowledgements . . . . . . . . . . . . . . . . . . . . . . . . . . . . . . . . . . . . . . . . . . . . 40
Resources . . . . . . . . . . . . . . . . . . . . . . . . . . . . . . . . . . . . . . . . . . . . . . . . . . 40

asthmacapitals.com©2018 Asthma and Allergy Foundation of America
4
Background and Introduction Breathing is life’s most basic, essential function. For most, it happens naturally without a second thought. But for the 25 million people in the United States with asthma, breathing is not something they take for granted.
Many factors come together to increase the risk for someone to be diagnosed with asthma. Genetics, respiratory infections, tobacco smoke and more all play a part. But can your location increase your risk? Can the city you live in create challenges that make asthma harder to control?
AAFA’s 2018 Asthma Capitals™ report looks at factors in cities across the continental U.S. that contribute to asthma rates and management. We ranked the cities based on health outcomes: prevalence, emergency room visits and mortality. We also looked at risk factors that contribute to these outcomes. Risk factors include poverty, air quality, access to specialists, pollen counts, medicine use, tobacco policies and the rate of uninsured residents.
In this report, we review these outcomes and risk factors. We also highlight two regions with a surprising number of cities that rank in the top 20 Asthma Capitals™ – the Northeastern U.S. and the state of Ohio.
As we encourage proper asthma education and treatment, we also need to look at other ways to improve quality of the life for Americans with asthma. This can only happen through a combined effort from researchers, health care providers, federal and state policy makers and local stakeholders to improve our communities.
The goal of this report is to start the conversation about improving asthma rates in our nation, especially in these top cities. This data gives us the chance to show where we can focus our efforts to create healthier environments and communities to bring down asthma rates and deaths.
The 2018 Asthma Capitals™ report is an independent research project of the Asthma and Allergy Foundation of America with sponsorship from Sanofi Genzyme and Regeneron.
ABOUT THE ASTHMA AND ALLERGY FOUNDATION OF AMERICA
Founded in 1953 and celebrating 65 years of service, AAFA is the oldest and largest nonprofit patient organization dedicated to improving the quality of life for people with asthma, allergies and related conditions through research, education, advocacy and support. AAFA provides practical information and community-based services through its digital communities and national network of local chapters and educational support groups. Through its Kids With Food Allergies division, AAFA offers the most extensive online support community for families raising children with food allergies. AAFA also helps consumers identify products suitable for those with asthma and allergies through the asthma & allergy friendly® Certification Program. For more information, visit aafa.org.
asthmacapitals.com©2018 Asthma and Allergy Foundation of America
5
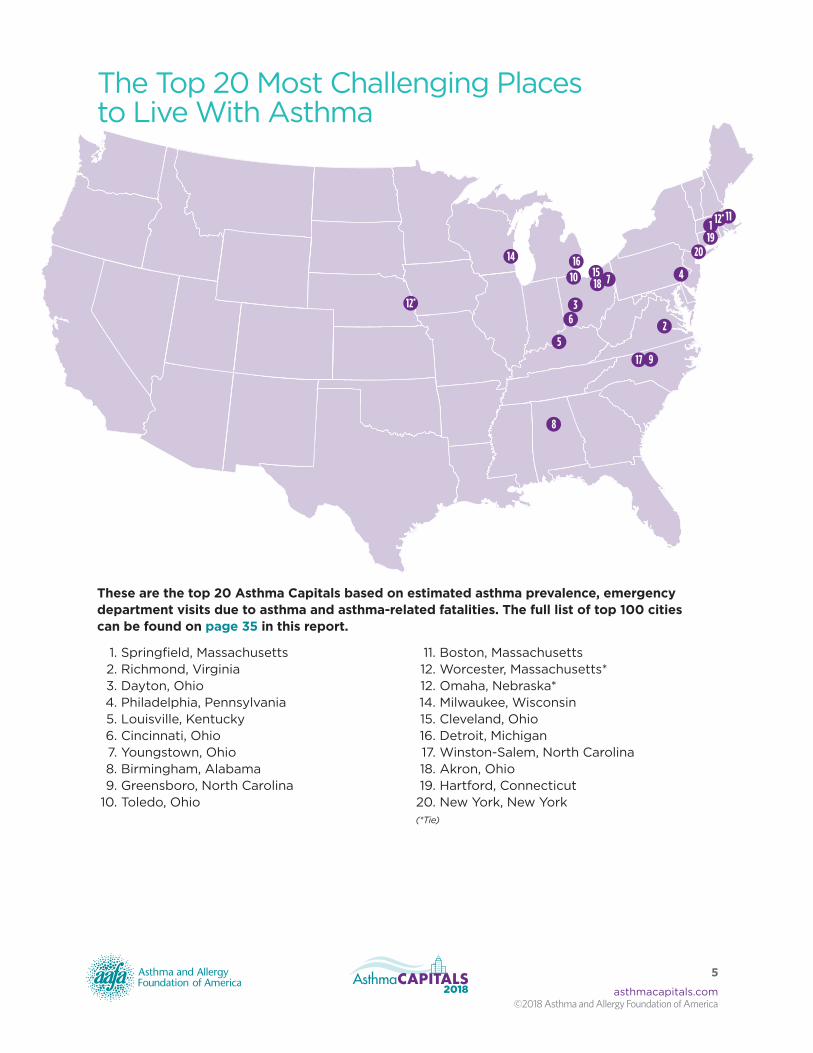
The Top 20 Most Challenging Places to Live With Asthma
These are the top 20 Asthma Capitals based on estimated asthma prevalence, emergency department visits due to asthma and asthma-related fatalities. The full list of top 100 cities can be found on page 35 in this report.
1. Springfield, Massachusetts 2. Richmond, Virginia 3. Dayton, Ohio 4. Philadelphia, Pennsylvania 5. Louisville, Kentucky 6. Cincinnati, Ohio 7. Youngstown, Ohio 8. Birmingham, Alabama 9. Greensboro, North Carolina 10. Toledo, Ohio
11. Boston, Massachusetts 12. Worcester, Massachusetts* 12. Omaha, Nebraska* 14. Milwaukee, Wisconsin 15. Cleveland, Ohio 16. Detroit, Michigan 17. Winston-Salem, North Carolina 18. Akron, Ohio 19. Hartford, Connecticut 20. New York, New York (*Tie)
11119
12*
2
3
4
5
6
7
8
917
1016
12*
141518
20

asthmacapitals.com©2018 Asthma and Allergy Foundation of America
6
Asthma Health OutcomesAsthma Health Outcomes
We ranked cities based on three health outcomes: asthma prevalence, asthma-related emergency department visits and asthma-related mortality rates. The outcomes were not weighted equally.
ESTIMATED ASTHMA PREVALENCE
Approximately 7.8% of people living in the United States have asthma. The disease is more common in children than in adults, with 8.4% of children under 18 having asthma, compared to 7.6% of adults 18 or older. Factors such as gender, race/ethnicity and socio-economic status are associated with asthma, with the disease being more common in males than females (for children). Non-Hispanic Blacks and Puerto Ricans are also more likely to have the disease than non-Hispanic whites. Persons living below 100% of the poverty level are more likely to have asthma than those living at any percentage above the poverty level.1
Rates of asthma can also vary from state to state and city to city. Do you know how common asthma is in your city? Are you aware of resources in your local county to help with asthma management?
The cities with the highest estimated asthma prevalence are:
Asthma Prevalence
RankingMetropolitan Area
Overall Asthma Capital
National Ranking
1 Louisville, KY 5
2 Portland, OR 39
3 Providence, RI 35
4 Boston, MA 11
5 Bridgeport, CT 49
6 Hartford, CT 19
7 New Haven, CT 24
8 Worcester, MA 12
9 Birmingham, AL 8
10 Springfield, MA 1
11 Philadelphia, PA 4
12 Harrisburg, PA 53
13 Allentown, PA 27
14 Pittsburgh, PA 42
15 Scranton, PA 21
16 Washington, D.C. 23
1. CDC - Asthma - Most Recent Asthma Data. (2018, February 13). Retrieved from https://www.cdc.gov/asthma/most_recent_data.htm
Louisville, KY

asthmacapitals.com©2018 Asthma and Allergy Foundation of America
7
Asthma Health OutcomesAsthma Health Outcomes
Asthma can have a significant effect on lifestyle. Many people with asthma go to great lengths to avoid their asthma triggers to prevent flareups.
Lynn Johnson of Birmingham, Alabama (overall #8 on Asthma Capitals), was diagnosed with asthma as an adult, around 2011. A big challenge for her has been the lifestyle changes that her asthma required. For example, to avoid strong smells, Johnson switched to using only scent-free products.
“Literally anything that comes into my house must be scent-free,” she says.
This includes cleaning products, deodorant, soaps, shampoo and more. This goes for the products that Johnson’s husband and two teenage sons use, too. Even her sons’ friends know not to wear any perfumes, colognes or other scented products when they come over to the Johnson’s house.
Her family is also supportive of some of the changes they have had to make at home. For example, they must have a generator for the nebulizers in case their power goes out. (A nebulizer is a medical device that some people with asthma use to turn liquid medicine into a mist and inhale into the lungs.) Vacations, outings and social events all require a lot more planning and awareness. Lynn’s asthma affects the family’s budget, too.
“Even though lifestyle changes have to be made, it doesn’t mean your life stops,” Lynn adds. “You learn to work around it. Stay as active as you can. Enjoy life. You have to make accommodations for it, but asthma doesn’t have to run your life.”
For each city included in the 2018 Asthma Capitals, AAFA obtained an estimated asthma prevalence for the respective county. The estimates ranged widely from 7.1% to 11.7%.
Approximately
7.8%of people living
in the United States have asthma.
asthmacapitals.com©2018 Asthma and Allergy Foundation of America
8
Asthma Health OutcomesAsthma Health Outcomes
EMERGENCY DEPARTMENT VISITS
A visit to the emergency department (ED) may be necessary due to an asthma flareup or exacerbation. According to a recent national survey, asthma accounts for more than 2 million visits to the emergency department yearly, making it one of the top 20 reasons for ED visits.2
It is important to seek medical care right away if you or your child has trouble breathing; however, unnecessary trips to the ED can be costly. On average, every asthma-related trip to the ED costs $1502.3
Effective asthma management may help to reduce ED visits and hospitalizations. Knowing and avoiding asthma triggers (when possible), adhering to your medicine and following an asthma action plan are steps that may improve your overall asthma management. Talk with your doctor or nurse to make sure you understand how to best manage your or your child’s asthma.
The Centers for Disease Control and Prevention (CDC) released its Vital Signs report on pediatric asthma. The CDC’s findings showed that from 2010-2016 the use of asthma action plans increased and the number of hospitalizations decreased. During the past 10 years, asthma-related hospitalizations decreased from 10% to 5%.4
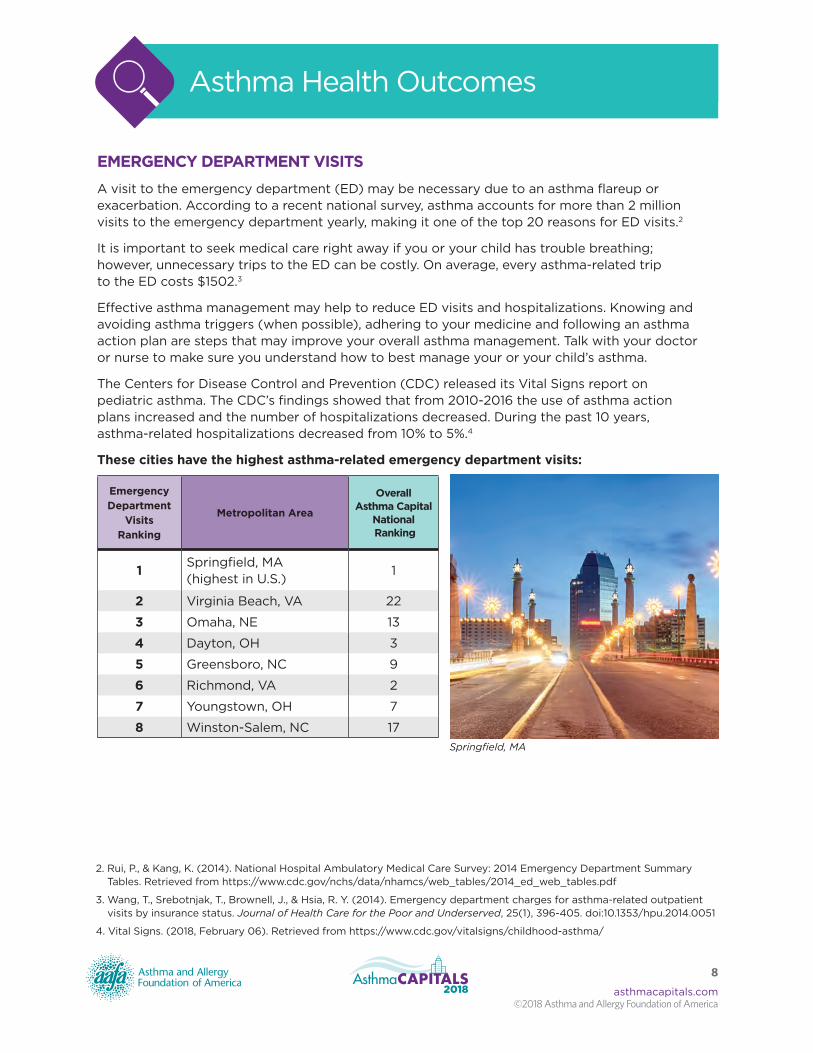
These cities have the highest asthma-related emergency department visits:
Emergency Department
Visits Ranking
Metropolitan Area
Overall Asthma Capital
National Ranking
1Springfield, MA (highest in U.S.)
1
2 Virginia Beach, VA 22
3 Omaha, NE 13
4 Dayton, OH 3
5 Greensboro, NC 9
6 Richmond, VA 2
7 Youngstown, OH 7
8 Winston-Salem, NC 17
2. Rui, P., & Kang, K. (2014). National Hospital Ambulatory Medical Care Survey: 2014 Emergency Department Summary Tables. Retrieved from https://www.cdc.gov/nchs/data/nhamcs/web_tables/2014_ed_web_tables.pdf
3. Wang, T., Srebotnjak, T., Brownell, J., & Hsia, R. Y. (2014). Emergency department charges for asthma-related outpatient visits by insurance status. Journal of Health Care for the Poor and Underserved, 25(1), 396-405. doi:10.1353/hpu.2014.0051
4. Vital Signs. (2018, February 06). Retrieved from https://www.cdc.gov/vitalsigns/childhood-asthma/
Springfield, MA

asthmacapitals.com©2018 Asthma and Allergy Foundation of America
9
Asthma Health OutcomesAsthma Health Outcomes
Nancy Gomez of Boston, Massachusetts, (overall #11 on Asthma Capitals), knows too well how the financial and emotional cost of severe asthma attacks and emergency department visits. Her 10-year-old son, Oziel, has had asthma and allergies since he was a baby and has been to an ED several times. The cost of these visits puts a strain on her finances as a single mother.
Nancy struggles with worry. “I think my main concern is being able to get him to the hospital on time.”
When Oziel has a severe asthma attack, Nancy drives him to the hospital herself. She doesn’t call 911 because it’s another expense and she lives
paycheck to paycheck. Her main health insurance is private insurance with copays and deductibles that are hard for her to afford. She wants to avoid getting a bill for $500 for the ambulance.
“Last year one time I thought I wasn’t going to make it to the hospital on time,” Nancy recalls. “He was in the back seat hardly getting any air. He couldn’t sit up straight. We barely made it.”
“There’s times when I don’t know how I manage,” Nancy adds. In addition to asthma, Oziel has environmental allergies to pollen, animals, dust, smoke and more. He also has life-threatening food allergies to peanuts, tree nuts and dairy products. And he is autistic. Managing all of this is a constant challenge for Nancy. “It gets very stressful. Especially since it’s not something acute where a child is really sick and then gets better. You have to be on top of that medical care all the time.”
For each city included in the 2018 Asthma Capitals, AAFA obtained the total number of Emergency Department visits where an asthma ICD 10 code was included in a diagnosis field, for the respective Census-designated metropolitan statistical area, or MSA, for 2016. Analyses included estimating the ED rate per 10,000 asthma patients.
Asthma causes
2 MILLION visits to emergency rooms
yearly.
Each visit averages
$1502 in costs.
asthmacapitals.com©2018 Asthma and Allergy Foundation of America
10
Asthma Health OutcomesAsthma Health Outcomes
ASTHMA-RELATED MORTALITY
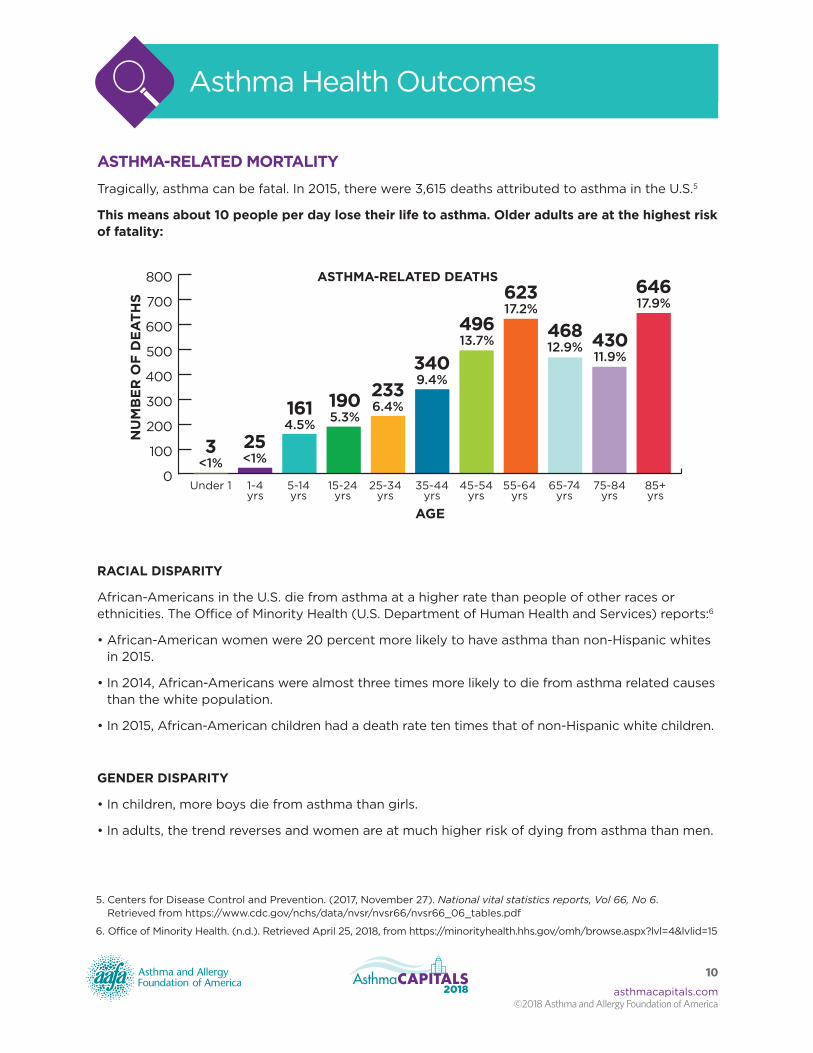
Tragically, asthma can be fatal. In 2015, there were 3,615 deaths attributed to asthma in the U.S.5
This means about 10 people per day lose their life to asthma. Older adults are at the highest risk of fatality:
ASTHMA-RELATED DEATHS
RACIAL DISPARITY
African-Americans in the U.S. die from asthma at a higher rate than people of other races or ethnicities. The Office of Minority Health (U.S. Department of Human Health and Services) reports:6
• African-American women were 20 percent more likely to have asthma than non-Hispanic whites in 2015.
• In 2014, African-Americans were almost three times more likely to die from asthma related causes than the white population.
• In 2015, African-American children had a death rate ten times that of non-Hispanic white children.
GENDER DISPARITY
• In children, more boys die from asthma than girls.
• In adults, the trend reverses and women are at much higher risk of dying from asthma than men.
5. Centers for Disease Control and Prevention. (2017, November 27). National vital statistics reports, Vol 66, No 6. Retrieved from https://www.cdc.gov/nchs/data/nvsr/nvsr66/nvsr66_06_tables.pdf
6. Office of Minority Health. (n.d.). Retrieved April 25, 2018, from https://minorityhealth.hhs.gov/omh/browse.aspx?lvl=4&lvlid=15
0
100
200
300
400
500
600
700
800
Under 1 1-4yrs
5-14yrs
15-24yrs
25-34yrs
35-44yrs
45-54yrs
55-64yrs
65-74yrs
75-84yrs
85+yrs
AGE
NU
MB
ER
OF
DE
AT
HS
646 17.9%
430 11.9%
468 12.9%
623 17.2%
496 13.7%
340 9.4%
233 6.4%190
5.3%161 4.5%
25 <1%
3<1%

asthmacapitals.com©2018 Asthma and Allergy Foundation of America
11
Asthma Health OutcomesAsthma Health Outcomes
If you ever feel your life or your child’s life is in danger, seek emergency care immediately. An asthma action plan can help you know when you are in danger. It uses red, yellow, green zones for your symptoms. If you are in the red zone, it is a medical emergency. AAFA has an action plan template you can use to discuss your treatment plan with your health care provider. Visit aafa.org/actionplan to download it.
The cities with the most asthma-related deaths are:
Asthma- Related Deaths Ranking
Metropolitan Area
Overall Asthma Capital
National Ranking
1Richmond, VA (highest in U.S.)
2
2 Chicago, IL 43
3 New York, NY 20
4 New Orleans, LA 25
5 Detroit, MI 16
6 Philadelphia, PA 4
Shari Duncan, of Detroit, Michigan (#16 overall on Asthma Capitals) has had asthma for over three decades. All six of her children, who range in age from 17 to 40, have asthma. Shari’s mother and her two grandchildren have asthma. And many members of her extended family have asthma as well.
“A lot of people have kids that are asthmatics,” Shari said, “but they aren’t real educated about it. People need to know the truth that asthma kills. You can die from this. You must take it seriously!”
Shari says that her greatest challenge has been fear. “I’ve had nieces and nephews who died from asthma,” Shari states. “It’s scary not knowing if you or your child will come across something that will activate the asthma.”
Richmond, VA
ASTHMA ACTION PLANName: Date:
Doctor: Medical Record #:
Doctor’s Phone #: Day Night/Weekend
Emergency Contact:
Doctor’s Signature:
The colors of a traffic light will help you use your asthma medicines.
GREEN means Go Zone! Use preventive medicine.
YELLOW means Caution Zone! Add quick-relief medicine.
RED means Danger Zone! Get help from a doctor.Personal Best Peak Flow:
GO Use these daily controller medicines:
You have all of these:• Breathing is good• No cough or wheeze• Sleep through
the night• Can work & play
MEDICINE HOW MUCH HOW OFTEN/WHEN
For asthma with exercise, take:
CAUTION Continue with green zone medicine and add:
You have any of these:• First signs of a cold• Exposure to known
trigger• Cough • Mild wheeze• Tight chest • Coughing at night
MEDICINE HOW MUCH HOW OFTEN/ WHEN
CALL YOUR ASTHMA CARE PROVIDER.
DANGER Take these medicines and call your doctor now.
Your asthma is getting worse fast:• Medicine is not helping• Breathing is hard
& fast• Nose opens wide• Trouble speaking • Ribs show (in children)
MEDICINE HOW MUCH HOW OFTEN/WHEN
GET HELP FROM A DOCTOR NOW! Your doctor will want to see you right away. It’s important! If you cannot contact your doctor, go directly to the emergency room. DO NOT WAIT. Make an appointment with your asthma care provider within two days of an ER visit or hospitalization.
aafa.org
Peak flow:
from
to
Peak flow:
from
to
Peak flow:
reading below
ASTHMA ACTION PLANName:
Date:
Doctor:Medical Record #:
Doctor’s Phone #: Day Night/Weekend
Emergency Contact:
Doctor’s Signature:
The colors of a traffic light will help you use your asthma medicines.
GREEN means Go Zone! Use preventive medicine.
YELLOW means Caution Zone! Add quick-relief medicine.
RED means Danger Zone! Get help from a doctor.
Personal Best Peak Flow:
GOUse these daily controller medicines:You have all of these:
• Breathing is good• No cough or wheeze• Sleep through
the night• Can work & play
MEDICINE HOW MUCH HOW OFTEN/WHEN
For asthma with exercise, take:
CAUTIONContinue with green zone medicine and add:You have any of these:
• First signs of a cold• Exposure to known
trigger• Cough • Mild wheeze• Tight chest • Coughing at night
MEDICINE HOW MUCH HOW OFTEN/ WHEN
CALL YOUR ASTHMA CARE PROVIDER.
DANGERTake these medicines and call your doctor now.Your asthma is getting worse fast:• Medicine is not helping
• Breathing is hard & fast
• Nose opens wide• Trouble speaking • Ribs show (in children)
MEDICINE HOW MUCH HOW OFTEN/WHEN
GET HELP FROM A DOCTOR NOW! Your doctor will want to see you right away. It’s important! If you cannot contact your doctor, go directly to the emergency room. DO NOT WAIT. Make an appointment with your asthma care provider within two days of an ER visit or hospitalization.
aafa.org
Peak flow: from
to
Peak flow: from
to
Peak flow:
reading below

asthmacapitals.com©2018 Asthma and Allergy Foundation of America
12
Asthma Health OutcomesAsthma Health Outcomes
For each city included in the 2018 Asthma Capitals, AAFA obtained the estimated asthma-related crude death rate per 100,000 people for the respective county from 1999-2016. The estimates range from 0.4% - 3.1%.
Meredith Dodds of Akron, Ohio (#18 overall on Asthma Capitals), lost her 16-year-old son, Austin, due to a severe asthma attack.
Austin was diagnosed with asthma when he was 3. That never stopped him from playing sports, including track, baseball and football. To manage his asthma, Austin used a quick-relief inhaler and a nebulizer when needed. He was very active.
But Austin’s asthma flared from exposure to pollen and poor air quality. High pollen counts and air pollution are key triggers that affect asthma in many cities like Akron.
Suddenly on Oct. 1, 2016, Austin had a massive asthma attack. He lost consciousness, and a few days later, he died.
“The night Austin passed away, it was completely unexpected and still unbelievable,” remembers his mother. “Anytime he had a flare up, we gave him a breathing treatment or had him use his inhaler. Within minutes, he found relief. This particular night, nothing worked … for some strange reason he couldn’t find relief.”
About 25 million people in the U.S. have asthma. In Meredith’s experience, “Everyone knows at least one person with asthma.” The challenge is that people “may not know what to do if they’re faced with a flareup or an emergency situation. I understood asthma was a very dangerous condition, but I never knew anyone died from asthma.”
10 PEOPLE per day lose their life to asthma.
Risk Factors That Can Worsen Asthma or Influence Asthma Rates
asthmacapitals.com©2018 Asthma and Allergy Foundation of America
13
A risk factor is any attribute, characteristic or exposure of an individual that increases the likelihood of developing a disease, like asthma. These are the top risk factors for asthma that may influence the ranking of outcomes for cities in this report:
• Poverty• Lack of health insurance• Air quality• Pollen count• Controller medication use• Quick-relief medication use• Access to asthma specialists• Anti-smoking laws
POVERTY
Asthma can be especially challenging for families living in poverty. Proper asthma management may be difficult when you are constantly worried about paying for basic needs such as housing, clothing and food. The cost of care may impact your decision to go to the doctor and pharmacy. A lack of reliable transportation may influence whether you attend regular health care appointments. If you or your child has asthma, and your financial situation is interfering with asthma management, look for local resources in your neighborhood that may help. There may be safety net (free) clinics that will treat all patients regardless of their insurance status or ability to pay.
There are also programs that can help cover the costs of some medications, such as:
• State pharmaceutical assistance programs• Non-profit programs• Assistance programs offered by pharmaceutical companies
Visit aafa.org/asthma-assistance for more information.

Risk Factors That Can Worsen Asthma or Influence Asthma Rates
asthmacapitals.com©2018 Asthma and Allergy Foundation of America
14
These cities have the highest rates of poverty:
Poverty Ranking
Metropolitan Area
Overall Asthma Capital
National Ranking
1 McAllen, TX 100
2 Richmond, VA 2
3 Augusta, GA 31
4 Fresno, CA 75
5 Philadelphia, PA 4
6 New Orleans, LA 25
7 Detroit, MI 16
8 El Paso, TX 94
9 Bakersfield, CA 85
10 Baltimore, MD 33
11 Jackson, MS 38
12 Memphis, TN 57
13 Baton Rouge, LA 89
14 Toledo, OH 10
15 Milwaukee, WI 14
16 Boston, MA 11
17 Indianapolis, IN 37
18 Youngstown, OH 7
19 Des Moines, IA 84
20 Washington, DC 23
The cost of managing asthma adds to the stress of those already living with limited means. Dr. Tyra Bryant-Stephens, Medical Director of the Community Asthma Prevention Program at Children’s Hospital of Philadelphia, has witnessed the correlation between poverty and asthma and the impact it has on low-income families.
“In the neighborhoods we serve, there is a high rate of poverty, as well as a high rate of asthma morbidity,” says Dr. Bryant-Stephens. “Limited financial resources impact every aspect of their lives, including the basic requirements of adequate food, clothing and shelter which should be a right for all children. It causes more family stress, and sometimes multiple families have to live together which may result in a more chaotic environment.”
McAllen, TX
Photo credit of McAllen: Valleyite12 via Wikimedia Commons / Saturated and cropped from original

Risk Factors That Can Worsen Asthma or Influence Asthma Rates
asthmacapitals.com©2018 Asthma and Allergy Foundation of America
15
Asthma often runs in families, increasing the burden even more. At one time, Shari Duncan in Detroit, Michigan, was managing her own asthma as well as asthma in all six of her children, who now range in age from 17 to 40. There was a point when managing everyone’s asthma was very complicated.
“There were over 40 meds and often 20 breathing treatments a day,” Shari says. “Sometimes me and two or three of the kids were in the emergency room at the same time. Every day was a challenge.”
Needless to say, the challenges of managing everyone’s asthma, and all of the worry associated with that, was very, very stressful for her.
Today, most of Shari’s children are adults and on their own. But back when there were co-pays for six kids, things were much more difficult. She had to arrange a payment plan in order to pay for all the asthma meds. The cost of buying sheets and pillow cases specially made for those with asthma also added up.
COST OF MANAGING ASTHMA
The cost of managing asthma are steep – both for those with the disease and the nation as a whole.
$3 billion Missed school and work days
50.3 billionMedical costs
$29 billion Asthma-related
$1,830Prescription
medicine$640
Office visits
$529Hospitalizations
$176 Outpatient
visits
$105 ED visits
$81.9 BILLION Annual U.S. economic cost of asthma7
$3,266 Average cost of asthma per person, per year7
For each city included in the 2018 Asthma Capitals, AAFA obtained the poverty rate for the respective county. The estimates range from 8.3% to 31.2%.
7. Nurmagambetov T, et al. The Economic Burden of Asthma in the United States, 2008 - 2013. Annals of the American Thoracic Society : 11 Jan 2018. Available from: URL: https://doi.org/10.1513/AnnalsATS.201703-259OC
asthmacapitals.com©2018 Asthma and Allergy Foundation of America
16
The cost of managing asthma can create many financial challenges. Some costs are expected, such as regular doctor’s visits and prescription medications. But unexpected ED visits, hospital stays and missed work and school put a great burden on those with asthma and their families. Many are forced to choose between necessary, life-saving medication and basic living expenses, such as food.
“My son used to get off the bus from school screaming for his rescue inhaler because he couldn’t breathe,” says Nancy Gomez of Boston, Massachusetts, (overall #11 on Asthma Capitals). “But it’s very expensive medication. My insurance covers it, because we proved that he medically needed it. But I had to sign a waiver to get MassHealth [the state insurance] to help me with his copay and deductible. It’s been a financial strain on me as a single parent to afford all of his medical care and traveling expenses within my budget.”
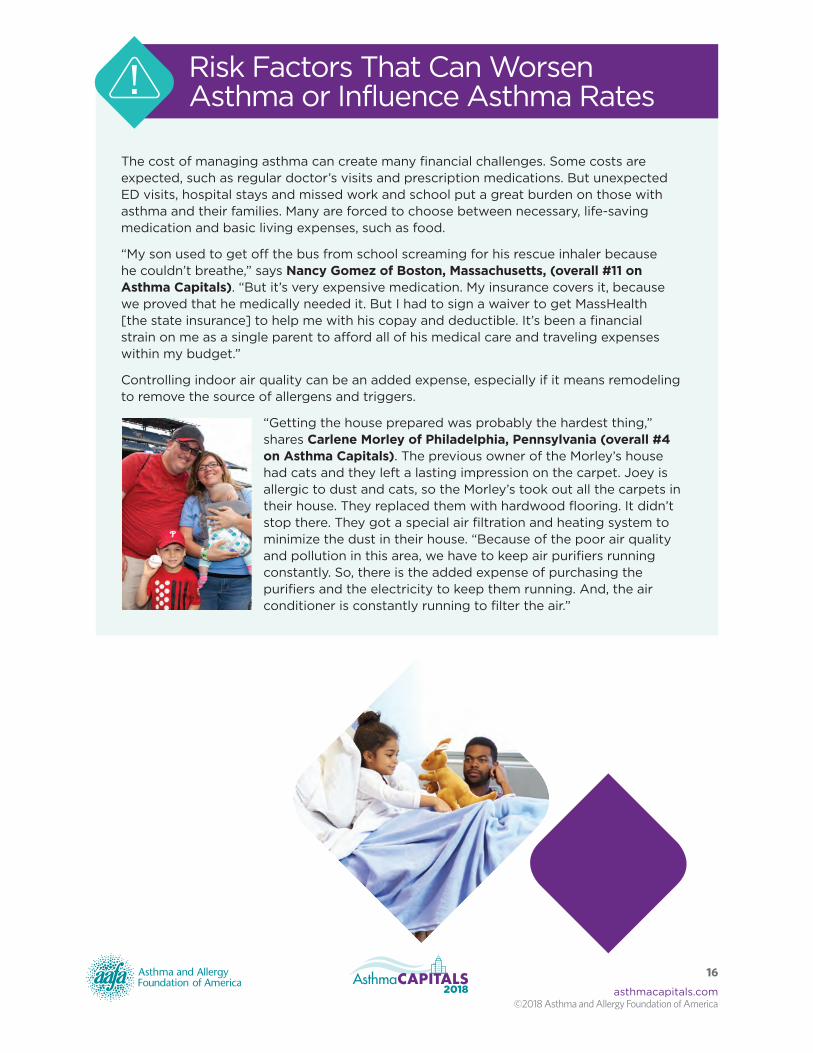
Controlling indoor air quality can be an added expense, especially if it means remodeling to remove the source of allergens and triggers.
“Getting the house prepared was probably the hardest thing,” shares Carlene Morley of Philadelphia, Pennsylvania (overall #4 on Asthma Capitals). The previous owner of the Morley’s house had cats and they left a lasting impression on the carpet. Joey is allergic to dust and cats, so the Morley’s took out all the carpets in their house. They replaced them with hardwood flooring. It didn’t stop there. They got a special air filtration and heating system to minimize the dust in their house. “Because of the poor air quality and pollution in this area, we have to keep air purifiers running constantly. So, there is the added expense of purchasing the purifiers and the electricity to keep them running. And, the air conditioner is constantly running to filter the air.”
Risk Factors That Can Worsen Asthma or Influence Asthma Rates

Risk Factors That Can Worsen Asthma or Influence Asthma Rates
asthmacapitals.com©2018 Asthma and Allergy Foundation of America
17
LACK OF HEALTH INSURANCE
Health care and medications can be very costly. For patients managing a chronic condition that requires medication year-round, like asthma, having insurance is often a big help. However, insurance itself can also be very costly. These costs may vary depending on if you are employed and if your employer offers health insurance as a benefit and pays any of the costs. Other options include marketplace health insurance and government-sponsored insurance, like Medicare or Medicaid. Some states have expanded health insurance options for their residents, while other states have not. There may be local resources in your community to help you determine what insurance option is best for you.
These cities have the highest number of uninsured residents, which is a risk factor for uncontrolled asthma:
Lack of Insurance Ranking
Metropolitan Area
Overall Asthma Capital
National Ranking
1 McAllen, TX 100
2 El Paso, TX 94
3 Dallas, TX 77
4 Miami, FL 83
5 Houston, TX 99
6 Cape Coral, FL 98
7 San Antonio, TX 96
8 Oklahoma City, OK 34
9 Austin, TX 79
10 Sarasota, FL 80
11 Tulsa, OK 44
12 Orlando, FL 90
13 Daytona Beach, FL 72
14 Lakeland, FL 82
15 Tampa, FL 76
Texas, Florida and Oklahoma have yet to expand their Medicaid programs under the Affordable Care Act (ACA). Texas is home to the largest number of uninsured Americans of any state in the country.8 For the millions of uninsured people in these states, this decision has left them without an option for affordable health insurance.
McAllen, TX
Photo credit of McAllen: Valleyite12 via Wikimedia Commons / Saturated and cropped from original
For each city included in the 2018 Asthma Capitals, AAFA obtained the uninsured rate for the respective county. The estimates range from 2.9% to 32%.
8. Barnett, J. C., & Berchick, E. R. (2017, September). Health Insurance Coverage in the United States: 2016(Rep.). Retrieved April 25, 2018, from U.S. Department of Commerce website: Health Insurance Coverage in the United States: 2016

Risk Factors That Can Worsen Asthma or Influence Asthma Rates
asthmacapitals.com©2018 Asthma and Allergy Foundation of America
18
POOR AIR QUALITY
Air pollution is a mixture of natural and man-made substances in the air we breathe. It is typically separated into outdoor and indoor pollution.9 Air pollution includes gases, smoke from fires, volcanic ash, dust particles and other substances that are irritating to the lungs. Research shows that air pollution can worsen asthma symptoms.
Ozone, a gas, is one of the most common air pollutants. Ozone contributes to what we typically experience as “smog” or haze. It is most common in cities where there are more cars. It is also more common in the summer when there is more sunlight and low winds. Ozone triggers asthma because it is very irritating to the lungs and airways.
Other forms of air pollution may also trigger asthma. Small particles in the air can pass through your nose or mouth and get into your lungs. Airborne particles, found in haze, smoke and airborne dust, present serious air quality problems. People with asthma are at greater risk from breathing in small particles. The particles can make asthma worse.
Many sources, including local TV weather forecasts, report the expected air quality for the next day or two. This information can help you know when the air quality may trigger an asthma episode and allow you to plan accordingly.
These cities have the worst air quality, which is a risk factor that worsens asthma:
Worst Air Quality
RankingMetropolitan Area
Overall Asthma Capital
National Ranking
1 Phoenix, AZ 47
2 Bakersfield, CA 85
3 Fresno, CA 75
4 Los Angeles, CA 92
5 Riverside, CA 86
6 Sacramento, CA 65
7 San Jose, CA 97
8 Stockton, CA 61
9 Chicago, IL 43
10 Allentown, PA 27
11 Pittsburgh, PA 42
12 El Paso, TX 94
13 Ogden, UT 80
14 Provo, UT 93
15 Salt Lake City, UT 70
10. National Institute of Environmental Health Sciences. (2018). Air pollution. Retrieved from https://www.niehs.nih.gov/health/topics/agents/air-pollution/index.cfm
Phoenix, AZ
Risk Factors That Can Worsen Asthma or Influence Asthma Rates
asthmacapitals.com©2018 Asthma and Allergy Foundation of America
19
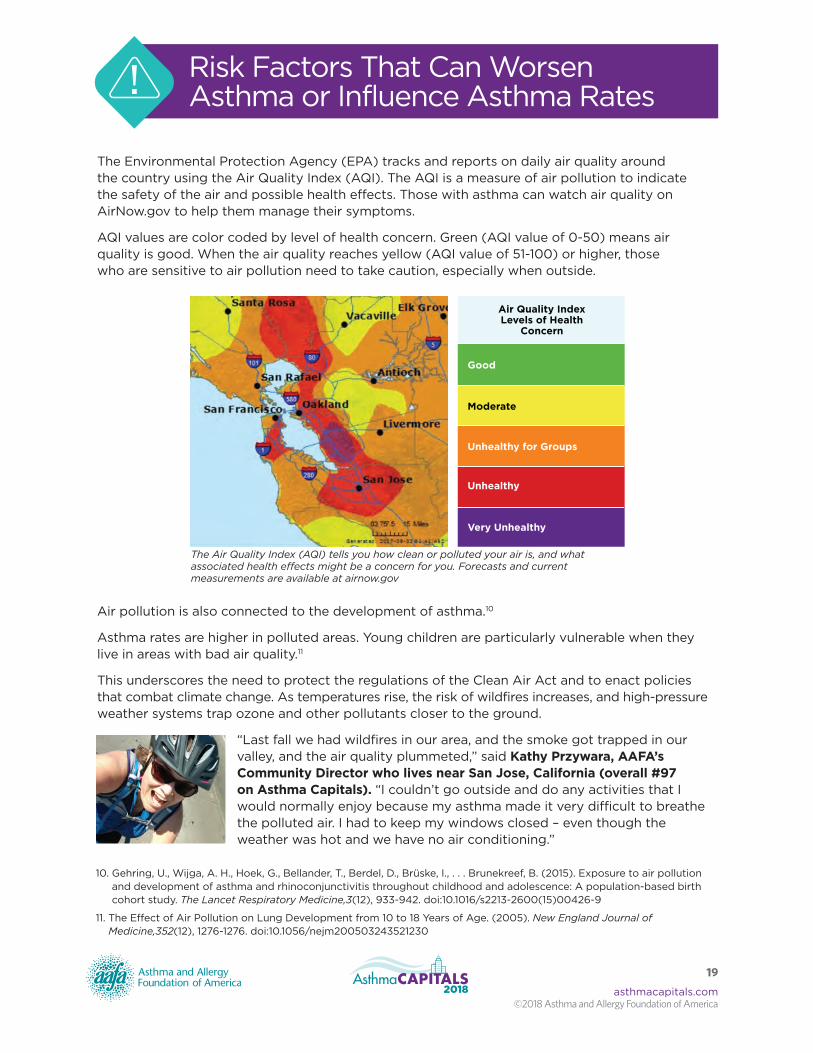
The Environmental Protection Agency (EPA) tracks and reports on daily air quality around the country using the Air Quality Index (AQI). The AQI is a measure of air pollution to indicate the safety of the air and possible health effects. Those with asthma can watch air quality on AirNow.gov to help them manage their symptoms.
AQI values are color coded by level of health concern. Green (AQI value of 0-50) means air quality is good. When the air quality reaches yellow (AQI value of 51-100) or higher, those who are sensitive to air pollution need to take caution, especially when outside.
The Air Quality Index (AQI) tells you how clean or polluted your air is, and what associated health effects might be a concern for you. Forecasts and current measurements are available at airnow.gov
Air Quality IndexLevels of Health
Concern
Good
Moderate
Unhealthy for Groups
Unhealthy
Very Unhealthy
Air pollution is also connected to the development of asthma.10
Asthma rates are higher in polluted areas. Young children are particularly vulnerable when they live in areas with bad air quality.11
This underscores the need to protect the regulations of the Clean Air Act and to enact policies that combat climate change. As temperatures rise, the risk of wildfires increases, and high-pressure weather systems trap ozone and other pollutants closer to the ground.
“Last fall we had wildfires in our area, and the smoke got trapped in our valley, and the air quality plummeted,” said Kathy Przywara, AAFA’s Community Director who lives near San Jose, California (overall #97 on Asthma Capitals). “I couldn’t go outside and do any activities that I would normally enjoy because my asthma made it very difficult to breathe the polluted air. I had to keep my windows closed – even though the weather was hot and we have no air conditioning.”
10. Gehring, U., Wijga, A. H., Hoek, G., Bellander, T., Berdel, D., Brüske, I., . . . Brunekreef, B. (2015). Exposure to air pollution and development of asthma and rhinoconjunctivitis throughout childhood and adolescence: A population-based birth cohort study. The Lancet Respiratory Medicine,3(12), 933-942. doi:10.1016/s2213-2600(15)00426-9
11. The Effect of Air Pollution on Lung Development from 10 to 18 Years of Age. (2005). New England Journal of Medicine,352(12), 1276-1276. doi:10.1056/nejm200503243521230

Risk Factors That Can Worsen Asthma or Influence Asthma Rates
asthmacapitals.com©2018 Asthma and Allergy Foundation of America
20
Air quality can limit outdoor activities for those with asthma because asthmatic lungs are more sensitive to poor air quality. April Behounek lives on the northwest side of Milwaukee, Wisconsin (overall #14 on Asthma Capitals), on the bank of Lake Michigan.
She loves riding the miles of bike trails around the lake and throughout the city. But outdoor fitness activities are a challenge because of her asthma.
“When I started to do more fitness activities, like riding bikes, I felt like my asthma was being impacted differently here in the city than when I’d go on a bike ride in my hometown,” shared April. “I’m assuming the pollution in the city contributes to having to use my rescue inhaler when I’m exercising outside.”
Weather permitting, you can find April on the bike trails almost every day. She rides 8-9 miles a day. Despite her asthma, she loves to be outdoors and loves to ride her bike.
“The biggest impact living in Milwaukee has on my asthma is the air quality,” says April. “I enjoy outdoor activities, and I know that the poor air quality negatively impacts my asthma as I feel better when I visit other communities and engage in the same activities.”
For each city included in the 2018 Asthma Capitals, AAFA obtained scores for high ozone and high particle pollution days for each respective county. Then AAFA, took an “average” of the two measures for the final air quality score.

Risk Factors That Can Worsen Asthma or Influence Asthma Rates
asthmacapitals.com©2018 Asthma and Allergy Foundation of America
21
POLLEN
Substances that cause allergies (allergens) can trigger asthma. If you inhale something you are allergic to, you may experience asthma symptoms. Pollen is a common allergen that can cause allergic asthma (asthma triggered by allergens). An allergist can confirm whether you or your child have allergies, usually with a skin or blood test.
If pollen is an asthma trigger for you or your child, there are certain actions you can take to reduce, or minimize, your exposure to pollen. These include:
• Limiting outdoor activities when pollen counts are high
• Keeping windows closed during pollen season and using central air conditioning with a CERTIFIED asthma & allergy friendly® filter
• Bathing and shampooing before bed
• Changing and washing clothing after outdoor activities
These cities have high pollen counts, which can be a risk factor for asthma:
Pollen Ranking
Metropolitan Area
Overall Asthma Capital
National Ranking
1 McAllen, TX 100
2 San Antonio, TX 96
3 Richmond, VA 2
4 Bridgeport, CT 49
5 Hartford, CT 19
6 New Haven, CT 24
7 Springfield, MA 1
8 Oklahoma City, OK 34
9 Wichita, KS 45
10 Syracuse, NY 54
11 Providence, RI 35
12 Dayton, OH 3
13 Austin, TX 79
14 Pittsburgh, PA 42
15 El Paso, TX 94
16 Memphis, TN 57
17 Dallas, TX 77
18 Miami, FL 83
19 Grand Rapids, MI 66
20 Las Vegas, NV 73
McAllen, TX
Photo credit of McAllen: Valleyite12 via Wikimedia Commons / Saturated and cropped from original

Risk Factors That Can Worsen Asthma or Influence Asthma Rates
asthmacapitals.com©2018 Asthma and Allergy Foundation of America
22
“Spring started early this year – in February – which means I have a longer season of suffering. Everything around me was blooming – I was driving, and it all hit at once and started with shortness of breath and then I really started to struggle to breathe,” shares Kylie Williams of Miami, FL (overall #83 on Asthma Capitals). “I had a severe asthma attack – the worst I’ve ever had in South Florida.”
Florida has been hit hard with the impacts of climate change. Recent severe hurricanes exposed people to an increased allergen load – mold grew rampant after Hurricane Irma. Debris collection in the state was stalled when Hurricane Maria devastated Puerto Rico, shifting much of the relief
and collections efforts to the island. With recovery still going on in Texas from Hurricane Harvey, Florida faced a shortage of personnel equipped to collect the debris and repair homes. Rotting debris became a considerable source of mold as it littered communities in the months after Irma. And many homeowners have struggled to find contractors to repair damage, allowing mold to thrive even more in the humid climate.
“It’s really aggravating. Everything I want to do here in Miami is outdoors – the allergies take away from my life because I can’t do the things I want to when my allergies and asthma flare. Exercise – want to do it outside but can’t. Going to the beach – want to do but can’t. Festivals, concerts, the list goes on. I’m young and want to socialize,” Kylie shares. “My friends will invite me to outdoor restaurants, and this even impacts whether I can eat out with my friends. Do I want to hang out with friends, or do I want to breathe?”
Allergies and asthma not only affect social and emotional well-being, but also physical and mental health, leading to frustration and grief. “When the pollen is bad, I can’t breathe, my nose is so runny it’s embarrassing, and my eyes are gougable,” Kylie, age 28, said. “I want to rip my eyes out of my face. I know it sounds vulgar, but it’s how I feel. And I know there are other people with allergies that know exactly what I’m talking about.”
For each city included in the 2018 Asthma Capitals, AAFA obtained a comprehensive index of the population at risk of being affected by airborne allergenic pollen, derived from actual pollen counts, allergy prevalence for each pollen type and related factors.
AAFA also releases annual Allergy Capitals reports for spring and fall allergies. Visit allergycapitals.com to learn how your city ranks and what to do if you live in an Allergy Capital and have pollen allergies.
In 2018, McAllen, Texas, ranked #1 on the Spring Allergy Capitals™ report.
Allergy CapitalsSpring 2018

Risk Factors That Can Worsen Asthma or Influence Asthma Rates
asthmacapitals.com©2018 Asthma and Allergy Foundation of America
23
High pollen can often send those with allergic asthma indoors. Shari Duncan of Detroit, Michigan (overall #16 on Asthma Capitals), has allergic asthma triggered by pollen. High pollen in Michigan can make her asthma flare.
“When the pollen gets to flying, I turn on the air conditioner and keep the windows up,” Shari says. “Sometimes I have to miss work because I can’t step out the door. When the pollen gets really bad, I just don’t go out. Period.”
ALLERGEN CONTROL
Asthma management involves taking medicine and avoiding your asthma triggers. Your asthma triggers may include irritants like air pollution or allergens like pollen.
Other allergens can also trigger asthma. Dust mites, cockroach debris, mouse dander, pet dander and mold can all trigger asthma. There are things you can do to control your environment and reduce your exposure to allergens and irritants.
AAFA can help you find products and services more suitable for you. The asthma & allergy friendly® Certification Program sets high standards and then scientifically tests products to see if they meet those standards. Only products and services that pass every test will receive this mark:

Risk Factors That Can Worsen Asthma or Influence Asthma Rates
asthmacapitals.com©2018 Asthma and Allergy Foundation of America
24
ASTHMA QUICK-RELIEF MEDICINE USE
Both long-term control medicines (sometimes called “controllers”) and quick-relief medicines (sometimes called “rescue inhalers”) may be necessary for optimal asthma management. Quick-relief medicines help relieve asthma symptoms as they are happening. These medicines act fast to relax tight muscles around your airways. This allows the airways to open up so air can flow through them. The high use of a quick-relief medicine (like an albuterol inhaler) is an indication there is a high number of asthma episodes.
If you use quick-relief medicines more than two days a week, this is a sign that your asthma is not under control. Talk with your health care provider about your asthma care plan and if you need to make changes.
Most quick-relief medicines are short-acting beta agonists, anticholinergics or a combination of the two. Short-acting beta agonists (SABAs) relax the smooth muscles around the airways and decrease swelling that blocks airflow. Anticholinergics work similarly to SABAs but are slower. Always work with your doctor to determine which medication is best for you or your child.
Quick-relief medicine use is highest in these cities:
Asthma Quick-Relief Medicine Use
Ranking
Metropolitan Area
Overall Asthma Capital
National Ranking
1 Toledo, OH 10
2 Des Moines, IA 84
3 Dayton, OH 3
4 Fresno, CA 75
5 Omaha, NE 12
6 Cleveland, OH 15
7 Milwaukee, WI 14
8 Knoxville, TN 78
9 Detroit, MI 16
10 New Orleans, LA 25
11 Chattanooga, TN 29
12 Akron, OH 18
13 Syracuse, NY 54
14 Youngstown, OH 7
15 Durham, NC 50
16 Springfield, MA 1
17 McAllen, TX 100
18 Las Vegas, NV 73
19 Wichita, KS 45
20 Tampa, FL 76
Toledo, OH

Risk Factors That Can Worsen Asthma or Influence Asthma Rates
asthmacapitals.com©2018 Asthma and Allergy Foundation of America
25
April Behounek of Milwaukee, Wisconsin (overall #14 on Asthma Capitals), uses long-term control medicines to help prevent and control her asthma symptoms. Every day she uses her controller inhaler, both in the morning and at night, and takes an oral allergy medicine. But there is rarely a day that April does not use her quick-relief inhaler, which is a sign that her asthma is not well-controlled. She suspects this is due to the air pollution in her area because she has asthma flare-ups when she exercises outside in her city. Her asthma doesn't flare as badly when she goes to areas where there is cleaner air.
For each city included in the 2018 Asthma Capitals, AAFA obtained the number of quick-relief medication prescriptions per patient prevalence, for the most recent full calendar year, for the MSA.
INHALERS (also called puffers)
There are two types of inhalers: metered dose inhaler (MDI) and dry powder inhaler (DPI).
• Metered dose inhalers use an aerosol canister inserted into a plastic mouthpiece to deliver a short burst of medicine.
• Dry powder inhalers deliver medicine as a dry powder using a special inhaler.
For inhalers to work well, you must use them correctly. But more than half of all people who use inhalers don’t use them properly. Ask your doctor or nurse to watch you and check your technique.
Remember, if you use your quick-relief inhaler more than twice per week, this is a sign that your asthma is not under control. Talk with your health care provider about
updating your asthma care plan.

Risk Factors That Can Worsen Asthma or Influence Asthma Rates
asthmacapitals.com©2018 Asthma and Allergy Foundation of America
26
ASTHMA LONG-TERM CONTROLLER MEDICINE USE
Both controller and quick-relief medications may be necessary for optimal asthma management. Controller medications help prevent and control asthma symptoms. You may need to take this type of medicine every day for best results. There are several kinds of controller medications, including inhaled corticosteroids (ICS). ICS medicines prevent and reduce airway swelling, as well as reduce mucus in the lungs. Combination inhaled medicines combine ICS along with a long- acting beta agonist (LABA). LABAs open the airways by relaxing the smooth muscles around the airways. Other types of controller medicines include biologics or leukotriene modifiers. Always work with your doctor to determine which medication is best for you or your child.
Asthma controller medicines are prescribed for persistent cases of asthma. A high number of these prescriptions may indicate that a city’s residents have more severe or uncontrolled cases of asthma.
These cities have the highest rates of asthma controller medicine use:
Asthma Long-Term Controller
Medicine Use Ranking
Metropolitan Area
Overall Asthma Capital
National Ranking (*Tie)
1 Omaha, NE 12*
2 Toledo, OH 10
3 Dayton, OH 3
4 Louisville, KY 5
5 Richmond, VA 2
6 Birmingham, AL 8
7 Milwaukee, WI 14
8 Hartford, CT 19
9 Winston-Salem, NC 17
10 Youngstown, OH 7
11 Cincinnati, OH 6
12 Akron, OH 18
13 Worcester, MA 12*Omaha, NE

Risk Factors That Can Worsen Asthma or Influence Asthma Rates
asthmacapitals.com©2018 Asthma and Allergy Foundation of America
27
For those with persistent asthma, controller medicines are essential to keeping symptoms under control. But they must be used regularly and consistently. Shari Duncan of Detroit, Michigan (overall #16 on Asthma Capitals) has had to manage not only her controller medication use, but also that of her six children who all also have asthma.
Shari takes daily asthma controller medicines, does nebulizer breathing treatments and works hard to avoid her biggest asthma triggers. She also uses her quick-relief inhaler about once or twice a week. In spite of these efforts, Shari is hospitalized for asthma four to six times a year.
As a working mom, Shari would often get up at 5 a.m. just to make sure everyone got their medicines. At night, she and her late husband “would go around to each kid in their bed, listen to see if they were wheezing and touch them to make sure they were breathing.”
For each city included in the 2018 Asthma Capitals, AAFA obtained the number of controller medication prescriptions per patient prevalence, for the most recent full calendar year, for the MSA.
BIOLOGICS
Biologics are shots or infusions given every few weeks. They work by targeting a cell or protein in your body to prevent airway inflammation. They are usually only prescribed if other asthma medicines have not controlled your asthma. Talk with your asthma specialist about this option to decide if this treatment may be right for you.

Risk Factors That Can Worsen Asthma or Influence Asthma Rates
asthmacapitals.com©2018 Asthma and Allergy Foundation of America
28
SMOKING LAWS
Some believe that smoking is probably the single largest cause of preventable deaths in the U.S. Smoking is not only harmful to the person doing the smoking but is also harmful to those nearby who inhale secondhand smoke or come into contact with thirdhand smoke. Many of the chemicals and substances in secondhand and thirdhand smoke can irritate the lungs and airways.
Secondhand smoke refers to the smoke that is released in the air when a smoker exhales, as well as the smoke released from a burning cigarette, cigar or pipe.
Thirdhand smoke is residue from tobacco smoke. When a cigarette is smoked, chemicals in the smoke stick to surfaces and dust for months after the smoke is gone. The chemicals in the residue then react to other pollutants in the air, like ozone, to create harmful particles you can easily inhale.12
Many state and local jurisdictions have passed laws that prohibit smoking in some places. These places may include workplaces, restaurants, hotels, parks and transit systems. You can research your state or county to see what the laws are in your local area.
These cities do the least to protect their residents and visitors from tobacco smoke and have one or fewer smoke-free laws:
Fewest Anti-Smoking
Laws Ranking
Metropolitan Area
Overall Asthma Capital
National Ranking
1 Augusta, GA 31
2 Chattanooga, TN 29
3 Knoxville, TN 78
4 Memphis, TN 57
5 Nashville, TN 58
6 Tulsa, OK 44
7 Allentown, PA 27
8 Atlanta, GA 55
9 Harrisburg, PA 53
10 Oklahoma City, OK 34
11 Richmond, VA 2
12 Virginia Beach, VA 22
For each city included in the 2018 Asthma Capitals, AAFA obtained data on whether there was a 100% smoking ban for cars, workplaces, restaurants, bars, multi-unit housing or public parks.
12. Emerging Evidence and Arguments for a Multidisciplinary Research Agenda. Environmental Health Perspectives, 119(9), 1218–1226. http://doi.org/10.1289/ehp.1103500
What can cities do to help protect people from the harmful effects of tobacco smoke? Strengthen tobacco smoke protection for residents by making additional smoke-free zones (like public parks). Support smoking cessation programs. Encourage anti-tobacco campaigns in schools.
What can states do to help protect people from the harmful effects of tobacco smoke? Pass clean air laws that create smoke-free zones for the public. All indoor, public buildings should be smoke-free, and a buffer near entrances/exits should also be provided (e.g., no smoking within 25 feet of a building door or window). Fund smoking cessation programs.

Risk Factors That Can Worsen Asthma or Influence Asthma Rates
asthmacapitals.com©2018 Asthma and Allergy Foundation of America
29
ACCESS TO SPECIALISTS
One of the most important parts of asthma management is working with your health care team to create an asthma plan that keeps your asthma under control. In addition to a primary care doctor, a person with asthma might also need to be in the care of a specialist. Pulmonologists, allergists and immunologists, for example, can provide specialized care for people with asthma and may have more experience treating patients with severe asthma than a primary care physician.
Access to appropriate medical care is dependent upon many different factors, including social determinants of health such as socio-economic status, which often correlates to insurance status. However, it is also determined by whether there are specialists practicing in your local area or community. Some neighborhoods may have fewer practicing specialists compared to others. The lack of availability of nearby asthma specialists may be associated with poor asthma outcomes. If you or your child with asthma need to be under the care of an asthma specialist, it is important to talk to your primary care doctor to see what options are nearby.
These cities have the fewest asthma specialists per patient:
Fewest Specialists
RankingMetropolitan Area
Overall Asthma Capital
National Ranking
1 Virginia Beach, VA 22
2 Ogden, UT 80
3 Riverside, CA 86
4 Washington, DC 23
5 Atlanta, GA 55
6 New York, NY 20
7 Bakersfield, CA 85
8 Dallas, TX 77
9 McAllen, TX 100
10 Scranton, PA 21
11 Detroit, MI 16Virginia Beach, VA

Risk Factors That Can Worsen Asthma or Influence Asthma Rates
asthmacapitals.com©2018 Asthma and Allergy Foundation of America
30
Living in an area where there are fewer specialists can mean traveling long distances for care. This can be a burden on personal finances and time, especially when frequent trips are needed. And it may take months to get an appointment.
The Morleys of Philadelphia, Pennsylvania (overall #4 on Asthma Capitals), travel 45 minutes to visit their son’s allergist and pulmonologist. There are only a few in the Philadelphia area that treat children.
“It gets expensive paying for the gas and tolls to visit frequently when trying new treatments,” explains Joey Morley’s mother, Carlene.
Lynn Johnson of Birmingham, Alabama (overall #8 on Asthma Capitals), has had challenges just trying to make an appointment. “In the last one-and-a-half years I called every pulmonologist office in town,” Lynn states. “The shortest amount of time to get in was 11 months. I was told that if I had a problem in the meantime, I should go to the emergency room.”
For each city included in the 2018 Asthma Capitals report, AAFA obtained an estimate of the number of certified pulmonologists, allergists and immunologists in each city and respective county, and selected the larger of the two. Then, AAFA calculated the total number of specialists per 10,000 asthma patients.
WHAT CAN CITIES DO TO HELP THIS ISSUE?
Recruit allergists and pulmonologists to work
in your city.
WHAT CAN STATES DO TO HELP THIS ISSUE?
Form a task force or asthma coalition to outline how to support asthma
treatment in your state.
asthmacapitals.com©2018 Asthma and Allergy Foundation of America
31
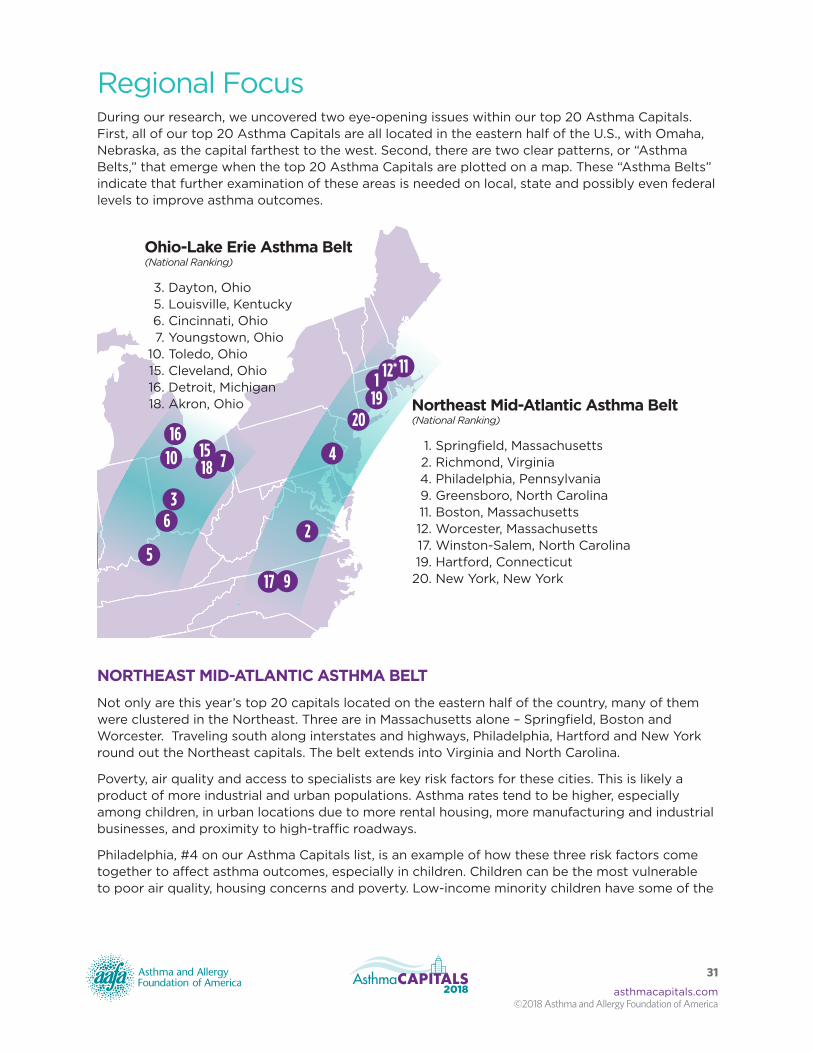
Regional FocusDuring our research, we uncovered two eye-opening issues within our top 20 Asthma Capitals. First, all of our top 20 Asthma Capitals are all located in the eastern half of the U.S., with Omaha, Nebraska, as the capital farthest to the west. Second, there are two clear patterns, or “Asthma Belts,” that emerge when the top 20 Asthma Capitals are plotted on a map. These “Asthma Belts” indicate that further examination of these areas is needed on local, state and possibly even federal levels to improve asthma outcomes.
11119
12*
2
3
4
5
6
7
8
917
1016
12*
141518
20Northeast Mid-Atlantic Asthma Belt (National Ranking)
1. Springfield, Massachusetts 2. Richmond, Virginia 4. Philadelphia, Pennsylvania 9. Greensboro, North Carolina 11. Boston, Massachusetts 12. Worcester, Massachusetts 17. Winston-Salem, North Carolina 19. Hartford, Connecticut 20. New York, New York
Ohio-Lake Erie Asthma Belt (National Ranking)
3. Dayton, Ohio 5. Louisville, Kentucky 6. Cincinnati, Ohio 7. Youngstown, Ohio 10. Toledo, Ohio 15. Cleveland, Ohio 16. Detroit, Michigan 18. Akron, Ohio
NORTHEAST MID-ATLANTIC ASTHMA BELT
Not only are this year’s top 20 capitals located on the eastern half of the country, many of them were clustered in the Northeast. Three are in Massachusetts alone – Springfield, Boston and Worcester. Traveling south along interstates and highways, Philadelphia, Hartford and New York round out the Northeast capitals. The belt extends into Virginia and North Carolina.
Poverty, air quality and access to specialists are key risk factors for these cities. This is likely a product of more industrial and urban populations. Asthma rates tend to be higher, especially among children, in urban locations due to more rental housing, more manufacturing and industrial businesses, and proximity to high-traffic roadways.
Philadelphia, #4 on our Asthma Capitals list, is an example of how these three risk factors come together to affect asthma outcomes, especially in children. Children can be the most vulnerable to poor air quality, housing concerns and poverty. Low-income minority children have some of the

asthmacapitals.com©2018 Asthma and Allergy Foundation of America
32
highest asthma rates of any group in the U.S. There are many factors involved, but unmaintained buildings and insurance issues can have a negative effect on families. Dr. Bryant-Stephens, who treats many children in Philadelphia with asthma, has seen the effects of these factors on children first-hand.
“Most of the families are renters and find it difficult to control their environment and often have to fight for their tenant rights to an adequate dwelling,” says Dr. Bryant-Stephens. “In addition, the school buildings are equally old in these neighborhoods, resulting in school buildings in need of major repairs with no resources to fix them. Limited community resources in mental health also contribute to the overall burden of asthma on the families. In addition, the ability of insurers to change their asthma medication formulary whenever they want causes much confusion and distrust of medical asthma management.”
Educating families who manage asthma is one approach to reducing rates and morbidity in these areas. Through the Community Asthma Prevention Program at Children’s Hospital of Philadelphia, Dr. Bryant-Stephens and her colleagues work to reduce asthma rates through free education. But on a community level, she feels additional methods are needed to help ease the burden of asthma for many urban residents.
In homes, she recommends an approach to “educate families on how to make their homes asthma friendly, including the implementation of integrated pest management strategies, make the home a ‘no-smoking’ zone, remove sources of dust from the child’s bedroom, and use ‘green cleaners’ and low-VOC materials. Equip renters with tools they need to insist on their right to have adequate asthma-friendly homes.”
Schools can do their part to reduce asthma rates as well. Asthma affects school performance and is the top reason for missed school days. And school buildings can be a source of triggers too. Dr. Bryant-Stephens recommends the following school initiatives:
• Systemwide assessment of the built environment to seal it while maintaining proper ventilation in schools and workplaces
• Private-public partnerships with the schools to make needed repairs
• Partnership with housing repair agencies to implement standard repairs that reduce common triggers
• Passing policies to ensure that any new public housing is asthma-safe
• Utilization of community health workers in both homes and schools to close gaps in asthma care
Philadelphia, PA

asthmacapitals.com©2018 Asthma and Allergy Foundation of America
33
Unfortunately, asthma is not a personal issue. When factors such as air quality and housing come into play, it becomes a community issue. Communities will have to work together with its residents to come up with solutions.
“I’ve been doing this for 20 years and I am embarrassed to say that the disparities in asthma outcomes still exist in asthma mortality and some indices of asthma morbidity,” says Dr. Bryant- Stephens. “If there are no changes, children will continue to die from what is a controllable disease. No child should die from asthma.”
Tyra Bryant-Stephens, M.D., is founder and Medical Director of the Community Asthma Prevention Program (CAPP) at Children’s Hospital of Philadelphia. She is also a faculty member at PolicyLab at Children’s Hospital of Philadelphia. She founded CAPP to improve the health and well-being of children with asthma through free community asthma classes for parents and their children. Dr. Bryant-Stephens received her medical degree from the Bowman Gray School of Medicine at Wake Forest University and her residency in pediatrics from the Medical College of Georgia.
OHIO-LAKE ERIE ASTHMA BELT
Six Ohio cities are in the top 20 of our report – Akron, Cincinnati, Cleveland, Dayton, Toledo and Youngstown. Although not in the top 20, Columbus comes in at #26. With so much of Ohio facing poor outcomes, asthma appears to be a widespread concern. Nearby, Detroit, Michigan, and Louisville, Kentucky, appear in this area’s “Asthma Belt.”
Poverty, pollen, air quality and high numbers of medication use are the key risk factors that have placed multiple Ohio cities at the top of our report.
“I think there are several issues that challenge asthmatics in the state of Ohio,” says Kasey Strothman, M.D., Assistant Professor of Pediatrics in the Section of Allergy and Immunology Nationwide Children’s Hospital in Columbus. “For example, patients often have continuous exposure to a variety of triggers in the environment, which can include aeroallergens in susceptible individuals or other irritants like smoke and pollution. Socioeconomic factors also present a variety of challenges. Patients may find themselves in hectic social situations with
Cincinnati, OH

asthmacapitals.com©2018 Asthma and Allergy Foundation of America
34
busy schedules and multiple caregivers. This can lead to difficulty with regard to medication adherence and routine follow-up.”
While Ohio’s poverty rate as a state is on par with the U.S. poverty rate (14.6% vs. 14%), the poverty rates in the Ohio cities on our report are higher, with the exception of Akron.
Poverty rates in Ohio cities:
• Toledo – 19.8% • Youngstown – 18.7% • Cleveland – 18.3% • Dayton – 18.2% • Columbus – 16.6% • Cincinnati – 16% • Akron – 13.7%
Poverty rates among children in these cities are even higher, especially among minority populations. Asthma rates among minorities coincide with these poverty rates. In Ohio overall, 16% of Non-Hispanic black children and 11.9% of Hispanic children have asthma, compared to 4.9% of Non-Hispanic white children.
“Low-income minority children often come from complicated social situations with multiple caregivers and homes,” states Dr. Strothman. “This can lead to poor medication adherence and general confusion or inconsistency regarding day-to-day asthma management. Guardians may also be dealing with several social stressors, such as lack of transportation and inability to miss work, both of which make routine follow-up more difficult. Lastly, with lower education levels come a limited understanding of asthma itself, including why adherence to various medications is so important and why avoidance of triggers must be a prioritized.”
How can Ohio improve asthma outcomes? It will likely require action from these communities, as well as from the state.
According to Dr. Strothman, “On a community and state level, I think we need to continue to target those who are at high risk for poor asthma outcomes. Programs that provide targeted education and access to resources for families will continue to be important. The focus should be on controlling asthma rather than on curing it, with an emphasis on secondary and tertiary prevention. Low-income families have greater rates of diseases, limited access to health care and exposure to the worst environmental conditions. As providers, we have to work with families to overcome these challenges in an individualized fashion.”
Kasey Strothman, MD is Co-Director of the Complex Allergy and Asthma Clinic at Nationwide Children’s Hospital, where she is also on faculty as an Assistant Professor of Pediatrics. This specialty clinic was created to treat children with difficult to control asthma, frequent ED visits, non-adherence and complex psychosocial stressors. Dr. Strothman received her medical degree from the University of Louisville School of Medicine and completed her residency in the Department of Pediatrics at the University of Louisville and Kosair Children’s Hospital.

asthmacapitals.com©2018 Asthma and Allergy Foundation of America
35
The Top 100 Most Challenging Places to Live With Asthma
NATIONAL RANKINGS ■ Worse Than Average ▲ Average ● Better Than Average (Factors are not weighted equally)
2018 National Rankings
(*Tie)
Overall Metropolitan AreaTotal Score (Avg. 61.84)
Subtotal: Estimated Asthma
Prevalence
Subtotal: Crude
Death Rate for Asthma
Subtotal: ER Visits
for Asthma
1 ■ Springfield, MA 100.00 ■ ▲ ■
2 ■ Richmond, VA 81.22 ▲ ■ ■
3 ■ Dayton, OH 77.31 ▲ ▲ ■
4 ■ Philadelphia, PA 75.76 ■ ■ ▲
5 ■ Louisville, KY 75.43 ■ ▲ ▲
6 ■ Cincinnati, OH 74.14 ▲ ■ ■
7 ■ Youngstown, OH 73.31 ▲ ▲ ■
8 ■ Birmingham, AL 72.31 ■ ■ ▲
9 ■ Greensboro, NC 71.87 ▲ ▲ ■
10 ▲ Toledo, OH 71.34 ▲ ■ ■
11 ▲ Boston, MA 70.61 ■ ▲ ▲
12* ▲ Worcester, MA 70.23 ■ ▲ ▲
12* ▲ Omaha, NE 70.23 ● ■ ■
14 ▲ Milwaukee, WI 70.10 ▲ ▲ ■
15 ▲ Cleveland, OH 69.84 ▲ ▲ ■
16 ▲ Detroit, MI 69.63 ▲ ■ ▲
17 ▲ Winston-Salem, NC 69.58 ▲ ▲ ■
18 ▲ Akron, OH 69.36 ▲ ▲ ■
19 ▲ Hartford, CT 69.08 ■ ▲ ▲
20 ▲ New York, NY 69.00 ▲ ■ ▲
21 ▲ Scranton, PA 68.78 ■ ■ ▲
22 ▲ Virginia Beach, VA 68.74 ▲ ● ■
23 ▲ Washington, DC 68.54 ■ ▲ ▲
24 ▲ New Haven, CT 68.44 ■ ▲ ▲
25 ▲ New Orleans, LA 68.36 ▲ ■ ▲
26 ▲ Columbus, OH 68.05 ▲ ▲ ■
27 ▲ Allentown, PA 67.76 ■ ● ▲
28 ▲ Spokane, WA 67.43 ▲ ■ ▲
29 ▲ Chattanooga, TN 67.41 ▲ ▲ ■
30 ▲ St. Louis, MO 66.96 ▲ ▲ ▲
31 ▲ Augusta, GA 66.67 ▲ ▲ ▲
32 ▲ Little Rock, AR 66.40 ▲ ▲ ▲

asthmacapitals.com©2018 Asthma and Allergy Foundation of America
36
NATIONAL RANKINGS ■ Worse Than Average ▲ Average ● Better Than Average (Factors are not weighted equally)
2018 National Rankings
(*Tie)
Overall Metropolitan AreaTotal Score (Avg. 61.84)
Subtotal: Estimated Asthma
Prevalence
Subtotal: Crude
Death Rate for Asthma
Subtotal: ER Visits
for Asthma
33 ▲ Baltimore, MD 66.05 ▲ ▲ ▲
34 ▲ Oklahoma City, OK 65.91 ▲ ▲ ▲
35 ▲ Providence, RI 65.75 ■ ● ▲
36 ▲ Tucson, AZ 65.70 ▲ ■ ▲
37 ▲ Indianapolis, IN 65.66 ▲ ▲ ▲
38 ▲ Jackson, MS 65.47 ▲ ■ ▲
39 ▲ Portland, OR 65.45 ■ ▲ ●
40 ▲ Buffalo, NY 65.44 ▲ ▲ ▲
41 ▲ Kansas City, MO 65.42 ▲ ▲ ▲
42 ▲ Pittsburgh, PA 65.21 ■ ▲ ▲
43 ▲ Chicago, IL 64.70 ▲ ■ ▲
44 ▲ Tulsa, OK 64.65 ▲ ▲ ▲
45 ▲ Wichita, KS 64.09 ▲ ▲ ▲
46 ▲ Charleston, SC 64.05 ▲ ▲ ■
47 ▲ Phoenix, AZ 63.59 ▲ ▲ ▲
48 ▲ Greenville, SC 63.21 ▲ ▲ ▲
49 ▲ Bridgeport, CT 63.20 ■ ▲ ●
50 ▲ Durham, NC 62.94 ▲ ● ▲
51 ▲ Albany, NY 62.90 ▲ ▲ ▲
52 ▲ Albuquerque, NM 62.55 ▲ ▲ ▲
53 ▲ Harrisburg, PA 62.43 ■ ▲ ●
54 ▲ Syracuse, NY 62.21 ▲ ▲ ▲
55 ▲ Atlanta, GA 61.74 ▲ ▲ ●
56 ▲ Rochester, NY 61.45 ▲ ● ▲
57 ▲ Memphis, TN 60.98 ▲ ■ ●
58 ▲ Nashville, TN 60.76 ▲ ▲ ▲
59 ▲ Madison, WI 60.42 ▲ ▲ ▲
60 ▲ Denver, CO 60.17 ▲ ▲ ▲
61 ▲ Stockton, CA 59.94 ● ▲ ■
62 ▲ Columbia, SC 59.77 ▲ ▲ ▲
63 ▲ Charlotte, NC 58.76 ▲ ● ▲
64 ▲ Raleigh, NC 58.46 ▲ ● ▲
65 ▲ Sacramento, CA 58.27 ● ▲ ▲
66 ▲ Grand Rapids, MI 57.57 ▲ ● ▲
67 ▲ Seattle, WA 56.90 ▲ ▲ ▲

asthmacapitals.com©2018 Asthma and Allergy Foundation of America
37
2018 National Rankings
(*Tie)
Overall Metropolitan AreaTotal Score (Avg. 61.84)
Subtotal: Estimated Asthma
Prevalence
Subtotal: Crude
Death Rate for Asthma
Subtotal: ER Visits
for Asthma
68 ▲ Jacksonville, FL 56.86 ▲ ■ ▲
69 ▲ San Francisco, CA 56.80 ● ▲ ▲
70 ▲ Salt Lake City, UT 56.42 ▲ ▲ ●
71 ▲ Boise, ID 56.07 ▲ ● ▲
72 ▲ Daytona Beach, FL 55.64 ● ▲ ▲
73 ▲ Las Vegas, NV 54.97 ● ● ▲
74 ▲ Colorado Springs, CO 54.50 ▲ ▲ ●
75 ▲ Fresno, CA 54.18 ● ▲ ▲
76 ▲ Tampa, FL 53.90 ▲ ▲ ▲
77 ▲ Dallas, TX 53.76 ● ▲ ▲
78 ▲ Knoxville, TN 53.69 ▲ ● ●
79 ▲ Austin, TX 53.66 ● ● ▲
80* ▲ Ogden, UT 53.36 ▲ ▲ ●
80* ▲ Sarasota, FL 53.36 ● ▲ ▲
82 ▲ Lakeland, FL 52.55 ● ▲ ▲
83 ▲ Miami, FL 52.37 ● ▲ ▲
84 ▲ Des Moines, IA 52.04 ● ● ▲
85 ● Bakersfield, CA 51.17 ● ▲ ▲
86 ● Riverside, CA 51.10 ● ● ▲
87 ● San Diego, CA 51.07 ● ▲ ▲
88 ● Oxnard, CA 50.95 ● ▲ ●
89 ● Baton Rouge, LA 50.92 ▲ ● ▲
90 ● Orlando, FL 50.83 ▲ ● ▲
91 ● Palm Bay, FL 50.33 ● ▲ ▲
92 ● Los Angeles, CA 49.64 ● ▲ ●
93 ● Provo, UT 49.50 ▲ ▲ ●
94 ● El Paso, TX 49.07 ● ● ▲
95 ● Minneapolis, MN 48.82 ● ▲ ●
96 ● San Antonio, TX 48.66 ● ● ▲
97 ● San Jose, CA 47.74 ● ▲ ●
98 ● Cape Coral, FL 45.43 ● ● ●
99 ● Houston, TX 45.25 ● ● ●
100 ● McAllen, TX 43.90 ● ● ●
NATIONAL RANKINGS ■ Worse Than Average ▲ Average ● Better Than Average (Factors are not weighted equally)

asthmacapitals.com©2018 Asthma and Allergy Foundation of America
38
REGIONAL RANKINGS ■ Worse Than Average ▲ Average ● Better Than Average (Factors are not weighted equally)
NORTHEAST
2018 National Rankings
(*Tie)
Overall
2018 National
Rank (*Tie)
Metropolitan AreaTotal Score (Avg. 61.84)
Subtotal: Estimated Asthma
Prevalence
Subtotal: Crude
Death Rate for Asthma
Subtotal: ER Visits
for Asthma
1 ■ 1 Springfield, MA 100.00 ■ ▲ ■
2 ■ 4 Philadelphia, PA 75.76 ■ ■ ▲
3 ▲ 11 Boston, MA 70.61 ■ ▲ ▲
4 ▲ 12* Worcester, MA 70.23 ■ ▲ ▲
5 ▲ 19 Hartford, CT 69.08 ■ ▲ ▲
SOUTH
2018 National Rankings
(*Tie)
Overall
2018 National
Rank (*Tie)
Metropolitan AreaTotal Score (Avg. 61.84)
Subtotal: Estimated Asthma
Prevalence
Subtotal: Crude
Death Rate for Asthma
Subtotal: ER Visits
for Asthma
1 ■ 2 Richmond, VA 81.22 ▲ ■ ■
2 ■ 5 Louisville, KY 75.43 ■ ▲ ▲
3 ■ 8 Birmingham, AL 72.31 ■ ■ ▲
4 ■ 9 Greensboro, NC 71.87 ▲ ▲ ■
5 ▲ 17 Winston-Salem, NC 69.58 ▲ ▲ ■
MIDWEST
2018 National Rankings
(*Tie)
Overall
2018 National
Rank (*Tie)
Metropolitan AreaTotal Score (Avg. 61.84)
Subtotal: Estimated Asthma
Prevalence
Subtotal: Crude
Death Rate for Asthma
Subtotal: ER Visits
for Asthma
1 ■ 3 Dayton, OH 77.31 ▲ ▲ ■
2 ■ 6 Cincinnati, OH 74.14 ▲ ■ ■
3 ■ 7 Youngstown, OH 73.31 ▲ ▲ ■
4 ▲ 10 Toledo, OH 71.34 ▲ ■ ■
5 ▲ 12* Omaha, NE 70.23 ● ■ ■
WEST
2018 National Rankings
(*Tie)
Overall
2018 National
Rank (*Tie)
Metropolitan AreaTotal Score (Avg. 61.84)
Subtotal: Estimated Asthma
Prevalence
Subtotal: Crude
Death Rate for Asthma
Subtotal: ER Visits
for Asthma
1 ▲ 28 Spokane, WA 67.43 ▲ ■ ▲
2 ▲ 36 Tucson, AZ 65.70 ▲ ■ ▲
3 ▲ 39 Portland, OR 65.45 ■ ▲ ●
4 ▲ 47 Phoenix, AZ 63.59 ▲ ▲ ▲
5 ▲ 52 Albuquerque, NM 62.55 ▲ ▲ ▲
asthmacapitals.com©2018 Asthma and Allergy Foundation of America
39
METHODOLOGY
The 2018 Asthma Capitals™ research and ranking is reported by the Asthma and Allergy Foundation of America (AAFA). The ranking is based on analysis of data from the 100 most populated Metropolitan Statistical Areas (MSAs) in the contiguous 48 states. The methodology has been changed from previous years’ reports, in consultation with Mitchell Grayson M.D., chief of the Division of Allergy and Immunology and a professor of Pediatrics at The Ohio State University College of Medicine, and chairman of AAFA’s Medical Scientific Council; therefore, comparisons to previous reports are not reliable. The three individual factors analyzed for the 2018 rankings are: estimated asthma prevalence; crude death rate from asthma; and emergency department visits due to asthma. For each factor, AAFA used the most recently available calendar year data. Weights are applied to each factor; factors are not weighted equally. Total scores are calculated as a composite of all three factors, and cities are ranked from highest total score (city rank #1) to lowest total score (city rank #100).
ESTIMATED ASTHMA PREVALENCE For each city, AAFA obtained the estimated asthma prevalence for the respective county.
CRUDE DEATH RATE FROM ASTHMA For each city, AAFA obtained the estimated asthma-related crude death rate per 100,000 people for the respective county.
EMERGENCY DEPARTMENT VISITS DUE TO ASTHMA For each MSA, AAFA obtained the total number of emergency department visits where an asthma ICD 10 code was included as a diagnosis.
Data on the following asthma-related risk factors were obtained and analyzed; however, these data did NOT factor into the scores or rankings. Data are from the most recently available calendar year.
RISK FACTORS • Annual air quality – Pollution levels and number of unhealthy outdoor ozone days, scored on a scale of A (best)
to F (worst)• Annual pollen score – A comprehensive index of the population at risk of being affected by airborne allergenic
pollen, derived from actual pollen counts, allergy prevalence for each pollen type, and related factors• Medication use (controller) – Number of controller medication prescriptions per patient prevalence• Medication use (quick-relief) – Number of rescue medication prescriptions per patient prevalence• Number of asthma specialists – Number of board-certified allergists/immunologists and pulmonologists per
patient prevalence • Public smoking laws – Number of “100-percent smoke-free” public smoking bans (e.g., bars, restaurants, workplaces, etc.)• Poverty rate – Estimated population living in poverty• Uninsured rate – Estimated population without health insurance
DATA SOURCES• American Board of Medical Specialties, Specialists Database• American Lung Association, Estimated Prevalence and Incidence of Lung Disease, 2017• American Lung Association, State of the Air, 2017• American Nonsmokers Rights Foundation, States, Commonwealths, and Territories with 100% • Smokefree Laws in all Non-Hospitality Workplaces, Restaurants, and Bars, 2018• Centers for Disease Control and Prevention, WONDER Online Database, Mortality• IQVIA Allergy Activity Notification (AAN) Program Database• IQVIA Emergency Visit Database
IQVIA Medication Database• U.S. Department of Commerce, Bureau of the Census, Metropolitan and Micropolitan Statistical Areas• U.S. Department of Commerce, Bureau of the Census, Small Area Income and Poverty Estimates• U.S. Department of Commerce, Bureau of the Census, Small Area Health Insurance Estimates
asthmacapitals.com©2018 Asthma and Allergy Foundation of America
40
ACKNOWLEDGEMENTS
The 2018 Asthma Capitals™ report is an independent research project by the Asthma and Allergy Foundation of America made possible through support from Sanofi Genzyme and Regeneron.
AAFA would like to thank Dr. Mitch Grayson for serving as an advisor on the methodology, Dr. Tyra Bryant- Stephens and Dr. Kasey Strothman for sharing their insights on how asthma impacts their communities.
We’d also like to thank all of our community members who shared their experiences with us about what it is like to live with asthma and agreed to have their stories profiled in this report.
And lastly, this comprehensive report would not be possible without the team of AAFA staff and consultants: Deidre Washington, PhD, Tanya Bumgardner, Melanie Carver, Nicole Gaghan, Kimberly Rafferty, Sanaz Eftekhari, Matthew Berner, Kathy Przywara, Cynthia Reese, Stacy Cooks, Brenda Silvia-Torma, Jennifer Roeder, Linda Coss
RESOURCES
Get general information on asthma: aafa.org/asthma
Get general information on allergies: aafa.org/allergies
Join our community for news and support: community.aafa.org
Follow our blog for news on asthma and allergies: aafa.org/blog
Find products suitable for those with asthma and allergies through our asthma & allergy friendly® Certification Program: aafa.org/certified
Learn how to improve your indoor air quality: aafa.org/iaq
Learn how to manage pollen allergies: aafa.org/pollen
Find school resources for managing your child’s asthma: aafa.org/school
Download an Asthma Action Plan: aafa.org/asthmaactionplan
AAFA’s Allergy Capitals Report: allergycapitals.com
National Asthma and Allergy Awareness Month: aafa.org/awarenessmonth
Find any allergist or immunologist: allergist.aaaai.org/find
Follow the EPA’s air quality reports: AirNow.gov
Follow daily local pollen counts: Pollen.com
See the air quality of U.S. cities on the American Lung Association’s State of the Air Report: stateoftheair.org
Find out more about Philadelphia’s Community Asthma Prevention Program (CAPP): chop.edu/centers-programs/community- asthma-prevention-program-capp
Made possible by support from: