the morningstar ratingtm methodology for hedge funds
TRANSCRIPT

The Morningstar RatingTM Methodology for Hedge Funds
Morningstar Methodology Paper December 2011 ©2011 Morningstar, Inc. All rights reserved. The information in this document is the property of Morningstar, Inc.
Reproduction or transcription by any means, in whole or in part, without the prior written consent of Morningstar, Inc., is prohibited.

The Morningstar RatingTM Methodology| December 2011
© 2011 Morningstar, Inc. All rights reserved. The information in this document is the property of Morningstar, Inc. Reproduction or transcription by any means, in whole or part, without the prior written consent of Morningstar, Inc., is prohibited. 2
Contents
Introduction Category Classification for Hedge Funds
Unsmoothing Returns
Risk-Adjusted Returns
3
6
6
Theory Expected Utility Theory
Degree of Risk Aversion
Morningstar’s Formulation of Utility Theory
8
10
11
Calculations Overview
Total Return
Unsmoothing Returns
Morningstar Return
Morningstar Risk-Adjusted Return
Morningstar Risk
14
14
17
19
20
20
The Morningstar Rating for Hedge Funds: 3-, 5-, and 10- Year
21
The Overall Morningstar Rating for Hedge Funds
24
Limitations of Morningstar Rating for Hedge Funds
25

The Morningstar RatingTM Methodology| December 2011
© 2011 Morningstar, Inc. All rights reserved. The information in this document is the property of Morningstar, Inc. Reproduction or transcription by any means, in whole or part, without the prior written consent of Morningstar, Inc., is prohibited. 3
Introduction
This document describes the rationale for, and the formulas and procedures used to calculate, the Morningstar RatingTM for hedge funds (commonly called the “star rating”). The Morningstar RatingTM has the following key characteristics:
× The peer group for each fund’s rating is its Morningstar CategoryTM. × Return data are unsmoothed prior to calculating risk-adjusted returns. × Ratings are based on funds’ risk-adjusted returns. Morningstar CategoryTM The Morningstar CategoryTM classifications for Hedge Funds were introduced in 2005 and revised in 2007 to help investors understand the different types of investment strategies used by hedge funds around the world. Hedge fund managers typically focus on specific areas of the market and/or specific trading strategies. For example, some hedge funds buy stocks based on broad economic trends, while others search for arbitrage profits by pairing long and short positions in related securities. The Morningstar categories divide the universe of hedge funds based on these different approaches. Morningstar supports 24 hedge fund categories, which map into seven broad category groupings (Equity, Arbitrage, Debt, Global, Event, Multi-Strategy, and Fund of Funds). These categories and category groupings can help investors make meaningful comparisons between hedge funds. Investors can use these peer groups to identify top-performing funds, evaluate a fund’s performance against its peers, and find similar funds. For example, an investor who wanted to evaluate how well a debt arbitrage fund performed could compare its performance to that of the debt arbitrage category and the broad arbitrage category grouping. Morningstar applies this principle when calculating the Morningstar RatingTM for hedge funds by ranking the risk-adjusted performance of all funds for which there is sufficient data within each category and assigning the rating based on where the funds falls in the resulting distribution. Morningstar assigns a category to each hedge fund based on a review of the hedge fund’s memorandum document, manager-provided investment strategy descriptions and supporting data, conversations with portfolio managers, cluster analysis, stepwise regression, and portfolio statistics acquired via surveys. Currently, Morningstar does not have access to portfolio holdings for hedge funds and must instead rely on other information provided by the asset managers.

The Morningstar RatingTM Methodology| December 2011
© 2011 Morningstar, Inc. All rights reserved. The information in this document is the property of Morningstar, Inc. Reproduction or transcription by any means, in whole or part, without the prior written consent of Morningstar, Inc., is prohibited. 4
Introduction (continued)
Morningstar regularly reviews the category structure and the hedge funds within each category to ensure that the system meets the needs of investors. The driving principles behind the classification system are as follows:
× Individual funds within a category use similar strategies and techniques to create value. × Individual funds within a category can, in general, be expected to behave more similarly to
one another than to funds outside the category. × Categories have enough constituents to form the basis for reasonable peer group
comparisons. (Small categories are permitted when a subset of funds is substantially different than other categories.)
× The distinctions between categories are meaningful to investors and assist in their pursuit of investing goals.
The Morningstar CategoryTM classifications for hedge funds, organized by category groupings, are as follows: Equity 1. Equity, US 2. Small-Cap Equity, US 3. Equity, Developed Asia 4. Equity, Europe 5. Equity, Emerging 6. Equity, Global 7. Equity, Short Arbitrage 8. Arbitrage, Convertible 9. Arbitrage, Equity 10. Arbitrage, Debt Event 11. Event, Corporate Actions 12. Event, Distressed Debt 13. Global, Debt

The Morningstar RatingTM Methodology| December 2011
© 2011 Morningstar, Inc. All rights reserved. The information in this document is the property of Morningstar, Inc. Reproduction or transcription by any means, in whole or part, without the prior written consent of Morningstar, Inc., is prohibited. 5
Introduction (continued)
Global 14. Global, Trend 15. Global, Non-Trend Multi-Strategy 16. Multi-Strategy Fund of Funds 18. Fund of Funds - Debt 19. Fund of Funds - Derivatives 20. Fund of Funds - Equity 21. Fund of Funds - Event 22. Fund of Funds - Multi-strategy 23. Fund of Funds - Non-directional 24. Fund of Funds - Miscellaneous Funds that currently fall in the Fund of Funds - Miscellaneous category will not be rated. Unsmoothing Returns Many hedge funds hold illiquid or difficult-to-price securities. The lack of readily available market prices may give hedge fund managers “flexibility” in how they value such positions when calculating returns that they report to hedge fund databases. Some have argued that hedge fund managers take advantage of this flexibility to “manage” their reported returns.1 Whether or not returns are managed, illiquid securities in a portfolio will often lead to smoothed time series of returns, which have an appearance of lower risk than is really the case. Smoothed returns series exhibit serial correlation. To get a more accurate picture of how much risk a series of hedge fund returns indicates, we apply a statistical “unsmoothing” procedure to remove first order serial correlation and use the resulting unsmoothed series to estimate risk-adjusted return. Risk-Adjusted Return The star rating is based on risk-adjusted performance. However, different aspects of portfolio theory suggest various interpretations of the phrase “risk-adjusted.” As the term is most commonly used, to “risk-adjust” the returns of two funds means to equalize their risk levels through leverage or de-leverage before comparing them. Hence, a fund’s score is not sensitive
1 See “Do Hedge Funds Hedge?” by Clifford Asness, Robert Krail, and John Liew, Journal of Portfolio Management, Fall 2001.

The Morningstar RatingTM Methodology| December 2011
© 2011 Morningstar, Inc. All rights reserved. The information in this document is the property of Morningstar, Inc. Reproduction or transcription by any means, in whole or part, without the prior written consent of Morningstar, Inc., is prohibited. 6
to its proportion of risk-free assets or its amount of leverage. The Sharpe ratio is consistent with this interpretation of risk-adjusted. But the Sharpe Ratio does not always produce intuitive results. If two funds have equal positive average excess returns, the one that has experienced lower return volatility receives a higher Sharpe ratio score. However, if the average excess returns are equal and negative, the fund with higher volatility receives the higher score, because it experienced fewer losses per unit of risk. While this result is consistent with portfolio theory, many investors find it counterintuitive. Unless advised appropriately, they may be reluctant to accept a fund rating based on the Sharpe ratio, or similar measures, in periods when the majority of the funds have negative excess returns. Standard deviation is another common measure of risk, but it is not always a good measure of fund volatility or consistent with investor preferences. First, any risk-adjusted return measure that is based on standard deviation assumes that the fund’s excess returns are normally or lognormally distributed, which is not always the case. Also, standard deviation measures variation both above and below the mean equally. But, investors are generally risk-averse and dislike downside variation more than upside variation. Morningstar gives more weight to downside variation when calculating Morningstar Risk-Adjusted Return and does not make any assumptions about the distribution of excess returns. The other commonly accepted meaning of “risk-adjusted” is based on assumed investor preferences. Under this approach, higher return is “good” and higher risk is “bad” under all circumstances, without regard to how these two outcomes are combined. Hence, when grading funds, return should be rewarded and risk penalized in all cases. The Morningstar Risk-Adjusted Return measure described in this document has this property.
The Morningstar RatingTM Methodology| December 2011
© 2011 Morningstar, Inc. All rights reserved. The information in this document is the property of Morningstar, Inc. Reproduction or transcription by any means, in whole or part, without the prior written consent of Morningstar, Inc., is prohibited. 7
Theory
Expected Utility Theory Morningstar Risk-Adjusted Return (MRAR) is motivated by expected utility theory, according to which an investor ranks alternative portfolios using the mathematical expectation of a function (called the utility function) of the ending value of each portfolio. This is a helpful framework to model decision-making under uncertainty. Let W be the ending value of a portfolio being considered and u(.) be the investor’s utility function. The expected utility of the portfolio is E[u(W)]. The form of the utility function that is used often in portfolio theory has the following characteristics. 1) More expected wealth is always better than less expected wealth.
This means that the utility function must always be positively sloped, so u’(.)>0. 2) The utility function must imply risk aversion and risk is always penalized.
The investor prefers a riskless portfolio with a known end-of-period value to a risky portfolio with the same expected value. For example, a fund that produces a steady 2% return each month is more attractive than a fund that has volatile monthly returns that average out to 2% per month. This can be written as:
[1] u(E[W])>E[u(W)]
From probability theory, it follows that this can be true only if u(.) is everywhere a concave function, so u’’(.)<0.
3) No particular distribution of excess returns is assumed.
Expected utility theory does not rely on any assumptions about whether a fund’s returns are normally or lognormally distributed. This is in contrast to other measures of risk-adjusted return that use standard deviation or variance as the main measure of risk. While many funds’ returns are approximately lognormally distributed, utility theory will also work for those that are not, such as funds that use extensive options strategies.

The Morningstar RatingTM Methodology| December 2011
© 2011 Morningstar, Inc. All rights reserved. The information in this document is the property of Morningstar, Inc. Reproduction or transcription by any means, in whole or part, without the prior written consent of Morningstar, Inc., is prohibited. 8
Theory (continued)
4) The investor’s beginning-of-period wealth has no effect on the ranking of portfolios. It is reasonable to assume that the investor’s risk aversion does not change with the level of investor wealth, i.e., that more wealthy individuals are not universally more or less risk-averse than less wealthy individuals. Individuals with the same attitudes toward risk and the same opportunity set will choose the same investments, regardless of their level of wealth.
One form of a utility function that has these characteristics and that is used often in portfolio theory is called constant relative risk aversion. Relative risk aversion (RRA) describes the degree to which wealth affects an investor’s level of risk aversion, and this is measured based on the shape of the utility function, with respect to wealth:
[2] By assuming that RRA is a constant value (i.e., the level of wealth will not change the investor’s attitude toward risk), the equations for the utility function can be written as follows: [3] where is a parameter that describes the degree of risk aversion, specifically, RRA(.) = +1. Because end-of-period wealth (W) is a function of beginning wealth and total return, these equations can be rewritten as follows, where there is a certain level of utility associated with each level of total return.
[4]
where
W0 = beginning of period wealth
TR = total return (in decimal form) on the portfolio being evaluated so that W = W0 (1+TR)
The value of W0 does not affect the curvature of utility as a function of TR, and so it does not affect how the investor ranks portfolios.
Wu"(W)
RRA(W)u'(W)
-W- -1, 0
u(W)
ln(W) 0
-0
00
W u(1 TR) -1, 0u(W (1 TR))
ln(W ) u(1 TR) 0

The Morningstar RatingTM Methodology| December 2011
© 2011 Morningstar, Inc. All rights reserved. The information in this document is the property of Morningstar, Inc. Reproduction or transcription by any means, in whole or part, without the prior written consent of Morningstar, Inc., is prohibited. 9
Theory (continued)
Degree of Risk Aversion Gamma () represents the degree of risk aversion. In theory, it can be any number of values. When is less then –1, the investor is risk-loving, rather than risk-averse. This investor might be indifferent between a steady fund that always earns 2.5% each month and a volatile fund that is expected to earn 2% on average each month. This investor likes risk. When is –1, the degree of risk aversion is zero, meaning that the investor is indifferent between a riskless choice and a risky choice as long as the arithmetic average expected return is the same. This investor is indifferent between a steady fund that always earns 2% per month and a volatile fund that is expected to earn 2% on average (e.g., equal likelihood of –4%, 2%, or 8% each month), even though the volatile fund could lose money. When is 0, the investor is indifferent between a riskless choice and a risky choice as long as the geometric average expected return is the same. This investor is indifferent between a steady fund that always earns 1.88% and a volatile fund is expected to earn 2% on average, with an equal likelihood of –4%, 2%, or 8% each month. (The geometric average of those volatile expected returns is 1.88%.) The risk premium is the amount of extra expected return demanded by the investor to compensate for the possibility of losing money in the risky portfolio versus the riskless portfolio. When is 0, this investor requires a risk premium of 0.12% per month, the difference between the arithmetic average return of the risky portfolio and the riskless return. In this case, the riskless return is the same as the geometric average return. When is greater than 0, the investor demands a larger risk premium for choosing the risky portfolio. Specifically, the risk premium must be larger than the difference between the arithmetic and geometric average returns. With =2, the investor is indifferent between a steady fund that always earns 1.65% per month and the volatile fund above that is expected to earn 2% on average, with equal likelihood of obtaining –4%, 2%, or 8% each month. In this case, the risk premium is 0.35% per month. In practice, most models assume investors are risk-averse and therefore, must be greater than –1.
The Morningstar RatingTM Methodology| December 2011
© 2011 Morningstar, Inc. All rights reserved. The information in this document is the property of Morningstar, Inc. Reproduction or transcription by any means, in whole or part, without the prior written consent of Morningstar, Inc., is prohibited. 10
Theory (continued)
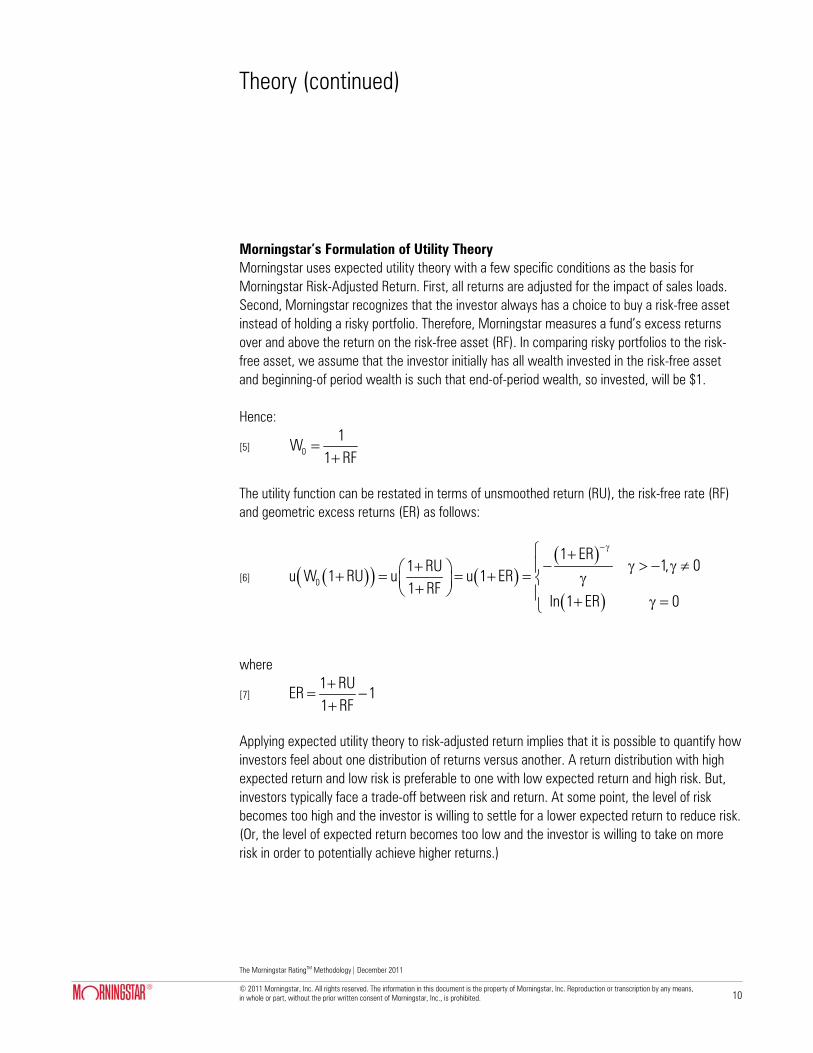
Morningstar’s Formulation of Utility Theory Morningstar uses expected utility theory with a few specific conditions as the basis for Morningstar Risk-Adjusted Return. First, all returns are adjusted for the impact of sales loads. Second, Morningstar recognizes that the investor always has a choice to buy a risk-free asset instead of holding a risky portfolio. Therefore, Morningstar measures a fund’s excess returns over and above the return on the risk-free asset (RF). In comparing risky portfolios to the risk-free asset, we assume that the investor initially has all wealth invested in the risk-free asset and beginning-of period wealth is such that end-of-period wealth, so invested, will be $1. Hence:
[5] 0
1W
1 RF
The utility function can be restated in terms of unsmoothed return (RU), the risk-free rate (RF) and geometric excess returns (ER) as follows:
[6]
0
1 ER1, 01 RU
u W 1 RU u u 1 ER1 RF
ln 1 ER 0
where
[7] 1 RU
ER 11 RF
Applying expected utility theory to risk-adjusted return implies that it is possible to quantify how investors feel about one distribution of returns versus another. A return distribution with high expected return and low risk is preferable to one with low expected return and high risk. But, investors typically face a trade-off between risk and return. At some point, the level of risk becomes too high and the investor is willing to settle for a lower expected return to reduce risk. (Or, the level of expected return becomes too low and the investor is willing to take on more risk in order to potentially achieve higher returns.)

The Morningstar RatingTM Methodology| December 2011
© 2011 Morningstar, Inc. All rights reserved. The information in this document is the property of Morningstar, Inc. Reproduction or transcription by any means, in whole or part, without the prior written consent of Morningstar, Inc., is prohibited. 11
Theory (continued)
Morningstar uses expected utility theory to determine how much return a model investor is willing to give up to reduce risk. Morningstar Risk-Adjusted Return measures the guaranteed riskless return that provides the same level of utility to the investor as the variable excess returns of the risky portfolio. We call this riskless return the “certainty equivalent” geometric excess return. For example, an investor might be indifferent between a moderately-risky fund generating 12% return (what we observe) and a riskless fund generating 8% return (as determined by the utility function). In that case, the investor is willing to give up 4% in return in order to remove the risk. By converting all return series to their riskless equivalents, Morningstar can compare one fund to another on a risk-adjusted basis. This equalizes the playing field for funds in the same category that have different exposures to risk factors. Let CEER ( ) denote the certainty equivalent geometric excess return for a given value of . The following formula states that the level of utility is the same between the certainty equivalent geometric excess return and the expected excess returns of the fund: [8]
Hence: [9] Morningstar defines Morningstar Risk-Adjusted Return, MRAR(), as the annualized value of the certainty equivalent, CEER , using the time series average of (1+ER)-
as an estimate of E[(1+ER)-]. That is, Morningstar uses historical excess returns as the basis for expected excess returns, rather than relying on analysts’ forecasts or other probabilities of future returns. With 0, Morningstar Risk-Adjusted Return is defined as follows: [10]
12T
-t
t 1
1MRAR( ) 1 ER 1
T
CEu 1 ER E u 1 ER
1
CE
E ln 1 ER
E 1 ER 1, 01 ER
e 0

The Morningstar RatingTM Methodology| December 2011
© 2011 Morningstar, Inc. All rights reserved. The information in this document is the property of Morningstar, Inc. Reproduction or transcription by any means, in whole or part, without the prior written consent of Morningstar, Inc., is prohibited. 12
Theory (continued)
where ERt = the geometric excess return in month t =(1+RUt)/(1+RFt)-1
RUt = unsmoothed return for the fund in month t
RFt = return for the risk-free asset in month t (in decimal form)
T = the number of months in the time period
When =0, MRAR is the annualized geometric mean of the excess returns: [11]
A rating system based solely on performance would rank funds on their geometric mean return, or equivalently, MRAR(0) or Morningstar Return. A rating system that provides a heavier penalty for risk requires that >0. Morningstar’s hedge fund analysts’ research has concluded that =5 results in ratings that best fit the needs of hedge fund investors. The higher gamma input for hedge funds, reflects the difficulty the fact that risk for hedge funds can often be understated, due to the illiquidity of many hedge-fund holdings, and to the effect of leverage, which does not appear risky during times of easy credit, but which can become dangerous when credit tightens. In addition, many hedge fund investors expect their funds to provide absolute returns, which implies a higher level of loss aversion. Because MRAR is expressed as an annualized return, it can be decomposed into a return component, Morningstar Return or MRAR(0), and a risk component, Morningstar Risk. Morningstar Risk is calculated as MRAR(0)–MRAR(5), or Morningstar Return – Morningstar Risk-Adjusted Return.
12
T T
tt 1
MRAR(0) 1 ER 1

The Morningstar RatingTM Methodology| December 2011
© 2011 Morningstar, Inc. All rights reserved. The information in this document is the property of Morningstar, Inc. Reproduction or transcription by any means, in whole or part, without the prior written consent of Morningstar, Inc., is prohibited. 13
Calculations
Overview There are four steps to calculate Morningstar Risk-Adjusted Return (MRAR): 1) Total Returns: Calculate monthly total returns for the fund. 2) Unsmoothed Returns: unsmooth the reported monthly returns over 3 years, 5 years (if
data are available), and 10 years (if data are available) 3) Morningstar Return: Adjust unsmoothed returns for the risk-free rate to get monthly
excess returns over 3 years, 5 years (if data are available), and 10 years (if data are available). Calculate Morningstar Return for 3 years, 5 years (if data are available), and 10 years (if data are available) as the annualized geometric mean excess return for these periods.
4) Morningstar Risk-Adjusted Return: Calculate Morningstar Return for 3 years, 5 years
(if data are available), and 10 years (if data are available) as the annualized certainty equivalent excess return for these periods.
Morningstar Risk is then calculated as the difference between Morningstar Return and Morningstar Risk-Adjusted Return. Total Return Each hedge fund reports its monthly performance to Morningstar in one of two ways: 1) Month-end Net Asset Value per ownership unit (NAV). When performance is reported
this way, Morningstar calculates monthly total return (MTR) as the percentage change in NAV from month-end to month-end, stated in decimal form.
2) Monthly Total Return. If the fund reports MTR in decimal form, Morningstar takes it as
it. If it is reported in percent form, Morningstar divides it by 100 to state it in decimal form.
If the fund reports performance in a currency other than U.S. dollars, Morningstar converts MTR to U.S. dollars at the spot exchange rate.2 MTR, stated in U.S. dollars in decimal form is TRt for month t in the formulas throughout this document
2 Currency conversion is done using the same method and data as is done in Morningstar Direct® and Morningstar EnCorr®.

The Morningstar RatingTM Methodology| December 2011
© 2011 Morningstar, Inc. All rights reserved. The information in this document is the property of Morningstar, Inc. Reproduction or transcription by any means, in whole or part, without the prior written consent of Morningstar, Inc., is prohibited. 14
Calculations (continued)
Hedge Funds may report their NAVs or MTRs to Morningstar on three different levels: a) Estimated. The fund may provide Morningstar an estimated value for the month-end
NAV or MTR during the first few weeks of the subsequent month. It may or may not later provide a final value.
b) Final. The fund may provide a final value for month-end NAV or MTR.
c) Audited. At the end of the calendar year the hedge fund may choose to have an
outside accounting firm look at the previously year’s NAV or returns and revalue them based on independent assessments of the pricing of the underlying holdings. When it does this, the fund may choose to provide Morningstar with updated audited NAVs or returns for the previous year.
These three levels of reporting form a hierarchy of the data that Morningstar uses to calculate the star rating. At 5 p.m. on the last business day of each month, the entire 38-month (for the 3-year rating), 62-month (for the 5 year rating), or 122-month (for the 10-year rating) history of the highest quality data of monthly total returns for each fund, ending on the last trading day of the prior month, is used to calculate the rating for the previous month, where quality is defined by this hierarchy. For example, on January 31, 2008, Morningstar will calculate the December 2007 star ratings for all hedge funds that have reported performance results for at the least 38 consecutive months ending December 2007. The returns on any given fund could be a mixture of estimates, final numbers, and audited numbers. For each month, the highest quality data that is available on January 31, 2008 will be used, regardless of what data is used prior to this date. For example, if a fund reported an estimated MTR for November 2007 sometime during December 2007 and sometime during January 2008 reported a final value for its November 2007 MTR, the November 2007 rating (calculated on December 31, 2007) would use the estimated value, but the December 2007 rating (calculated on January 31, 2008) would use the final value. Note that while the returns that go into the star rating calculation can be restated (and thus impact subsequent star ratings), star ratings are never restated once they have been calculated. If a fund sometimes reports its performance within the one-month window prior to a rating being calculated, and sometimes fails to do so, it will be in the rating universe (and receive a rating) for those months when it reports within the allotted time, but will not be in the rating universe (and thus not receive a rating) for those months that it fails to do so. This means that (1) ratings universes can vary from month to month due to the reporting patterns of the funds, and (2) individual funds can have gaps in their rating histories.

The Morningstar RatingTM Methodology| December 2011
© 2011 Morningstar, Inc. All rights reserved. The information in this document is the property of Morningstar, Inc. Reproduction or transcription by any means, in whole or part, without the prior written consent of Morningstar, Inc., is prohibited. 15
Calculations (continued)
If a fund starts reporting its performance to Morningstar with a back history, it will create an “instant history” within the database. If this instant history is at least 38 months deep, the fund will start receiving a star rating. While such instant histories can affect certain statistics on a category’s past, they do not cause star ratings to be restated. The voluntary nature of hedge fund performance reporting creates an opportunity for hedge funds to game the rating system by not providing a complete set of performance history. For example, if a fund had poor returns four to five years ago, it could avoid receiving a 5-year rating (and a 10-year rating) by not reporting those poor returns. At anytime, a fund could opt of being rated by extending its reporting lag by more than a month or just stop reporting performance altogether. Since most hedge funds claim that the NAVs or returns that they report are net of all fees, Morningstar assumes that all hedge fund performance data is net of all fees. This is why Morningstar makes no adjustments for fees in calculating the star ratings for hedge funds.

The Morningstar RatingTM Methodology| December 2011
© 2011 Morningstar, Inc. All rights reserved. The information in this document is the property of Morningstar, Inc. Reproduction or transcription by any means, in whole or part, without the prior written consent of Morningstar, Inc., is prohibited. 16
Calculations (continued)
Unsmoothing Returns Morningstar uses the technique presented by Okunev and White3 to unsmooth returns, but applies their technique to logarithmic returns rather that returns in level form because unsmoothing returns in level form can result in returns that are less than -100%. Let
TRt = the observed return on the hedge fund in month t in decimal form
rt = the observed logarithmic return on the hedge fund in month t
rut = the unsmoothed logarithmic return on the hedge fund in month t
RUt = the unsmoothed return on the hedge fund in month t in decimal form
Morningstar calculates rt as [12] t tr ln 1 TR Morningstar calculates rut as follows: [13]
c
crrru tt
t
11
where c is a coefficient selected so that rut has a 1st order autocorrelation coefficient with a minimum of zero. (See the discussion below.) Morningstar then convert rut to RUt as follows: [14] t tRU exp ru 1 As Okunev and White show, for rut to have a 1st order autocorrelation coefficient with a minimum of zero, c should be set as follows: [15]
3 See John Okenuv and Derek White, “Hedge Fund Factors and the Value at Risk of Credit Trading Strategies,” October 2003.
1
21
222
2
411,0max
c

The Morningstar RatingTM Methodology| December 2011
© 2011 Morningstar, Inc. All rights reserved. The information in this document is the property of Morningstar, Inc. Reproduction or transcription by any means, in whole or part, without the prior written consent of Morningstar, Inc., is prohibited. 17
Calculations (continued)
where k is the kth order autocorrelation coefficient. Given a time series of T+k month observations on rt, we estimate k as follows:
[16]
[17] So to calculate an unsmoothed series of T months, we need a time series of T+2 months. Hence, to calculate the 3-year rating, we need 38 months of consecutive monthly returns. Similarly, for the 5-year rating we need 62 months of data and for the 10-year rating we need 122 months of data. The advantage of the Okunev-White procedure over using the 1st order autocorrelation for c is that it makes no assumptions about the higher orders of autocorrelation. However, we have found that is some cases, the estimated value of 2 using equation [17] implies that r is an explosive series so that equation [15] cannot be used to set c. In such cases, we set c to 1. To make the unsmoothing procedure more robust, we employ a statistical technique called Bayesian shrinkage. In the Bayesian approach, the researcher starts with some belief about one or more of the parameters of a model and combines those prior beliefs with what he learns from the data to develop a final estimate. The estimate from the data alone is said to be “shrunk” towards the prior belief. The amount of shrinkage depends on the strength of the prior belief relative to the strength of the evidence from the data. In our case, we have a prior belief that the 2nd order partial autocorrelation coefficient is zero. The 2nd order partial autocorrelation is 2 in the regression equation [18] t 1 t 1 2 t 2 tr r r
T k
tt 1
rr
T k
T
t t kt 1
k T k2
tt 1
r r r r
r r

The Morningstar RatingTM Methodology| December 2011
© 2011 Morningstar, Inc. All rights reserved. The information in this document is the property of Morningstar, Inc. Reproduction or transcription by any means, in whole or part, without the prior written consent of Morningstar, Inc., is prohibited. 18
Calculations (continued)
The theoretical values of 1 and 2 are related to the theoretical values of 1 and 2 as follows: [19] 2
1 121
1
1
[20] 2
2 12 2
11
Note that if our prior that 2 0 held, 2
2 1 . If we are estimating the values of 1 and 2 from T observations and we have a prior belief that
2 0 which we hold with a strength equivalent to N observations, the shrunken estimates for 1 and 2 are [21] * 2
1 121
[22] 2
* 2 12 2
1
where [23]
T N
T
Let *
1 and *2 denote the 1st and 2nd order autocorrelation coefficients implied by equations
[19] and [20] when *1 and *
2 are the beta coefficients in equation [18]. Substituting *1 for
1, *2 for 2, the right-hand side of equation [21] for 1, and the right-hand side of equation
[22] for 2, in equations [19] and [20], and solving for *1 and *
2 , we find that *1 1 and
[24] Replacing 2 with *
2 in equation [15], we have our revised formula for c:
[25]
21
212
212*
2
)(
1
21
2*2
*2
2
411,0max
c

The Morningstar RatingTM Methodology| December 2011
© 2011 Morningstar, Inc. All rights reserved. The information in this document is the property of Morningstar, Inc. Reproduction or transcription by any means, in whole or part, without the prior written consent of Morningstar, Inc., is prohibited. 19
Calculations (continued)
Morningstar Return Next, Morningstar adjusts the fund’s monthly unsmoothed returns for the risk-free rate. Because investors always have an option to invest at the risk-free rate, Morningstar measures only the amount by which fund returns have exceeded that risk-free rate. This adjustment also accounts for how the risk-free rate has changed over time. For each month, Morningstar calculates the fund’s geometric excess return over the risk-free rate. [26] 1
1
1
t
tt RF
RUER
where
ERt = the geometric excess return for the fund for month t
RUt = the unsmoothed return for the fund for month t
RFt = the total return for the risk-free rate for month t
Morningstar selects a risk-free rate that is appropriate for the investor. With the mutual find rating, this varies for different Morningstar offices around the world. However, since the hedge fund rating assumes that the investor using the rating is a U.S. dollar investor, the appropriate risk-free rate for a month is the one-month U.S. Treasury Bill. The annualized geometric mean of these excess returns is known as Morningstar Return which we can denote as MRAR(0). It is calculated as [27] 1)0(
12
1
)1(
TT
ttMRAR ER
T = number of months in the rating period
For the 3-year rating, T=36; for the 5-year rating, T=60, and for the 10-year rating, T=120.

The Morningstar RatingTM Methodology| December 2011
© 2011 Morningstar, Inc. All rights reserved. The information in this document is the property of Morningstar, Inc. Reproduction or transcription by any means, in whole or part, without the prior written consent of Morningstar, Inc., is prohibited. 20
Calculations (continued)
Morningstar Risk-Adjusted Return Next, Morningstar calculates a risk-adjusted return for the rating period for each fund. As mentioned earlier, Morningstar uses expected utility theory to model how investors trade off return and risk. Morningstar Risk-Adjusted Return (MRAR) is the guaranteed return that provides the same level of utility to the investor as the specific combination of returns exhibited by the fund. The formal equation for Morningstar Risk-Adjusted Return, equation [10], uses the parameter gamma to describe the model investor’s sensitivity to risk. Morningstar sets that value equal to five, so Morningstar Risk-Adjusted Return is calculated as follows: [28]
5
12
5
1
)1(1
)5(
T
ttER
TMRAR
The section inside the brackets determines the investor’s average utility from this fund’s monthly excess returns over 36, 60 or 120 months. Then, that level of utility is converted into a return by taking it to the power of –1/2. Lastly, Morningstar annualizes the result by taking it to the power of 12. Morningstar Risk Because MRAR is expressed as an annualized return, we can derive a risk component, Morningstar Risk, as the difference between Morningstar Return (adjusted for loads and the risk-free rate) and MRAR (adjusted for loads, the risk-free rate, and risk). Morningstar Risk is always greater than or equal to zero. [29] Morningstar Risk = MRAR(0) – MRAR(5)

The Morningstar RatingTM Methodology| December 2011
© 2011 Morningstar, Inc. All rights reserved. The information in this document is the property of Morningstar, Inc. Reproduction or transcription by any means, in whole or part, without the prior written consent of Morningstar, Inc., is prohibited. 21
The Morningstar Rating for Hedge Funds: 3-, 5-, and 10-Year
Three-, Five-, and 10-Year Ratings Investments must have at least 38 continuous months of total returns in order to receive a rating. Morningstar ranks all funds in a category using Morningstar Risk-Adjusted Return, and the funds with the highest scores receive the most stars. Morningstar assigns fractional weights to those funds that are merely different share classes of the same underlying strategy. For example, if the same strategy can be bought in the form of five share classes and all five have performance for the time period being measured; each share class is counted as one-fifth of a strategy. This allows Morningstar to rate funds on a framework that is based on the number of strategies rather the number of funds.4 If a category has 60 strategies with data available for a particular time period, Morningstar will assign a five-star rating to the equivalent of six strategies (10% of the sample). These are rarely six single-fund strategies. Instead, these usually are a combination of single-fund strategies and multi-fund strategies (that have the best risk-adjusted performance) whose fractional weights add up to the equivalent of six distinct strategies. Morningstar rates each share class of a strategy separately, because each share class can have different performance histories and total return time periods available. However, the distribution of funds among the star ratings depends on the number of strategies evaluated within the category, rather than the number of funds. This policy prevents multi-fund strategies from taking up a disproportionate amount of space in any one rating level. Note that if a hedge fund manager reports performance fails to report performance results for some classes for some months within the one-month window, the fractional weights can differ from month-to-month. So if a strategy has five share classes and the fund manager reports results for November 2007 on all five in December 2007, but reports results only four of them for December 2007 in January 2008, in calculating the November 2007 rating, each share class counts as one-fifth of a strategy, but in calculating the December 2007 rating, each of the four share classes for which performance is reported counts as one-fourth of a strategy.
4 The distinction between funds and strategies is represented in the hedge fund data base by having separate strategy id and fund id fields for each fund. Funds that are share classes of the same strategy have unique fund ids but the same strategy id.

The Morningstar RatingTM Methodology| December 2011
© 2011 Morningstar, Inc. All rights reserved. The information in this document is the property of Morningstar, Inc. Reproduction or transcription by any means, in whole or part, without the prior written consent of Morningstar, Inc., is prohibited. 22
The Morningstar Rating for Hedge Funds: 3-, 5-, and 10-Year (continued)
Let: n = the total number of distinct strategies being evaluated
n1 = the number of distinct strategies that receive one star
n2 = the number of distinct strategies that receive two stars
n3 = the number of distinct strategies that receive three stars
n4 = the number of distinct strategies that receive four stars
n5 = the number of distinct strategies that receive five stars
Morningstar sets n1 through n5 so that the distribution of funds across the rating levels forms an approximate bell curve:
n1 = 10% of n
n2 = 22.5% of n
n3 = 35% of n
n4 = 22.5% of n
n5 = 10% of n
Three-year star ratings are assigned as follows: 1) Assign a fractional weight to each fund, based on the number of other share classes in
the same portfolio that have at least 38 months of data available. 2) Sort all funds in the category by three-year MRAR in descending order. 3) Starting with the highest MRAR, add up the funds’ fractional weights until n5 is
reached but not exceeded. These funds receive five stars. 4) Continue counting off funds until the total number reaches but does not exceed
n5+n4. The additional funds receive four stars. 5) Continue counting off funds until the total number reaches but does not exceed
n5+n4+n3. The additional funds receive three stars. 6) Continue counting off funds until the total number reaches but does not exceed
n5+n4+n3+n2. The additional funds receive two stars. 7) The remaining funds receive one star. If the data are available, five-year ratings are assigned using 62 months of data and 10-year ratings are assigned using 122 months of data.

The Morningstar RatingTM Methodology| December 2011
© 2011 Morningstar, Inc. All rights reserved. The information in this document is the property of Morningstar, Inc. Reproduction or transcription by any means, in whole or part, without the prior written consent of Morningstar, Inc., is prohibited. 23
The Morningstar Rating for Hedge Funds: 3-, 5-, and 10-Year (continued)
Morningstar uses the same bell curve and rating procedure above to assign scores for Morningstar Return and Morningstar Risk for three, five, and 10 years. Funds are scored from one to five, and these scores are typically expressed as word labels in Morningstar products.
Score Percent Word Label
5 Top 10% High
4 Next Above Average
3 Next 35% Average
2 Next Below Average
1 Bottom Low
Note that the word label “High” is generally good for Morningstar Return, and “Low” is generally good for Morningstar Risk. The Morningstar Return Score and Morningstar Risk Score are helpful when funds have the same rating and similar MRARs but different levels of risk.

The Morningstar RatingTM Methodology| December 2011
© 2011 Morningstar, Inc. All rights reserved. The information in this document is the property of Morningstar, Inc. Reproduction or transcription by any means, in whole or part, without the prior written consent of Morningstar, Inc., is prohibited. 24
The Overall Morningstar Rating
The Overall Morningstar Rating An overall star rating for each fund is based on a weighted average (rounded to the nearest integer) of the number of stars assigned to it in the three-, five-, and 10-year rating periods. The weights are:
Months of Total Returns Overall (Weighted) Morningstar Rating
38–61 100% three-year rating
62–121 60% five-year rating
40% three-year rating
122 or more 50% 10-year rating
30% five-year rating
20% three-year rating
For example, the weighted average of the ratings below is 2.5, and this rounds up to an Overall Rating of three stars.
Period Rating Weight Multiply
10-year 3 50% 1.5
Five-year 2 30% 0.6
Three-year 2 20% 0.4
Total 2.5
While the 10-year overall star rating formula seems to give the most weight to the 10-year period, the most recent three-year period actually has the greatest impact because it is included in all three rating periods.

The Morningstar RatingTM Methodology| December 2011
© 2011 Morningstar, Inc. All rights reserved. The information in this document is the property of Morningstar, Inc. Reproduction or transcription by any means, in whole or part, without the prior written consent of Morningstar, Inc., is prohibited. 25
Limitations of Morningstar Rating for Hedge Funds
Hedge fund data are generally self-reported and not subject to independent verification so that errors or deficiencies in those data can go undiscovered and potentially affect the Morningstar Rating for a particular hedge fund. Some potential problems that one may encounter when relying on hedge funds to self-report data include:
× Smoothing of returns—Some hedge funds may value the holdings in their portfolio using proprietary valuation models, holdings with illiquid prices, or holdings with large bid ask spreads. These hedge funds may be able to manage their monthly performance data by varying the estimated value for certain securities in the portfolio.
× Incomplete data to compute a hedge fund’s monthly NAV or return. In some cases, a hedge fund may calculate the value for a portfolio’s return using incomplete pricing data for some holdings.
× Leveraged returns – Some hedge funds may estimate the effect of leverage on a share class’s return.
× Un-audited data – Although many hedge funds have an independent auditor verify their return data, some hedge funds do not. Audited data received through a disinterested third party is, obviously, more useful and accurate than un-audited data. However, if necessary, Morningstar will use un-audited data to calculate Morningstar Rating.
× Inaccurate data—A particular hedge fund may, whether intentionally or not, submit inaccurate returns data to Morningstar or its investors. Without on-site investigation of each hedge fund’s accounting records, it is very difficult to ascertain whether this is occurring.