the more you learn, the more you earn! - community profiles site/documents... · 2016-05-31 · the...
TRANSCRIPT

6/8/2015
1
The more you learn, the more you earn! How to help students find good-paying jobs in SC
Lorraine Faulds, GCDF SC Dept. of Employment & Workforce
Education & Business Summit June 2015 w Greenville, SC
Wages
Current Employment
Jobs by Demand
Workforce Supply
Supply vs. Demand
Reality Check and Financial Literacy
Certificates and Soft Skills
Cost of College
Professional Athlete?
Military
The Future
Tools and Resources
On today’s agenda…
6/8/2015
2
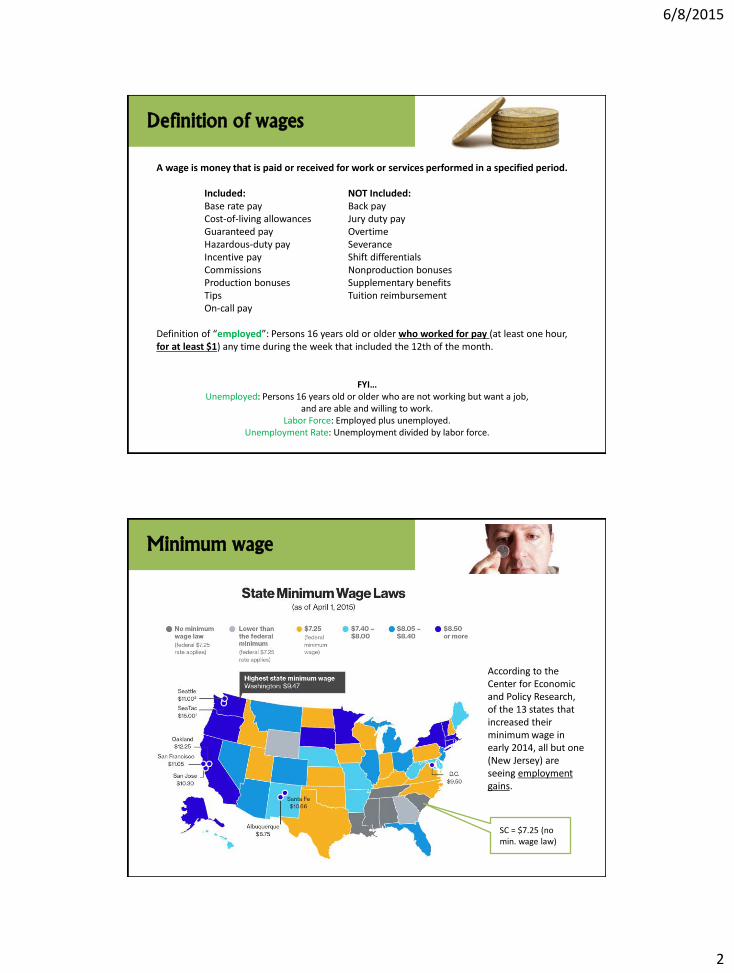
A wage is money that is paid or received for work or services performed in a specified period.
Included: NOT Included: Base rate pay Back pay Cost-of-living allowances Jury duty pay Guaranteed pay Overtime Hazardous-duty pay Severance Incentive pay Shift differentials Commissions Nonproduction bonuses Production bonuses Supplementary benefits Tips Tuition reimbursement On-call pay
Definition of “employed”: Persons 16 years old or older who worked for pay (at least one hour, for at least $1) any time during the week that included the 12th of the month.
FYI… Unemployed: Persons 16 years old or older who are not working but want a job,
and are able and willing to work. Labor Force: Employed plus unemployed.
Unemployment Rate: Unemployment divided by labor force.
Definition of wages
According to the Center for Economic and Policy Research, of the 13 states that increased their minimum wage in early 2014, all but one (New Jersey) are seeing employment gains.
Minimum wage
SC = $7.25 (no min. wage law)
6/8/2015
3
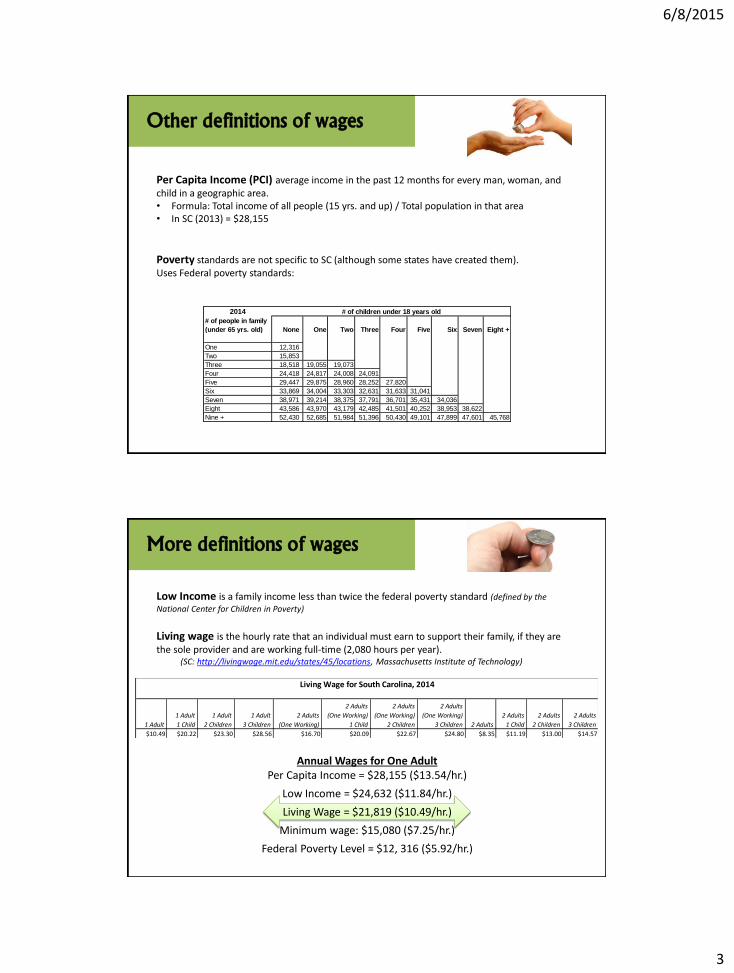
Per Capita Income (PCI) average income in the past 12 months for every man, woman, and child in a geographic area. • Formula: Total income of all people (15 yrs. and up) / Total population in that area • In SC (2013) = $28,155
Poverty standards are not specific to SC (although some states have created them). Uses Federal poverty standards:
Other definitions of wages
2014
# of people in family
(under 65 yrs. old) None One Two Three Four Five Six Seven Eight +
One 12,316
Two 15,853
Three 18,518 19,055 19,073
Four 24,418 24,817 24,008 24,091
Five 29,447 29,875 28,960 28,252 27,820
Six 33,869 34,004 33,303 32,631 31,633 31,041
Seven 38,971 39,214 38,375 37,791 36,701 35,431 34,036
Eight 43,586 43,970 43,179 42,485 41,501 40,252 38,953 38,622
Nine + 52,430 52,685 51,984 51,396 50,430 49,101 47,899 47,601 45,768
# of children under 18 years old
Annual Wages for One Adult Per Capita Income = $28,155 ($13.54/hr.)
Low Income = $24,632 ($11.84/hr.)
Living Wage = $21,819 ($10.49/hr.)
Minimum wage: $15,080 ($7.25/hr.)
Federal Poverty Level = $12, 316 ($5.92/hr.)
Low Income is a family income less than twice the federal poverty standard (defined by the
National Center for Children in Poverty)
Living wage is the hourly rate that an individual must earn to support their family, if they are the sole provider and are working full-time (2,080 hours per year).
(SC: http://livingwage.mit.edu/states/45/locations, Massachusetts Institute of Technology)
More definitions of wages
1 Adult
1 Adult
1 Child
1 Adult
2 Children
1 Adult
3 Children
2 Adults
(One Working)
2 Adults
(One Working)
1 Child
2 Adults
(One Working)
2 Children
2 Adults
(One Working)
3 Children 2 Adults
2 Adults
1 Child
2 Adults
2 Children
2 Adults
3 Children
$10.49 $20.22 $23.30 $28.56 $16.70 $20.09 $22.67 $24.80 $8.35 $11.19 $13.00 $14.57
Living Wage for South Carolina, 2014
6/8/2015
4
What effects salary?
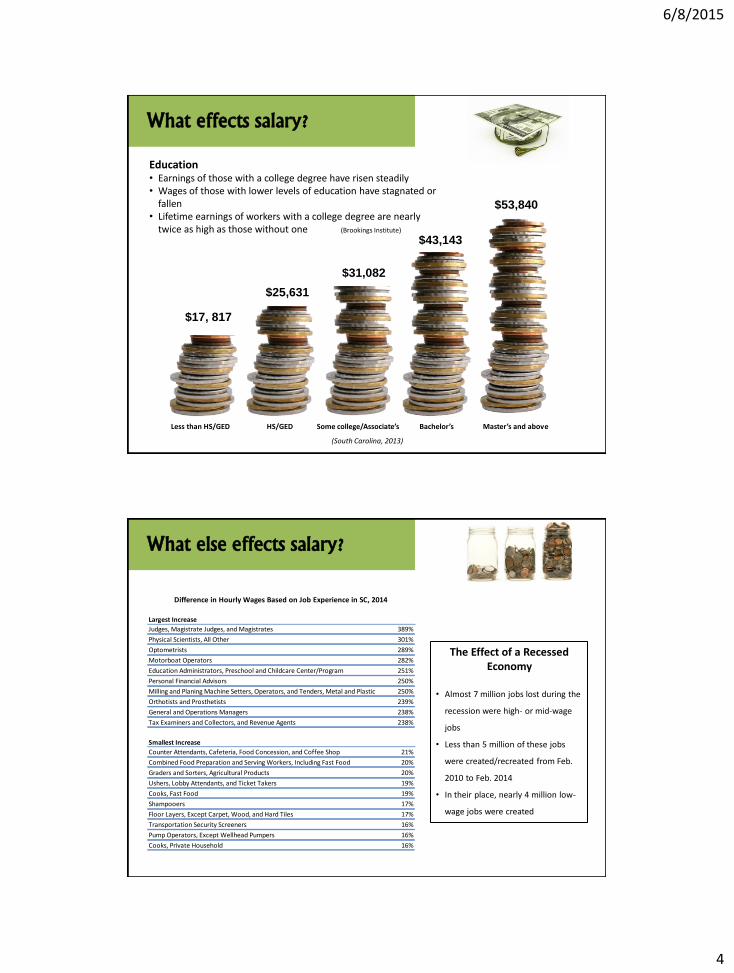
Education • Earnings of those with a college degree have risen steadily • Wages of those with lower levels of education have stagnated or
fallen • Lifetime earnings of workers with a college degree are nearly
twice as high as those without one (Brookings Institute)
Less than HS/GED HS/GED Some college/Associate’s Bachelor’s Master’s and above
$17, 817
$25,631
$31,082
$43,143
$53,840
(South Carolina, 2013)
What else effects salary?
Largest Increase
Judges, Magistrate Judges, and Magistrates 389%
Physical Scientists, All Other 301%
Optometrists 289%
Motorboat Operators 282%
Education Administrators, Preschool and Childcare Center/Program 251%
Personal Financial Advisors 250%
Milling and Planing Machine Setters, Operators, and Tenders, Metal and Plastic 250%
Orthotists and Prosthetists 239%
General and Operations Managers 238%
Tax Examiners and Collectors, and Revenue Agents 238%
Smallest Increase
Counter Attendants, Cafeteria, Food Concession, and Coffee Shop 21%
Combined Food Preparation and Serving Workers, Including Fast Food 20%
Graders and Sorters, Agricultural Products 20%
Ushers, Lobby Attendants, and Ticket Takers 19%
Cooks, Fast Food 19%
Shampooers 17%
Floor Layers, Except Carpet, Wood, and Hard Tiles 17%
Transportation Security Screeners 16%
Pump Operators, Except Wellhead Pumpers 16%
Cooks, Private Household 16%
Difference in Hourly Wages Based on Job Experience in SC, 2014
The Effect of a Recessed Economy
• Almost 7 million jobs lost during the
recession were high- or mid-wage
jobs
• Less than 5 million of these jobs
were created/recreated from Feb.
2010 to Feb. 2014
• In their place, nearly 4 million low-
wage jobs were created
6/8/2015
5
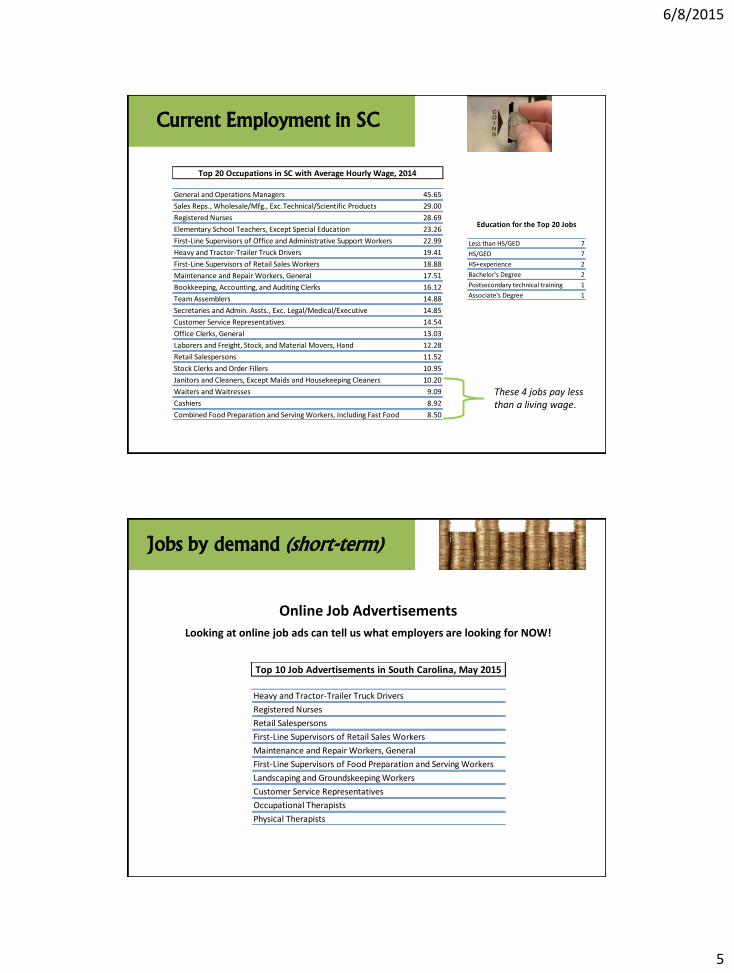
Current Employment in SC
General and Operations Managers 45.65
Sales Reps., Wholesale/Mfg., Exc.Technical/Scientific Products 29.00
Registered Nurses 28.69
Elementary School Teachers, Except Special Education 23.26
First-Line Supervisors of Office and Administrative Support Workers 22.99
Heavy and Tractor-Trailer Truck Drivers 19.41
First-Line Supervisors of Retail Sales Workers 18.88
Maintenance and Repair Workers, General 17.51
Bookkeeping, Accounting, and Auditing Clerks 16.12
Team Assemblers 14.88
Secretaries and Admin. Assts., Exc. Legal/Medical/Executive 14.85
Customer Service Representatives 14.54
Office Clerks, General 13.03
Laborers and Freight, Stock, and Material Movers, Hand 12.28
Retail Salespersons 11.52
Stock Clerks and Order Fillers 10.95
Janitors and Cleaners, Except Maids and Housekeeping Cleaners 10.20
Waiters and Waitresses 9.09
Cashiers 8.92
Combined Food Preparation and Serving Workers, Including Fast Food 8.50
Top 20 Occupations in SC with Average Hourly Wage, 2014
These 4 jobs pay less than a living wage.
Less than HS/GED 7
HS/GED 7
HS+experience 2
Bachelor's Degree 2
Postsecondary technical training 1
Associate's Degree 1
Education for the Top 20 Jobs
Jobs by demand (short-term)
Online Job Advertisements
Looking at online job ads can tell us what employers are looking for NOW!
Top 10 Job Advertisements in South Carolina, May 2015
Heavy and Tractor-Trailer Truck Drivers
Registered Nurses
Retail Salespersons
First-Line Supervisors of Retail Sales Workers
Maintenance and Repair Workers, General
First-Line Supervisors of Food Preparation and Serving Workers
Landscaping and Groundskeeping Workers
Customer Service Representatives
Occupational Therapists
Physical Therapists
6/8/2015
6
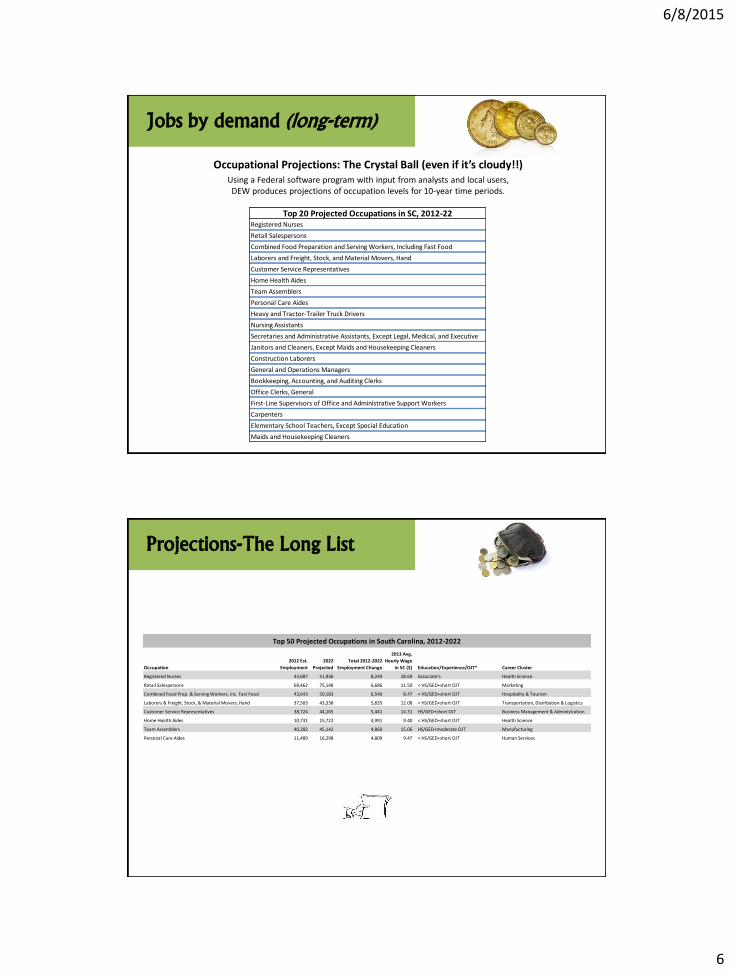
Jobs by demand (long-term)
Occupational Projections: The Crystal Ball (even if it’s cloudy!!)
Using a Federal software program with input from analysts and local users, DEW produces projections of occupation levels for 10-year time periods.
Top 20 Projected Occupations in SC, 2012-22Registered Nurses
Retail Salespersons
Combined Food Preparation and Serving Workers, Including Fast Food
Laborers and Freight, Stock, and Material Movers, Hand
Customer Service Representatives
Home Health Aides
Team Assemblers
Personal Care Aides
Heavy and Tractor-Trailer Truck Drivers
Nursing Assistants
Secretaries and Administrative Assistants, Except Legal, Medical, and Executive
Janitors and Cleaners, Except Maids and Housekeeping Cleaners
Construction Laborers
General and Operations Managers
Bookkeeping, Accounting, and Auditing Clerks
Office Clerks, General
First-Line Supervisors of Office and Administrative Support Workers
Carpenters
Elementary School Teachers, Except Special Education
Maids and Housekeeping Cleaners
Projections-The Long List
Occupation
2012 Est.
Employment
2022
Projected
Total 2012-2022
Employment Change
2013 Avg.
Hourly Wage
in SC ($) Education/Experience/OJT* Career Cluster
Registered Nurses 43,687 51,936 8,249 28.69 Associate's Health Science
Retail Salespersons 68,462 75,148 6,686 11.50 < HS/GED+short OJT Marketing
Combined Food Prep. & Serving Workers, Inc. Fast Food 43,643 50,183 6,540 8.47 < HS/GED+short OJT Hospitality & Tourism
Laborers & Freight, Stock, & Material Movers, Hand 37,503 43,338 5,835 12.08 < HS/GED+short OJT Transportation, Distribution & Logistics
Customer Service Representatives 38,724 44,165 5,441 14.31 HS/GED+short OJT Business Management & Administration
Home Health Aides 10,731 15,722 4,991 9.40 < HS/GED+short OJT Health Science
Team Assemblers 40,282 45,142 4,860 15.06 HS/GED+moderate OJT Manufacturing
Personal Care Aides 11,489 16,298 4,809 9.47 < HS/GED+short OJT Human Services
Top 50 Projected Occupations in South Carolina, 2012-2022
6/8/2015
7
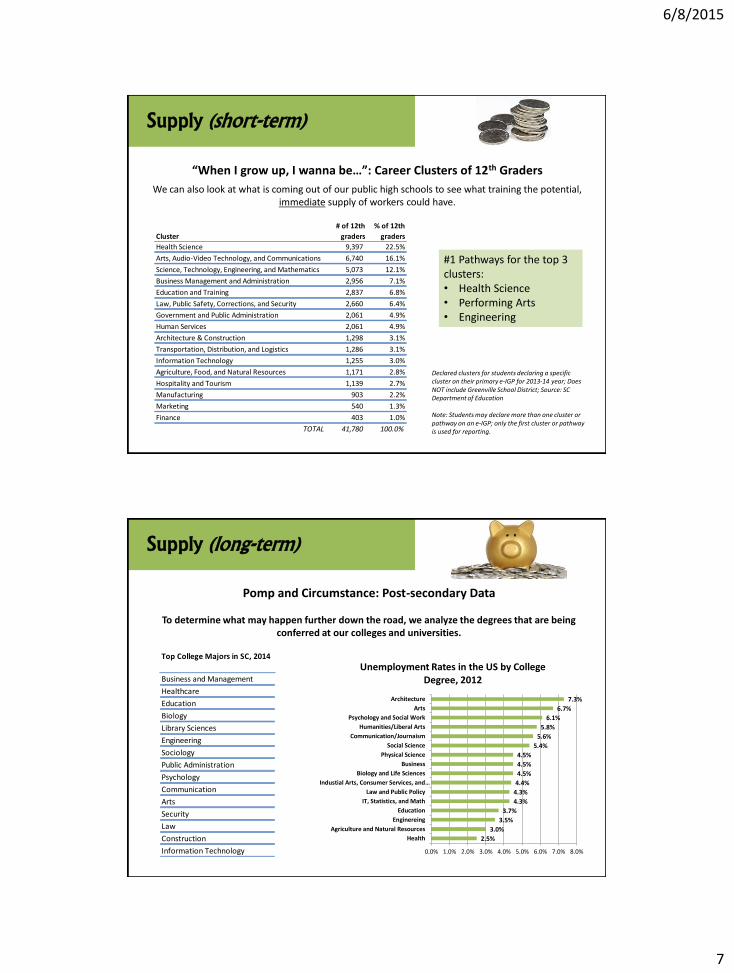
Supply (short-term)
“When I grow up, I wanna be…”: Career Clusters of 12th Graders
We can also look at what is coming out of our public high schools to see what training the potential, immediate supply of workers could have.
Declared clusters for students declaring a specific cluster on their primary e-IGP for 2013-14 year; Does NOT include Greenville School District; Source: SC Department of Education Note: Students may declare more than one cluster or pathway on an e-IGP; only the first cluster or pathway is used for reporting.
Cluster
# of 12th
graders
% of 12th
graders
Health Science 9,397 22.5%
Arts, Audio-Video Technology, and Communications 6,740 16.1%
Science, Technology, Engineering, and Mathematics 5,073 12.1%
Business Management and Administration 2,956 7.1%
Education and Training 2,837 6.8%
Law, Public Safety, Corrections, and Security 2,660 6.4%
Government and Public Administration 2,061 4.9%
Human Services 2,061 4.9%
Architecture & Construction 1,298 3.1%
Transportation, Distribution, and Logistics 1,286 3.1%
Information Technology 1,255 3.0%
Agriculture, Food, and Natural Resources 1,171 2.8%
Hospitality and Tourism 1,139 2.7%
Manufacturing 903 2.2%
Marketing 540 1.3%
Finance 403 1.0%
TOTAL 41,780 100.0%
#1 Pathways for the top 3 clusters: • Health Science • Performing Arts • Engineering
Supply (long-term)
Pomp and Circumstance: Post-secondary Data
To determine what may happen further down the road, we analyze the degrees that are being conferred at our colleges and universities.
2.5%
3.0%
3.5%
3.7%
4.3%
4.3%
4.4%
4.5%
4.5%
4.5%
5.4%
5.6%
5.8%
6.1%
6.7%
7.3%
0.0% 1.0% 2.0% 3.0% 4.0% 5.0% 6.0% 7.0% 8.0%
Health
Agriculture and Natural Resources
Enginereing
Education
IT, Statistics, and Math
Law and Public Policy
Industial Arts, Consumer Services, and…
Biology and Life Sciences
Business
Physical Science
Social Science
Communication/Journaism
Humanities/Liberal Arts
Psychology and Social Work
Arts
Architecture
Unemployment Rates in the US by College Degree, 2012
Top College Majors in SC, 2014
Business and Management
Healthcare
Education
Biology
Library Sciences
Engineering
Sociology
Public Administration
Psychology
Communication
Arts
Security
Law
Construction
Information Technology
6/8/2015
8
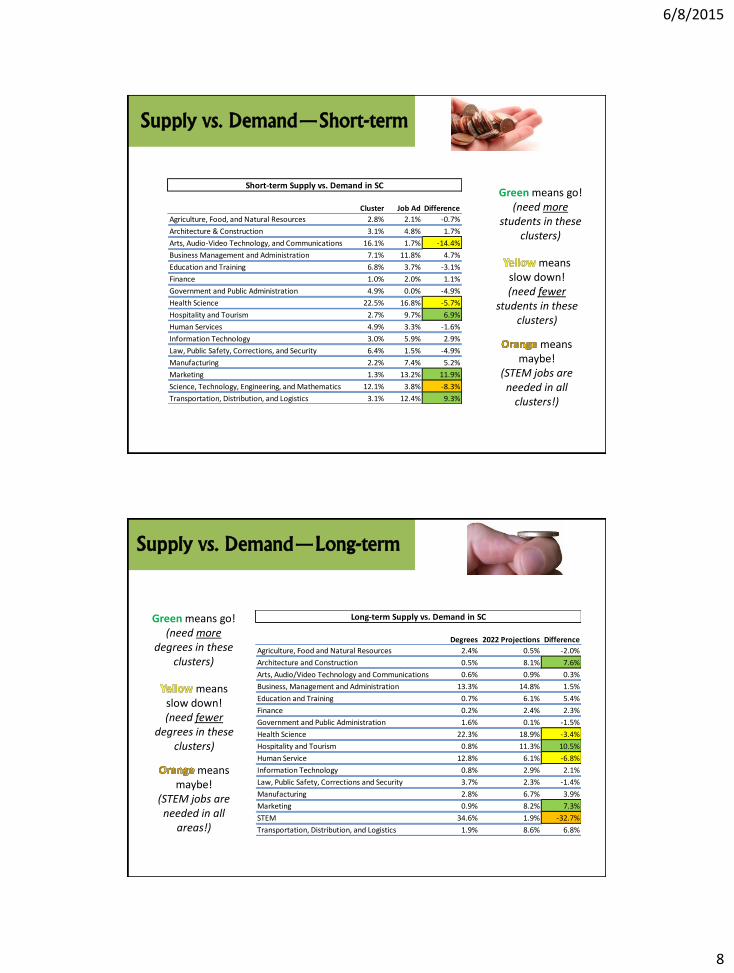
Supply vs. Demand—Short-term
Cluster Job Ad Difference
Agriculture, Food, and Natural Resources 2.8% 2.1% -0.7%
Architecture & Construction 3.1% 4.8% 1.7%
Arts, Audio-Video Technology, and Communications 16.1% 1.7% -14.4%
Business Management and Administration 7.1% 11.8% 4.7%
Education and Training 6.8% 3.7% -3.1%
Finance 1.0% 2.0% 1.1%
Government and Public Administration 4.9% 0.0% -4.9%
Health Science 22.5% 16.8% -5.7%
Hospitality and Tourism 2.7% 9.7% 6.9%
Human Services 4.9% 3.3% -1.6%
Information Technology 3.0% 5.9% 2.9%
Law, Public Safety, Corrections, and Security 6.4% 1.5% -4.9%
Manufacturing 2.2% 7.4% 5.2%
Marketing 1.3% 13.2% 11.9%
Science, Technology, Engineering, and Mathematics 12.1% 3.8% -8.3%
Transportation, Distribution, and Logistics 3.1% 12.4% 9.3%
Short-term Supply vs. Demand in SCGreen means go!
(need more students in these
clusters)
means slow down! (need fewer
students in these clusters)
means maybe!
(STEM jobs are needed in all
clusters!)
Supply vs. Demand—Long-term
Degrees 2022 Projections Difference
Agriculture, Food and Natural Resources 2.4% 0.5% -2.0%
Architecture and Construction 0.5% 8.1% 7.6%
Arts, Audio/Video Technology and Communications 0.6% 0.9% 0.3%
Business, Management and Administration 13.3% 14.8% 1.5%
Education and Training 0.7% 6.1% 5.4%
Finance 0.2% 2.4% 2.3%
Government and Public Administration 1.6% 0.1% -1.5%
Health Science 22.3% 18.9% -3.4%
Hospitality and Tourism 0.8% 11.3% 10.5%
Human Service 12.8% 6.1% -6.8%
Information Technology 0.8% 2.9% 2.1%
Law, Public Safety, Corrections and Security 3.7% 2.3% -1.4%
Manufacturing 2.8% 6.7% 3.9%
Marketing 0.9% 8.2% 7.3%
STEM 34.6% 1.9% -32.7%
Transportation, Distribution, and Logistics 1.9% 8.6% 6.8%
Long-term Supply vs. Demand in SCGreen means go! (need more
degrees in these clusters)
means slow down! (need fewer
degrees in these clusters)
means maybe!
(STEM jobs are needed in all
areas!)
6/8/2015
9
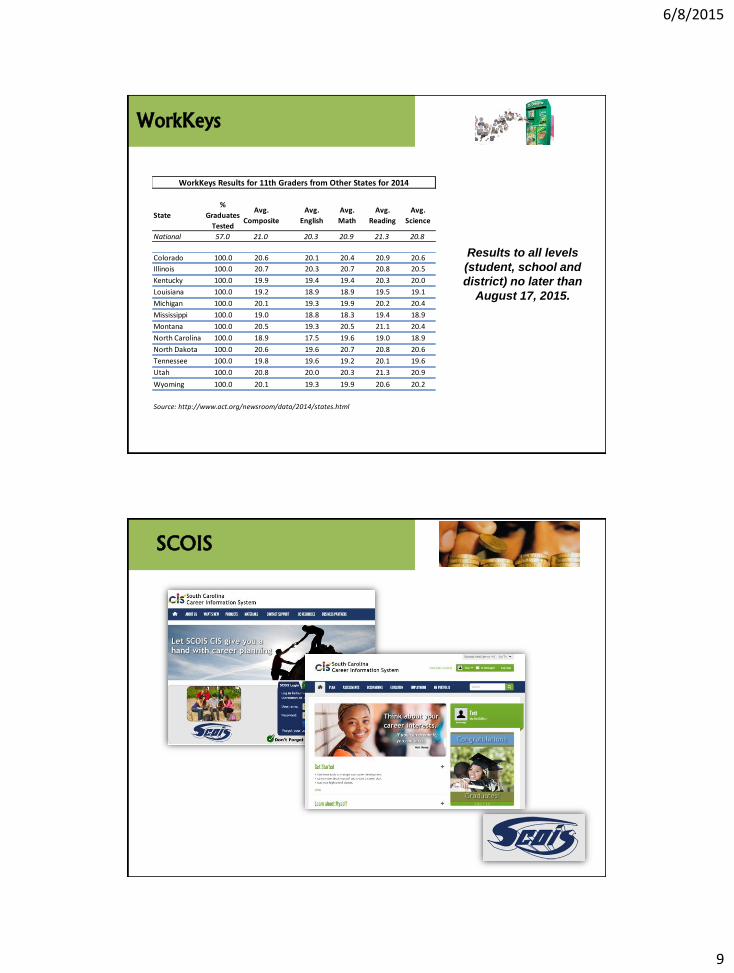
Results to all levels
(student, school and
district) no later than
August 17, 2015.
WorkKeys
State
%
Graduates
Tested
Avg.
Composite
Avg.
English
Avg.
Math
Avg.
Reading
Avg.
Science
National 57.0 21.0 20.3 20.9 21.3 20.8
Colorado 100.0 20.6 20.1 20.4 20.9 20.6
Illinois 100.0 20.7 20.3 20.7 20.8 20.5
Kentucky 100.0 19.9 19.4 19.4 20.3 20.0
Louisiana 100.0 19.2 18.9 18.9 19.5 19.1
Michigan 100.0 20.1 19.3 19.9 20.2 20.4
Mississippi 100.0 19.0 18.8 18.3 19.4 18.9
Montana 100.0 20.5 19.3 20.5 21.1 20.4
North Carolina 100.0 18.9 17.5 19.6 19.0 18.9
North Dakota 100.0 20.6 19.6 20.7 20.8 20.6
Tennessee 100.0 19.8 19.6 19.2 20.1 19.6
Utah 100.0 20.8 20.0 20.3 21.3 20.9
Wyoming 100.0 20.1 19.3 19.9 20.6 20.2
Source: http://www.act.org/newsroom/data/2014/states.html
WorkKeys Results for 11th Graders from Other States for 2014
SCOIS
6/8/2015
10
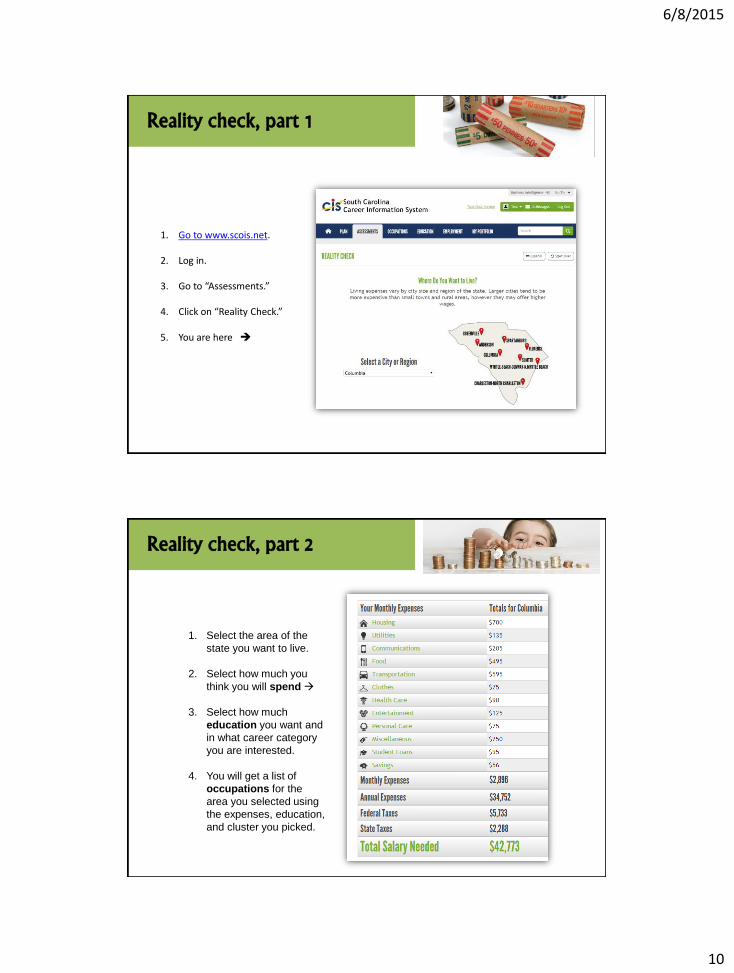
Reality check, part 1
1. Go to www.scois.net.
2. Log in.
3. Go to “Assessments.”
4. Click on “Reality Check.”
5. You are here
Reality check, part 2
1. Select the area of the
state you want to live.
2. Select how much you
think you will spend
3. Select how much
education you want and
in what career category
you are interested.
4. You will get a list of
occupations for the
area you selected using
the expenses, education,
and cluster you picked.
6/8/2015
11
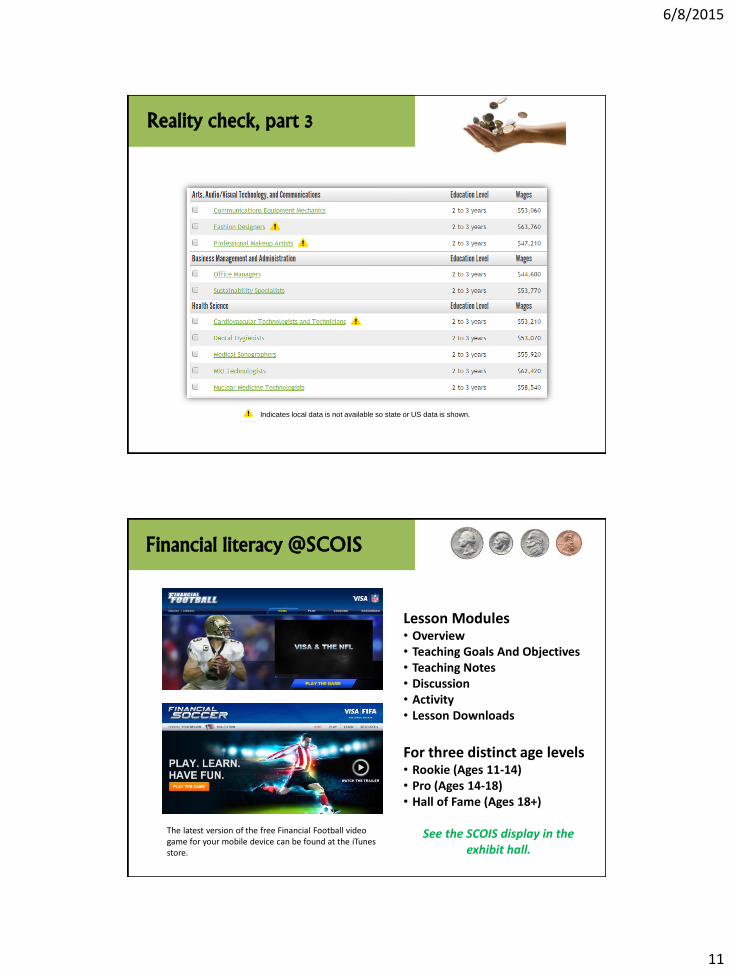
Reality check, part 3
Indicates local data is not available so state or US data is shown.
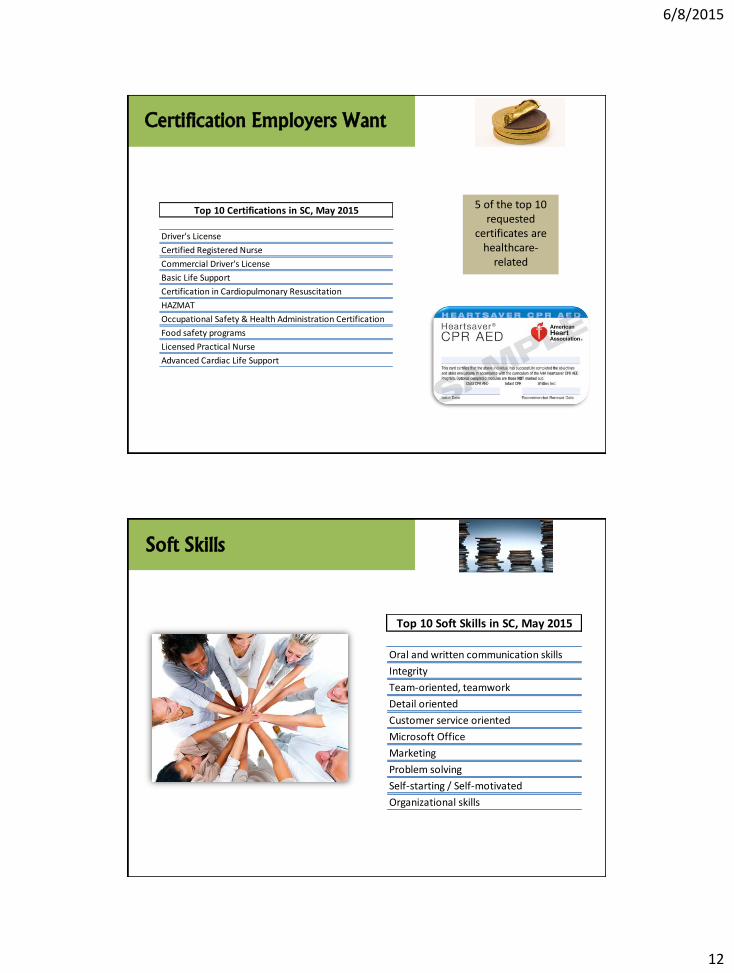
Financial literacy @SCOIS
The latest version of the free Financial Football video game for your mobile device can be found at the iTunes store.
Lesson Modules • Overview • Teaching Goals And Objectives • Teaching Notes • Discussion • Activity • Lesson Downloads
For three distinct age levels • Rookie (Ages 11-14) • Pro (Ages 14-18) • Hall of Fame (Ages 18+)
See the SCOIS display in the
exhibit hall.
6/8/2015
12
5 of the top 10 requested
certificates are healthcare-
related
Certification Employers Want
Top 10 Certifications in SC, May 2015
Driver's License
Certified Registered Nurse
Commercial Driver's License
Basic Life Support
Certification in Cardiopulmonary Resuscitation
HAZMAT
Occupational Safety & Health Administration Certification
Food safety programs
Licensed Practical Nurse
Advanced Cardiac Life Support
Soft Skills
Top 10 Soft Skills in SC, May 2015
Oral and written communication skills
Integrity
Team-oriented, teamwork
Detail oriented
Customer service oriented
Microsoft Office
Marketing
Problem solving
Self-starting / Self-motivated
Organizational skills
6/8/2015
13
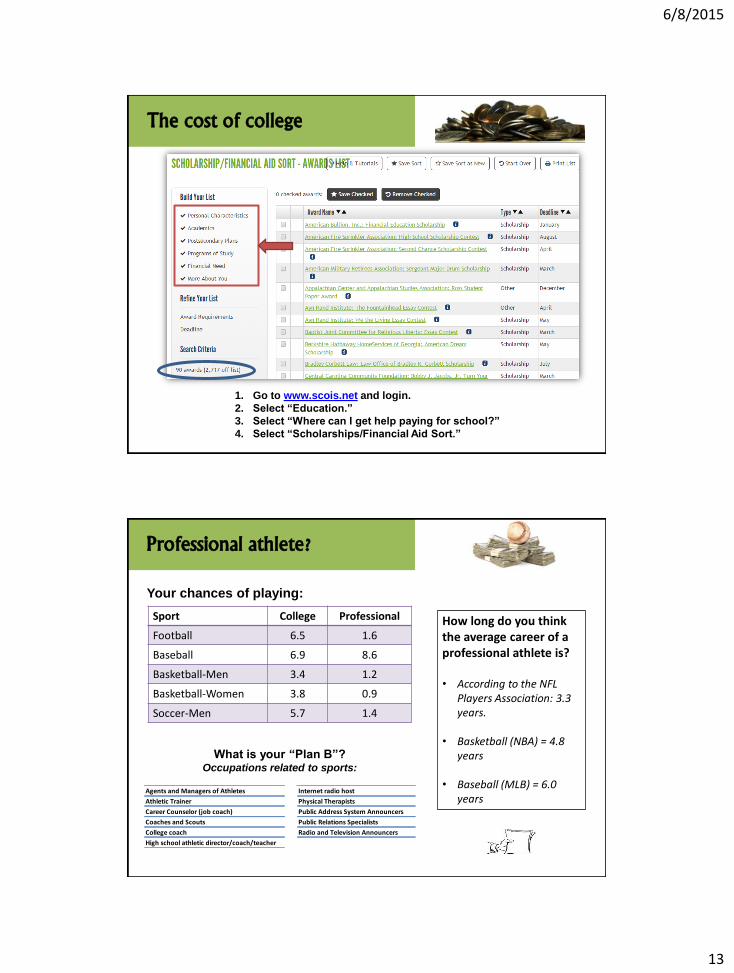
The cost of college
1. Go to www.scois.net and login.
2. Select “Education.”
3. Select “Where can I get help paying for school?”
4. Select “Scholarships/Financial Aid Sort.”
Professional athlete?
Your chances of playing:
Sport College Professional
Football 6.5 1.6
Baseball 6.9 8.6
Basketball-Men 3.4 1.2
Basketball-Women 3.8 0.9
Soccer-Men 5.7 1.4
How long do you think the average career of a professional athlete is? • According to the NFL
Players Association: 3.3 years.
• Basketball (NBA) = 4.8 years
• Baseball (MLB) = 6.0 years
What is your “Plan B”? Occupations related to sports:
Agents and Managers of Athletes Internet radio host
Athletic Trainer Physical Therapists
Career Counselor (job coach) Public Address System Announcers
Coaches and Scouts Public Relations Specialists
College coach Radio and Television Announcers
High school athletic director/coach/teacher
6/8/2015
14
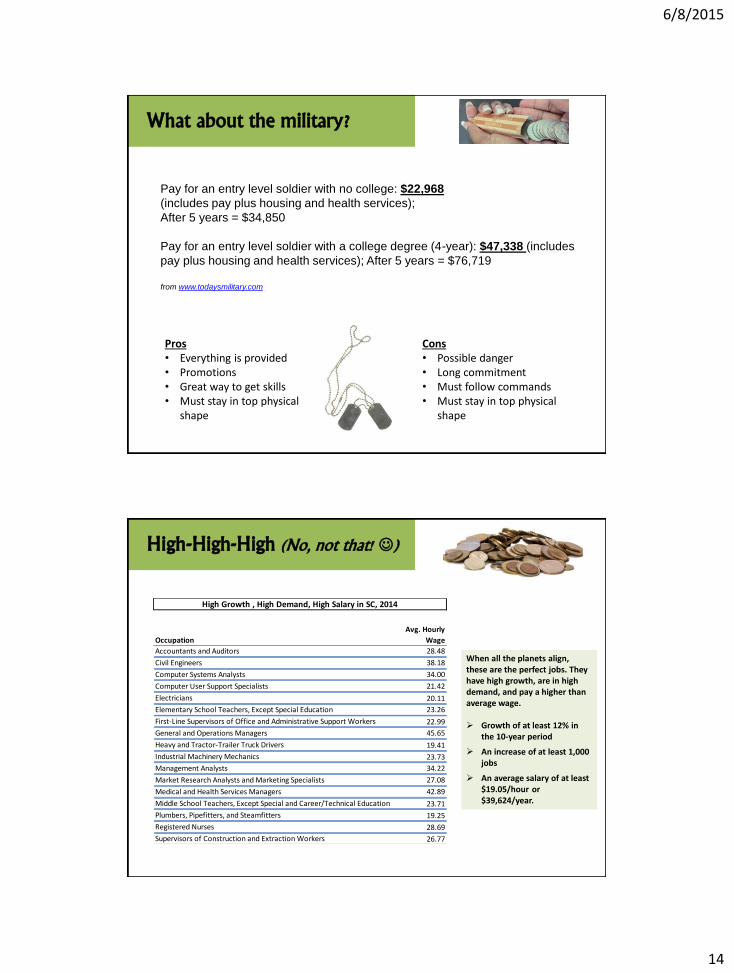
Pay for an entry level soldier with no college: $22,968
(includes pay plus housing and health services);
After 5 years = $34,850
Pay for an entry level soldier with a college degree (4-year): $47,338 (includes
pay plus housing and health services); After 5 years = $76,719
from www.todaysmilitary.com
Pros • Everything is provided • Promotions • Great way to get skills • Must stay in top physical
shape
Cons • Possible danger • Long commitment • Must follow commands • Must stay in top physical
shape
What about the military?
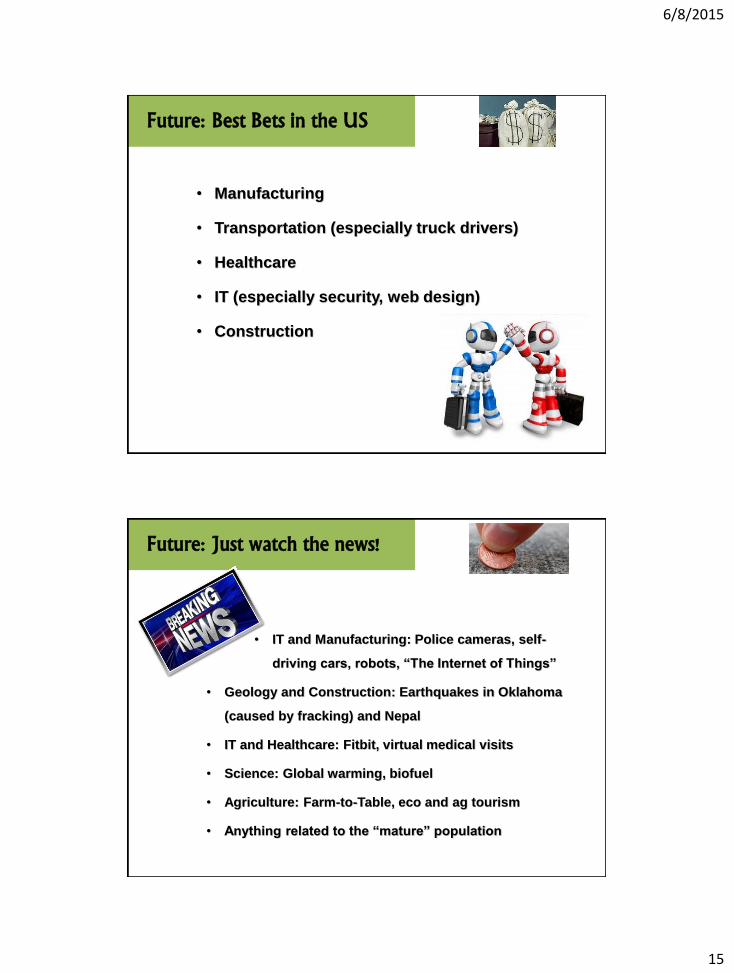
High-High-High (No, not that! )
When all the planets align, these are the perfect jobs. They have high growth, are in high demand, and pay a higher than average wage. Growth of at least 12% in
the 10-year period
An increase of at least 1,000 jobs
An average salary of at least $19.05/hour or $39,624/year.
Occupation
Avg. Hourly
Wage
Accountants and Auditors 28.48
Civil Engineers 38.18
Computer Systems Analysts 34.00
Computer User Support Specialists 21.42
Electricians 20.11
Elementary School Teachers, Except Special Education 23.26
First-Line Supervisors of Office and Administrative Support Workers 22.99
General and Operations Managers 45.65
Heavy and Tractor-Trailer Truck Drivers 19.41
Industrial Machinery Mechanics 23.73
Management Analysts 34.22
Market Research Analysts and Marketing Specialists 27.08
Medical and Health Services Managers 42.89
Middle School Teachers, Except Special and Career/Technical Education 23.71
Plumbers, Pipefitters, and Steamfitters 19.25
Registered Nurses 28.69
Supervisors of Construction and Extraction Workers 26.77
High Growth , High Demand, High Salary in SC, 2014
6/8/2015
15
Future: Best Bets in the US
• Manufacturing
• Transportation (especially truck drivers)
• Healthcare
• IT (especially security, web design)
• Construction
Future: Just watch the news!
• IT and Manufacturing: Police cameras, self-
driving cars, robots, “The Internet of Things”
• Geology and Construction: Earthquakes in Oklahoma
(caused by fracking) and Nepal
• IT and Healthcare: Fitbit, virtual medical visits
• Science: Global warming, biofuel
• Agriculture: Farm-to-Table, eco and ag tourism
• Anything related to the “mature” population
6/8/2015
16
Future: Closer to home
Transportation, Distribution & Logistics Widening of Panama Canal, deepening of Charleston Port,
inland port in Greer
Auto Manufacturing Volvo (!), Daimler-Mercedes Benz, BMW
Tire Manufacturing Giti, Bridgestone, Michelin, Firestone
Aerospace Manufacturing Boeing
Mining Haile Gold Mine
Also… Amazon, V. C. Summer Nuclear Station, chicken processing
Resources/Tools, Part I
6/8/2015
17
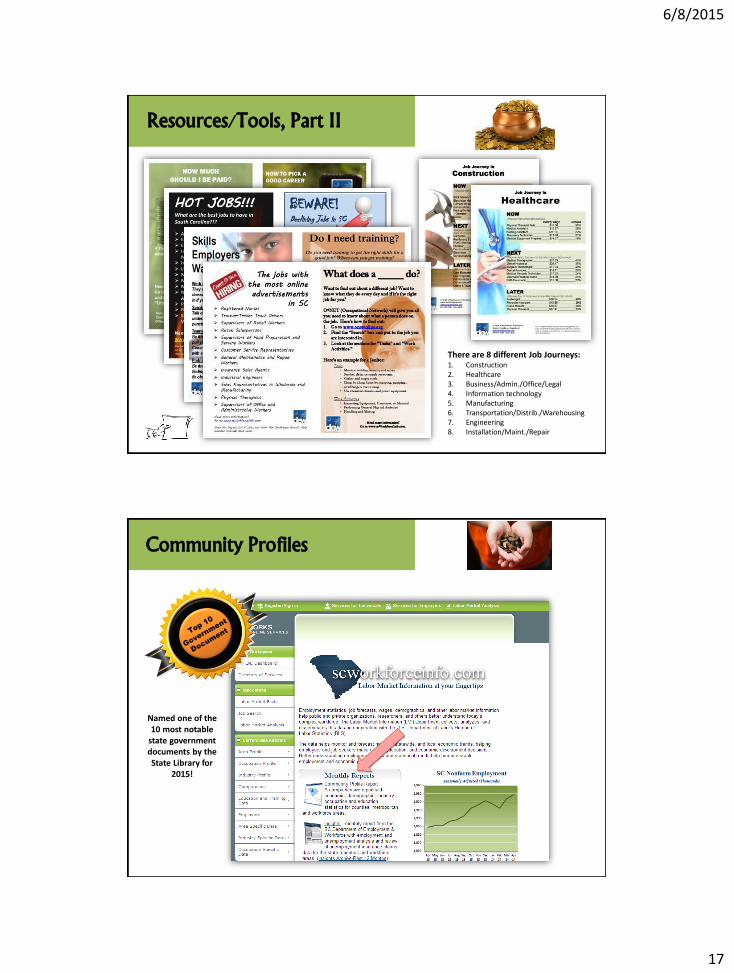
Resources/Tools, Part II
There are 8 different Job Journeys: 1. Construction 2. Healthcare 3. Business/Admin./Office/Legal 4. Information technology 5. Manufacturing 6. Transportation/Distrib./Warehousing 7. Engineering 8. Installation/Maint./Repair
Community Profiles
Named one of the 10 most notable
state government documents by the State Library for
2015!
6/8/2015
18
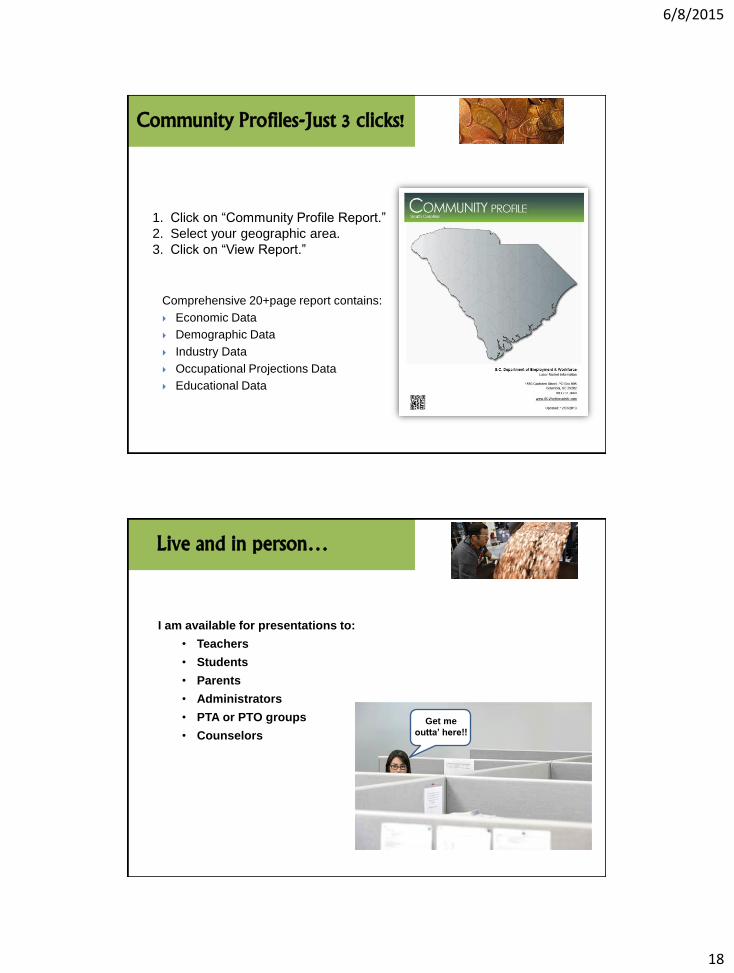
1. Click on “Community Profile Report.”
2. Select your geographic area.
3. Click on “View Report.”
Comprehensive 20+page report contains:
Economic Data
Demographic Data
Industry Data
Occupational Projections Data
Educational Data
Community Profiles-Just 3 clicks!
Live and in person…
I am available for presentations to:
• Teachers
• Students
• Parents
• Administrators
• PTA or PTO groups
• Counselors
Get me
outta’ here!!
6/8/2015
19
The differences between PCI, minimum, wage,
and living wage
Current employment and possible gaps
between supply and demand
How to use Reality Check and Financial
Literacy tools on SCOIS
What certificates and soft skills employers want
How to find scholarships to help with the cost
of college
Chances of becoming a professional athlete
Military options and pay
The Future: In the US and SC
Tools and resources to use to help students
So today we learned…
QUESTIONS?
Lorraine Faulds, GCDF
Business Intelligence Department
(803) 737-2714 or 737-2660
www.scWorkforceInfo.com