the micronutrient report - nutrition international · the micronutrient report current progress and...
TRANSCRIPT
Current Progress and Trends in the Control of Vitamin A,lodine, and Iron Deficiencies
The Micronutrient Report
John. B. MasonMahshid LotfiNita DalmiyaKavita Sethuraman and Megan Deitchler
The
Micronutrient
Initiative

The Micronutrient ReportCurrent Progress and Trends in the Control of Vitamin A, Iodine, and IronDeficiencies
Micronutrient deficiencies are a significant cause of malnutrition and associated illhealth throughout the world. This is particularly true in the developing world, wherenearly 20% of the population suffers from iodine deficiency, about 25% of childrenhave subclinical vitamin A deficiency, and more than 40% of women are anaemic.Micronutrient deficiencies also lead to impaired growth and cognitive development,birth defects, cretinism, and blindness, as well as decreased school and workperformance and poor general health.
The Micronutrient Report summarizes current data on the prevalence of vitamin A,iodine, and iron deficiencies and reports on the implementation and progress ofprograms to battle these deficiencies in developing countries. Prepared by theDepartment of International Health at Tulane University, the Micronutrient Initiative,and UNICEF, this report is the first in what will be a ongoing series on the state ofmicronutrient nutrition and the battle against micronutrient deficiency. It sets areference point by which priorities for program content and coverage can be betterinformed and a baseline from which progress in deficiency prevention can bemeasured. Part 1 summarizes prevalence trends for deficiencies of vitamin A, iodine,and iron; part 2 describes the status of current programs aimed at preventing orreducing micronutrient deficiencies. The report is illustrated with numerous statisticaltables, figures, and maps.
John B. Mason is a professor in the Department of International Health andDevelopment at Tulane University (USA). From 1986 to 1996, he was TechnicalSecretary of the United Nations Coordinating Committee on Nutrition based at theWorld Health Organization in Geneva. He is also past Director of the CornellNutritional Surveillance Program. Mahshid Lotfi is Senior Program Specialist for theMicronutrient Initiative, where she monitors and helps to develop internationalhealth, nutrition, and development programs in Asia, Africa, and Latin America. Sheholds a doctorate in physiological nutrition from the University of London (UK). NitaDalmiya works for the Nutrition Division in the United Nations Children’s Fund(UNICEF) in New York. Kavita Sethuraman is currently completing doctoral researchat the Centre for International Child Health, University College, London, UK. She hasworked for the United Nations Coordinating Committee on Nutrition and as acommunity-based nutritionist in the inner city of Boston and in the South Pacific.Megan Deitchler currently works at Tulane University as program coordinator for amulticentre micronutrient project. She holds a master’s degree in public health fromTulane University.
,!7IB8J4-cbhbih!ISBN 1-894217-18-7
L'Initiativemicronutriments
The MicronutrientInitiative

The Micronutrient Report
Current Progress and Trends in the Control of
Vitamin A, Iodine, and Iron Deficiencies

The MicronutrientReportCurrent Progress and Trends in the Control of
Vitamin A, Iodine, and Iron Deficiencies
John. B. MasonDepartment of International Health and Development, Tulane University School ofPublic Health and Tropical Medicine, New Orleans, LA, USA
Mahshid LotfiMicronutrient Initiative, Ottawa, ON, Canada
Nita DalmiyaNutrition Section, United Nations Children’s Fund, NY, USA
Kavita Sethuraman and Megan Deitchlerwith Scott Geibel, Kari Gillenwater, Amy Gilman, Karen Mason, and Nancy MockDepartment of International Health and Development, Tulane University School ofPublic Health and Tropical Medicine, New Orleans, LA, USA
SCH
OO
LOF
PUBLIC HEALTH & TROPICAL
MED
ICIN
E
•T
UL
AN
E
UNIVERSITY HEALTH SCIENCES
CE
NT
ER
•
ESTAB L ISHED 1912
Published by the Micronutrient InitiativePO Box 8500, Ottawa, ON, Canada K1G 3H9http://www.micronutrient.org
© International Development Research Centre 2001
NNaattiioonnaall LLiibbrraarryy ooff CCaannaaddaa ccaattaalloogguuiinngg iinn ppuubblliiccaattiioonn ddaattaa
Main entry under title :The micronutrient report : current progress and trends in the control of vitamin A, iron, and iodinedeficiencies
Includes bibliographical references.Co-published by Micronutrient Initiative.ISBN 1-894217-18-7
1. Vitamin A deficiency — Developing countries.2. Iron deficiency anemia — Developing countries.3. Iodine deficiency diseases — Developing countries.4. Regional medical programs — Developing countries.I. Mason, John B.II. Micronutrient Initiative (Association)III. International Development Research Centre (Canada)
RA645.V56M52 2001 615’.328 C2001-980031-2
All rights reserved. No part of this publication may be reproduced, stored in a retrieval system, ortransmitted, in any form or by any means, electronic, mechanical, photocopying, or otherwise, without the prior permission of the International Development Research Centre. A microfiche editionis available. IDRC Books endeavours to produce environmentally friendly publications. All paper used is recycled as well as recyclable. All inks and coatings are vegetable-based products.
One or more photos in this pubication were selected from Photoshare, the online database of theMedia/Materials Clearinghouse at the JHU/Population Information Program at www.jhuccp.org/mmc.Cover photos, clockwise from top: Mohsen Allan (93-28), Mohsen Allan (93-20), Liz Gilbert, courtesyof the David and Lucille Packard Foundation (2355-14).
Published in association with theInternational Development Research CentrePO Box 8500, Ottawa, ON, Canadahttp://www.idrc.ca

v
Cont
ents
ContentsForeword . . . . . . . . . . . . . . . . . . . . . . . . . . . . . . . . . . . . . . . . . . . . . . . . . ix
Acknowledgments. . . . . . . . . . . . . . . . . . . . . . . . . . . . . . . . . . . . . . . . . . . . xi
Executive Summary. . . . . . . . . . . . . . . . . . . . . . . . . . . . . . . . . . . . . . . . . . . xiii
Part I. Trends in Prevalences . . . . . . . . . . . . . . . . . . . . . . . . . . . . . . . . . . . 1
1. Introduction — What Are We Trying To Find Out? . . . . . . . . . . . . . . . . . . 1
2. Data and Analytical Methods . . . . . . . . . . . . . . . . . . . . . . . . . . . . . . . . . . 3
Measurement and Indicators . . . . . . . . . . . . . . . . . . . . . . . . . . . . . . . . 3
Data Sources for Population Assessments . . . . . . . . . . . . . . . . . . . . . . . 6
Issues in Aggregating Data, Making Comparisons, and Assessing Trends . . 7
Samples . . . . . . . . . . . . . . . . . . . . . . . . . . . . . . . . . . . . . . . . . . . . 8
Cutoff Values . . . . . . . . . . . . . . . . . . . . . . . . . . . . . . . . . . . . . . . . 10
Biological Groups . . . . . . . . . . . . . . . . . . . . . . . . . . . . . . . . . . . . . 11
Seasonality . . . . . . . . . . . . . . . . . . . . . . . . . . . . . . . . . . . . . . . . . . 12
Aggregation of Data to Standard Time . . . . . . . . . . . . . . . . . . . . . . . 13
Estimation of Trends . . . . . . . . . . . . . . . . . . . . . . . . . . . . . . . . . . . 18
3. Results: Trends in Reducing Micronutrient Deficiencies. . . . . . . . . . . . . . . 21
Recent Trends in Prevalence of Vitamin A Deficiency . . . . . . . . . . . . . . . 21
Recent Trends in Prevalence of Iodine Deficiency Disorders . . . . . . . . . . 23
Recent Trends in Prevalence of Anemia . . . . . . . . . . . . . . . . . . . . . . . . 26
Levels of Vitamin A, Iodine, and Iron Deficiencies . . . . . . . . . . . . . . . . 30
Overlaps and Multiple Deficiencies . . . . . . . . . . . . . . . . . . . . . . . . . . . 36
4. Conclusions . . . . . . . . . . . . . . . . . . . . . . . . . . . . . . . . . . . . . . . . . . . . . 39
Part II. Program Implementation in the 11990s . . . . . . . . . . . . . . . . . . . . . . 41
1. Introduction. . . . . . . . . . . . . . . . . . . . . . . . . . . . . . . . . . . . . . . . . . . . . 41
2. Types of Programs . . . . . . . . . . . . . . . . . . . . . . . . . . . . . . . . . . . . . . . . . 42
3. Methods, Data Sources, and Treatment of Data . . . . . . . . . . . . . . . . . . . . . 44
General Principles of Data Treatment . . . . . . . . . . . . . . . . . . . . . . . . . 45
Vitamin A. . . . . . . . . . . . . . . . . . . . . . . . . . . . . . . . . . . . . . . . . . . . . 45
Iodine . . . . . . . . . . . . . . . . . . . . . . . . . . . . . . . . . . . . . . . . . . . . . . . 47
Iron. . . . . . . . . . . . . . . . . . . . . . . . . . . . . . . . . . . . . . . . . . . . . . . . . 48
Multiple Micronutrient Programs . . . . . . . . . . . . . . . . . . . . . . . . . . . . 48

[THE MICRONUTRIENT REPORT]vi
4. Results: Progress in Micronutrient Deficiency Control Programs. . . . . . . . . 49
Control of Vitamin A Deficiency . . . . . . . . . . . . . . . . . . . . . . . . . . . . . 49
Control of Iodine Deficiency Disorders . . . . . . . . . . . . . . . . . . . . . . . . 56
Control of Iron Deficiency . . . . . . . . . . . . . . . . . . . . . . . . . . . . . . . . 60
Addressing Multiple Deficiencies . . . . . . . . . . . . . . . . . . . . . . . . . . . . . 62
5. Conclusions . . . . . . . . . . . . . . . . . . . . . . . . . . . . . . . . . . . . . . . . . . . . . 67
References . . . . . . . . . . . . . . . . . . . . . . . . . . . . . . . . . . . . . . . . . . . . . . . . 69
Appendix 11.. Prevalence of clinical signs of vitamin A deficiency in preschool children . . . . . . . . . . . . . . . . . . . . . . . . . . . . . . . . 76
Appendix 2. Prevalence of subclinical vitamin A deficiency . . . . . . . . . . . . . . 77
Appendix 3. Prevalence of iodine deficiency disorders . . . . . . . . . . . . . . . . . 78
Appendix 4. Prevalence of anemia in pregnant women 15–49 years of age. . . . 80
Appendix 5. Prevalence of anemia in nonpregnant women 15–49 years of age . 82
Appendix 6. Prevalence of underweight for 1995 . . . . . . . . . . . . . . . . . . . . . 84
Appendix 7. Prevalence of underweight in 1995 and most recent survey years . 86
Appendix 8. Status of micronutrient supplementation policies and fortification legislation . . . . . . . . . . . . . . . . . . . . . . . . . . . . . 88
Appendix 9. Procurement of vitamin A capsules in relation to need for children 6–12 and 12–59 months of age . . . . . . . . . . . . . . . . . 95
Appendix 1100.. Countries with national immunization days (NIDs), micronutrient (M-NUT) days, Extended Programs for Immunization (EPIs) coupled with vitamin A capsule distribution, or policies for postpartum supplementation, 1998 . . . . . . . . . . 102
Appendix 1111.. Households consuming adequately iodized salt . . . . . . . . . . . . . 106
Appendix 1122.. Reported program coverage for iron supplementation during pregnancy, 1996 . . . . . . . . . . . . . . . . . . . . . . . . . . . . . . . . . . 108
Appendix 1133.. Estimated adequacy of supply and reported program coverage for vitamin A, iodine (through iodized salt), and iron . . . . . . . . 110
Tables1. Indicators of micronutrient deficiencies as established by WHO . . . . . . . . . 4
2. Estimates of clinical and subclinical prevalences of vitamin A deficiency in relation to multiplication factors (WHO 1995). . . . . . . . . . . . . . . . . . . . . 9
3. Summary of five surveys of subclinical vitamin A deficiency reported in WHO (1995) . . . . . . . . . . . . . . . . . . . . . . . . . . . . . . . . . . . . . . . . . . . . 9
4. Prevalence of anemia (hemoglobin < 120 g/L) in nonpregnant women 15–49 years of age . . . . . . . . . . . . . . . . . . . . . . . . . . . . . . . . . . . . . . . . 29
5. Prevalence of anemia (hemoglobin < 110 g/L) in pregnant women 15–49 years of age . . . . . . . . . . . . . . . . . . . . . . . . . . . . . . . . . . . . . . . . 29
6. Prevalence and number of preschool children affected by clinical vitamin A deficiency, 1985–1995 . . . . . . . . . . . . . . . . . . . . . . . . . . . . . . . . . . . . 31

vii
Cont
ents
7. Prevalence and number of preschool children affected by subclinical vitamin A deficiency, 1995. . . . . . . . . . . . . . . . . . . . . . . . . . . . . . . . . . . 32
8. Prevalence and number of people (all ages) with goitre (visible + palpable) in 1990 and 1998 . . . . . . . . . . . . . . . . . . . . . . . . . . . . . . . . . . . . . . . . 34
9. Prevalence and number of women (15–59 years of age) affected by anemia in 1995 . . . . . . . . . . . . . . . . . . . . . . . . . . . . . . . . . . . . . . . . . . . . . . . . 35
10. Prevalence of nutritional problems and implied overlap of deficiencies in preschool children . . . . . . . . . . . . . . . . . . . . . . . . . . . . . . . . . . . . . . . . 38
11. Preferred initial approaches to prevention and control of vitamin A, iodine, and iron deficiencies in populations at different levels of micronutrient malnutrition . . . . . . . . . . . . . . . . . . . . . . . . . . . . . . . . . . . . . . . . . . . . 43
12. Numbers of countries with micronutrient supplementation policies and fortification legislation . . . . . . . . . . . . . . . . . . . . . . . . . . . . . . . . . . . . . 50
13. Regional procurement of vitamin A capsules in relation to need . . . . . . . . . 52
14. Countries with priority for external provision of vitamin A supplements . . . 53
15. Distribution of vitamin A capsules in relation to national immunization days (NIDs), micronutrient (M-NUT) days, Expanded Programs for Immunization (EPIs), and postpartum supplementation policies . . . . . . . . 55
16. Percentage of mothers receiving high-dose vitamin A capsules within 4–8 weeks after delivery in countries reporting presence of a program . . . . . 56
17. Commodities being used for fortification with vitamin A in operational country programs . . . . . . . . . . . . . . . . . . . . . . . . . . . . . . . . . . . . . . . . . 57
18. Households consuming adequately iodized salt, 1995–1998 . . . . . . . . . . . . 57
19. Regional procurement of iron supplements in relation to need . . . . . . . . . 61
20. Commodities being used for fortification with iron . . . . . . . . . . . . . . . . . 63
21. Regional procurement in relation to need for vitamin A, iodine, and iron. . 66
Figures1. Prevalence of subclinical vitamin A deficiency in Southeast Asia . . . . . . . . . 15
2. Trends in clinical vitamin A deficiency . . . . . . . . . . . . . . . . . . . . . . . . . . 19
3. Clinical vitamin A deficiency in preschool children. . . . . . . . . . . . . . . . . . 21
4. Subclinical vitamin A deficiency in preschool children . . . . . . . . . . . . . . . 22
5. Trends in iodine deficiency disorders for nine countries . . . . . . . . . . . . . . 24
6. Prevalence of iodine deficiency disorders in school-age children. . . . . . . . . 26
7. Prevalence of anemia among nonpregnant women 15–49 years of age . . . . . 27
8. Prevalence of anemia among pregnant women 15–49 years of age . . . . . . . . 28
9. Estimated prevalence of clinical vitamin A deficiency among preschool children in 1985 and 1995 . . . . . . . . . . . . . . . . . . . . . . . . . . . . . . . . . . 32
10. Estimated prevalence of subclinical vitamin A deficiency among preschool children in 1995 . . . . . . . . . . . . . . . . . . . . . . . . . . . . . . . . . . . . . . . . . 33
11. Estimated numbers of preschool children affected by subclinical vitamin A deficiency in 1995 . . . . . . . . . . . . . . . . . . . . . . . . . . . . . . . . . . . . . . . . 33
12. Prevalence of anemia among women 15–49 years of age in 1995 . . . . . . . . . 35

[THE MICRONUTRIENT REPORT]viii
13. Summary of regional prevalences of underweight, subclinical vitamin A deficiency, iodine deficiency disorders, and anemia among preschool children in 1995 . . . . . . . . . . . . . . . . . . . . . . . . . . . . . . . . . . . . . . . . . 37
14. Reported program coverage with high-dose vitamin A capsules for preschool children in 1998 and estimated adequacy of external capsule supply . . . . . . 53
15. Prevalence of subclinical vitamin A deficiency and reported coverage of vitamin A supplementation programs in 1998 . . . . . . . . . . . . . . . . . . . . . 54
16. Households receiving adequately iodized salt for the period 1995–1998. . . . 58
17. Prevalence of iodine deficiency disorders and percentage of households receiving adequately iodized salt . . . . . . . . . . . . . . . . . . . . . . . . . . . . . . . 59
18. Reported program coverage with iron supplementation for pregnant women in 1996 and estimated adequacy of external supply . . . . . . . . . . . . . . . . . . 62
19. Prevalence of anemia among pregnant women and reported coverage of iron supplementation programs . . . . . . . . . . . . . . . . . . . . . . . . . . . . . . . . . . 64
20. Percentage of countries reporting high program coverage for vitamin A supplementation, iodine fortification, and iron supplementation . . . . . . . . 65

ix
Fore
wor
d
Micronutrient deficiencies are asignificant cause of malnutrition andassociated ill health among populationsin developing countries. Deficiencies invitamin A, iodine, and iron are knownto be especially prevalent and areassociated with a range of mild (andoften reversible) to severe (and oftenirreversible) effects. At the subclinicallevel of micronutrient deficiency, poorgeneral health and decreased school andwork performance are likely to result,and mortality risk increases. Knownclinical outcomes of micronutrientdeficiencies include impaired growth and cognitive development, poor birthoutcomes, anaemia, cretinism, andblindness.
Global prevalences of micronutrientdeficiencies are remarkably high. In thedeveloping world, more than 40% ofwomen are anaemic, nearly 20% of thepopulation suffers from iodine deficiencydisorders (IDDs), and about 25% ofchildren have subclinical vitamin Adeficiency. The level of clinical vitaminA deficiency is now falling quite rapidly(MI et al. 1998). The prevalence ofIDDs must also be falling in regionswhere the salt is iodized, but as yet thedata are too scarce to verify this. Foranaemia, however, there is no evidence of improvement.
To understand the full extent of theproblem, a reliable assessment ofdeficiency prevalence and proper moni-toring and evaluation of micronutrientprograms are required. To respond to thisneed, the Department of InternationalHealth at Tulane University, theMicronutrient Initiative, and the UnitedNations Children’s Fund (UNICEF)have cooperated in the preparation ofthis report. The report summarizes currentdata on the prevalence of vitamin A,iodine, and iron deficiencies and reportson the implementation and progress of programs to battle these deficienciesin developing countries. Each of thehundreds of different data pointsassembled and analyzed herein representsubstantial data-collection efforts bymany people, all over the world. The
Micronutrient Report is presented in twoparts: (1) a summary of prevalencetrends for deficiencies of vitamin A,iodine, and iron; (2) a description ofthe status of current programs aimed at preventing or reducing micronutrientdeficiencies.
It is hoped that this report helps both to establish a reference point by whichpriorities for program content andcoverage can be better informed and abaseline from which progress in deficiencyprevention can be measured. The baselineestimates, given here and to come in the
Foreword

[THE MICRONUTRIENT REPORT]x
future, will provide for updated trendestimates in future reports. The reportaims to give guidance on appropriatemethods for future assessment of trendsin deficiencies and interventions. It alsoidentifies specific gaps in existing data —anaemia prevalences at the national levelfor instance — that need to be addressed.National surveys need to be carried outregularly, with attention to comparabilitythrough time and between countries.Proper evaluations will not only help tobetter assess the progress of programsbut will also help to inform the mostcost-effective and sustainable means ofpreventing micronutrient deficiencies.
Tulane University, the MicronutrientInitiative, and UNICEF are pleased toreport the great increase in the extent ofmicronutrient policies and programs,especially vitamin A supplementationand salt iodization. Many countries haveimplemented large-scale programs to reduce vitamin A and iodinedeficiencies. Accelerated decreases in theprevalence of micronutrient deficienciescould rapidly result from furtherprogram expansion.
The time is right to act more widely stillon micronutrient deficiencies. Althoughencouraging progress is already evident,much more remains to be achieved.Low-cost interventions are alreadyavailable, and research for additionalsolutions is advancing. More resourcescould be mobilized toward the effort,and more effective programs could beimplemented on a larger scale. Controlof micronutrient deficiencies, notablyIDDs and vitamin A deficiency, is set to become a major public health andnutrition success story, in the league of
smallpox eradication. We hope that thisreport — intended to be the first of aregular series, in print and availableonline with regular updates — willprovide useful information forexpanding and supporting these efforts.
M.G. Venkatesh MannarExecutive DirectorThe Micronutrient InitiativeOttawa, Canada
Werner SchultinkSenior Advisor, MicronutrientsUNICEFNew York, USA
Robert MagnaniActing ChairDepartment of International Health and DevelopmentSchool of Public Health and Tropical MedicineTulane UniversityNew Orleans, USA
xi
Ackn
owle
dgem
ents
This report results from a great deal of data compilation and analysis by many people. The epidemiological dataoriginated from hundreds of surveys,usually analyzed in the countriesconcerned, and then summarized andcompiled through international bodiessuch as the World Health Organization,the United Nations University, theInternational Council on the Control of Iodine Deficiency Disorders (mostlythrough the University of Virginia), and the United States Agency forInternational Development and itscontracting institutions such asOpportunities for MicronutrientIntervention, the International Vitamin A Consultative Group, theInternational Nutritional AnemiaConsultative Group, and others.Program data came both from responsesto questionnaires by country offices ofthe United Nations Children’s Fund(UNICEF) and from demographic andhealth surveys (Macro International),multiple indicator cluster surveys, andlocal surveys. Both earlier and morerecent compilations of information onpolicies, legislation, and programs in the MN-Net — a system of onlinedatabases maintained by theMicronutrient Initiative (MI), which was itself updated as part of this
work — all contributed. Some of thematerial on vitamin A was previouslypublished in Progress in Controlling Vitamin A
Deficiency (MI et al. 1998). Our thanksare due to the many people who haveworked at the different stages to measureindicators, accumulate data, and analyzeand summarize the information.
We are grateful for comments fromJean-Pierre Habicht, Fernando Viteri,and François Delange, who reviewed Part I of the report, and UNICEF, MI, and Tulane University staff whochecked the voluminous data in Part II.
At UNICEF, Roger Shrimpton andWerner Schultink provided support and help in many ways. At the MI,Venkatesh Mannar showed patience and gave encouragement. Many thanks to these and others at their institutions.
Our particular thanks are due to staff in the UNICEF country offices forcompleting the questionnaires and toTulane University students — some of whom are coauthors — and others who contributed in various ways:Roxanne Johnson, Pam Opdyke, Nate Smith, and Erica Wetzler.
Acknowledgments

[THE MICRONUTRIENT REPORT]xii
We gratefully acknowledge financialsupport from the MI to the Depart-ment of International Health andDevelopment, Tulane University School of Public Health and TropicalMedicine, to enable this work to beundertaken.
John B. Mason, PhDMahshid Lotfi, PhD
xiii
Exec
utiv
e Su
mm
ary
Micronutrient deficiencies affect nearly half of humanity. In this report,we summarize the extent of and trends in deficiencies of vitamin A, iodine, and iron (in part I) and progress inprograms for their control (in part II).The main purpose is to establish abaseline from which to set priorities for program interventions and forconducting research and development to accelerate progress.
A view of trends through time is neededto assess progress: it makes a lot ofdifference whether matters are gettingbetter or worse, how fast the changes are occurring, and whom they affect.Part I of this document describesmicronutrient deficiencies and theirtrends, and Part II presents informationon program implementation. Where thetrends show improvements, the issuesinclude how to sustain the interventionsand generate permanent solutions —achieving full coverage, with adequatemonitoring and quality control. Wherethere are no real trends of improvement,steps are needed to find and implementeffective, large-scale programs suited toconditions in poor countries.
Overlap between deficiencies andinteractions between nutrients have so far received relatively scant attentionin large-scale programs. However,supplementation and fortification withmultiple micronutrients may make moresense both biologically and operationallyand should result in enhanced healthbenefits. Viewing the information in amore integrated way is thus the logicalnext step, rather than perpetuating theboundaries between deficiencies, whichexist mostly for recent historical reasons.We can also learn from comparing andcontrasting experiences with collection,analysis, and interpretation of dataconcerning different deficiencies, which in turn should lead to moreeffective and integrated surveillance in the future. In this document,underweight in children is also includedfor comparative purposes, in partbecause it is the most widely availableindicator of general malnutrition.
Recent trends in prevalences of clinical vitamin A deficiency, assessed by comparing results of repeatednational surveys (available from eightcountries), have shown improvements.
ExecutiveSummary
[THE MICRONUTRIENT REPORT]xiv
Furthermore, comparisons of regionalestimates of the prevalence of clinicalvitamin A deficiency for 1985 and 1995 indicate an overall trend of strongimprovement. The global prevalence of clinical vitamin A deficiency for 1995is probably best estimated as 1.2% inpreschool children (a value based onreported prevalences that have not beenreduced according to assumptionsrelated to survey coverage, such as theWorld Health Organization [WHO]multiplication factor; the globalprevalence would be 0.6% if this factorwere used — see Table 2). For subclinicalvitamin A deficiency, defined as serumretinol level of less than 0.7 µmol/L, thetrend is less clear because of the scarcityof data; however, calculations based onsubclinical results, which are almostalways obtained from surveys conductedindependently of assessments of clinicalvitamin A deficiency, support the ideathat a significant improvement is underway. On a global basis, it is estimatedthat 75–140 million preschoolers areaffected by subclinical vitamin Adeficiency, with the upper limit of thisrange thought to be more likely. Thehighest prevalences of both clinical andsubclinical vitamin A deficiency occur in South Asia and sub-Saharan Africa,where 30% to 40% of preschoolchildren are at heightened risk of illhealth and death because of thisdeficiency and which is home to 100 million of the 140 million people worldwide who are affected bysubclinical vitamin A deficiency.
By the late 1990s, about half of thecountries in the developing world hadadopted national policies for addressingvitamin A deficiency, including two-thirds of countries in East Asia and thePacific region and one-third of those inthe Middle East and northern Africa. Inmost cases, distribution of high-dosevitamin A capsules was an important part of the policy. Over the period1993–1998 over 100 million capsules,on average, were distributed annually,and high levels of coverage were achievedin many countries in the mid-1990s.Operationally, it is useful to identifycountries with high prevalence ofvitamin A deficiency and low coverage of the population throughsupplementation programs, which would be possible priorities for programdevelopment, as well as countries withsignificant prevalence of deficiency andhigh coverage through supplementationprograms, but low ability to procure thesupplement. Some of these countries(those without domestic sources ofvitamin A capsules) might have priority for external provision of thesupplement. Such considerations arguethat priority for program developmentshould go to Burundi, Chad, India,Malawi, and Pakistan, and that thequestion of increasing the externalsupply of capsules to Bangladesh and the Philippines should be explored.These analyses should be updated asprograms change.

xv
Exec
utiv
e Su
mm
ary
Thirty-nine countries reporteddistribution of vitamin A supplementsduring national immunization days or in conjunction with other massimmunization campaigns. In the African countries, this was by far thecommonest method, and severalcountries distributed supplements in this way although they had no nationalpolicy on supplementation. Vitamin Asupplementation is also being integratedinto routine visits to mother and childhealth clinics and is occurring throughcommunity-based nutrition programs.These methods reportedly lead to highcoverage rates for children. Moreover,44 countries reported adoption ofpolicies for supplementation of allmothers with a high-dose vitamin Acapsule within 8 weeks after childbirth.
Fewer than half of the roughly 50 countries that have a national policyfor addressing vitamin A deficiency alsohave legislation governing fortificationof foods with this micronutrient. InLatin America and the Caribbean,supplementation is not a commonapproach, and more reliance is placedon fortification. Sugar and margarineare the commodities most often fortifiedin developing countries (usually whenlegislation is in place, except for sub-Saharan Africa); maize flour, vegetableoil, rice, and dairy products are alsoused. Research and pilot projects areunder way in several other countries.
Overall, a judicious conclusion is thatvitamin A deficiency is extensive andserious, but that there is an underlyingtrend of improvement, which could beaccelerated by large-scale programs.
The prevalence of iodine deficiencydisorders, assessed as visible pluspalpable goitre, is about 20% to 30% in Africa and the easternMediterranean region (includingPakistan); estimates for Southeast Asiaare lower. The total number of peopleaffected in these countries was estimatedat nearly 600 million in 1998, out of atotal of 740 million people thought tobe affected by goitre worldwide. About80 national surveys of goitre have beencarried out since 1970, but only for 8 countries were repeat surveys that werelikely to be comparable identified. Fortwo additional countries (Cameroon andPeru) progress was tracked by a sentinelsite monitoring system.
It appears that rapid improvementoccurs when adequately iodized salt, withwide population coverage, is introduced.This outcome is expected, given thelong-established effectiveness of saltiodization. What is uncertain is thetrend before widespread programs wereimplemented. [In most of the countriesfor which repeat data are available, someextent of iodine-deficiency control hadbeen undertaken.] Thus, a pattern ofimprovement has been observed inEthiopia, Indonesia,
[THE MICRONUTRIENT REPORT]xvi
Viet Nam, and Zambia. About 68% ofhouseholds are now getting adequatelyiodized salt, and three-quarters of thecountries in the developing world havelegislation in place for iodization of salt. Nearly 90% of households in Latin America and the Caribbean areusing adequately iodized salt. Thecorresponding figures are 65% to 75%for Asia, 50% to 74% for sub-SaharanAfrica, and about 50% for the Near East and northern Africa. The lowestcoverage with adequately iodized saltoccurs in the former Soviet Union.Countries that should have priority forassistance might be those with significantprevalences of goitre (e.g., more than10%) and low percentages of householdsusing adequately iodized salt (e.g., lessthan 30%) — examples are Burkina Faso,Ethiopia, Ghana, Mauritania, and thePhilippines.
A comparison of the estimates for 1990and 1998 indicates little change in theprevalence of iodine deficiency disordersover this period. When the results fromnationally representative surveys arepooled by groups of countries andperiods (1980–1989, 1990–1999), the averages indicate no overallimprovement and indeed possibledeterioration. This apparent increase,reported by the WHO, may reflectincreased effort to identify the deficiencyin recent years and should probably not be taken as evidence for generaldeterioration. It does, however, supportthe idea that significant improvementoccurs only when effective salt iodizationprograms are in place. It also stresses the
lack of representative data that wouldallow a better assessment of trends.
Improving quality control for the iodinecontent of salt is now a key issue. Lack ofquality control is one major reason thataccess to iodized salt is not even higherthan it is. The other reason is thatdistribution and marketing of iodizedsalt still has not reached more remoteareas, which is a particular problem incountries where there are large numbersof small, traditional producers.
No repeated, comparable survey resultsat the national or subnational level couldbe found for iron deficiency, which isusually assessed as anemia. Thus, directcomparisons for determining trends arenot possible. This situation is seriousnow but will become worse if twodeliberate efforts are not begun soon:first, to select existing survey results andensure that repeat surveys generatingcomparable data are undertaken, andsecond, where such surveys do not exist,to begin establishing a baseline fromwhich trends can be estimated in thefuture. The data compiled for thisreport showed too great a variation to allow any meaningful conclusions.The results for nonpregnant women,representing about 90% of the femalepopulation, are more likely thanpregnant women to be representative ofthe overall population. Prevalences havebeen calculated for 1995, and they aresimilar to the averages for the period1975–1997 since there is little apparentchange over time. These values show that Asian countries have the highest

xvii
Exec
utiv
e Su
mm
ary
prevalences of anemia among bothnonpregnant and pregnant women,about 60%. For developing countries as a group, the average prevalences are42% and 56% for nonpregnant andpregnant women, respectively, and anestimated 1.14 billion nonpregnantwomen and 96 million pregnant women are anemic.
The variation among regions tends to be higher for pregnant women than fornonpregnant women, which confirms a wider range of anemia prevalencesamong subgroups of the population.Despite this variation, a consistentpattern of higher prevalence amongpregnant than among nonpregnantwomen is evident across all regions, and the numbers of women affected are increasing. An exception is in SouthAsia, perhaps because prevalences havealready peaked in this region. The datavary enormously, although they havebeen carefully examined for possibleerrors. It is reasonable to stateconservatively that there has been nodetectable change in any region. But astronger assertion may be valid: there isno improvement in rates of anemia formost women in developing countries.
Pregnant women are the most commontarget group for iron supplementationprograms, and it is mainly for this groupthat data on program coverage areavailable. For the 39 countries reportingon coverage, the range is wide; somecountries reported up to 100% coverage(e.g., Cuba and Nicaragua), whereasothers, such as Tunisia, reported very
low coverage (10%). These figures aresomewhat difficult to interpret, as theyrefer only to women registered inprograms and do not estimate adherenceto the required regimen of frequentsupplementation throughout pregnancy.Furthermore, not many countriesreported supplementation programs,and, for those that did, the programsbore little relation to need. Althoughprogram coverage needs to be expanded,there is a sense that countries may bewaiting for better methods to beidentified and demonstrated.
Data from the United Nations Children’sFund (UNICEF) on procurement ofiron tablets are less informative thandata for vitamin A capsules, because ahigher proportion of iron supplementsare obtained from suppliers other thanUNICEF. Nonetheless, the supply ofiron tablets may be much lower than theneed; only 3% of the need for pregnantwomen is currently being met byUNICEF. Even if the supply in relationto need were calculated on the basis ofweekly supplementation, this supplywould still be less than 20% of the needfor pregnant women. Because supplyproblems have been considered a majorconstraint, improvement of the low levelof external supply could be a step towardgreater program effectiveness.
Fortification of foods with iron is ofgreat potential importance, and forti-fication of wheat is being widely adopted;this is especially relevant where wheat isthe staple food. Solutions to thetechnical problems that remain for

[THE MICRONUTRIENT REPORT]xviii
fortifying rice would represent a majorbreakthrough in controlling irondeficiency, and such solutions can beanticipated in the foreseeable future.Meanwhile, a number of othercommodities are being tried at bothexperimental and large scales — premixesto be added to rice and commerciallyprocessed foods (e.g., in Thailand), saltin India and elsewhere (which presentsseparate technical challenges, particularlyif iodized salt is used), and sugar.
The prevalence of multiple (two or more)deficiencies is estimated at between 10%and 25% among preschool children.Such estimates are valuable for providingsome idea of the extent of the problemand stressing that tackling one micronu-trient at a time may lead to only limitedsuccess in controlling the effects ofmicronutrient deficiencies. Twenty-eightcountries have policies for addressing allthree of the deficiencies that currentlyhave priority (vitamin A, iodine, and iron).Although these policies have not yet beentranslated into integrated approaches(such as multiple supplementation andfortification), these countries couldprovide valuable opportunities now formultiple micronutrient supplementationand fortification interventions.
In summary, iodization of salt is the mostextensive micronutrient intervention atpresent. Coverage through vitamin Asupplementation is 60% or more in about30 countries, half of these in Asia andsub-Saharan Africa; in Latin Americamore reliance is put on fortification with vitamin A than supplementation.Iron supplementation is lagging: only 20 countries report more than 60%
coverage of pregnant women, and thisfigure is likely a considerable overestimateof actual supplementation, given theknown logistic and adherence problemsfor iron tablets.
Control of micronutrient deficiencieshas gathered much momentum in the past 10 years. The trends areundoubtedly positive for iodine andvitamin A. For iodine, the improvementis due to iodized salt. For vitamin A,there is a positive underlying trend thatmust be accelerated by continuing andexpanding programs of supplementationand fortification (which must overlap,not substitute for, one another until it issafe to do so). Research on controllingiron deficiency is urgently needed, mainlyto find effective fortification methods.Multiple micronutrient interventionsshould increase in importance. Thecurrent momentum must be sustainedand reinforced. With this momentum,the goals of eliminating or greatlycontrolling these deficiencies can beachieved in the foreseeable future.

The extent of micronutrient deficienciesis well known. The World HealthOrganization (WHO) estimates thatanemia affects about 2 billion people in the world (WHO 1997), or aboutone-third of the population, womensuffering the most. Judging by the extent of goitre, the usual sign of iodinedeficiency, about 13% of the populationor 740 million people are disadvantagedthrough lack of this nutrient, of whichonly minute amounts are needed (WHO 1999). Vitamin A deficiency,while less common clinically, is presentin subclinical form — increasing risks of ill health and death — in at least
one-quarter of children in developingcountries (WHO 1995; MI et al. 1998).Moreover, these problems certainlyoverlap and interact, so many peoplemust have multiple deficiencies.
Such estimates of prevalences andnumbers of people affected, summarizedby groups of countries and over rangesof time, are periodically issued by the United Nations (UN) system.Comprehensive regional estimates ofdeficiencies of vitamin A, iodine, andiron were released in 1992 (ACC/SCN1992, chapter 3) and updated in 1996(ACC/SCN 1997). National and
1
Wha
t ar
e w
e tryi
ng t
o fin
d ou
t?[
TREN
DS
IN P
REVA
LENCE
S ]
1.Trends inPrevalences1. INTRODUCTION — WHAT ARE WE TRYING TO FIND OUT?
[THE MICRONUTRIENT REPORT: PART 1]2
subnational estimates are available on the Micronutrient Initiative (MI) Web site (MI 1999), which is nowupdated to 1999.
Although keeping information up to date is important, its assembly andinterpretation as a basis for policy andprogram decisions are crucial. Withoutthese steps, we are “flying blind.” Twoaspects are particularly useful. First, aninternally consistent review of the extentand severity of deficiencies, for allaffected countries at a defined point intime, is needed to determine prioritiesfor resource allocations. Second, a reviewof trends in deficiencies through time, ata reasonable level of disaggregation, isneeded to assess progress: it makes a lot of difference whether matters are gettingbetter or worse, how fast the changes areoccurring, and who is affected. Evaluationresearch is needed to determine whetherpositive changes can be ascribed tointervention, although this may requirecollection of specific new data rather than interpretation of existing cross-country data.
The consequences of single micronutrientdeficiencies and the best means ofcontrolling them are adequately estab-lished as a basis for advocacy and foreffective control of the deficiencies. For example, the US Institute ofMedicine has recently issued a definitivepublication covering the three majorknown deficiencies (Howson et al.1998b), and the MI, individualmicronutrient groups such asInternational Vitamin A Consultative
Group, and UN agencies have allprovided guidance on specific nutrients.Overlap between deficiencies, and theirinteractions, have so far not received asmuch attention, and an attempt is madeto do so later in the current report.
The most obvious deficiencies are theeasiest to tackle, and those more difficultto observe tend also to be the mostdifficult to prevent. This pattern extendsto the quantitative demonstration of the consequences of deficiency and tomonitoring. Thus, vitamin A deficiency is known to cause blindness and itsprevention demonstrably protects sight, as well as substantially reducing death inchildren (and probably mothers) in areasof deficiency. Moreover, prevention canbe readily achieved through an infrequentsupplement, whose distribution can bemonitored in a straightforward manner.Similarly, iodine deficiency has visiblydistressing results, such as cretinism,which is easily prevented, at least inprinciple, by iodized salt, and the use ofiodized salt can also be simply tracked.Conversely, iron deficiency anemia is lessreadily observed and less easily prevented.General malnutrition, assessed by growthfailure, often goes unrecognized but is the largest single risk factor in the globalburden of disease (Murray and Lopez1997). It can be improved throughcommunity-based programs, but these are much more complex than those aimed at micronutrient deficiencies.
Comparative data on nutrientdeficiencies and progress in controllingthem must therefore also redress these

3
Dat
a an
d an
alyt
ical
met
hods
[ TR
ENDS
IN P
REVA
LENCE
S ]
perceptual imbalances, between obviousand more easily tackled problems andtheir opposites. As will be seen, thisapplies notably to iron deficiency. It isvery likely that other deficiencies areimportant but not systematically assessedand that they interact with the better-recognized ones. The control ofmicronutrient deficiencies no longerfocuses on one deficiency at a time, andmultiple micronutrient supplementationand fortification may make more senseboth biologically and operationally.
Viewing the available information in amore integrated way is thus the logicalnext step, rather than perpetuating theborders between deficiencies, which existmostly for recent historical reasons. Inthis report, underweight in children isincluded for comparative purposes, in part because it is the most widelyavailable indicator of malnutrition. We can learn also from the experienceswith data collection, analysis, andinterpretation by comparing andcontrasting the deficiencies, which inturn should lead to more effective andintegrated surveillance in the future.Moreover (as will be seen), time shouldbe taken to obtain baseline data designed
to be comparable over time — withoutsuch data now (and it is scarce in manyareas), it will not be possible to assesschanges in the future, nor to implementfully effective interventions now.
The overall aim of this report is tosummarize trends and levels ofdeficiencies to determine priorities forprogram interventions and development,including research. Thus, where thereare established trends in eliminatingdeficiency, sustaining the interventionsand moving to more permanentsolutions may be the issues. At the same time, fostering full coverage ofthose affected (or, for iodine, fosteringuniversal coverage) becomes a priority,along with good monitoring and qualitycontrol. Where there are no real trendsof improvement, steps are needed tofind effective programs suited to theservices and structural conditions ofpoor countries and to find innovativeways to implement such programs on a large scale. The results in this part of the report describe the deficienciesand their current trends. Part II of thereport presents information on programimplementation, to guide policy forprogram development.
2. DATA AND ANALYTICAL METHODS
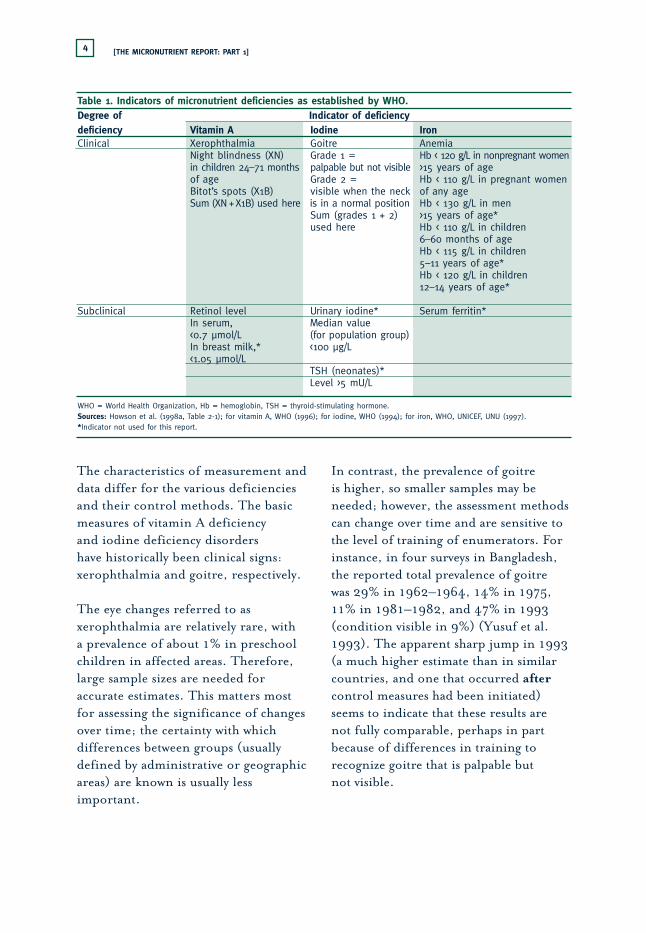
Measurement and IndicatorsThe indicators of micronutrientmalnutrition for vitamin A, iodine, and iron, as established by WHO andassociated bodies, are summarized inTable 1 (WHO 1994, 1996; WHO,
UNICEF, UNU 1997; Howson et al.1998b). Clinical indicators are commonto all three. Subclinical (biochemical)measurement is also important, especiallyfor vitamin A (for which deficiencyappears as low serum levels of retinol).
[THE MICRONUTRIENT REPORT: PART 1]4
The characteristics of measurement anddata differ for the various deficienciesand their control methods. The basicmeasures of vitamin A deficiency and iodine deficiency disorders have historically been clinical signs:xerophthalmia and goitre, respectively.
The eye changes referred to asxerophthalmia are relatively rare, with a prevalence of about 1% in preschoolchildren in affected areas. Therefore,large sample sizes are needed foraccurate estimates. This matters most for assessing the significance of changesover time; the certainty with whichdifferences between groups (usuallydefined by administrative or geographicareas) are known is usually lessimportant.
In contrast, the prevalence of goitre is higher, so smaller samples may beneeded; however, the assessment methodscan change over time and are sensitive tothe level of training of enumerators. Forinstance, in four surveys in Bangladesh,the reported total prevalence of goitre was 29% in 1962–1964, 14% in 1975,11% in 1981–1982, and 47% in 1993(condition visible in 9%) (Yusuf et al.1993). The apparent sharp jump in 1993(a much higher estimate than in similarcountries, and one that occurred aftercontrol measures had been initiated)seems to indicate that these results arenot fully comparable, perhaps in partbecause of differences in training torecognize goitre that is palpable but not visible.
Table 1. Indicators of micronutrient deficiencies as established by WHO.Degree of Indicator of deficiencydeficiency Vitamin A Iodine IronClinical Xerophthalmia Goitre Anemia
Night blindness (XN) Grade 1 = Hb < 120 g/L in nonpregnant womenin children 24–71 months palpable but not visible >15 years of ageof age Grade 2 = Hb < 110 g/L in pregnant women Bitot’s spots (X1B) visible when the neck of any ageSum (XN +X1B) used here is in a normal position Hb < 130 g/L in men
Sum (grades 1 + 2) >15 years of age*used here Hb < 110 g/L in children
6–60 months of ageHb < 115 g/L in children5–11 years of age*Hb < 120 g/L in children12–14 years of age*
Subclinical Retinol level Urinary iodine* Serum ferritin*In serum, Median value<0.7 µmol/L (for population group)In breast milk,* <100 µg/L<1.05 µmol/L
TSH (neonates)*Level >5 mU/L
WHO = World Health Organization, Hb = hemoglobin, TSH = thyroid-stimulating hormone.Sources: Howson et al. (1998a, Table 2-1); for vitamin A, WHO (1996); for iodine, WHO (1994); for iron, WHO, UNICEF, UNU (1997). *Indicator not used for this report.

5
Dat
a an
d an
alyt
ical
met
hods
[ TR
ENDS
IN P
REVA
LENCE
S ]
Anemia is widely used as a measure ofiron deficiency. Several complicatingfactors must be borne in mind, both interms of the relation between anemiaand iron deficiency and in terms ofother causes of anemia. Iron deficiencyis estimated to be twice as prevalent asanemia, where malaria is not endemic(Viteri 1998). Strictly speaking, thepopulation can be divided into fourgroups — anemic and iron deficient,anemic for reasons other than irondeficiency (see below), iron-deficientand not anemic, and neither anemic nor iron-deficient (see also ACC/SCN1992, p. 43). Anemia is usuallyconsidered a measure of iron deficiency,because prevalences of anemia notrelated to iron deficiency anemia(notably that caused by malaria) andnonanemic iron deficiency may roughlybalance, but this relationship has notbeen verified for a range of countries.Malaria is the main confounder, but anemias due to other nutrientdeficiencies and other causes of irondeficiency — especially intestinalparasites (hookworm and whipworm) —also complicate the estimates.Nutritional deficiencies that causeanemia are notably those of folic acid,vitamin B
12, and vitamin A. Lack ofvitamin C also contributes, by inhibitingiron absorption; other inhibitorsinclude dietary tannins (in tea) andphytates (in cereals).
Other measures of micronutrientdeficiencies depend on biochemical assay of blood, serum, or urine. Serumlevel of retinol is becoming a widely used
measure of vitamin A deficiency and isdiscussed later. Urinary iodine measuresare sometimes available on a populationbasis. For anemia, hemoglobinconcentrations in the blood constitutethe basic measure; other indicators (such as ferritin and transferrin in the serum) are rarely measured on apopulation-wide basis and do notcontribute to the overall picture.
The most widely available measure ofgeneral malnutrition is underweightchildren. This measure is also useful in this context, in part because itsummarizes malnutrition. Child weightprobably responds to some extent tomicronutrient deficiencies in the motheror the child or both. Reference togeneral malnutrition, measured by theprevalence of child underweight, ratherthan protein-energy malnutrition, isbased on the realization that child growthdeficits can be due to micronutrienteffects, both in utero and during earlychildhood. This principle applies to milddeficiencies of “type II” nutrients andmore severe cases of “type I” nutrientdeficiencies (Golden 1994, 1995), type Ireferring to micronutrients with specificsigns of clinical deficiency (vitamin A,iodine, and iron are all of this type) andtype II referring to those without specificclinical signs, for which growth failure is a first response to deficiency (proteinand zinc are examples). Thus, prevalenceof underweight is included in some of the results used here. Althoughstunting is a better measure of cumulativemalnutrition, prevalence of underweightis more widely available. Because it is

[THE MICRONUTRIENT REPORT: PART 1]6
strongly associated with stunting,underweight is a good proxy indicator ofthis condition and hence of cumulativemalnutrition in most populations.
In sum, the following four groups ofindicators are used in this report:
➧ vitamin A deficiency: as the clinicalindicator, prevalence of eye changes(night blindness or Bitot’s spots) in preschool children (<5 years ofage); as the subclinical indicator,prevalence of serum retinol <0.7 µmol/L in preschool children;
➧ iodine deficiency disorder: totalgoitre rate, the prevalence of goitre(both palpable only and visible) inschool-age children (5–15 years ofage) or in the total population;
➧ anemia: prevalence of hemoglobin(Hb) level <120 g/L in nonpregnantwomen 15–49 years of age; data onpregnant women of the same age with Hb <110 g/L are also used;
➧ general malnutrition: underweight in children 6–59 months of age,defined as body weight more than two standard deviations below meanweight for age, according to NationalCenter for Health Statistics (NCHS)and WHO standards (WHO 1983).
Data Sources for Population AssessmentsThe most useful data for the presentpurposes derive from nationallyrepresentative surveys. Although suchsurveys are common for anthropometry(e.g., demographic and health surveys,surveys by the United Nations Children’s
Fund [UNICEF], and multiple indicatorcluster surveys), they are less widelyavailable for micronutrient deficiencies.For iron, most results derive from clinic or small-scale survey data onanemia in pregnant women, and theirrepresentativeness is unknown. A smallerset of results is available for nonpregnantwomen; these are more often fromsurveys intended to assess populationprevalences and therefore are probablymore reliable for this purpose, eventhough they have fewer data points. For clinical vitamin A deficiency and foriodine deficiency disorders, the surveyshave generally been aimed at populationassessment of areas within countries,rather than at a national level; this surveycharacteristic has led to some difficultiesin comparison and aggregation.
Compilations of survey results arepublished periodically by WHO: forvitamin A deficiency, WHO (1995); foriodine deficiency disorders, from theInternational Council on the Control ofIodine Deficiency Disorders (ICCIDD),WHO, and UNICEF, as WHO (1993,1999); and for iron, WHO (1992,1997). Recently, these results and othersidentified from the literature and fromthe MN-Net have been recompiled andare now available on the World Wide Web through the updated MN-Net (MI 1999). These data are used here.The data on vitamin A deficiency werepublished earlier as MI et al. (1998), and a few new results have been added.The iron data were reported in Mason,Sethuraman, Mason, et al. (1998). Theiodine deficiency data are available at the
7
Dat
a an
d an
alyt
ical
met
hods
[ TR
ENDS
IN P
REVA
LENCE
S ]
Web sites of ICCIDD (ICCIDD 2000)and the MI (MI 1999). An earliercompilation was given in Mason,Sethuraman, Gilman, et al. (1998).Results from these sources were alsoincluded in the databases and are listed in Appendixes 1 to 5.
Issues in Aggregating Data, Making Comparisons, and Assessing Trends
Single estimates of prevalences are of limited meaning until they arecompared either with norms or withother estimates. Cutoff values andinterpretation of prevalences below theselevels are suggested, usually by WHO.For example, a prevalence of nightblindness of more than 1% amongpreschool children and a prevalence of low serum retinol (<0.7 µmol/L) ofmore than 10% have been suggested asdefining public health problems relatedto vitamin A deficiency (WHO 1996);these are examples of using normativevalues for interpretation. Available data must be checked and sometimestransformed for comparison with suchnorms, which also raises the issue of thepopulation to which the original datarefer or of which these data are taken as representative.
Further meaning comes from comparingestimates between different groups,usually countries or regions, to indicatepriorities for resource allocation, for instance. Often the most usefulcomparisons are those through time, to assess progress. Such comparisons
necessitate ensuring that the estimatesare in fact comparable and thus can alsobe aggregated, usually for groups ofcountries (regions), or compared validlyover time to give an assessment oftrends. Assessing the validity of suchcomparisons and aggregations togenerate self-consistent sets of data is the most time-consuming feature ofassembling and interpreting these data.
Results were obtained from summarizedreports, in which the variances andconfidence intervals of the estimateswere not systematically given (nor werethe sample sizes always similar). Theseproblems preclude reassembling the datafor meta-analysis. It should be stressedtherefore that the sample numbers givenrefer to numbers of survey results — i.e., the prevalence estimates for acountry-year — each of which is derivedfrom many individual measurements(often in the thousands). Thus, althoughthe significance of differences cannot berealistically tested, it is certainly greaterthan that reported from treating(unavoidably) each survey result as onecase. For example, the 35 data points onclinical vitamin A deficiency representmany thousands of measurements, and if we could directly compare any two of these (say) as two surveys, wecould estimate the significance of thedifference; just comparing two summarydata points can give only the size of thedifference, not whether it is likely to be due to chance. Nonetheless, thesignificances estimated are likely to be highly conservative because of this constraint.

[THE MICRONUTRIENT REPORT: PART 1]8
Such comparisons can refer to differentactivities (vitamin A vs iodine, forinstance), to different countries, or togroups of countries. The grouping intoregions is mainly a summarizationprocess for the first case — comparingproblems within a region — but aims to draw attention to regions of greatestneed in the second — such as the very high levels of anemia among Asian women.
Valid assessment of trends in practice has more rigorous requirements thancomparisons of data across countries forone point in time. For example, rankingcountries, or areas within countries, by prevalence usually shows quite largedifferences — a rule of thumb is that at least a doubling of prevalence isgenerally seen between better- andworse-off areas — and hence a minimumdifference of 5 percentage points is oftenadequate. However, in a trend analysis,changes of less than 1 percentage pointper year (for underweight children about 0.5 percentage points per year isaverage) may be of interest; thus, morecertainty about smaller differences isneeded for assessment of trends.
The main factors to be considered incomparing two or more results are samples(design, size, and multiplication factors),cutoff points (and standards), biologicalgroups, seasonality, date of estimate, and standardized time for aggregation,population weights, and assessment oftrends. These factors will be discussedfirst, and then methods of aggregation and trend estimation will be described.
SamplesSamples were designed to berepresentative (i.e., deliberately selected in population surveys, usually as multistage cluster designs) or weretaken from people attending clinics orschools, a self-selected and thus usuallybiased sample of the overall population.Although in the latter case it is difficultto relate data to population estimateswhen the clinical data are scarce (e.g., xerophthalmia and anemia),sometimes these samples give results that are judged (by those compiling andpublishing the data) to be at least betterthan nothing. For example, the majorcompilations of data on vitamin Adeficiency and anemia by WHO (1992, 1997) listed results from bothtypes of sources, and attempts were madeto aggregate after selection. Here, exceptfor anemia, the aim has been to includeonly results that are based on someattempt at representative sampling.Another issue is the size of the sample,which affects the confidence intervalsaround the estimates (although these are generally unknown). Many samplesreported are very small; here a minimumof 100 was used for inclusion. Forexample, the 35 results listed inAppendix 1 for clinical vitamin Adeficiency include 13 national surveys,the rest covering subnational areas. The data given in Appendixes 1 and 2for vitamin A deficiency are those used here for aggregation.
An approach used by WHO for thevitamin A deficiency data, to address the question of how to use samples of
9
Dat
a an
d an
alyt
ical
met
hods
[ TR
ENDS
IN P
REVA
LENCE
S ]
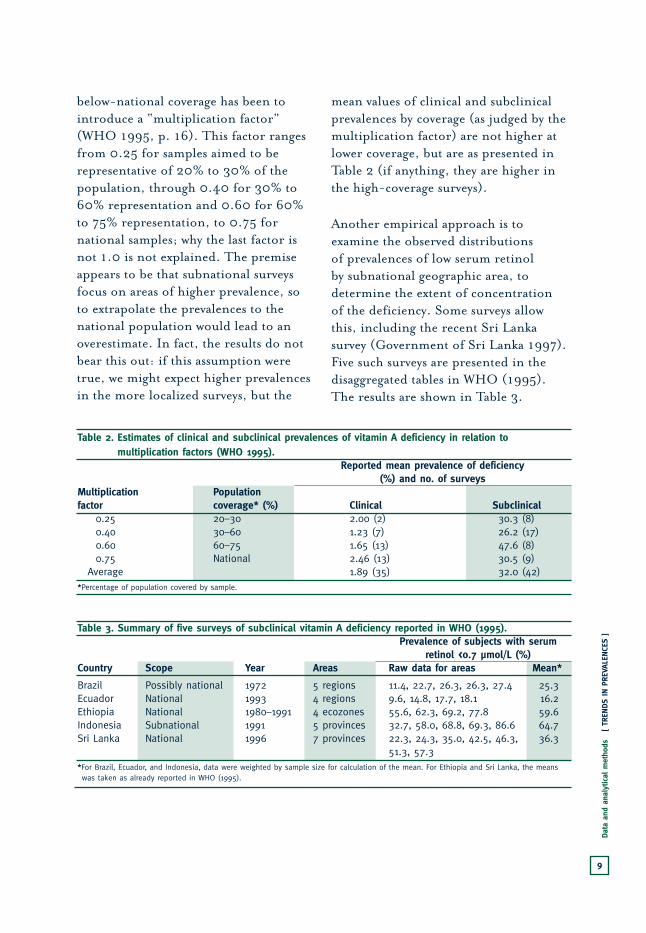
below-national coverage has been tointroduce a “multiplication factor”(WHO 1995, p. 16). This factor rangesfrom 0.25 for samples aimed to berepresentative of 20% to 30% of thepopulation, through 0.40 for 30% to60% representation and 0.60 for 60%to 75% representation, to 0.75 fornational samples; why the last factor isnot 1.0 is not explained. The premiseappears to be that subnational surveysfocus on areas of higher prevalence, soto extrapolate the prevalences to thenational population would lead to anoverestimate. In fact, the results do notbear this out: if this assumption weretrue, we might expect higher prevalencesin the more localized surveys, but the
mean values of clinical and subclinicalprevalences by coverage (as judged by themultiplication factor) are not higher atlower coverage, but are as presented inTable 2 (if anything, they are higher inthe high-coverage surveys).
Another empirical approach is toexamine the observed distributions of prevalences of low serum retinol by subnational geographic area, todetermine the extent of concentration of the deficiency. Some surveys allowthis, including the recent Sri Lankasurvey (Government of Sri Lanka 1997).Five such surveys are presented in thedisaggregated tables in WHO (1995).The results are shown in Table 3.
Table 2. Estimates of clinical and subclinical prevalences of vitamin A deficiency in relation to multiplication factors (WHO 1995).
Reported mean prevalence of deficiency (%) and no. of surveys
Multiplication Population factor coverage* (%) Clinical Subclinical
0.25 20–30 2.00 (2) 30.3 (8)0.40 30–60 1.23 (7) 26.2 (17)0.60 60–75 1.65 (13) 47.6 (8)0.75 National 2.46 (13) 30.5 (9)
Average 1.89 (35) 32.0 (42)*Percentage of population covered by sample.
Table 3. Summary of five surveys of subclinical vitamin A deficiency reported in WHO (1995).Prevalence of subjects with serum
retinol <0.7 µmol/L (%)Country Scope Year Areas Raw data for areas Mean*
Brazil Possibly national 1972 5 regions 11.4, 22.7, 26.3, 26.3, 27.4 25.3Ecuador National 1993 4 regions 9.6, 14.8, 17.7, 18.1 16.2Ethiopia National 1980–1991 4 ecozones 55.6, 62.3, 69.2, 77.8 59.6Indonesia Subnational 1991 5 provinces 32.7, 58.0, 68.8, 69.3, 86.6 64.7Sri Lanka National 1996 7 provinces 22.3, 24.3, 35.0, 42.5, 46.3, 36.3
51.3, 57.3*For Brazil, Ecuador, and Indonesia, data were weighted by sample size for calculation of the mean. For Ethiopia and Sri Lanka, the means was taken as already reported in WHO (1995).

[THE MICRONUTRIENT REPORT: PART 1]10
Unless there was an unfortunate choice of region in a subnational survey,there would be only about a doubling of prevalence between better- andworse-off areas, and even if the worse-off area were selected for survey, it wouldnever need to be multiplied by a factorof even 0.6 to bring it to the mean,given that the ratio of mean to highestprevalence in these five cases rangedfrom 0.63 to 0.92 (average 0.79).
To summarize, there are four reasons to believe that the prevalences of at leastsubclinical deficiency should not beadjusted down by this factor. First, we now expect subclinical vitamin Adeficiency to be widely spread in thepopulation. Second, if anything, higher-coverage surveys (>60%, which wouldimply a multiplication factor ≥0.6) havehigher prevalences than lower-coverageones. Third, the distribution nowobserved of low prevalences of below-normal serum retinol does not showextensive clustering. Fourth, recentresults (such as those in Government of Sri Lanka [1997]) are higher thanwould be predicted on the basis of themultiplication factor. The values of themultiplication factor greatly influencethe adjusted prevalences, largelyarbitrarily, and although they probablyensure that the resulting estimates are not overestimated, they in factsubstantially determine the comparisonsbetween countries and through time. In the data presented here, resultsaggregated by region are calculated bothwith and without the multiplicationfactor. The multiplication factor is not
used for deficiencies other than that ofvitamin A, so the issue does not arise foriodine or iron.
Cutoff ValuesThe standard cutoff levels fordetermining prevalences were givenearlier, and the question here is theapproach to be taken when differentcutoffs were given in the survey reports.This applies most often to hemoglobin,for which a variety of cutoffs have beenused. No method of adjustment wasavailable, and prevalences with cutoffsdifferent from the standard 120 g/L for nonpregnant women and 110 g/L for pregnant women were not used for aggregation or trend assessment. For serum retinol, a few reports (e.g.,Government of Sri Lanka 1997) usedmicrograms per decilitre as the unit ofmeasurement; however, 20 µg/dL isequivalent to 0.7 µmol/L, so these units caused no problem.
Analogous problems occurred with theprevalence estimates based on clinicalsigns, specifically xerophthalmia and (to a lesser extent) goitre. Most of theprevalence data for clinical vitamin Adeficiency combined night blindness(known as XN) with eye changes, mainlyBitot’s spots (known as X1B). WHO(1995) used the prevalence of “totalxerophthalmia” as an aggregation ofvarious clinical signs, depending on how they were reported (often the sumof night blindness and Bitot’s spots).Because these two signs have the highestprevalences, omitting the prevalences ofother signs presents a relatively minor

11
Dat
a an
d an
alyt
ical
met
hods
[ TR
ENDS
IN P
REVA
LENCE
S ]
source of error. The sum of theprevalences of night blindness andBitot’s spots is thus the most feasiblestandard indicator. When both arereported, the prevalence of Bitot’s spots usually ranges from one-half theprevalence of night blindness to the sameas the prevalence of night blindness.Thus, when only one or the other wasknown, the sum of prevalences wasestimated conservatively (using the lower end of the range), as follows: whenthe prevalence of night blindness wasunknown, it was assumed to be equal tothe prevalence of Bitot’s spots, and thesum was twice that of Bitot’s spots; when the prevalence of Bitot’s spots wasunknown, it was assumed to be equal tohalf the prevalence of night blindness,and the sum was 1.5 times that of nightblindness.
For goitre, the indicator is clearlydefined as palpable plus visible goitre.Although the classification of differentdegrees of goitre has changed over thepast decade, the resulting summaryindicator of “total goitre rate” hasremained the same (WHO 1993, 1994).The important source of uncertainty istherefore the measurement itself, asdiscussed earlier.
For child anthropometry, the cutoff oftwo standard deviations below the meanweight for age by NCHS standards is now the norm; earlier surveys used other cutoffs (usually <80% weight forage, almost the same as two standarddeviations below the mean) andsometimes different standards (local
or “Harvard” [Jelliffe 1966]). The dataused here had already been standardizedto two standard deviations below themean according to NCHS standards, as given in ACC/SCN (1993, p. 94).
Biological GroupsThe biological groups assessed (in terms of age, sex, and pregnancy status)are reasonably well standardized for thethree deficiencies.
Preschool children are the referencegroup for vitamin A deficiency (andunderweight), usually defined as up to60 months of age, but with variationmore common at younger ages, startingat 0, 3, 6, or sometimes even up to 24 months (see Appendixes 1 and 2).The prevalence of both clinical vitamin A deficiency and low serumretinol change with age (which can beseen, for example, by inspection ofresults by age band [WHO 1995, pp. 69–95]). What is needed are sets ofdata with prevalence by age group fordifferent regions. If consistent, such datamight allow adjustments to be made tomore exactly standardized age bands;however, suitable data have not beenfound. The error introduced by varyingage-group definitions has thus beenignored; it is certainly a source of“noise” (random error) in the data, but there is no evidence that differentage-group definitions are systematicallyassociated with specific countries orsurvey dates, so this is unlikely tointroduce bias into the calculations (and any error is certainly less than theerrors introduced by the multiplication
[THE MICRONUTRIENT REPORT: PART 1]12
factors.) For underweight data, theestimates were already been adjusted tothe standard age range of 6–60 months(ACC/SCN 1993, p. 95).
For goitre, the data were taken fromresults assembled by WHO, ICCIDD,and UNICEF, as reported by UNICEF(1998), and the biological group wasdefined as children 6–11 years of age.Methods for adjusting results to this age group when the original estimatescovered a different age group are notgiven here, but generally the prevalencesare not greatly affected by age, so suchvariation is probably not a major sourceof error. Other issues for this age group,such as accounting for children who donot attend school (where samples wouldbe obtained), ensuring correct samplerepresentation for more remote schools(where the prevalences of goitre are likelyhigher), and standardizing diagnosticmethods between enumerators, are likelyto be more important but cannot beeasily assessed retrospectively.
For anemia, hemoglobin data arereported for a wide variety of biologicalgroups, including children, adolescents,women of reproductive age (variousdefinitions), and pregnancy status. Thedatabase for this study was combinedwith that set up for the Second Report on
the World Nutrition Situation (described under “Women’s Nutritional StatusIndicators,” ACC/SCN 1993, p. 114).New results were compiled from WHO(1992, 1997), MN-Net (MI 1999),UNICEF (N. Dalmiya, personalcommunication, 1998), and a
computerized literature search. In fact,many reports give results for severaldifferent groups as well as aggregatedvalues. In setting up the database, eachcase was defined as a separate group, so each report could generate severalcases; this allowed comparisons andaggregation (but produced a complexdata file). Overall, the databasecontained 562 cases, which were thenseparated into the two main files (forpregnant and nonpregnant women15–49 years old). Rules were set up toguide selection to approximate thisdefinition of groups and the intendedindicators (<110 and <120 g/L Hb,respectively). The age groups used herewere intended to represent reproductiveage; where feasible, groups within areport were aggregated to give typically15–49 years, which is thus used as thedefinition. When pregnancy status wasnot defined, nonpregnant status wasassumed.
SeasonalitySeasonality has a significant effect onprevalences of underweight children inmany environments, which can lead todifferences of as much as 10 percentagepoints or more between the high and low values throughout the year (ACC/SCN 1989). As a result, attempts aresometimes made to time repeat nationalsurveys at the same season and to preferslower-reacting measures, notablystunting. Similar seasonal data are notavailable for micronutrient deficiencies,but substantial variation is likely.Seasonality may well be a source ofconsiderable error in the estimates,

13
Dat
a an
d an
alyt
ical
met
hods
[ TR
ENDS
IN P
REVA
LENCE
S ]
but cannot be assessed, let alonecorrected for, with the data presentlyavailable. Again, this factor probablycontributes noise, not systematic error.Seasonality is of particular concern ininterpreting changes through timebetween two or more individual nationalestimates, where the effect will not beaveraged out. This factor should becarefully considered if a more organizedeffort is to be made to monitor trends inmicronutrient deficiencies.
Aggregation of Data to Standard TimeAggregating data to a standard time isone of the more difficult methodologicalproblems. Its importance depends bothon whether rapid change is occurringand on the intended uses of the results.When the aim is to give a general pictureof size and relative distribution ofdeficiencies by groups of countries,estimating these data by averaging over a range of years may be adequate, if theresulting estimate is treated with caution.This is the standard method used byWHO for anemia (e.g., WHO 1992).However, when we want to validlycompare countries at one point in time,especially if there are several indicators,we need to go further. In addition,estimates of numbers of people affectedhave to be anchored at one point intime, because population numberschange from year to year.
The challenge can be envisaged byconsidering a country–year matrix,within which the columns represent years and the rows represent countriesand where each survey result is inserted
in the appropriate cell. Most of the cellswill be blank, and indeed many rows willhave no data at all (because the countriesin question have not carried out asurvey). To derive an average value forgroups of countries (regions), even for a range of years, some assumptions areneeded about the prevalences for thecountries for which data are missing.Often these prevalences are set, at leastimplicitly, to the average for the othercountries in the group. In other words,the values for the countries in eachregion for which data are available areaveraged, and this value is taken as theaverage for the whole region. The issuethat arises when a range of years is usedis whether to use the population data for the year of the survey or for themidpoint of the range of years or evenfor the latest year in the range. Usuallythe population numbers (and weights)are applied for a given year; sometimes,this is the last year of the range, andoccasionally the prevalences by regionare then reported as if they apply to thislast year (e.g., WHO 1997). Althoughthey are perhaps somewhat unclear, such results usually give a picture of the problem that is appropriate forgeneral advocacy. The main problemsthat arise for more accurate reportingare in presenting country-level data, for example by mapping, and inestimating trends.
Country-level data, whether mapped or presented in other forms, imply thatthe indicators are comparable betweencountries, which means that they shouldrefer to the same year (unless the

[THE MICRONUTRIENT REPORT: PART 1]14
indicators are changing particularlyslowly, which should be determined).The date on the map or table must beclearly stated. Thus, some assumptionsare needed to bring the data pointsscattered through the country–yearmatrix to one point in time (onecolumn). This requires some form ofinterpolation, of which the simplest is to assume no change in the indicatorthroughout the period. This gives anunbiased estimate of the average, if there really is no change. However, whenthere is an underlying trend (usually ofimprovement), and the interpolation is made toward the latter part of theperiod, then the assumption of nochange will yield an overestimate of theactual prevalence and, moreover, maydistort the relative prevalences betweengroups of countries.
Determining changes through time isimportant for both analytical and policypurposes. There is no escaping the needfor repeated estimates on the same or a very similar population. For clinicalvitamin A deficiency and iodinedeficiency disorders, almost enoughpairs of data points exist to drawconclusions on changes through time(see Figs. 2 and 5, discussed later), and these strongly indicate a trend ofimprovement. For anemia there arevirtually no pairs of data points allowingan assessment of trend, and the sameapplies to serum retinol. In the case ofunderweight, many measures throughtime have been determined, and long-term trends can be confidently estimatedon this basis, but this was not so in the
1980s, when indirect methods(subsequently confirmed by survey data)were also used (ACC/SCN 1987, 1993).
Further investigation using less directmethods for estimating anemia andsubclinical vitamin A deficiency (serumretinol) are thus necessary if we want tohave an idea of trends. The data can bevisualized as scatter plots (as shown inFigs. 3 and 4 and discussed later). Theserum retinol results for Southeast Asiaillustrate the problem (Fig. 1). It isevident that the average value depends on which countries are included; forexample, averaging for the 1980s and the 1990s gives similar prevalences (28% and 31%), but the countriesincluded in these two estimates aredifferent — for example, Indonesia, with a high reported prevalence, appearsonly once, in 1991. This effect is lessimportant if there are more data points,as the plot for the complete data set forserum retinol shows (Fig. 3, discussedlater). Here, there are indications of animproving trend, such that averagingacross a wide time range could bemisleading. Fitting a regression line tosuch disparate data points is not verysatisfactory, but is better than simplydetermining an overall average. Appliedto the anemia data (see Results section)fitting a line also allows averagingthrough time, especially as mostcountries appear several times in thislarger data set.
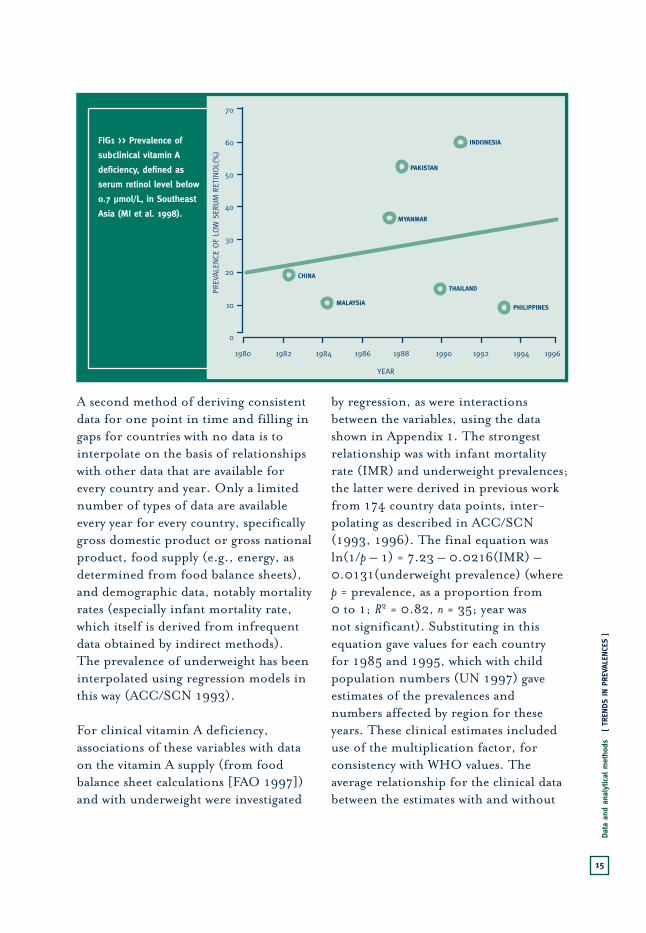
15
Dat
a an
d an
alyt
ical
met
hods
[ TR
ENDS
IN P
REVA
LENCE
S ]
FIG1 >> Prevalence of
subclinical vitamin A
deficiency, defined as
serum retinol level below
0.7 µmol/L, in Southeast
Asia (MI et al. 1998).PREV
ALE
NCE
OF
LOW
SER
UM
RET
INOL(
%)
YEAR
70
1980 1982 1984 1986 1988 19921990 1994 1996
60
50
40
30
20
10
0
INDONESIA
PAKISTAN
MYANMAR
CHINA
MALAYSIA
THAILAND
PHILIPPINES
A second method of deriving consistentdata for one point in time and filling ingaps for countries with no data is tointerpolate on the basis of relationshipswith other data that are available forevery country and year. Only a limitednumber of types of data are availableevery year for every country, specificallygross domestic product or gross nationalproduct, food supply (e.g., energy, asdetermined from food balance sheets),and demographic data, notably mortalityrates (especially infant mortality rate,which itself is derived from infrequentdata obtained by indirect methods). The prevalence of underweight has beeninterpolated using regression models inthis way (ACC/SCN 1993).
For clinical vitamin A deficiency,associations of these variables with dataon the vitamin A supply (from foodbalance sheet calculations [FAO 1997])and with underweight were investigated
by regression, as were interactionsbetween the variables, using the datashown in Appendix 1. The strongestrelationship was with infant mortalityrate (IMR) and underweight prevalences;the latter were derived in previous workfrom 174 country data points, inter-polating as described in ACC/SCN(1993, 1996). The final equation wasln(1/p – 1) = 7.23 – 0.0216(IMR) –0.0131(underweight prevalence) (where p = prevalence, as a proportion from 0 to 1; R2 = 0.82, n = 35; year was not significant). Substituting in thisequation gave values for each country for 1985 and 1995, which with childpopulation numbers (UN 1997) gaveestimates of the prevalences andnumbers affected by region for theseyears. These clinical estimates includeduse of the multiplication factor, forconsistency with WHO values. Theaverage relationship for the clinical databetween the estimates with and without

[THE MICRONUTRIENT REPORT: PART 1]16
the multiplication factor is 1.26, so theresults (shown in Table 6, discussedlater) could be multiplied by 1.26 to give the equivalent estimates without this adjustment. A similar approach was taken to interpolating low serumretinol values, using the data shown inAppendix 2. In this case, as might beexpected, the best model was with clinical vitamin A deficiency (with bothclinical and subclinical prevalences aslogarithms). The derived values ofclinical vitamin A deficiency were thustransformed further to give estimates of the prevalence of low serum retinol(<0.7 µmol/L), using the followingequation: ln(prevalence of low serumretinol) = 3.019 + 0.555 ln(estimatedclinical prevalence) (R2 = 0.44, n = 42).Further details of these methods aregiven in MI et al. (1998).
This approach generated a set ofprevalence estimates for clinical andsubclinical vitamin A deficiency for each country for 1985 and 1995. Theseestimates were multiplied by the childpopulation to determine the numbersaffected. To aggregate by region, thesenumbers were summed and divided by the total child population for theregion, to give numbers affected andpopulation-weighted mean prevalences.
For the prevalence of iodine deficiencydisorders (goitre), the database usedhere was compiled from data in WHO(1993), MN-Net (generally updated to mid-1998) (MI 1999), and a cur-rent literature search (Appendix 3).Nationally representative estimates
were available for 81 countries in total.Averages were calculated for groups of countries and for two periods,1980–1989 and 1990–1999 (see Fig. 6,discussed later). Where more than oneestimate existed for a country withinthese periods (e.g., Thailand), thesevalues were averaged to obtain onecountry–period value. Overall, therewere 62 estimates applying to Asia,Africa and the Middle East, and LatinAmerica and the Caribbean. Most of the survey results were for school-agechildren, but no correction was madefor those reported for the generalpopulation, as the extent of thedifference in prevalence between theseage groups is thought to be relativelysmall (WHO 1993, p. 49). The urinaryiodine data were insufficient to be usedfor trend analysis. The goitre data usedbelow, accumulated from WHO (1993),MN-Net (MI 1999), and literaturesearching, are very similar to those used in WHO (1999), and the WHO(1999) calculations of regional levelswere directly extracted.
For anemia, the problem was differentagain. Each case was defined as a groupor subgroup by year, country, area (e.g., district), and pregnancy status. If only the year of publication was given, the survey year was estimated bysubtracting 5 years from this date, theaverage period for studies in which both survey and publication dates wereknown. Sample size generally had to beat least 100 for inclusion. If the datawere from a national survey, sample sizeswere assumed to be greater than 100.

17
Dat
a an
d an
alyt
ical
met
hods
[ TR
ENDS
IN P
REVA
LENCE
S ]
Surveys from a few countries of yearsthat were underrepresented wereretained, regardless of sample size. A total of 562 acceptable cases wereincluded. Of these the sample size wasunder 100 for 56 (10%), and samplesize was missing for 124 (22%). Cutoffswere hemoglobin level 120 and 110 g/Lfor nonpregnant and pregnant women,respectively (for some samples, the cutoff values differed slightly, but only by 5 g/L). Only a few studies did notreport cutoff values, and in these casesprevalences have been estimated byWHO (1992). Pregnancy status wasknown in all but two cases. In 40 cases(7%) the sample included both pregnantand nonpregnant women. These datawere included in the nonpregnantgroup, and a cutoff of 120 g/L was used.The age range varied but was usually15–49 years; in some cases, the range was narrower. The pregnant grouprepresented a younger sample of womenon average than the nonpregnant group.Age differences in relation to prevalenceof iron deficiency anemia could not bestudied in this analysis; however, thislimitation should be considered incomparisons of pregnant and non-pregnant groups. All age groups under15 years were omitted.
Through this procedure 148 new cases were added to the 1992 database(ACC/SCN 1993, p. 114). Of the newcases, more referred to pregnant than tononpregnant women. Several were newlyidentified results from the 1980s ratherthan more recent results. Most cases werenot national in coverage. Some countries
had clumps of results in particular years(e.g., 34 data points for India in 1984;8 data points for South Africa in 1978).To reduce the influence of thisclustering and of scatter in general, the data were aggregated such that eachcountry–year had only one data point(the mean). This resulted in a file with269 points, 122 for nonpregnantwomen and 147 for pregnant women.(The sample sizes by region are shown in later tables, where the n values refer to numbers of country–years; the datapoints in the figures also represent theaverage for a country–year.)
Aggregations were done within region,by pregnancy status. For these, nopopulation weights were used (the same approach as in ACC/SCN [1992,chapter 4]). This was based in part on the view that because most of theestimates covered subnational areas(some of which were very small, such asone clinic), it made little sense to weighta survey according to the population of the whole country (e.g., Bali vsIndonesia). Thus, within regions each survey was taken as a sample of the region. In an analysis such as this, a single case (i.e., country–year) cangreatly influence the mean for thatregion–year. Small samples from well-off areas may thus give much lowervalues for prevalences of iron deficiencyanemia than the country as a whole. Forexample, a study in one region of Algeria(Biskra) showed 10% prevalence for one subgroup and 87% for another.Fortunately, these within-countrydifferences were not usually so marked;

[THE MICRONUTRIENT REPORT: PART 1]18
however, moderate differences werecommon and for this reason alonetrends should be viewed with somecaution. A more valid comparison isbetween regions, as these averaged resultsare less influenced by unusual cases.
Trends by region were estimated by fittinga regression line to the available data from1970 through 1995. Considering thevariability of iron deficiency anemia, it was decided that the best analyticalprocedure to test regional and trenddifferences was analysis of variance(ANOVA). Data were grouped by year, as follows: 1970–1980, 1981–1985,1986–1990, and 1991–1998. Type IIIsums of squares analysis (used in anunbalanced design) was selected in testingregional differences, while controlling fortrends over time, and vice versa. Regionalestimates were calculated for 1995, fromthe regression results by region. Theseresults are reported later.
Underweight prevalences are used hereto a limited extent. They are included in the regional estimates in Table 10,where the extent of those with multipledeficiencies includes underweightprevalences. These data are the same asused in ACC/SCN (1996). The sameunderweight prevalence estimates areincluded in the calculation of vitamin Adeficiency prevalences, as describedearlier. The calculation uses the sameapproach as described in ACC/SCN(1993, pp. 95–100). The country-levelunderweight prevalence results for 1995are given in Appendix 6, together withthe equation used for the calculation.
Estimation of TrendsTrends were estimated by differentmethods, depending on the dataavailable and their characteristics. Inprinciple, the most important method is to assess change at the national level between two comparable surveyscarried out several years apart. Given the uncertainties of individual com-parisons, the pattern of change thus seen is important: if most pairs of comparable surveys show the samedirection of change at comparable rates, we can have reasonable confidencethat the underlying trend is real. This approach is feasible for clinicalvitamin A deficiency results and forgoitre rates. As mentioned earlier, the method of assessment is now wellestablished for underweight prevalences,for which 57 pairs of survey results from 42 countries, from 1980 on, werereported in 1996 (ACC/SCN 1996). Forvitamin A deficiency the correspondingvalues are 10 pairs of results from 8 countries and for iodine deficiencydisorder, 11 pairs from 6 countries.Although it was not possible to check thecomparability in terms of sample designand assessment methods, the consistentpattern of results to some extentcompensates for these drawbacks and the small number of replicates. Forestimates of trends in clinical vitamin Adeficiency, it was necessary to matchresults by the specific clinical signsrecorded, of which the most consistentlyavailable in pairs of surveys was Bitot’s spots (Fig. 2). In contrast, thecombination of Bitot’s spots and nightblindness was chosen as the standard

19
Dat
a an
d an
alyt
ical
met
hods
[ TR
ENDS
IN P
REVA
LENCE
S ]
FIG2 >> Trends in clinical
vitamin A deficiency,
defined as Bitot's spots
and night blindness, as
determined from national
surveys in various years.
All data in this figure are
reported survey values;
the WHO multiplication
factor has not been
used.
PREV
ALE
NCE
(%
)
YEAR
1975 1980 1985 19951990 2000
1.25
1.00
0.75
0.50
0.25
0
1.50
NEPAL
INDIA
SRI LANKA
PREV
ALE
NCE
(%
)
YEAR
1975 1980 1985 19951990 2000
2.00
1.50
1.00
0.50
0
2.50NIGER
ETHIOPIA
PREV
ALEN
CE (%
)
YEAR
3.50
1975 1980 1985 19951990 2000
3.00
2.00
1.50
1.00
0.50
0
2.50
BHUTAN
PHILLIPPINES
INDONESIA
2A
2B
2C
Bitot's spots (x1B)
Night blindness (XN)
Total X1B + XN** Except Indonesia:
X1B only.

[THE MICRONUTRIENT REPORT: PART 1]20
indicator for the database presented inAppendix 1 (in line with WHO’s practice[WHO 1995, pp. 69–83]). For iodine,nationally representative survey resultsfor eight countries could be compared;in addition, there were two cases fromsentinel site surveillance (shown later, in Fig. 5). For anemia there are nocomparable representative surveys, sothis method could not be applied.
A second, less satisfactory, approach is to examine apparent trends by fitting aline to the scatter of data points throughtime. This method is vulnerable toextreme country–year values appearing at the beginning or end of the timeperiod by chance, as illustrated earlierfor subclinical vitamin A deficiency inAsia. Fitting a regression line to a timeseries of points from different countriesis associated with the same type ofproblems as taking regional averages of national results for two time periods(e.g., as for goitre [WHO 1999, Table 5]) — the expectation is that there is no association of types ofcountry (by underlying prevalence) with time, and with enough cases theappearance of a country in one grouponly will not be misleading; this can bechecked by examining the scatter plots,which except for the case of SoutheastAsia in Fig. 1 (introduced to illustratethis point) do not appear to be affectedby outliers.
For the global data and for regionalgroupings for which there are 20 ormore country–year data points there isa pattern, the consistency of which may
be meaningful; at a minimum, foranemia, it seems reasonable to conclude(see below) that there is no strong trend.This method also facilitates makingestimates of prevalences at a single point in time for comparison with otherindicators, by taking the value of thefitted line at the reference year.
Third, where regional prevalences areestimated at two points in time (1985and 1995 for vitamin A deficiency here),comparing the estimates gives a furtherindication of probable trend. This ismore credible if the variable for “year” is not significant in the regression, asituation that implies that sources ofchange have been captured in theindependent variables, as was the case for the models used here. Again, thepattern is important: for vitamin Adeficiency, the trends estimated bycomparing the 1985 and 1995 data arevery similar to those observed in the 12 pairs of country–year data points that could be compared.
These methods were applied to thedatabases described here, yielding theresults presented in the next section.

21
Resu
lts:
Tren
ds in
redu
cing
mic
ronu
trie
nt d
efic
ienc
ies
[ TR
ENDS
IN P
REVA
LENCE
S ]
PREV
ALE
NCE
OF
CLIN
ICAL
VIT
AM
IN A
DEF
ICIE
NCY
(%
)
YEAR
5
1980 1985 1990 1995 2000
2
1
0
4
3
FIG3 >> Clinical vitamin A deficiency, defined as Bitot’s spots and night blindness combined in preschool children, as determined from national surveys in various years. Trends were deter-mined by regression of country data within each UNICEF region. Regression results: for total sample, B = –0.16 (P = 0.002, n = 35); for East Asia and the Pacific region, B = –0.15 (P = 0.033, n = 9); for eastern and southern Africa, B = –0.12 (P = 0.096, n = 9). For all other equations, P > 0.1. All data in this figure are reported survey values; the WHO multiplication factor has not been used.
South Asia
East Asia & Pacific
Eastern & Southern Africa
Western & Central Africa
Middle East & Northern Africa
Total Population
Recent Trends in Prevalence ofVitamin A Deficiency
Trends in the prevalence of clinicalvitamin A deficiency (mainly Bitot’sspots) were assessed by comparing repeatnational survey results, when these wereavailable. Such data were identified for eight countries, with 10 pairs ofestimates (Fig. 2). Except in Niger andNepal, a pattern of improvement isevident. The average rate of decrease in Bitot’s spots is about 0.5 percentagepoints per 10 years in this small sampleof results.
The total sample of prevalence estimatesfor clinical vitamin A deficiency (nightblindness + Bitot’s spots) is plotted
against year in Fig. 3. The regressionline fitted to the full sample (n = 35) issignificant and indicates an estimatedrate of improvement of 1.5 percentagepoints per 10 years. If the prevalence ofBitot’s spots is about half that of nightblindness (as is often the case), Bitot’sspots would contribute a third of thetotal (XN + X1B), so the rate here of 1.5 percentage points per 10 years is in line with 0.5 percentage points per 10 years for Bitot’s spots as determinedfrom individual pairs of data points. The fitted lines are significant for EastAsia and the Pacific region and foreastern and southern Africa (see captionfor Fig. 2), but not for the other regions.
3. RESULTS: TRENDS IN REDUCING MICRONUTRIENTDEFICIENCIES

[THE MICRONUTRIENT REPORT: PART 1]22
As will be seen later (Table 6), comparingthe prevalence estimates for clinicalvitamin A deficiency (as indicated by nightblindness and Bitot’s spots) by region for 1985 and 1995 also indicates a stronglyimproving overall trend (0.4–0.9percentage points per 10 years). Thisincludes the multiplication factor, so wouldbe lower than other estimates that do notuse the multiplication factor, but itgenerally supports the conclusion that animportant general improvement has beenoccurring in clinical vitamin A deficiency.
For subclinical vitamin A deficiencyassessed by serum retinol levels <0.7 µmol/L the picture is less clear.Only four countries, all in Latin America(Colombia, Costa Rica, El Salvador, andGuatemala) have repeated surveys, andalthough these surveys indicate someimprovement in this region, they are not
much to go on. The plot of all theavailable individual data points againsttime is shown in Fig. 4. The overallregression line is significant, and thereduction averages 15 percentage pointsper 10 years. The fit for eastern andsouthern Africa is also significant, butthe others are not, and differencesbetween regions should not be regardedas having been demonstrated here. Asdiscussed earlier, such analyses are alsovulnerable to the effects of high-prevalencecountries (for example, Indonesia forEast Asia and the Pacific region).Furthermore, because of the lack of dataon subclinical vitamin A deficiency andthe need to use the relation with clinicalvitamin A deficiency to estimate regionallevels, the subclinical results by regionare given only for 1995. Thus acomparison of regional estimates for1985 and 1995 is not available.
PREV
ALE
NCE
OF
LOW
SER
UM
RET
INOL
(%)
YEAR
80
1980 1985 1990 1995 2000
70
20
10
0
40
50
60
30
FIG4 >> Subclinical vitamin A deficiency, defined as serum retinol level < 0.7 µmol/L in preschool children, as determined from national surveys in various years. Trends were determined by regression of country data within some regions (as defined by UNICEF). Regression results: for total sample, B=-1.54 (P=0.02, n=41); for eastern and southern Africa, B=-1.57 ) P=0.07, n=9). For all other equations, P>0.1. Average prevalences (total sample): for 1980–1989, 40.3% (n=16); for 1990–1996, 27.1% (n=25) (P=0.02).
South Asia
East Asia & Pacific Region
Latin America & Caribbean
Eastern & Southern Africa
Western & Central Africa
Middle East & Northern Africa
Total population

23
Resu
lts:
Tren
ds in
redu
cing
mic
ronu
trie
nt d
efic
ienc
ies
[ TR
ENDS
IN P
REVA
LENCE
S ]
A judicious conclusion may be that the subclinical vitamin A deficiencyresults, which are almost always takenfrom surveys conducted independentlyof clinical assessments, support the idea that a significant and broadimprovement is under way.
Recent Trends in Prevalence ofIodine Deficiency DisordersGoitre has existed for centuries, and itmight be expected that in the absence of interventions, prevalences wouldremain fairly static. In countries wherethe food systems are still localized andthe foods are not highly processed, there is no particular reason to expectimprovement, unlike the situation with vitamin A deficiency, wheresocioeconomic progress may lead toreductions. About 80 national surveys of goitre have been carried out since1970 (see Appendix 3). Only in eightcountries were repeated surveys, likely to be comparable, identified. In twoadditional cases (Cameroon and Peru)progress was tracked by a sentinel sitemonitoring system.
It appears that a rapid improvementoccurs when salt iodization is effectivelyintroduced, as illustrated in Figs. 5A and5B. This improvement is expected, giventhe long-established effectiveness of saltiodization (Hetzel 1988), and the successstories (such as that of Bolivia [Fig. 5A])are well understood (e.g., Stanbury1998). What is uncertain is the trend thatoccurs before a widespread program is inplace. In most of the countries for whichrepeat data are available (Figs. 5C and 5D),
some degree of iodine deficiency controlhas been undertaken, if generally lessextensive than in the countries shown inFigs. 5A and 5B. Thus a pattern ofimprovement of about 1 percentage pointper year has been observed in Ethiopia,Indonesia, and Zambia.
Two contrasting results are shown in Fig. 5D. In Guatemala, salt iodizationwas started nationally in the 1950s, andthe prevalence of goitre was estimated at11% in 1979; in the 1980s the programdeclined with the political crisis, and the goitre rate increased to 20% in 1987 (Stanbury 1998). The data fromBangladesh probably reflect a differentstory (as noted in the section onmethods): the 1993 survey was larger and more organized than earlier ones,and in particular much more attentionwas paid to training field staff torecognize goitre (Yusuf et al. 1993). The result is likely to be a morecomprehensive assessment, but one that may well not be comparable withprevious results. The situation inBangladesh is thus probably notdeteriorating as seriously as Fig.5Dimplies (and deficiency controlprograms have been operating for some time), but the level may indeed be one of the highest seen.
When the results from nationallyrepresentative surveys are pooled bygroups of countries and periods(1980–1989 and 1990–1999), the averages indicate no overallimprovement, and indeed may showdeterioration (Fig. 6). In fact, thenumber of estimates is small (62 in

[THE MICRONUTRIENT REPORT: PART 1]24
FIG5 >> Trends in iodine
deficiency disorders, as
determined from surveys
of total goitre rate (TGR)
in various years for nine
countries. These trends
are related to household
use of iodized salt for
four countries.
PREV
ALE
NCE
OF
GOIT
RE
(%) AND H
OUSE
LHOLD
USE
OF
SALT
(%
)
YEAR
100
1982 1984 1986 19901988 2000
80
60
40
20
0
1992 1994 1996 1998
TGR, BOLIVIA
TGR, PERU
SALT, BOLIVIA
SALT, PERU
5A
PREV
ALE
NCE
OF
GOIT
RE
(%) AND H
OUSE
LHOLD
USE
OF
SALT
(%
)
YEAR
100
1982 1984 1986 19901988 2000
80
60
40
20
0
1992 1994 1996 1998
TGR, THAILAND
TGR, CAMEROON
SALT, CAMEROON
SALT, THAILAND
5B

25
Resu
lts:
Tren
ds in
redu
cing
mic
ronu
trie
nt d
efic
ienc
ies
[ TR
ENDS
IN P
REVA
LENCE
S ]
PREV
ALE
NCE
OF
GOIT
RE
(%) AND H
OUSE
LHOLD
USE
OF
SALT
(%
)
YEAR
60
1970 1975 1980 1995
40
20
0
1985 1990
TGR, ETHIOPIA
TGR, INDONESIA
TGR, ZAMBIA
5C
PREV
ALE
NCE
OF
GOIT
RE
(%) AND H
OUSE
LHOLD
USE
OF
SALT
(%
)
YEAR
60
1970 1975 1980 1995
40
20
0
1985 1990
TGR, GUATEMALA
TGR, BANGLADESH
5D

[THE MICRONUTRIENT REPORT: PART 1]26
total for the three country groups), and the differences through time are notsignificant. This apparent increase wasreported by WHO (1999, p. 17), asshown here in Table 7, and is discussedlater in the current report in thatcontext. The apparent increase mayreflect increased effort to identify thedeficiency in recent years. It shouldprobably not be taken as evidence ofgeneral deterioration, but it doessupport the idea that there is only animportant improvement when effectivesalt iodization programs are in place.These findings also emphasize the lack of representative data that would allow a better assessment of trends.
In sum, there is just enough evidence toinfer that iodine deficiency disorders asmeasured by goitre remain at high levelsuntil effective control programs,
primarily with iodized salt, are in place.The underlying trend is probably fairlyunimportant compared with the rapidand widespread reduction that can beachieved with iodine fortification.
Recent Trends in Prevalence of Anemia
Iron deficiency and anemia are notsynonymous (as discussed in section 2,“Data and Analytical Methods”), but the prevalence of anemia is by far thecommonest indicator used to monitoriron deficiency, and if the distinction iskept in mind, misleading conclusionscan be avoided.
No repeated, comparable surveys ofanemia, at national or subnationallevels, could be identified. Thus we do not have available the first line of
FIG6 >> Prevalence of iodine deficiency disorders, defined as goitre (both visible and palpable) in school-age children, as determined from averages of national survey data. Regions are as defined by UNICEF (1998, p. 122). When more than one estimate was available for a given period for one country (e.g., Thailand), the values were averaged. Sample sizes: Asia, for 1980–1989, n=8, and for 1990–1997, n=10; Latin America and the Caribbean, 1980–1989, n=7, and for 1990–1997, n=9; Africa and the Middle East, for 1980-1989, n=9, and for 1990–1997, n=19.
PREVALENCE OF GOITRE (%)
0 10 20 30 40
ASIA
LATIN AMERICA & CARIBBEAN
AFRICA & MIDDLE EAST
1980–19891990–1997

27
Resu
lts:
Tren
ds in
redu
cing
mic
ronu
trie
nt d
efic
ienc
ies
[ TR
ENDS
IN P
REVA
LENCE
S ]
analysis for determining trends. This is aserious lack now, but will become worseif two deliberate efforts are not madesoon: first, to select existing surveyresults from the past and ensure thatrepeat surveys conducted in future canbe compared with the existing results;and second, where such surveys do notexist, to begin to establish a baselinefrom which trends can be estimated inthe future.
The data compiled were separated into two groups (pregnant andnonpregnant women, 15–49 years ofage) and aggregated to give no more than one estimate for each group percountry–year. The large degree ofvariation in the data is apparent for both nonpregnant (Fig. 7) and pregnant(Fig. 8) women. Indeed, any real trendwould have to be substantial if it were to
emerge through the noise in the data.Can we derive useful conclusions fromthese results?
Mean prevalences of anemia by regioncan be estimated (Tables 4 and 5). It islikely that the estimates for nonpregnantwomen tend to come from survey data,whereas estimates of anemia for pregnantwomen usually derive from thoseattending antenatal clinics. The resultsfor nonpregnant women are thus morelikely to be representative of the overallpopulation. This may relate to theseemingly more stable trends in the data for nonpregnant women. Thenonpregnant group also representsabout 90% of the female population.The relative levels of anemia by region in nonpregnant women can be seen inTable 4 and Fig. 7 (fitted lines). SouthAsia has the highest average prevalence of
PREV
ALE
NCE
OF
ANEM
IA (%
)
YEAR
100
1970 1975 1980 1995 2000
80
20
0
1985 1990
40
60
FIG7 >> Prevalence of anemia among nonpregnant women 15–49 years of age, defined as hemoglobin level < 120 g/L, as determined from national survey data. Trends were determined by regression of country data. For total sample, B=-0.463, t=-1.306(P=0.194, n=123). For all others, t was greater than -0.6; thus, no other coefficients approached significance. Regions are as defined by UNICEF (1998, p. 122). South Asia
Southeast Asia
South America
Central America
Sub-Saharan Africa
Middle East & Northern Africa
Total population

[THE MICRONUTRIENT REPORT: PART 1]28
anemia, at about 58%; the prevalence is46% in Southeast Asia. The prevalencein Sub-Saharan Africa is about 40%,and the Near East and northern Africaand Central and South America haveprevalences between 20% and 30%.Comparison tests (ANOVA) betweenregions show that the situation in SouthAsia is significantly worse than that in all other regions, except Southeast Asia.
Regression results showed no significanttrends in any region. The coefficients of the lines shown in Fig. 7 are notsignificant in any region, nor is theoverall average for all regions. There isenormous variation, but the data havebeen very carefully examined for likelyerrors. It is certainly true to stateconservatively that there has been no detectable change, but a strongerassertion may be valid: there really is
no improvement in anemia for mostwomen in developing countries.
The estimates for pregnant women are shown in Table 5 and Fig. 8. Theprevalences in South Asia are againsignificantly worse than in otherregions, except Southeast Asia and sub-Saharan Africa. The variation by regiontends to be higher among the pregnantwomen, which confirms a wider spreadin anemia prevalences between subgroupsand perhaps more questionable reliability.Despite this variation, a consistent trendof higher prevalences among pregnantwomen than among nonpregnant womenis evident across all regions — theexception being South Asia, perhapsbecause prevalences have already peakedin this region. No significant trendswere found for pregnant women.
PREV
ALE
NCE
OF
ANEM
IA (%
)
YEAR
100
1970 1975 1980 1995 2000
80
20
0
1985 1990
40
60
FIG8 >> Prevalence of anemia among pregnant women 15–49 years of age, defined as hemoglobin level < 110 g/L, as determined from national survey data. Trends were determined by regression of country data. For total sample, B=-0.449, t=-1.444(P=0.151, n=150). For all others, no coefficients approached significance. Regions are as defined by UNICEF (1998, p. 122). South Asia
Southeast Asia
South America
Central America
Sub-Saharan Africa
Middle East & Northern Africa
Total population

29
Resu
lts:
Tren
ds in
redu
cing
mic
ronu
trie
nt d
efic
ienc
ies
[ TR
ENDS
IN P
REVA
LENCE
S ]
The slopes of the lines in Figs. 7 and 8are compiled in Tables 4 and 5 as thechanges in percentage points per year.As mentioned earlier, the estimates fornonpregnant women are probably morereliable. A slope of –0.5 percentagepoints/year — the highest seen — impliesthat a prevalence of 40% (e.g., as insub-Saharan Africa) would be reduced to the level of 10% that seems to betypical of industrialized countries over a 60-year period — plausible but far too
slow to simply let happen if there wereeffective interventions to accelerateprogress. Most regions are hardlyimproving at all by this indicator, and South Asia may be deteriorating.Because trends through time are probably small compared with the overallprevalences, the year at which prevalencesare considered is not crucial, in contrastto other indicators of malnutrition(where they change more rapidly). Forpresentation purposes, the prevalences
Table 4. Prevalence of anemia (hemoglobin <120 g/L) in nonpregnant women 15–49 years of age.Prevalence of anemia (%)
Sample size Average for Estimate for Trend† (percentage Region* (country–years) 1975–1997 1995 points/year)
South Asia 19 56.0‡ 53.4 –0.21Southeast Asia 18 44.7 42.5 –0.23Middle America and Caribbean 25 28.3 27.6 –0.07South America 14 22.8 25.0 +0.15Sub-Saharan Africa 32 40.8 36.0 –0.45Near East and northern Africa 14 25.4 24.3 –0.18China 4 23.2 — —Pacific islands 3 33.6 — —Dash = information not available.*Regions as defined by ACC/SCN (1992, p. 5).†Trends calculated by regression (as in Fig. 7). None of the trends were significant. Trend for all data: B = –0.56, n = 129, P = 0.11.‡South Asia significantly higher than Near East and northern Africa and the American regions (P <0.05).
Table 5. Prevalence of anemia (hemoglobin <110 g/L) in pregnant women 15–49 years of age.Prevalence of anemia (%)
Sample size Average for Estimate for Trend† (percentage Region* (country-years) 1975–1997 1995 points/year)
South Asia 18 59.7‡ 53.9 –0.48Southeast Asia 23 52.1 52.7 +0.01Middle America and Caribbean 26 38.0 34.8 –0.33South America 18 34.0 27.2 –0.60Sub-Saharan Africa 43 46.4 48.5 +0.21Near East and northern Africa 19 37.7 34.1 –0.50China 6 30.3 — —Pacific Islands 2 20.8 — —Dash = information not available.*Regions as defined by ACC/SCN (1992, p. 5).†Trends calculated by regression (as in Fig. 8). None of the trends were significant. Trend for all data: B = –0.32, n = 155, P = 0.32.‡South Asia significantly higher than Near East and northern Africa and the American regions (P <0.05).

[THE MICRONUTRIENT REPORT: PART 1]30
have been calculated for 1995, as given inTables 4 and 5. This is the value of theplotted regression line in Figs. 7 and 8,for 1995. These are broadly in line withthe 1975–1997 averages, since there islittle apparent trend, and thus with thosegiven by WHO (1997, Table 8). Theyshow that the Asian countries have thehighest prevalences among both pregnantand nonpregnant women. Prevalencesduring pregnancy usually appear higher(in four of the six regions) although lesspronounced when estimated in this waythan those shown in Table 5 (means byregion). It should be remembered thatthe cutoffs are different for pregnant and nonpregnant women, and thereforeprevalences are not necessarily directlycomparable between these two groups.
In terms of the numbers of peopleaffected by anemia, data from WHO(1992, 1997) imply that some 419 million pregnant and nonpregnantwomen (about 44% of the developingworld population) were affected in 1988 and that this value rose to 532 million in 1995. The present results would generally support thisestimate (for 1995), as discussed in thenext section and shown in Table 9.
In sum, progress in reducing theprevalence of anemia is hardlydetectable, and numbers affected are increasing. Earlier estimates ofdeterioration in South Asia and sub-Saharan Africa remain plausible, butcannot be taken further as insufficientnew data (after 1987) are available;
however, significant improvement doesnot appear to be occurring in theseregions or, indeed, elsewhere. Furtheranalysis seems merited, both to com-pare raw data from surveys in specificcountries, and to combine data in more meaningful ways, taking account of sample size and other information, to better understand recent trends andtheir determinants.
Levels of Vitamin A, Iodine, and Iron Deficiencies
As discussed previously, vitamin Adeficiency is declining substantially,which means that data should not be averaged over time. For clinicalvitamin A deficiency (indicated by night blindness and Bitot’s spots), themodel described in section 2 (“Data andAnalytical Methods”) was therefore usedto predict prevalences for 1985 and1995 for countries with and withoutsurvey results from the period1980–1997. These results, weighted bypopulation numbers and aggregatedaccording to regions, are shown in bothTable 6 and Fig. 9. The valuesincorporate the WHO multiplicationfactor and are therefore probablyconservative estimates. The numbers ofpeople affected (Table 6) are similar tonumbers reported by WHO (1995), forwhich 1994 population data were usedand prevalences (not corrected for trend)were averaged from 1980 onward. Thetotal number of preschool childrenaffected by clinical vitamin A deficiencyin 1995 is estimated at 3.3 million,equivalent to a prevalence of 0.63%.

31
Resu
lts:
Tren
ds in
redu
cing
mic
ronu
trie
nt d
efic
ienc
ies
[ TR
ENDS
IN P
REVA
LENCE
S ]
The comparable WHO value (WHO1995) was 2.8 million children.
Table 6 includes some alternativeestimates. Yet however the values arecalculated, the trend of improvementappears. The numbers of childrenaffected as of the mid-1990s might rangefrom 3.3 to 6 million, with a possibleprevalence range of 0.6% to 1.4%. Thevalues in Table 6 are used here as a pointof reference for 1985 and 1995, inrecognition that they are probablyconservative estimates. Prevalences ofclinical vitamin A deficiency by region for1985 and 1995 are displayed in Fig. 9.
As described earlier, the multiplicationfactor is probably incorrect. In this case,the basic value for global prevalence ofclinical vitamin A deficiency in 1995 isprobably best estimated as 1.2% inpreschool children.
Estimates of subclinical vitamin Adeficiency for 1995, as prevalences of low serum retinol level (<0.7 µmol/L)and numbers affected, are shown inTable 7 and Fig. 10. Two values aregiven, one with and the other withoutthe multiplication factor. The upper value probably more closelyapproximates reality (see Methodssection in MI et al. [1998]). Thenumbers affected are shown in Fig. 11.The highest prevalences of both clinicaland subclinical vitamin A deficiency wereobserved in south Asia and sub-SaharanAfrica, where 30% to 40% of preschoolchildren are at heightened risk of illhealth and death. WHO (1994)suggested that in populations in which more than 20% of the childrenhave serum retinol levels less than 0.7 µmol/L, vitamin A deficiency should be regarded as a severe publichealth problem; this criterion applies to the populations of these regions.
Table 6. Prevalence and number of preschool children affected by clinical vitamin A deficiency,*1985–1995.
No. affected Change in prevalencePrevalence (%) (millions) (percentage points/decade)
Region† 1985 1995 1985 1995 1985–1995
South Asia 1.79 0.95 2.67 1.58 –0.84East Asia and Pacific 0.43 0.25 0.66 0.40 –0.18Latin America and Caribbean 0.35 0.24 0.17 0.12 –0.11Eastern and southern Africa 1.80 1.06 0.69 0.53 –0.74Western and central Africa 1.40 0.87 0.53 0.45 –0.53Middle East and northern Africa 0.63 0.27 0.24 0.12 –0.36Total‡ 1.06 0.63 5.00 3.30 –0.43Source: MI et al. (1998).Note: The values in this table were computed with the WHO multiplication factor.*Defined as xerophthalmia (night blindness and Bitot’s spots).†Regions as defined by United Nations Children’s Fund (UNICEF).‡Alternative calculations of total prevalence values for all developing regions are possible. Method 1—averaging the available survey resultswithin time periods, with and without the applicable WHO multiplication factor (MF) (WHO 1995), yields the following: for 1980–1989, with MF,prevalence = 1.65%, without MF, prevalence = 2.45% (n = 16); for 1990–1996, with MF, prevalence = 0.79%, without MF, prevalence = 1.41% (n = 19) (P = 0.013). Method 2—using the model estimates without MF, values for 1995 are as follows: prevalence = 1.15% and no. affected = 6.0 million. The WHO MF is used as a way of allowing for how well the sample reflects the population; see Table 2.

[THE MICRONUTRIENT REPORT: PART 1]32
FIG9 >> Estimated
prevalence of clinical
vitamin A deficiency
among preschool
children in 1985 and
1995. Values in this
figure incorporate
the WHO multiplication
factors. The data
are presented in
Table 6. Regions are
as defined by UNICEF
(1998, p. 122).
PREVALENCE OF CLINICAL VITAMIN A DEFICIENCY (%)
0 0.5 1.0 1.5 2.0
SOUTH ASIA
EAST ASIA & PACIFIC
LATIN AMERICA & CARIBBEAN
EASTERN & SOUTHERN AFRICA
WESTERN & CENTRAL AFRICA
MIDDLE EAST & NORTHERN AFRICA
TOTAL
19851995
Table 7. Prevalence and number of preschool children affected by subclinical vitamin A deficiency,* 1995.Prevalence (%) No. affected (millions)
With WHO Without WHO With WHO Without WHORegion† MF MF MF MFSouth Asia 19.2 35.6 32.3 59.5East Asia and Pacific 9.1 18.2 14.8 29.6Latin America and Caribbean 9.0 19.6 4.7 10.2Eastern and southern Africa 20.0 37.1 10.0 18.6Western and central Africa 18.1 33.5 9.4 17.4Middle East and northern Africa 9.8 9.8 4.2 4.2Overall 14.6 26.5 75.4 139.5WHO MF = World Health Organization multiplication factor (used as a way of allowing for how well the sample reflects the population; see Table 2).*Defined as serum retinol <0.7 µmol/L.†Regions as defined by UNICEF.

33
Resu
lts:
Tren
ds in
redu
cing
mic
ronu
trie
nt d
efic
ienc
ies
[ TR
ENDS
IN P
REVA
LENCE
S ]
FIG10 >> Estimated
prevalence of subclinical
vitamin A deficiency,
defined as serum retinol
level < 0.7 µmol/L,
among preschool
children in 1995.
Regions are as
defined by UNICEF
(1998, p. 122).
PREVALENCE OF SUBCLINICAL VITAMIN A DEFICIENCY (%)
0 10 20 30 40
SOUTH ASIA
EAST ASIA & PACIFIC
LATIN AMERICA & CARIBBEAN
EASTERN & SOUTHERN AFRICA
WESTERN & CENTRAL AFRICA
MIDDLE EAST & NORTHERN AFRICA
TOTAL
FIG11 >> Estimated
numbers of preschool
children affected by
subclinical vitamin A
deficiency, defined as
serum retinol level
< 0.7 µmol/L, in 1995.
Regions are as
defined by UNICEF
(1998, p. 122).
NO. WITH LOW SERUM RETINOL (MILLIONS)
0 10 20 30 7040 50 60
SOUTH ASIA
EAST ASIA & PACIFIC
LATIN AMERICA & CARIBBEAN
EASTERN & SOUTHERN AFRICA
WESTERN & CENTRAL AFRICA
MIDDLE EAST & NORTHERN AFRICA

[THE MICRONUTRIENT REPORT: PART 1]34
Of the global total of 140 millionchildren affected by vitamin A deficiency,nearly 100 million live in south Asia or sub-Saharan Africa.
Prevalences and numbers affected byiodine deficiency, assessed as visible plus palpable goitre, were recentlyreported by WHO (1999), and theresults for regions of developingcountries (excluding Latin America andthe Caribbean) are shown in Table 8. In Africa and the eastern Mediterraneanregion (including Pakistan), theprevalences are about 20% to 30%;estimates for Southeast Asia are lower.The total number affected in thesecountries is estimated as nearly 600 million in 1998, of the 740 millionthought to be affected by goitre worldwide(WHO 1999, Table 3). Comparing theestimates for 1990 and 1998 indicateslittle change in overall prevalence overthis period (WHO 1999, Table 5; Table8 in the current document).
Iron deficiency is indicated by anemia,and the prevalence data summarized by
WHO (1997) for the period 1980–1996may be taken as the reference. Nosignificant trend is seen in any region, so averaging across several years shouldnot introduce bias. The populationnumbers were standardized to 1995 byWHO (1997). The data for pregnant andnonpregnant women 15–59 years of ageextracted from WHO (1997) are given inTable 9 and Fig. 12. Southeast Asia andthe eastern Mediterranean region arethought to have the highest prevalences,around 60%. The higher value of 79.6% for pregnant women in SoutheastAsia depends on how prevalence iscalculated for India (see below). Fordeveloping countries as a whole, theaverage prevalences are 42% to 56% for nonpregnant and pregnant women, respectively, and an estimated1.14 billion nonpregnant women and 96 million pregnant women are anemic.
The anemia data in Table 9 are forregions defined by WHO and thuscannot be readily compared with theregional definitions used here, whichcorrespond to those of UNICEF. The
Table 8. Prevalence and number of people (all ages) with goitre (visible + palpable) in 1990 and 1998.1990 1998
No. affected No. affected Region*† Prevalence (%) (millions) Prevalence (%) (millions)Southeast Asia 13.0 176 12 172Western Pacific 9.0 141 8 124Africa 15.6 86 20 124Eastern Mediterranean 22.9 93 32 152Overall 12.5 496 13.6 572Sources: for 1990, WHO (1993, Table 2A); for 1998, WHO (1999, Table 5).*Regions as defined by WHO.†Americas not included because industrialized (Canada and United States) and non-industrialized (Latin America and the Caribbean) regions could not be distinguished in these data. Data here can be compared with data for Africa, Asia, Latin America, and the Caribbean,shown in Fig. 6.

35
Resu
lts:
Tren
ds in
redu
cing
mic
ronu
trie
nt d
efic
ienc
ies
[ TR
ENDS
IN P
REVA
LENCE
S ]
prevalences for 1995 calculated from ourdatabase and presented in Tables 4 and 5 can be used for comparison with other estimates by region. The maindifferences between the WHO estimatesand those in Tables 4 and 5 are forpregnant women in the WHO region“Southeast Asia” (prevalence 79.6%; see Table 9), which is essentially
equivalent to the UNICEF region “SouthAsia” (prevalence 59.7%; see Table 5).The difference depends mainly on theprevalence estimated for India. From the database used here, the values rangedfrom 66% to 90%, and the median of eight values was 72%. The medianvalue for Bangladesh was 62% and for Pakistan 51%. On this basis, although
FIG12 >> Prevalence of
anemia among women
15–49 years of age in
1995; definition of
anemia for pregnant
women is hemoglobin
< 110 g/L and for
nonpregnant women,
hemoglobin < 120 g/L.
Regions are as defined
by UNICEF (1998,
p. 122).
PREVALENCE OF ANEMIA (%)
0 10 20 30 6040 50
NonpregnantPregnant
SOUTH ASIA
SOUTHEAST ASIA
CENTRAL AMERICA & CARIBBEAN
SOUTH AMERICA
SUB-SAHARAN AFRICA
MIDDLE EAST & NORTHERN AFRICA
Table 9. Prevalence and number of women (15–59 years of age) affected by anemia in 1995.Pregnant women† Nonpregnant women‡
No. affected No. affected Region* Prevalence (%) (millions) Prevalence (%) (millions)Southeast Asia 79.6 22 227 57.0 192 746Western Pacific (non-industrialized) 38.5 9 384 33.8 144 558Americas (non-industrialized) 39.0 3 838 30.0 40 546Africa 46.9 9 586 36.6 48 194Eastern Mediterranean 63.9 8 807 49.0 51 389Overall 55.8 53 842 42.0 477 433Source: WHO (1997, Table 8).*Regions as defined by WHO.†For pregnant women, anemia defined as hemoglobin level <110 g/L.‡For nonpregnant women, anemia defined as hemoglobin level <120 g/L.

[THE MICRONUTRIENT REPORT: PART 1]36
the prevalence of 79.6% seems relativelyhigh, the prevalence of 59% might below. In any case, this analysis gives someidea of the range of uncertainty, andeither way the prevalence is very high.
For comparing prevalences of differentdeficiencies and examining possibleoverlaps, the age group most commonlyused is preschool children. The anemiaestimates for this group have been takendirectly from WHO (1997), althoughcertain assumptions have been made sothat definitions of the various regionsare essentially equivalent.
Overlaps and Multiple Deficiencies
Prevalences of the different deficiencies,summarized in Fig. 13, are generallyhighest in South Asian and lowest in East Asia and the Pacific region, The extent of multiple deficiencies can be approximated from these data bymaking some assumptions about howindividual deficiencies overlap in thepreschool population. We can makesome reasonable estimates of the highestand lowest prevalences likely for two ormore deficiencies in the same children.A high estimate would assume that theworst-off children were the same forseveral deficiencies — that the poorest,for example, tended to suffer from thecombination of deficiencies. Forexample, if it is assumed that theprevalence of vitamin A deficiency is25% and that of anemia is 40%, thenthe 25% of children with vitamin Adeficiency are assumed to represent asubset of those with anemia. In this
situation, all of the children with vitamin A deficiency would be anemic,and the prevalence of those with bothvitamin A deficiency and anemia wouldbe 25%. This estimate of the prevalenceof dual deficiency is probably high. Analternative assumption is that there is nocorrelation between various deficienciesand that (in this example) the prevalenceof vitamin A deficiency in the anemicpopulation is the same as in the overallpopulation, 25%. Thus the proportionof those with both anemia and vitamin Adeficiency would be 25% of the 40%with anemia or 10% of the totalpopulation. Therefore, the likelyprevalence of two or more deficienciescould be set as 10% to 25%. Althoughthis range is wide, it has a certain valuein giving some idea of the extent of the problem.
The actual overlap can be gauged from afew studies and probably lies somewherebetween these bounds (W. Schultink,UNICEF, personal communication,1999). For example, some results fromIndonesia showed higher levels of lowserum retinol level in anemic preschoolchildren (Merzenich et al. 1994),whereas for others the prevalence wassimilar to that in the overall population(Angeles-Agdeppa et al. 1997; Thu et al. 1999).
Results based on these calculations are presented in Table 10. The overallrange of prevalences for preschoolchildren with two or more deficiencies is estimated at 13% to 27%, and about 100 million children are affected.

37
Resu
lts:
Tren
ds in
redu
cing
mic
ronu
trie
nt d
efic
ienc
ies
[ TR
ENDS
IN P
REVA
LENCE
S ]
Many deficiencies are known to interact.For our purposes, the most importantinteractions are those for which a singlenutrient intervention will be ineffectivein reducing the effects of the deficiencybecause another nutrient is lacking.Such problems can occur at differentlevels, for example absorption from thegut or metabolic pathways. Anemia is a good example. Many nutrients areinvolved in anemia (see, for example,Viteri 1998), which has various causes,many but not all of which involve dietary iron supply. Reduction ofanemia (through effects on absorption,metabolism, probably gene expression,and other processes) can depend onconcurrent provision of other nutrients,such as vitamin C, folate, or vitamin A(for example, see Schultink and Gross1997). Similarly, most nutrientdeficiencies affect the immune system,
and all such deficiencies may need to be corrected before full immunecompetence can be restored.
The calculations performed here (Table 10) show clearly that we canexpect only limited success in controllingthe effects of micronutrient deficienciesby tackling one micronutrient at a time.For example, in theory, reducing themost prevalent deficiency (bearing in mind that cutoff values are somewhatarbitrary) might reduce the prevalence of dual deficiency to that where the nextmost scarce nutrient becomes limiting —from 35.6% to 27.4% in South Asia, for example.
This analysis argues for a multifacetedapproach incorporating supplemen—tation and fortification with severalmicronutrients, supported where
FIG13 >> Summary of
regional prevalences of
underweight, subclinical
vitamin A deficiency,
iodine deficiency
disorders, and anemia
among preschool
children in 1995.
Data are presented in
Table 10. Regions are
as defined by UNICEF
(1998, p. 122).
PREVALENCE OF DEFICIENCY (%)
0 20 6040
SOUTH ASIA
EAST ASIA & PACIFIC
SUB-SAHARAN AFRICA
MIDDLE EAST & NORTHERN AFRICA
LATIN AMERICA & CARIBBEAN
UnderweightVitamin A deficiencyIodine deficiency disorderAnemia

[THE MICRONUTRIENT REPORT: PART 1]38
Tabl
e 10
. Pr
eval
ence
of nu
triti
onal
pro
blem
s an
d im
plie
d ov
erla
p of
def
icie
ncie
s in
pre
scho
ol c
hild
ren.
Unde
rwei
ght*
Vita
min
Ade
ficie
ncy†
Iodi
ne d
efic
ienc
y‡An
emia
§W
ith t
wo
or m
ore
(199
5)(s
ubcl
inic
al, 19
95)
(198
5–19
96)
(197
5–19
97)
nutriti
onal
def
icie
ncie
s||
Prev
-No.
Pr
ev-
No.
Pr
ev-
No.
Pr
ev-
No.
Pr
ev-
No.
al
ence
af
fect
ed
alen
ce
affe
cted
alen
ce
affe
cted
alen
ce
affe
cted
alen
ce
affe
cted
Regi
on(%
)(m
illio
ns)
(%)
(mill
ions
)(%
)(m
illio
ns)
(%)
(mill
ions
)(%
)(m
illio
ns)
Sout
h Asi
a 52
87.4
35.6
59.5
25.3
42.5
52.7
93.8
27.4
–35.
646
.1–5
9.8
East
Asi
a an
d Pa
cific
2339
.318
.229
.618
.031
.114
.120
.04.
2–18
.28.
2–31
.1La
tin
Am
eric
a an
d Ca
ribb
ean
116.
219
.610
.215
.68.
822
.913
.04.
5–19
.62.
5–11
.1Su
b-Sa
hara
n Afric
a30
30.9
35.3
36.0
29.2
30.1
33.1
34.1
11.7
–33.
112
.1–3
6.3
Mid
dle
East
and
nor
ther
n Afric
a16
7.4
9.8
4.2
24.0
11.1
38.3
17.7
9.2–
24.0
4.3–
7.4
Ove
rall
3117
1.2
2613
9.5
2312
3.6
3517
8.6
13–2
773
.2–1
45.7
*Val
ues
are
base
d on
ACC
/SCN
(19
96), c
alcu
late
d fo
r re
gion
s from
cou
ntry
est
imat
es.
†Pre
vale
nce
of s
ubcl
inic
al v
itam
in A
defic
ienc
y as
giv
en in
MI et
al.
(199
8). Fo
r su
b-Sa
hara
n Afric
a, v
alue
s fo
r ea
ster
n an
d so
uthe
rn A
fric
a an
d w
este
rn a
nd c
entral
Afric
a w
ere
wei
ghte
d an
d co
llaps
ed int
oa
sing
le v
alue
(fo
r ea
ster
n an
d so
uthe
rn A
fric
a, p
reva
lenc
e w
as 3
7.1%
, an
d 18
.6 m
illio
n w
ere
affe
cted
; fo
r w
este
rn a
nd c
entral
Afric
a, p
reva
lenc
e w
as 3
3.5%
, an
d 17
.4 m
illio
n w
ere
affe
cted
).‡P
reva
lenc
es c
alcu
late
d from
nat
iona
lly r
epre
sent
ativ
e da
ta in
MN-N
et (
MI 19
99)
and
othe
r so
urce
s (s
ee A
ppen
dix
3), as
use
d fo
r Fi
g. 6
, by
ave
ragi
ng a
ll da
ta p
oint
s by
reg
ion.
The
se r
esul
ts w
ere
for
scho
ol-a
ge c
hild
ren
and
have
not
bee
n ad
just
ed for
age
, bu
t di
ffere
nces
fro
m p
resc
hool
chi
ldre
n ar
e re
lative
ly m
inor
(W
HO 1
993,
p. 49
).§Dat
a from
WHO (
1997
, Ta
ble
8). So
me
appr
oxim
atio
ns w
ere
used
for
reg
iona
l ag
greg
atio
n, a
s fo
llow
s: S
outh
Asi
a is
the
app
roxi
mat
ion
for
the
WHO r
egio
n ca
lled
“Sou
thea
st A
sia”
; M
iddl
e Ea
st a
ndno
rthe
rn A
fric
a ap
prox
imat
es W
HO r
egio
n ca
lled
“Eas
tern
Med
iter
rane
an”;
Eas
t Asi
a an
d Pa
cific
reg
ion
is a
ppro
xim
ated
by
WHO r
egio
n ca
lled
“wes
tern
Pac
ific,
non
-indu
strial
ized
”; a
nd L
atin
Am
eric
a an
dth
e Ca
ribb
ean
appr
oxim
ates
WHO r
egio
n ca
lled
“Am
eric
as, no
n-in
dust
rial
ized
.”||L
ower
val
ue a
ssum
es n
o co
rrel
atio
n be
twee
n m
ultipl
e de
ficie
ncie
s, s
uch
that
in
the
high
est-pr
eval
ence
gro
up, th
e pr
eval
ence
of th
e se
cond
-hig
hest
def
icie
ncy
in t
he o
vera
ll pr
esch
ool po
pula
tion
is
appl
ied
(i.e
., th
e tw
o hi
ghes
t pr
eval
ence
s ar
e m
ultipl
ied)
; th
e hi
gher
fig
ure
assu
mes
com
plet
e ov
erla
p be
twee
n m
ultipl
e de
ficie
ncie
s, s
o th
at a
ll su
bjec
ts in
the
seco
nd-h
ighe
st p
reva
lenc
e gr
oup
are
take
n as
hav
ing
the
defic
ienc
y re
pres
ente
d by
the
hig
hest
pre
vale
nce
(i.e
., th
is e
qual
s th
e se
cond
hig
hest
pre
vale
nce)
. Th
ese
two
estim
ates
are
lik
ely
to b
ound
the
act
ual pr
eval
ence
. Und
erw
eigh
t is
cons
ider
ed a
def
icie
ncy
here
, fo
r ex
ampl
e pr
otei
n-en
ergy
mal
nutritio
n or
pro
tein
-ene
rgy
defic
ienc
y.

39
Conc
lusi
ons
[ TR
ENDS
IN P
REVA
LENCE
S ]
Vitamin A deficiency is decreasingrapidly, and clinical forms are likely to become rare in the near future.Subclinical deficiency, however, whichcarries substantial risk of death, is at a high level among children in poorcountries, and its control would repaycontinued vigorous efforts.
In contrast, there is little evidence ofimprovement in anemia levels, whichboth reflects iron deficiency and iscaused by it. This deficiency affectsparticularly women and their infants and is the most common deficiencytoday — half a billion women are anemicworldwide. No highly effective controlmeasure is available, but a combinationof approaches including attention toassociated deficiencies (e.g., vitamin Aand folate) can bring relief.
Iodine deficiency disorders certainlyrespond rapidly to iodized salt programs,but without such programs, the disordersappear to persist at levels associated withrisk of developmental problems. Theexpansion of control measures, mainlyiodized salt, if they can be monitored
and sustained, may lead to major successin human nutrition.
Overlaps and interactions betweenmicronutrients (anemia is a clearexample) are likely widespread, probably affecting about 20% ofpreschool children, and half of thechildren with any deficiency may havemultiple deficiencies. This situationargues strongly for a multifacetedapproach, notably supplementationand fortification with multiplemicronutrients, for both operationaland biological reasons.
There is a serious scarcity of data formaking these assessments. In particular,few comparable, representative nationalsurveys have been conducted throughtime. Priority should be given torepeating such surveys to allow betterassessment of current progress. Inaddition, first-time surveys are neededin many countries (especially for anemiabut also for other deficiencies) togenerate baseline data, so that we candetermine in the future whether effortshave had any effect.
4. CONCLUSIONS
feasible with increased micronutrientintake from the diet. Such an approachnot only makes sense in operationalterms — if a supplement is to be given(especially daily or weekly), it ought to
contain all that is needed — but mayactually be imperative biologically.

[THE MICRONUTRIENT REPORT: PART 1]40
Finally, there is no doubt that manypeople are affected by deficiencies of many other nutrients, and assess-ment methods are not yet adequate toidentify these deficiencies. Zinc is anobvious example. Rickets, possibly caused by a complex of factors, is stillwidely observed. Other deficiencies, such as that of selenium, may both beimportant themselves and interact with others (such as iodine deficiency in the case of selenium deficiency).Many vitamins and minerals are probably limiting during catch-upgrowth in children, which constitutesmuch of the growth of children in poor environments. In terms ofunderstanding these deficiencies on a worldwide basis, the surface is only now being scratched, and an increase in attention to these problems holdsgreat promise for improvements inhuman health and development.

41
Introd
uctio
n[ PR
OGRA
M IM
PLEM
ENTA
TION IN T
HE
1990
s ]
2.
ProgramImplementationin the 1990s
Over the past two decades there has been a major increase in the globalattention and commitment to thecontrol and elimination of micro-nutrient malnutrition. Results of the research conducted during the1980s have expanded our understandingof the adverse consequences of thesedeficiencies, which are much moreextensive than previously assumed in alarge number of developing countries.Several key international meetings heldin 1990s, including the World Summitfor Children in 1990, the 1991
Montreal meeting entitled “EndingHidden Hunger,” and the 1992
International Conference on Nutrition, raised awareness andstimulated worldwide actions to address micronutrient malnutrition.Many countries developed plans ofaction to specifically control andeliminate deficiencies of vitamin A,iodine, and iron in their populations for health, intellectual development, and economic gains. These plans,together with availability and leverage of substantial external and internalresources, led to an increasing numberof affected countries initiating actions tocontrol micronutrient deficiencies.
1. INTRODUCTION
[THE MICRONUTRIENT REPORT: PART 2]42
Part II of this report reviews progress inplanning and implementing programs tocontrol micronutrient deficiencies andindicates, where feasible, the evolutionof such programs in recent years. Ofcourse, data collection progressed inconjunction with the control programs,so assessing current status of programs
is easier than assessing trends. Becausecountries are at various stages ofsituation analysis, policy development,program implementation, and programevaluation, the main aim of this sectionis to provide information that will beuseful to policy and decision making atglobal, regional, and national levels.
2. TYPES OF PROGRAMS
The major strategies to correct micro-nutrient deficiencies are supplemen-tation, dietary diversification or modi-fication, and fortification.
➧ Supplementation is a medicalapproach to treating and preventingmicronutrient malnutrition andinvolves administration of capsules,tablets, syrups, and other prepara-tions of the required micronutrient.Supplementation is the method ofchoice when the deficiency is severeand life threatening or when access to regular intake of micronutrients islimited and there is high likelihoodof severe deficiency episodes.
➧ Dietary diversification ormodification aims to correct dietary behaviours that lead tomicronutrient deficiencies and toensure that deficient populationshave access to foods rich inmicronutrients.
➧ Fortification is the addition ofmicronutrients to foods that areregularly consumed and as such it can deliver micronutrients to a largepopulation through the daily diet.
On the basis of experiences to date, amix of strategies seems most likely toresult in sustained enhancement ofhealth benefits, particularly whencombined with health measures.According to the Institute of Medicine(Howson et al. 1998a), the preferredapproach is related to the extent of the problem at the population level (see Table 11). The long-term goal ofintervention should be to shift emphasisaway from supplementation toward acombination of food fortification(through universal salt iodization orfortification of flour with iron, forexample) and dietary diversification,where appropriate and feasible. In other words, as populations move alongthe continuum of risk from a position of higher to one of lower risk, therelevant mix of interventions shouldfavour those involving food intake andshould be modeled after that presentedin Table 11.
The high-priority interventions aretargeted supplementation for iron andvitamin A and universal fortification for vitamin A, iodine, and iron. Thefollowing sections summarize programs
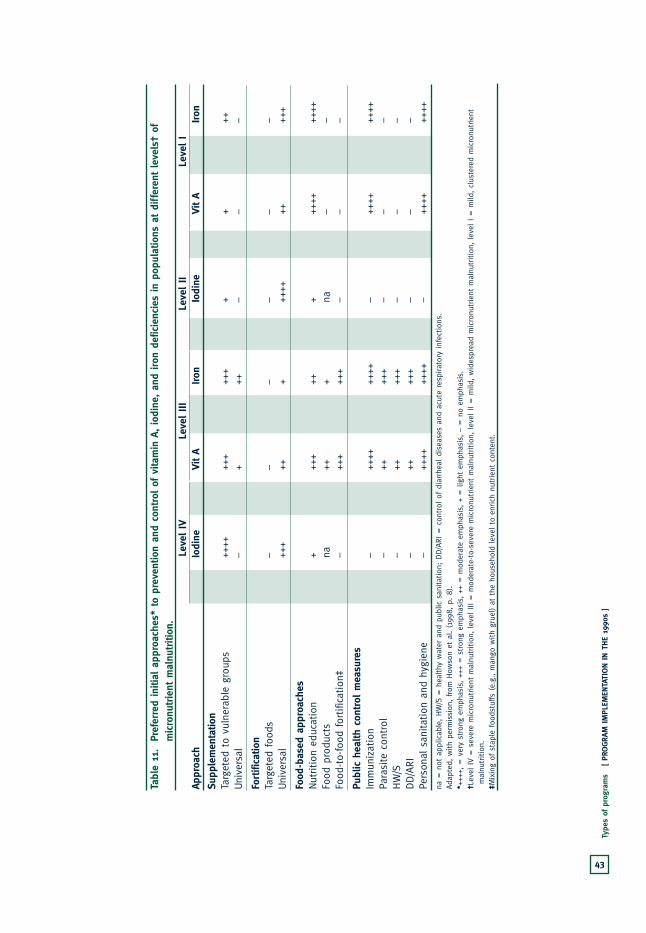
Tabl
e 11
.Pr
efer
red
initi
al a
ppro
ache
s* t
o pr
even
tion
and
cont
rol of
vita
min
A, io
dine
, an
d iron
def
icie
ncie
s in
pop
ulat
ions
at di
ffer
ent
leve
ls†
ofm
icro
nutrie
nt m
alnu
triti
on.
Leve
l IV
Leve
l III
Leve
l II
Leve
l I
Appr
oach
Vit A
Iodi
neIron
Vit A
Iodi
neIron
Vit A
Iodi
neIron
Vit A
Iodi
neIron
Supp
lem
enta
tion
Targ
eted
to
vuln
erab
le g
roup
s++
++++
–++
+++
+++
+++
+++
++
++Uni
vers
al++
++–
++++
+–
++–
––
––
–
Fortifi
catio
nTa
rget
ed foo
ds++
+–
+–
––
––
––
––
Uni
vers
al–
+++
–++
++++
+++
++++
+++
++++
++++
+
Food
-bas
ed a
ppro
ache
sNut
rition
edu
cation
+++
+++
++
++++
+++
+++
++++
++++
++Fo
od p
rodu
cts
+++
na++
++na
++
na–
–na
–Fo
od-to-
food
for
tific
atio
n‡++
++–
++++
+++
–++
+–
––
––
–
Publ
ic h
ealth
con
trol
mea
sure
sIm
mun
izat
ion
++++
–++
++++
++–
++++
++++
–++
++++
++–
++++
Para
site
con
trol
++–
+++
++–
+++
––
––
––
HW
/S–
–++
+++
–++
+–
––
––
–DD/A
RI
+++
–++
+++
–++
+–
––
––
–Pe
rson
al s
anitat
ion
and
hygi
ene
++++
–++
++++
++–
++++
++++
–++
++++
++–
++++
na =
not
app
licab
le, HW
/S =
hea
lthy
wat
er a
nd p
ublic
san
itat
ion;
DD/A
RI = c
ontrol
of di
arrh
eal di
seas
es a
nd a
cute
res
pira
tory
inf
ection
s.Ad
apte
d, w
ith
perm
issi
on, from
How
son
et a
l. (1
998,
p. 8)
.*+
+++,
= v
ery
stro
ng e
mph
asis
, ++
+ = s
tron
g em
phas
is, ++
= m
oder
ate
emph
asis
, +
= lig
ht e
mph
asis
, –
= n
o em
phas
is.
†Lev
el IV =
sev
ere
mic
ronu
trie
nt m
alnu
tritio
n, lev
el III
= m
oder
ate-
to-s
ever
e m
icro
nutrie
nt m
alnu
tritio
n, lev
el II = m
ild, w
ides
prea
d m
icro
nutrie
nt m
alnu
tritio
n, lev
el I =
mild
, cl
uste
red
mic
ronu
trie
ntm
alnu
tritio
n.‡M
ixin
g of
sta
ple
food
stuf
fs (
e.g.
, m
ango
with
grue
l) a
t th
e ho
useh
old
leve
l to
enr
ich
nutrie
nt c
onte
nt.
43
Type
s of
pro
gram
s[ PR
OGRA
M IM
PLEM
ENTA
TION IN T
HE
1990
s ]

[THE MICRONUTRIENT REPORT: PART 2]44
planned or implemented in these areas.Multiple micronutrient fortification and supplementation have only recentlyemerged as potentially important
interventions, so there are fewer data toreport on these approaches. Similarly,public health measures are not examinedin detail here.
3. METHODS, DATA SOURCES, AND TREATMENT OF DATA
The first source of much of the data usedfor this report is the MicronutrientNetwork (MN-Net) (MI 1999). Thesources of data for MN-Net are thedatabases developed and maintained bythe ICCIDD, WHO, and UNICEF, aswell as information obtained from adhoc inquiries through internationalagencies and literature searches. Theiodine data were compiled by ICCIDDand are also available through MN-Net.At the time MN-Net was developed, nodatabase on programs for controllingiron deficiency had been compiled in the required format, so the MIdeveloped the appropriate database itself, using information available from various sources. MN-Netincorporates information obtainedthrough questionnaires sent to allUNICEF field offices as well as othersources available in 1995. UNICEFcarried out surveys in 1997 for iron, and in 1997 and 1998 for vitamin A.
The information in MN-Net wasupdated in 1999, with data on vitamin Aand iron from the UNICEF field surveys and a further literature search, as outlined in MI et al. (1998) for vitamin A. Also in 1999, MN-Net was restructured, and the results and
tables presented in this document reflect much of the current structure of MN-Net.
Data on policy and legislation (Table 12)are based on information contained inMN-Net (MI 1999) and WHO (1999)and on results obtained by the AsiaDevelopment Bank (ADB) and UNICEF(Mason et al. 2000). Table 12 includesMN-Net data for vitamin A, mostlyderived from a 1998 UNICEF fieldsurvey, originally presented in MI et al.(1998). MN-Net information onnational iron supplementation policiescomes mainly from a 1997 UNICEFfield survey. MN-Net data on iodinelegislation was provided by ICCIDD(2000), as well as WHO (1999).Information on micronutrient policyand legislation for countries in SoutheastAsia also incorporates results obtained byADB and UNICEF (Mason et al. 2000).
Information on procurement of vitamin A capsules and iron–folatetablets (donated by Canada and shippedby UNICEF) was provided from officialrecords of the MI and UNICEF.

45
Met
hods
, da
ta s
ourc
es, an
d trea
tmen
t of
dat
a[ PR
OGRA
M IM
PLEM
ENTA
TION IN T
HE
1990
s ]
General Principles of Data Treatment One problem in assembling the data and deriving the various averages andestimates of adequacy (expressed aspercentage of need met) is theincompleteness of data by country and year. The following principles were therefore applied.
➧ With respect to program data,countries that have never reportedprogram coverage were treated asmissing and were not included indenominators. For countriesreporting for some years and notothers, the years without reports were treated as missing, and regionalcoverage was expressed as a medianvalue (e.g., column I in Table 13 and column H in Table 19) excluding the iodine data.
➧ With respect to procurement data, countries with no recordedprocurement were given a zero value for estimation of the regionalaverages (e.g., column F in Table 13and column E in Table 19). Theregional average was not used inestimating the adequacy of supply, in part because of this manipula-tion. Comparisons of supply withestimated need for one year (i.e.,vitamin A capsules in 1998, iron in1996) included only countries withsome level of procurement reported.
➧ With respect to policy and legislationdata, the regional values for eachindicator represent only countriesthat have already adopted theparticular policy or legislation.
Thus, in compiling the data,countries for which information on supplementation policy orfortification legislation wasunavailable and those with policy or legislation in the planning stages,in draft form, or pending were givena value of zero (and have a “no” entry in Appendix 8). Informationon current status of policy andlegislation in these countries appearsin footnotes to Appendix 8.
Vitamin A
Appendix 9 (columns A and D) presentstotal procurement of 100 000 IU and200 000 IU vitamin A capsules byvarious countries in 1998. Theprocurement data were provided by theUNICEF Copenhagen Supply Divisionand represent shipments of vitamin Acapsules (donated by the CanadianInternational Development Agency)from Copenhagen to UNICEF fieldoffices in 1998. The total number ofcapsules procured by a country does notinclude any capsule supply purchasedwith national funds (either governmentor nongovernmental organization) orobtained through local production.These procurement data are aggregatedby UNICEF region in Table 13, whichalso includes regional vitamin Aprocurement for 1993–1996; these data were also provided by the UNICEFCopenhagen Supply Division and areshown here as given in MI et al. (1998).For determining the annual average forregional procurement for the five yearspresented in Table 13, any country withno procurement was given a zero value.

[THE MICRONUTRIENT REPORT: PART 2]46
Therefore, for determining the annualaverage, the denominator is 5 years,regardless of the countries and years for which no data are available.
To assess the potential range of coveragewith vitamin A capsules, the estimatedadequacy of the capsule supply wascalculated separately for the agecategories 6–12 months and 12–59months. The potential coverage valuesfor various countries are presented inAppendix 9 (columns C and G). Theestimated adequacy of capsule supply forthe two age groups was derived from thetotal number of capsules received andrepresents the potential percentage ofchildren who received the recommendedage-specific dose of vitamin A. Thevalues were calculated on the basis of1996 population figures and policyrecommendations made by WHO,UNICEF, IVACG (1997). Thatdocument recommends one 100 000-IU capsule per year forchildren 6–12 months of age, two 200 000-IU capsules per year forchildren 12–59 months of age, and one 200 000-IU capsule forpostpartum women.
Given the recommended supplemen-tation dose and frequency ofadministration and the available age-specific population data, the estimatedannual need for each age group wascalculated (Appendix 9, columns B and E). Column F shows the estimatedannual capsule need for postpartumwomen. Estimated annual capsule needis presented here only for countries and
capsule dosages for which 1998procurement data were reported.Because children 6–12 months of ageneed only one 100 000-IU capsuleannually, computation of the estimatedadequacy of capsule supply is straight-forward (division of the total number of100 000-IU capsules procured in 1998by the total estimated need for this agegroup in that year, i.e., [column A ÷column B] x 100 = column C inAppendix 9). Computation of theestimated adequacy of capsule supply forchildren 12–59 months of age was morecomplicated. Division of the number of200 000-IU capsules received by theestimated capsule need will overestimatepotential capsule coverage, becausepostpartum women also receive 200 000-IU capsules, although theproportion of capsules received by thecountry that are used for this group isunknown. To account for postpartumsupplementation, equal coverage forpostpartum women and children 12–59 months of age was assumed. Thevalues in column G of Appendix 9 werecalculated as follows: ([no. of capsulesreceived in 1998] ÷ [estimated annualneed for children 12–59 months +estimated annual need for postpartumwomen]) x 100, i.e. (column D ÷[column E + column F]) x 100 = column G in Appendix 9.
In computing the percentage ofestimated need met in each country(Appendix 9, columns C and G) and ineach region (Table 13, column H), onlythe estimated annual need for countrieswith reported procurement data were
47
Met
hods
, da
ta s
ourc
es, an
d trea
tmen
t of
dat
a[ PR
OGRA
M IM
PLEM
ENTA
TION IN T
HE
1990
s ]
included. Lack of procurement data isthus counted as missing data, rather thanas zero values for the region. Althoughcounting lack of procurement data asmissing data has an obvious effect onlyon the interpretation of columns C andG in Appendix 9, this approach shouldalso be considered carefully wheninterpreting the regional values in Table 13. Proper interpretation of theaggregated estimate of supply adequacyrequires consideration also of the effectof countries with a capsule supply greaterthan 100% of need (e.g., Mongolia,Myanmar, Honduras, and Nicaragua; see Appendix 9, column G). Moreover,in comparing potential and reportedprogram coverage for vitamin A inTables 13 (columns H and I) and 21
(columns C and D), it should beremembered that the values are notdirectly comparable. The estimatedadequacy of annual capsule supplyrepresents the potential coverage forchildren 12–59 months of age for 1 year,whereas the values for reported coveragewere obtained from UNICEF countryfield offices in response to a specificinquiry concerning the proportion ofchildren 6–59 months who received atleast one vitamin A dose in the previous6 months.
Table 15 shows the number of countriesin each region that distribute vitamin Acapsules in conjunction with nationalimmunization days, micronutrient days,or extended immunizations programs,or through postpartum supplementationpolicies. Many of the countries withnational immunization days did not
respond when asked whether these eventswere combined with distribution ofvitamin A capsules. They were recordedas having given no response (Table 15).In addition, many countries receivedvitamin A capsules through UNICEF but did not distribute them through the mechanisms described above.
Iodine
The data on households consumingadequately iodized salt are the same asthose given in UNICEF (2000) andwere provided directly by UNICEF (T. Wardlaw, N. Levin, and N. Dalmiya,1999). As far as possible, data on theproduction of iodized salt have beenexcluded, and only data on householdconsumption are included. Thedefinition of adequately iodized salt issalt with at least 15 ppm iodine, usuallydetermined by means of testing kits usedin household surveys. Most data pointsfor reporting countries fall within theperiod 1995–1998; however, for 23 countries, information on the date of survey was not available or the datawere collected before 1995 (Table 18 and Appendix 11). Country-level dataon household consumption of iodized salt are presented Appendix 11, andregional population-weighted averages of household consumption of iodizedsalt are presented in Table 18. Theseregional values cover only countries thatreported consumption of iodized salt.Population data from UNICEF (1998)were used in weighting countries thatreported consumption data.

[THE MICRONUTRIENT REPORT: PART 2]48
Iron
Procurement information for irontablets presented in Table 19, columnsA–E, comes from the UNICEFCopenhagen Supply Division andincorporates country-level data for bothiron folate and ferrous sulfate tablets.The procurement data for iron have also been used to assess the estimatedpotential coverage of the tablet supplyreceived by the countries in question.The adequacy of the 1996 iron tabletsupply is estimated for each country in Appendix 13 (column E). The values represent the annual potentialpercentage of pregnancies covered (for countries with recorded 1996procurement data), assuming a need for300 iron tablets over a 40-week termpregnancy, according to the followingformula:
([no. of iron tablets procured in 1996] ÷[no. of births in 1996 x 300-tablet needper pregnancy]) x 100
The estimated adequacy of the supply of iron tablets was also calculated on aregional basis (Table 19, column G).The annual number of births in theregion (Table 19, column F) wasdetermined from country-level data(UNICEF 1998) and represents the sumof births in countries with recorded1996 procurement data for iron tablets.Appendix 12 presents the reportedprogram coverage in 1996 for individualcountries. These data were compiledfrom the results of a 1997 UNICEF field survey to country offices. In mostregions, data for reported coverage of
iron programs is missing for more thanhalf of the countries. Regional programcoverage values in Table 19 (column I)are therefore given as the minimum and maximum values, rather than as aweighted average with a large proportionof the regional population excluded.The median value for each region is also given in Table 19 (column H) tofacilitate interpretation.
Table 19 (column E) shows the annualregional average procurement of irontablets for the period 1993–1996. Asstated above, countries for which therewere no procurement data were assigneda zero value, rather than treating data as missing for computation of theregional averages. The denominator for calculating average iron procurementwas therefore 4 years for all countries ineach region, regardless of the countriesand years for which no procurement data were listed.
Multiple Micronutrient Programs
For determining the number ofcountries with a policy on vitamin Asupplementation (Table 12, column B),only countries that had adopted auniversal policy for addressing vitamin Adeficiency were included. Countries thatwere counted as having a national policyfor iron (Table 12, column E) includethose for which supplementation isprovided to pregnant women eitheruniversally, on the basis of hemoglobinlevel, or on the basis of a clinicalassessment. Where the supplementationpolicy adopted is not universal, the basisfor supplementation is presented in
49
Resu
lts:
Prog
ress
in
mic
ronu
trie
nt d
efic
ienc
y co
ntro
l pr
ogra
ms
[ PR
OGRA
M IM
PLEM
ENTA
TION IN T
HE
1990
s ]
Appendix 8. The number of countries ineach region considered to have nationalvitamin A policy, iodine legislation, andiron policy (Table 12, column G) is thesum of the countries for which the criteriaof columns B, D, and E are all met. Forcountries in Central and Eastern Europeand for newly independent states,information is available only on ironsupplementation and iodine legislation;therefore, to avoid large amounts ofmissing data, these countries wereexcluded from Table 12. Available policyand legislation data for this group ofcountries are compiled at the countrylevel in Appendix 8.
The methods of computing regionalprocurement and estimating theadequacy of the supply of vitamin Acapsules (Table 21) were described in the methods section for vitamin A. The methods of calculating annualaverage procurement and estimating
adequacy of tablet supply for iron can befound in the preceding section on iron. The sources for reports of programcoverage for vitamin A and iron and forconsumption of iodized salt consist ofUNICEF field surveys of country offices(for iron in 1997 and for vitamin A in1998) and UNICEF (2000) for iodizedsalt, with additional informationprovided through UNICEF staff (T. Wardlaw, N. Levin, and N. Dalmiya,personal communication, 1999). Foreach region, individual country data onprogram coverage for vitamin A and ironand consumption of iodized salt wereclassified as low, medium, or high (low, <10%; medium, 10% to 60%;high, >60%), and the number ofcountries in each category is presentedin Table 21). The numbers of countriesnot reporting coverage data are alsoshown. Regional data are reported inthis way because a large number ofcountries did not report coverage data.
4. RESULTS: PROGRESS IN MICRONUTRIENT DEFICIENCYCONTROL PROGRAMS
Control of Vitamin A Deficiency
By the late 1990s, about half of thecountries in the developing world hadadopted national policies for addressingvitamin A deficiency (see Table 12).Regional program coverage ranged fromtwo-thirds of the countries in East Asiaand the Pacific region, to one-third of countries in the Middle East andnorthern Africa. In most countries,distribution of high-dose vitamin A
capsules was an important part of thepolicy. Most countries implementingvitamin A supplementation programshave adopted the policy recommendedby WHO, UNICEF, IVACG (1997),which specifies that children 6–12 months of age should receive a100 000-IU dose and children olderthan 12 months of age should be given a 200 000-IU dose every 4 to 6 months.

[THE MICRONUTRIENT REPORT: PART 2]50
Tabl
e 12
. Num
bers
of co
untrie
s w
ith m
icro
nutrie
nt s
uppl
emen
tatio
n po
licie
s an
d fo
rtifi
catio
n le
gisl
atio
n.No.
of co
untrie
s w
ith p
olic
y or
leg
isla
tion*
Vita
min
AIo
dine
Iron
Tota
l Nat
iona
lLe
gisl
atio
nLe
gisl
atio
n fo
rNat
iona
l po
licy
for
Legi
slat
ion
for
Mul
tiple
pol
icie
sno
. o
f po
licy
for
fortifi
catio
nio
dizi
ng s
alt
supp
lem
enta
tion
fortifi
catio
n (n
o. a
nd %
of
coun
trie
s(1
996–
1998
)(1
996–
1998
)(1
998–
1999
)(1
996–
1998
)(1
996–
1998
)co
untrie
s)UNIC
EF r
egio
nCo
l. A
Col.
BCo
l. C
Col.
DCo
l. E
Col.
FCo
l. G
Sout
h Asi
a7
41
45
03
(43)
East
Asi
a an
d Pa
cific
128
49
70
6(5
0)La
tin
Am
eric
a an
d Ca
ribb
ean
2112
1218
1110
6(2
9)Ea
ster
n an
d so
uthe
rn A
fric
a20
80
159
03
(15)
Wes
tern
and
cen
tral
Afric
a21
110
1512
17
(33)
Mid
dle
East
and
nor
ther
n Afric
a18
60
135
03
(17)
Tota
l99
4917
7449
1128
(28)
FSo
urce
s:M
I (1
999)
, W
HO (
1999
), a
nd M
ason
et
al. (2
000)
. Se
e Ap
pend
ix 8
for
com
plet
e da
ta s
et.
Not
e:Fo
r co
untrie
s in
cen
tral
and
eas
tern
Eur
ope
and
new
ly ind
epen
dent
sta
tes,
inf
orm
atio
n is
ava
ilabl
e on
ly o
n iro
n su
pple
men
tation
and
iod
ine
legi
slat
ion.
Of th
e 27
cou
ntries
in
the
regi
on, 10
hav
e a
nation
al iro
n su
pple
men
tation
pol
icy
and
18 h
ave
legi
slat
ion
conc
erni
ng iod
izat
ion
of s
alt
(see
App
endi
x 8)
.*C
ount
ries
for
whi
ch n
o in
form
atio
n w
as a
vaila
ble
conc
erni
ng p
olic
ies
or leg
isla
tion
for
mic
ronu
trie
nts
wer
e pr
esum
ed n
ot t
o ha
ve a
lread
y ad
opte
d a
mic
ronu
trie
nt p
olic
y or
leg
isla
tion
and
wer
e gi
ven
ava
lue
of z
ero
for
the
resp
ective
ind
icat
or.

51
Resu
lts:
Prog
ress
in
mic
ronu
trie
nt d
efic
ienc
y co
ntro
l pr
ogra
ms
[ PR
OGRA
M IM
PLEM
ENTA
TION IN T
HE
1990
s ]
Many countries distributing high-dosevitamin A supplements procure thecapsules through UNICEF’s SupplyDivision in Copenhagen. Othercountries, including China, India, andIndonesia, procure supplements locallyor regionally. Consolidated purchasingby UNICEF results in low costs. A single 200 000-IU capsule purchasedthrough the UNICEF Supply Divisioncosts US$0.02. The total number ofvitamin A capsules procured fromUNICEF for 1993–1996 and 1998 isshown in Table 13. A rapid increase inprocurement after 1993 is evident. Onaverage, over 100 million vitamin Acapsules were provided in 1993–1998.In 1998, for example, over 153 mil-lion vitamin A capsules were sent to 52 different countries (see Appendix 9for individual country data), a value thatcan be used to determine the adequacyof coverage for young children on theassumption of two capsules per year (see Methods section of MI et al.[1998]). This quantity of capsules would be sufficient to supply anestimated 38% of the children in thecountries that received capsules (Table 13) but only 10% of all child-ren in developing countries.
Coverage through vitamin A supple-mentation programs can also be assessedfrom the reports obtained from countryoffices (Appendix 9, column H).Because only a limited number ofcountries report levels of coverage andbecause the estimates (presented aspercentages) vary widely, the bestregional description of coverage is
the median value (Table 13, column I).In the 52 countries reporting supple-mentation programs, the mediancoverage was over 80%, except in LatinAmerica and the Caribbean. (There are several reasons why the values foravailable supply and reported programcoverage differ, one of which is thatsupply stocks are carried over; forexample the reported coverage data for South Asia do not match the supplydata because of carryover of capsulestocks from previous years’ supplies in Bangladesh).
The regional estimates of access tovitamin A capsules, in terms of reportedprogram coverage and adequacy ofsupply, for the 52 countries reportingsuch data, are displayed in Fig. 14. These data generally support theconclusion that high levels of capsuledistribution were achieved in manycountries in the mid-1990s.
The estimated prevalences of low serumretinol (see part I) can be comparedvisually with reported vitamin A programcoverage by categorizing and mappingthese two factors (Fig. 15). Somecorrespondence between reportedcoverage and extent of the deficiency isevident, for example, in sub-SaharanAfrica. Operationally, it could be useful to identify countries with highprevalence of vitamin A deficiency andlow coverage, which might be givenpriority for program development, as well as countries with significantprevalence of deficiency and highprogram coverage, but low levels of

[THE MICRONUTRIENT REPORT: PART 2]52
Tabl
e 13
. Re
gion
al p
rocu
rem
ent
of v
itam
in A
caps
ules
in
rela
tion
to n
eed.
No.
of vi
tam
in A
caps
ules
pro
cure
d (m
illio
ns)*
Estim
ated
M
edia
n re
ported
Annu
alNee
d† (
mill
ions
adeq
uacy
of
cove
rage
§ (
%)
and
1993
1994
1995
1996
1998
aver
age
of c
apsu
les)
supp
ly‡
(%)
no. of
cou
ntries
UNIC
EF r
egio
nCo
l. A
Col.
BCo
l. C
Col.
DCo
l. E
Col.
FCo
l. G
Col.
HCo
l. I
Sout
h Asi
a5.
3646
.50
48.0
62.
406.
7321
.81
62.7
39.
187
(5)
East
Asi
a a
nd P
acifi
c3.
9513
.70
12.6
426
.00
31.3
117
.52
36.3
266
.680
(8)
La
tin
Am
eric
a an
d Ca
ribb
ean
8.90
26.8
025
.56
4.30
23.3
217
.78
62.0
530
.060
(9)
East
ern
and
sout
hern
Afric
a14
.13
51.4
038
.95
11.8
031
.08
29.4
733
.85
67.8
83 (
13)
Wes
tern
and
cen
tral
Afric
a3.
926.
029.
405.
1536
.33
12.1
673
.15
36.2
90 (
11)
Mid
dle
East
and
nor
ther
n Afric
a8.
6817
.40
0.32
17.4
024
.73
13.7
121
.32
57.6
85 (
6)To
tal
44.9
416
1.82
134.
9367
.05
153.
5011
2.45
289.
4238
.180
(52
)So
urce
s:M
I et
al.
(199
8), UNIC
EF C
open
hage
n Su
pply
Div
isio
n (d
ata
for
1998
), U
NIC
EF fie
ld s
urve
y of
cou
ntry
offi
ces
unde
rtak
en in
1998
.*N
umbe
rs o
f vi
tam
in A
caps
ules
pro
cure
d fo
r 19
93–1
996
do n
ot inc
lude
dat
a fo
r Gam
bia
or S
waz
iland
. To
tal nu
mbe
r of
vitam
in A
caps
ules
pro
cure
d fo
r 19
98 is
the
sum
of 10
0 00
0-IU
cap
sule
s an
d 20
000
0-IU
cap
sule
s fo
r ea
ch r
egio
n (s
um o
f co
lum
ns A
and
D in
Appe
ndix
9). T
otal
num
bers
of ca
psul
es p
rocu
red
in e
ach
year
do
not
incl
ude
caps
ules
pur
chas
ed w
ith
nation
al fun
ds (
eith
er g
over
nmen
t or
nong
over
nmen
tal or
gani
zation
s) o
r ob
tain
ed t
hrou
gh loc
al p
rodu
ctio
n. F
or c
alcu
lation
of an
nual
ave
rage
pro
cure
men
t (for
199
3–19
96 a
nd 1
998)
, ab
senc
e of
pro
cure
men
t da
ta w
as c
ount
ed a
s ze
ro r
athe
rth
an a
s m
issi
ng d
ata.
The
ann
ual av
erag
e pr
ocur
emen
t fo
r a
regi
on d
oes
not
nece
ssar
ily r
epre
sent
pro
cure
men
t da
ta for
the
sam
e co
untrie
s ov
er t
he 5
-yea
r pe
riod
.†F
or c
hild
ren
12–5
9 m
onth
s of
age
. Bas
ed o
n 20
0 00
0-IU
cap
sule
s, for
cou
ntries
with
repo
rted
cap
sule
pro
cure
men
t fo
r 19
98 (
Appe
ndix
9, co
lum
n E)
and
usi
ng c
ount
ry p
opul
atio
n da
ta for
tho
seco
untrie
s.‡F
or c
hild
ren
12–5
9 m
onth
s of
age
in
coun
trie
s re
ceiv
ing
UNIC
EF c
apsu
les.
Est
imat
ed a
dequ
acy
of c
apsu
le s
uppl
y is
bas
ed o
n po
licy
reco
mm
endi
ng p
rovi
sion
of on
e 20
0 00
0-IU
cap
sule
to
post
partum
wom
en a
nd t
wo
200
000-
IU c
apsu
les
annu
ally
to
child
ren
12–5
9 m
onth
s of
age
. Th
e ca
lcul
atio
n as
sum
es e
qual
dis
trib
utio
n of
200
000
-IU c
apsu
les
betw
een
thes
e tw
o po
pula
tion
gro
ups.
Som
eco
untrie
s ha
ve g
reat
er t
han
100%
pot
ential
cov
erag
e of
chi
ldre
n fo
r 19
98 (
see
Appe
ndix
9). P
oten
tial
vitam
in A
cove
rage
of So
uth
Asi
an c
hild
ren
is low
in
part b
ecau
se p
rocu
rem
ent
data
for
Ind
ia w
ere
not
avai
labl
e.§Fo
rch
ildre
n 6–
59 m
onth
s of
age
who
rec
eive
d at
lea
st o
ne s
uppl
emen
t in
the
pre
viou
s 6
mon
ths,
as
repo
rted
for
199
8 .
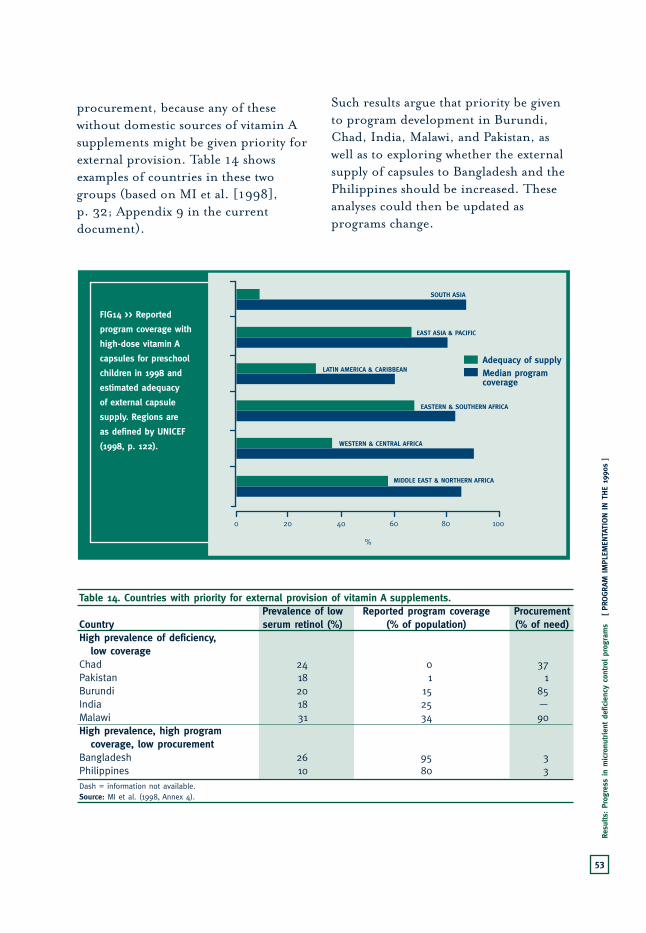
53
Resu
lts:
Prog
ress
in
mic
ronu
trie
nt d
efic
ienc
y co
ntro
l pr
ogra
ms
[ PR
OGRA
M IM
PLEM
ENTA
TION IN T
HE
1990
s ]
procurement, because any of thesewithout domestic sources of vitamin Asupplements might be given priority forexternal provision. Table 14 showsexamples of countries in these twogroups (based on MI et al. [1998], p. 32; Appendix 9 in the currentdocument).
Such results argue that priority be givento program development in Burundi,Chad, India, Malawi, and Pakistan, aswell as to exploring whether the externalsupply of capsules to Bangladesh and thePhilippines should be increased. Theseanalyses could then be updated asprograms change.
FIG14 >> Reported
program coverage with
high-dose vitamin A
capsules for preschool
children in 1998 and
estimated adequacy
of external capsule
supply. Regions are
as defined by UNICEF
(1998, p. 122).
0 20 10040 60 80
SOUTH ASIA
EAST ASIA & PACIFIC
WESTERN & CENTRAL AFRICA
MIDDLE EAST & NORTHERN AFRICA
EASTERN & SOUTHERN AFRICA
LATIN AMERICA & CARIBBEANAdequacy of supplyMedian programcoverage
%
Table 14. Countries with priority for external provision of vitamin A supplements.Prevalence of low Reported program coverage Procurement
Country serum retinol (%) (% of population) (% of need)High prevalence of deficiency,
low coverageChad 24 0 37Pakistan 18 1 1Burundi 20 15 85India 18 25 —Malawi 31 34 90High prevalence, high program
coverage, low procurementBangladesh 26 95 3Philippines 10 80 3Dash = information not available.Source: MI et al. (1998, Annex 4).
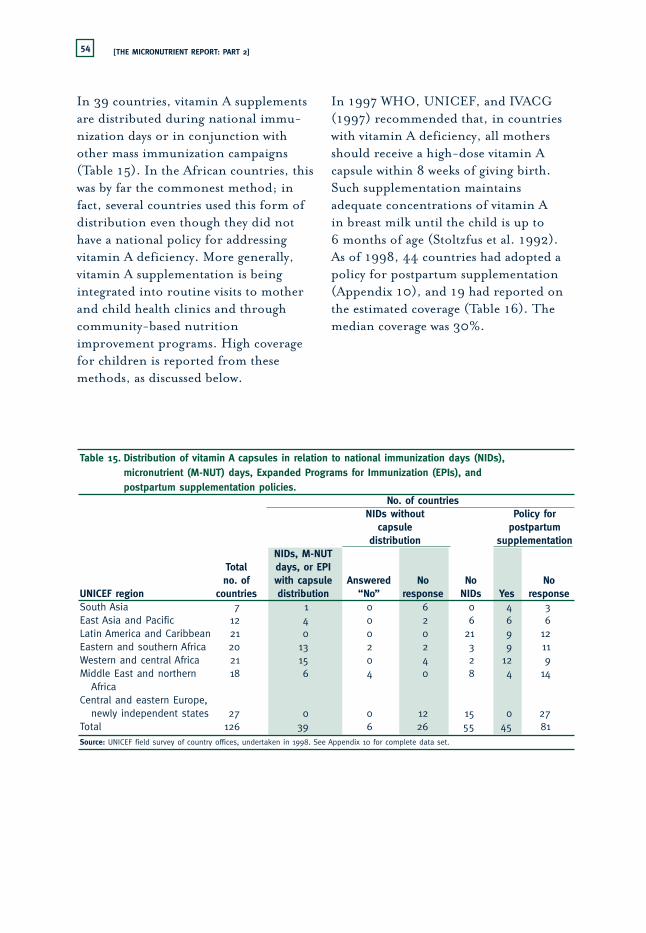
[THE MICRONUTRIENT REPORT: PART 2]54
In 39 countries, vitamin A supplementsare distributed during national immu-nization days or in conjunction withother mass immunization campaigns(Table 15). In the African countries, thiswas by far the commonest method; infact, several countries used this form ofdistribution even though they did nothave a national policy for addressingvitamin A deficiency. More generally,vitamin A supplementation is beingintegrated into routine visits to motherand child health clinics and throughcommunity-based nutritionimprovement programs. High coveragefor children is reported from thesemethods, as discussed below.
In 1997 WHO, UNICEF, and IVACG(1997) recommended that, in countrieswith vitamin A deficiency, all mothersshould receive a high-dose vitamin Acapsule within 8 weeks of giving birth.Such supplementation maintainsadequate concentrations of vitamin A in breast milk until the child is up to 6 months of age (Stoltzfus et al. 1992).As of 1998, 44 countries had adopted apolicy for postpartum supplementation(Appendix 10), and 19 had reported onthe estimated coverage (Table 16). Themedian coverage was 30%.
Table 15. Distribution of vitamin A capsules in relation to national immunization days (NIDs), micronutrient (M-NUT) days, Expanded Programs for Immunization (EPIs), and postpartum supplementation policies.
No. of countriesNIDs without Policy for
capsule postpartumdistribution supplementation
NIDs, M-NUT Total days, or EPI no. of with capsule Answered No No No
UNICEF region countries distribution “No” response NIDs Yes responseSouth Asia 7 1 0 6 0 4 3East Asia and Pacific 12 4 0 2 6 6 6Latin America and Caribbean 21 0 0 0 21 9 12 Eastern and southern Africa 20 13 2 2 3 9 11Western and central Africa 21 15 0 4 2 12 9Middle East and northern 18 6 4 0 8 4 14
AfricaCentral and eastern Europe,
newly independent states 27 0 0 12 15 0 27Total 126 39 6 26 55 45 81Source: UNICEF field survey of country offices, undertaken in 1998. See Appendix 10 for complete data set.

55
Resu
lts:
Prog
ress
in
mic
ronu
trie
nt d
efic
ienc
y co
ntro
l pr
ogra
ms
[ PR
OGRA
M IM
PLEM
ENTA
TION IN T
HE
1990
s ]
FIG15 >> Prevalence of subclinical vitamin A deficiency, as defined by serum retinol <70 µmol/L (A), and reported
coverage of vitamin A supplementation programs in 1998 (B). Values in parentheses in the legend represent the
total number of countries. Regions are as defined by UNICEF (1998, p. 122).
≥20 (22)
15 to <20 (15)
10 to <15 (17)
0 to <10 (35)
DEVELOPING COUNTRIESPREVALENCE OFLOW SERUM RETINOL (%)
15A
≥75 (29)
25 to <75 (11)
0 to <25 (6)
DEVELOPING COUNTRIESREPORTED VITAMIN APROGRAM COVERAGE (%)
15B

[THE MICRONUTRIENT REPORT: PART 2]56
Fewer than half of the 49 countries with a national policy for addressingvitamin A deficiency (for 1996–1998)also had legislation governing vitamin Afortification of foods (Table 12 andAppendix 8). In fact, in Latin Americaand the Caribbean, vitamin A supple-mentation is not a common approach,and more reliance is placed onfortification. The commodities mostoften fortified in developing countriesare shown in Table 17: sugar andmargarine are the most common, withmaize flour, vegetable oil, rice, and dairyproducts also being used. Research andpilot projects are under way in a numberof additional countries.
Control of Iodine DeficiencyDisorders
Three-quarters of the countries in thedeveloping world now have legislation in place for iodizing salt (Table 12,Appendix 8). Most of the countries haveadopted this legislation in the past10–15 years. Thanks to the fact that
large-scale surveys — such as multipleindicator cluster surveys anddemographic and health surveys — now include direct estimates of theiodization level of salt in sampledhouseholds, the extent to whichhouseholds are consuming adequatelyiodized salt can be directly assessed.National results are presented inAppendix 11, and regional averages are given in Table 18. Two-thirds ofhouseholds (68%) are now estimated to be getting adequately iodized salt(defined in most cases as at least 15 ppmof iodine). This estimate refers to theaverage for the countries reporting data,which accounts for almost all countriesexcept those in Central and EasternEurope and newly independent states, asindicated in the last column of Table 18.
Nearly 90% of households in LatinAmerica and the Caribbean areconsuming adequately iodized salt; therange is about 65% to about 75% forcountries in the Asian regions, about50% to about 74% in sub-Saharan
Table 16. Percentage of mothers receiving high-dose vitamin A capsules* within 4–8 weeks after deliveryin countries reporting presence of a program.
% of mothers % of mothersCountry receiving capsule Country receiving capsule
Nigeria 90 Burkino Faso 30Bhutan 80 Philippines 30Iraq 64 Bolivia 26Honduras 53 Ethiopia 15Viet Nam 53 Madagascar 13El Salvador 40 Guatemala 10Indonesia 40 India 10Malawi 39 Somalia 10Panama 37 Zambia 10
Haiti 5Source: UNICEF field survey of country offices, undertaken in 1998. *Usually 300 000 IU.

57
Resu
lts:
Prog
ress
in
mic
ronu
trie
nt d
efic
ienc
y co
ntro
l pr
ogra
ms
[ PR
OGRA
M IM
PLEM
ENTA
TION IN T
HE
1990
s ]
Table 17. Commodities being used for fortification with vitamin A in operational country programsDeveloping countries with fortification programs in place*
No. of developing countries exploring
Commodity fortification Primary program Secondary programSugar 20 El Salvador, Guatemala, Chile, Viet Nam† (n = 2)
Honduras, Nicaragua, Zambia (n = 5)Margarine 14 Malaysia, Peru, the Philippines, Ecuador, El Salvador,
Sri Lanka, Brazil (n = 5)‡ Guatemala, Honduras, India, Mexico, Panama, Singapore, Zimbabwe (n = 9)
Maize flour 5 Colombia, Zimbabwe (n = 2) Venezuela (n = 1)Rice 3 Burkino Faso, Lesotho,
Singapore§ (n = 3) NoneOil 6 Bolivia, China, Tanzania (n = 3) NoneMilk, dairy products 5 India (on regional basis),
Thailand (condensed milk) (n = 2) China (n = 1)Dried mango 2 Haiti, Senegal (n = 2)Noodles 2 None Indonesia, Thailand
(n = 2)Wheat flour 3 None|| None*In data compiled for MN-Net (MI 1999), fortified commodities are defined as “primary” and “secondary.” These terms refer to the scale of
implementation, secondary methods often being at the experimental stage.†Viet Nam is exploring the feasibility of a program.‡Margarine is also fortified with vitamin A in European and North American countries.§Rice is also fortified with vitamin A in Hungary and Japan.|| Indonesia and Namibia report plans to do so.
Table 18. Households consuming adequately iodized salt,* 1995–1998.
No. of countries Households consuming No. of countriesin region iodized salt (average %)† reporting
UNICEF region Col. A Col. B Col. CSouth Asia 7 65.1 6East Asia and Pacific 12 75.3 9Latin America and the Caribbean 21 88.6 19Eastern and southern Africa 20 51.6 19Western and central Africa 21 73.6 16Middle East and northern Africa 18 48.9 12Central and eastern Europe and 27 28.2 10
newly independent statesTotal 126 67.8 91Sources: UNICEF (2000).*Adequate iodization defined as ≥15 ppm iodine.†Average calculated on the basis of the reporting countries only. Regional average is weighted according to 1996 population data forcountries reporting household consumption data. Data points for all reporting countries are for years within the period 1995–1998, with theexception of the following 23 countries: Argentina, Costa Rica, Cuba, Ecuador, Eritrea, Ghana, Guatemala, India, Korea DPR, Mauritania, SouthAfrica, Venezuela, and Zimbabwe (date not available); Haiti (data for 1989); Russian Federation (data for 1992); Burundi, Gambia, and Libya(data for 1993); Botswana, Macedonia, Tajikistan, Uzbekistan, and Yugoslavia (data for 1994).

[THE MICRONUTRIENT REPORT: PART 2]58
Africa; and about 50% in the MiddleEast and northern Africa. The lowestcoverage with adequately iodized saltoccurs in the former Soviet bloc (data on iodized salt are more available thandata on program coverage for iron andvitamin A and are therefore includedhere for this group of countries [Fig. 16]). Even though the average for most regions is high (Table 18),Appendix 11 shows that a number of countries still lag, for example,Cambodia and Pakistan in Asia, severalcountries in western and central Africa,and a few in the Middle East andnorthern Africa.
The key issue now is to improve thequality control for the iodine content ofsalt, which is one of major reasons that
access to iodized salt is not higher. Theother main reason is that distributionand marketing of iodized salt has not yet reached the more remote areas, aparticular problem in countries wherethere are large numbers of small,traditional producers.
Household coverage with adequatelyiodized salt is compared with theprevalence of goitre in Fig. 17.Countries that should have priority for assistance might be those withsignificant prevalence of goitre (e.g., more than 10%) and lowhousehold coverage with adequatelyiodized salt (e.g., less than 30%), forexample, Ethiopia, Mauritania, Ghana,Philippines, and Burkina Faso.
FIG16 >> Households
receiving adequately
iodized salt, defined as
salt with at least 15 ppm
iodine, for the period
1995–1998. The data are
presented in Table 14.
Regions are as defined
by UNICEF (1998,
p. 122).
0 20 10040 60 80
SOUTH ASIA
EAST ASIA & PACIFIC
WESTERN & CENTRAL AFRICA
MIDDLE EAST & NORTHERN AFRICA
CENTRAL & EASTERN EUROPE, NEWLY INDEPENDENT STATES
EASTERN & SOUTHERN AFRICA
LATIN AMERICA & CARIBBEAN
% OF HOUSEHOLDS
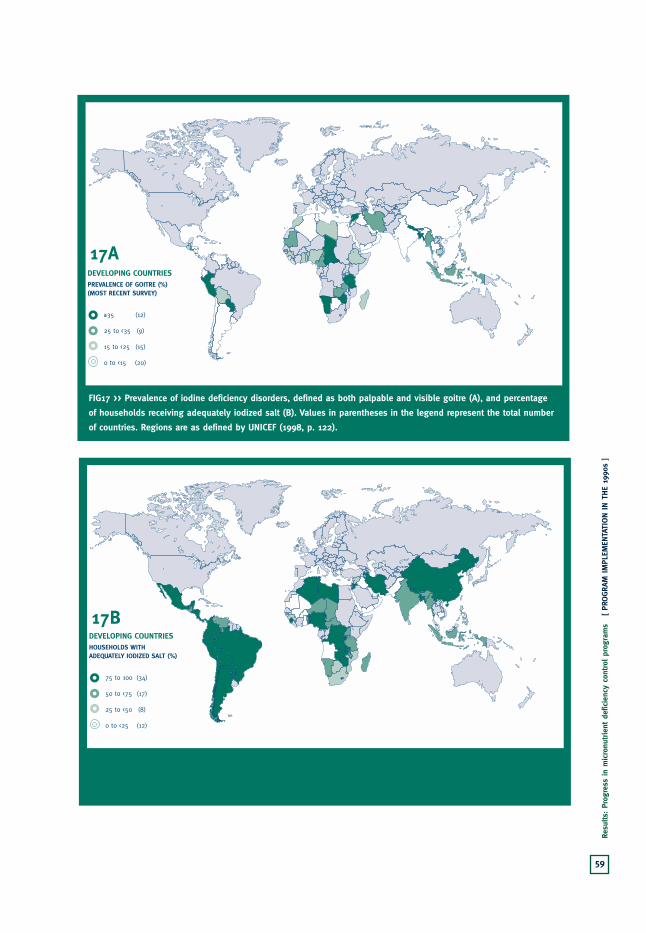
59
Resu
lts:
Prog
ress
in
mic
ronu
trie
nt d
efic
ienc
y co
ntro
l pr
ogra
ms
[ PR
OGRA
M IM
PLEM
ENTA
TION IN T
HE
1990
s ]
FIG17 >> Prevalence of iodine deficiency disorders, defined as both palpable and visible goitre (A), and percentage
of households receiving adequately iodized salt (B). Values in parentheses in the legend represent the total number
of countries. Regions are as defined by UNICEF (1998, p. 122).
≥35 (12)
25 to <35 (9)
15 to <25 (15)
0 to <15 (20)
DEVELOPING COUNTRIESPREVALENCE OF GOITRE (%)(MOST RECENT SURVEY)
17A
75 to 100 (34)
50 to <75 (17)
25 to <50 (8)
0 to <25 (12)
DEVELOPING COUNTRIESHOUSEHOLDS WITHADEQUATELY IODIZED SALT (%)
17B

[THE MICRONUTRIENT REPORT: PART 2]60
Control of Iron Deficiency About half of the countries in thedeveloping world reported adoption of anational policy for iron supplementation(Table 12, column E). The number issimilar, and the countries are often thesame, as for policies for controllingvitamin A deficiency. Only in LatinAmerica and the Caribbean isfortification of foods with iron thepriority. Only one country in anotherregion has legislation for ironfortification (Table 12, column F).
Pregnant women are the most commontarget group for iron supplementationprograms, and it is mainly for this group that data on program coverage are available. Program coverage for the39 countries reporting such data varieswidely (Appendix 12 and Table 16);some countries reported up to 100%(e.g., Cuba and Nicaragua), whereasothers, such as Tunisia, reported only10% coverage. The regional range was52% to 78%, and the regional medianwas 55%. These coverage values aresomewhat difficult to interpret, becausethey refer to the percentage of womenregistered in supplementation pro-grams but do not include estimates ofadherence to the supplementationregimen throughout pregnancy.
For this deficiency, the procurementdata from UNICEF are less informative,because a much higher proportion of the supplement is obtained locally.Nonetheless, the results in Table 19indicate that the supply of iron tabletsfrom external sources is very low relative
to the need. To give a sense of scale, weestimated the need in terms of coveringan entire pregnancy with daily supple-mentation, hence relating the tabletsupply to the annual number of births.This calculation indicated that onlyabout 3% of the need for pregnantwomen is being met by external supplies.Even if the calculation were based onweekly supplementation, the externalsupply would still be less than 20% ofthe needs of pregnant women.
The reported program coverage andexternal supply data are shown in Fig. 18. No doubt most of the irontablet supply used in these countries is obtained from domestic sources.Nonetheless, because supply problemshave been considered a major constraint(Gillespie et al. 1991) improving thelevel of external provision could be astep toward improving the effectivenessof programs.
The average estimated levels of anemia(in pregnant women) and the reportedcoverage by iron supplementationprograms (for countries that provideddata) are mapped in Fig. 19. The moststriking observation is that not manycountries reported supplementationprograms, and for those that did, therewas little relation to need. Althoughprogram coverage needs to be expanded,there is a sense that this may be waitingfor better methods to be identified anddemonstrated.
Tackling iron deficiency throughsupplementation is much moredemanding than using supplementation

61
Resu
lts:
Prog
ress
in
mic
ronu
trie
nt d
efic
ienc
y co
ntro
l pr
ogra
ms
[ PR
OGRA
M IM
PLEM
ENTA
TION IN T
HE
1990
s ]
Tabl
e 19
. Re
gion
al p
rocu
rem
ent
of iro
n su
pple
men
ts in
rela
tion
to n
eed.
No.
of iron
tab
lets
pro
cure
d (m
illio
ns)
*Rep
orte
d pr
ogra
m c
over
age§
Annu
al
No.
of bi
rths
† Ad
equa
cy o
f M
edia
n Ra
nge
No.
of co
untrie
s19
9319
9419
9519
96av
erag
e(m
illio
ns)
supp
ly‡
(%)
(%)
(%)
repo
rtin
gUNIC
EF r
egio
nCo
l. A
Col.
BCo
l. C
Col.
DCo
l. E
Col.
FCo
l. G
Col.
HCo
l. I
Col.
J
Sout
h Asi
a10
6.03
85.2
913
4.40
132.
8011
4.63
10.7
44.
156
51–6
12
East
Asi
a an
d Pa
cific
76.9
630
6.00
105.
8582
.13
142.
745.
774.
750
30–8
27
Latin
Am
eric
a an
d Ca
ribb
ean
20.9
170
.59
63.7
535
.18
47.6
14.
852.
466
20–1
0010
East
ern
and
sout
hern
Afric
a22
9.38
139.
9514
2.72
75.4
214
6.87
8.09
3.1
7820
–90
6W
este
rn a
nd c
entral
Afric
a81
.32
32.5
548
.71
85.8
662
.11
11.3
22.
552
25–9
510
Mid
dle
East
and
nor
ther
n Afric
a20
4.16
33.6
729
5.50
45.3
314
4.67
3.70
4.1
6025
–95
4To
tal
718.
7666
8.05
790.
9345
6.72
658.
6344
.47
3.4
5520
–100
39So
urce
s: U
NIC
EF (
1998
), U
NIC
EF C
open
hage
n Su
pply
Div
isio
n (d
ata
for
1993
–199
6), UNIC
EF fie
ld s
urve
y of
cou
ntry
offi
ces
unde
rtak
en in
1997
.Not
e: E
stim
ated
tot
al s
pent
for
iro
n ta
blet
s in
199
6 w
as U
S$1.
075
mill
ion
for
456.
72 m
illio
n ta
bles
(US$
0.00
24 p
er t
able
t).
*Tot
al n
umbe
r of
iro
n ta
blet
s pr
ocur
ed r
epre
sent
s th
e su
m o
f al
l iro
n fo
late
and
fer
rous
sul
fate
tab
lets
pro
cure
d in
eac
h ye
ar, bu
t do
es n
ot n
eces
sarily
rep
rese
nt d
ata
for
the
sam
e co
untrie
s fo
r ea
ch y
ear.
Aver
age
is for
199
3–19
96.
†Birth
s in
199
6 fo
r on
ly t
hose
cou
ntries
rep
orting
iro
n pr
ocur
emen
t in
tha
t ye
ar.
‡For
199
6, in
rela
tion
to
need
for
300
iro
n ta
bles
for
eac
h 40
-wee
k te
rm p
regn
ancy
.§Dat
aon
rep
orte
d pr
ogra
m c
over
age
is for
199
6 fo
r al
l co
untrie
s ex
cept
Bhu
tan,
Gui
nea,
and
Vie
tnam
(fo
r w
hich
dat
e w
as n
ot a
vaila
ble)
.
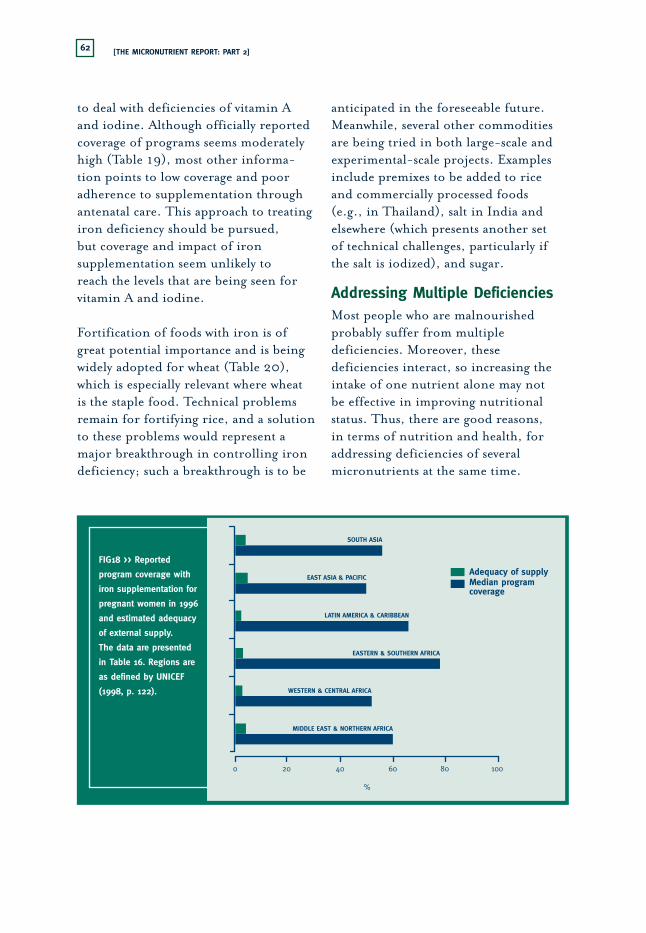
[THE MICRONUTRIENT REPORT: PART 2]62
FIG18 >> Reported
program coverage with
iron supplementation for
pregnant women in 1996
and estimated adequacy
of external supply.
The data are presented
in Table 16. Regions are
as defined by UNICEF
(1998, p. 122).
0 20 10040 60 80
SOUTH ASIA
EAST ASIA & PACIFIC
WESTERN & CENTRAL AFRICA
MIDDLE EAST & NORTHERN AFRICA
EASTERN & SOUTHERN AFRICA
LATIN AMERICA & CARIBBEAN
Adequacy of supplyMedian programcoverage
%
to deal with deficiencies of vitamin Aand iodine. Although officially reportedcoverage of programs seems moderatelyhigh (Table 19), most other informa-tion points to low coverage and pooradherence to supplementation throughantenatal care. This approach to treatingiron deficiency should be pursued, but coverage and impact of ironsupplementation seem unlikely to reach the levels that are being seen forvitamin A and iodine.
Fortification of foods with iron is ofgreat potential importance and is beingwidely adopted for wheat (Table 20),which is especially relevant where wheat is the staple food. Technical problemsremain for fortifying rice, and a solutionto these problems would represent amajor breakthrough in controlling irondeficiency; such a breakthrough is to be
anticipated in the foreseeable future.Meanwhile, several other commoditiesare being tried in both large-scale andexperimental-scale projects. Examplesinclude premixes to be added to rice and commercially processed foods (e.g., in Thailand), salt in India andelsewhere (which presents another set of technical challenges, particularly if the salt is iodized), and sugar.
Addressing Multiple DeficienciesMost people who are malnourishedprobably suffer from multipledeficiencies. Moreover, thesedeficiencies interact, so increasing theintake of one nutrient alone may not be effective in improving nutritionalstatus. Thus, there are good reasons, in terms of nutrition and health, foraddressing deficiencies of severalmicronutrients at the same time.
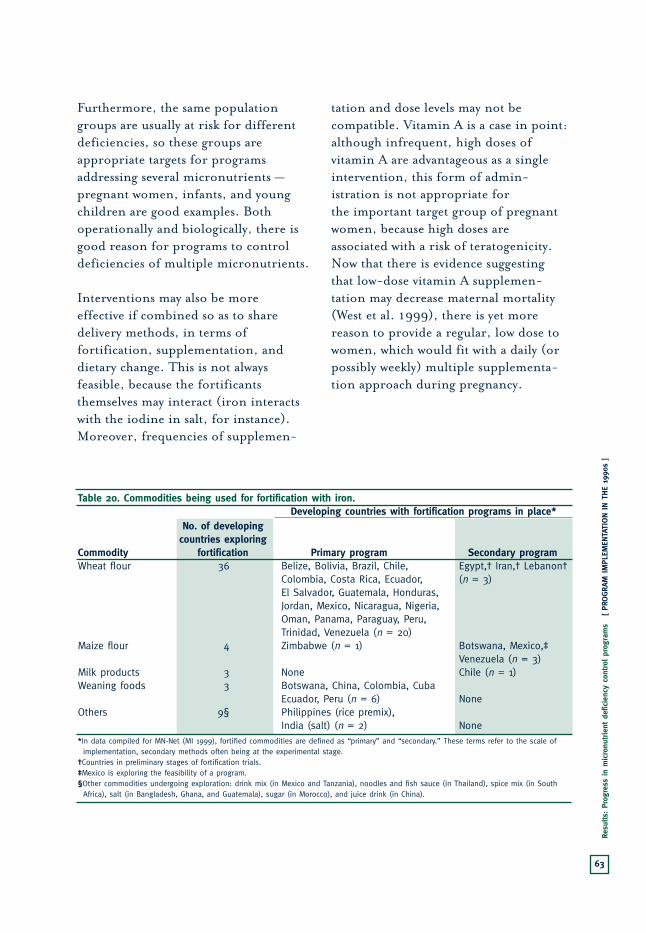
63
Resu
lts:
Prog
ress
in
mic
ronu
trie
nt d
efic
ienc
y co
ntro
l pr
ogra
ms
[ PR
OGRA
M IM
PLEM
ENTA
TION IN T
HE
1990
s ]
Table 20. Commodities being used for fortification with iron.Developing countries with fortification programs in place*
No. of developing countries exploring
Commodity fortification Primary program Secondary programWheat flour 36 Belize, Bolivia, Brazil, Chile, Egypt,† Iran,† Lebanon†
Colombia, Costa Rica, Ecuador, (n = 3)El Salvador, Guatemala, Honduras, Jordan, Mexico, Nicaragua, Nigeria, Oman, Panama, Paraguay, Peru, Trinidad, Venezuela (n = 20)
Maize flour 4 Zimbabwe (n = 1) Botswana, Mexico,‡ Venezuela (n = 3)
Milk products 3 None Chile (n = 1)Weaning foods 3 Botswana, China, Colombia, Cuba
Ecuador, Peru (n = 6) NoneOthers 9§ Philippines (rice premix),
India (salt) (n = 2) None*In data compiled for MN-Net (MI 1999), fortified commodities are defined as “primary” and “secondary.” These terms refer to the scale of
implementation, secondary methods often being at the experimental stage.†Countries in preliminary stages of fortification trials.‡Mexico is exploring the feasibility of a program.§Other commodities undergoing exploration: drink mix (in Mexico and Tanzania), noodles and fish sauce (in Thailand), spice mix (in South
Africa), salt (in Bangladesh, Ghana, and Guatemala), sugar (in Morocco), and juice drink (in China).
Furthermore, the same populationgroups are usually at risk for differentdeficiencies, so these groups areappropriate targets for programsaddressing several micronutrients —pregnant women, infants, and youngchildren are good examples. Bothoperationally and biologically, there isgood reason for programs to controldeficiencies of multiple micronutrients.
Interventions may also be more effective if combined so as to sharedelivery methods, in terms offortification, supplementation, anddietary change. This is not alwaysfeasible, because the fortificantsthemselves may interact (iron interactswith the iodine in salt, for instance).Moreover, frequencies of supplemen-
tation and dose levels may not becompatible. Vitamin A is a case in point:although infrequent, high doses ofvitamin A are advantageous as a singleintervention, this form of admin-istration is not appropriate for the important target group of pregnantwomen, because high doses areassociated with a risk of teratogenicity.Now that there is evidence suggestingthat low-dose vitamin A supplemen-tation may decrease maternal mortality(West et al. 1999), there is yet morereason to provide a regular, low dose towomen, which would fit with a daily (orpossibly weekly) multiple supplementa-tion approach during pregnancy.

[THE MICRONUTRIENT REPORT: PART 2]64
FIG19 >> Prevalence of anemia among pregnant women, defined as hemoglobin level <110 g/L (regional mean
values) (A), and reported coverage of iron supplementation programs in 1997 (B). Regions are as defined by UNICEF
(1998, p. 122).
≥50 (16)
25 to <50 (54)
0 to <35 (27)
DEVELOPING COUNTRIESANEMIA IN PREGNANT WOMEN (%)
19A
≥80 (10)
60 to <80 (7)
40 to <60 (12)
0 to <40 (5)
DEVELOPING COUNTRIESREPORTED COVERAGE OF IRON SUPPLEMENTATION (%)
19B
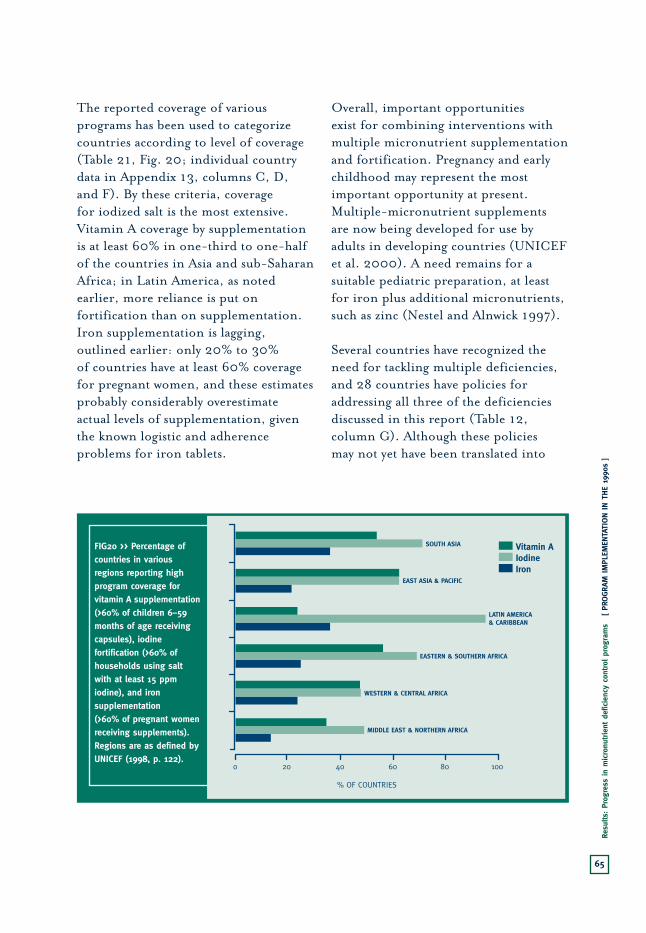
65
Resu
lts:
Prog
ress
in
mic
ronu
trie
nt d
efic
ienc
y co
ntro
l pr
ogra
ms
[ PR
OGRA
M IM
PLEM
ENTA
TION IN T
HE
1990
s ]
The reported coverage of variousprograms has been used to categorizecountries according to level of coverage(Table 21, Fig. 20; individual countrydata in Appendix 13, columns C, D, and F). By these criteria, coverage for iodized salt is the most extensive.Vitamin A coverage by supplementationis at least 60% in one-third to one-halfof the countries in Asia and sub-SaharanAfrica; in Latin America, as notedearlier, more reliance is put onfortification than on supplementation.Iron supplementation is lagging,outlined earlier: only 20% to 30% of countries have at least 60% coveragefor pregnant women, and these estimatesprobably considerably overestimateactual levels of supplementation, giventhe known logistic and adherenceproblems for iron tablets.
Overall, important opportunities exist for combining interventions withmultiple micronutrient supplementationand fortification. Pregnancy and earlychildhood may represent the mostimportant opportunity at present.Multiple-micronutrient supplements are now being developed for use byadults in developing countries (UNICEFet al. 2000). A need remains for asuitable pediatric preparation, at leastfor iron plus additional micronutrients,such as zinc (Nestel and Alnwick 1997).
Several countries have recognized theneed for tackling multiple deficiencies,and 28 countries have policies foraddressing all three of the deficienciesdiscussed in this report (Table 12,column G). Although these policies may not yet have been translated into
FIG20 >> Percentage of countries in various regions reporting high program coverage for vitamin A supplementation (>60% of children 6–59 months of age receiving capsules), iodine fortification (>60% of households using salt with at least 15 ppm iodine), and iron supplementation (>60% of pregnant women receiving supplements). Regions are as defined by UNICEF (1998, p. 122).
0 20 10040 60 80
SOUTH ASIA
EAST ASIA & PACIFIC
WESTERN & CENTRAL AFRICA
MIDDLE EAST & NORTHERN AFRICA
EASTERN & SOUTHERN AFRICA
LATIN AMERICA& CARIBBEAN
% OF COUNTRIES
Vitamin AIodineIron
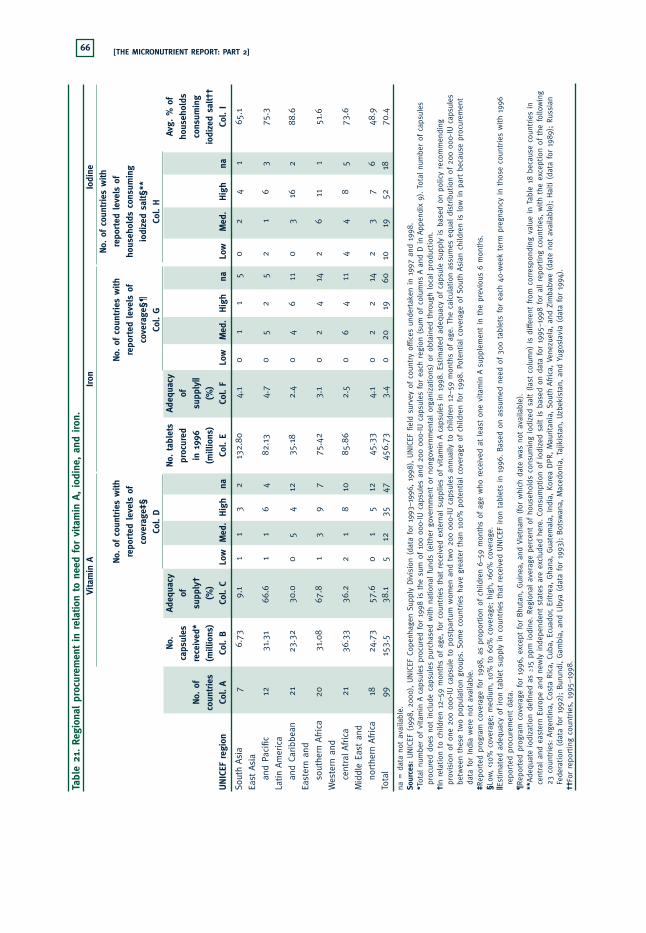
[THE MICRONUTRIENT REPORT: PART 2]66
Tabl
e 21
. Re
gion
al p
rocu
rem
ent
in r
elat
ion
to n
eed
for
vita
min
A, io
dine
, an
d iron
.Vi
tam
in A
Iron
Iodi
neNo.
of co
untrie
s w
ith
No.
of co
untrie
s w
ith
No.
of co
untrie
s w
ithre
ported
lev
els
of
repo
rted
lev
els
of
repo
rted
lev
els
ofho
useh
olds
con
sum
ing
cove
rage
‡§co
vera
ge§¶
iodi
zed
salt§
**Co
l. D
Col.
GCo
l. H
No.
Ad
equa
cyNo.
tab
lets
Ad
equa
cyAv
g. %
of
caps
ules
of
pr
ocur
ed
ofho
useh
olds
No.
of
rece
ived
*su
pply
†in
199
6 su
pply
|| co
nsum
ing
coun
trie
s(m
illio
ns)
(%)
(mill
ions
)(%
)io
dize
d sa
lt††
UNIC
EF r
egio
nCo
l. A
Col.
BCo
l. C
Low
Med
.Hig
hna
Col.
ECo
l. F
Low
Med
.Hig
hna
Low
Med
.Hig
hna
Col.
I
Sout
h Asi
a7
6.73
9.1
11
32
132.
804.
10
11
50
24
165
.1
East
Asi
a
and
Paci
fic12
31.3
166
.61
16
482
.13
4.7
05
25
21
63
75.3
Latin
Am
eric
a
and
Caribb
ean
2123
.32
30.0
05
412
35.1
82.
40
46
110
316
288
.6
East
ern
and
sout
hern
Afric
a20
31.0
867
.81
39
775
.42
3.1
02
414
26
111
51.6
Wes
tern
and
cent
ral A
fric
a21
36.3
336
.22
18
1085
.86
2.5
06
411
44
85
73.6
Mid
dle
East
and
northe
rn A
fric
a18
24.7
357
.60
15
1245
.33
4.1
02
214
23
76
48.9
Tota
l99
153.
538
.15
1235
4745
6.73
3.4
020
1960
1019
5218
70.4
na =
dat
a no
t av
aila
ble.
Sour
ces:
UNIC
EF (
1998
, 20
00), U
NIC
EF C
open
hage
n Su
pply
Div
isio
n (d
ata
for
1993
–199
6, 1
998)
, UNIC
EF fie
ld s
urve
y of
cou
ntry
offi
ces
unde
rtak
en in
1997
and
199
8.*T
otal
num
ber
of v
itam
in A
caps
ules
pro
cure
d fo
r 19
98 is
the
sum
of 10
0 00
0-IU
cap
sule
s an
d 20
0 00
0-IU
cap
sule
s fo
r ea
ch r
egio
n (s
um o
f co
lum
ns A
and
D in
Appe
ndix
9). T
otal
num
ber
of c
apsu
les
proc
ured
doe
s no
t in
clud
e ca
psul
es p
urch
ased
with
nation
al fun
ds (
eith
er g
over
nmen
t or
non
gove
rnm
enta
l or
gani
zation
s) o
r ob
tain
ed t
hrou
gh loc
al p
rodu
ctio
n.
†In
rela
tion
to
child
ren
12–5
9 m
onth
s of
age
, fo
r co
untrie
s th
at r
ecei
ved
exte
rnal
sup
plie
s of
vitam
in A
caps
ules
in
1998
. Es
tim
ated
ade
quac
y of
cap
sule
sup
ply
is b
ased
on
polic
y re
com
men
ding
prov
isio
n of
one
200
000
-IU c
apsu
le t
o po
stpa
rtum
wom
en a
nd t
wo
200
000-
IU c
apsu
les
annu
ally
to
child
ren
12–5
9 m
onth
s of
age
. Th
e ca
lcul
atio
n as
sum
es e
qual
dis
trib
utio
n of
200
000
-IU c
apsu
les
betw
een
thes
e tw
o po
pula
tion
gro
ups.
Som
e co
untrie
s ha
ve g
reat
er t
han
100%
pot
ential
cov
erag
e of
chi
ldre
n fo
r 19
98. Po
tent
ial co
vera
ge o
f So
uth
Asi
an c
hild
ren
is low
in
part b
ecau
se p
rocu
rem
ent
data
for
Ind
ia w
ere
not
avai
labl
e.‡R
epor
ted
prog
ram
cov
erag
e fo
r 19
98, as
pro
portio
n of
chi
ldre
n 6–
59 m
onth
s of
age
who
rec
eive
d at
lea
st o
ne v
itam
in A
supp
lem
ent
in t
he p
revi
ous
6 m
onth
s.§Lo
w,<1
0% c
over
age;
med
ium
, 10
% t
o 60
% c
over
age;
hig
h, >
60%
cov
erag
e.||E
stim
ated
ade
quac
y of
iro
n ta
blet
sup
ply
in c
ount
ries
tha
t re
ceiv
ed U
NIC
EF iro
n ta
blet
s in
199
6. B
ased
on
assu
med
nee
d of
300
tab
lets
for
eac
h 40
-wee
k te
rm p
regn
ancy
in
thos
e co
untrie
s w
ith
1996
repo
rted
pro
cure
men
t da
ta.
¶Re
ported
pro
gram
cov
erag
e fo
r 19
96, ex
cept
for
Bhu
tan,
Gui
nea,
and
Vie
tnam
(fo
r w
hich
dat
e w
as n
ot a
vaila
ble)
.**
Adeq
uate
iod
izat
ion
defin
ed a
s ≥1
5 pp
m iod
ine.
Reg
iona
l av
erag
e pe
rcen
t of
hou
seho
lds
cons
umin
g io
dize
d sa
lt (
last
col
umn)
is
diffe
rent
fro
m c
orre
spon
ding
val
ue in
Tabl
e 18
bec
ause
cou
ntries
in
cent
ral an
d ea
ster
n Eu
rope
and
new
ly ind
epen
dent
sta
tes
are
excl
uded
her
e. C
onsu
mpt
ion
of iod
ized
sal
t is
bas
ed o
n da
ta for
199
5–19
98 for
all
repo
rtin
g co
untrie
s, w
ith
the
exce
ptio
n of
the
fol
low
ing
23 c
ount
ries
: Arg
entina
, Co
sta
Ric
a, C
uba,
Ecu
ador
, Er
itre
a, G
hana
, Gua
tem
ala,
Ind
ia, Ko
rea
DPR, M
aurita
nia,
Sou
th A
fric
a, V
enez
uela
, an
d Zi
mba
bwe
(dat
e no
t av
aila
ble)
; Hai
ti (
data
for
198
9);
Russ
ian
Fede
ration
(da
ta for
199
2);
Bur
undi
, Gam
bia,
and
Lib
ya (
data
for
199
3);
Bot
swan
a, M
aced
onia
, Ta
jikis
tan,
Uzb
ekis
tan,
and
Yug
osla
via
(dat
a fo
r 19
94).
††Fo
r re
portin
g co
untrie
s, 1
995–
1998
.

67
Conc
lusi
ons
[ PR
OGRA
M IM
PLEM
ENTA
TION IN T
HE
1990
s ]
multiple approaches (such as multiplesupplementation and fortification), thiswould be a logical next step, and these
countries (identified in Appendix 8,column F) might be the places to start.
High levels of coverage for vitamin Acapsules were achieved in many countries in the mid-1990s. In LatinAmerica and the Caribbean, vitamin Asupplementation is not a commonapproach, and more reliance is placedon fortification. The supply of vitamin Acapsules from UNICEF is about 10% ofwhat would be needed if all children indeveloping countries were to be covered.The data presented here highlight theareas where attention should be focused.Priority should be given to programdevelopment in Burundi, Chad, India,Malawi, and Pakistan and to explorationof whether external supplies of capsulesshould be increased to Bangladesh andthe Philippines.
For control of iodine deficiency disorders,the analyses presented here indicate thatthe countries that should have priority forassistance might be those with significantprevalence of goitre (e.g., >10%) and low percentages of households withadequately iodized salt (e.g., <30%) —examples are Ethiopia, Mauritania,Ghana, the Philippines, and Burkina Faso.
Regarding programs to control anemia,the supply of iron tablets from externalsources is low compared to the need.Because supply problems have been
considered a major constraint (ACC/SCN1992), this very low level of externalprovision — covering only about 3% ofthe need — could be improved as a steptoward improving the effectiveness ofprograms. The most striking observationwas that not many countries reported ironsupplementation programs, and for thosethat did, there was little relation to need.Although program coverage needs to beexpanded, there is a sense that it may beadvisable to wait until better methods ofsupplementation have been identified and demonstrated. Although officiallyreported program coverage seemsmoderately high, most other infor-mation points to low coverage and poor adherence to supplemen-tation through antenatal care.
For most effective program impact,multiple micronutrient deficiencies needattention. Twenty-eight countries havepolicies for addressing all three of thedeficiencies discussed in this report.There are important opportunities now for combining intervent.
5. CONCLUSIONS


69
Refe
renc
es
ReferencesACC/SCN (Administrative Committee
on Coordination, Subcommittee onNutrition). 1987. First report on theworld nutrition situation. UnitedNations, Geneva, Switzerland.
— 1989. Update on the world nutritionsituation: recent trends in nutritionin 33 countries. United Nations,Geneva, Switzerland.
— 1992. Second report on the worldnutrition situation, vol. 1: Globaland regional results. UnitedNations, Geneva, Switzerland.
— 1993. Second report on the worldnutrition situation, vol. 2: Countrytrends, methods and statistics.United Nations, Geneva,Switzerland.
— 1996. Update on the nutritionsituation, 1996. United Nations,Geneva, Switzerland.
Angeles-Agdeppa, I.; Schultink, W.;Sastroamidjojo, S.; Gross, R.;Karyadi, D. 1997. Weeklymicronutrient supplementation to build iron stores in femaleIndonesian adolescents. AmericanJournal of Clinical Nutrition, 66(1), 177–183.
70 [THE MICRONUTRIENT REPORT]
FAO (Food and AgricultureOrganization). 1997. Agrostat[computerized database]. Economic and Social DevelopmentStatistics Division, FAO, Rome, Italy.
Gillespie, S.; Kevany, J.; Mason, J.1991. Controlling iron deficiency.Nutrition Policy Discussion Paper No. 9. United NationsAdministrative Committee onCoordination, Subcommittee onNutrition, Geneva, Switzerland.
Golden, M. 1994. Is complete catch-uppossible for stunted malnourishedchildren? European Journal ofClinical Nutrition, 48, S58–S71.
— 1995. Specific deficiencies versusgrowth failure: type I and type IInutrients. SCN News, 12, 10–14.
Government of Sri Lanka. 1997.Vitamin A deficiency and selectedworld summit goals for children in Sri Lanka. Ministry of Health and Medical Research Institute,Government of Sri Lanka, andUnited Nations Children’s Fund,Colombo, Sri Lanka.
Hetzel, B. 1988. The prevention and control of iodine deficiencydisorders. State-of-the-Art Series Nutrition Policy DiscussionPaper No. 3. United NationsAdministrative Committee onCoordination, Subcommittee onNutrition, Geneva, Switzerland.
Howson, C.P.; Kennedy, E.T.; Horwitz, A. 1998a. Key elements inthe design and implementation ofmicronutrient interventions. In
Howson, C.P.; Kennedy, E.T.;Horwitz, A., ed., Prevention ofmicronutrient deficiencies. Toolsfor policymakers and public healthworkers. Institute of Medicine,National Academy of Sciences,Washington, DC, USA. p. 11–41.
— 1998b. Prevention of micronutrientdeficiencies. Tools for policymakersand public health workers. Instituteof Medicine, National Academy ofSciences, Washington, DC, USA.
ICCIDD (International Council for the Control of Iodine DeficiencyDisorders). 2000. Web site forICCIDD. ICCIDD, city, country.Available from: http://www.people.virginia.edu/~jtd/iccidd/. Cited 2 Sept. 2000.
Jelliffe, D. 1966. The assessment ofnutritional status of the community.World Health OrganizationMonograph Series 53. World HealthOrganization, Geneva, Switzerland.
Mason, J.B.; Mannar, V.; Mock, N.2000. Controlling micronutrientdeficiencies in Asia. AsianDevelopment Review, 17(1–2):1–30.

71
Refe
renc
es
Mason, J.B.; Sethuraman, K.; Gilman, A.; Mason, K. 1998.Progress in controlling iodinedeficiency. Unpublished report tothe Micronutrient Initiative, Ottawa, ON, Canada.
Mason, J.B.; Sethuraman, K.; Mason,K.; Gilman, A.; Mock, N. 1998.Progress in controlling irondeficiency. Unpublished report to the Micronutrient Initiative,Ottawa, ON, Canada.
Merzenich, M.; Schultink, W.; Gross, R. 1994. Effect of iron–zincsupplementation on iron, zinc, and vitamin A status in Indonesiananaemic children. In Report of 16th International Vitamin AConsultative Group Meeting.International Life Sciences Institute,Washington, DC, USA. p. 87.
MI (Micronutrient Initiative). 1999.MN-Net: information for theelimination of micronutrientmalnutrition [Web site with online databases]. Available from www.micronutrient.org. Cited 30 Aug. 2000.
MI; UNICEF; Tulane (MicronutrientInitiative; United NationsChildren’s Fund; TulaneUniversity). 1998. Progress incontrolling vitamin A deficiency.MI, Ottawa, ON, Canada.
Murray, C.; Lopez, A. 1997. Globalmortality, disability, and thecontribution of risk factors: GlobalBurden of Diseases Study. Lancet,349(9063), 1436–1442.
Nestel, P.; Alnwick, D. 1997.Iron/multi-micronutrientsupplements for young children.International Nutritional AnaemiaConsultative Group, Washington,DC, USA.
Schultink, W.; Gross, R. 1997. Theinfluence of vitamin A on iron status and possible consequences formicronutrient deficiency alleviationprograms. In Micronutrientinteraction: impact on child healthand nutrition (meeting report).International Life Sciences Institute,Washington, DC, USA. pp. 28–35.
Stanbury, J.B. 1998. Prevention ofiodine deficiency. In Howson, C.P.;Kennedy, E.T.; Horwitz, A., ed.Prevention of micronutrientdeficiencies. Tools for policymakersand public health workers. National Academy Press,Washington, DC, USA. p. 167–201.
Stoltzfus, R.J.; Hakimi, M.; Miller, K.W.; Rasmussen, K.M.;Dawiesah, S.; Habicht, J.-P.;Dibley, M.J. 1992. High dosevitamin A supplementation ofbreast-feeding Indonesian mothers:effects on the vitamin A status ofmother and infant. Journal ofNutrition, 123, 666–675.
72 [THE MICRONUTRIENT REPORT]
Thu, B.D.; Schultink, W.; Dillon, D.; Gross, R.; Leswara,N.D.; Khoi, H.H. 1999. Effect of daily and weekly micronutrientsupplementation on micronutrientdeficiencies and growth in youngVietnamese children. AmericanJournal of Clinical Nutrition, 69(1), 80–86.
UN (United Nations). 1997.Demographic yearbook. PopulationDivision, UN, New York, NY, USA.
UNICEF (United Nations Children’sFund). 1995. UNICEF annualreport 1995. UNICEF, New York,NY, USA.
— 1996. UNICEF annual report 1996.UNICEF, New York, NY, USA.
— 1998. State of the world’s children1998. UNICEF, New York, NY,USA.
— 2000. State of the world’s children2000. UNICEF, New York, NY,USA.
UNICEF; WHO; UNU (United NationsChildren’s Fund; World HealthOrganization; United NationsUniversity). 2000. Report of aworkshop on composition of amulti-micronutrient supplement to be used in pilot programmesamong pregnant women indeveloping countries, 9 July 1999,New York, NY. United Nations,New York, NY, USA.
Viteri , F.E. 1998. Prevention of irondeficiency. In Howson, C.P.;Kennedy, E.T.; Horwitz, A., ed.Prevention of micronutrientdeficiencies. Tools for policymakersand public health workers. Instituteof Medicine, National Academy ofSciences, Washington, DC, USA. p. 45–102.
West, K.P., Jr.; Katz, J.; Khatry, S.K.;LeClerq, S.C.; Pradhan, E.K.;Shrestha, S.R.; Connor, P.B.; Dali, S.M.; Christian, P.; Pokhrel, R.P.; Sommer, A. 1999.Double blind, cluster randomisedtrial of low dose supplementationwith vitamin A or beta carotene onmortality related to pregnancy inNepal. The NNIPS-2 Study Group.British Medical Journal, 318(7183),570–575.
WHO (World Health Organization).1983. Measuring change innutritional status: guidelines forassessing the nutritional impact ofsupplementary feeding programmesfor vulnerable groups. WHO,Geneva, Switzerland.
— 1992. The prevalence of anaemia inwomen. WHO/MCH/MSM/92.2.WHO, Geneva, Switzerland.
— 1993. Global prevalence of iodinedeficiency disorders. MDIS WorkingPaper No. 1. WHO, United NationsChildren’s Fund, and InternationalCouncil for the Control of IodineDeficiency Disorders. WHO,Geneva, Switzerland.
— 1994. Indicators for assessing iodinedeficiency disorders and their

73
Refe
renc
es
control through salt iodization.WHO, United Nations Children’sFund, and International Council forthe Control of Iodine DeficiencyDisorders. WHO/NUT/94.6.WHO, Geneva, Switzerland.
— 1995. Global prevalence of vitamin Adeficiency. MDIS Working PaperNo. 2. WHO/NUT/95.3. WHO,Geneva, Switzerland.
— 1996. Indicators for assessing vitamin A deficiency and theirapplication in monitoring andevaluating intervention programmes.WHO/NUT/96.10. WHO, Geneva,Switzerland.
— 1997. Prevalence of anaemia amongdifferent populations based onnational data. MDIS Working Paper No. 3 [mimeo]. WHO,Geneva, Switzerland.
— 1999. Progress towards theelimination of iodine deficiencydisorders (IDD). United NationsChildren’s Fund, WHO, andInternational Council for theControl of Iodine DeficiencyDisorders. WHO/NHD/99.4.WHO, Geneva, Switzerland.
WHO; UNICEF; IVACG (World HealthOrganization; United NationsChildren’s Fund; InternationalVitamin A Consultative Group).1997. Vitamin A supplements. Aguide to their use in the treatmentand prevention of vitamin Adeficiency and xerophthalmia.WHO, Geneva, Switzerland.
WHO; UNICEF; UNU (World HealthOrganization; United NationsChildren’s Fund; United NationsUniversity). 1997. Indicators andstrategies for iron deficiency controlprograms. WHO/NUT/96.12.WHO, Geneva, Switzerland.
Yusuf, H.K.M.; Salamatullah, Q.;Islam, M.N.; Hoque, T.; Baquer, M.; Pandav, C.S. 1993.Report of the National IodineDeficiency Disorders Survey in Bangladesh — 1993. DhakaUniversity, United NationsChildren’s Fund, and InternationalCouncil for the Control of IodineDeficiency Disorders, Dhaka,Bangladesh


75
Refe
renc
es
ReferencesACC/SCN (Administrative Committee
on Coordination, Subcommittee onNutrition). 1987. First report on theworld nutrition situation. UnitedNations, Geneva, Switzerland.
— 1989. Update on the world nutritionsituation: recent trends in nutritionin 33 countries. United Nations,Geneva, Switzerland.
— 1992. Second report on the worldnutrition situation, vol. 1: Globaland regional results. UnitedNations, Geneva, Switzerland.
— 1993. Second report on the worldnutrition situation, vol. 2: Countrytrends, methods and statistics.United Nations, Geneva,Switzerland.
— 1996. Update on the nutritionsituation, 1996. United Nations,Geneva, Switzerland.
Angeles-Agdeppa, I.; Schultink, W.;Sastroamidjojo, S.; Gross, R.;Karyadi, D. 1997. Weeklymicronutrient supplementation to build iron stores in femaleIndonesian adolescents. AmericanJournal of Clinical Nutrition, 66(1), 177–183.

76 [THE MICRONUTRIENT REPORT]
FAO (Food and AgricultureOrganization). 1997. Agrostat[computerized database]. Economic and Social DevelopmentStatistics Division, FAO, Rome, Italy.
Gillespie, S.; Kevany, J.; Mason, J.1991. Controlling iron deficiency.Nutrition Policy Discussion Paper No. 9. United NationsAdministrative Committee onCoordination, Subcommittee onNutrition, Geneva, Switzerland.
Golden, M. 1994. Is complete catch-uppossible for stunted malnourishedchildren? European Journal ofClinical Nutrition, 48, S58–S71.
— 1995. Specific deficiencies versusgrowth failure: type I and type IInutrients. SCN News, 12, 10–14.
Government of Sri Lanka. 1997.Vitamin A deficiency and selectedworld summit goals for children in Sri Lanka. Ministry of Health and Medical Research Institute,Government of Sri Lanka, andUnited Nations Children’s Fund,Colombo, Sri Lanka.
Hetzel, B. 1988. The prevention and control of iodine deficiencydisorders. State-of-the-Art Series Nutrition Policy DiscussionPaper No. 3. United NationsAdministrative Committee onCoordination, Subcommittee onNutrition, Geneva, Switzerland.
Howson, C.P.; Kennedy, E.T.; Horwitz, A. 1998a. Key elements inthe design and implementation ofmicronutrient interventions. In
Howson, C.P.; Kennedy, E.T.;Horwitz, A., ed., Prevention ofmicronutrient deficiencies. Toolsfor policymakers and public healthworkers. Institute of Medicine,National Academy of Sciences,Washington, DC, USA. p. 11–41.
— 1998b. Prevention of micronutrientdeficiencies. Tools for policymakersand public health workers. Instituteof Medicine, National Academy ofSciences, Washington, DC, USA.
ICCIDD (International Council for the Control of Iodine DeficiencyDisorders). 2000. Web site forICCIDD. ICCIDD, city, country.Available from: http://www.people.virginia.edu/~jtd/iccidd/. Cited 2 Sept. 2000.
Jelliffe, D. 1966. The assessment ofnutritional status of the community.World Health OrganizationMonograph Series 53. World HealthOrganization, Geneva, Switzerland.
Mason, J.B.; Mannar, V.; Mock, N.2000. Controlling micronutrientdeficiencies in Asia. AsianDevelopment Review, 17(1–2):1–30.

77
Refe
renc
es
Mason, J.B.; Sethuraman, K.; Gilman, A.; Mason, K. 1998.Progress in controlling iodinedeficiency. Unpublished report tothe Micronutrient Initiative, Ottawa, ON, Canada.
Mason, J.B.; Sethuraman, K.; Mason,K.; Gilman, A.; Mock, N. 1998.Progress in controlling irondeficiency. Unpublished report to the Micronutrient Initiative,Ottawa, ON, Canada.
Merzenich, M.; Schultink, W.; Gross, R. 1994. Effect of iron–zincsupplementation on iron, zinc, and vitamin A status in Indonesiananaemic children. In Report of 16th International Vitamin AConsultative Group Meeting.International Life Sciences Institute,Washington, DC, USA. p. 87.
MI (Micronutrient Initiative). 1999.MN-Net: information for theelimination of micronutrientmalnutrition [Web site with online databases]. Available from www.micronutrient.org. Cited 30 Aug. 2000.
MI; UNICEF; Tulane (MicronutrientInitiative; United NationsChildren’s Fund; TulaneUniversity). 1998. Progress incontrolling vitamin A deficiency.MI, Ottawa, ON, Canada.
Murray, C.; Lopez, A. 1997. Globalmortality, disability, and thecontribution of risk factors: GlobalBurden of Diseases Study. Lancet,349(9063), 1436–1442.
Nestel, P.; Alnwick, D. 1997.Iron/multi-micronutrientsupplements for young children.International Nutritional AnaemiaConsultative Group, Washington,DC, USA.
Schultink, W.; Gross, R. 1997. Theinfluence of vitamin A on iron status and possible consequences formicronutrient deficiency alleviationprograms. In Micronutrientinteraction: impact on child healthand nutrition (meeting report).International Life Sciences Institute,Washington, DC, USA. pp. 28–35.
Stanbury, J.B. 1998. Prevention ofiodine deficiency. In Howson, C.P.;Kennedy, E.T.; Horwitz, A., ed.Prevention of micronutrientdeficiencies. Tools for policymakersand public health workers. National Academy Press,Washington, DC, USA. p. 167–201.
Stoltzfus, R.J.; Hakimi, M.; Miller, K.W.; Rasmussen, K.M.;Dawiesah, S.; Habicht, J.-P.;Dibley, M.J. 1992. High dosevitamin A supplementation ofbreast-feeding Indonesian mothers:effects on the vitamin A status ofmother and infant. Journal ofNutrition, 123, 666–675.

78 [THE MICRONUTRIENT REPORT]
Thu, B.D.; Schultink, W.; Dillon, D.; Gross, R.; Leswara,N.D.; Khoi, H.H. 1999. Effect of daily and weekly micronutrientsupplementation on micronutrientdeficiencies and growth in youngVietnamese children. AmericanJournal of Clinical Nutrition, 69(1), 80–86.
UN (United Nations). 1997.Demographic yearbook. PopulationDivision, UN, New York, NY, USA.
UNICEF (United Nations Children’sFund). 1995. UNICEF annualreport 1995. UNICEF, New York,NY, USA.
— 1996. UNICEF annual report 1996.UNICEF, New York, NY, USA.
— 1998. State of the world’s children1998. UNICEF, New York, NY,USA.
— 2000. State of the world’s children2000. UNICEF, New York, NY,USA.
UNICEF; WHO; UNU (United NationsChildren’s Fund; World HealthOrganization; United NationsUniversity). 2000. Report of aworkshop on composition of amulti-micronutrient supplement to be used in pilot programmesamong pregnant women indeveloping countries, 9 July 1999,New York, NY. United Nations,New York, NY, USA.
Viteri , F.E. 1998. Prevention of irondeficiency. In Howson, C.P.;Kennedy, E.T.; Horwitz, A., ed.Prevention of micronutrientdeficiencies. Tools for policymakersand public health workers. Instituteof Medicine, National Academy ofSciences, Washington, DC, USA. p. 45–102.
West, K.P., Jr.; Katz, J.; Khatry, S.K.;LeClerq, S.C.; Pradhan, E.K.;Shrestha, S.R.; Connor, P.B.; Dali, S.M.; Christian, P.; Pokhrel, R.P.; Sommer, A. 1999.Double blind, cluster randomisedtrial of low dose supplementationwith vitamin A or beta carotene onmortality related to pregnancy inNepal. The NNIPS-2 Study Group.British Medical Journal, 318(7183),570–575.
WHO (World Health Organization).1983. Measuring change innutritional status: guidelines forassessing the nutritional impact ofsupplementary feeding programmesfor vulnerable groups. WHO,Geneva, Switzerland.
— 1992. The prevalence of anaemia inwomen. WHO/MCH/MSM/92.2.WHO, Geneva, Switzerland.
— 1993. Global prevalence of iodinedeficiency disorders. MDIS WorkingPaper No. 1. WHO, United NationsChildren’s Fund, and InternationalCouncil for the Control of IodineDeficiency Disorders. WHO,Geneva, Switzerland.
— 1994. Indicators for assessing iodinedeficiency disorders and their

79
Refe
renc
es
control through salt iodization.WHO, United Nations Children’sFund, and International Council forthe Control of Iodine DeficiencyDisorders. WHO/NUT/94.6.WHO, Geneva, Switzerland.
— 1995. Global prevalence of vitamin Adeficiency. MDIS Working PaperNo. 2. WHO/NUT/95.3. WHO,Geneva, Switzerland.
— 1996. Indicators for assessing vitamin A deficiency and theirapplication in monitoring andevaluating intervention programmes.WHO/NUT/96.10. WHO, Geneva,Switzerland.
— 1997. Prevalence of anaemia amongdifferent populations based onnational data. MDIS Working Paper No. 3 [mimeo]. WHO,Geneva, Switzerland.
— 1999. Progress towards theelimination of iodine deficiencydisorders (IDD). United NationsChildren’s Fund, WHO, andInternational Council for theControl of Iodine DeficiencyDisorders. WHO/NHD/99.4.WHO, Geneva, Switzerland.
WHO; UNICEF; IVACG (World HealthOrganization; United NationsChildren’s Fund; InternationalVitamin A Consultative Group).1997. Vitamin A supplements. Aguide to their use in the treatmentand prevention of vitamin Adeficiency and xerophthalmia.WHO, Geneva, Switzerland.
WHO; UNICEF; UNU (World HealthOrganization; United NationsChildren’s Fund; United NationsUniversity). 1997. Indicators andstrategies for iron deficiency controlprograms. WHO/NUT/96.12.WHO, Geneva, Switzerland.
Yusuf, H.K.M.; Salamatullah, Q.;Islam, M.N.; Hoque, T.; Baquer, M.; Pandav, C.S. 1993.Report of the National IodineDeficiency Disorders Survey in Bangladesh — 1993. DhakaUniversity, United NationsChildren’s Fund, and InternationalCouncil for the Control of IodineDeficiency Disorders, Dhaka,Bangladesh
