the micro origins of international business cycle comovement · the micro origins of international...
TRANSCRIPT
The Micro Origins of International Business CycleComovement
By Julian di Giovanni, Andrei A. Levchenko, and Isabelle Mejean∗
This paper investigates the role of individual firms in internationalbusiness cycle comovement using data covering the universe ofFrench firm-level value added and international linkages over 1993-2007. At the micro level, trade and multinational linkages with aparticular foreign country are associated with a significantly highercorrelation between a firm and that foreign country. The impactof direct linkages on comovement at the micro level has signifi-cant macro implications. Without those linkages the correlationbetween France and foreign countries would fall by about 0.098,or one-third of the observed average correlation of 0.291 in oursample of partner countries.JEL: F44, F61, F62Keywords: Comovement, International Trade, Firm-Level Shocks,Large Firms
Countries that exhibit greater bilateral trade and multinational production link-ages have more correlated business cycles (Frankel and Rose, 1998; Kleinert etal., 2015). While the empirical literature has repeatedly confirmed the trade-comovement relationship in the data, its meaning is not well-understood, eitherempirically or quantitatively. Taken at face value, the positive association betweenbilateral trade and multinational linkages and comovement is often interpreted asevidence of transmission of shocks across countries through those linkages.
The empirical literature has faced two related challenges. The first is the cri-tique by Imbs (2004) that countries that trade more with each other are similarin other ways, and thus subject to common shocks. Under an extreme version
∗ di Giovanni: ICREA-Universitat Pompeu Fabra, Barcelona GSE, CREI and CEPR, Ramon TriasFargas 25-27, 08005, Barcelona, Spain ([email protected]). Levchenko: University of Michigan,NBER and CEPR, 611 Tappan Street, Ann Arbor, MI 48109, United States ([email protected]). Mejean:CREST, Ecole Polytechnique, Universite Paris-Saclay and CEPR, Route de Saclay 91128 Palaiseaucedex, France ([email protected]). We would like to thank the editor (Mark Aguiar),anonymous referees, Jean Imbs, Silvana Tenreyro, and workshop participants at several institutions forhelpful discussions, and Eda Gulsen for expert research assistance. Di Giovanni gratefully acknowledgesthe European Research Council (ERC) under the European Union’s Horizon 2020 research and innovationprogramme (grant agreement No. 726168), and the Spanish Ministry of Economy and Competitiveness,through the Severo Ochoa Programme for Centres of Excellence in R&D (SEV-2015-0563) for financialsupport. Mejean gratefully acknowledges support from a public grant overseen by the French NationalResearch Agency (ANR) as part of the “Investissements d’Avenir” program (Idex Grant Agreement No.ANR-11-IDEX-0003- 02/Labex ECODEC No. ANR-11-LABEX-0047 and Equipex reference: ANR-10-EQPX-17 – Centre d’acces securise aux donnees CASD), and the European Research Council (ERC)under the European Union’s Horizon 2020 research and innovation programme (grant agreement No.714597). The authors declare that they have no relevant or material financial interests that relate to theresearch described in this paper.
1
2 THE AMERICAN ECONOMIC REVIEW MONTH YEAR
of this view, the trade linkage variable in the Frankel-Rose specification does notreflect the intensity of transmission of shocks, but rather is simply a stand-infor the prevalence of common shocks. The second is that even if one acceptsthe transmission of shocks interpretation of the Frankel-Rose result, the coarsenature of the cross-country setting makes it difficult to learn about the microunderpinnings of the trade-comovement relationship. This lack of understandingis reinforced by the quantitative literature, which has struggled to capture thetrade-comovement relationship. Kose and Yi (2006) and Johnson (2014) showthat even quite sophisticated IRBC models fail to generate the observed positiveassociation, dubbing it the “trade-comovement puzzle.”1
Until now the properties of international comovement at the firm level, or itsaggregate implications, have by and large not been studied. This paper provides aforensic account of international comovement at both the micro and macro levelsusing data covering the universe of French firm-level value-added, destination-specific imports and exports, and cross-border ownership over the period 1993-2007. Examining cross-border comovement at the firm level has two advantagesrelative to the traditional approach of looking directly at GDP correlations. First,at the micro level, the data allow for precise measurement of trade and multi-national linkages – by firm×country – and to control for common shocks usingappropriate fixed effects. This overcomes the common shocks critique and letsus establish much more firmly that the positive trade-comovement relationship isdue at least in part to transmission of shocks at the firm level.
Second, at the macro level, our approach allows us to capture the aggregate co-movement implications of heterogeneity across firms in both size and the extentof international linkages. Larger firms are disproportionately more likely to tradeinternationally and own affiliates in foreign countries. Indeed, in most countriesinternational trade flows are dominated by only a handful of large firms. Anemerging research agenda in closed-economy macro has argued convincingly thatmodeling and measuring shocks at the micro level (to firms and sectors), andlinkages between them, is essential for understanding aggregate fluctuations.2 Iflarge firms and firm-to-firm linkages matter for aggregate fluctuations, a naturalconjecture is that they will matter as much if not more for cross-border comove-ment.
1The literature on multinationals and international business cycle comovement is more limited, butshares this feature. Kleinert et al. (2015) show that French regions that contain more multinationals froma particular foreign country are more correlated with that country. However, Cravino and Levchenko(2017) show that the observed multinational presence alone cannot generate the level of positive comove-ment found in the data. Liao and Santacreu (2015) develop a model in which technology shocks aretransmitted between countries through changes in the mix of imported inputs, and show that allowingfor the extensive margin of trade yields more promising results.
2Gabaix (2011), di Giovanni and Levchenko (2012), and Carvalho and Grassi (2015) develop modelsin which aggregate fluctuations arise from shocks to individual firms, because the firm-size distributionis extremely fat-tailed (Zipf’s Law). Acemoglu et al. (2012) and Carvalho and Gabaix (2013) argue thatsectoral shocks lead to aggregate fluctuations through interconnections between sectors. Di Giovanni et al.(2014), Atalay (2017), Friberg and Sanctuary (2016), and Magerman et al. (2016) provide correspondingempirical evidence on the role of shocks to firms and sectors in aggregate fluctuations.

VOL. VOL NO. ISSUE MICRO ORIGINS OF INTERNATIONAL COMOVEMENT 3
We begin by estimating a specification inspired by Frankel and Rose (1998),which relates the correlation of firm total value added growth with foreign GDPgrowth to firm-level direct linkages to that country. The data contain, for eachfirm and potential partner country, four types of direct linkages: (i) importingfrom it, (ii) exporting to it, (iii) being a France-based affiliate of a multinationalfirm headquartered in that country; (iv) being a French firm with a foreign affiliatein that country. Because the sample includes many firms and countries, estimationcontrols for both firm and country effects. Country effects in particular absorbthe common aggregate shocks affecting France and each foreign country.
In a sample of firm-level correlations with 10 large trading partners of France,trade linkages at the firm level are significantly associated with increased comove-ment between an individual firm and the country with which it trades. An importlink increases the correlation by 0.013, and an export link by 0.005. This is largerelative to the average correlation between an individual firm and foreign GDP,which is 0.024 for directly connected firms, and essentially zero for non-directlyconnected ones. By a similar token, affiliates of foreign multinationals operatingin France have a 0.010 higher correlation with their source countries.
At the same time, the empirical exercise reveals the importance of commonshocks in the data. In a specification that omits the 10 country fixed effects butstill includes the ∼1 million firm effects, the coefficients on the direct linkagesvariables are 2-5 times larger in magnitude and all strongly statistically signifi-cant. This underscores both the empirical relevance of common shocks, and howimportant it is to control for them in “gravity-macro” analyses of the effects ofbilateral trade and capital flows linkages on aggregate outcomes. Nonetheless,the results when controlling for common shocks still provide clear evidence oftransmission through direct linkages at the firm level.
We then use the sector-level Input-Output table together with firm-level infor-mation on input purchases and domestic sales to construct proxies for indirectlinkages between French firms and foreign markets. The measures, inspired by the“network effect” propagation terms in Acemoglu et al. (2016), capture the inten-sity with which a French firm interacts with internationally connected firms. Thedownstream indicator reflects whether a firm buys intermediate inputs from firmsthat import from a particular country. The upstream indicator captures whethera firm sells its output to firms that export to a particular country. Both of thesemeasures are firm- and foreign country-specific. We augment the main specifi-cation with these indirect linkage terms, and show that the downstream indirectlinkages do matter significantly for firm-level comovement with foreign markets.Firms that buy inputs from importers from a particular country are more corre-lated with that country. The evidence on upstream linkages is more mixed, withcoefficients differing in sign and significance depending on specification.
The second half of the analysis examines the macro implications of the micro-level findings. We start with the observation that the aggregate business cycle cor-relation between France and another country is simply an appropriately weighted
4 THE AMERICAN ECONOMIC REVIEW MONTH YEAR
sum of the correlations of firm-level total value added with that country. Theaggregate business cycle correlation between France and each country can thusbe written as a sum of two terms: the part due to the directly connected firms,and the part due to the not directly connected firms. For the 10 large tradingpartners of France in our sample, we show that the large directly connected firmsare important in accounting for aggregate comovement. For a typical foreignpartner country, the directly connected firms represent only about 8% of all firmsin our dataset, but account for 56% of total value added. The directly connectedfirms are also unconditionally more correlated with the foreign country. Togetherthese two facts imply that the directly connected firms account for 67% of theaggregate business cycle correlation observed in the data for the average country.
We then use the conditional relationship between direct linkages and firm-levelcorrelations to compute the change in the aggregate correlation between Franceand each foreign country that would occur if direct linkages at the firm leveldisappeared. This accounting exercise combines information on the change in thecorrelation at the firm level from the regression estimates with firm-level weights.If direct linkages at the firm level were severed, the aggregate correlation wouldfall by 0.098 on average in our sample of 10 partner countries. This is a non-negligible change relative to the observed correlations between France and itsmain trading partners of 0.291 on average over this period. Since our data allowus to estimate the coefficients on trade and multinational links separately, wecan also check which ones matter more for generating aggregate comovement. Itturns out that the trade linkages are about 10 times more important in generatingaggregate comovement than multinational linkages, accounting for 0.090 of theoverall 0.098 effect.
Augmenting the aggregate impact with the indirect linkage estimates, we showthat indirect linkages are quantitatively important as well. Accounting for indirectlinkages implies that aggregate correlation would fall by 0.199 on average in thewhole economy if links to the foreign country were severed. Thus, direct andindirect linkages together can account for two-thirds of the average 0.291 observedaggregate correlation.
To summarize, on the one hand the data point clearly to the presence of com-mon shocks, implying that it is imperative to control for them in the empiricalexercise. On the other hand, even after controlling for common shocks, thereis still substantial evidence of transmission of shocks through trade and multina-tional linkages. Among those linkages, trade linkages appear to matter more thanmultinational ones, especially in aggregate. Downstream indirect input linkagesare both statistically robust and quantitatively important as well.
Our paper contributes to the empirical literature on international business cy-cle comovement. Studies building on Frankel and Rose (1998) have confirmedthe positive association between trade and comovement and examined how it dif-fers across types of goods trade and sub-samples of countries (see, e.g. Baxterand Kouparitsas, 2005; Calderon et al., 2007; Ng, 2010; Blonigen et al., 2014;

VOL. VOL NO. ISSUE MICRO ORIGINS OF INTERNATIONAL COMOVEMENT 5
Liao and Santacreu, 2015). While the existing empirical literature has almostexclusively used GDP correlations as the outcome variable, there has been com-paratively little work on international comovement at more disaggregated levels.Di Giovanni and Levchenko (2010) estimate the relationship between bilateraltrade, input linkages, and sector-level correlations. This paper’s contribution isto examine the trade-comovement relationship at the firm level, and to derive theaggregate implications based on micro-level estimates. In this respect, it sharessome features with recent papers such as Boehm et al. (2015), Kurz and Senses(2016), and Cravino and Levchenko (2017), who perform related exercises.
The empirical literature on the cross-country business cycle synchronization hasalso examined other mechanisms, such as sectoral specialization (see, e.g., Clarkand van Wincoop, 2001; Kalemli-Ozcan et al., 2001; Imbs, 2004), or financial in-tegration (see, e.g., Morgan et al., 2004; Imbs, 2006; Kalemli-Ozcan et al., 2013,among others). Our approach allows for us to control for these country charac-teristics as well as common aggregate shocks, thus providing a precise estimateof the impact of firm-level real linkages on business cycle comovement.
An important research agenda, going back to Backus et al. (1995), attempts tounderstand the positive GDP comovement across countries using representativefirm models in which all shocks are aggregate. Later developments in this litera-ture explored the role of the production structure, such as input-output linkages(Burstein et al., 2008; Arkolakis and Ramanarayanan, 2009), or firm heterogene-ity (Ghironi and Melitz, 2005; Alessandria and Choi, 2007) but have similarlybeen confined to considering only the role of aggregate productivity shocks ingenerating cross-country business cycle comovement. Our results suggest that tofully understand the impact of transmission of shocks for aggregate comovement,a quantitative framework must feature a realistic micro-structure that combinesgranularity in the firm size distribution and systematic heterogeneity among firmsin trade and multinational linkages.
The rest of the paper is organized as follows. Section I lays out the concep-tual framework and the empirical exercises performed in the paper. Section IIdescribes the data, and Section III the results. Section IV concludes.
I. Conceptual Framework
Total value added Xt by all French firms in year t is by definition given by:Xt ≡
∑f∈It xft, where xft is defined as the value added of firm f in year t, and
It is the set of firms f operating at t. The growth rate of aggregate value addedis then defined simply as γAt = Xt/Xt−1− 1, where we assume that Xt−1 and Xt
are the aggregate value added of all firms that exist both at t − 1 and t, i.e. werestrict attention to the intensive margin of aggregate value added growth. OnlineAppendix A develops a complete decomposition of the total value added growthinto extensive and intensive margins, and presents the results for the relativecontributions of the extensive and intensive margins to aggregate comovementbetween France and its main trade partners. The main result is that the large

6 THE AMERICAN ECONOMIC REVIEW MONTH YEAR
majority of aggregate comovement is accounted for by the intensive margin, withthe extensive margin playing only a minor role.3
The growth rate of aggregate value added can be written as a function ofindividual firm growth rates and firm shares:
(1) γAt =∑f
wft−1γft,
where γft is the growth rate of value added of firm f , and wft−1 is the share off ’s value added in total French value added.
The object of interest is the correlation between French aggregate growth andforeign GDP growth. Let γCt be the GDP growth of a foreign country C betweent− 1 and t. This correlation is given by:
(2) ρ (γAt, γCt) =Cov (γAt, γCt)
σAσC,
where σA is the standard deviation of French GDP growth, and σC is the standarddeviation of country C growth.
Combining (1) and (2), the correlation between France and C at time t can bewritten as
ρ (γAt, γCt) =Cov
(∑f wft−1γft, γCt
)σAσC
(3)
=∑f
wft−1σfσA
ρ (γft, γCt) ,(4)
where σf is the standard deviation of γft.
While simply an identity, (4) states the key premise of the paper: the aggregatecorrelation between the French economy and another country is an appropriatelyweighted sum of the firm-level correlations. The substantial literature on inter-national comovement has studied empirically and theoretically the left-hand sideof this equation – the aggregate business cycle comovement. This paper providesa picture of aggregate comovement by examining instead the components of theright-hand side. We proceed by analyzing first the properties of the individualfirm-level correlations ρ (γft, γCt), and then the consequences of aggregation acrossfirms.
3These results are not inconsistent with the empirical findings in Liao and Santacreu (2015), whoshow that the extensive margin of trade is positively correlated with bilateral comovement. Those resultsrelate the cross-sectional variation in the number of products traded between country pairs to bilateralbusiness cycle comovement. Our extensive margin is the aggregate contribution of entry and exit ofFrench firms from year to year, an object that has no close relationship to the cross-country differencesin the number of traded varieties.
VOL. VOL NO. ISSUE MICRO ORIGINS OF INTERNATIONAL COMOVEMENT 7
A. Micro Evidence
To establish whether the direct trade and multinational linkages at the firm levelto a particular foreign country are associated with a higher correlation betweenthe firm and that foreign country, we estimate the following specification:
(5) ρ (γft, γCt) = α+β1EXf,C+β2IMf,C+β3AFFf,C+β4HQf,C+δf +δC+ηf,C .
In equation (5), the correlation between a firm and a foreign market C is relatedto binary indicators of whether the firm exports to there (EXf,C), imports fromthere (IMf,C), is a French multinational with affiliates in C (HQf,C), or is anaffiliate of a foreign multinational headquartered in C (AFFf,C).
Our firm-level specification leads to qualitatively new insights relative to thetraditional cross-country empirical model pioneered by Frankel and Rose (1998).First, it admits both firm and country effects, allowing us to establish that tradeand multinational linkages are indeed a source of transmission of shocks ratherthan simply a stand-in for the presence of common shocks. Since all firms inthis specification are in France, country effects capture the common correlationof all firms in France with country C, and thus absorb the correlation induced bycommon shocks that affect both France and that country.
At the same time, the country effects will also capture the correlation thatis due to transmission of shocks between a foreign country and France if thattransmission manifests itself at the aggregate level. For example, if German shockstransmit to French wages or the overall price levels, these shocks will affect all thefirms in France and thus will get picked up by the German country effect. In otherwords, while the country effects control for common shocks, they in principle alsoabsorb some part of the impact of shock transmission, to the extent that theforeign shocks affect all firms irrespective of their own direct connectedness. Asa result, the β coefficients in equation (5) can be thought of as a lower bound onthe importance of transmission for comovement. By the same token, the findingthat country effects play a large role is not necessarily evidence that transmissionis unimportant, as some transmission will be picked up by those country effects.
Second, estimation at the firm level reveals the micro underpinnings of theaggregate relationship. Observing cross-border links at the firm level allows us toestablish with forensic precision the role of each type of trade and multinationalrelationship in international comovement. With very few exceptions (e.g. Kleinertet al., 2015), existing papers do not combine information on both trade andmultinational linkages in the same specification. This may be important: if bothtypes of linkages potentially matter, not including them will lead to omittedvariable bias. Firm effects also control for a range of characteristics that vary atthe firm level and potentially affect its average comovement with the rest of theworld, such as its volatility, size, primary industry of operation, capital or skillintensity, access to external finance, R&D intensity, domestic linkages, and so on.
8 THE AMERICAN ECONOMIC REVIEW MONTH YEAR
Indirect Linkages
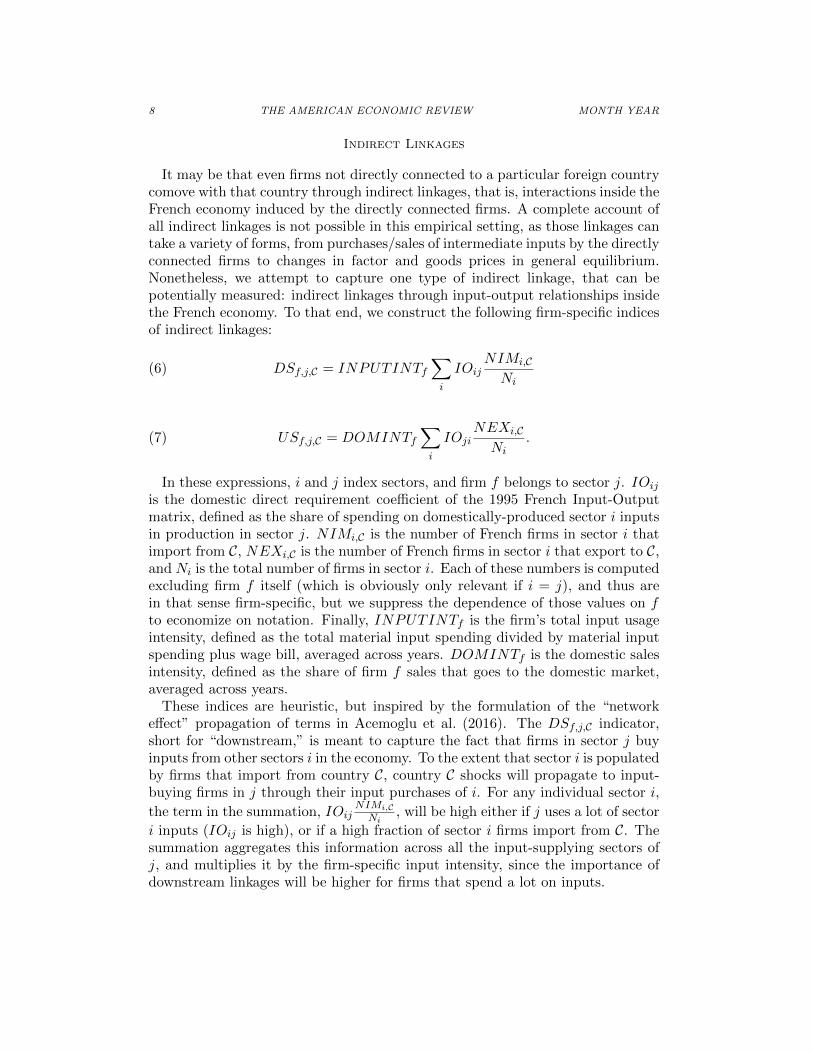
It may be that even firms not directly connected to a particular foreign countrycomove with that country through indirect linkages, that is, interactions inside theFrench economy induced by the directly connected firms. A complete account ofall indirect linkages is not possible in this empirical setting, as those linkages cantake a variety of forms, from purchases/sales of intermediate inputs by the directlyconnected firms to changes in factor and goods prices in general equilibrium.Nonetheless, we attempt to capture one type of indirect linkage, that can bepotentially measured: indirect linkages through input-output relationships insidethe French economy. To that end, we construct the following firm-specific indicesof indirect linkages:
(6) DSf,j,C = INPUTINTf∑i
IOijNIMi,CNi
(7) USf,j,C = DOMINTf∑i
IOjiNEXi,CNi
.
In these expressions, i and j index sectors, and firm f belongs to sector j. IOijis the domestic direct requirement coefficient of the 1995 French Input-Outputmatrix, defined as the share of spending on domestically-produced sector i inputsin production in sector j. NIMi,C is the number of French firms in sector i thatimport from C, NEXi,C is the number of French firms in sector i that export to C,and Ni is the total number of firms in sector i. Each of these numbers is computedexcluding firm f itself (which is obviously only relevant if i = j), and thus arein that sense firm-specific, but we suppress the dependence of those values on fto economize on notation. Finally, INPUTINTf is the firm’s total input usageintensity, defined as the total material input spending divided by material inputspending plus wage bill, averaged across years. DOMINTf is the domestic salesintensity, defined as the share of firm f sales that goes to the domestic market,averaged across years.
These indices are heuristic, but inspired by the formulation of the “networkeffect” propagation of terms in Acemoglu et al. (2016). The DSf,j,C indicator,short for “downstream,” is meant to capture the fact that firms in sector j buyinputs from other sectors i in the economy. To the extent that sector i is populatedby firms that import from country C, country C shocks will propagate to input-buying firms in j through their input purchases of i. For any individual sector i,
the term in the summation, IOijNIMi,CNi
, will be high either if j uses a lot of sector
i inputs (IOij is high), or if a high fraction of sector i firms import from C. Thesummation aggregates this information across all the input-supplying sectors ofj, and multiplies it by the firm-specific input intensity, since the importance ofdownstream linkages will be higher for firms that spend a lot on inputs.

VOL. VOL NO. ISSUE MICRO ORIGINS OF INTERNATIONAL COMOVEMENT 9
The USf,j,C (“upstream”) indicator is meant to capture the fact that firms insector j supply inputs to other sectors i, and thus will be affected by whetherthe sector i buying its inputs has a large population of directly connected firms.Export opportunities in sector i to country C will propagate to sector j as anincrease in exports from i to C will raise demand for sector j inputs. For an
individual output sector i, the term IOjiNEXi,CNi
will be high if either i uses a lotof j inputs, or if a large share of firms in i export to C. The summation acrosssectors is multiplied by the share of firm f ’s sales in the domestic market, sinceif f does not sell much of its output in France, by construction it must be arelatively unimportant supplier of inputs to the French market.
The indices are constructed using sector-level information by necessity, as thereis yet no firm-level Input-Output matrix available for France. If we had firm-levelinformation, these indices would have a much simpler form, and would exploitinformation on whether firm f sources inputs from directly connected firms, orsupplies inputs to directly connected firms.4
Note that while these formulations appear the most natural to us, one canthink of other transmission mechanisms that might be at work. For example,one can build a “horizontal” transmission indicator that instead of counting thenumber of importing firms in the input-supplying sector, counts the number ofexporting firms. This indicator would be relevant if, for instance, there are ca-pacity constraints and thus greater export opportunities in the input-supplyingsector i reduce those firms’ domestic supply of inputs. We view those alternativeindicators as less compelling and most likely second-order relative to those setout above. Indeed, using the exogenous shock of the 2011 Japanese earthquake,Carvalho et al. (2016) do not find horizontal transmission to be important. Anadditional question is whether we should also build propagation indices for multi-nationals and affiliates. In this case, it is also unclear in which way do shocks tomultinationals propagate to non-directly connected firms. To avoid a prolifera-tion of regressors, we favor a more parsimonious specification with only the twoindices (6)-(7).
We add these two variables to the baseline specification (5). Thus, we includethe indirect linkage indicators alongside the direct linkage indicators and countryand firm fixed effects:
ρ (γft, γCt) = α+ β1EXf,C + β2IMf,C + β3AFFf,C + β4HQf,C +
+β5DSf,j,C + β6USf,j,C + δf + δC + ηf,C .(8)
4If we had a firm-to-firm IO matrix, we could construct the simple index DS∗f,C =∑
g IOgf IMg,C ,
where IOgf if the share of spending by firm f on inputs supplied by firm g in f ’s total output (thefirm-to-firm direct requirement coefficient), and IMg,C is, as defined above, the indicator for whether gimports from C. The “ideal” index DS∗f,C would be a precise measure of whether firm f sources inputs
from directly connected firms or not. In the absence of firm-to-firm IO information, INPUTINTf IOij
is our best guess for IOgf , andNIMi,C
Niis an estimate for how likely it is that IMg,C = 1.

10 THE AMERICAN ECONOMIC REVIEW MONTH YEAR
B. From Micro to Macro
Next, we investigate the macroeconomic implications of these micro findings.The aggregate correlation as written in (4) is additive in the individual firm-level correlations with foreign GDP, and thus can be decomposed easily into thevarious components. Since we are interested in the impact of individual firmson aggregate correlations, we can decompose the aggregate growth rate into thecontribution of two sets of firms: the directly connected and the not directlyconnected to a particular country:
(9) γAt =∑f
wft−1γft =∑f∈IC
wft−1γft +∑f∈IcC
wft−1γft,
where IC is the set of firms that satisfy at least one of the four criteria includedin estimating equation (5): (i) export to C; (ii) import from C; (iii) is a Frenchaffiliate of a multinational based in C; or (iv) is part of a French multinationalthat has affiliates in C. Correspondingly, IcC is the complement of that set of firms.Plugging (9) into (3), the aggregate comovement decomposes additively into twocomponents, one due to the directly connected firms, and the other due to therest:
(10) ρ (γAt, γCt) =σICσA
ρ
∑f∈IC
wft−1γft, γCt
+σIcCσA
ρ
∑f∈IcC
wft−1γft, γCt
,
where σ2IC
= Var(∑
f∈IC wft−1γft
)is the variance of the combined value added
of the directly connected terms, and similarly for σ2IcC
. By bringing in information
on firm weights wft−1, this additive decomposition will provide the first glimpseof whether the directly connected firms combined are a large enough segment ofthe economy to play an appreciable role in aggregate comovement.
Of course, this decomposition yields only part of the answer: the direct compo-nent can be large either because the directly connected firms are large, or becausethey are more correlated. An accounting exercise that uses estimates of equation(5) provides the means of separating the two. For each directly connected firm,we can compute the predicted change in its correlation with country C if it wereno longer connected with C:(11)
∆ρ (γft, γCt) = −β11 (EXf,C = 1)−β21 (IMf,C = 1)−β31 (AFFf,C = 1)−β41 (HQf,C = 1) .
As an example, if firm f only exported to C and had no other links, the predictedchange in the correlation between f and C is simply −β1. The formulation (11)allows for every combination of different types of direct links, and turns off allthe existing ones at the same time.
Combining (11) with (4), the predicted change in the aggregate business cycle
VOL. VOL NO. ISSUE MICRO ORIGINS OF INTERNATIONAL COMOVEMENT 11
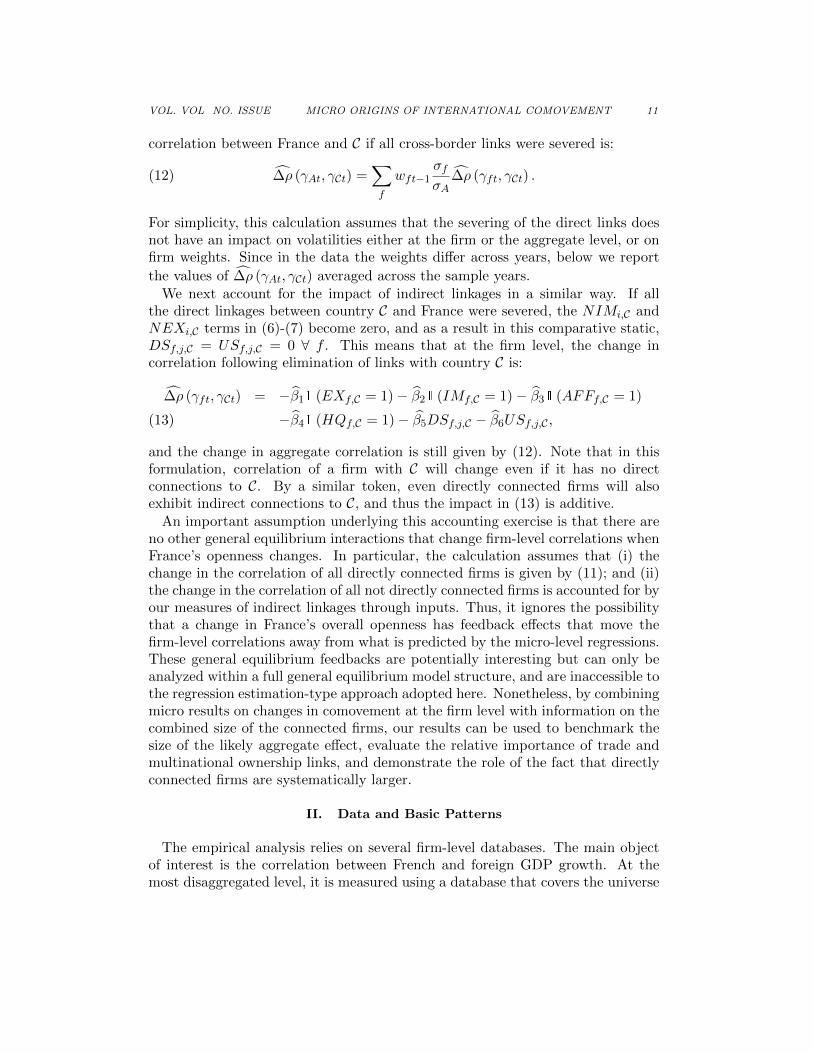
correlation between France and C if all cross-border links were severed is:
(12) ∆ρ (γAt, γCt) =∑f
wft−1σfσA
∆ρ (γft, γCt) .
For simplicity, this calculation assumes that the severing of the direct links doesnot have an impact on volatilities either at the firm or the aggregate level, or onfirm weights. Since in the data the weights differ across years, below we report
the values of ∆ρ (γAt, γCt) averaged across the sample years.We next account for the impact of indirect linkages in a similar way. If all
the direct linkages between country C and France were severed, the NIMi,C andNEXi,C terms in (6)-(7) become zero, and as a result in this comparative static,DSf,j,C = USf,j,C = 0 ∀ f . This means that at the firm level, the change incorrelation following elimination of links with country C is:
∆ρ (γft, γCt) = −β11 (EXf,C = 1)− β21 (IMf,C = 1)− β31 (AFFf,C = 1)
−β41 (HQf,C = 1)− β5DSf,j,C − β6USf,j,C ,(13)
and the change in aggregate correlation is still given by (12). Note that in thisformulation, correlation of a firm with C will change even if it has no directconnections to C. By a similar token, even directly connected firms will alsoexhibit indirect connections to C, and thus the impact in (13) is additive.
An important assumption underlying this accounting exercise is that there areno other general equilibrium interactions that change firm-level correlations whenFrance’s openness changes. In particular, the calculation assumes that (i) thechange in the correlation of all directly connected firms is given by (11); and (ii)the change in the correlation of all not directly connected firms is accounted for byour measures of indirect linkages through inputs. Thus, it ignores the possibilitythat a change in France’s overall openness has feedback effects that move thefirm-level correlations away from what is predicted by the micro-level regressions.These general equilibrium feedbacks are potentially interesting but can only beanalyzed within a full general equilibrium model structure, and are inaccessible tothe regression estimation-type approach adopted here. Nonetheless, by combiningmicro results on changes in comovement at the firm level with information on thecombined size of the connected firms, our results can be used to benchmark thesize of the likely aggregate effect, evaluate the relative importance of trade andmultinational ownership links, and demonstrate the role of the fact that directlyconnected firms are systematically larger.
II. Data and Basic Patterns
The empirical analysis relies on several firm-level databases. The main objectof interest is the correlation between French and foreign GDP growth. At themost disaggregated level, it is measured using a database that covers the universe

12 THE AMERICAN ECONOMIC REVIEW MONTH YEAR
of French firm sales and value added over the period 1993-2007. The datasetis described in detail in di Giovanni et al. (2014). Importantly, it covers theentire French economy, manufacturing and non-manufacturing sectors included.We augment it with information on each firm’s direct trade and multinationallinkages, disaggregated by foreign partner country. Namely, we use Customs datato recover bilateral export and import flows, at the level of each individual firm.Finally, information on the firm ownership linkages is taken from the LIaisonsFInancieres (LIFI) database, an administrative dataset that provides informationabout the ownership and nationality of the parent company of firms located inFrance. Together, these two datasets provide firm-level information on all possibledirect links to each individual foreign country, whether through cross-border tradeor multinational production. Finally, note that we do not have any informationat the plant level.
The value added data, as well as additional variables, come from the balancesheet information collected from firms’ tax forms. The original dataset is quasi-exhaustive. However, the amount of information that has to be provided to thefiscal administration differs according to the firm’s size. Namely, the French taxsystem distinguishes three different regimes, the “normal” regime (called BRN forBenefice Reel Normal), the “simplified” regime (called RSI for Regime Simplified’Imposition) that is restricted to smaller firms, and the “micro-BIC” regimefor entrepreneurs.5 Throughout the exercise, “micro-BIC” and “RSI” firms areexcluded. We do not have enough information for “micro-BIC” firms. We alsoexclude “RSI” firms, both because their weight in annual sales is negligible andbecause it is difficult to harmonize these data with the rest of the sample. In2007, those firms represented less than 4% of total sales and about 11% of to-tal employment. Thus, our sample represents the bulk of the aggregate Frencheconomy. In this sample, it is possible to classify firms according to the sector inwhich they operate, using information on their NAF code.6
The information collected by the tax authorities is combined with the firm-level export and import data from the French customs authorities. The datasetscan be merged using a unique firm identifier, called SIREN. On top of the firmdimension, the customs data also detail trade flows by their country of destination(for exports) or the country of origin (for imports). This information makesit possible to investigate the heterogeneity of trade linkages within firm acrossdifferent foreign countries. The customs data are also quasi-exhaustive. There isa declaration threshold of 1,000 euros for annual exports to and annual imports
5Under some conditions, firms can choose their tax regime. In 2010, an individual entrepreneur candecide to enroll in the “micro-BIC” regime if its annual sales are below 80,300 euros. Likewise, a firmcan choose to participate in the RSI rather than the BRN regime if its annual sales are below 766,000euros (231,000 euros in services). Those thresholds are adjusted over time, but marginally so.
6“NAF”, Nomenclature d’Activites Francaise, is the French industrial classification. Our baselineanalysis considers the level of aggregation with 114 sectors. This corresponds to the 3-digit ISIC (Revision3) nomenclature. We drop NAF sectors 95 (domestic services), and 99 (activities outside France). Wealso have to neglect the banking sector due to important restructuring at the beginning of the 2000s thatmakes it difficult to follow individual firms.

VOL. VOL NO. ISSUE MICRO ORIGINS OF INTERNATIONAL COMOVEMENT 13
from any given destination outside the European Union. Below the threshold, thecustoms declaration is not compulsory. Since 1993, intra-EU trade is no longerliable for any tariff, and as a consequence firms are no longer required to submitthe regular customs form. A new form has however been created that tracks intra-EU trade. Unfortunately, the declaration threshold for this kind of trade flows inmuch higher, around 150,000 euros per year in 2010. A number of firms continuedeclaring intra-EU trade flows below the threshold however, either because theydon’t know ex ante that they will not reach the 150,000 Euro limit in a given fiscalyear, because they apply the same customs procedure for all export markets theyserve, or because they delegate the customs-related tasks to a third party (e.g.,a transport firm) that systematically fills out the customs form. Below-cutofftrade flows missing from customs data imply that we might underestimate thecontribution of direct trade linkages as a driver of aggregate comovement.7
The customs data include only trade in goods, and thus firm-level informationon trade in services is missing from our analysis. Data on services trade are notcollected by customs authorities and are thus considerably more spotty. Accordingto the OECD, in the later half of our sample period services trade accounted forabout 20% of overall (goods plus services) French imports and exports. Note thatour production, goods trade, and multinational indicator data include servicesector firms, and our indirect transmission measures in (6) and (7) incorporatedomestic service sector linkages. Nonetheless, if there are firms that trade servicesbut not goods, the analysis below understates the extent of direct linkages toforeign countries, and thus the contribution of direct linkages to comovement. Itis not clear how large that understatement is, both because we do not observethe magnitude of the service trade at the firm level, and because we do not knowwhether the comovement impact of service trade is different from that of goodstrade.
Finally, the LIFI data are used to get information on i) whether each Frenchfirm is an affiliate of a company headquartered in a particular foreign country,or ii) whether each firm is, or belongs to, a French company that owns foreignaffiliates in a particular foreign country. The LIFI database is constructed bythe French statistical institute (INSEE). It is not exhaustive, but it has a goodcoverage. All firms with more than 500 employees or a turnover above 60 millioneuros, whatever their sector of activity, are included in the survey. Moreover,the information is complemented with two additional administrative sources thatcontain information on a large number of smaller groups. According to the Frenchstatistical institute, a firm is an affiliate of a group if the group has the (direct orindirect) majority of voting rights. Using this definition, INSEE identifies firms
7We can judge how many exports we are missing by comparing exports declared on tax forms toexports declared to customs. It appears that the problem is relatively minor. In 10% of firm-yearobservations, the tax form reports exports but the customs data do not. These observations account for7% of overall exports. On average, the total exports reported in the tax form but missing from customs(413,000 euros per year) are an order of magnitude smaller than average exports in the whole sample,which are 3,056,000.

14 THE AMERICAN ECONOMIC REVIEW MONTH YEAR
that own affiliates abroad, together with the nationalities of those affiliates. Whenthe French firm is identified as an affiliate of a foreign company, the nationalityof the parent group is recorded as well.
The firm-level correlation coefficients are measured using the time dimensionof the value added data, at the firm level. All the firm-level growth rates aredeflated with the French GDP deflator.8 On the other hand, the empirical strat-egy does not use the time variability of measures of each firm’s direct links witheach destination country. To construct the dummies for whether a firm exports(EXf,C), imports (IMf,C), has affiliates in the destination (AFFf,C) or is anaffiliate of a foreign multinational firm (HQf,C) the time dimension is thus col-lapsed. Namely, in the baseline analysis the dummy is set to 1 whenever thefirm satisfies the corresponding condition over at least one year in the period ofobservation.9 The numbers of firms in each sector that import and export usedin the indirect linkage indicators, NIMi,C and NEXi,C , are defined consistentlywith the direct linkage indicators and are simply sector-level summations of those,e.g. NIMi,C =
∑f∈i IMf,C . Throughout the analysis, we winsorize the firm-level
growth rates to be bounded by +100% and −50% to reduce the impact of outliers.Figure 1 plots the growth rates of aggregate value added, exports, and imports,
together with the growth rate of GDP from IMF’s International Financial Statis-tics, and total exports and imports from IMF’s Direction of Trade Statistics. Theaggregates in our sample of firms mimic the aggregate data from standard sourcesquite well.
Figure 2 reports the scatterplot of the aggregate correlations with the 10 maintrading partner countries implied by our data and the GDP correlations fromstandard sources, along with a 45-degree line. It is clear that our data captureboth the levels and the variation in aggregate comovement extremely well. Thecorrelation between the business cycle comovement implied by our data and bystandard GDP data is 0.992.
Table 1 presents the basic stylized facts on the composition of the sample.Panel A reports the summary statistics for the whole economy, separately forexporters, importers, affiliates of foreign multinationals, and French firms withforeign affiliates. These four categories are of course not mutually exclusive.The table reports the total numbers of observations and firms, the mean andmedian value added in each category, and the percentage of total value addedcaptured by each category of firms. There are about a million firms in total.As expected, firms engaged in an international activity represent a minority ofthe population of French firms. Around 20% of French firms export or importat all. There are an order of magnitude more trading firms than multinationals:about 200,000 importers and exporters, compared to 30,000 affiliates of foreign
8Firm-level value added deflators are not available for France. However, since GDP is also deflatedwith the GDP deflator, real firm-level growth rates defined this way aggregate to the real GDP growthrate as in (1).
9The results are robust to instead defining the dummy to equal 1 whenever the firm is connected forat least 50% of the years it is present in the sample.
VOL. VOL NO. ISSUE MICRO ORIGINS OF INTERNATIONAL COMOVEMENT 15
multinationals, and 1,786 French firms that have foreign affiliates. Each categoryof the internationally connected firms has larger average value added than purelydomestic firms. The largest category on average is French multinationals withaffiliates abroad.
More novel is the information in the last column that reports the share of totalvalue added in France that is taken up by each category of firms. These statisticshave not, to our knowledge, been previously reported. It turns out that importersaccount for 72% of total French value added, and exporters 71%. By contrast,multinational firms account for a smaller share of economic activity, with about25% for foreign affiliates in France, and 14% for French-owned multinationals.
Panels B and C of Table 1 report the same statistics for the manufacturingsector and its complement. The manufacturing sector is not surprisingly moreinternationally integrated, with exporters and importers taking up around 93%of total manufacturing value added. The non-manufacturing sector still exhibitssubstantial cross-border linkages, with over 60% of the value added in the non-manufacturing sector accounted for by firms that trade, and 18% by firms thathave multinational linkages.10
To get a better sense of the composition of the manufacturing and the non-manufacturing sectors, online Appendix Table A1 presents the summary statisticsby 2-digit NAF sector. It reports the share of firms in each sector that exhibitany international linkage (trade or multinational) to any country, the share of thetotal sectoral value added accounted for by the connected firms, and the shareof the sector in the aggregate French value added. Manufacturing correspondsto NAF sectors 15 through 37. The table highlights the extent to which themanufacturing sector in France is dominated by internationally connected firms.Connected firms represent well over half of all firms, and the vast majority ofvalue added in manufacturing. At the same time, the non-manufacturing sectorexhibits substantial cross-border linkages. Connected firms comprise over 80% ofsectoral value added in Electricity, Gas, and Water Supply, Wholesale and RetailTrade, Transport, and Post and Telecommunications, among others. Multina-tional presence is an important mode of international integration in these sectors.Indeed, Electricity, Gas, and Water Supply, Wholesale and Retail Trade, Trans-port, and Post and Telecommunications together account for 85% of the valueadded of foreign multinational affiliates operating in France.
To highlight the similarities and differences between manufacturing and non-manufacturing sectors, we report the full set of results for each of these separatelyin the Appendix.
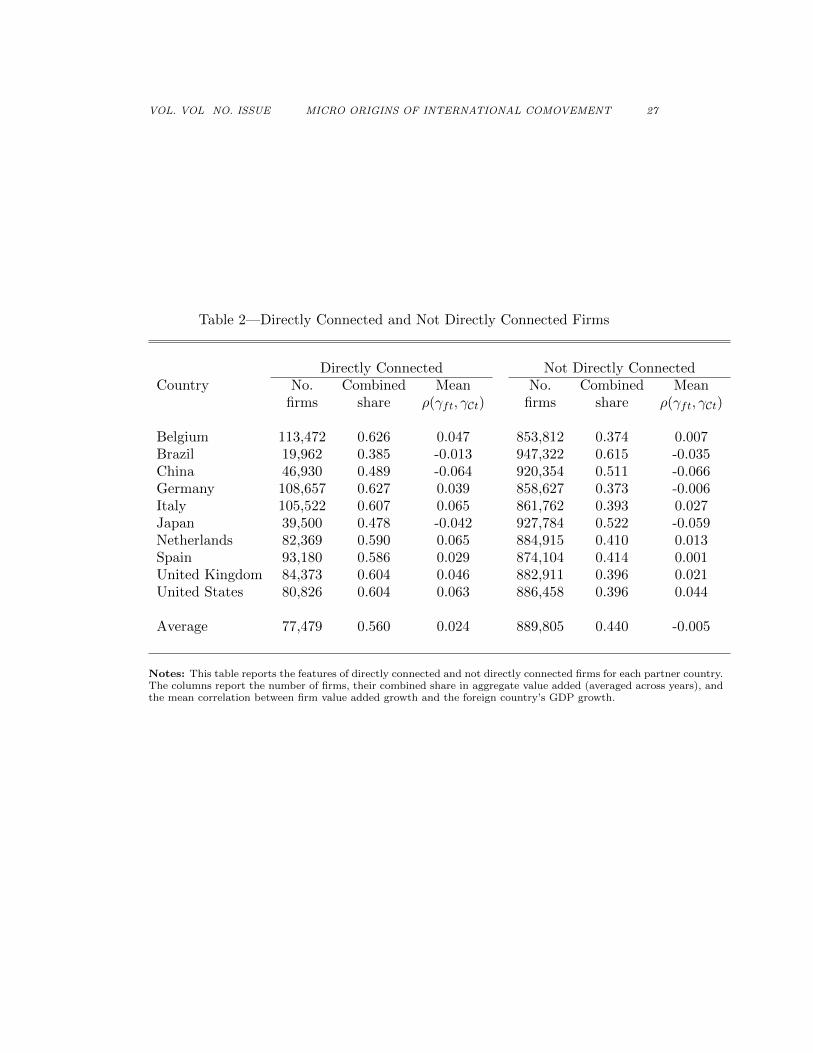
Table 2 reports the measures of connectedness and firm-level correlations withFrance’s 10 major trading partner countries.11 For each country, the table presents
10There is a small discrepancy between the total number of firms in Panel A and the sum of thenumbers of firms in Panel B and C, due to the fact that some firms changed sectors during our sampleperiod. Thus, a small minority of firms will appear in both subsamples, in different years.
11These countries are 9 of the top 10 trading partners of France plus Brazil, which we included as amajor emerging market to make the sample more diverse and less dominated by European countries.

16 THE AMERICAN ECONOMIC REVIEW MONTH YEAR
the number of directly connected firms, the combined share of those firms in totalFrench value added, and the mean correlation between an individual firm and theGDP growth of that country. The last three columns report the same statisticsfor the not directly connected firms.
On average, and for most individual countries, there are an order of magnitudefewer directly connected firms than non-directly connected firms. At the mean,there are 77,000 directly connected, and about 890,000 not directly connectedfirms. However, the directly connected firms take up on average 56% of totalFrench value added. For every single partner country, the directly connectedfirms are more correlated with the foreign GDP, with an average difference incorrelation of 0.029 between the directly connected and not connected firms inthis set of countries.12 The variation across countries is as expected. In the4 countries most closely integrated with France – Belgium, Germany, the UK,and Italy – the directly connected firms account for about 60% of all Frenchvalue added. At the other extreme, the firms directly connected to Brazil, China,and Japan account for 0.385, 0.489, and 0.478 of aggregate French value added,respectively.
Online Appendix Table A2 reports the same statistics for the manufacturingand the non-manufacturing sectors separately. The role of the directly connectedfirms is greater in manufacturing, where they account for 80% of total value added,even though they comprise less than one quarter of all the firms in this subsample.On the flip side, in the non-manufacturing sector, firms directly connected to aparticular country comprise only 44% of the value added on average. The averagecorrelations are slightly higher for the connected manufacturing firms comparedto the non-manufacturing sector.
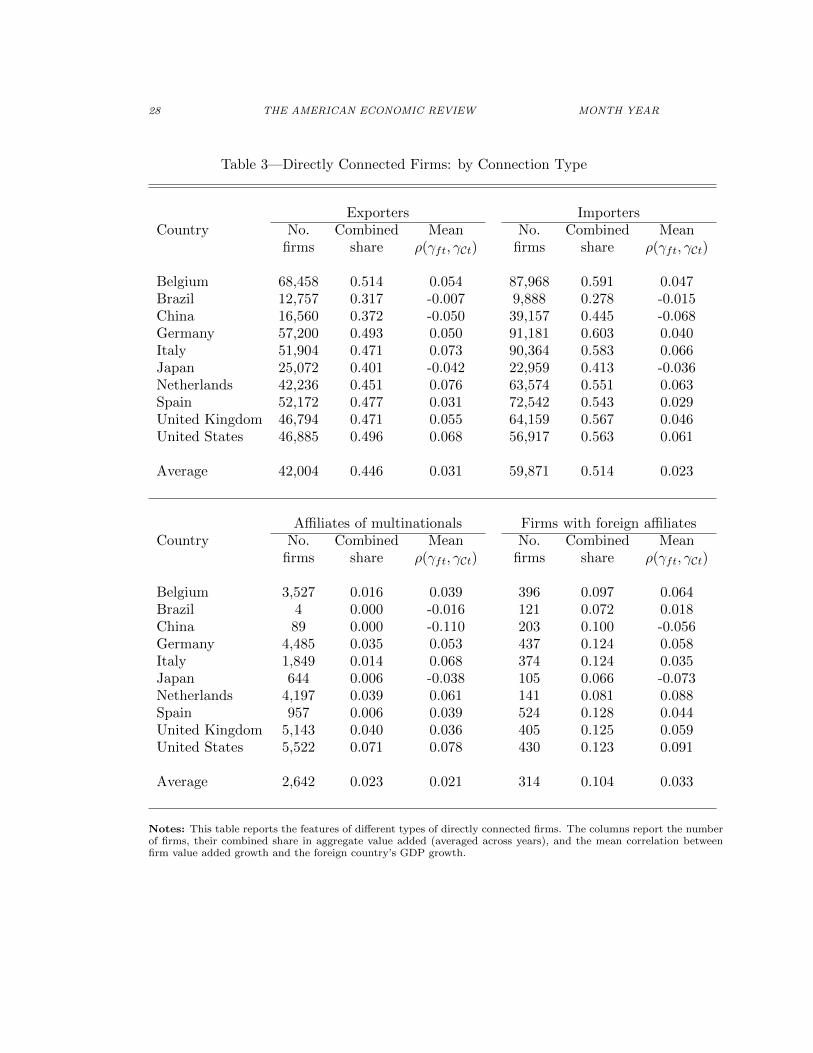
Table 3 further separates the directly connected firms into importers, exporters,and foreign and domestic multinationals. Once again, the categories are not mu-tually exclusive. There are large differences between the trading firms and themultinationals. Directly connected exporters and importers account for 45 and51 percent of aggregate French value added for this set of foreign countries, or thelarge majority of the total value added of connected firms. By contrast, affiliates offoreign multinationals from an individual country take up 2.3% of aggregate valueadded. French firms with foreign affiliates account for 10.4% of aggregate valueadded. There are also many fewer multinational firms of both kinds than tradingfirms. Online Appendix Table A3 presents the same statistics for manufacturingand non-manufacturing. In manufacturing, both importing and exporting firmsaccount for over 70% of aggregate value added. In non-manufacturing, importingis a considerably more important form of direct connectedness than exporting.
12The reason that the absolute values of these firm-level correlations are quite small can be gleanedfrom (4), which shows that aggregate correlation is a combination of firm-level correlations and theratio of firm-level standard deviations to the aggregate standard deviation. Since firm-level standarddeviations of value added growth are much larger than the aggregate (see, e.g. di Giovanni et al., 2014),the individual correlations must be small to be consistent with the observed aggregate correlations suchas those reported in Figure 2.

VOL. VOL NO. ISSUE MICRO ORIGINS OF INTERNATIONAL COMOVEMENT 17
This is intuitive: even firms that do not produce tradeable goods can import.(Recall however that we do not have data on service trade. Thus, these summarystatistics understate the non-manufacturing firms’ connectedness through export-ing if they engage in substantial service exports.) Another difference betweenmanufacturing and non-manufacturing is that French multinationals account fora higher share of total value added in non-manufacturing.
III. Main Results
A. Firm-Level Linkages and Correlations
Table 4 reports the results of estimating (5). The baseline sample includesall firms, and performs the analysis on the growth rates of value added. Thestandard errors are clustered at the firm level. The first column presents thebasic estimation without any fixed effects. All four forms of connectedness arepositive and strongly significant. The coefficient magnitudes are sizeable as well.Importing or exporting is associated with increases in the correlation of 0.029 and0.035 respectively. Being a French multinational with affiliates in a particularcountry increases correlation with that country by 0.023. Foreign affiliates inFrance have a 0.028 higher correlation with the parent country. The next columnadds firm fixed effects. In this specification, the coefficients are estimated fromthe variation within the same firm across the 10 partner countries. Some of thepoint estimates fall somewhat, but all four types of connectedness remain positiveand strongly significant.13
The next column adds country effects. Given that this specification adds only 10dummy variables to a regression with over 8 million observations, it is remarkablehow dramatically the coefficients change. The importer coefficient falls by a factorof 2, and the exporter coefficient by a factor of 4. Both multinational coefficientsdecrease and one of them ceases to be statistically significant. This change inthe coefficients is a stark illustration of the key tension in the Frankel-Rose typeestimation: disentangling transmission of shocks through trade from commonshocks.
By using firm-level data, we can control much better for the common shocksthat affect France and its trading partners. The contrast between the specifi-cations with and without country effects shows why it is important to do so.Without country effects (and even after including firm effects), it looks like di-rectly connected firms are strongly correlated with the markets with which theyare linked. However, it is clear that a large part of these estimated coefficientsis due to the fact that firms are more likely to establish direct links with morecorrelated markets. Adding country effects controls for the average correlation
13There are fewer firms in the regression sample than in the full sample summarized in Table 1 becausewe drop firms only present in the sample for 2 years or less, as for those firms the correlation with eachforeign country is trivially −1 or 1.

18 THE AMERICAN ECONOMIC REVIEW MONTH YEAR
between French firms and each country, and reduces the estimated impact ofdirect connectedness considerably.
Nonetheless, column 3 shows that even after controlling for common shocks,direct linkages increase comovement between a firm and the foreign country. Adirect importing link is associated with an increase in the firm-level correlationof 0.013, and an exporting link of 0.005. Foreign affiliates in France have 0.010higher correlation with their parent country. Relative to the mean correlation ofabout 0.024 for the directly connected firms, these coefficients are still sizeable.
The rest of the table checks robustness of the results to alternative specifi-cations. Column 4 checks whether the results are driven by omitted regionalvariation within France, by using foreign country×departement effects instead offoreign country effects. A departement is a relatively small French region: thereare 96 departements in metropolitan France. These fixed effects control for anydifferences in correlation between firms in individual French regions and foreigncountries. Column 5 instead adds foreign country×sector effects. These controlfor any differences between how individual French sectors are correlated with for-eign countries. This may matter if sector j in France experiences common shockswith a foreign country. An important special case is that firms belonging to sec-tor j experience common shocks in both France and C, which would translateinto a greater correlation of all firms in France that belong to sector j and thatforeign country. By a similar token, these fixed effects control for any commoncorrelation between the sectoral price indices in France and each foreign country.In both cases the results are virtually identical to the baseline. Column 6 usesthe correlation of firm sales instead of value added. The results are stronger thanin the baseline.
Online Appendix Tables A4 and A5 replicate all the results using the samplesof manufacturing and non-manufacturing firms, respectively. All the coefficientmagnitudes, patterns of significance, and substantive conclusions are very similarin the two subsamples. These results suggest that while there may be differencesbetween the firms in manufacturing and non-manufacturing sectors, the ultimaterole of direct linkages in generating cross-border comovement at the firm level isquite similar in these two sets of firms.
Table 5 presents the results of estimating (8), that includes indirect linkages.Column 1 presents the baseline specification with firm and country effects. Thecoefficients on the indirect linkage variables are strongly significant. The coeffi-cient on DSf,j,C is positive, indicating that foreign shocks transmitted throughthe firm’s input suppliers that import from abroad increase comovement. Thecoefficient on USf,j,C is actually negative (though small in magnitude). To under-stand the results better, columns 2 reports the estimates including country×sectoreffects. These will further absorb the variation across sectors, but are very de-manding for the purposes of estimating the impact of DSf,j,C and USf,j,C , sincethose indicators rely largely on sector-level variation. The coefficient on DSf,j,Ccontinues to be positive and significant, but falls considerably in magnitude. The

VOL. VOL NO. ISSUE MICRO ORIGINS OF INTERNATIONAL COMOVEMENT 19
coefficient on USf,j,C flips sign and becomes positive and significant. We concludethat the impact of downstream indirect linkages is clearly detectable in the dataand robustly positive. By contrast, the importance of upstream linkages (i.e.,supplying inputs to exporting firms) is less clear in the data, with the sign andsignificance sensitive to sample and fixed effects configuration. As a side note,including indirect linkages has virtually no impact on the size and pattern ofsignificance of the direct linkage coefficients.
The finding that the downstream terms are more robustly associated with co-movement than the upstream terms lends support to the recent but growinginput-output network literature, that tends to emphasize downstream propaga-tion of shocks (Carvalho, 2010; Acemoglu et al., 2012; Baqaee, 2016; Carvalho etal., 2016; Atalay, 2017).
Online Appendix Table A6 reports the results for the manufacturing and non-manufacturing samples separately. The manufacturing sample yields larger andmore robust coefficients than in the whole economy. However, for the non-manufacturing sector the pattern is much less consistent. Thus, indirect linkagesappear to have their most clear-cut impact in the manufacturing sector. Since themanufacturing and non-manufacturing sectors are likely to have quite differentproduction functions and market structures, it is not surprising that there are im-portant heterogeneities between sectors in the role of upstream and downstreamlinkages in generating comovement. Baqaee (2016), Carvalho et al. (2016), andAtalay (2017) show that the sign and strength of propagation of shocks across sec-tors is determined by the elasticity of substitution across inputs. Grassi (2016)demonstrates that the nature of upstream propagation depends on the marketstructure.
An interesting question is whether connectedness through trade and multina-tional links interact in important ways. One may conjecture, for instance, thatfirms that are part of the same multinational will comove more when they tradecompared to firms that trade at arm’s length. Table 6 checks this possibility. Inorder to avoid an excessively large set of interaction terms that is possible between4 variables, we condense the set of indicators to two: whether the firm trades witha country and whether it is a part of a multinational with a presence in that coun-try. Column 1 checks whether these coarser indicators significantly increase thecorrelation with the foreign GDP. Column 2 augments the specification with theinteraction between the two. It seems that there is no prima facie evidence of aninteraction effect: the coefficient is close to zero at 0.001 and insignificant.
To summarize, direct connectedness through importing, exporting, and foreignparent firms is robustly positively associated with greater comovement betweena firm and foreign GDP. This effect is identified from the variation across foreigncountries within the firm (i.e., by comparing the firm’s correlation with a countrythat it trades with to its correlation with a country that it does not), and aftercontrolling for common aggregate shocks. Thus, this result can be interpreted asrobust evidence for transmission of shocks through trade and multinational links.

20 THE AMERICAN ECONOMIC REVIEW MONTH YEAR
In addition, indirect linkages to downstream firms are robustly positively associ-ated with increased comovement at the firm level, especially in the manufacturingsector.
B. Aggregate Implications
Table 7 presents the decomposition in (10). For each country, it reports theaggregate correlation ρ (γAt, γCt), as well as the two components of the aggregatecorrelation on the right-hand side of (10), namely those due to the directly andnot directly connected firms. On average, 67% of the aggregate correlation istaken up by the directly connected firms. The shares are between zero and onein all but one case (the UK), implying that the direct and indirect componentstend to have the same sign as the overall correlation. Online Appendix Table A7breaks down the sample between manufacturing and non-manufacturing firms. Inthe manufacturing sector, the observed correlations are on average higher, andthe average share taken up by the directly connected firms is larger at 84%.
This decomposition is merely suggestive that direct links are responsible forthe observed aggregate comovement. (10) shows that the direct component couldbe large both because the directly connected firms account for the large shareof the economy, and/or because they exhibit larger correlations with the foreigncountry. Table 2 shows indeed that both of those things are true. However,the higher correlations reported for the directly connected firms in the table arenot necessarily evidence of transmission of shocks. To isolate the role of thetransmission of shocks, we next make use of the econometric estimation results.
We first compute, based on each firm’s connectedness values, how much itscorrelation with each country would change if it were no longer connected to thatcountry, as in (11). For all firms that are not connected at all to a particularcountry, this change is zero. We then aggregate according to (12). This equationtakes into account the interaction between relative firm sizes (wf ) and connect-edness: the impact on aggregate comovement would be greater, all else equal, ifthe connected firms took up a larger share of aggregate value added.
Table 8 presents the results of computing the change in the aggregate correlationas in (12). It reports the actual correlation in the data, the predicted change inthe correlation if none of the firms were connected, and the standard error forthat predicted change in correlation. On average the aggregate correlation woulddecrease by about 0.098 if firms stopped being connected. By comparison, themean actual observed correlation is 0.291.
An interesting question is whether the change in aggregate correlation is drivenby trade in goods or multinational linkages. Examining (11), it is clear that thechange in aggregate correlation is simply additive in the weighted contributionof trade links (captured by the EX and IM coefficients) and the multinationallinks. Of course, these are not mutually exclusive for each firm, as a single firmcan be in up to 3 of these categories at the same time. However, the breakdownof the aggregate effect into those two components can still be suggestive of the

VOL. VOL NO. ISSUE MICRO ORIGINS OF INTERNATIONAL COMOVEMENT 21
relative importance of those effects.Columns 4-7 of Table 8 separate the contribution of trade linkages (denoted
by ∆ρA|Trade), and of the multinational linkages (∆ρA|MNE) to aggregatecomovement. It turns out that the bulk of the aggregate effect is due to trade.On average, trade linkages account for more than 90% of the total (0.090 out of0.098).
Finally, we check to what extent the fact that the largest firms tend to be sys-tematically more internationally connected contributes to the aggregate impactof direct linkages. To that end, we construct the change in the aggregate comove-ment that would obtain if all firms were of equal size: wf = 1/N ∀f in (12), withN the total number of firms. The results are presented in columns 8-9 of Table8, labeled ∆ρA|Eq.W . The change in the aggregate correlation is substantiallysmaller, 0.024. That is, the fact that the larger firms are systematically morelikely to exhibit international linkages roughly quadruples the impact of directlinkages on international comovement.
Online Appendix Table A8 presents the results separately for the manufacturingand the non-manufacturing sectors. In the manufacturing sector, the impact islarger in absolute terms, with the severing of direct linkages leading to a fall incorrelation of 0.103 on average, relative to the mean observed correlation of 0.484.For the non-manufacturing sector, the absolute impact is more modest at −0.063,but the correlation of the non-manufacturing sector with the foreign countries isalso lower, at 0.111 on average.
We now compute the change in aggregate correlation taking indirect linkagesinto account. While the direct linkage coefficients are remarkably similar in themanufacturing and non-manufacturing samples, online Appendix Table A6 re-veals that upstream and downstream indirect linkage coefficients exhibit quitedifferent patterns in these two sets of firms. Our aggregation exercise thus takesthis heterogeneity into account, by applying subsample-specific coefficients to theDSf,j,C and USf,j,C terms for manufacturing and non-manufacturing firms.14
Column 2-3 of Table 9 report the results. The predicted change in aggregatecorrelation is now larger at −0.199. Columns 4-9 break down the change in theaggregate correlation into the components due to direct and indirect linkages.15
Because DSf,j,C and USf,j,C coefficients differ across the two subsamples, we re-port the aggregate contributions of indirect linkages separately for manufacturingand non-manufacturing. Direct linkages account for an average of −0.082 of the−0.199 total effect.
Indirect linkages together actually contribute more than half of the overall ef-fect, −0.117 on average. The entire contribution of indirect linkages to increasingcomovement is driven by the manufacturing subsample, which is responsible for
14Precisely, we run a regression on the whole sample, but allowing DSf,j,C and USf,j,C and countryfixed effects to differ for manufacturing and non-manufacturing firms. The results (not reported toconserve space) are very similar to the coefficients in online Appendix Table A6.
15This exercise uses the direct linkage coefficients from the specification that includes indirect linkages,and thus column 4 of Table 9 does not match exactly column 2 of Table 8 (though it is close).

22 THE AMERICAN ECONOMIC REVIEW MONTH YEAR
a −0.153 correlation change if links are severed. The point estimate of the in-direct linkage contribution in the non-manufacturing sample is actually positive,implying that the non-manufacturing indirect links lower comovement, by 0.036on average. We do not draw sharp conclusions from either the sign or the sizeof this effect, as the non-manufacturing indirect linkage coefficient estimates arenot reliable. Online Appendix Table A6 shows that the signs of the coefficientson the two indirect linkage coefficients are not even stable across country andcountry×sector effects. All in all, however, we find a strong and robust positivecontribution of indirect linkages to comovement, driven by the manufacturingsector.
IV. Conclusion
In order to understand fluctuations at the macro level, we must understandmicro-level behavior. This paper applies this principle to international businesscycle comovement by analyzing this phenomenon at the firm level. Because thelargest firms are the most likely to exhibit direct cross-border linkages, we showthat the internationally connected firms account for over half of French aggregatevalue added. We next show that they are more correlated with the countries towhich they are directly connected through trade and ownership links. Combiningthe two, if direct linkages were severed the aggregate correlations would fall byabout one-third of the observed aggregate correlations in the data. We provideevidence of downstream linkages as well: firms that buy inputs from French firmsthat import from foreign markets tend to be more correlated with those foreignmarkets. Direct and indirect linkages combined can account for two-thirds ofthe observed aggregate comovement between the overall French economy and itstrading partners.
REFERENCES
Acemoglu, Daron, Ufuk Akcigit, and William Kerr, “Networks and theMacroeconomy: An Empirical Exploration,” NBER Macroeconomics Annual2015, 2016, 30, 276–335.
, Vasco M. Carvalho, Asuman Ozdaglar, and Alireza Tahbaz-Salehi,“The Network Origins of Aggregate Fluctuations,” Econometrica, September2012, 80 (5), 1977–2016.
Alessandria, George and Horag Choi, “Do Sunk Costs of Exporting Matterfor Net Export Dynamics?,” Quarterly Journal of Economics, 2007, 122 (1),289–336.
Arkolakis, Costas and Ananth Ramanarayanan, “Vertical Specializationand International Business Cycle Synchronization,” Scandinavian Journal ofEconomics, December 2009, 111 (4), 655–680.

VOL. VOL NO. ISSUE MICRO ORIGINS OF INTERNATIONAL COMOVEMENT 23
Atalay, Enghin, “How Important Are Sectoral Shocks?,” June 2017. Forthcom-ing, American Economic Journal: Macroeconomics.
Backus, David K., Patrick J. Kehoe, and Finn E. Kydland, “InternationalBusiness Cycles: Theory and Evidence,” in Thomas Cooley, ed., Frontiers ofbusiness cycle research, Princeton: Princeton University Press, 1995, pp. 331–356.
Baqaee, David Rezza, “Cascading Failures in Production Networks,” Septem-ber 2016. Mimeo, LSE.
Baxter, Marianne and Michael A. Kouparitsas, “Determinants of BusinessCycle Momovement: A Robust Analysis,” Journal of Monetary Economics,January 2005, 52 (1), 113–57.
Blonigen, Bruce A., Jeremy Piger, and Nicholas Sly, “Comovement inGDP trends and cycles among trading partners,” Journal of International Eco-nomics, November 2014, 94 (2), 239 – 247.
Boehm, Christoph, Aaron Flaaen, and Nitya Pandalai Nayar, “InputLinkages and the Transmission of Shocks: Firm-Level Evidence from the 2011Tohoku Earthquake,” October 2015. Finance and Economics Discussion Series2015-094. Washington: Board of Governors of the Federal Reserve System,http://dx.doi.org/10.17016/FEDS.2015.094.
Burstein, Ariel, Christopher Kurz, and Linda L. Tesar, “Trade, Produc-tion Sharing, and the International Transmission of Business Cycles,” Journalof Monetary Economics, 2008, 55, 775–795.
Calderon, Cesar, Alberto Chong, and Ernesto Stein, “Trade Intensity andBusiness Cycle Synchronization: Are Developing Countries any Different?,”Journal of International Economics, 2007, 71 (1), 2–21.
Carvalho, Vasco M., “Aggregate Fluctuations and the Network Structure ofIntersectoral Trade,” October 2010. Mimeo, CREi and Universitat PompeuFabra.
and Basile Grassi, “Large Firm Dynamics and the Business Cycle,” May2015. CEPR Discussion Paper 10587.
and Xavier Gabaix, “The Great Diversification and its Undoing,” AmericanEconomic Review, August 2013, 103 (5), 1697–1727.
, Makoto Nirei, Yukiko U. Saito, and Alireza Tahbaz-Salehi, “SupplyChain Disruptions: Evidence from the Great East Japan Earthquake,” Decem-ber 2016. mimeo, University of Cambridge, Policy Research Institute, Ministryof Finance of Japan, RIETI, and Columbia GSB.

24 THE AMERICAN ECONOMIC REVIEW MONTH YEAR
Clark, Todd E. and Eric van Wincoop, “Borders and Business Cycles,”Journal of International Economics, 2001, 55 (1), 59–85.
Cravino, Javier and Andrei A. Levchenko, “Multinational Firms and Inter-national Business Cycle Transmission,” Quarterly Journal of Economics, May2017, 132 (2), 921–962.
di Giovanni, Julian and Andrei A. Levchenko, “Putting the Parts To-gether: Trade, Vertical Linkages, and Business Cycle Comovement,” AmericanEconomic Journal: Macroeconomics, April 2010, 2 (2), 95–124.
and , “Country Size, International Trade, and Aggregate Fluctuations inGranular Economies,” Journal of Political Economy, December 2012, 120 (6),1083–1132.
, , and Isabelle Mejean, “Firms, Destinations, and Aggregate Fluctua-tions,” Econometrica, July 2014, 82 (4), 1303–1340.
Frankel, Jeffrey A. and Andrew K. Rose, “The Endogeneity of the OptimumCurrency Area Criteria,” Economic Journal, July 1998, 108 (449), 1009–25.
Friberg, Richard and Mark Sanctuary, “The contribution of firm-levelshocks to aggregate fluctuations: The case of Sweden,” Economics Letters,2016, 147, 8 – 11.
Gabaix, Xavier, “The Granular Origins of Aggregate Fluctuations,” Economet-rica, May 2011, 79 (3), 733–772.
Ghironi, Fabio and Marc J. Melitz, “International Trade and Macroeco-nomic Dynamics with Heterogeneous Firms,” Quarterly Journal of Economics,August 2005, 120 (3), 865–915.
Grassi, Basile, “IO in I-O: Competition and Volatility in Input-Output Net-works,” November 2016. mimeo, University of Oxford.
Imbs, Jean, “Trade, Finance, Specialization, and Synchronization,” Review ofEconomics and Statistics, August 2004, 86 (3), 723–34.
, “The Real Effects of Financial Integration,” Journal of International Eco-nomics, 2006, 68 (2), 296–324.
Johnson, Robert C., “Trade in Intermediate Inputs and Business Cycle Co-movement,” American Economic Journal: Macroeconomics, October 2014, 6(4), 39–83.
Kalemli-Ozcan, Sebnem, Bent Sorensen, and Oved Yosha, “EconomicIntegration, Industrial Specialization, and the Asymmetry of MacroeconomicFluctuations,” Journal of International Economics, 2001, 55 (1), 107–137.

VOL. VOL NO. ISSUE MICRO ORIGINS OF INTERNATIONAL COMOVEMENT 25
, Elias Papaioannou, and Jose-Luis Peydro, “Financial Regulation, Fi-nancial Globalization and the Synchronization of Economic Activity,” Journalof Finance, 2013, 68 (3), 1179–1228.
Kleinert, Jorn, Julien Martin, and Farid Toubal, “The Few Leading theMany: Foreign Affiliates and Business Cycle Comovement,” American Eco-nomic Journal: Macroeconomics, October 2015, 7 (4), 134–159.
Kose, M. Ayhan and Kei-Mu Yi, “Can the Standard International BusinessCycle Model Explain the Relation Between Trade and Comovement,” Journalof International Economics, March 2006, 68 (2), 267–295.
Kurz, Christopher and Mine Z. Senses, “Importing, Exporting and Firm-Level Employment Volatility,” Journal of International Economics, January2016, 98, 160–175.
Liao, Wei and Ana Maria Santacreu, “The Trade Comovement Puzzle andthe Margins of International Trade,” Journal of International Economics, July2015, 96 (2), 266–288.
Magerman, Glenn, Karolien De Bruyne, Emmanuel Dhyne, and JanVan Hove, “Heterogeneous firms and the micro origins of aggregate fluctua-tions,” October 2016. National Bank of Belgium Working Paper 312.
Morgan, Donald, Bertrand Rime, and Philip E. Strahan, “Bank Integra-tion and State Business Cycles,” Quarterly Journal of Economics, 2004, 119(4), 1555–1584.
Ng, Eric C.Y., “Production fragmentation and business-cycle comovement,”Journal of International Economics, September 2010, 82 (1), 1–14.

26 THE AMERICAN ECONOMIC REVIEW MONTH YEAR
Table 1—Summary Statistics
Panel A: Whole Economy
No. Value Addedfirms Mean Median Share in total
All Firms 998,531 1,165 211 1.00Importers 189,863 3,516 515 0.72Exporters 200,775 3,219 477 0.71Affiliates of foreign multinationals 30,654 7,061 1,335 0.25Firms with foreign affiliates 1,786 65,829 2,279 0.14
Panel B: Manufacturing Sector
No. Value Addedfirms Mean Median Share in total
All Firms 145,575 2,367 382 1.00Importers 60,395 4,444 872 0.93Exporters 66,507 4,053 754 0.93Affiliates of foreign multinationals 8,370 11,994 2,939 0.38Firms with foreign affiliates 378 34,794 6,993 0.06
Panel C: Non-manufacturing Sector
No. Value Addedfirms Mean Median Share in total
All Firms 871,196 946 191 1.00Importers 135,161 3,116 402 0.63Exporters 139,904 2,849 384 0.62Affiliates of foreign multinationals 22,810 5,060 998 0.18Firms with foreign affiliates 1,445 78,192 1,451 0.18
Notes: This table reports the summary statistics for the whole economy, the manufacturing and the non-manufacturing sectors. It reports the number of distinct firms, mean and median value added, and the share ofa particular type of firm in total value added. Value added is reported in thousands of euros. The categories of firmsare not mutually exclusive.
VOL. VOL NO. ISSUE MICRO ORIGINS OF INTERNATIONAL COMOVEMENT 27
Table 2—Directly Connected and Not Directly Connected Firms
Directly Connected Not Directly ConnectedCountry No. Combined Mean No. Combined Mean
firms share ρ(γft, γCt) firms share ρ(γft, γCt)
Belgium 113,472 0.626 0.047 853,812 0.374 0.007Brazil 19,962 0.385 -0.013 947,322 0.615 -0.035China 46,930 0.489 -0.064 920,354 0.511 -0.066Germany 108,657 0.627 0.039 858,627 0.373 -0.006Italy 105,522 0.607 0.065 861,762 0.393 0.027Japan 39,500 0.478 -0.042 927,784 0.522 -0.059Netherlands 82,369 0.590 0.065 884,915 0.410 0.013Spain 93,180 0.586 0.029 874,104 0.414 0.001United Kingdom 84,373 0.604 0.046 882,911 0.396 0.021United States 80,826 0.604 0.063 886,458 0.396 0.044
Average 77,479 0.560 0.024 889,805 0.440 -0.005
Notes: This table reports the features of directly connected and not directly connected firms for each partner country.The columns report the number of firms, their combined share in aggregate value added (averaged across years), andthe mean correlation between firm value added growth and the foreign country’s GDP growth.
28 THE AMERICAN ECONOMIC REVIEW MONTH YEAR
Table 3—Directly Connected Firms: by Connection Type
Exporters ImportersCountry No. Combined Mean No. Combined Mean
firms share ρ(γft, γCt) firms share ρ(γft, γCt)
Belgium 68,458 0.514 0.054 87,968 0.591 0.047Brazil 12,757 0.317 -0.007 9,888 0.278 -0.015China 16,560 0.372 -0.050 39,157 0.445 -0.068Germany 57,200 0.493 0.050 91,181 0.603 0.040Italy 51,904 0.471 0.073 90,364 0.583 0.066Japan 25,072 0.401 -0.042 22,959 0.413 -0.036Netherlands 42,236 0.451 0.076 63,574 0.551 0.063Spain 52,172 0.477 0.031 72,542 0.543 0.029United Kingdom 46,794 0.471 0.055 64,159 0.567 0.046United States 46,885 0.496 0.068 56,917 0.563 0.061
Average 42,004 0.446 0.031 59,871 0.514 0.023
Affiliates of multinationals Firms with foreign affiliatesCountry No. Combined Mean No. Combined Mean
firms share ρ(γft, γCt) firms share ρ(γft, γCt)
Belgium 3,527 0.016 0.039 396 0.097 0.064Brazil 4 0.000 -0.016 121 0.072 0.018China 89 0.000 -0.110 203 0.100 -0.056Germany 4,485 0.035 0.053 437 0.124 0.058Italy 1,849 0.014 0.068 374 0.124 0.035Japan 644 0.006 -0.038 105 0.066 -0.073Netherlands 4,197 0.039 0.061 141 0.081 0.088Spain 957 0.006 0.039 524 0.128 0.044United Kingdom 5,143 0.040 0.036 405 0.125 0.059United States 5,522 0.071 0.078 430 0.123 0.091
Average 2,642 0.023 0.021 314 0.104 0.033
Notes: This table reports the features of different types of directly connected firms. The columns report the numberof firms, their combined share in aggregate value added (averaged across years), and the mean correlation betweenfirm value added growth and the foreign country’s GDP growth.

VOL. VOL NO. ISSUE MICRO ORIGINS OF INTERNATIONAL COMOVEMENT 29
Tab
le4—
Mai
nE
stim
atio
nR
esu
lts
(1)
(2)
(3)
(4)
(5)
(6)
Bas
elin
eB
asel
ine
Bas
elin
eB
asel
ine
Bas
elin
eS
ales
Dep
.V
ar:ρ
(γft,γCt
)Im
por
ter
0.02
9∗∗∗
0.02
5∗∗∗
0.01
3∗∗∗
0.01
3∗∗∗
0.01
2∗∗∗
0.01
8∗∗∗
(0.0
01)
(0.0
01)
(0.0
01)
(0.0
01)
(0.0
01)
(0.0
01)
Exp
orte
r0.
035∗∗∗
0.02
0∗∗∗
0.00
5∗∗∗
0.00
5∗∗∗
0.00
6∗∗∗
0.01
1∗∗∗
(0.0
01)
(0.0
01)
(0.0
01)
(0.0
01)
(0.0
01)
(0.0
01)
Fre
nch
Mu
ltin
atio
nal
0.02
3∗∗
0.02
1∗∗
0.00
90.
009
0.00
80.
017∗
(0.0
09)
(0.0
09)
(0.0
08)
(0.0
08)
(0.0
08)
(0.0
08)
Affi
liat
eof
aF
orei
gnM
NE
0.02
8∗∗∗
0.02
8∗∗∗
0.01
0∗∗∗
0.01
0∗∗∗
0.00
9∗∗∗
0.01
4∗∗∗
(0.0
03)
(0.0
02)
(0.0
02)
(0.0
02)
(0.0
02)
(0.0
02)
Ob
serv
atio
ns
8,36
3,76
08,
363,
760
8,36
3,76
08,
363,
440
8,36
3,75
08,
928,
330
Ad
just
edR
20.
001
0.28
10.
287
0.28
80.
289
0.28
5F
irm
FE
No
Yes
Yes
Yes
Yes
Yes
Cou
ntr
yF
EN
oN
oY
esN
oN
oY
esC
ountr
y×
Reg
ion
FE
No
No
No
Yes
No
No
Cou
ntr
y×
Sec
tor
FE
No
No
No
No
Yes
No
#of
Xin
gli
nks
403,
180
403,
180
403,
180
403,
092
403,
180
418,
915
#of
Min
gli
nks
573,
347
573,
347
573,
347
573,
222
573,
347
593,
338
#of
Affi
liat
es25
,385
25,3
8525
,385
25,3
8225
,385
27,7
86#
ofH
Qli
nks
3,04
63,
046
3,04
63,
043
3,04
63,
626
#of
Fir
mF
Es
836,
376
836,
376
836,
344
836,
375
892,
833
#of
Cou
ntr
yF
Es
1010
#of
Cou
ntr
y×
Reg
ion
FE
s96
0#
ofC
ountr
y×
Sec
tor
FE
s1,
090
Note
s:S
tan
dard
erro
rscl
ust
ered
at
the
firm
level
.∗∗∗:
sign
ifica
nt
at
the
1%
level
;∗∗
:si
gn
ifica
nt
at
the
5%
level
;∗:
sign
ifica
nt
at
the
10%
level
.T
his
tab
lere
port
sth
ere
sult
sof
esti
mati
ng
(5)
for
the
wh
ole
econ
om
y.T
he
ind
epen
den
tvari
ab
les
are
bin
ary
ind
icato
rsfo
rw
het
her
the
firm
imp
ort
sfr
om
aco
untr
y,ex
port
sto
it,
isan
affi
liate
of
am
ult
inati
on
al
firm
from
that
cou
ntr
y,or
isa
Fre
nch
mu
ltin
ati
on
al
wit
haffi
liate
sin
that
cou
ntr
y.

30 THE AMERICAN ECONOMIC REVIEW MONTH YEAR
Table 5—Estimation Results, Taking Indirect Linkages into Account
(1) (2)Dep. Var: ρ (γft, γCt)Importer 0.011∗∗∗ 0.011∗∗∗
(0.001) (0.001)Exporter 0.003∗∗∗ 0.006∗∗∗
(0.001) (0.001)French Multinational 0.009 0.008
(0.008) (0.008)Affiliate of a Foreign MNE 0.011∗∗∗ 0.010∗∗∗
(0.002) (0.002)DSf,j,C 0.225∗∗∗ 0.052∗∗∗
(0.016) (0.021)USf,j,C -0.025∗∗∗ 0.030∗∗
(0.006) (0.014)
Observations 7,866,970 7,866,960Adjusted R2 0.288 0.289Firm FE Yes YesCountry FE Yes NoCountry×Sector FE No Yes# of Xing links 401,722 401,722# of Ming links 571,234 571,234# of Affiliates 24,105 24,105# of HQ links 3,020 3,020# of Firm FEs 786,697 786,696# of Country FEs 10# of Country×Sector FEs 1090
Notes: Standard errors clustered at the firm level. ∗∗∗: significant at the 1% level; ∗∗: significant at the 5%level; ∗: significant at the 10% level. This table reports the results of estimating (8) for the whole economy. Theindependent variables are binary indicators for whether the firm imports from a country, exports to it, is an affiliate ofa multinational firm from that country, or is a French multinational with affiliates in that country. The downstreamindirect linkage indicator DSf,j,C is defined in (6). The upstream indirect linkage indicator USf,j,C is defined in (7).

VOL. VOL NO. ISSUE MICRO ORIGINS OF INTERNATIONAL COMOVEMENT 31
Table 6—Estimation Results: Interaction Terms
(1) (2)Dep. Var: ρ (γft, γCt)Trade dummy (Importer+Exporter≥1) 0.011∗∗∗ 0.011∗∗∗
(0.001) (0.001)MNE Dummy (French multinational + Affiliate≥1) 0.012∗∗∗ 0.011∗∗∗
(0.002) (0.004)Trade×MNE Dummy 0.001
(0.004)
Observations 8,363,760 8,363,760Adjusted R2 0.287 0.287Firm FE Yes YesCountry FE Yes Yes# of Trade Links 726,920 726,920# of MNE Links 28,375 28,375# of Firm FEs 836,376 836,376# of Country FEs 10 10
Notes: Standard errors clustered at the firm level. ∗∗∗: significant at the 1% level; ∗∗: significant at the 5% level;∗: significant at the 10% level. This table reports the results of estimating (5), adding an interaction between tradeand multinational status. The independent variables are binary indicators for whether the firm trades with a country(imports from it or exports to it), has any multinational links with a country (is an affiliate of a multinational firmfrom that country, or is a French multinational with affiliates in that country), and the interactions.
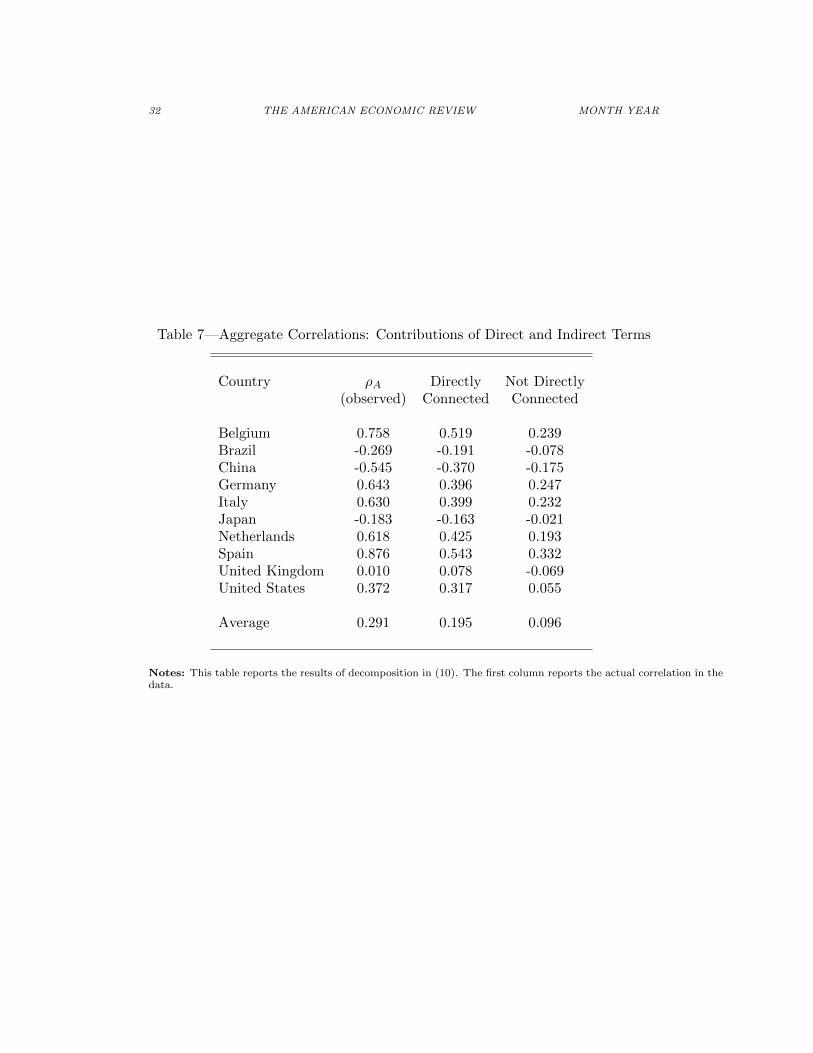
32 THE AMERICAN ECONOMIC REVIEW MONTH YEAR
Table 7—Aggregate Correlations: Contributions of Direct and Indirect Terms
Country ρA Directly Not Directly(observed) Connected Connected
Belgium 0.758 0.519 0.239Brazil -0.269 -0.191 -0.078China -0.545 -0.370 -0.175Germany 0.643 0.396 0.247Italy 0.630 0.399 0.232Japan -0.183 -0.163 -0.021Netherlands 0.618 0.425 0.193Spain 0.876 0.543 0.332United Kingdom 0.010 0.078 -0.069United States 0.372 0.317 0.055
Average 0.291 0.195 0.096
Notes: This table reports the results of decomposition in (10). The first column reports the actual correlation in thedata.
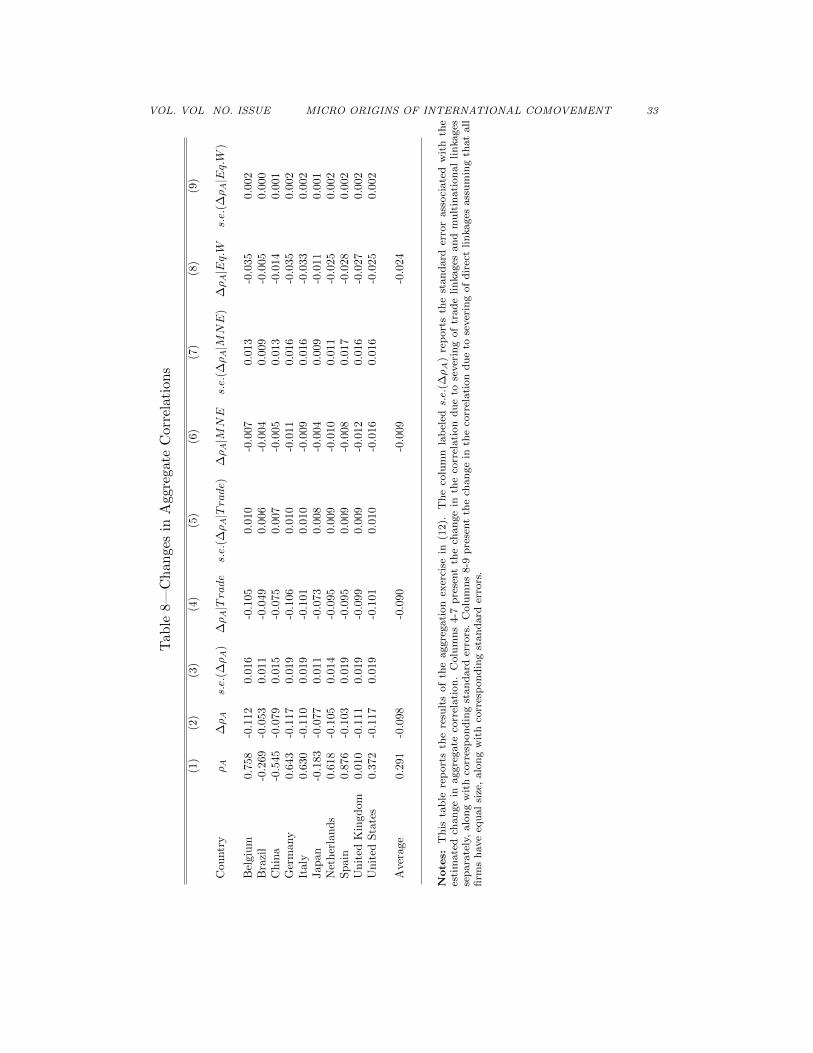
VOL. VOL NO. ISSUE MICRO ORIGINS OF INTERNATIONAL COMOVEMENT 33
Tab
le8—
Ch
ange
sin
Agg
rega
teC
orre
lati
ons
(1)
(2)
(3)
(4)
(5)
(6)
(7)
(8)
(9)
Cou
ntr
yρA
∆ρA
s.e.
(∆ρA
)∆ρA|Trade
s.e.
(∆ρA|Trade)
∆ρA|M
NE
s.e.
(∆ρA|M
NE
)∆ρA|Eq.W
s.e.
(∆ρA|Eq.W
)
Bel
gium
0.75
8-0
.112
0.01
6-0
.105
0.01
0-0
.007
0.01
3-0
.035
0.00
2B
razi
l-0
.269
-0.0
530.
011
-0.0
490.
006
-0.0
040.
009
-0.0
05
0.0
00C
hin
a-0
.545
-0.0
790.
015
-0.0
750.
007
-0.0
050.
013
-0.0
140.0
01G
erm
any
0.64
3-0
.117
0.01
9-0
.106
0.01
0-0
.011
0.01
6-0
.035
0.0
02It
aly
0.63
0-0
.110
0.01
9-0
.101
0.01
0-0
.009
0.01
6-0
.033
0.00
2Jap
an-0
.183
-0.0
770.
011
-0.0
730.
008
-0.0
040.
009
-0.0
110.
001
Net
her
lands
0.61
8-0
.105
0.01
4-0
.095
0.00
9-0
.010
0.01
1-0
.025
0.00
2Spai
n0.
876
-0.1
030.
019
-0.0
950.
009
-0.0
080.
017
-0.0
28
0.00
2U
nit
edK
ingd
om0.
010
-0.1
110.
019
-0.0
990.
009
-0.0
120.
016
-0.0
270.
002
Unit
edSta
tes
0.37
2-0
.117
0.01
9-0
.101
0.01
0-0
.016
0.01
6-0
.025
0.00
2
Ave
rage
0.29
1-0
.098
-0.0
90-0
.009
-0.0
24
Note
s:T
his
tab
lere
port
sth
ere
sult
sof
the
aggre
gati
on
exer
cise
in(1
2).
Th
eco
lum
nla
bel
eds.e.
(∆ρA
)re
port
sth
est
an
dard
erro
rass
oci
ate
dw
ith
the
esti
mate
dch
an
ge
inaggre
gate
corr
elati
on
.C
olu
mn
s4-7
pre
sent
the
chan
ge
inth
eco
rrel
ati
on
du
eto
sever
ing
of
trad
elin
kages
an
dm
ult
inati
on
al
lin
kages
sep
ara
tely
,alo
ng
wit
hco
rres
pon
din
gst
an
dard
erro
rs.
Colu
mn
s8-9
pre
sent
the
chan
ge
inth
eco
rrel
ati
on
du
eto
sever
ing
of
dir
ect
lin
kages
ass
um
ing
that
all
firm
sh
ave
equ
al
size
,alo
ng
wit
hco
rres
pon
din
gst
an
dard
erro
rs.

34 THE AMERICAN ECONOMIC REVIEW MONTH YEAR
Tab
le9—
Ch
ange
sin
Agg
rega
teC
orre
lati
ons,
Incl
ud
ing
Ind
irec
tE
ffec
ts
(1)
(2)
(3)
(4)
(5)
(6)
(7)
(8)
(9)
Cou
ntr
yρA
∆ρA
s.e.
(∆ρA
)∆ρA|
s.e.
(∆ρA|
∆ρA|
s.e.
(∆ρA|
∆ρA|
s.e.
(∆ρA|
Direct
Direct)
Indirect,
Indirect,
Indirect,
Indirect,
Manuf
Manuf
)Non
-Manuf
Non
-Manuf
)
Bel
gium
0.75
8-0
.263
0.02
9-0
.093
0.01
6-0
.223
0.02
00.
053
0.0
15
Bra
zil
-0.2
69-0
.074
0.01
2-0
.044
0.0
11-0
.048
0.00
40.
018
0.0
04
Chin
a-0
.545
-0.2
72
0.0
31-0
.098
0.01
9-0
.218
0.0
200.0
440.0
14
Ger
man
y0.
643
-0.2
54
0.0
29-0
.092
0.01
9-0
.201
0.0
190.0
390.0
13
Ital
y0.
630
-0.1
210.0
15-0
.063
0.01
2-0
.081
0.0
070.
024
0.0
06
Jap
an-0
.183
-0.2
160.
023
-0.0
880.0
14-0
.163
0.01
50.
035
0.0
11
Net
her
lands
0.61
8-0
.121
0.01
5-0
.063
0.0
12-0
.081
0.00
70.
024
0.0
06
Spai
n0.
876
-0.2
220.0
28-0
.085
0.01
9-0
.181
0.0
160.
045
0.0
12
Unit
edK
ingd
om0.
010
-0.2
300.
027
-0.0
940.0
19-0
.176
0.01
60.
040
0.0
12
Unit
edSta
tes
0.37
2-0
.221
0.02
6-0
.100
0.0
19-0
.159
0.01
40.0
380.0
11
Ave
rage
0.29
1-0
.199
-0.0
82-0
.153
0.03
6
Note
s:T
his
tab
lere
port
sth
ere
sult
sof
the
aggre
gati
on
exer
cise
in(1
2),
au
gm
ente
dw
ith
ind
irec
tli
nkages
.T
he
colu
mn
lab
eled
s.e.
(∆ρA
)re
port
sth
est
an
dard
erro
rass
oci
ate
dw
ith
the
esti
mate
dch
an
ge
inaggre
gate
corr
elati
on
.T
he
last
6co
lum
ns
pre
sent
the
chan
ge
inth
eco
rrel
ati
on
du
eto
sever
ing
of
dir
ect
lin
kages
an
din
dir
ect
lin
kages
sep
ara
tely
,alo
ng
wit
hco
rres
pon
din
gst
an
dard
erro
rs.
Th
ere
sult
sare
base
don
esti
mati
on
that
allow
sco
effici
ents
on
DSf,j,C
an
dUSf,j,C
as
wel
las
cou
ntr
yfi
xed
effec
tsto
diff
erin
manu
fact
uri
ng
an
dn
on
-manu
fact
uri
ng
sect
ors
.

VOL. VOL NO. ISSUE MICRO ORIGINS OF INTERNATIONAL COMOVEMENT 35
Figure 1. Comparison with Aggregates, Growth Rates
(a) Aggregate Value Added and GDP
1992 1994 1996 1998 2000 2002 2004 2006 2008
GD
P g
row
th r
ate
-0.04
-0.03
-0.02
-0.01
0
0.01
0.02
0.03
0.04
0.05
0.06
IMF IFSSample (Intensive)
(b) Exports
1992 1994 1996 1998 2000 2002 2004 2006 2008
Gro
wth
rat
e of
Exp
orts
-0.15
-0.1
-0.05
0
0.05
0.1
0.15
0.2
0.25
IMF DOTSSample
(c) Imports
1992 1994 1996 1998 2000 2002 2004 2006 2008
Gro
wth
rat
e of
Impo
rts
-0.15
-0.1
-0.05
0
0.05
0.1
0.15
0.2
0.25
IMF DOTSSample
Notes: The top panel presents the time series of the growth rates of total before-tax value added in our data andGDP sourced from the IMF International Financial Statistics. The bottom two panels present the growth rates oftotal exports and imports, respectively, in our sample and sourced from IMF’s Direction of Trade Statistics.
Figure 2. Aggregate Correlations: Comparison to Standard Sources
USA
GBR
BELDEUITA
NLD
JAP
ESP
BRA
CHN
−.5
0.5
1G
DP
Cor
rela
tion,
IMF
IFS
−.5 0 .5 1Aggregate Correlation, our data
Notes: This Figure presents the scatterplot of the aggregate correlations implied by our data and the correlations inGDP from IMF International Financial Statistics, along with a 45-degree line.