the mekong river commission secretariat · best practise guidelines for flood risk ... n.b....
TRANSCRIPT

THE MEKONG RIVER COMMISSION SECRETARIAT
Best Practise Guidelines for Flood Risk Assessment
The Flood Management and Mitigation Programme,Component 2: Structural Measures & Flood Proofingin the Lower Mekong Basin
December 2009
Draft Final Report
HASKONING NEDERLAND B.V. UNESCO IHE


MRC Flood Management and Mitigation Programme Component 2: Structural Measures and Flood Proofing
Guidelines Flood Risk Assessment i December 2009
CONTENTSPage
1 INTRODUCTION 3 1.1 Guide to the reporting structure of the Flood Management and Mitigation
Programme Component 2, Structural Measures and Flood Proofing 3 1.2 Best Practice Guidelines for Integrated Flood Risk Management 4 1.3 Concepts in the Best Practice Guidelines for Flood Risk Assessment 4
1.3.1 Flood risk and flood risk management 4 1.3.2 Flood risk assessment 5
1.4 Basis of the Flood Risk Assessment Guidelines 7 1.5 Use of the Flood Risk Assessment Guidelines 7 1.6 The Best Practice Guidelines and project phases/ stages 8
2 FLOOD HAZARD ASSESSMENT 11 2.1 Introduction 11 2.2 Classification of type of flood 11 2.3 Tributary floods 15
2.3.1 General 15 2.3.2 Flood hazard derived from rainfall extremes 16 2.3.3 Example of flood hazard derived from rainfall extremes 19 2.3.4 Flood hazard determined from observed flows 22 2.3.5 Flood hazard derived from regional flood statistics 26
2.4 Mainstream floods 27 2.4.1 General 27 2.4.2 Data collection 28 2.4.3 Database development and field visit 30 2.4.4 Data validation and processing 30 2.4.5 Hydrological hazard 31 2.4.6 Flood hazard assessment 31 2.4.7 Example: Mekong near Nhakon Phanom (Thailand) 32
2.5 Combined floods 35 2.5.1 General 35 2.5.2 Data collection 37 2.5.3 Database development and field visit 37 2.5.4 Data validation and processing 38 2.5.5 Hydrological hazard 38 2.5.6 Flood hazard assessment 39 2.5.7 Example: combined floods in the lower Se Bang Fai (Lao PDR) 40
2.6 Floods in the Mekong delta 47 2.6.1 General 47 2.6.2 Data collection and field visit 47 2.6.3 Database development 49 2.6.4 Hydrodynamic model development 50 2.6.5 Flood hazard assessment 53
2.7 Flood hazard mapping 54 2.7.1 General 54 2.7.2 Transfer of modelling results (A) 55 2.7.3 Creation of spatial data (B) 55 2.7.4 Creation of flooding maps (C) 58 2.7.5 Data sources 59

MRC Flood Management and Mitigation Programme Component 2: Structural Measures and Flood Proofing
Guidelines Flood Risk Assessment ii December 2009
3 FLOOD DAMAGE ASSESSMENT 63 3.1 Introduction 63 3.2 Classification of flood damages and benefits 63
3.2.1 Flood damages 63 3.2.2 Flood benefits 65
3.3 General approach for economic damage assessment 66 3.3.1 Scope of the analysis and level of detail 66 3.3.2 Direct damage assessment 67 3.3.3 Damage functions 68 3.3.4 Relative and absolute damage assessments 70 3.3.5 Assessment of indirect damages 71
3.4 Damage models 72 3.5 Economic and financial issues in damage assessment 73
3.5.1 Financial vs. economic valuation 73 3.5.2 Estimating values of assets 74 3.5.3 Time value of money 74
3.6 Loss of life and health effects 74 3.6.1 Introduction 74 3.6.2 Loss of life 75 3.6.3 Health effects and social and environmental impacts 76
3.7 Presentation of damage assessments results 76 3.8 Data collection 77 3.9 Flood damage assessment in the Mekong basin 80
3.9.1 Scope and selected areas 80 3.9.2 Approach and methodology 80 3.9.3 Damage categories 81 3.9.4 Data collections and surveys 81 3.9.5 Derivation of damage functions 85 3.9.6 Creation of damage maps 88 3.9.7 Results of damage assessments 90
4 FLOOD RISK ASSESSMENT 95 4.1 Introduction 95 4.2 General approach 95 4.3 Presentation of the results of risk assessments 96
4.3.1 Economic risk 96 4.3.2 Risk to life 98
4.4 Risk reduction measures and risk evaluation 99 4.4.1 Effects of measures on the risk 99 4.4.2 Basics of cost benefit analysis 100 4.4.3 Economic optimisation 101 4.4.4 Risk evaluation for loss of life 102 4.4.5 Risk matrix 103
4.5 Risk assessment for the Lower Mekong Basin 104 4.5.1 Introduction and approach 104 4.5.2 Results of risk assessment 104
5 REFERENCES 109

MRC Flood Management and Mitigation Programme Component 2: Structural Measures and Flood Proofing
Guidelines Flood Risk Assessment iii December 2009
APPENDICES
Appendix 1 Approach to flood damage and risk assessment in Europe
Appendix 2 Approaches for the assessment of structural damage to buildings
Appendix 3 Fundamental issues in economic evaluation
Appendix 4 Analysis of human instability in flood flows
Appendix 5 The Best Practice Guidelines and project phases/ stages
Appendix 6 Flow chart to create flood maps with a GIS

MRC Flood Management and Mitigation Programme Component 2: Structural Measures and Flood Proofing
Guidelines Flood Risk Assessment iv December 2009
GLOSSARY
Damage curve The functional relation between inundation characteristics (depth,duration, flow velocity) and damage for a certain category ofelements at risk.
Direct damage All harm which relates to the immediate physical contact of floodwater to people, property and the environment. This includes, forexample, damage to buildings, economic assets, loss of standingcrops and livestock, loss of human life, immediate health impactsand loss of ecological goods.
Exposure The people, assets and activities that are threatened by a floodhazard.
Flood control A structural intervention to reduce the flood hazard.
Flood damage Damage to people, property and the environment caused by aflood. This damage refers to direct as well as indirect damage.
Flood damage risk(= Flood risk)
The combination or product of the probability of the flood hazardand the possible damage that it may cause. This risk can also beexpressed as the average annual possible damage or expecteddamage.
Flood hazard A flood that potentially may result in damage. A hazard does notnecessarily lead to damage.
Flood hazard map Map with the predicted or documented extent / depth / velocity offlooding with an indication of the flood probability.
Flood proofing A process for preventing or reducing flood damages toinfrastructural works, buildings and/or the contents of buildingslocated in flood hazard areas.
Flood risk management Comprehensive activity involving risk analysis, and identification andimplementation of risk mitigation measures.
Flood risk managementmeasures
Actions that are taken to reduce the probability of flooding or thepossible damages due to flooding or both.
Flood risk map Map with the predicted extent of different levels / classes ofaverage annual possible damage.
Hydrological hazard A hydrological event (discharge) that may result in flooding.
Indirect damage All damage which relate to the disruption of economic activity andservices due to flooding.
Integrated flood riskmanagement
The approach to Flood Risk Management that embraces the fullchain of a meteorological hazard leading to flood damages andconsiders combinations of structural and non structural solutions toreduce that damage.

MRC Flood Management and Mitigation Programme Component 2: Structural Measures and Flood Proofing
Guidelines Flood Risk Assessment v December 2009
Meteorological hazard A meteorological event (storm) that may result in a hydrologicalhazard and, eventually, in flooding
Resilience The ability of a system / community / society to cope with thedamaging effect of floods
Susceptibility The opposite of resilience, that is to say the inability of a system /community / society to cope with the damaging effect of floods
Vulnerability The potential damage that flooding may cause to people, propertyand the environment
ABBREVIATIONS
N.B. Abbreviations that occur only once and that are explained in the text are not includedin the table below.
ADCP Acoustic Doppler Current Profiler (Acoustic Doppler Profiler);instrument to measure how fast water is moving across an entirewater column
ARF Area Reduction Factor (hydrology)BCM Billion Cubic MetersBDP Basin Development PlanningBPG Best Practise GuidelinesCBA Cost Benefit Analysisd/s downstreamDACA Damage and Casualties Assessment project for the Lower Mekong
Basin based on HIS SSMDEM Digital Elevation Model (see also DTM)DSF Decision Support FrameworkDTM Digital Terrain Model (see also DEM)EC European CommissionEU European UnionEV1 Extreme Value type 1 distribution (hydrology)EXCIMAP European Exchange Circle on Flood MappingFEMA Federal Emergency Management AgencyFHA Flood Hazard AssessmentFMM Flood Management and MitigationFMMP C2 Flood Management and Mitigation Programme, Component 2FN curve Curves relating the probability per year of causing N or more
fatalities (F) to NFRA Flood Risk AssessmentFV Future Value (economic analysis)GEV Generalised Extreme Value distribution (hydrology)GIS Geographic Information SystemHAZUS Software for risk assessment analysis of potential losses from
floods, hurricane winds and earthquakes (by FEMA)HH Household(s)HIS SSM Hydrological Information System damages and casualties
assessment moduleHYMOS Information system for water resources management

MRC Flood Management and Mitigation Programme Component 2: Structural Measures and Flood Proofing
Guidelines Flood Risk Assessment vi December 2009
IDW Inverse Distance Weighting method: an interpolation method toobtain a continuous GIS raster on the basis of data points (nodes),assigning most weight to nearby points by using their distance tothe point to calculate(see also NN)
IFRM Integrated Flood Risk ManagementISIS Hydrodynamic simulator for modelling flows and levels in open
channels and estuariesIUH Instantaneous Unit Hydrograph (hydrology)JICA Japan International Cooperation AgencyLMB Lower Mekong BasinLMD Lower Mekong DeltaLXQ Long Xuyen Quadrangle (Vietnam)MCM Million Cubic MetersMRC(S) Mekong River Commission (Secretariat)MSL Mean sea level, the average (mean) height of the sea, with
reference to a suitable reference surfaceNN Natural Neighbours method: an interpolation method to obtain a
continuous GIS raster on the basis of data points (nodes), assigningmost weight to nearby points by calculating overlapping areas inVoronoi/ Thiessen polygons (see also IDW)
NPV Net Present Value (economic analysis)PDR (Lao) (Lao) People�’s Democratic RepublicPoR Plain of Reeds (Vietnam)PV Present Value (economic analysis)RFMMP Regional Flood Management and Mitigation ProgrammeRID Royal Department of IrrigationRR Rainfall Ratio (hydrology)SBF Se Bang Fai (Lao PDR)SCS CN Soil Conservation Service (USA) Curve Number method (hydrology)SWAT River basin scale model quantifying the impact of land management
practices in large, complex watershedsTCEV Two Component Extreme Value (hydrology)u/s upstreamUH Unit Hydrograph (hydrology)UK United KingdomUNESCO IHE Institute for Water Education (IHE) of the United Nations
Educational, Scientific and Cultural OrganizationUSA United States of AmericaWUP Water Utilisation Programme

MRC Flood Management and Mitigation Programme Component 2: Structural Measures and Flood Proofing
Guidelines Flood Risk Assessment vii December 2009
USED SYMBOLS
The FMMP C2 guidelines contain in the left margins symbols for quick reference. The symbolsindicate:
A. Type of text/ content;B. A project stage.
A) The report texts have been categorised into four groups. These groups are as follows:
I) Project background / Report info
Text on the FMMP project and its background,or explanation on the report structure or content.
II) Theory
Theory behind the proposed/ applied methods and guidelines.
III) Example
Example of the proposed/ applied methods and guidelines.
The fourth group comprises the remainder of texts and concern methodology and theoryadapted/ applied to the Lower Mekong Basin, i.e. the guidelines. These guidelines are to beapplied in one of the five project stages described below (B).
B) A project consists in general of five phases (see Section 1.6). Project FMMP C2encompasses only Phase 2: Planning/ Development/ Design. This phase can be subdividedin the following five stages:
a) Preliminary/ prefeasibility study
b) Feasibility study & overall planning
c) Preliminary design
d) Detailed design & detailed planning
e) Construction/ bid documents
Any part of a guideline falling outside thescope of the five phases above will be marked with:
Sometimes more than one symbol may apply to a section.

MRC Flood Management and Mitigation Programme Component 2: Structural Measures and Flood Proofing
Guidelines Flood Risk Assessment viii December 2009

MRC Flood Management and Mitigation Programme Component 2: Structural Measures and Flood Proofing
Guidelines Flood Risk Assessment 1 December 2009
CHAPTER1INTRODUCTION

MRC Flood Management and Mitigation Programme Component 2: Structural Measures and Flood Proofing
Guidelines Flood Risk Assessment 2 December 2009

MRC Flood Management and Mitigation Programme Component 2: Structural Measures and Flood Proofing
Guidelines Flood Risk Assessment 3 December 2009
1 INTRODUCTION
1.1 Guide to the reporting structure of the Flood Management and Mitigation ProgrammeComponent 2, Structural Measures and Flood Proofing
Component 2 on Structural Measures and Flood Proofing of the Mekong River Commission'sFlood Management and Mitigation Programme was implemented from September 2007 tillJanuary 2010 under a consultancy services contract between MRCS and Royal Haskoning inassociation with Deltares and Unesco IHE. The Implementation was in three stages, anInception Phase, and two Implementation Stages. During each stage a series of outputs wasdelivered and discussed with the MRC, the National Mekong Committees and line agencies ofthe four MRC member countries. A part of Component 2 on 'Roads and Floods' wasimplemented by the Delft Cluster under a separate contract with MRC. Component 2 preparedfive Demonstration Projects which have been reported separate from the main products.
The consultancy services contract for Component 2 specifies in general terms that, in additionto a Final Report, four main products are to be delivered. Hence, the reports produced at theend of Component 2 are structured as follows:
Volume 1 Final Report
Volume 2 Characteristics of Flooding in the Lower Mekong BasinVolume 2A Hydrological and Flood Hazards in the Lower Mekong Basin;Volume 2B Hydrological and Flood Hazards in Focal Areas;Volume 2C Flood Damages, Benefits and Flood Risk in Focal Areas;Volume 2D Strategic Directions for Integrated Flood Risk Management in Focal Areas.
Volume 3 Best Practice Guidelines for Integrated Flood Risk ManagementVolume 3A Best Practice Guidelines for Flood Risk Assessment;Volume 3B Best Practice Guidelines for Integrated Flood Risk Management Planning and
Impact Evaluation;Volume 3C Best Practice Guidelines for Structural Measures and Flood Proofing;Volume 3D Best Practice Guidelines for Integrated Flood Risk Management in Basin
Development Planning;Volume 3E Best Practice Guidelines for the Integrated Planning and Design of Economically
Sound and Environmentally Friendly Roads in the Mekong Floodplains ofCambodia and Vietnam1.
Volume 4 Project development and Implementation Plan
Volume 5 Capacity Building and Training Plan
Demonstration ProjectsVolume 6A Flood Risk Assessment in the NamMae Kok Basin, Thailand;Volume 6B Integrated Flood Risk Management Plan for the Lower Xe Bangfai Basin, Lao
PDR;Volume 6C Integrated Flood Risk Management Plan for the West Bassac Area, Cambodia;Volume 6D Flood Protection Criteria for the Mekong Delta, Vietnam;Volume 6E Flood Risk Management in the Border Zone between Cambodia and Vietnam.
The underlying report is Volume 3A of the above series.
1 Developed by the Delft Cluster

MRC Flood Management and Mitigation Programme Component 2: Structural Measures and Flood Proofing
Guidelines Flood Risk Assessment 4 December 2009
1.2 Best Practice Guidelines for Integrated Flood Risk Management
The Best Practice Guidelines (BPG) for Integrated Flood Risk Management have been developedunder FMMP C2 to provide policy makers, managers and FMM professionals in MRC andnational line agencies with a common knowledge base to apply in:
policy formulation, strategy and plan development, and project design and evaluation for flood risk management in the Lower Mekong Basin (LMB).
Each member country of the MRC has its own policy and legal frameworks that will guide orregulate the planning, evaluation and implementation of flood risk management plans andmeasures.
The BPGs do not attempt to summarize or replace these national guidelines, nor are theyintended as a recipe for carrying out planning or project design for flood risk management inthe LMB. Rather the BPGs will provide an information resource/ tool to be adapted according toeach country and project context.
Basis for any attempt to manage flood risks in the LMB is a proper assessment of the actual risksto be managed. The best practice guidelines for flood risk assessment (BPG for FRA) in the LMBare therefore considered a key guideline.
1.3 Concepts in the Best Practice Guidelines for Flood Risk Assessment
1.3.1 Flood risk and flood risk management
In general the word risk refers to the probability of loss or harm. In the context of flood riskmanagement it denotes the combination of the probability of a flood and its consequences. Thedefinition adopted by the European Commission is the following:
"flood risk" means the combination of the probability of a flood event and of the potentialadverse consequences for human health, the environment, cultural heritage and economicactivity associated with a flood event.�”
In this context also the terms hazard and vulnerability are often used. Hazard refers to thesource of danger, i.e. the (probability of) flooding. Vulnerability relates to potentialconsequences in case of an event.
(Integrated) Flood risk management is an approach to identify, analyse, evaluate, control andmanage the flood risks in a given system. A general scheme for flood risk management ispresented in Figure 1.1. The following steps are identified:
Definition of the system, the analysed hazards and the scale and scope of the analysis. A quantitative analysis where the probabilities and consequences are assessed and
combined/ displayed into a risk number, a graph or a flood risk map. Risk evaluation: with the results of the former analyses the risk is evaluated. In this phase
the decision is made whether the risk is acceptable or not. Risk reduction and control: dependent on the outcome of the risk evaluation, measures can
be taken to reduce the risk. Measures could concern structural and non structuralmeasures. It should also be determined how the risks can be controlled and managed, forexample by monitoring, inspection or maintenance.

MRC Flood Management and Mitigation Programme Component 2: Structural Measures and Flood Proofing
Guidelines Flood Risk Assessment 5 December 2009
Quantitative analysis and flood risk mapping
Risk Evaluation
Risk reduction andcontrol
-
System definition Scope, hazards
Structural and non-structural
measures
Figure 1.1 General scheme for flood risk management.
The scheme focuses on minimization of flood risks to an acceptable level. The approach couldalso be used to assess the overall hydrological performance of the system (e.g. minimization ofdrought, maximization of water quality and ecological quality). Then the approach will focus onmultiple objectives: not only to minimize the risk, but also maximize the performance.
The concept of flood risk assessment generally refers to the second step, i.e. the quantitativeanalysis of the level of flood risk in an area or basin, and this report focuses on that step. Otherguidelines/ reports give insight in possible measures and approaches for evaluation (see Section1.2 for an overview of other guidelines).
1.3.2 Flood risk assessment
The identification and mapping of flood risks requires information on several elements andsteps. These are shown in Figure 1.2 and discussed in further detail below.
System definition and collection of basic dataThe first step is the definition of the system and area studied and the collection of data forthis area (e.g. data basic regarding elevation of the terrain and the hydraulic processes).
Flood hazard analysisThe second step is the analysis of the occurrence of flooding. It includes an analysis ofmeteorological events that may eventually lead to flooding. In connection with thecharacteristics of the respective watershed the hydrological hazard (peak discharges,volumes) is assessed that eventually may create the flooding. In connection with thecharacteristics of river channel and floodplain the flood hazard is assessed in terms ofinundation area, depth etcetera. The results can be eventually displayed by means of flood(hazard) maps.
Vulnerability and damage assessmentThe third step is the analysis of potential damages in the areas prone to flooding based onsocio economic data and a vulnerability / damage model.
Risk determination and flood risk mappingIn the final step the risk is determined by combining the results of the flood hazard analysis,that gives insight in the probability of a certain hazard, and the results of the damageassessment. These results can be displayed in different forms, e.g. by means of risk maps orgraphs or risk numbers that give insight in the yearly expected damage.

MRC Flood Management and Mitigation Programme Component 2: Structural Measures and Flood Proofing
Guidelines Flood Risk Assessment 6 December 2009
These steps are separately elaborated in the sections in this report.
Flood hazard maps
System definition and collection of basic data
Flood damage maps
Flood hazard analysis
Vulnerability and damage
assessment
Risk determination and flood risk
mapping
Figure 1.2 General scheme for flood risk assessment.
A related scheme is used throughout the FMMP C2 project. It is shown in Figure 1.3 andbasically covers the same steps as in Figure 1.2. It schematically shows how meteorologicalinformation in combination with watershed and river information is used to determine thehydrological and flood hazards. By relating the possible floods to the vulnerability of theaffected area the damage can be determined. When the return periods of different flood eventsare included, the probability of a certain damage, i.e. the risk, is determined. Finally, it can alsobe evaluated how several measures, including crisis management can reduce the risk.
crisis management
precipitation peak discharges volumes
floods damage
meteorological hazard
hydrological hazard
watershed
river channel
flood hazard
damage risk
damagevulnerability
hazard risk
crisis management
precipitation peak discharges volumes
floods damage
meteorological hazard
hydrological hazard
watershed
river channel
flood hazard
damage risk
damagevulnerability
hazard risk
precipitation peak discharges volumes
floods damage
meteorological hazard
hydrological hazard
watershed
river channel
flood hazard
damage risk
damagevulnerability
hazard risk
Figure 1.3 Scheme for flood risk assessment used in the FMMP C2.

MRC Flood Management and Mitigation Programme Component 2: Structural Measures and Flood Proofing
Guidelines Flood Risk Assessment 7 December 2009
1.4 Basis of the Flood Risk Assessment Guidelines
The Best Practice Guidelines were prepared on the basis of:
1. a review of other guidelines or best practice documents in the field of flood riskassessments (see Appendix 1 of this BPG);
2. a review of existing guidelines in the LMB countries regarding damage assessments;3. experience gained during the flood risk assessments made for the LMB focal areas during
the Stage 1 of the FMMP C2.
In Stage 1 of the FMMP C2 a damage data collection and processing methodology was designedthat could be expected to yield the required data for the LMB focal areas, given the availabilityof secondary data, time and budget constraints. The methodology was evaluated by the surveyteams that did the secondary and primary data collection for workability and by the consultantsas for providing the required information. Both concluded that the method was workable andsuitable in the local context of the MRC member countries and that the damage data could beused for processing into flood risks. For details on the FMMP C2 damage data collection, seeAnnex 2 to the Stage 1 Evaluation Report.
Annex 1 to the Stage 1 Evaluation Report gives the details and results of the methodologiesapplied for the assessment of the flood hazards in the LMB focal areas; these are updated inStage 2.
The guidelines for flood risk assessment will be further elaborated and tested during Stage 2 ofFMMP C2, especially through the demonstration projects and through feedback from theregional training courses.
1.5 Use of the Flood Risk Assessment Guidelines
Who should use the guidelines and what is the main use for which the BPG has been prepared?
1. The group of policy makers that will participate in the development of the flood riskmanagement strategies at national and/or regional level.
2. The regional and/or basin planners that should be aware of the impact of developmentscenarios on flood risks and that should take flood risk management as an essentialcomponent of Integrated Water Resources Management. For this group also the IFRM BPGfor Basin Development Planning (BDP) is of relevance.
3. The group that will participate in the preparation of flood risk management relatedprojects, structural or non structural. The guidelines can be used to generate field levelflood benefits and costs that can be used as an input for project analysis. This projectanalysis itself is treated in the Best Practice Guidelines for IFRM Planning and ImpactAssessment.
4. The group that will participate in multilateral dialogues regarding transboundary flood riskrelated impacts.
The BPG for FRA provide a set of methodologies for the assessment of:1. flood hazards,2. flood damages, and3. flood risks.

MRC Flood Management and Mitigation Programme Component 2: Structural Measures and Flood Proofing
Guidelines Flood Risk Assessment 8 December 2009
These guidelines have the objective to combine theory and practice with specific emphasis onapplication to flooding in the Lower Mekong Basin. This document follows the general schemefor flood risk mapping (Figure 1.2). Section 2 describes the analysis of flood hazards andSection 3 focuses on flood damage and vulnerability assessment. Section 4 discusses how floodrisk can be determined and displayed.Within each section the following topics are discussed:
The principles, concepts and terminology; Existing models to determine and quantify hazards, consequences or risk; The proposed approach for the Lower Mekong Basin; Examples of results from stage 1 of Mekong FMMP C2.
These guidelines are intended to enable a consistent and uniform approach for flood riskassessment for several areas in the Lower Mekong Basin. The guidelines describe the theoryand make the connection to the practice in the LMB by including examples of results of floodhazard, damage and risk assessments for a case study area. These guidelines do not prescribe alldetails of the methods and models in the risk assessment, but provide the principles and give anoverview of the steps that need to be followed for a complete risk assessment.
The exact elaboration and application of the risk assessment depends on many factors, asobjectives and scope of the assessment, available data and local situation (hydrology, land use).For example the type of flooding is crucial. Within the Lower Mekong Basin several types offlooding can occur, such as tributary floods, main stream floods, or floods in the floodplains (seeSection 2.2). Each type of flooding is associated with particular flooding processes, like floodduration or flow speed, and these determine (among others) the details of the flood hazardanalysis.
1.6 The Best Practice Guidelines and project phases/ stages
In order to manage an engineering project properly, it is normally divided in project phases.Common is a division in the following five phases:
1. Initiation2. Planning/ Development/ Design3. Production/ Execution4. Monitoring/ Control5. Closure
The Best Practise Guidelines are almost exclusively applicable to Phase 2: Planning/Development/ Design. This phase, its stages and the associated symbols used in the guidelinesare elaborated in Appendix 5.

MRC Flood Management and Mitigation Programme Component 2: Structural Measures and Flood Proofing
Guidelines Flood Risk Assessment 9 December 2009
CHAPTER2FLOOD HAZARD ASSESSMENT

MRC Flood Management and Mitigation Programme Component 2: Structural Measures and Flood Proofing
Guidelines Flood Risk Assessment 10 December 2009

MRC Flood Management and Mitigation Programme Component 2: Structural Measures and Flood Proofing
Guidelines Flood Risk Assessment 11 December 2009
2 FLOOD HAZARD ASSESSMENT
2.1 Introduction
There is a variety of measures available to prevent or reduce damaging effects of flood hazards.Whether or not these measures are effective strongly depends on the system underconsideration. It is therefore vital to have a clear understanding of the processes involved. Foreach area of interest the following questions (among others) need to be addressed:
What type of floods does occur? Where does the water come from and where does it flow to? Which quantities are involved? Which system characteristic influence the flow of water? How frequent do floods occur?
This type of analysis is referred to as �“flood hazard assessment�”. Chapter 2 presents the basicguidelines in flood hazard assessment for the Mekong river basin. Section 2.2 presents aclassification of different types of flood events in the Mekong basin. This classification isrelevant because the different types require different guidelines. Sections 2.3 2.6 each presentthe guidelines for a separate type of flood. The guidelines are clarified with a number ofexamples for selected �“focal areas�” in the Mekong basin.
2.2 Classification of type of flood
A classification of floods is used as applied by the MRC for the Lower Mekong Basin, including:
Tributary floods, Main stream floods, Combined floods, Floods in Cambodian flood plain, and Floods in the Mekong delta.
The Mekong basin is divided in sub basins numbered from 1 to 10: see Figure 2.1. An overviewof the location where different flood types occur in the Mekong Basin is given in Figure 2.2. Theflood types are described in more detail below.
Tributary floods that occur in the steep sloped upper reaches of the basins are generally flashfloods, caused by intense rainfall after a long rainy period forcing the catchment to respondquickly to the rainfall. Flash floods are short lived, rise and fall rapidly and the flow velocities arevery high. Effects of flash floods, when accompanied with landslides, are equivalent to dambreak waves. Further downstream, in the middle sections of the tributaries the flashinessreduces, but the flood levels are not affected by backwater from the Mekong, like in the NamMae Kok at Chiang Rai.
Mainstream floods are floods along the Mekong caused by high water levels on the Mekong.The hydrological hazard is determined by the flood peaks responsible for the maximum waterlevels, whereas the flood volumes are of importance when flood duration is considered.Mainstream floods occur at a number of locations along the Lower Mekong between ChiangSaen and Kratie.

MRC Flood Management and Mitigation Programme Component 2: Structural Measures and Flood Proofing
Guidelines Flood Risk Assessment 12 December 2009
Figure 2.1 The sub basins or sub areas in the Lower Mekong Basin; the letters refer to thecountries (M= Myanmar, T = Thailand, L = Lao PDR, V = Vietnam, C = Cambodia).

MRC Flood Management and Mitigation Programme Component 2: Structural Measures and Flood Proofing
Guidelines Flood Risk Assessment 13 December 2009
Figure 2.2 Overview of flood types in the Mekong River.
Combined floods are floods that occur in the downstream sections of the tributaries, where theflood level is determined by the combination of tributary flow and the water levels in theMekong, backing up the tributary levels and impeding the drainage. Also, when the levels in theMekong are high, backwater flowing into the tributaries may occur. The character of thesefloods is not flashy; they may stay for weeks. In view of the shallow areas along the Mekongdownstream of Vientiane a large number of tributaries in their lower reaches face this type offlooding.

MRC Flood Management and Mitigation Programme Component 2: Structural Measures and Flood Proofing
Guidelines Flood Risk Assessment 14 December 2009
Floods in the Cambodian flood plain concern the conveyance and storage of the flood along theMekong and its flood plain downstream of Kratie to Phnom Penh, inclusive of the floodingaround Tonle Sap Lake and the inflow to and outflow from the lake via the Tonle Sap River.
Floods in the Mekong delta deals with the conveyance of floodwater via the Mekong andBassac Rivers and via their flood plains, including the use of colmatage canals to divert andcontrol the flow from and to the river. In the delta the levels rise slowly due to the storage inTonle Sap Lake and in the Mekong flood plains. Flooding here is recognized as essential for soilfertility, biodiversity and aquaculture. At the same time, it hampers use of agricultural land. Theflood levels in the Mekong Delta in its downstream part are essentially the result of upstreamand lateral inflow and downstream water levels at sea.
In Table 2.1 an overview is presented of the occurrence of the type of floods in the sub areas ofthe Lower Mekong Basin.
Table 2.1 Overview of flood types per sub area (sub basin)
Sub area Type of flood Is
sue
Assessment of hydrological
hazard
Assessment of flood hazard
SA1 Northern
Laos
Tributary
Mainstream
Combined
yes
yes
no
From rainfall statistics,
discharge statistics or regional
approach
Annual Flood Report
Rainfall runoff + hydraulic model/satellite
imagery
Hydraulic model/satellite imagery
SA2 Northern
Thailand
Tributary
Mainstream
Combined
yes
yes
yes
From rainfall statistics,
discharge statistics or regional
approach
Annual Flood Report
HYMOS/other databases
Rainfall runoff + hydraulic model/satellite
imagery
Hydraulic model/satellite imagery
As above
SA3 Nong Khai/
Songkhram
Tributary
Mainstream
Combined
yes
yes
yes
For some basins via statistics
rest via regional approach
Annual Flood Report
HYMOS/other databases
Models available for Nam Loei, Huai Mong
and Nam Songkhram/
satellite imagery
Hydraulic model/satellite imagery
As above
SA4 Central
Laos
Tributary
Mainstream
Combined
yes
yes
yes
From rainfall statistics,
discharge statistics or regional
approach
Annual Flood Report
HYMOS/other databases
Models available for Nam Ngum, Se Bang
Fai and Se Bang Hieng/
satellite imagery
Hydraulic model/satellite imagery
As above
SA5 Mun Chi Tributary
Mainstream
Combined
yes
yes
no
For 12 via statistics, rest via RID
data or regional approach
HYMOS/RID/other databases
Annual Flood Report
Hydraulic models/ satellite imagery
Hydraulic model/satellite imagery
SA6 Southern
Laos
Tributary
Mainstream
Combined
yes
yes
yes
From rainfall statistics,
discharge statistics or regional
approach
Annual Flood Report
HYMOS/other databases
Rainfall runoff + hydraulic model/satellite
imagery
Hydraulic model/satellite imagery
As above
SA7 Se San/ Sre
Pok/ Se Kong
Tributary
Mainstream
Combined
yes
no
yes
From rainfall or discharge
statistics or regional approach
HYMOS/other databases
Rainfall runoff + hydraulic model/satellite
imagery
Hydraulic model/satellite imagery

MRC Flood Management and Mitigation Programme Component 2: Structural Measures and Flood Proofing
Guidelines Flood Risk Assessment 15 December 2009
Sub area Type of flood Is
sue
Assessment of hydrological
hazard
Assessment of flood hazard
SA8 Kratie Tributary
Mainstream
Combined
yes
yes
yes
From rainfall statistics
Annual Flood Report
No data
Rainfall runoff + hydraulic model/ satellite
imagery
Satellite imagery u/s Kratie + model d/s
Kratie
SA9 Tonle Sap Tributary
Mainstream
Combined
yes
yes
yes
MRC database
HYMOS/other databases
MRC database
Rainfall runoff + hydraulic model/ satellite
imagery
Hydraulic delta model/satellite imagery
As above
SA10 Mekong
Delta
Tributary
Mekong delta
yes
yes
HYMOS/other databases
HYMOS/other databases
rainfall runoff+ hydraulic model/satellite
imagery
Hydraulic delta model/satellite imagery
2.3 Tributary floods
2.3.1 General
To develop appropriate flood hazard assessment procedures for the tributaries of the Mekongthe capacity of the monitoring systems is to be considered. The state of the hydrologicalmonitoring infrastructure in the Lower Mekong basin is such that only a limited number ofbasins is equipped with rainfall and water level recorders. For most locations only daily rainfallis available. The water level gauging network is generally less dense and the monitoring intervalis often too large to properly describe flash flood. Very often only daily water levels is availablefully unsuitable for flash flood analysis. With respect to flow, discharge measurements usuallycover only the lower stages and occasionally include flood data. Dependent on the dataavailability one of the following three procedures is feasible:
1. Flood hazard derived from rainfall extremes.This method is advocated for small basins when little or no data is available on historicalflows. It starts with the specification of the meteorological hazard is terms of designrainstorms of desired return periods. The design rainstorms are adjusted to net rainstormsand transformed into design discharge hydrographs at the required location usingappropriate unit hydrograph and hydrologic routing techniques to arrive at the hydrologicalhazard. Finally, the flood hazard is determined by transforming the peaks of the dischargehydrographs into water levels by means of flow simulation using a hydraulic model.
2. Flood hazard derived from observed flows.When a homogeneous discharge series (>15 years) is available for the concerned riverreach, the hydrological hazard can be derived from statistical analysis of annual flood peaksand flood volumes. A hydraulic model of river and flood plain is subsequently used for thetransformation of hydrological hazard into flood hazard. A selection of representative floodhydrographs, covering the full spectre of flood peaks and flood volumes, are transformedinto water levels using the hydraulic model. The levels and flood volumes are input to aMonte Carlo procedure to derive the frequency of occurrence of water levels as a functionof time and space. Comparing the levels for selected frequencies with a DEM flood hazardmaps can be created.
3. Flood hazard determined from regional flood statistics.The distribution of annual flood peaks can also be obtained from regional flood statisticswhen available. It requires knowledge of the average annual flood peak. For un gaugedstreams this value may be estimated from basin characteristics.

MRC Flood Management and Mitigation Programme Component 2: Structural Measures and Flood Proofing
Guidelines Flood Risk Assessment 16 December 2009
2.3.2 Flood hazard derived from rainfall extremes
When using rainfall extremes for the assessment of the flood hazard the following main stepsare involved:
Collection of relevant information1. Database development and field visit2. Determination of design rainstorms for different return periods3. Transformation of design rainstorms into design hydrographs4. Transformation of design hydrographs into design levels.
These steps are elaborated below.
Step 1 Collection of relevant information
Data required for flood hazard assessment includes:
Digital Elevation Model (DEM) of the area and topographical maps;1. Soils, geological land use maps (past and present);2. Data on historical floods;3. Layout of hydro meteorological network in the river basin, its operation and maintenance;4. Collection of time series of rainfall, climatic variables, and when available of water levels,
stage discharge measurements, discharges and sediment of the river basin;5. Data on hydraulic infrastructure, dimensions and operation in times of flood;6. Survey data of river (cross sections) and flood plain (DEM) at and upstream and
downstream of the reach under investigation and of relevant hydraulic parametersincluding bed material, vegetation, embankment elevation, etc
7. Data on morphological development of the river and its environs, and8. Planned land use and infrastructural developments.
Step 2 Database development and field visit
The collected information is next organized in a database consisting of GIS related and timeoriented data. In the database a clear distinction is to be made between original/raw data, dataunder validation and fully validated data.
Thorough validation, correction and completion procedures should be applied to arrive at areliable set of information. Since this procedure relies heavily on quality rainfall data, availablerecords have to be thoroughly screened using graphical and tabular comparisons (mind rainfallamounts during weekends and holidays in view of possible non availability of observer), nearestneighbour validation and double mass analysis. Nearest neighbours (i.e. closest stations) areused to fill in missing data. Reference is made to standard textbooks for detailed explanation ofthe procedures.
In this data collection and validation process one or more field visits is essential to validatecollected information and to assess its sufficiency. Key rainfall stations have to be visited andmonitoring practices need to be reviewed. Interviewing inhabitants and officials on the extentof historic floods, land use changes and developments is essential. As a result additional datamay be collected or a (temporary) monitoring program is set up and executed.

MRC Flood Management and Mitigation Programme Component 2: Structural Measures and Flood Proofing
Guidelines Flood Risk Assessment 17 December 2009
Step 3 Design rainstorms
The determination of design storms involves the following steps:
1. Assess the time of concentration Tc of the basin up to the location for flood hazardassessment. This is the travel time required for a drop of water from the most upper part ofthe catchment to the outlet. Tc is a measure for the delay in the translation from rainfall torunoff.
2. Determine the basin rainfall from point rainfall for smallest interval available if applicable.
3. Development of intensity (or depth) duration frequency curves for return periods of 2 to100 years, for durations of 5 min to 24 hours. If no short interval rainfall is available thenthe short duration intensities are derived from daily rainfall data. In that case EV1 or GEVdistributions are fitted to the observed distribution of annual maximum daily rainfall, andthe rainfall for selected return periods is determined. These values should be adjusted to 24hr values by applying a correction factor of 1.12. Next, when needed, the 24 hr values arecorrected for possible orographical effects, based on regional rainfall characteristics asfunction of elevation. Then regionally acceptable values for the coefficients b and n in thefollowing intensity duration relation are to be obtained:
( )naI
b D (2.1)where: I = rainfall intensity (mm/hour)
D = rainfall duration (hours)a,b,n = constants
Values for coefficients for Phnom Penh e.g. are b = 0.23 and n = 0.86 (Watkins et al., 1984).
Finally, the Rainfall Ratio Method is used to derive the rainfall for durations shorter than 24hrs. The Rainfall Ratio method assumes that the constants in equation (2.1) apply for alldurations less than 24 hours and all return periods. In that case the rainfall of duration D forany return period is derived from the 24 hour rainfall extreme via equation (2.1) as follows:
2424
n
DD bRR
b D (2.2)where: RRD = rainfall ratio for conversion of 24 hr rainfall into D hr rainfall
D = rainfall duration (hours)
4. In case of single point rainfall, correct the point rainfall for spatial distribution by applicationof an Area Reduction Factor (ARF) as a function of basin area (A) and rainfall duration (D).For e.g. convective rainfall the function is applied in Cambodia with D in hours and A in km2:
0.33 0.50
0.50
8 : 1 0.048 : 1 0.02
for D hrs ARF D Afor D hrs ARF A (2.3)
5. The design rainstorms for selected return periods can be obtained by the incrementalintensity of the rainfall totals of the calculated durations up to the time of concentration:
1, ,1
1
:j jA D A Dj j j
j j
R R mmI for D DD D hr
(2.4)where: Ij = jth incremental intensity (mm/hr)
RA,D = areal rainfall of duration D

MRC Flood Management and Mitigation Programme Component 2: Structural Measures and Flood Proofing
Guidelines Flood Risk Assessment 18 December 2009
6. The incremental intensities are subsequently arranged around the peak value. The locationof the peak is determined by the storm advancement coefficient r which is the ratio of thetime to peak relative to the total duration of the design storm Tc. The advantage of thisprocedure is that up to Tc all design intensities are included in the design storm. Otheroptions are triangular hyetographs, where the occurrence of the peak value is determinedby the storm advancement coefficient. When possible the arrangement is according toobserved hyetographs in the region. The availability of short duration rainfall then is anecessity.
7. Repeat the above step for required return periods to arrive at a set of hyetographs.
Step 4 From design storm to design hydrograph
The transformation of a design rainstorm into a design hydrograph involves the following:1. Determination of the net rainfall by estimation of losses, to be distributed among the
ordinates of the hyetograph;2. Development of a unit hydrograph of the basin up to the required location, and3. Convoluting the net hyetograph to the design hydrograph using the unit hydrograph
developed under the previous activity.
To determine the rainfall losses, use can e.g. be made of the SCS Curve Number method,applied for wet antecedent moisture conditions. This method requires information about soils,land use and treatment of the land to arrive at a curve number. The Curve Number (CN) methodis extensively described in hydrological textbooks (e.g. Viessman, 1989).
To develop a unit hydrograph of the basin it is advocated that use is made of the Clark method.This method is based on the routing of a time area diagram with a time base equal to theconcentration time Tc through a linear reservoir, simulating channel storage.
When the unit hydrograph has been established, the net design rainstorm is convoluted to adesign hydrograph, which comprises the hydrological hazard with a return period equal to thereturn period of the design rainstorm. This assumption is valid in view of the wet antecedentmoisture conditions assumed in the computation, reducing the abstractions that cause thedifference between extremities of storms and discharge hydrographs under less wet initialconditions. By repeating this process for design rainstorms of different return periods�’ peak,discharge values are obtained for the locations and a frequency distribution can be obtained.
Above procedure is applicable to relatively small catchments, say up to 1,000 km2. With somemodification, this procedure can also be applied to larger areas. Then use is made of asegmented approach to the transformation of excess rainfall into runoff to allow spatialvariation in the excess rainfall and runoff characteristics. In that case the basin up to thelocation of interest is divided into segments and the rainfall runoff transformation is applied toeach segment. The output of each segment is subsequently routed to the area of interest. Thisrouting can be done by simple hydrologic routing methods or with the hydraulic modelextended to the outlet of the uppermost segment.
Step 5 From design hydrographs to design levels
By means of hydraulic model simulation the peak discharges are transformed into water levelsof required return periods. The hydraulic model is schematised according to detailedbathymetric survey data on river and flood plain and estimated or calibrated hydraulicroughness. The calculations should include existing flood protection for calibration and plannedprotection works for investigation of alternatives, as these may back up future water levelsfurther upstream.

MRC Flood Management and Mitigation Programme Component 2: Structural Measures and Flood Proofing
Guidelines Flood Risk Assessment 19 December 2009
2.3.3 Example of flood hazard derived from rainfall extremes
An example of above procedure is provided for a hypothetical basin in Upper Se San near Pleiku,assuming that only daily rainfall series are available. For the development of a design storm thefollowing parameters have been assumed:
Basin area is 50 km2; Rainfall intensity parameters for disaggregation of daily rainfall (equation 2.1) b = 0.23 and
n = 0.86 apply; Storm advancement coefficient r = 0.3; ARF for convective storms in tropical countries apply; and Rainfall conditions are similar to Pleiku with orographic adjustment factor of 1.25.
Daily rainfall series for Pleiku (station 140703) are available for the period 1927 2006, with gaps.After validation and homogeneity tests EV1 and GEV distributions have been fitted to theannual maximum rainfall of the station. The results are shown in Table 2.2 and Figure 2.3.
Table 2.2 Parameters of EV1 and GEV distributions fitted to annual maximum daily rainfall atPleiku and rainfall values (mm) for selected return periods.
Parameters/
Return period (years)
Pleiku
EV1 GEV
k
u
30.12
98.08
0.0048
30.26
98.11
2
5
10
25
50
100
500
1000
109
143
166
194
216
237
285
306
109
143
166
194
215
236
283
304
Annual maximum daily rainfall at Pleiku, 1927-2006
0
50
100
150
200
250
300
350
-2.00 -1.00 0.00 1.00 2.00 3.00 4.00 5.00 6.00
Reduced EV1 variate
Ann
ual m
axim
um ra
infa
ll (m
m)
ObservationsEV1 distributionGEV distribution
Figure 2.3 EV1 and GEV fit to annual maximum daily rainfall at Pleiku, Period 1927 2006.

MRC Flood Management and Mitigation Programme Component 2: Structural Measures and Flood Proofing
Guidelines Flood Risk Assessment 20 December 2009
The depth duration frequency curves have been derived for intervals of 5 min to 24 hrs startingoff from the daily rainfall extremes for T = 2 to 100 years, using equation (2.2). The results arepresented in Table 2.3 and shown in Figure 2.4.
The calculation of the T = 50 year design storm is indicated in Table 2.4. The result is presentedin Figure 2.5. It follows from a re ordering of the derived incremental intensities. Here a basicinterval of 15 minutes has been assumed. The sensitivity of the design hydrograph for thechoice of this interval is to be investigated, once the basin Unit Hydrograph is known. Thisprocedure is to be repeated for other selected return periods.
Table 2.3 Short duration rainfall (mm) at Pleiku derived from daily rainfall extremes.
Duration
Rainfall ratio
Return Period in years
hrs RR 2 5 10 25 50 100
5 min 0.083 0.15 18 23 27 32 35 39
10 min 0.167 0.24 29 38 44 52 58 63
15 min 0.250 0.30 37 49 56 66 73 81
30 min 0.500 0.42 52 68 79 92 102 112
1 hr 1 0.54 66 87 101 117 131 144
2 hr 2 0.65 79 104 121 141 157 172
4 hr 4 0.75 91 120 139 162 181 198
8 hr 8 0.84 103 135 157 183 204 224
12 hr 12 0.90 110 144 167 196 218 239
18 hr 18 0.96 117 153 178 208 232 254
24 hr 24 1.00 122 160 186 217 242 265
Day Day 109 143 166 194 216 237
Depth-duration-frequency curves for Pleiku
0
50
100
150
200
250
300
0.01 0.10 1.00 10.00 100.00
Duration in hrs
Rai
nfal
l (m
m)
T = 2 yearT = 5 yearT = 10 yearT = 25 yearT = 50 yearT = 100 year
Figure 2.4 Depth duration frequency curves for Pleiku.

MRC Flood Management and Mitigation Programme Component 2: Structural Measures and Flood Proofing
Guidelines Flood Risk Assessment 21 December 2009
Table 2.4 Computation of design storm ordinates for 15 min intervals.
Time (hrs) 0.25 0.50 1.00 2.00
Point Rainfall (mm) 73 102 131 157
Correction for orography 92 128 164 196
ARF 0.55 0.64 0.72 0.78
Areal rainfall (mm) 51 82 117 152
Incremental intensity (mm/hr) 202 127 70 35
No of 15 min increments 1 1 2 4
2 hr-design rainstorm for Pleiku, T = 50 years
0
50
100
150
200
250
0.25 0.50 0.75 1.00 1.25 1.50 1.75 2.00
Duration (hrs)
Rai
nfal
l (m
m/h
r)
Figure 2.5 A 2hour design rainstorm for Upper Se San derived from Pleiku.
In the development of the flood hazard the next step is the transformation of the design storminto the design hydrograph. This involves first the assessment of the excess rainfall. For this theCurve Number Method can be used.
Subsequently, the Unit Hydrograph of the basin is determined, for which the use of the ClarkMethod is advocated. The method is based on the routing of a time area diagram (with a timebase equal to the time of concentration Tc) through a linear reservoir, simulating channelstorage. For the diagram isochrones are constructed representing points of equal travel time tothe segment outlet; see Figure 2.6.
The time area diagram fully represents the physical runoff characteristics from (mountainous)catchments. This diagram can be thought of as the outflow from the basin if only translationand no deformation take place of an instantaneous unit supply of rain. Flow paths, slopes andhydraulic roughness determine the celerity and can readily be obtained from a DEM or atopographic map. Beside the concentration time it requires the estimation of a recessioncoefficient k for routing of the time area diagram. It is noted that the output from the reservoirrepresents the instantaneous unit hydrograph (IUH). This has to be transformed into a UnitHydrograph (UH) of the required interval by multiplication with observed rainfall depths. Thetwo parameters Tc and k can be also be obtained from observed rainfall and dischargehydrographs.

MRC Flood Management and Mitigation Programme Component 2: Structural Measures and Flood Proofing
Guidelines Flood Risk Assessment 22 December 2009
area
kTc
UH
(t)
IUH UH
time
Time-area diagram
Linearreservoir
1-hourUnit
Hydrograph
1
23
45
67
isochrones
segment
7 6 5 4 3 2 1
time
Figure 2.6 Principle of the Clark Unit Hydrograph method.
The time of concentration is equal to the time interval between cessation of rainfall and thetime the hydrograph has receded to its inflection point. Note that this is only applicable whendrainage conditions and infrastructure have not or will not change. If changed it is determinedfrom physical features of the segment as length and slope. The recession coefficient k isdetermined from the slope of the recession part of the surface runoff hydrograph. Using thisUnit Hydrograph the excess hyetograph is convoluted to arrive at the design flood for theselected return periods. Based on these results a frequency distribution of the floods resultingfrom the selected rainfall duration (equal to the time of concentration) is prepared.
It is to be verified whether storms of shorter or longer duration lead to higher peaks. This will bedependent on the intensity distribution in the rainstorm and the way the losses are distributedover the rainfall ordinates.
The frequency distribution of flood peaks can be transformed to design flood levels by means ofbackwater calculations. If storages upstream play a role, then also the full flood hydrographshould be routed through the hydraulic network, with realistic initial values for the storages.
2.3.4 Flood hazard determined from observed flows
When discharge series of sufficient length ( 15 years) are available then the hydrologicalhazard can be determined by statistical analysis of these data, provided that the series arereliable and homogeneous. This procedure involves the following steps:
1. Collection of relevant information.2. Database development and field visit.3. Assessment of the hydrological hazard in terms of flood peaks and flood volumes.4. Transformation of selected flood hydrographs to flood levels using a hydraulic model.
MRC Flood Management and Mitigation Programme Component 2: Structural Measures and Flood Proofing
Guidelines Flood Risk Assessment 23 December 2009
5. Flood hazard is assessed by means of a Monte Carlo procedure, interpolating between thesimulated water levels based on samples from the flood peak and volume distributions.
6. Preparation of flood maps by selection of flood levels, durations etc. of the same returnperiod.
Step 1 Collection of relevant information
See also Step 1 in the procedure described in Section 2.3.2, since the required data for this typeof flood hazard assessment does not differ much from the one above. Here, special emphasis ison the hydrometric network layout and operation, sampling and measurement procedures,station and equipment maintenance, gauge range and re settings, available water level series,stage discharge data and assumed discharge ratings with extrapolation procedures anddischarge series.
Step 2 Database development and field visit
See also Step 2 in the procedure described in Section 2.3.2.
Thorough validation, correction and completion procedures should be applied to arrive at areliable set of discharge data. It requires inspection of all hydrometric stations relevant forassessment of the hydrological hazard and validation of the key stations. Flood marks arelevelled and discussed with local people. When lateral inflow is to be determined from rainfallalso the rainfall network should be inspected. The hydraulic infrastructure and flood protectionworks should be included in the field visit, to ascertain their capacity and operation in times offlood and their effect on the shape of the hydrograph due to storage and/or backwater.Developments in the basin, which may have affected the hydrograph and specifically the peakvalue, have to be quantified.
Screening of the historical water levels involves inspection of the behaviour of hydrographs,comparison with hydrographs at nearby stations, stage relation curve analysis to identifyoutliers and gauge shifts and comparison of hydrographs with hyetographs on logic of response.Special attention is given to differences between instantaneous peak levels and maximum dailyaverage levels, which latter information is generally only available in the databases. The peak ofthe hydrographs should later be adjusted for this phenomenon.
Stage relation curves (with appropriate time shifts to account for flood wave celerity) may beapplied to fill in gaps. With respect to the stage discharge data the stage data is first comparedwith the stage hydrograph. The computation of the discharge from field data is checked and itsaccuracy is assessed. Possible backwater and unsteady flow effects are to be identified bymeans of a first order backwater calculation and assessment of the Jones correction,respectively. The establishment of the discharge ratings is to be inspected, with specialemphasis on the extrapolation. The latter should be physically based!
Next, the discharge rating is applied to the water level series for computation of the dischargeseries. A comparison is made with the series in the database. Discharge hydrographs atneighbouring stations are compared graphically and the consistency is checked by means ofwater balances and double mass analysis. Similarly, peak values are validated. Subsequently,peak values are analysed on possible trends and other anomalies, graphically, statistically andfrom documents on drainage conditions. Trends and anomalies are to be eliminated.
Special attention is to be given to the variability of the discharge ratings at locations due tomorphological developments in the river bed. The variation of the water level for distinct highdischarges through the years is to be determined in order to assess the additional uncertainty inthe water level when a specific discharge rating is used in the model.

MRC Flood Management and Mitigation Programme Component 2: Structural Measures and Flood Proofing
Guidelines Flood Risk Assessment 24 December 2009
Step 3 Assessment of hydrological hazard
The features of the hydrograph which are of importance for flood hazard assessment includethe peak value in view of maximum levels and the flood volume which determines the durationof flooding. The following activities are required:
1. For flood peaks: Creation of a homogeneous series of annual maximum flows of sufficient length; Application of extreme value analysis to the annual maximum series to derive
frequency distributions for the flow extremes; For locations upstream of Vientiane it is advised to compare the obtained distribution
with the regional flood frequency curve described in Section 2.3.5.
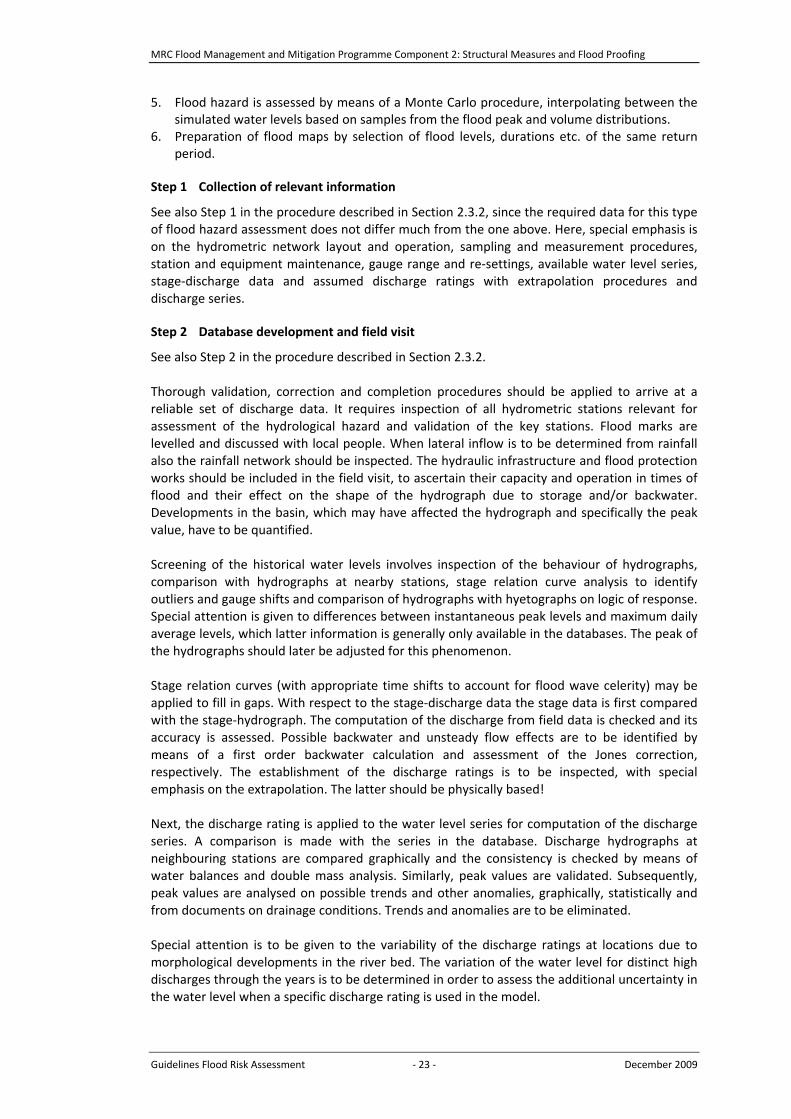
2. For flood volumes: Selection of 20 to 25 largest floods; Derivation of a regression relation between flood peaks and flood volumes (V = f(Q))
and its scatter, or �“standard error�”, (Se). The regression line gives the �“average�” or�“expected�” value of the flood volume, for given values the flood peak. The expectedflood volume increases with increasing flood peak. The relation is not perfect, though,i.e. there will be some scatter (volumes above and volumes below the expected value).Figure 2.7 shows an example of such a regression line and the deviation from the linefor a single point. The value Se is the standard deviation of all points with respect to theregression line and will be used (step 3) in the procedure to take the effect of scatterinto account;
Derivation of representative dimensionless flood hydrographs from the selectedhydrographs. The base of the hydrograph should be long enough to represent the fullduration of characteristic floods (from M days before till N days after the peak. For eachflood assign the time of Qmax to time step t=0 and determine for t = M, �…, t=0, ..., t=Nthe discharge relative to Qmax (=Q/Qmax) and repeat the procedure for all otherselected peaks. Then, apply a frequency analysis on Q/Qmax for each time t = M, �…,t=0, ..., t=N. The result is a distribution function of Q/Qmax for each time step. So, forany give probability, p, of (non )exceedance the value of Q/Qmax is known for all timesteps. Connection of these values gives the (dimensionless) hydrograph for p. In thismanner, for a variety of p values hydrographs are defined and used in the next step.
3. Creation of flood peak flood volume matrix for hydraulic simulations: Selection of flood peaks of return period 2, 5, 10, 25, 50 and 100 year; Determination of a range of flood volumes for the selected flood peaks, based on the
scatter around the flood volume flood peak regression relation, V = f(Q). For eachselected peak value a very low (R 1.96 Se), a low (R Se), medium (R) , high (R+Se) andvery high flood volume (R+1.96 Se) by scaling of the representative flood hydrographsto the flood peak of selected return periods. This results into 6 x 5 = 30 hydrographs;
Adjustment of flood hydrographs for differences between daily average flow maximaand instantaneous peak flows;
Lateral inflows, assumed to be relatively small, are introduced as a percentage of theselected flood hydrograph.

MRC Flood Management and Mitigation Programme Component 2: Structural Measures and Flood Proofing
Guidelines Flood Risk Assessment 25 December 2009
regression flood peak/flood volume
0
500
1000
1500
2000
2500
0 20 40 60 80 100 120 140 160 180
flood peak
flood
vol
ume
deviation from regression line
regression line
Figure 2.7 Hypothetic regression relation between flood volume and flood peak. As an example,this Figure shows the deviation from the regression line for a single observation.
Step 4 Transformation of flood hydrographs to flood levels
An accurate hydraulic model is to be developed for the river and flood plain underconsideration, where the model boundaries are chosen in agreement with the hydrometricnetwork and the limits of the area of interest. It is advised to select a 1D 2D hydraulic model,where the rivers are represented 1D and the flood plain 2D, readily derived from a DEM. Thisapproach has clear advantages over a quasi 2D approach, which is a 1D model with storage cellsfor the flood plain, where human subjectivity is involved in the schematisation of theconnection between river and flood plain. The 1D 2D model has also advantages over a full 2Dmodel, as in the latter narrow river cannot be properly represented. The model should becalibrated for river and flood plain conditions representing the base case. Special attention is tobe given to the position of the river bed in comparison with possible bed shifts due tomorphological developments.
The 30 selected hydrographs are subsequently routed in the model through the river and floodplain system and the computed water level as function of time and space are stored in adatabase for further elaboration in a Monte Carlo procedure for flood hazard assessment. Thesesimulations are repeated for development scenarios under consideration, after adjustment ofthe hydraulic model for the scenario conditions.
Step 5 Flood hazard assessment
The probability of exceedance of a water level at any location is determined by application ofthe Monte Carlo method. This method consists of a large number (N) of paired samples of thepeak discharge and flow volume. In this procedure the derived frequency distribution of peakdischarges is used to sample the peak discharges. Subsequently the flood volume is derivedfrom the peak discharge, taking the sum of:
1. the regression line to derive the �“expected�” volume, given the value of the peak discharge;

MRC Flood Management and Mitigation Programme Component 2: Structural Measures and Flood Proofing
Guidelines Flood Risk Assessment 26 December 2009
2. a sample from the normal distribution with mean 0 and standard deviation Se (see step 2)to derive the deviation from the expected volume.
Application of this procedure ensures that sampled volumes are correlated to the sampled peakdischarges in the same manner as the correlation that was obtained from the data. For eachsampled pair the water levels at locations of interest are derived from 2 dimensionalinterpolation in the grid of the 6 x 5 simulated hydrographs. The result is a N year syntheticseries of water levels h1, �…, hN, at each location. From this series the T year flood levels can beeasily derived with e.g. Gringortens formula:
0.440.12
iirpN (2.5)
where: pi = probability of exceedance of synthetic water level hiN = total number of Monte Carlo samplesri = rank number of the maximum synthetic water level hi
(1 = highest, N = lowest)
Step 6 Preparation of flood maps
The mapping of the hydraulic modelling results is described for mainstream flows in Section 2.7.For tributary floods the mapping principles are the same, but the interpolation method is morecritical because of the hilly terrain.
2.3.5 Flood hazard derived from regional flood statistics
Adamson (2007) proposed the use of a regional approach for flood hazard assessment. Themethod has been developed for the upper part of the LMB for 16 drainage basins with areasranging from 200 to 6000 km2 and 1 basin of 19,700 km2. The technique is generally applicableprovided the regional curve is valid for the concerned basin. Its development involves thefollowing steps:
1. Creation of a regional sample of annual maximum flood peaks by pooling the individualannual maximum values, scaled to their individual mean annual flood value. Discordanceand homogeneity test should be applied to assure regional homogeneity of the selectedstations (see Hosking and Wallis, 1997).
2. Subsequently, an extreme value distribution is fitted to the scaled ranked annual extremes.For the LMB basins considered by Adamson (2007) the TCEV (Two Component ExtremeValue) distribution fits to the observed frequency distribution of pooled values. The regionalcurve for the upper part of the LMB is shown in Figure 2.8. The TCEV distribution waschosen to account for the different phenomena creating the discharge extremes, i.e.monsoon and typhoons, where the latter causes extremes far beyond the monsoon range.
3. To apply the TCEV values to un gauged sites a regional relationship between the meanannual maximum flood discharge and one or more climatic and/or basin characteristic(s)has been developed. For the upper part of the LMB the following relation with drainagearea was found:
0.75 .aveQ A err (2.6)
where: Qave = mean annual maximum flood (m3/s)A = drainage area (km2)
The error about regression is considerable (Se is about 50% of Qave) and it is advised to entermore characteristics in the relation.

MRC Flood Management and Mitigation Programme Component 2: Structural Measures and Flood Proofing
Guidelines Flood Risk Assessment 27 December 2009
Estimated TCEV distribution of the ratio (%) of the T-year event to the mean annual flood for pooled regional sample (n=530) (Source: Adamson (2007))
0
100
200
300
400
500
600
700
1 10 100 1000
Return Period (years)
Rat
io (%
) of T
-yea
r flo
od to
mea
n an
nual
floo
d Lower 95% CL
TCEV-values
Upper 95% CL
Figure 2.8 TCEV distribution of the ratio of the T year event to the mean annual flood for thepooled regional sample (Upper part of LMB, from Adamson, 2007).
Following remarks are made to the use of the regional approach:
In principle the method is very attractive and easy to use, provided that the base data areproperly validated and a much improved relationship is established for the mean annualflood and meteorological and basin characteristics.
The data set used in Adamson (2007) has been taken from the MRC database. Inspection ofthe data reveals inconsistencies in the presented station flow extremes. A thoroughvalidation of the data set is required before the presented regional curve can reliably beused.
Using Adamson�’s data set, Qave appears to correlate well with the mean annual flow, whichin turn should be well correlated with the annual rainfall. The latter quantity can generallybe made available for un gauged streams in view of the better distribution of rain gauges.Furthermore, stream length, basin slopes and land use data can be made availablenowadays from available DEM, which inclusion might improve the estimate of Qave
An adjustment is required for instantaneous peak values relative to daily average maximumvalues applied in above approach. In the case of flash floods a considerable adjustment isexpected as the duration of the flood may be just a number of hours.
2.4 Mainstream floods
2.4.1 General
The hydrological hazard along the Mekong River is determined by the discharge peaks on theriver creating the maximum water levels and by the flood volumes determining the duration offlooding. Transformation of hydrological hazard into flood hazard requires a hydraulic model ofriver and flood plain to transform flows into levels. The model is run for combinations ofselected hydrographs covering the full spectre of possible combinations of flood peaks andflood volumes. Special attention is required to account for variations of the river bed due to

MRC Flood Management and Mitigation Programme Component 2: Structural Measures and Flood Proofing
Guidelines Flood Risk Assessment 28 December 2009
morphological activities, which affects the discharge ratings along the river. The Monte Carlosampling technique is used to derive exceedance probabilities of water levels and flooddamages by interpolation between the simulation results for a very large number ofcombinations of peak discharges, flood volumes and river bed conditions.
The flood hazard assessment for mainstream floods includes the following steps:
1. Data collection.2. Database development and field visit.3. Hydrological hazard assessment in terms of flood peaks and flood volumes.4. Flood hazard assessment by transformation of selected flood hydrographs to flood levels
and application of the Monte Carlo sampling to arrive at flood levels and durations fordistinct return periods.
5. Preparation of flood maps by selection of flood levels, durations etc. of the same returnperiod.
The steps are elaborated in the following sub sections.
2.4.2 Data collection
For assessment of the hazard of mainstream floods following data needs to be collected:
1. Identification of key hydrological stations (Qh stations) along the Mekong enclosing theproblem area, which defines the study area;
2. Survey data of Mekong River (full river bathymetry) and flood plain in the study area andbeyond and relevant hydraulic parameters including bed material, vegetation, embankmentelevation, etc.;
3. Updated Digital Elevation Model (DEM) of the flood plain in the study area;4. Soils map of the flood plain;5. Land use maps of the flood plain, including past, present and future land conditions;6. Data on hydraulic infrastructure in and downstream of the study area, its dimensions and
operation in times of flood and planned developments;7. Historical flood maps (flood levels, extent, depth and duration);8. Layout, operation and maintenance of the hydro meteorological network around the study
area including also nearest upstream and downstream stations along Mekong and stationson the tributaries where relevant;
9. Collection of time series of water levels, stage discharge measurements, discharge ratingsand discharges series of the relevant monitoring stations as well as series of rainfall andclimatic variables in the region;
10. Changes in runoff characteristics of basins upstream of the study area affecting thehomogeneity of the historical discharge series (reservoirs, land use changes).
Below, an overview is given of the agencies to be consulted to obtain the required information.
Cambodia
Ministry of Water Resources and meteorology (MOWRAM) Department of Hydrology and River Works (DHRW), water level, discharge and rainfall time
series; Department of Meteorology (DOM), rainfall, climatic data (air temperature, relative
humidity, wind direction, wind velocity, duration of sunshine, radiation)
Ministry of Public Works and transport (MPWT) Department of Waterways River and lake bathymetry, hydrographic atlas;

MRC Flood Management and Mitigation Programme Component 2: Structural Measures and Flood Proofing
Guidelines Flood Risk Assessment 29 December 2009
Department of Road and transport
Ministry of Agriculture, Forestry and Fishery (MAFF) Department of Agronomy and Agricultural Land Improvement (soil map, land Use maps)
Phnom Penh Municipality: Department of Public Works and Transport of Phnom Penh Municipality, city flood
protection dikes/drainage in and around Phnom Penh
Ministry of Land Urban Planning Land Use and Construction (MUPLC Department of Land Use planning, Commune Land Use Planning (CLUP)
Lao PDR
Water Resources and Environment Administration (WREA)The WREA in a new organization grouping the previously Department of Meteorology andHydrology (DMH) of the Ministry of Agriculture and the Waterways Administration Division(WAD) of the Ministry of Communication, Transport, Post and Communication. WREA nowcollect and supply all related water data in Lao PDR including establishment andmanagement of hydrological and meteorological network.The Hydrographic Atlas data of the Mekong mainstream is also transferred to WREA.
Thailand
Ministry of Agriculture (MAF) Royal Department of Irrigation (RID), manage, collect and disseminate hydro
meteorological data in most of the Mekong tributaries especially the Nam Mae Kok, NamMae Ing, Nam Chi and NamMum
Ministry of Natural Resources and Environment Department of Water Resources management hydro meteorological networks previously
under the Department of Energy Development and Promotion, this includes all the ThaiMekong mainstream stations. Climatic and water quality data previously supported by theMekong Committee were also collected and disseminated by this department includingbathymetric survey and hydrographic atlas.
Ministry of Information and Communication Technology (MICT) Department of Meteorology (TMD), meteorological data, climatic data, weather
forecasting,
Ministry of Interior Department of Disaster Prevention and Mitigation, Department of, Local Administration,
Department of Public Works, town and country planning, flood mapping.
Vietnam
Ministry of Natural Resources science and Environment (MoNRE) Department of Water Resources Management Hydro meteorological Services of Vietnam, Southern Region Hydro meteorological Center:
hydrological, meteorological, water quality, salinity data collection network management,data collection and dissemination, flood, salinity and weather forecasting
Sub National Institute for Agricultural Planning and Production (NIAPP) produce flood mapsin the Mekong delta, soil suitability maps.

MRC Flood Management and Mitigation Programme Component 2: Structural Measures and Flood Proofing
Guidelines Flood Risk Assessment 30 December 2009
Southern Institute of Water Resources Research (SIWRR), hydraulic works ( sluices,hydropower, reservoirs, sea, dikes, embankments), river training works, coastal zonemanagement (river morphology, strategies and work for river bank protection), irrigation,drainage, soil reclamation, water supply and drain. Operate and maintain meteorological,hydrological data, cross sections for Mekong Delta and Dong Nai basin.
2.4.3 Database development and field visit
The collected information is to be organized in a database consisting of GIS related and timeoriented data. In the database a clear distinction is to be made between original/raw data, dataunder validation and fully validated data.
During the field visit the data on flood protection and hydraulic infrastructure in the study areawill be checked, including maintenance and operation in times of flood. All key hydrometricstations will be visited and monitoring and discharge measurement practices be reviewed.Gauge stations and gauge histories will be inspected, including gauge reach, staff gaugeconnections, bench marks, gauge zero controls and shifts, gauge damages and repairs as well asrecords from manual and automatic gauges compared. Flow measurement equipmentcalibration and functioning will be tested. Inhabitants and officials will be interviewed on theextent of historic floods, flood protection developments and land use changes. Flood marks arelevelled and discussed with local people. As a result of the field visit when required additionaldata may be collected or a (temporary) monitoring program set up and executed.
2.4.4 Data validation and processing
Thorough validation, correction and completion procedures should be applied to arrive at areliable set of discharge data:
Screening of the historical water levels involves inspection of the behaviour ofhydrographs, comparison of hydrographs at nearby stations, stage relation curve analysisto identify outliers and gauge shifts. Stage relation curves (with appropriate time shifts toaccount for flood wave celerity) may be applied to fill in gaps.
Stages of discharge measurement data are first compared with the stage hydrograph. Thecomputation of the discharge from field data is checked and its accuracy is assessed.Possible backwater and unsteady flow effects are to be identified by means of a first orderbackwater calculation and assessment of the Jones correction, respectively. Theestablishment of the discharge ratings is to be inspected, with special emphasis on theextrapolation. The latter should be physically based, taking into account flood protectionworks in and downstream of the section! The variability of the discharge ratings atlocations due to morphological developments in the river bed is to be assessed, bydetermining the variation of the water level for distinct high discharges through the years.Particularly, this change is assessed for the natural bank full discharge.
The discharge rating is applied to the water level series for computation of the dischargeseries. A comparison is made with the series in the database. Discharge hydrographs atneighbouring stations are compared graphically and the consistency is checked by meansof water balances and double mass analysis. Similarly peak values are validated.Subsequently, peak values are analysed on possible trends and other anomalies,graphically, statistically and from documents on drainage and storage conditions. Trendsand anomalies are to be eliminated.

MRC Flood Management and Mitigation Programme Component 2: Structural Measures and Flood Proofing
Guidelines Flood Risk Assessment 31 December 2009
2.4.5 Hydrological hazard
The hydrological hazard is determined by peak flow and flood volume, taking into account theirinterrelation. A matrix of flood hydrographs is to be established covering the full spectre ofpossible hydrographs with peak values T 2 years. The development of this matrix involves thefollowing activities:
1. Creation of homogeneous discharge series for the key station at the upper boundary of theconcerned river reach;
2. Estimation of the marginal distributions of annual flood peaks and flood volumes (1 June 30November) at this upper boundary. The observed distributions of flood peaks and floodvolumes are generally well represented by a GEV distribution;
3. Development of a regression relation of flood volume (V) on flood peak (Qp) (V = f(Qp)) andestimate its standard error SeV, similar to step 3 in Section 2.3.4;
4. Specification of the matrix of flood hydrographs for distinct discharge peaks similar to step3 in Section 2.3.4.
Changes in the stage discharge rating due to bed variations can be accounted for by changingthe hydraulic roughness of the hydraulic model commensurate with the change in the waterlevel. For this purpose the changes in the water level for natural bank full flow from year to yearis assessed. The effect can be obtained from comparison of applied discharge ratings or plots ofdischarge series versus water level series, (provided that shifts in gauge zeros have beeneliminated). The differences are given relative to the levels from the discharge rating used in thecalibration of the hydraulic model (see Section 2.3.6) and are determined for all key stations inthe modelled reach. According to Manning�’s equation for a wide cross section, if the waterdepth at bank full discharge changes from h1 to h2 = h1 + h, then without changing the crosssections one has to adjust the hydraulic roughness n1 to n2 as follows to correct for the waterlevel change:
5 / 3
22 1
1
hn n
h(2.7)
Note that the stage discharge relation at the downstream boundary has to be adjustedaccordingly, to avoid unwanted backwater effects.
2.4.6 Flood hazard assessment
The hydrological hazard in terms of peak flow statistics is transformed into water levels bymeans of a hydraulic model of the concerned Mekong river reach. An accurate hydraulic modelis to be developed for the river and flood plain under consideration, where the modelboundaries are chosen in agreement with the hydrometric network and the limits of the area ofinterest. It is strongly advised to select a 1D 2D hydraulic model, where the Mekong river isrepresented 1D and the flood plain 2D, readily derived from a DEM. This approach has clearadvantages over a quasi 2D approach with storage cells, where human subjectivity is involved inthe schematisation of the connection between river and flood plain. The model should becalibrated for river and flood plain conditions representing the base case. Special attention is tobe given to the position of the river bed in comparison with possible bed shifts due tomorphology.
Subsequently, with the model the 30 selected hydrographs are routed through the river andflood plain system and the computed water level as function of time and space are stored in adatabase. Next, above procedure is repeated at least twice with adjusted hydraulic roughnessand downstream stage discharge relations to cover the full range of water level changes forbank full discharge. These results are added to the database for elaboration in a Monte Carloprocedure for flood hazard assessment. These simulations are repeated for development

MRC Flood Management and Mitigation Programme Component 2: Structural Measures and Flood Proofing
Guidelines Flood Risk Assessment 32 December 2009
scenarios under consideration, after adjustment of the hydraulic model for the scenarioconditions.
The final step is the execution of a Monte Carlo analysis in the same manner as described instep 5 of Section 2.3.4.
2.4.7 Example: Mekong near Nhakon Phanom (Thailand)
Preparations for Monte Carlo analysis
Figure 2.9 shows the GEV function fitted to the series of observed annual maximum dischargesof the Mekong river at Nakhon Phanom. From this function, discharges with return periods of 2,5, 10, 25, 50 and 100 year are derived (Table 2.5). Subsequently, the relation between peakflows and flood volumes (total flow volumes from July 1st until November 30th) is derived fromregression analysis (full line in Figure 2.10). Also the spread around this line is depicted in Figure2.10 by the 4 graphs at distances 1.96 Se, Se, 0, +Se, +1.96 Se from the regression line (Se is thestandard deviation from the regression line). Then, for each selected flood peak flood volume ofTable 2.5, the 5 accompanying flood volumes are specified according to the spread in the floodvolume peak discharge relation. Figure 2.11 shows the resulting 30 (6 5) grid points incombination with the lines of Figure 2.10.
For each of the 30 grid points a model simulation with Isis is executed to derive water levels atvarious locations for a range of hydraulic conditions. The simulations serve as the basis for theMonte Carlo analysis. For these simulations, Isis requires 30 hydrographs of daily discharge asinput series. These (synthetic) hydrographs need to have the same features (i.e. peak dischargeand flow volume) as the 30 grid points. In order to obtain realistic synthetic hydrographs,observed hydrographs are selected and (slightly) adapted. The observed hydrographs thatclosest resemble the features of the grid points are selected. This selection procedure isdepicted by the green lines in Figure 2.12). The observed hydrograph is then �“scaled�” in such away that its peak discharge and flow volume are exactly equal to that of the associated gridpoint. Figure 2.13 shows an example of such scaling. In this example the peak was slightlyaltered, but the remainder of the hydrograph was slightly lowered to decrease the flow volume.The resulting hydrograph is still very much realistic since it closely resembles the observedhydrograph.

MRC Flood Management and Mitigation Programme Component 2: Structural Measures and Flood Proofing
Guidelines Flood Risk Assessment 33 December 2009
Figure 2.9 Fit of the GEV function to annual maximum daily discharge of the Mekong at NakhonPhanom.
Table 2.5 Parameters of the GEV distribution fitted to annual maximum daily discharge of theMekong at Nakhon Phanom and discharges (m3/s) for selected return periods.
parameter value
k 0.309
4,685
u 24,475
return period (years) discharge (m3/s)2 26,0985 30,097
10 32,07025 33,98950 35,090100 35,970
Figure 2.10 Peak discharge Flood volume relation at Nhakon Phanom.
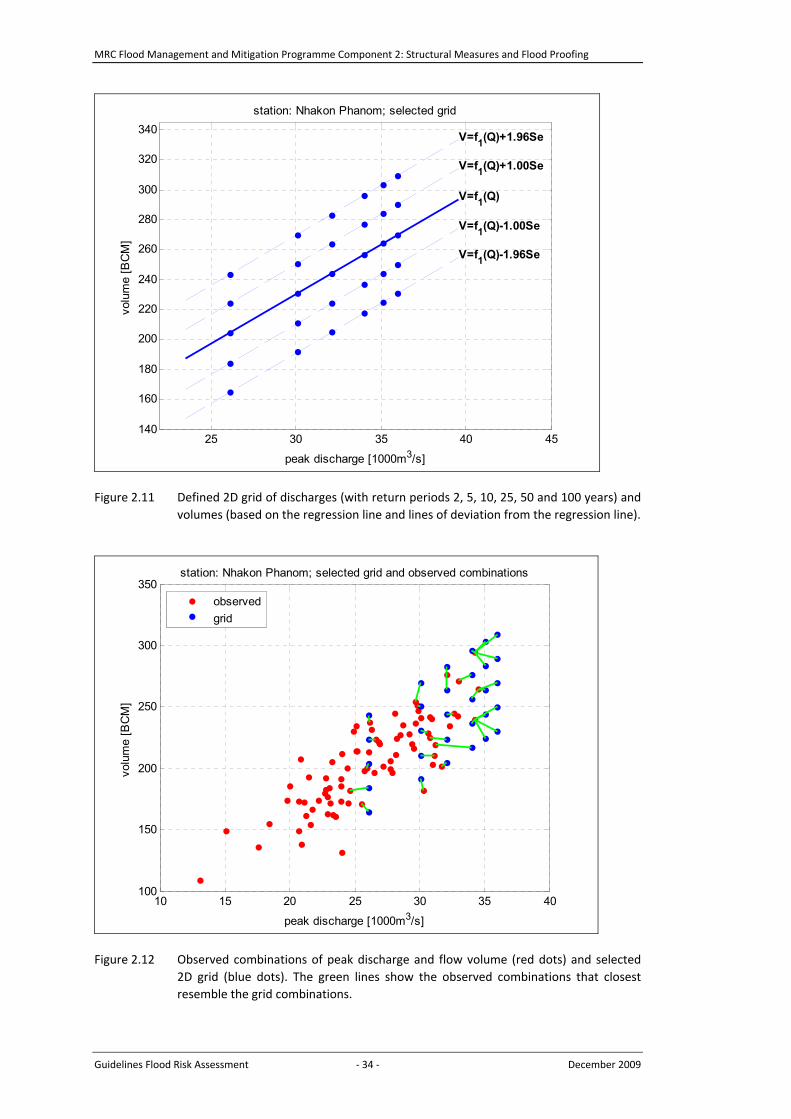
MRC Flood Management and Mitigation Programme Component 2: Structural Measures and Flood Proofing
Guidelines Flood Risk Assessment 34 December 2009
25 30 35 40 45140
160
180
200
220
240
260
280
300
320
340
V=f1(Q)-1.96Se
V=f1(Q)-1.00Se
V=f1(Q)
V=f1(Q)+1.00Se
V=f1(Q)+1.96Se
peak discharge [1000m3/s]
volu
me
[BC
M]
station: Nhakon Phanom; selected grid
Figure 2.11 Defined 2D grid of discharges (with return periods 2, 5, 10, 25, 50 and 100 years) andvolumes (based on the regression line and lines of deviation from the regression line).
10 15 20 25 30 35 40100
150
200
250
300
350
peak discharge [1000m3/s]
volu
me
[BC
M]
station: Nhakon Phanom; selected grid and observed combinations
observedgrid
Figure 2.12 Observed combinations of peak discharge and flow volume (red dots) and selected2D grid (blue dots). The green lines show the observed combinations that closestresemble the grid combinations.

MRC Flood Management and Mitigation Programme Component 2: Structural Measures and Flood Proofing
Guidelines Flood Risk Assessment 35 December 2009
14/05 03/06 23/06 13/07 02/08 22/08 11/09 01/10 21/10 10/11 30/110
5
10
15
20
25
30
date
disc
harg
e [1
000m
3 /s]
(scaled) hydrograph at station Nhakon Phanom; year: 1972observed peak: 25500 [m3/s]; scaled peak: 26098 [m3/s]observed volume: 172 [BCM]; scaled volume: 165 [BCM]
observedscaled
Figure 2.13 Example of scaling an observed hydrograph to make it suitable for serving as one ofthe grid points in Figure 2.12.
Monte Carlo analysis and results
For this example a Monte Carlo analysis with N=100,000 samples was executed. For theresulting N water levels the probability of exceedance is estimated through application offormula (2.5) of Section 2.3.4. For a floodplain just downstream of Nakhon Phanom, theresulting frequency curve for the water level is shown in Figure 2.14. It starts with a basic levelof just over 130 [m+MSL]. This is the output of the Isis model if the floodplain location does notflood during the year. The probability that this happens is approximately 0.5 per year. Naturally,for increasing water levels the probability of exceedance are lower. The 100 year water level isapproximately equal to 134.8 m+MSL (where the graph crosses the line of x = 10 2 per year). In asimilar matter the 100 year water level can be determined for other locations. Based on theresults for all locations a spatial map can be produced with the GIS procedures as mentioned inSection 2.7).
2.5 Combined floods
2.5.1 General
Combined floods are floods that occur in the downstream sections of the tributaries, where theflood level is determined by the combination of tributary flow and the water level in theMekong, backing up the stages on the tributary and impeding the drainage.

MRC Flood Management and Mitigation Programme Component 2: Structural Measures and Flood Proofing
Guidelines Flood Risk Assessment 36 December 2009
Figure 2.14 Derived frequency curve for maximum annual water levels at a location in thefloodplain just downstream of Nhakon Phanom.
The hydrological hazard of tributary runoff with high water levels at the confluence with theMekong is transformed into water levels in river and flood plain in the backwater affected zonenear the mouth by means of a hydraulic model, which is run for the full spectre of possiblecombinations of upstream inflow and downstream levels. The hydraulic model should cover thetributary with flood plains from a backwater free location to the confluence, whereas theMekong reach around the confluence is enclosed by key hydrometric stations, applyingdischarge hydrographs upstream and a stage discharge relation downstream.
The simulation results are used in a Monte Carlo procedure to derive the exceedanceprobabilities of water levels and flood damages. The procedure uses in principle three or fourrandom variables, representing the main causes for high water levels in the downstream part ofthe tributary backed up by the mainstream:
1. maximum discharge in the Mekong at the confluence;2. total volume of the flood in the Mekong at the confluence;3. total volume of the tributary flood, and4. maximum discharge in the tributary.
Note that it may not always be necessary to explicitly take the tributary peak flow into account,particularly when flood plain inundations and associated damages are considered. In such casesthe tributary flood volume, rather than the peak plays an important role. On the other hand,tributary peak flow becomes of importance when flood protection works along the tributary areto be designed and tributary flood volumes have little value. In practice, to limit thecombinations, generally one of the two is considered and only rarely both.

MRC Flood Management and Mitigation Programme Component 2: Structural Measures and Flood Proofing
Guidelines Flood Risk Assessment 37 December 2009
Special attention is required to account for variations of the river bed due to morphologicalactivities, which affects the conveyance of the rivers and hence the resulting stages. This maylead to the introduction another variable in the Monte Carlo procedure: the river conveyance.
Finally, combining the water levels of equal probability and comparing the results with a DEMflood maps of levels, depth and duration can be created.
The flood hazard assessment for combined floods includes the following steps:
1. Data collection.2. Database development and field visit.3. Hydrological hazard assessment in terms of flood peaks and flood volumes on the Mekong
and the tributary.4. Flood hazard assessment by transformation of a selected combination of flood hydrographs
to flood levels using a hydraulic model and interpolating between the simulated waterlevels by means of a Monte Carlo procedure to arrive at flood levels and durations fordistinct return periods.
5. Preparation of flood maps: see Section 2.7.
The steps are elaborated in the following sub sections.
2.5.2 Data collection
For assessment of the hazard of combined floods following data is required and needs to becollected:
1. Identification of key hydrological stations (Qh stations) on the tributary to beyond thebackwater reach of the mainstream and the along the Mekong enclosing the problem area.This defines the study area;
2. Survey data of tributary and Mekong River (full river bathymetry) and of flood plains in thestudy area and beyond and data of relevant hydraulic parameters including bed material,vegetation, embankment elevation, etc.;
3. Updated Digital Elevation Model (DEM) of the flood plain in the study area;4. Soils map of the flood plains;5. Land use maps of the flood plain, including past, present and future land use;6. Data on hydraulic infrastructure in and downstream of the study area, its dimensions and
operation in times of flood and planned developments;7. Historical flood maps (flood levels, extent, depth and duration);8. Layout, operation and maintenance of the hydro meteorological network around the study
area including also nearest upstream (and for Mekong also downstream) stations along thetributaries and Mekong where relevant;
9. Collection of time series of water levels, stage discharge measurements, discharge ratingsand discharges series of the relevant monitoring stations as well as series of rainfall andclimatic variables in the region, particularly when lateral inflow downstream of the keystation on the tributary is substantial;
10. Changes in runoff characteristics of basins upstream of the study area affecting thehomogeneity of the historical discharge series (reservoirs, land use changes).
2.5.3 Database development and field visit
The same database development strategy as outlined for mainstream floods applies here, andtherefore reference is made to Section 2.3.3. The same holds for the field visit, with thefollowing addition. When lateral inflow is substantial and can only be estimated from rainfallrecords attention should also go to the rainfall/ climatic stations in and around the contributingarea. Station layout, equipment exposure, operating practice and maintenance is to beinspected/ reviewed, to judge the suitability of a station for use in rainfall runoff modelling.
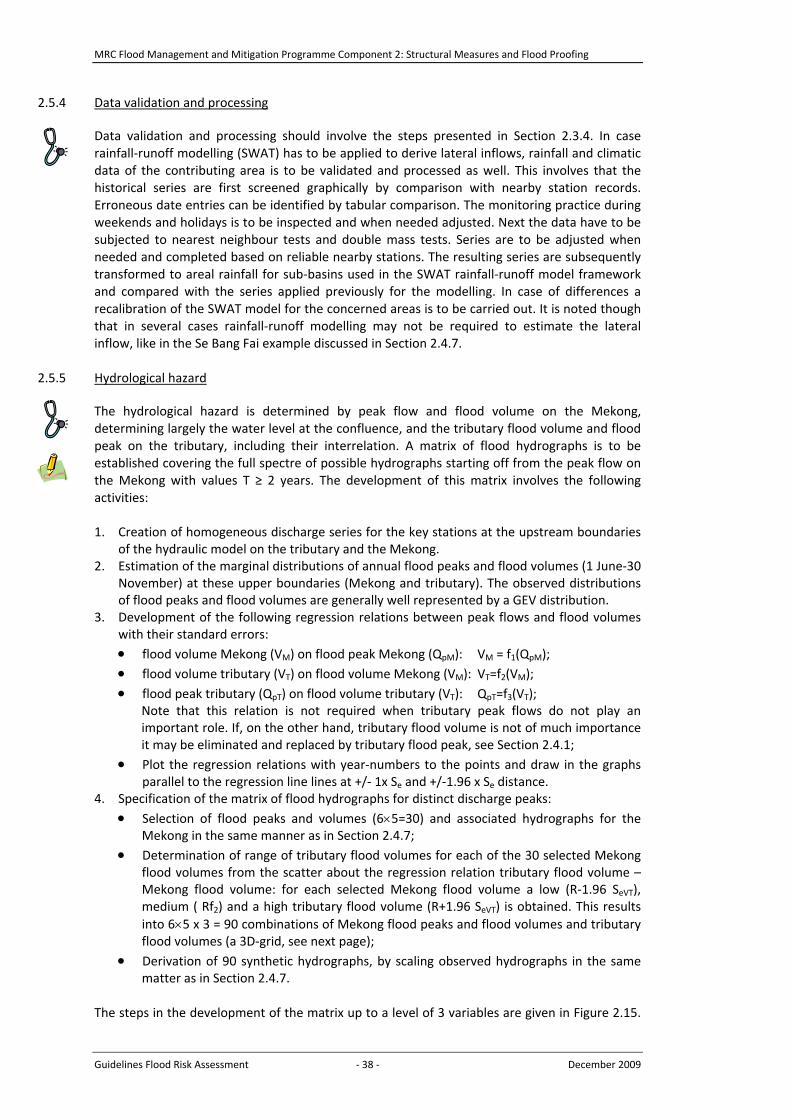
MRC Flood Management and Mitigation Programme Component 2: Structural Measures and Flood Proofing
Guidelines Flood Risk Assessment 38 December 2009
2.5.4 Data validation and processing
Data validation and processing should involve the steps presented in Section 2.3.4. In caserainfall runoff modelling (SWAT) has to be applied to derive lateral inflows, rainfall and climaticdata of the contributing area is to be validated and processed as well. This involves that thehistorical series are first screened graphically by comparison with nearby station records.Erroneous date entries can be identified by tabular comparison. The monitoring practice duringweekends and holidays is to be inspected and when needed adjusted. Next the data have to besubjected to nearest neighbour tests and double mass tests. Series are to be adjusted whenneeded and completed based on reliable nearby stations. The resulting series are subsequentlytransformed to areal rainfall for sub basins used in the SWAT rainfall runoff model frameworkand compared with the series applied previously for the modelling. In case of differences arecalibration of the SWAT model for the concerned areas is to be carried out. It is noted thoughthat in several cases rainfall runoff modelling may not be required to estimate the lateralinflow, like in the Se Bang Fai example discussed in Section 2.4.7.
2.5.5 Hydrological hazard
The hydrological hazard is determined by peak flow and flood volume on the Mekong,determining largely the water level at the confluence, and the tributary flood volume and floodpeak on the tributary, including their interrelation. A matrix of flood hydrographs is to beestablished covering the full spectre of possible hydrographs starting off from the peak flow onthe Mekong with values T 2 years. The development of this matrix involves the followingactivities:
1. Creation of homogeneous discharge series for the key stations at the upstream boundariesof the hydraulic model on the tributary and the Mekong.
2. Estimation of the marginal distributions of annual flood peaks and flood volumes (1 June 30November) at these upper boundaries (Mekong and tributary). The observed distributionsof flood peaks and flood volumes are generally well represented by a GEV distribution.
3. Development of the following regression relations between peak flows and flood volumeswith their standard errors: flood volume Mekong (VM) on flood peak Mekong (QpM): VM = f1(QpM); flood volume tributary (VT) on flood volume Mekong (VM): VT=f2(VM); flood peak tributary (QpT) on flood volume tributary (VT): QpT=f3(VT);
Note that this relation is not required when tributary peak flows do not play animportant role. If, on the other hand, tributary flood volume is not of much importanceit may be eliminated and replaced by tributary flood peak, see Section 2.4.1;
Plot the regression relations with year numbers to the points and draw in the graphsparallel to the regression line lines at +/ 1x Se and +/ 1.96 x Se distance.
4. Specification of the matrix of flood hydrographs for distinct discharge peaks: Selection of flood peaks and volumes (6 5=30) and associated hydrographs for the
Mekong in the same manner as in Section 2.4.7; Determination of range of tributary flood volumes for each of the 30 selected Mekong
flood volumes from the scatter about the regression relation tributary flood volume �–Mekong flood volume: for each selected Mekong flood volume a low (R 1.96 SeVT),medium ( Rf2) and a high tributary flood volume (R+1.96 SeVT) is obtained. This resultsinto 6 5 x 3 = 90 combinations of Mekong flood peaks and flood volumes and tributaryflood volumes (a 3D grid, see next page);
Derivation of 90 synthetic hydrographs, by scaling observed hydrographs in the samematter as in Section 2.4.7.
The steps in the development of the matrix up to a level of 3 variables are given in Figure 2.15.

MRC Flood Management and Mitigation Programme Component 2: Structural Measures and Flood Proofing
Guidelines Flood Risk Assessment 39 December 2009
Figure 2.15 Development of the flood simulation matrix for combined floods.
As for the mainstream floods, changes in the stage discharge ratings (mainstream and/ortributary) due to bed variations will be accounted for by repeating the model simulations withdifferent hydraulic roughness. The roughness change will be commensurate with the maximumobserved changes in the water level for bank full discharge relative to the model values used forthe calibration.
2.5.6 Flood hazard assessment
The hydrological hazard in terms of statistics and relations between: peak flow and flood volume on the Mekong, and flood volume and/or flood peak on the tributaryis transformed into water levels in the rivers and flood plains in a hydraulic model of thetributary confluence with the Mekong. The model requirements are specified in Section 2.3.6.
The 30 selected Mekong hydrographs and 90 tributary floods are subsequently in the modelrouted through the rivers and flood plains system and the computed water levels as function oftime and space are stored in the database. If relevant, in view of bed changes, the simulationsare repeated at least twice with adjusted hydraulic roughness and downstream stage dischargerelations to accommodate the conveyance changes and added to the simulation database forfurther elaboration in a Monte Carlo procedure. Also, a full repetition of simulations will berequired for the analyses of development scenarios.
T = 2
T = 5
T = 10
T = 25
T = 50
T = 100
Peak flow le
vels
Selection of Flood Volumes
very
low
low
med
ium
high
very
hig
h
Step 2
R-1.96 Se R-Se R R+Se R+1.96 SeR = regression equation V=f(Qp)
Se = standard error
high volume tributary flood
medium volume triburaty flood
low volume tributary flood
Step 3
For each selected main stream flood select 3 tributary floods on volume (high, medium and low)
Step 1
Selection of 6 peak flows from annual maximum discharge distribution GEV
T= 2, 5,10, 25, 50, 100 years

MRC Flood Management and Mitigation Programme Component 2: Structural Measures and Flood Proofing
Guidelines Flood Risk Assessment 40 December 2009
The final step is the execution of a Monte Carlo analysis in the same manner as described instep 5 of Section 2.3.4. The only difference is that in this case 3D interpolation is requiredinstead of 2D interpolation.
2.5.7 Example: combined floods in the lower Se Bang Fai (Lao PDR)
Combined flooding takes place in the flood plains along the lower Se Bang Fai, where the waterlevels are affected by backwater from the Mekong. The Se Bang Fai drains an area of 10,240km2 and discharges to the Mekong at That Phanom, which is located between the key Mekongstations Nakhon Phanom upstream and Mukhdahan downstream. The flow in the Se Bang Fai ismeasured a.o. at Mahaxai and Ban Se Bang Fai at Highway Bridge 13, see Figure 2.16. StationMahaxai controls an area of 4,520 km2, whereas the drainage area at Ban Se Bang Fai amounts8,560 km2, respectively 44 and 84 % of the entire basin. Between Mahaxai and Ban Se Bang Faithe Se Bang Fai is joined by the Nam Oula and Se Noy. The monthly average flows in the Se BangFai at Mahaxai and the Mekong at Nakhon Phanom are presented in Table 2.6.
Figure 2.16 Layout of Lower Se Bang Fai basin.
Table 2.6 Average monthly and annual flow (MCM) in Se Bang Fai at Mahaxai and Mekong atNakhon Phanom.
Jan Feb Mar Apr May Jun Jul
Mahaxai 60.0 41.5 37.2 34.7 90.8 565.6 1601.4
Nakh. Phanom 6,277 4,469 4,130 4,000 6,492 17,722 35,993
Jul Aug Sep Oct Nov Dec Year
Mahaxai 1601.4 2370.7 1687.9 635.9 240.5 105.8 7504.4
Nakh. Phanom 35,993 54,457 51,055 29,808 14,860 9,111 238,376

MRC Flood Management and Mitigation Programme Component 2: Structural Measures and Flood Proofing
Guidelines Flood Risk Assessment 41 December 2009
Floods in the Se Bang Fai may occur from June to early October, coinciding with high waterlevels on the Mekong. The water levels in the Se Bang Fai at Highway Bridge 13 at Ban Se BangFai are seriously affected by backwater from the Mekong, whereas Mahaxai is backwater free.
Hydrological hazard assessment
The hydrological hazard in the lower Se Bang Fai is determined by the discharge of the river atMahaxai and lateral inflow further downstream and the water levels on the Mekong at theconfluence near That Phanom. The following data is available to describe the hazard: The Se Bang Fai discharge record for Mahaxai is available for the Period 1988 2006. Tributary inflow between Mahaxai and Ban Se Bang Fai is estimated as a function of the
flow at Mahaxai, to bypass questionable inflow estimation from a very limited number ofrainfall stations. Actual flow measurements at Ban Se Bang Fai were considered toestablish the function, in view of backwater effects on the stage discharge relation for thatsite.
The water level at That Phanom is determined by the Mekong discharge at NakhonPhanom augmented with the flow from the Se Bang Fai and by the conveyance capacitydownstream of the confluence, represented by the stage discharge relation ofMukhdahan. For Nakhon Phanom discharge series have been used of the Period 19242005.
The discharge series have been thoroughly validated along the lines of Section 2.3.4, and whereneeded, they have been adjusted; see the Se Bang Fai FHA Report for details. Subsequently, thehydrological hazard in terms of marginal distributions of peak flows and flood volumes and theirinterrelations have been quantified. Statistics for Nakhon Phanom have been presented in 2.4.7.Statistics for Mahaxai are presented in Table 2.7, Figure 2.19 and Figure 2.20.
Next, the matrix of flood hydrographs for distinct discharge peaks is specified, starting off fromthe flood peaks at Nakhon Phanom. This was already described in Section 2.4.7. The resultconsists of 30 (6 5) combinations of peak discharge and flow volume and 30 associateddischarge hydrographs. For each of these 30 Mekong flood volumes 3 Se Bang Fai flood volumesare selected at distances 1.96 SeVSBF, 0,+1.96 SeVSBF from the Se Bang Fai flood volume Mekongflood volume regression relation, see Figure 2.20. The result is a 3 dimensional grid for peakdischarge and volume in the Mekong (at Nakhon Phanom) and flood volume in the Se Bang Fai(at Mahaxai) as depicted in Figure 2.17. The grid contains 90 points (6 5 3), meaning 90discharge hydrographs for Mahaxai are required. This is done through rescaling of observedhydrographs, in a similar matter as described in Section 2.4.7. Figure 2.18 shows an example ofa scaled hydrograph.
Table 2.7 GEV parameters, peak discharges and flood volumes (June November) for distinctreturn periods in the Se Bang Fai at Mahaxai.
Parameter Peak discharge
(m3/s)
Flood Volume
(MCM)
k
u
0.341
498
1,614
0.221
2,304
6,105
T (years)
2
5
10
25
50
100
1,757
2,177
2,398
2,626
2,765
2,881
6,916
9,045
10,188
11,386
12,126
12,755

MRC Flood Management and Mitigation Programme Component 2: Structural Measures and Flood Proofing
Guidelines Flood Risk Assessment 42 December 2009
28
3032
3436
200
250
300
3502
4
6
8
10
12
14
peak discharge Mekong [1000m3/s]
3D grid of volumes and peak discharges
Volume Mekong [BCM]
Vol
ume
Se
Ban
g Fa
i [B
CM
]
Figure 2.17 Impression of the 3D grid for peak discharge and volume in the Mekong (at NakhonPhanom) and flood volume in the Se Bang Fai (at Mahaxai). The blue dots only showthe �‘outer side�’ of the grid; the full grid contains 90 dots.
14/05 03/06 23/06 13/07 02/08 22/08 11/09 01/10 21/10 10/11 30/110
500
1000
1500
date
disc
harg
e [m
3 /s]
(scaled) hydrograph at station Mahaxai; year: 1988observed peak: 1440 [m3/s]; scaled peak: 1255 [m3/s]
observed volume: 4.0 [BCM]; scaled volume: 3.5 [BCM]
observedscaled
Figure 2.18 Scaling of an observed hydrograph for the Se Bang Fai at Mahaxai.

MRC Flood Management and Mitigation Programme Component 2: Structural Measures and Flood Proofing
Guidelines Flood Risk Assessment 43 December 2009
GEV-fit to annual maximum discharge in Se Bang Fai at Mahaxai
500
1,000
1,500
2,000
2,500
3,000
3,500
-2.00 -1.00 0.00 1.00 2.00 3.00 4.00 5.00 6.00
EV1 reduced variate
Ann
ual m
axim
um d
isch
arge
at M
ahax
ai (m
3 /s) Annual maximum discharge
GEV-distribution
GEV-fit to annual flood volume in Se Bang Fai at Mahaxai
0
2,000
4,000
6,000
8,000
10,000
12,000
14,000
-2.00 -1.00 0.00 1.00 2.00 3.00 4.00 5.00 6.00
EV1 reduced variate
Ann
ual f
lood
vol
ume
at M
ahax
ai (M
CM
)
Annual Flood VolumeGEV-distribution
Figure 2.19 GEV fit to marginal distributions of annual maximum discharge and flood volume at Mahaxai (Se Bang Fai).
Correlation of flood volume Se Bang Fai (Mahaxai) and Mekong (Nakhon Phanom)
Fvol,Mahaxai = 0.0335Fvol,NPhanom + 52.8R2 = 0.58
0
2,000
4,000
6,000
8,000
10,000
12,000
14,000
50,000 100,000 150,000 200,000 250,000 300,000 350,000
Flood volume Nakhon Phanom (MCM)
Floo
d vo
lum
e M
ahax
ai (M
CM
)
Correlation of flood volume Se Bang Fai (Mahaxai) and Mekong (Nakhon Phanom)
Fvol,Mahaxai = 0.0335Fvol,NPhanom + 52.8R2 = 0.58
0
2,000
4,000
6,000
8,000
10,000
12,000
14,000
50,000 100,000 150,000 200,000 250,000 300,000 350,000
Flood volume Nakhon Phanom (MCM)
Floo
d vo
lum
e M
ahax
ai (M
CM
)
VM+1.96 Se
VM-1.96 Se
VM=f(VNP)
Figure 2.20 Flood volume �– peak discharge relation for Nakhon Phanom and flood volumes relation between Mahaxai and Nakhon Phanom, without and with Se relatedselection lines.

MRC Flood Management and Mitigation Programme Component 2: Structural Measures and Flood Proofing
Guidelines Flood Risk Assessment 44 December 2009
Flood hazard assessment
The 90 flood hydrographs of Mekong and Se Bang Fai selected above are input to the hydraulicmodel of the Se Bang Fai delta model for transformation of flows into water levels. The modellayout and boundary conditions are schematically displayed in Figure 2.21.
Figure 2.21 Se Bang Fai hydraulic modelwith boundary conditions.
The morphological development of the river bed, particularly of the Mekong, is taken intoconsideration by adjusting the hydraulic roughness of the river in accordance with the levelchanges for bank full discharge relative to the calibrated situation.
h + hNnew = ncal ( )5/3 (2.8)
hwhere: h = water depth at Qbankfull [m]
h = change [m]
Also the Mukhdahan rating is adjusted to eliminate unwanted backwater effects on the levels atThat Phanom. The hydraulic model is the run with same hydraulic boundaries again withadjusted Manning roughness values.
Mek
ong
That Phanom
Se Noy
Se Bang Fai
Q
Q
QH
Mahaxai
Mukhdahan
Q81
Q38
Q35
Nakhon Phanom
Q

MRC Flood Management and Mitigation Programme Component 2: Structural Measures and Flood Proofing
Guidelines Flood Risk Assessment 45 December 2009
Then by Monte Carlo sampling on the model boundaries interpolation is performed betweenthe computed water levels for each grid cell in the hydraulic model to obtain a frequencydistribution for the levels at each cell. Figure 2.22 shows an example of the frequencydistribution at a location in the floodplain of the Se Bang Fai river, as derived from the MonteCarlo sampling method.
Figure 2.22 Derived frequency curve for maximum annual water levels at a location in thefloodplain of the Se Bang Fai river.
Flood hazard mapping
Flood hazard mapping is described in Section 2.7.

MRC Flood Management and Mitigation Programme Component 2: Structural Measures and Flood Proofing
Guidelines Flood Risk Assessment 46 December 2009
Figure 2.23 Flood depth and extent map Lower Se Bang Fai, T = 100 years.

MRC Flood Management and Mitigation Programme Component 2: Structural Measures and Flood Proofing
Guidelines Flood Risk Assessment 47 December 2009
2.6 Floods in the Mekong delta
2.6.1 General
The floods in the Cambodian flood plains and Mekong delta (see Figure 2.24) are classified as aspecial type of flood in the Lower Mekong Basin due to their special external and internalboundary conditions and the delta�’s unique hydraulic infrastructure. Whereas the flood levelsnear Kratie are mainly determined by the Mekong river only with some backwater from theTonle Sap, further downstream more factors play a role. In the Mekong Delta in its downstreampart the flood levels are essentially the result of upstream and lateral inflow, local rainfall anddownstream water levels at sea. The flood in the Mekong delta is conveyed via the Mekong andBassac Rivers and via their flood plains, including the colmatage canal system, which diverts andcontrols the flow from and to the River. In the delta the river regime is modified by thetemporary storage in Tonle Sap Lake and in the Mekong flood plains, creating slowly rising andfalling water levels.
Essentially, the hydrological hazard in the delta is formed by upstream and lateral inflow, localrainfall and downstream water levels at sea. The flood hazard in the Mekong Delta isdetermined by the frequency of flood water levels and flow velocities in the delta. These can bederived from the hydrodynamic Delta model based on the ISIS software system. This modelcovers the Mekong Delta downstream of Kratie up to the Gulf of Thailand and South China Sea.It has been developed to compute water levels, flow velocities and discharges in the delta as afunction of the hydrological hazard components.
To assess the flood hazard in the Mekong delta downstream of Kratie use is made of the factthat a relatively long historical discharge series is available for Stung Treng just upstream ofKratie. Furthermore, for the tributary inflow further downstream and to the Tonle Sap Lake longrepresentative series have been created preserving the serial and cross correlation with theMekong flow. The series, which cover the period 1910 2006, are used as boundary conditionsfor a hydrodynamic model (based on ISIS modelling package) to derive a 97 year series of waterlevels in the flood prone areas. Further input to the model is formed by local rainfall,evaporation, water use and the year 2000 tidal conditions at the Gulf of Thailand and the SouthChina Sea. The relevant statistics including the probabilities of flooding and related damages forreturn periods from 2 to 100 years can be derived directly from the series of water levels anddepths computed with the model.
2.6.2 Data collection and field visit
The hydraulic model is calibrated to the delta conditions of the year 2000. To assess the floodhazard for development scenarios relative to the base case it is necessary that the hydraulicinfrastructure pertinent to the scenarios is implemented. Hence, detailed information on layout,dimensions, capacities and operation of the hydraulic infrastructure and flood protection worksrelative to the model conditions is collected. In a field visit the existing infrastructure is to becompared with its schematization in the model. Where necessary the model has to be updated.
With respect to the hydrological boundary conditions the established 97 years series ofupstream, lateral and downstream boundary conditions are a realistic representation of thevariability of the hydrologic conditions in and around the Mekong delta.

MRC Flood Management and Mitigation Programme Component 2: Structural Measures and Flood Proofing
Guidelines Flood Risk Assessment 48 December 2009
Figure 2.24 Hydraulic infrastructure of the Mekong delta.

MRC Flood Management and Mitigation Programme Component 2: Structural Measures and Flood Proofing
Guidelines Flood Risk Assessment 49 December 2009
Figure 2.25 The schematization of the Mekong delta in the hydrodynamic delta model (ISIS)involves a large number of hydraulic nodes downstream of Kratie, next to �‘reservoirs�’(polygons) and �‘river cross sections�’ (polylines).
2.6.3 Database development
A database has been developed for flood hazard assessment in the Mekong delta includingfollowing type of data:1. Model database, including schematization of the hydraulic infrastructure, hydraulic structure
layout and operation and hydrological boundary conditions.2. Result database, covering the simulated water levels and flow velocities of the base case and
development scenarios as input for flood hazard assessment, etc.3. A digital elevation model of the delta.4. For distinct return periods the water levels, flood depth and flood duration.5. Flood maps.

MRC Flood Management and Mitigation Programme Component 2: Structural Measures and Flood Proofing
Guidelines Flood Risk Assessment 50 December 2009
2.6.4 Hydrodynamic model development
The hydrodynamic model of the Mekong Delta is based on the ISIS modelling system for thesimulation of unsteady flow in channel networks. It provides an implicit numerical solver for thede Saint Venant equations for 1 dimensional flow. At selected intervals it computes water levelsand discharges on a non staggered grid. Flood plains are included as storage cells connected tothe stream channels via two way weirs. The system was introduced to the MRC under the WUPA programme and now serves as part of the Decision Support Framework (DSF). The modelcovers the Mekong Basin from Kratie to the South China Sea, including the Tonle Sap Lake andFloodplain, the Cambodian floodplains and the Vietnamese Mekong Delta. At various instancesadaptations and recalibration have been implemented to the original one. The model used inFMMP C2 is based on Delta Model Version 2009.
The schematization of the Cambodian and Vietnamese part of the delta in the model ispresented in Figure 2.25.
The boundary conditions of the model comprise:
upstream discharge at Kratie, tributary inflow to Tonle Sap Lake, tributary inflow to Mekong d/s Kratie and Tonle Sap Lake, rainfall, evaporation, water use, and downstream boundary condition at Gulf of Thailand and South China Sea.
Upstream discharge at Kratie
A 97 year discharge series has been established for Kratie, based on the record of Stung Treng,which is available since 1910. For several reasons preference has been given to the series ofStung Treng, including length of record, absence of gauge shifts and backwater effects, stableand predictable hydraulic control for high flows and availability of discharge records. Thedischarge measurements of Stung Treng, transferred to Kratie reveals excellent agreement withthe current meter measurements at the latter location in the past. A serious problem andsource of confusion is the difference between discharge ratings according to conventionaldischarge measurements and those based on ADCP records in use at Kratie since 2002. Thelatter, due to erroneous referencing of the measurements, lead to lower discharges for thesame water levels then the ratings based on conventional discharge measurements, Thedifferences increase for the higher stages. Therefore, unless concurrent current meter andADCP measurements are made at Kratie and Stung Treng, and discharge rating curves havebeen updated, it is advised to use the Stung Treng record, entirely based on conventionalmeasurements. This record proved to be consistent with the flow at Pakse on the Mekong.Since the hydrodynamic model has been calibrated on recent discharge series at Kratie withflood volumes about 8% less then of Stung Treng the historical record of Stung Treng have beenreduced with 8% to match with the discharge used for model calibration (note that this 8%reduction is not applied to the data and statistics presented below for Stung Treng).
The annual maximum discharge series and flood volume of the Mekong at Stung Treng areshown in Figure 2.26 and Figure 2.27.

MRC Flood Management and Mitigation Programme Component 2: Structural Measures and Flood Proofing
Guidelines Flood Risk Assessment 51 December 2009
Annual maximum discharge in the Mekong at Stung Treng, period 1910-2006
20,000
30,000
40,000
50,000
60,000
70,000
80,000
90,000
1910 1920 1930 1940 1950 1960 1970 1980 1990 2000 2010
Peak
dis
char
ge (m
3 /s)
Figure 2.26 Annual maximum discharge at Stung Treng, period 1910 2006.
Annual flood volume in the Mekong at Stung Treng, period 1910-2006
0
50,000
100,000
150,000
200,000
250,000
300,000
350,000
400,000
450,000
500,000
1910 1920 1930 1940 1950 1960 1970 1980 1990 2000 2010
Floo
d vo
lum
e (M
CM
)
Figure 2.27 Annual flood volume at Stung Treng, period 1910 2006.
Tributary inflow to Tonle Sap Lake
The area draining to Tonle Sap up to the highways 5 and 6 enclosing the lake amounts 68,830km2. It comprises the drainage areas of 13 Stungs (rivers). Inflow series of daily discharges areavailable for the years 1997 2004. To extend the period to 1910 2006 a multiple regressionequation has been used for the generation of monthly tributary flow. The flows have beenregressed on the tributary inflow in the previous of month to preserve the serial correlation andthe Mekong flow at Stung Treng in the same month to preserve the cross correlation. Anormally distributed random number was added to preserve the variance. The monthly flowswere disaggregated to daily values based on their degree of resemblance with the observed
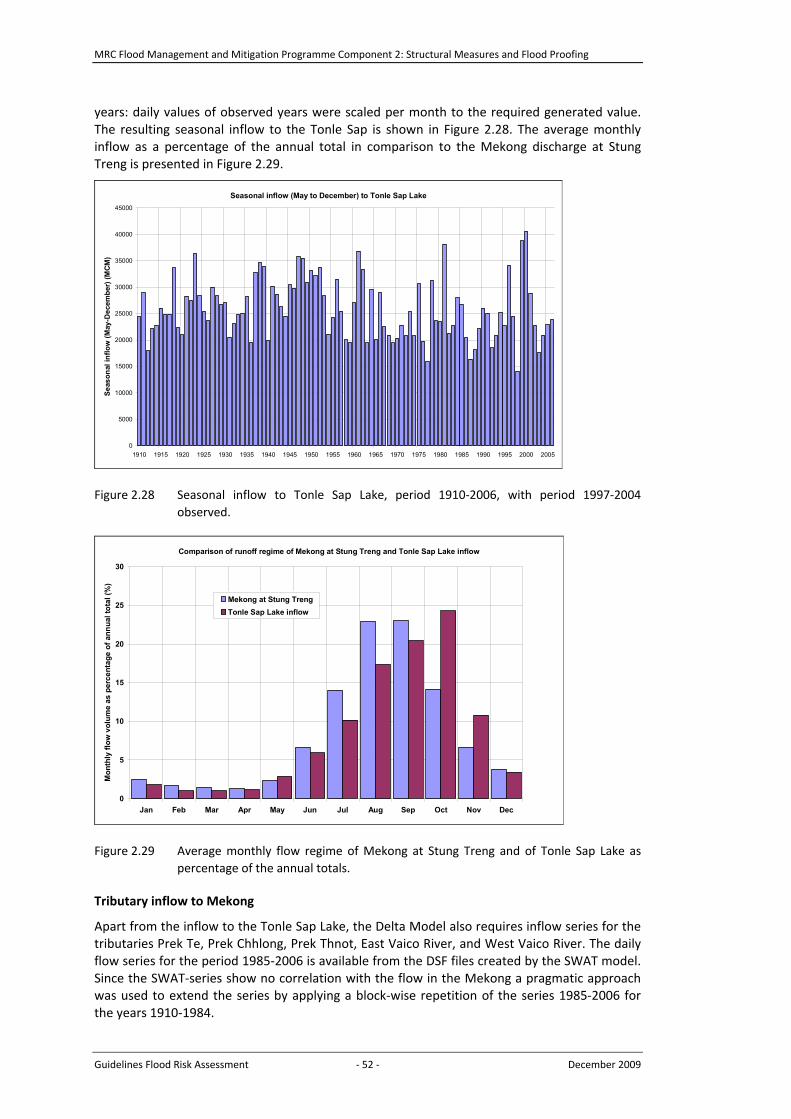
MRC Flood Management and Mitigation Programme Component 2: Structural Measures and Flood Proofing
Guidelines Flood Risk Assessment 52 December 2009
years: daily values of observed years were scaled per month to the required generated value.The resulting seasonal inflow to the Tonle Sap is shown in Figure 2.28. The average monthlyinflow as a percentage of the annual total in comparison to the Mekong discharge at StungTreng is presented in Figure 2.29.
Seasonal inflow (May to December) to Tonle Sap Lake
0
5000
10000
15000
20000
25000
30000
35000
40000
45000
1910 1915 1920 1925 1930 1935 1940 1945 1950 1955 1960 1965 1970 1975 1980 1985 1990 1995 2000 2005
Seas
onal
inflo
w (M
ay-D
ecem
ber)
(MCM
)
Figure 2.28 Seasonal inflow to Tonle Sap Lake, period 1910 2006, with period 1997 2004observed.
Comparison of runoff regime of Mekong at Stung Treng and Tonle Sap Lake inflow
0
5
10
15
20
25
30
Jan Feb Mar Apr May Jun Jul Aug Sep Oct Nov Dec
Mon
thly
flow
vol
ume
as p
erce
ntag
e of
ann
ual t
otal
(%)
Mekong at Stung TrengTonle Sap Lake inflow
Figure 2.29 Average monthly flow regime of Mekong at Stung Treng and of Tonle Sap Lake aspercentage of the annual totals.
Tributary inflow to Mekong
Apart from the inflow to the Tonle Sap Lake, the Delta Model also requires inflow series for thetributaries Prek Te, Prek Chhlong, Prek Thnot, East Vaico River, and West Vaico River. The dailyflow series for the period 1985 2006 is available from the DSF files created by the SWAT model.Since the SWAT series show no correlation with the flow in the Mekong a pragmatic approachwas used to extend the series by applying a block wise repetition of the series 1985 2006 forthe years 1910 1984.

MRC Flood Management and Mitigation Programme Component 2: Structural Measures and Flood Proofing
Guidelines Flood Risk Assessment 53 December 2009
Rainfall
Daily rainfall series of 9 locations in Cambodia and of 5 locations in Vietnam are required asinput to the hydraulic model of the Mekong Delta. Data is available for the locations for theperiod 1985 2006. The annual maximum daily values generally are in the order of 100 to 150mm, occasionally with larger values up to 400 mm in Can Tho in 1985. Analysis shows thatseasonal rainfall at the selected locations hardly correlates with Tonle Sap inflow and not at allwith the flow in the Mekong. Hence, a block wise repetition of the series 1985 2006 wasapplied for the period 1910 1984.
Evaporation
For the same locations as rainfall also evaporation data is required as input into the model. Forthe locations in Vietnam daily series is available from 1985 onward with the exception of 2002.The series available for Cambodia are shorter. In view of the limited variability of potentialevaporation in a particular month from year to year, long term monthly averages have beenapplied in case data was not available.
Water use
At 128 nodes in the network of the Delta model water is abstracted for agriculture, domesticand industrial use. The variation in the total abstraction varies from about 1,400 m3/s in Januarydown to almost 0 m3/s at the end of September. The total annual abstraction amounts 16.5BCM. During the flood season the demand is about 4.4 BCM in total, i.e. an abstraction of lessthan 300 m3/s.
Sea boundary
In total at 19 nodes water level boundaries are defined in the Delta Model. These boundariesare taken from hourly observations made at the 6 stations listed in Table 2.8. The hourlyobservations used in the Delta Model are records of the year 2000. From a comparison withlong historical records it was revealed that the use of this series will not introduce a biasregarding peak water levels.
Table 2.8 Overview of water level stations at sea boundaries.
Station River Province Remark
Rach Gia
Song Doc
Ganh Hao
Cai Lon
Song Ong Doc
Ganh Hao
Kien Giang
Ca Mau
Ca Mau/Bac Lieu
Draining to Gulf of Thailand
As above
Draining to South China Sea
My Thanh Bassac Soc Trang/Tra Vinh Draining to South China Sea
Ben Trai
Vam Kinh
Cua Cung Hau
Cua Dai
Tra Vinh/Ben Tre
Ben Tre/Tien Giang
Southern Mekong outlet, draining to South China Sea
Northern Mekong outlet, draining to South China Sea
2.6.5 Flood hazard assessment
The Isis model is used to simulate the 97 years for which discharge series at Stung Treng areavailable. The main output of the model consists of water levels at all river sections andfloodplains in the model schematisation. For each location, the series of 97 annual maximumwater levels is derived from the model output. The estimates of the probabilities of exceedanceof the water levels are then obtained with Gringortens formula (see equation (2.5) in Section2.3.4). Since the series of annual maxima is close to 100 years, the estimated 100 year waterlevel is by definition approximately the same as the maximum observed water level.

MRC Flood Management and Mitigation Programme Component 2: Structural Measures and Flood Proofing
Guidelines Flood Risk Assessment 54 December 2009
2.7 Flood hazard mapping
2.7.1 General
The MRC uses the ISIS hydraulic model (and sometimes the VRSAP model) to calculate waterlevels (+MSL) in part of the Mekong basin (see previous sections). The water levels arecalculated for (among others) ISIS river cross section nodes and reservoir nodes. A cross sectionis a line perpendicular to the river in an area where the river can flow more or lessunobstructed. A reservoir node represents a �‘reservoir�’ or �‘cell�’ (polygon), being a (mostlyembanked) area with an even water level. Through interpolation of the node water levels with aGIS, spatially continuous water levels are established: see Figure 2.30. After subtracting theground levels (+MSL, stored in a DTM or DEM) the water depth, i.e. the flooding level, isretrieved: see Figure 2.31 and Figure 2.32. Flood maps have been created for various floodingfrequencies (return periods or probabilities), for year maximum levels and for maximum levelsup to 1 August. Flood damage and flood risk maps for agriculture, housing and infrastructureare based on the water depth maps and economic/ damage data.
Figure 2.30 Water level map, based oninterpolation of ISIS nodes.
Figure 2.31 Water depth map, the result of awater level map minus the DTM(ground) levels.
Figure 2.32 The water or flood depth is obtained by subtracting the ground level (DTM) from thewater level (hydraulic simulation + GIS interpolation).
The map layers in a GIS need all to have the same datum and projection to be able to combinethem. The standard datum at the MRC for the whole Mekong basin is Indian 1954, while thestandard MRC projection is UTM (northern zones). As the data sets from the hydraulic modeluse another datum, they were converted to Indian 54.
The mapping of the hydraulic modelling results can be divided in three steps:A: Transfer of modelling results (water levels) into a �‘georeferenceable�’ table;B: Creation of spatial data;C: Creation of flooding maps.

MRC Flood Management and Mitigation Programme Component 2: Structural Measures and Flood Proofing
Guidelines Flood Risk Assessment 55 December 2009
The three steps (see Sections 2.7.2, 2.7.3 and 2.7.4) and each of its data sets and performedactions are schematised and numbered in the flow chart in Appendix 5. In the description belowthe flow chart numbering is followed.
2.7.2 Transfer of modelling results (A)
The transfer of modelling results (water levels) into a �‘georeferenceable�’ table involves thefollowing steps:
A 1, A 2:The hydraulic model, ISIS, can export the (unique) node ID�’s (names), their x/ycoordinates, and the calculated water level per node, into a comma separated file(CSV).
A 3, A4, A 5:Some of the ISIS output may be processed with MatLab, as that software providessuitable tools to determine e.g. the maximum water levels associated with certainreturn periods. Otherwise, the data can be imported into a spreadsheet and transferredto a database like Access.
A 6, A 7:In Access separate data sets can easily be combined into one table by using queries(based on node ID�’s). One table with all data reduces the work to be done in the GIS.
Figure 2.33 Example of ISIS data imported into Access, with node info and water levels fordifferent scenarios, various return periods (probabilities), and different periods of theyear.
2.7.3 Creation of spatial data (B)
ISIS calculations are mainly based on node and water level info in a data file (DAT file, ASCIIformat). The cross section nodes have x/y coordinates specified; the reservoir nodes have alsotheir central (point) coordinates in the DAT file, but not their outline coordinates.
ISIS has also a GIS component containing the river cross sections (lines) and the reservoiroutlines (polygons). The cross section and central reservoir node coordinates in the GIS shouldcorrespond with the coordinates in the DAT file, but the GIS files are not always updatedsimultaneously with the DAT file update.
So for the reservoir outlines the GIS files from ISIS have to be used, for the cross sections thereis the option to use the DAT file or use the sometimes not updated ISIS GIS files. Extracting therelevant cross section info from a DAT file for use in a GIS is time consuming (the DAT file forthe Lower Mekong Basin contains more than 170,000 lines).

MRC Flood Management and Mitigation Programme Component 2: Structural Measures and Flood Proofing
Guidelines Flood Risk Assessment 56 December 2009
The methodology described below uses the ISIS GIS data and not the DAT file. It shows how towork around the inaccuracies in the GIS files. If the ISIS GIS files have been synchronised withthe DAT file the methodology is in essence the same, but some steps can be skipped (e.g. stepsB 9 to B 12; see Appendix 6), also depending on the information supplied with the GIS files.
B 1: The data stored in the Access table is imported in ArcGIS and georeferenced using thex/y coordinates.
B 2, B 3, B 4:ISIS calculates with (among others) reservoir nodes and (river) cross section nodes: seeFigure 2.34. For the creation of maps, these two types need different processing.Therefore the one data table originating from Access is split in two: one containing thereservoir nodes, and another containing the cross section nodes. These two tables maybe split again in case different areas inside the basin are considered (e.g. focal area inCambodia and focal area in Vietnam).
B 5, B 6, B 7, B 8:A spatial (GIS) component of ISIS contains cross sections (polylines) and reservoirs(polygons). However, the relation between the calculation nodes and the lines/polygons is not always one to one (if the GIS is not updated). The cross section layerand reservoir layer are added to ArcGIS and duplicate lines or polygons are removed, ifnecessary.
Figure 2.34 ISIS calculates with (among others) reservoir nodes (+) and cross section nodes(dots). A spatial component of ISIS contains cross sections (blue lines) and reservoirs(purple polygons). However, the relation between the calculation nodes and thelines/ polygons may not always be one to one if the GIS files are not updated.
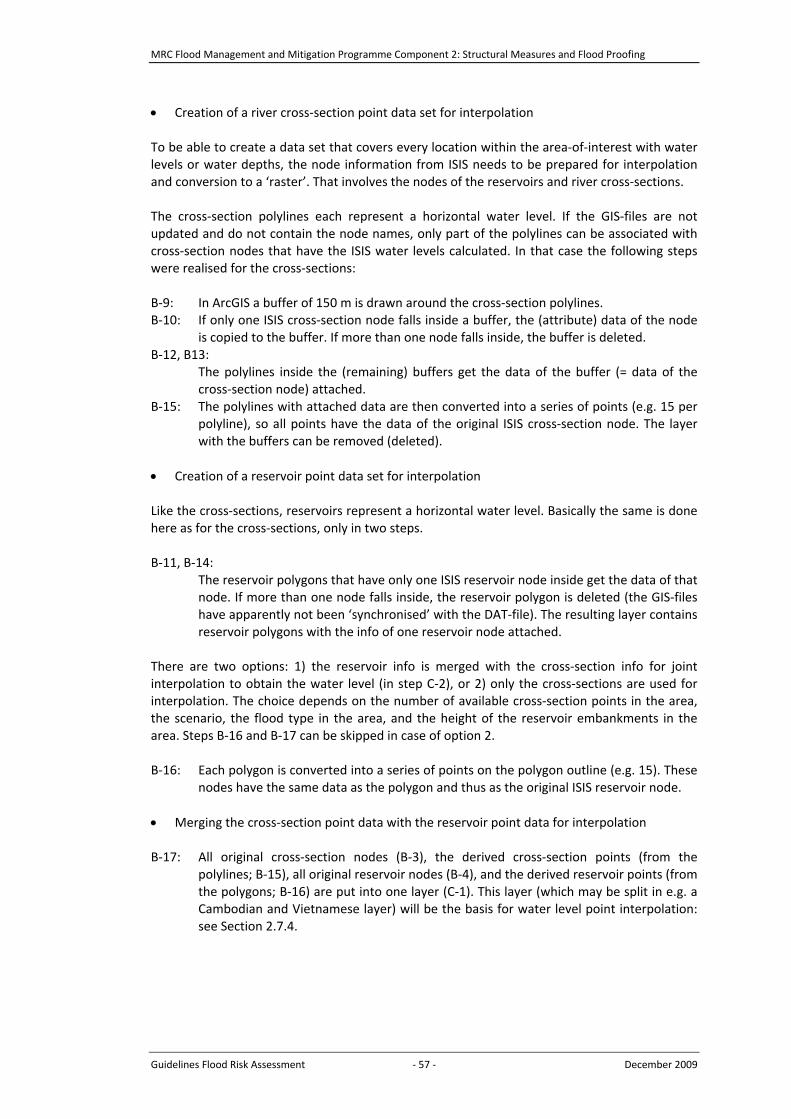
MRC Flood Management and Mitigation Programme Component 2: Structural Measures and Flood Proofing
Guidelines Flood Risk Assessment 57 December 2009
Creation of a river cross section point data set for interpolation
To be able to create a data set that covers every location within the area of interest with waterlevels or water depths, the node information from ISIS needs to be prepared for interpolationand conversion to a �‘raster�’. That involves the nodes of the reservoirs and river cross sections.
The cross section polylines each represent a horizontal water level. If the GIS files are notupdated and do not contain the node names, only part of the polylines can be associated withcross section nodes that have the ISIS water levels calculated. In that case the following stepswere realised for the cross sections:
B 9: In ArcGIS a buffer of 150 m is drawn around the cross section polylines.B 10: If only one ISIS cross section node falls inside a buffer, the (attribute) data of the node
is copied to the buffer. If more than one node falls inside, the buffer is deleted.B 12, B13:
The polylines inside the (remaining) buffers get the data of the buffer (= data of thecross section node) attached.
B 15: The polylines with attached data are then converted into a series of points (e.g. 15 perpolyline), so all points have the data of the original ISIS cross section node. The layerwith the buffers can be removed (deleted).
Creation of a reservoir point data set for interpolation
Like the cross sections, reservoirs represent a horizontal water level. Basically the same is donehere as for the cross sections, only in two steps.
B 11, B 14:The reservoir polygons that have only one ISIS reservoir node inside get the data of thatnode. If more than one node falls inside, the reservoir polygon is deleted (the GIS fileshave apparently not been �‘synchronised�’ with the DAT file). The resulting layer containsreservoir polygons with the info of one reservoir node attached.
There are two options: 1) the reservoir info is merged with the cross section info for jointinterpolation to obtain the water level (in step C 2), or 2) only the cross sections are used forinterpolation. The choice depends on the number of available cross section points in the area,the scenario, the flood type in the area, and the height of the reservoir embankments in thearea. Steps B 16 and B 17 can be skipped in case of option 2.
B 16: Each polygon is converted into a series of points on the polygon outline (e.g. 15). Thesenodes have the same data as the polygon and thus as the original ISIS reservoir node.
Merging the cross section point data with the reservoir point data for interpolation
B 17: All original cross section nodes (B 3), the derived cross section points (from thepolylines; B 15), all original reservoir nodes (B 4), and the derived reservoir points (fromthe polygons; B 16) are put into one layer (C 1). This layer (which may be split in e.g. aCambodian and Vietnamese layer) will be the basis for water level point interpolation:see Section 2.7.4.

MRC Flood Management and Mitigation Programme Component 2: Structural Measures and Flood Proofing
Guidelines Flood Risk Assessment 58 December 2009
2.7.4 Creation of flooding maps (C)
The water level (flooding) maps will be created basically in two steps: 1) the point data, withwater levels (B 15 or B 17, depending on the chosen option), will be interpolated to create araster that will cover the area(s) of interest, and 2) the reservoir polygons will be converted intoa raster and put on top of the raster resulting from step 1 (i.e. replace it�’s values).
There are many methods to create a continuous surface based on spatial points with values.The type of data, the spatial distribution of the points, the range in the values etc. determinethe appropriate method. A few methods have been considered: IDW, Spline, Kriging, NaturalNeighbours. Although no in depth analysis has been done, the Natural Neighbours (NN) methodand the Inverse Distance Weighting (IDW) method seem to be suitable for the LMB. Both NNand IDW have the option to include �‘barriers�’ or �‘linear discontinuities�’, which suits the inclusionof e.g. embankments or canals in the interpolation. Details on the interpolation methods can befound on Internet.
C 1, C 2, C 3:The node/ point water level values (e.g. year maximum water levels with a returnperiod of 10 years) may be interpolated with the NN method (raster size is 50 m likeDTM), resulting in a rectangular raster covering the area with the points used as input.
C 4, C 5, C 6:A reservoir raster file is created by converting the polygons to raster, using the requiredwater level values from the polygon attribute table as raster cell values.
C 7: The polygon based raster (reservoirs; C 6) is put �‘on top�’2 of the point based raster(cross section nodes, reservoir nodes; C 3) to assure that the reservoir areas haveindeed a horizontal water level.
C 8, C 9, C 10:The raster is �‘cut out�’ more precisely using a mask (polygon) with the exact delineationof the area of interest (or using several masks to cut out various areas of interest). Theresult is a raster of the area(s) of interest with each raster cell (50 x 50 m) having awater level value. The raster values (e.g. year maximum water levels with a returnperiod of 10 years) can then be classified using suitable class limits.
Figure 2.35 Example of a raster, with the reservoir raster (angular areas) superimposed on thepoint based raster.
2 Using the ArcGIS Map Calculator with the �‘con�’ statement (e.g. con(isnull([reserv]),[xsec],[reserv]))

MRC Flood Management and Mitigation Programme Component 2: Structural Measures and Flood Proofing
Guidelines Flood Risk Assessment 59 December 2009
C 11, C 12, C 13:If water depth maps are required, the DTM with the ground elevation should besubtracted from the water level raster, and classified.
The previous steps result in a flood (water) depth map, similar to the one in Figure 2.36.
2.7.5 Data sources
Data retrieved from the ISIS model (with x/y coordinates):a) The polygons that represent reservoirs (i.e. areas with horizontal water level).b) The polylines that represent river cross sections (i.e. lines with horizontal water level).c) Model calculation nodes for the reservoirs and cross sections (not for spills etc.). These
nodes (from the DAT file) may not coincide one to one with the polygons and polylinesmentioned above if the ISIS GIS files are not updated (see introduction in Section 2.7.3).
d) The calculated maximum water levels (referenced to MSL) for various return periods, forvarious periods of the year (e.g. �‘early floods�’), for various areas (�‘focal areas�’), and/or forvarious scenarios (measures).
Data used from the MRC/FMMP GIS:e) DTM (Digital Terrain Model) or DEM (Digital Elevation Model). In 2009 two DTM�’s were
being used at the MRC, b dtm50upd and dem0603, both based on interpolation of 10 mcontours (on some map sheets 20 m contours), spot heights and rivers/ streams (from1:50,000 and 1:100,000 topographical maps, depending on the area). b dtm50upd is a 50 x50 m raster, while dem0603 is a 100 x 100 m raster. Both have significant areas witherrors: in b dtm50upd it concerns two large areas near Kampong Chhnang and KampongCham, in dem0603many smaller areas all over the LMB. As dem0603 is used in ISIS and theerroneous areas are smaller, this DEM has been used.
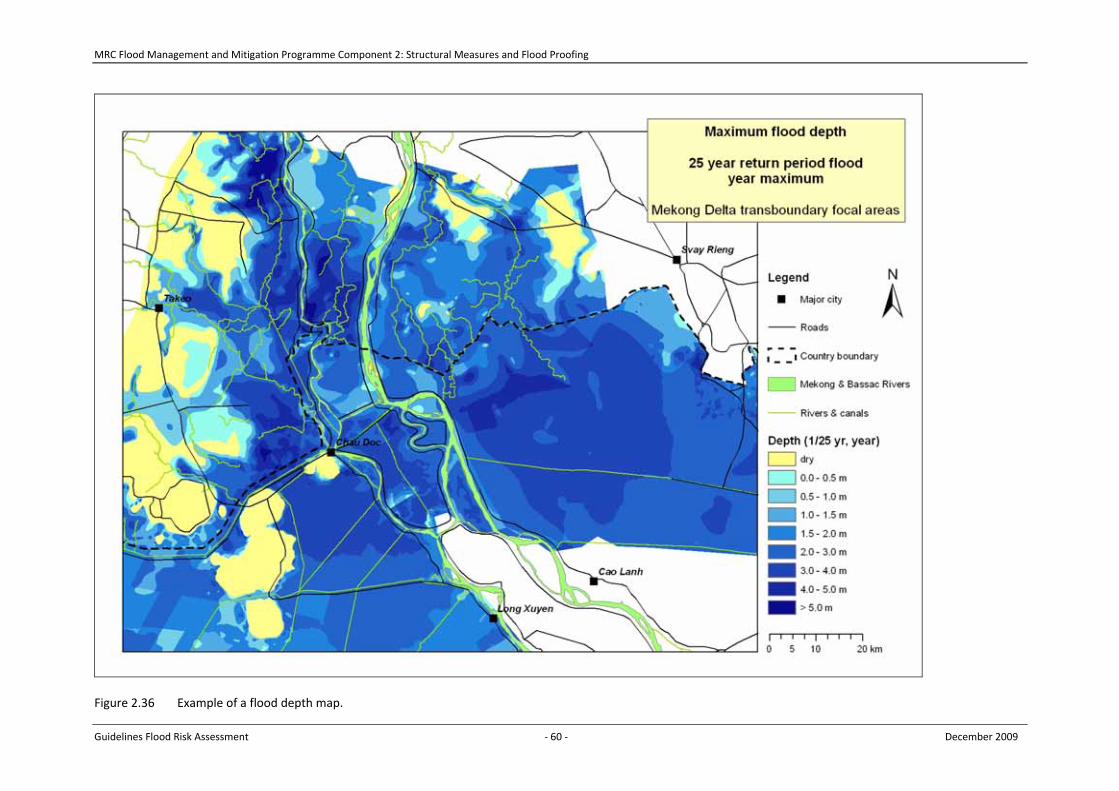
MRC Flood Management and Mitigation Programme Component 2: Structural Measures and Flood Proofing
Guidelines Flood Risk Assessment 60 December 2009
Figure 2.36 Example of a flood depth map.

MRC Flood Management and Mitigation Programme Component 2: Structural Measures and Flood Proofing
Guidelines Flood Risk Assessment 61 December 2009
CHAPTER3FLOOD DAMAGE ASSESSMENT

MRC Flood Management and Mitigation Programme Component 2: Structural Measures and Flood Proofing
Guidelines Flood Risk Assessment 62 December 2009

MRC Flood Management and Mitigation Programme Component 2: Structural Measures and Flood Proofing
Guidelines Flood Risk Assessment 63 December 2009
3 FLOOD DAMAGE ASSESSMENT
3.1 Introduction
This chapter focuses on flood damage assessment. It outlines the classification of damage andbenefits (Section 3.2) and approaches for damage assessment (Section 3.3). Existing damagemodels (Section 3.4) and economic and financial issues in damage assessment (Section 3.5) arediscussed. Methods for the assessment of other damage types are summarized in Section 3.6. InSection 3.7 is described how the results of damage estimates can be presented. In order todevelop damage models data collection is very important and this topic is treated in Section 3.8.Finally, examples of damage assessments for the Lower Mekong Basin are presented in Section3.9.
The next Chapter (4) will demonstrate how the results of damage assessment can be combinedwith flood hazard analyses to estimate the risk.
3.2 Classification of flood damages and benefits
3.2.1 Flood damages
The consequences of a flood encompass multiple types of damage. All these different types ofconsequences can be observed after large flood disasters, for example after the flooding of NewOrleans due to hurricane Katrina in 2005. The term �“flood damage�“ refers to all varieties ofharm caused by flooding. It encompasses a wide range of harmful effects on humans, theirhealth and their belongings, on public infrastructure, cultural heritage, ecological systems,industrial production and the competitive strength of the affected economy. However, floodingmay also have benefits and this topic is separately discussed in the next Section (3.2.2).
An overview of different types of damages / consequences is given in Table 3.1. The damage isdivided into tangible and intangible damage, depending on whether or not the losses can beassessed in monetary values. Tangible damages can be directly priced in monetary terms,because a market value exists for the damaged goods or services. Other types of damages, suchas casualties, health effects or damages to ecological goods and to all kind of goods and serviceswhich are not traded in a market and those are far more difficult to assess in monetary terms.They are therefore indicated as �‘intangibles�’.
Table 3.1 Classification of flood damages.
Tangible Intangible
Direct
Physical damage to:Housing, structure and assets;Infrastructure and public utilities;Agriculture.
Loss of life;Health effects;Environmental damages.
Indirect
Temporary relocation;Cleaning & sanitation;Loss of income;Industrial production losses;Others.
Societal disruption;Increased vulnerability of survivors.
Another distinction is made between the direct damage, caused by physical contact withfloodwaters, and damage indirectly following from the flood. Direct damage includes, forexample, damage to buildings, economic assets, loss of standing crops and livestock inagriculture, loss of human life, immediate health impacts, and loss of ecological goods. Indirect

MRC Flood Management and Mitigation Programme Component 2: Structural Measures and Flood Proofing
Guidelines Flood Risk Assessment 64 December 2009
damages are damages caused by disruption of physical and economic linkages of the economy3,and the extra costs of emergency and other actions taken to prevent flood damage and otherlosses, see e.g. (Parker et al., 1987). This includes, for example, the loss of production ofcompanies affected by the flooding, induced production losses of their suppliers and customers,the costs of traffic disruption or the costs of emergency services.
The main damage categories are:
1. Direct and tangible damages
Damages to properties and infrastructureIn the targeted areas such as houses, schools, offices, commercial & industrial buildings andinstallations, hydraulic works, energy, transportation and other infrastructures andsupplies/assets of individuals and businesses. These damages depend on the magnitudeand duration of the flood. The damages to properties are the costs of replacement orrestoration of an affected structure and inventories.
Agricultural damagesCrop damages depend on the depth, timing and duration of a flood. The bigger the flood,the more submerged cultivated area sustains bigger losses. However, if flood occurs afterharvesting, there would be no crop damage at all. Damage to livestock and agriculturalequipment depends on the magnitude and duration of the flood. The damages to livestockare the costs of livestock lost or the loss of income due to a distress sale. The damages toagricultural equipment/tools are the cost of replacement or restoration of these assets.
2. Indirect and tangible damages
Costs of temporary relocation and rescueare the costs that local government agencies and NGOs incur before, during and after theflood to support affected people living during the flood and recovering at after the flood.
Costs of cleaning and sanitationafter the flood are mainly labour mobilization by individuals, households, enterprises andinstitutions to clean their houses and buildings.
Income losses and higher costs of livingcould due to disruption of economic activities and/or services by the flood for (i) individuals,landless labourers, families and enterprises; (ii) large commercial and industry enterprisesthat have been partly or fully closed down for some period of time during high flood waterlevel; Higher costs of living could due to temporary relocation, and the purchase of foodthat otherwise would be available from the family farm, lack of basic supply as save waterand electricity, additional cost for transportation and daily activities.
Costs of illnessof humans and livestock related to poor environmental conditions and increased waterborn diseases. These costs include additional cost of healthcare: for families and individuals,and additional expenditures by local government for disease prevention and treatment, andfor sanitation control during the flood.
3 Alternative definitions of indirect damage exist. For example, Merz et al. define indirect damage as damage that
occurs outside the flooded area (Merz et al., 2004). E.g. companies can lose supply and demand from the flooded area.

MRC Flood Management and Mitigation Programme Component 2: Structural Measures and Flood Proofing
Guidelines Flood Risk Assessment 65 December 2009
Other costsinclude the negative impacts of flooding on tourism revenue, loss of income or revenue forpeople or enterprises outside the target areas, loss in social stability, problems in incomedistribution and confidence of people in the Government and other forward and backwardeconomic linkages are omitted from the study as no data are available or could be collectedon these issues.
Important indirect damages categories are the loss of life and injuries and the health effects. Itis noted that part of these health effects could be monetized by estimating the (increased) costof treatment and medical care. Other important indirect damages are environmental losses, e.g.due to pollution, and societal disruption in general. Methods for the estimation of loss of life arebriefly discussed in Section 3.6.
3.2.2 Flood benefits
Flooding in the Mekong basin causes not only damages, but benefits as well. For a completeassessment it is important to also take these into account. Flooding has an important role inmaintaining natural fishery, wetlands, and soil fertilities. They are primarily from:
FisheryFlood water provides habitat for fishes breading grounds and nursing and growingenvironment. Natural fish is an important resource for people living in the LMB, especiallyCambodia and Vietnam. The quantity of natural fish would be reduced in case of a low floodlevel; it depends on the magnitude, timing and duration of flood, but the best indicator isthe flooded area.
Agricultural productionFlood water (i) brings sediments to the flood plain especially for acid sulphate soil areas; (ii)flushes toxic substances from the cultivated soil; (iii) kills the rats and pests; (iv) speeds upthe process of plant residue disintegration; (v) improves soil structure; and (vi) provides soilfertility; This impact could be measured by net benefit from agricultural production after ayear with a good flood as compared with a year with no flood.
Main land expansionFlood water brings sediments to river mouths in Vietnam to make the Delta expanded intothe sea. This impact could be measured as value of additional land formed by sedimentsfrom Mekong River.
Biodiversity conservationFlooding plays an important role in maintaining biodiversity values for Mekong River Basin,especially in the wetlands in the LMD. There are a few studies on these positive impacts,but their values in monetary terms are not available.
In general these benefits are associated with relatively small floods and processes that occurrelatively frequently (e.g. annual or seasonal floods). The larger damages are generallyassociated with extreme events that are infrequent and have lower return periods. In theconsideration of measures that prevent flooding it is also important to assess the adverseeffects on the above benefits.

MRC Flood Management and Mitigation Programme Component 2: Structural Measures and Flood Proofing
Guidelines Flood Risk Assessment 66 December 2009
3.3 General approach for economic damage assessment
3.3.1 Scope of the analysis and level of detail
Before starting a damage assessment it is important to decide on the scope and level of detail ofthe damage evaluation. This depends on a) the spatial scale of the study, b) the objectives, c)the availability of resources, and d) the availability of data. These factors are outlined below.
a) The spatial scopeThe size of the area under investigation is important. This size can vary from areas ofnational or even international scale to areas of local scale. Within could range from basin,country, district, village or even individual structure level. Due to the fact that very precisemethods require more effort (i.e. time and money) than less detailed approaches and thatthe resources are usually limited, the most precise methods are often restricted to smallareas under investigation, while studies with a research area of regional or even nationalsize mostly have to rely on less detailed methods.
b) The objectivesThe chosen method and the accuracy of the results of a specific study must match with theobjective of the study. If the goal of the study is for strategy development and planning, aless precise (and consequently less costly and time consuming) method might be sufficient.If on the other hand single flood protection measures have to be assessed, e.g. for aprioritization of investment, it is necessary to employ a more precise method. Nevertheless,it should be checked if it is worth being more precise, i.e. has it any effects on the results.
c) The availability of resourcesAlthough it would be fine and desirable for every study to come to results with the highestlevel of precision, this is often not possible due to budget or time restrictions. If only a smallbudget and/or little time is available for a study, quick, easy and approximate methods haveto be chosen in order to finish the study under these restrictions.
d) The availability of dataIndeed, the effort or costs to carry out a certain method of damage evaluation can besignificantly reduced if necessary data already exists. Consequently, the availability of preexisting data has an essential influence on the choice of an appropriate method. If, forexample, adequate land use data or a thoroughly developed set of damage functionsalready exists, this may facilitate the application of detailed approaches on a regional oreven national scale. Furthermore, not only the question whether data are pre existing, butalso which data are pre existing and available in a country or region can have a large impacton the choice of a method.
Selection of damage categories
The question in damage evaluation is which categories of damages should be included. On theone hand it would be desirable to take all types of damages from table 3.1 into account in thedamage assessment. However, this may lead to extensive and costly studies and not for alldamage types methods are available to assess and quantify those. Therefore it is often morepractical to focus on the most important damage categories to keep the effort of the analysisreasonable. It is important that the selected categories constitute the largest part of the totaldamage. For example in the standardized damage method that is used in the Netherland thefollowing main damage categories are considered: land use, infrastructure, households,companies and other. Within each main categories sub categories are distinguished (e.g.agriculture, urban area, or recreation within the main category land use).

MRC Flood Management and Mitigation Programme Component 2: Structural Measures and Flood Proofing
Guidelines Flood Risk Assessment 67 December 2009
Less important categories can also be included in a more simple way, e.g. by applying a typicaldamage multiplier. For �“intangible�” damage categories other approaches could be chosen tomake these more explicit in the context of damage and risk evaluation in their own units, e.g.the number of lives lost (see for example Section 3.6 for a discussion of methods to estimatethe loss of life).
3.3.2 Direct damage assessment
Methods for the estimation of direct economic damage to objects, such as structures, housesare well established, and the use of so called damage functions is widespread, see below forfurther explanation and e.g. (Penning Rowsell and Chatterton, 1977; Dutta et al., 2003; Kok etal., 2005; Jonkman et al., 2008) for further background.
To estimate the flood damage there needs to be insight in the following factors:a) the intensity of flooding;b) the number and type of land use functions affected and their value;c) the susceptibility of land use functions against flooding.
These factors are schematically shown in Figure 3.1 and discussed below.
Figure 3.1 General approach for damage estimation.
Ad a Intensity of floodingData on the intensity of flood, i.e. the affected area, the flood water levels, inundationcharacteristics, have to be estimated. The area and depth of inundation are the mostimportant information to be sampled here, but also the duration, time of occurrence,water velocity could have a significant influence on damage depending types of flood.Information on the intensity of flooding follows from the flood hazard assessment (seeSection 2).

MRC Flood Management and Mitigation Programme Component 2: Structural Measures and Flood Proofing
Guidelines Flood Risk Assessment 68 December 2009
Ad b Affected land use and valuesDepending on the number of damage categories that are considered different types ofland use that correspond with damage categories are selected to be assessed. Forexample for damage to properties information on the location, number and type aswell as the elevation of properties which could be affected by a certain flood eventneeds to be gathered. Such information is normally given by land use data. This can beeither primary data from field surveys or secondary data, i.e. data from already existingsources. General information on data collection and surveys is given in Section 3.8.
Ad c Susceptibility of land use functions against floodingIn this step it is determined how the level of economic damage is related to the floodconditions. Often, so called (stage) damage functions are used that relate the level ofdamage to the flooding conditions. The main parameter that is considered is flooddepth, but it is noted that other flood characteristics, such flow velocity or floodduration could be relevant as well. Further details regarding damage functions arepresented in Section 3.3.
The following general equation describes how the elements in the damage model are combinedto estimate the total damage in a flooded area:
m
i
n
rriiri nDhD ,max,)(
(3.1)
where: Dmax,i= maximum damage amount for an object or land use category ii = damage or land use categoryr = location in flooded aream = number of damage categoriesn = number of locations in flooded areahr = hydraulic characteristics of the flood at a particular locationi(hr) = stage damage function that expresses the fraction of maximum
damage for category i as a function of flood characteristics at aparticular location r (0 i(hr) 1)
ni,r = number of objects of damage category i at location r
For each damage category a specific stage damage function is estimated and used in thephysical damage assessment by correlating historical damage data with flood depth.
3.3.3 Damage functions
Damage functions relate the level of damage to the flooding conditions. In different countriessuch functions have been developed, for example in the Netherlands based on the 1953 floodevent, see Kok et al. (2005). An example of a damage function is given in Figure 3.2 for damagesto houses and their contents. The figure shows that the flood damage is 100 percent if thewater depth exceeds 4.5 meters. As already noted, other damage functions have beendeveloped in other countries. For example, in the United States the Federal EmergencyManagement Agency (FEMA) has developed the HAZUS model that includes damage functionsfor different damage categories4.
4 see http://www.fema.gov/plan/prevent/hazus/ for more details

MRC Flood Management and Mitigation Programme Component 2: Structural Measures and Flood Proofing
Guidelines Flood Risk Assessment 69 December 2009
Figure 3.2 Example of a stage damage function for houses in the Netherlands (Kok et al., 2005).
Influence of flood characteristics on the damage functionMost stage damage functions include water depth as the main determinant of direct damage.However, it is noted that other flood characteristics, such flow velocity or flood duration couldbe relevant as well. Thieken et al. (2005) also investigate the influence of other factors, such asflood duration, contamination and preparedness for flood damage based on data for the 2002floods in Germany. It needs to be mentioned that further factors like risk perception of thepeople in flood prone areas and their preparedness to be flooded can also influence thesusceptibility of elements at risks and, hence, the potential size of the flood damage. Up to nowsuch factors have not been included in damage functions at least not explicitly.
In the application of damage functions to estimate the damage for agricultural land use, e.g. forcrops or rice paddies, other factors are taken into account in addition to the flood depth. Firstly,the duration of the flooding can be taken into account as longer duration will cause moredamage and / or could prevent harvesting. Secondly, there is a seasonal effect, as the damagewill highly depend on the moment of occurrence of flooding relative to growth and harvestingpattern of the crops. A damage function has to be developed that reflects the relevant damageprocesses that are representative for the local type of flooding (moment during the year,duration) and characteristics of the land use (crop characteristics).
Relationship between structural damage and economic damageAn important source of economic damage is the structural damage to buildings, especiallyhouses. Figure 3.3 shows how economic damage is connected to structural damage. The level ofstructural damage caused by the flood will be determined by the flood actions (or loads) andthe building resistance (or strength) (Kelman and Spence 2004). The degree of structuraldamage depends on the intensity and magnitude of the flood actions, i.e. hydrostatic andhydrodynamic forces, and on the building�’s resistance to flooding. The next step is the economicvaluation of the physical damages. To convert the structural damage to economic estimatesinsight in the building�’s pre disaster market value and the replacement cost is required. Apartfrom damage to the structure, the damage estimation in monetary terms will also includedamage to the inventory of the structure.
In the earlier presented damage functions the economic damage estimate is directly related tothe flood characteristics. However, for some applications it could be relevant to have insight in
0,0
0,1
0,2
0,3
0,4
0,5
0,6
0,7
0,8
0,9
1,0
1,1
0 0,5 1 1,5 2 2,5 3 3,5 4 4,5 5 5,5 6
Flood depth (m)
dam
age
fact
or
total damagedamage buildingdamage content

MRC Flood Management and Mitigation Programme Component 2: Structural Measures and Flood Proofing
Guidelines Flood Risk Assessment 70 December 2009
the degree of structural damage and the number of damaged or destroyed buildings. InAppendix 2 existing methods for the analysis of structural damage have been summarized. Forstructural damage both the depth and flow velocity will be important. The level of structuraldamage is also important for human safety and loss of life as buildings are important sheltersduring flood events.
Figure 3.3 Scheme of structural flood damage analysis.
3.3.4 Relative and absolute damage assessments
There exist two basic approaches for damage assessment by means of damage functions. Theydiffer in the way in which the information sources on land use, values of assets and damagefunctions are combined:
1. The use of absolute damage functions for damage assessmentIn this approach the damage functions describe the relationship between the flood depth orflood water level and the absolute damage value. This relationship can be determined bymeans of surveys on damage during historical floods. Combined with data on inundationdepth and land use information, these absolute damage functions enable a directestimation of the absolute damage amount for asset categories (agriculture, housing,infrastructure, etc.).
2. The use of relative damage functions for damage assessmentIn this approach the damage function describes the relationship between the flood depthand the damage as a fraction or percentage of the maximum damage value for a certainland use category. By bringing together land use information and asset values, the totalvalue of assets at risk is calculated. By combining this total value with the earlier deriveddamage fraction the total damage is estimated.
Figure 3.4 schematically shows how the different elements are combined in the twoapproaches. The figure also shows the different formats of the damage functions for both cases.The main difference is that in the relative damage approach, the damage function produces arelative damage fraction (or percentage) as a function of water depth, whereas in the absolutedamage approach a damage value follows directly from the damage function.

MRC Flood Management and Mitigation Programme Component 2: Structural Measures and Flood Proofing
Guidelines Flood Risk Assessment 71 December 2009
Approach Function
Absoluteapproach
Absolute depth damage function
Land use information
Susceptibility of assets Value of assets
Damage
Hydraulic characteristics
Water depth or level (m)
Damage ($)
Relativ
eapproach
Relative depth damage function
Total value of assets at risk
Susceptibility of assets Value of assets
Damage
Hydraulic characteristics
Land use information
Water depth (m)
Damage (%)
100%
Figure 3.4 Absolute and relative damage approaches.
The two approaches have advantages and disadvantages. Absolute damage functions are onlyapplicable to the region for which they have been derived. If a new region would have to beanalysed, new data would have to be collected to derive the specific absolute damage functionsfor that area. Relative damage functions are more generally applicable. If they have beenderived for a certain region and event, they can be applied to a wider region for which nohistorical flood damage data is available. However, extending the relative damage functions toother areas is only appropriate when damage processes and susceptibilities for these regionsare similar. For example, it is then assumed that building types or agricultural land used aresimilar for these regions. The absolute damage approach is thus more suitable when largeregional differences exist in the above factors.
Which of both approaches is chosen also depends on the kind of available data. For example if acomprehensive set of absolute damage functions already exists, the absolute damageestimation approach could be more appropriate. If on the other hand detailed data on the valueof assets is at hand, the relative damage approach may be convenient.
An issue with using different data sets is the varying level of detail. If data at commune level iscombined with data at district level and the results are presented at commune level, �‘false�’accuracy is suggested. One should be aware of this in all data processing steps of a damageassessment.
3.3.5 Assessment of indirect damages
Indirect damages are damages caused by disruption of physical and economic linkages of theeconomy, and the extra costs of emergency and other actions taken to prevent flood damageand other losses. This includes, for example, the loss of production of companies affected by theflooding, induced production losses of their suppliers and customers, the costs of trafficdisruption or the costs of emergency services.

MRC Flood Management and Mitigation Programme Component 2: Structural Measures and Flood Proofing
Guidelines Flood Risk Assessment 72 December 2009
The losses due to business interruption and induced losses in other parts of the economy can bevery significant, especially if important economic hotspots are flooded. This is the case forexample, if an important airport if affected by flooding and has to be closed for a long period orif a cluster of important companies is affected. In general this effect is estimated by a modelthat includes the existing network of linkages within an economy. In such a model it can beinvestigated how the disruption of a one important facility or sector (e.g. an airport) affectsother parts of the economy. This is generally done by so called input output models; see forexample Van der Veen et al. (2003) for an example. However, these approaches have beeninvestigated in academic literature and they are not yet readily applicable to full practice.
Therefore a more pragmatic approach is often chosen. The losses due to business interruptionare generally estimated by assuming a certain interruption period (e.g. a number of months)and a cost factor that includes the lost economic activity (added value) and the number ofaffected employees.
If insufficient underlying data is available to estimate the indirect costs from models it is a morepractical way to analyse the level of indirect damage by means of surveys. For a flooded area itcan be analysed with surveys what the indirect damage categories are what the damage costsare for indirect damages. Eventually this gives information on the ratio between direct andindirect damages. With this ratio it is possible to estimate the indirect damage as a function ofthe direct damages. Further details on the application of this approach to estimate indirecteconomic damage to the Lower Mekong Basin are found in Annex 2 to the draft stage 1evaluation report, entitled �“Flood damages and flood risks in the focal areas�”.
3.4 Damage models
For consistent decision making it is desirable to have a more or less standardized approach fordamage assessment on a higher aggregation level, such as a river basin or even a completecountry. With this in mind, governments in several countries have developed standardizedmethods and software tools for the estimation of damage due to flooding as well as the risk andcost benefit calculation.
Examples are the HAZUS methodology developed in the USA (FEMA, 2003) or the standardizeddamage model developed in the Netherlands (Kok et al., 2005). In these approaches the landuse data and damage functions have been included in a computer model, so that the damagecan be easily estimated if input information for a certain flood scenario is available. Based onthis Dutch model a more generic model / tool has been developed under the name of DACA(Damage and Casualties Assessment) and it has also been applied to parts of the Lower MekongBasin �– see Textbox 1.
An automated approach is specifically attractive, when: A large number of damage categories and / or a large amount of land use data needs to be
processed; The underlying data on land use and values of assets is available in GIS format; It is expected that a large number of calculations has to be made, so that is efficient to
develop on automated approach. This could for example be the case when it is desired toanalyze many different situations (e.g. situations with various alternative protectionschemes and measures).
A similar damage function can be used for different areas that are considered in the model,i.e. the land uses and housing types have to be comparable.
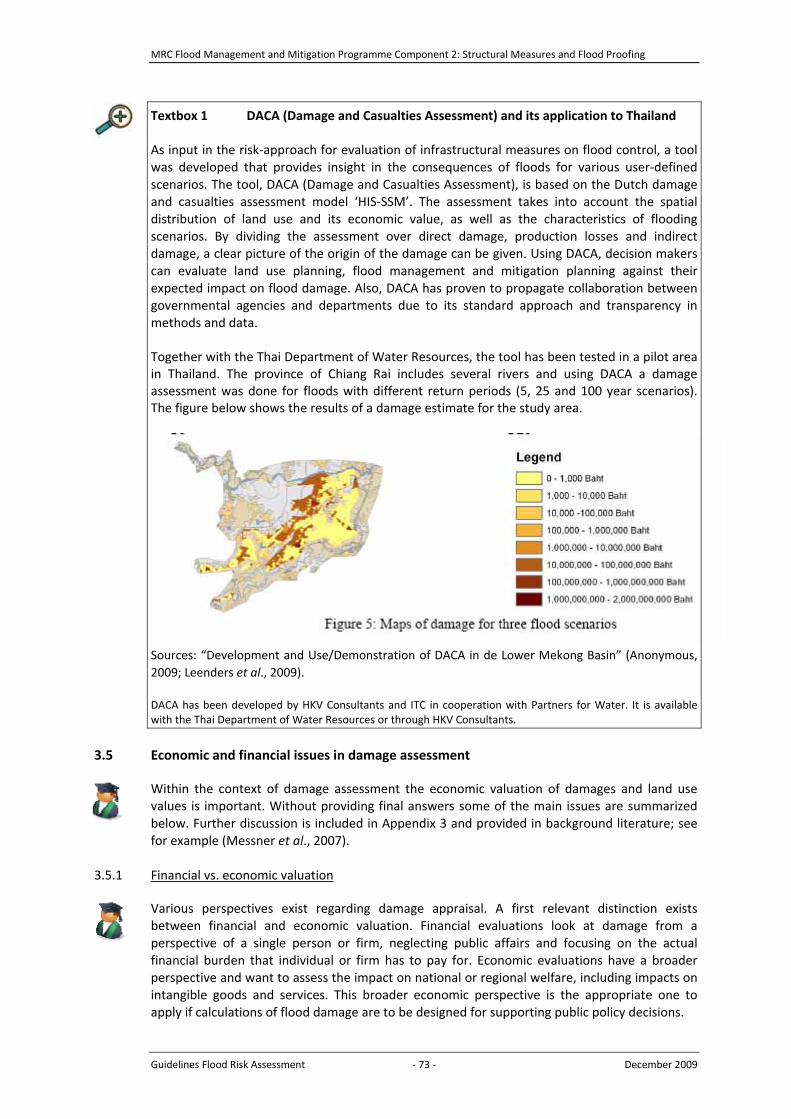
MRC Flood Management and Mitigation Programme Component 2: Structural Measures and Flood Proofing
Guidelines Flood Risk Assessment 73 December 2009
Textbox 1 DACA (Damage and Casualties Assessment) and its application to Thailand
As input in the risk approach for evaluation of infrastructural measures on flood control, a toolwas developed that provides insight in the consequences of floods for various user definedscenarios. The tool, DACA (Damage and Casualties Assessment), is based on the Dutch damageand casualties assessment model �‘HIS SSM�’. The assessment takes into account the spatialdistribution of land use and its economic value, as well as the characteristics of floodingscenarios. By dividing the assessment over direct damage, production losses and indirectdamage, a clear picture of the origin of the damage can be given. Using DACA, decision makerscan evaluate land use planning, flood management and mitigation planning against theirexpected impact on flood damage. Also, DACA has proven to propagate collaboration betweengovernmental agencies and departments due to its standard approach and transparency inmethods and data.
Together with the Thai Department of Water Resources, the tool has been tested in a pilot areain Thailand. The province of Chiang Rai includes several rivers and using DACA a damageassessment was done for floods with different return periods (5, 25 and 100 year scenarios).The figure below shows the results of a damage estimate for the study area.
Sources: �“Development and Use/Demonstration of DACA in de Lower Mekong Basin�” (Anonymous,2009; Leenders et al., 2009).
DACA has been developed by HKV Consultants and ITC in cooperation with Partners for Water. It is availablewith the Thai Department of Water Resources or through HKV Consultants.
3.5 Economic and financial issues in damage assessment
Within the context of damage assessment the economic valuation of damages and land usevalues is important. Without providing final answers some of the main issues are summarizedbelow. Further discussion is included in Appendix 3 and provided in background literature; seefor example (Messner et al., 2007).
3.5.1 Financial vs. economic valuation
Various perspectives exist regarding damage appraisal. A first relevant distinction existsbetween financial and economic valuation. Financial evaluations look at damage from aperspective of a single person or firm, neglecting public affairs and focusing on the actualfinancial burden that individual or firm has to pay for. Economic evaluations have a broaderperspective and want to assess the impact on national or regional welfare, including impacts onintangible goods and services. This broader economic perspective is the appropriate one toapply if calculations of flood damage are to be designed for supporting public policy decisions.

MRC Flood Management and Mitigation Programme Component 2: Structural Measures and Flood Proofing
Guidelines Flood Risk Assessment 74 December 2009
3.5.2 Estimating values of assets
For damage assessments it is important to have insight in the values of the objects and landuses that could be potentially damaged. The question is which economic value to assign.
The basis for valuation is the market price for an object or unit. The economic evaluation ofgoods and services which are traded in the market is a task that is relatively easy to accomplish.However, in more detailed assessments it could be assessed that several effects could �“disturb�”the market price and this should be taken into account in damage estimation5.
Secondly, depreciated values should be applied in order to reflect the value of a good at thetime when it is damaged by a flood. Using replacement costs is an overestimation of damagefrom a broader economic perspective, because replacement usually involves improvements: oldgoods which are damaged during a flood are usually substituted by new, more productive andbetter performing goods (Messner et al., 2007).
3.5.3 Time value of money
In an economic analysis it is important to consider the value of money over time. For example, abuilding that is worth US$ 50,000 this year could have a higher price next year.
From a more practical point of view the following is relevant. The (damage) values that are usedin a certain damage model could be based on the data collected for a certain year in the past.When one is estimating damages for the current situation it is important to take into account apotential increase in the values and damages. This could be due to economic growth and/orinflation.
3.6 Loss of life and health effects
3.6.1 Introduction
Apart from approaches for the estimation of economic damage that have been discussed above,there are several approaches for the estimation of other damage types that are expressed indifferent units. These damage types include the loss of life and general health impacts. In thisSection existing approaches and literature are briefly summarized for these damage types.
Although the presented approaches and methods are not yet part of standardized methods fordamage assessment6, their inclusion could be relevant for future more detailed investigations.
Finally, it is noted that the loss of life is sometimes expressed in terms of economic damage (e.g.a monetary value or damage sum per fatality). There is no uniform approach for the monetaryvaluation of loss of life and different approaches will lead to different values. In addition,valuing the loss of life will often lead to many ethical discussions. It is therefore often preferredto assess the loss of life separately and independently from the economic damages.
5 Since these ideal conditions are never fulfilled in a real world market, adjustments are necessary tocalculate the ideal �‘shadow price�’ of the good under examination. This means market prices must betranslated into shadow prices by excluding transfer payments like taxes and subsidies, and byconverting monopolistic market prices into competitive market prices.6 One exception is the approach for loss of life estimation that is included in the standard model fordamage assessment in the Netherlands.

MRC Flood Management and Mitigation Programme Component 2: Structural Measures and Flood Proofing
Guidelines Flood Risk Assessment 75 December 2009
3.6.2 Loss of life
One other very important consequence type concerns the loss of life. In recent years severalmethods have been developed for the estimation for loss of life, see (Jonkman, 2007). Ingeneral the following steps are needed to estimate the loss of life in a certain area:
1) Information regarding the flood characteristics;2) An analysis of the exposed population and evacuation;3) An estimate of the mortality amongst the exposed population.
The elaboration of these steps and the level of detail of the analysis depend on the type offlooding studied. Irrespective of the exact application, the output of hydrodynamic floodsimulations can be used to estimate the flood characteristics. For large scale flooding associatedwith dike breaching, e.g. in the Netherlands or New Orleans the steps 2 and 3 can be elaboratedat a relatively rough level of detail. A general estimate of the possibilities for evacuation of thepopulation can be made. In this analysis the effects of warning have to be taken into account.By analysing empirical information from historical floods new mortality functions have beendeveloped. These relate the mortality amongst the exposed population to the floodcharacteristics. Mortality is defined as the fraction of the exposed population that will notsurvive a flood event. An example of such a mortality function is presented in Figure 3.5. Thisfunction is applicable to areas where the water is rising rapidly, so that people have limited timeto find a safe place.
Figure 3.5 Example of a mortality function derived for large scale flooding in the Netherlands(Jonkman, 2007).
For smaller scale floods where velocities are more important, criteria have been developed toassess human instability (i.e. toppling) in flood flows. In general so called depth velocityproducts are used to indicate the combination of depth (h �– [m]) and velocity (v �– [m/s]) thatwould lead to a person�’s instability. Overall, the available studies and experiments show thatpeople lose stability in flows in relatively low depth velocity products. The obtained criticaldepth velocity products for standing range from 0.6 m2/s to about 2 m2/s. This means that aflow with 1m depth and a velocity of 1 m/s would most likely lead to instability of mostindividuals. Further details on human instability are included in Appendix 4.
MRC Flood Management and Mitigation Programme Component 2: Structural Measures and Flood Proofing
Guidelines Flood Risk Assessment 76 December 2009
3.6.3 Health effects and social and environmental impacts
Important non lethal health impacts of floods are injuries and illnesses. The occurrence of theseeffects and their importance will highly depend on (amongst others), the general healthsituation and medical infrastructure in the area affected (before and after the flood), climaticfactors, type of flooding (fresh, salt water) and duration of flooding, Thereby there is nostandardized approach for �“predicting�” these health effects. Hajat et al. (2004) and Ahern et al.(2005) give comprehensive overview of the available information regarding health impacts offloods.
In addition, longer term psychological health effects can occur amongst the population due toflooding. Some evidence exists regarding connections between psychological health effects andpost flood mortality, see e.g. (Bennet, 1970).
Flooding will also have adverse effects on the environment and the social system. Thesedamage types are generally analysed by means of qualitative / descriptive methods.
3.7 Presentation of damage assessments results
The results of flood damage assessment can be presented in different ways. Assuming thatflood damage is calculated for a given flood scenario, the following presentations are possible:
The damage number / amount for the flood scenario (in $ or another currency); The absolute damage value by category and the distribution of the total damage over the
categories; To support the damage estimate �“underlying�” numbers such as numbers of flooded houses,
or flooded hectares of farmland could be presented; Damage per hectare: indicating the �“damage density�” in the area.
As the effects of a flood are spatially distributed it could be relevant to present maps that giveinformation on the damages. This is possible by means of geographical information systems(GIS): see Section 2.7. The resolution of these maps and the level of spatial detail depend on the(spatial) scope of the analysis and the data available.
The damage per hectare can be determined precisely if the underlying data (e.g. land use andvalues) is available at a high spatial resolution. It is also possible to determine the averageddamage per hectare over a larger area. This can be done when damage functions are availablefor a larger area, e.g. a district.
Presentation example of a damage assessment
As an example a presentation of a damage assessment for a flood scenario in the Netherlands isshown. The flood scenario concerns the flooding of the densely populated province SouthHolland due to an extreme coastal flood. An area with in total 1 million inhabitants is flooded inthis scenario and the consequences are therefore very large. The total damage for this scenariois estimated with the Dutch standardized damage model and the damage is estimate to bearound 23.7 billion Euros.
Table 3.1 gives an overview of the distribution of the total damage over damage categories. Thespatial damage distribution for a flood scenario in the Netherlands is given by Figure 3.6,showing the density of damage per hectare. These results are used in flood risk studies anddiscussions on the revision of the national policy on flood protection in the Netherlands.

MRC Flood Management and Mitigation Programme Component 2: Structural Measures and Flood Proofing
Guidelines Flood Risk Assessment 77 December 2009
Table 3.2 Distribution of damage over damage categories for a flood scenario for South Holland(Jonkman et al., 2008).
Damage CategoryDirect damage(mln. EUR)
% of total damage
Residences and inventory 16,000 69%Commercial and public buildings 2,300 10%Vehicles 40 0%Infrastructure 300 1%Airports 500 2%Agriculture 1,900 8%Direct damages due to business interruption 2,700 11%
Total 23,740 100%
Figure 3.6 Damage intensity per hectare of the flooding of the area South Holland in theNetherlands.
3.8 Data collection
If no damage functions are available it is necessary to collect data for historical flood events toderive damage functions and indicators. The table below gives a general overview of thedamage categories, their definition, the type of data and sources that could be utilized to collectdata, and a summary of data items that could be collected. The table is based on the presentedgeneral classification of flood damages (see Section 3.2.1). As part of the data collection it is alsorelevant to collect data on benefits of flooding.
The table below could be seen as the desired list of information for several items. In practice adata collection and processing methodology has to be developed that yields the requiredinformation, given the availability of secondary data, time and budget constraints. In Section 3.9it is further elaborated how this approach has been applied in Stage 1 of the FMMP C2.

MRC Flood Management and Mitigation Programme Component 2: Structural Measures and Flood Proofing
Guidelines for Flood Risk Assessment 78 December 2009
Table 3.3 Overview of Flood Damage Data
Category Definition Type Source of data Summary of data items that could be collectedDirect damages
Loss of life and
injuries
Reported number of deaths, injuries and people missing due
to the flood
No. of deaths
No. of injuries
No. of missing
Damage to
properties and
infrastructure.
The estimated value of replacement or restoration of an
affected structure and inventories in the targeted areas such
as houses, schools, offices, commercial & industrial buildings
and installations, hydraulic works, energy, transportation,
infrastructures and supplies/assets of individuals and
businesses
No. of houses collapsed or damaged
No. of business collapsed and damaged
Km of roads
No. of schools/classrooms
No. of irrigation schemes
Etc. based on the actual indicators that are available in the
Provincial & District damage reports
Crop damages Agriculture land inundated or measure of agriculture
production lost, food and seed stocks damaged
Ha of crops destroyed
No. of fruit trees destroyed
Ha of land damaged/covered in sand
Tonnes of expected harvest lost
Stocks of produce and seeds lost
Livestock
damages
Drowned livestock and loss of income due to distress sale Dead poultry, dead large and small livestock
Damages to
fishery
Damaged aquaculture and fishing gear
Secondary data District/Provincial
level direct flood
damage reports
Fish/shrimp ponds damaged
Fish cages, rafts and traps damaged/lost
Boats lost
Damage to paddy Inundation depth damage relationships and effect of flooding
duration and timing on net benefits
Primary data Focus Group
Discussion
Hypothetical flood damage to paddy in relation to
inundation depth and timing of floods
Damage to
houses
Inundation depth damage relationship and house value Primary data Household/
business survey
Actual and hypothetical damage to houses as percentage
of house value in relation to inundation depth

MRC Flood Management and Mitigation Programme Component 2: Structural Measures and Flood Proofing
Guidelines for Flood Risk Assessment 79 December 2009
Category Definition Type Source of data Summary of data items that could be collectedIndirect damages
Cost of illness Costs associated with increased incidence of water borne
diseases compared to condition of no flood. Includes
additional cost of health care that families and individuals
spent on flood related illnesses; and additional expenditures
from local government for disease prevention and treatment
and for sanitation control during the flood
Primary data District authorities,
line agencies
Amount spent by individuals on flood related health care
Loss of labour from flood related disease
Amount spent on drugs, campaigns, care for disease
prevention
Cost of temporary
relocation and
rescue
Costs by local government and NGOs incurred before, during
and after the flood
District, NGOs Transport, temporary shelter, provision of food and
drinking water, etc.
Income losses Losses due to disruption of economic activities and/or services
by the flood for (i) individuals, landless labourers, families and
enterprises; (ii) large commercial and industry enterprises that
have been partly or fully closed down for some period of time
during high flood water level
Cost of repair/reconstruction of residential structures,
including:
Hypothetical damages to the residential structures based
on flood levels
Agricultural assets/incomes, crop losses
Livestock losses, fish/shrimp losses
Other HH income sources (e.g., home based businesses,
hired labour)
Loss of labour days
Health costs
Damage to business structures, equipment and inventory
Losses in revenues and employment
Private expenditures for flood protection
Higher cost of
living
Due to relocation water, food and fuel has to be purchased
that otherwise would be available on the farm
Purchase of food, water, fuel, etc.
Cost of
prevention
measure
Preventive measures Sand bags, etc.
Cost of cleaning
up
Cleaning houses, shops and other buildings
Primary data
Household survey
Business survey
Mainly labour
Benefits
Flood benefits Positive aspects of flooding for agriculture, fisheries and
otherwise
Primary data Focus Group
Discussion
Household benefits from fishing the flood waters, fertility
and pest control etc. to fields.

MRC Flood Management and Mitigation Programme Component 2: Structural Measures and Flood Proofing
Guidelines Flood Risk Assessment 80 December 2009
3.9 Flood damage assessment in the Mekong basin
3.9.1 Scope and selected areas
In stage 1 of the FMMP several focal areas were selected to investigate in detail the flooddamages and risks:
In Thailand: Lower NamMae Kok;In Lao PDR: Bokeo province and Lower Se Bang Fai basin;In Cambodia: Kratie province, Right Bank Bassac River and Left Bank Mekong River;In Vietnam: Upper Se San basin, Plain of Reeds (PoR) and Long Xuyen Quadrangle (LXQ).
The four delta focal areas in Cambodia and Vietnam compose two transboundary areas, oneeast of the Mekong River and the other west of the Bassac River.
The detail of the assessment is at district level, although part of the data is available atcommune level: see Data collection and surveys below.
Below, the general implementation of damage assessment is described and results areillustrated for three districts in Cambodia that were analysed as focal areas in the stage 1. Theseare the districts Koh Andet, Koh Thom and Kampong Trabek. More information on the damageassessments for these districts can be found in the report �”Flood damages and flood risks in thefocal areas�” Annex 2 to the draft stage 1 evaluation report (Royal Haskoning, 2008).
3.9.2 Approach and methodology
As described in Section 3.3.4, there are basically two approaches for flood damage/ riskassessment: a top down and a bottom up one. In the top down approach historical damagedata for an (administrative) area are used to assess the flood damage/ risk in that area. In thebottom up approach inundation damage relationships are developed on a per unit (ha, house)basis, and the flood damage/ risk is assessed by applying the per unit risk to the number of unitsin the concerned area.
For the top down approach only a limited set of data is needed to determine flood damage,available at government agencies. With these data sets absolute damage curves can be created(see Section 3.3.4), so to the top down approach is also referred to as the �‘absolute damageapproach�’.
For the bottom up approach various data sets and many processing steps are required. It will,among others, result in relative damage curves (see Section 3.3.4), so to the bottom upapproach is also referred to as the �‘relative damage approach�’.
In this study both approaches have been followed for damages to Housing and Agriculture; forInfrastructure & Relief only the top down approach could be applied by lack of adequate spatialinformation.
The assessment of hydrological hazards (peak discharges and volumes for different returnperiods) has proven to be possible with accuracy acceptable for risk assessment. Themethodology applied is in principle applicable basin wide. The conversion of hydrologicalhazards into flood hazards (flooding depth and duration for different return periods) has provento be more problematic. Limited topographical information and modelling quality or availabilityhamper accurate flood damage/ risk assessments. The derived flood damage/ risk maps for thefocal areas are, therefore, to be considered with due care.

MRC Flood Management and Mitigation Programme Component 2: Structural Measures and Flood Proofing
Guidelines Flood Risk Assessment 81 December 2009
Flood vulnerability assessments have been made for a number of sample districts in the focalareas. These assessments have allowed for the estimate of indirect damages due to flooding inaddition to the, generally known, direct damages. Moreover, damage curves could be estimatedproviding the relation between flood damages and inundation depth and time of flooding in acertain area.
A GIS based tool has been developed that allows for the calculation of flood damages/ risks bycombining flood maps (see Chapter 2) and other available GIS data sets with the deriveddamage curves. This tool is in principle applicable basin wide, provided that flood maps areproduced and adequate GIS data sets are available.
3.9.3 Damage categories
In the lower Mekong basin the most important damage categories that were analysed as part ofStage 1 of the project are:
Infrastructure & ReliefIncludes facilities, equipment and materials for education, health, irrigation, bank erosion,fisheries, transport, communication, industry, construction, drinking water and sanitation,rescue operations, support and relief.
HousingIncludes collapsed and swept away houses, partly damaged or submerged houses, damagedroofs and other private property damage, cultural & historical structures, offices, smallindustrial units, markets & commercial centres and warehouses.
AgricultureIncludes rice areas, flower & vegetable areas, other annual crops, perennial crops, large andsmall livestock and poultry, damaged agro chemicals and erosion of farm land and housingland.
The importance of these categories varies among the focal areas depending topographicalcharacteristics and existing level of flood protection. The levels of importance in a share of totalflood damages are presented in Table 3.4.
Table 3.4 Observed level of important share of damages in the focal areas
Categories Laos Thailand Cambodia VietnamPublic infrastructures 3 2 1 1Housing 2 3 3 2Agriculture 1 1 2 3
Source: Direct flood damage inventory
Note: Number 1 is the most important share; Number 2 is moderate share, and Number 3 is a small share.
3.9.4 Data collections and surveys
The approach for data collection that was followed in Stage 1 of the FMMP is summarizedbelow. A data collection and processing methodology was designed that could be expected toyield the required data for the focal areas, given the availability of secondary data, time andbudget constraints.

MRC Flood Management and Mitigation Programme Component 2: Structural Measures and Flood Proofing
Guidelines Flood Risk Assessment 82 December 2009
Flood damage data is collected annually by various administrations: at province, district andcommune level. Also flood levels are measured by governmental agencies. These data havebeen retrieved by Stage 1 of the FMMP.
Primary and secondary data have been not only been collected at these governmentalorganisations, but also at households and businesses in order to establish an inventory of floodvulnerability characteristics and direct and indirect flood damages.
Focus group discussions with people living and working in the project areas have been held toprovide insight into a range of relevant issues such as the benefits of flooding, traditional copingmechanisms and community resilience.
Surveys have been held to collect and/or validate existing information on direct damages for anagreed reference flood; and, to the extent possible, and to document and quantify indirectdamages associated with the reference flood event. For this purpose the 2006 flood wasselected as this flood can be considered an �‘average flood�’ and as this year was consideredrecent enough for respondents to remember with an acceptable level of accuracy.
During the Household and Business interviews respondents have been asked to also estimatedamages in case the flood water would have reached higher levels than in 2006. During themeeting with Provincial and District authorities flood damages have been collected for as manyyears as were available in their records.
The sources of data on direct and indirect damages included interviews with the followinggroups:
Provincial and District officialsReview and validation of existing data on casualties and direct damages caused by historicflood/erosion events. This is an extensive listing in kind and in monetary terms of damagesoccurred in the recent past. Damage categories included educational facilities, healthcarefacilities and assets, road and transport facilities, irrigation facilities, water supply &sanitation infrastructure, power facilities, and communication infrastructure.
HouseholdsCollection of data of individual households in the envisaged project areas for a particularreference year in which significant flooding/erosion occurred (2006). Data collectionincluded household characteristics, characteristics of the recent flood(s), losses toresidential structures, hypothetical damages to the residential structures in the case theinundation depth would have been higher, agricultural assets/incomes, crop losses,livestock losses, fish/shrimp losses, other HH income sources (e.g. home based businesses,hired labour) and health impacts.
Local businesses (non home based)Collection of data of individual businesses in the envisaged project areas for a particularreference year in which significant flooding/erosion occurred (2006). Data collectionincluded business data, characteristics of the recent flood(s), direct and indirect damages tobusiness structures, equipment and inventory, impact on revenues and employment, andexpenditures for flood protection.
In addition, the field work in each study area included:

MRC Flood Management and Mitigation Programme Component 2: Structural Measures and Flood Proofing
Guidelines Flood Risk Assessment 83 December 2009
Baseline flood vulnerability data collectionIn consultation with local district and/or commune officials and existing databases, datawere assembled to document key aspects of flood and erosion vulnerability including:population composition and growth, number of households, household assets, economicactivities, poverty incidence, land ownership, land use and cropping patterns, fisheriesproduction, animal husbandry, types of structures and infrastructure. In addition, thebaseline captured data on business activities, educational facilities and assets, healthcarefacilities and assets, road and transport facilities, irrigation facilities, water supply &sanitation infrastructure, power facilities, and communication infrastructure. This data is tobe incorporated into the flood data database, as well as being used in the formulation offlood risk management strategies.
Focus groups on community resilienceThe survey team facilitated focus groups with local leadership, community/ massorganizations and including men and women living in the study area who representdifferent economic activities and wealth. The groups are used to collect qualitativeinformation on the beneficial and detrimental effects of floods and erosion. A guide forthese discussions had been prepared to ensure that the various groups follow the samepattern and that results could be compared and analysed. The focus group discussionscovered issues such as the history of flooding in the area, their perception of �‘good�’ and�‘bad�’ floods, benefits of floods for paddy cultivation and fishing, traditional copingmechanisms and strengths and weaknesses of community preparedness and resilience toflooding.
For each of the above mentioned approaches a survey tool was developed. The tools consist ofquestionnaires for the first three approaches and a guideline for the focus group discussions.For focal areas where bank erosion is the issue, a revised methodology has been developed tocollect data at district level for each relevant river bank Section; no household or businessinterviews and no focus group discussions were held there. The set of tools consists of:
Questionnaires for Provincial & District Inventory of direct flood damages/ bank erosion; Questionnaires for District Flood vulnerability/ bank erosion baseline database; Questionnaires for District flood events/ bank erosion; Questionnaires for District Indirect flood/ bank erosion costs; Guide for Focal Group discussion; Household questionnaire; Business questionnaire; National Report outline.
These tools have been translated into the local languages as required and spreadsheets forquestionnaire analysis were prepared and provided to the survey team, along with a guidelineto prepare a national report.
The data from the surveys, interviews, group discussions, field observations, combined with thedata in the governmental damage reports, are the basis for the damage functions and damageprobability curves.

MRC Flood Management and Mitigation Programme Component 2: Structural Measures and Flood Proofing
Guidelines Flood Risk Assessment 84 December 2009
Overview of data sources for damage assessment using a GIS
For the absolute approach of flood damage (see Section 3.3.4) the data requirements are lowerthan for the relative approach. A Geographic Information System (GIS) is required for therelative approach, combining spatial data with tabular data. Figure 3.7 shows the differenceschematically for agriculture, housing and infrastructure damage and risk assessments.
Data required
GIS: land use
= village and household data
Survey:
housing data/ values
Survey:
agriculture data/ values
Hydraulic model (ISIS) data: calculated flood levels
Flooding reports: district/ commune damage data
GIS: land use
= agriculture
Agriculture(annual/ perennial crops,
livestock, poultry, fertilisers,
chemicals, erosion etc.)
Housing(houses, offices, sheds, cultural
buildings, industrial units,
markets, warehouses etc.)
Infrastructure & relief(for education, health, irrigation,
fisheries, transport, communi-
cation, industry, drinking water/
sanitation, relief etc.)
GIS: land use
= infrastructure data
Survey:
infrastructure data/ values
Flooding reports: country/ province damage data
GIS base data: DTM (DEM), administrative boundaries
Hydrological dbase: measured flood levels (also model data can be used)
Relative damage (%) - flood depth graphs
Absolute damage ($) - flood level graphs
complex
simple
Figure 3.7 The absolute and relative flood damage assessment approaches require differentdata sets.
Table 3.5 gives an overview of data sources that were used to determine flood damages in theCambodian focal areas. Maps were produced at both district and commune level, although thecommune level results for housing damage were partly based on district level information(average house values).

MRC Flood Management and Mitigation Programme Component 2: Structural Measures and Flood Proofing
Guidelines Flood Risk Assessment 85 December 2009
Table 3.5 Data sources used for mapping damages in the Cambodian Mekong delta.
Category Definition Source
Information on flood characteristics: Hydrologic and elevation information
ISIS maximum water levels fordifferent return periods
Max. water levels for different periods in the year
(e.g. early flood season, rainy season) and various
return periods (e.g. 2, 5, 10, 25 and 100 years)
ISIS hydraulicmodel (MRC)
Digital Elevation Model (DTM, DEM) Altitude ground level data for the whole Mekong
basin
MRC GIS data
Information on land use and values
District and commune/ villageboundaries
MRC GIS data
Village locations and number ofhouseholds per village
MRC GIS data
Paddy coverage (JICA land use map) Coverage (areas) of early flood rice and rainy
season rice cultivation
MRC GIS data,JICA
Average house values per district FMMP C2surveys
Damage functions
�‘Damage water depth�’ curves forhousing and rice at district level
Relation (mathematical function) between the
local flood level (flooded areas) and the damage on
housing or rice cultures
FMMP C2surveys
3.9.5 Derivation of damage functions
To be able to estimate damage the following information sources have to be combined (also seeSection 3.3.2):
a) Information on land use and values;b) Information on flood characteristics;c) Damage functions.
The MRC executed a socio economic survey early 2008 related to flooding in several districts.This survey showed that for some socio economic aspects (as houses, roads) mainly themaximum annual flood depth is determining the damage. For agriculture there is a distinctionbetween the �‘early flood�’ paddies and the �‘rainy season�’ paddies. Damage to the �‘early flood�’paddies is mainly caused by the floods up to June July, while damage to the �‘rainy season�’paddies is the result of floods up to October.
With the governmental commune data and MRC survey flood damage data of three Cambodiandistricts the relation between water level and flood damage has been established forinfrastructure and relief, housing, and agriculture. Figure 3.8 shows the results for Koh Andeth.

MRC Flood Management and Mitigation Programme Component 2: Structural Measures and Flood Proofing
Guidelines Flood Risk Assessment 86 December 2009
Koh Andeth: Direct & indirect damages Infrastructure & Relief
0.0
0.2
0.4
0.6
0.8
3.0 3.5 4.0 4.5 5.0
max water level at Borey Cholsar (M+MSL)
Dam
age
(Mill
ion
US
D)
damagefit
Koh Andeth: Direct & indirect damages Housing
0.00
0.01
0.02
0.03
0.04
3.0 3.5 4.0 4.5 5.0max water level at Borey Cholsar (M+MSL)
Dam
age
(Milli
on U
SD)
damagefit
Koh Andeth: Damages Agriculture
0.00
0.40
0.80
1.20
1.60
3.0 3.5 4.0 4.5 5.0max water level at Borey Cholsar (M+MSL)
Dam
age
(Milli
on U
SD)
damagefit
Figure 3.8 District flood damage curves for Koh Andeth.
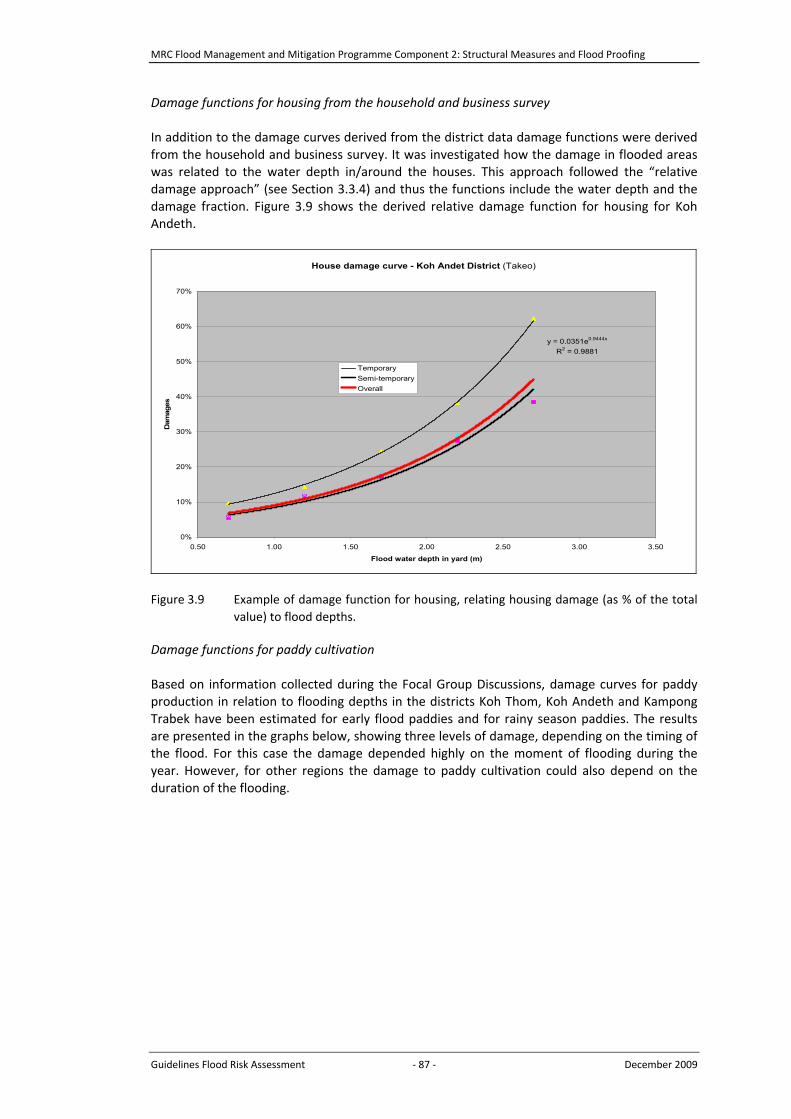
MRC Flood Management and Mitigation Programme Component 2: Structural Measures and Flood Proofing
Guidelines Flood Risk Assessment 87 December 2009
Damage functions for housing from the household and business survey
In addition to the damage curves derived from the district data damage functions were derivedfrom the household and business survey. It was investigated how the damage in flooded areaswas related to the water depth in/around the houses. This approach followed the �“relativedamage approach�” (see Section 3.3.4) and thus the functions include the water depth and thedamage fraction. Figure 3.9 shows the derived relative damage function for housing for KohAndeth.
House damage curve - Koh Andet District (Takeo)
y = 0.0351e0.9444x
R2 = 0.9881
0%
10%
20%
30%
40%
50%
60%
70%
0.50 1.00 1.50 2.00 2.50 3.00 3.50
Flood water depth in yard (m)
Dam
ages
TemporarySemi-temporaryOverall
Figure 3.9 Example of damage function for housing, relating housing damage (as % of the totalvalue) to flood depths.
Damage functions for paddy cultivation
Based on information collected during the Focal Group Discussions, damage curves for paddyproduction in relation to flooding depths in the districts Koh Thom, Koh Andeth and KampongTrabek have been estimated for early flood paddies and for rainy season paddies. The resultsare presented in the graphs below, showing three levels of damage, depending on the timing ofthe flood. For this case the damage depended highly on the moment of flooding during theyear. However, for other regions the damage to paddy cultivation could also depend on theduration of the flooding.

MRC Flood Management and Mitigation Programme Component 2: Structural Measures and Flood Proofing
Guidelines Flood Risk Assessment 88 December 2009
Damage Curve for Early Flood Paddy, Cambodia
0
100
200
300
400
500
600
700
800
1.0 1.5 2.0 2.5 3.0 3.5 4.0 4.5
Flooding depth (m)
Dam
age
(US$
/ha)
1 of June1 of July1 of August
Figure 3.10 Relative flood damage curves for paddies, Cambodia.
3.9.6 Creation of damage maps
Basically two types of damage maps can be distinguished:1. Damage maps based on absolute damage curves;2. Damage maps based on relative damage curves.
Figure 3.11 shows the steps to create the maps. The data for creating the damage maps can becombined in several ways, but the map output will be equal to these two types.
Ad 1 Damage maps based on absolute damage curvesAbsolute damage curves are created with historic flood damage inventories related toflood levels for a specific area, e.g. a district: see Figure 3.8. The flood level at the time/date of flooding originates from a gauge station in the district or from a hydraulic modelcovering that same district. The absolute damage curves are linked to the long termflood levels from the same gauge station, resulting in a damage probability curve.Damage figures for certain flood return periods are extracted from this curve. A mapmay show the district boundaries plus the damage value of a certain return period inthe district as a �‘pie�’, bar chart, colour shading etc.
Ad 2 Damage maps based on relative damage curvesRelative damage curves are created with damage figures related to the flood depths atthe damage locations: see Figure 3.9 (housing) and Figure 3.10 (paddies). The damagefigures may come from a field survey or may be based on expert knowledge. A land usemap may provide the spatial distribution of e.g. paddies. A flood map (see Chapter 2)gives the water depths in an area for a certain return period (based on hydraulicmodelling results). By combining the land use map (with e.g. paddies, villages or roads)with the flood map (water depths at specific return period), the areas with ánd paddiesánd certain water depths for different return periods are known. This information canbe combined with the relative damage curves, resulting in the damage on paddies. Amap shows the damage value of a certain return period in the area as a �‘pie�’, bar chart,colour shading etc.

MRC Flood Management and Mitigation Programme Component 2: Structural Measures and Flood Proofing
Guidelines Flood Risk Assessment 89 December 2009
Assessmentproducts
Koh Thum; Direct & indirect damages Infrastructure & Relief
0.0
0.2
0.4
0.6
0.8
1.0
4.5 5.0 5.5 6.0 6.5
max water level at Koh Thum (m +MSL)
Dam
age
(mill
ion
US$
)
House damage, Tan Hong District
y = 0.0231x3.0908
R2 = 0.9482
0%
10%
20%
30%
40%
50%
60%
0 0.5 1 1. 5 2 2.5 3
Flood depth in yard (m)
Dam
age
(% h
ouse
val
ue)
Damage ($) - probability graphs
Flood depth maps(various return periods)
complex
simple
Flood level table(+ return period of level)
Land use maps(analysis by theme)
complex
simple
Flood damage and risk maps: communes
Flood damage and risk maps: district, province...
Flood damage and risk tables: communes
Damage Probability Curve
0
2
4
6
8
10
12
14
0% 10% 20% 30% 40% 50% 60%
Probability of Excedance
Dam
age
(Mill
ion
USD
)
Relative damage (%) - flood depth graphs
Absolute damage ($) - flood level graphs
Figure 3.11: Steps (simplified) to create maps based on absolute and relative damage �– flood depth curves.

MRC Flood Management and Mitigation Programme Component 2: Structural Measures and Flood Proofing
Guidelines Flood Risk Assessment 90 December 2009
As the �‘relative damage curve�’ method uses spatial information available on maps, the level ofdetail that may be obtained is higher than with the �‘absolute damage curve�’ method. In bothcases care have to be taken with combining information of different detail levels in order tointerpret the accuracy of the results correctly.
To come to maps based on relative damage curves, a series of calculations have to be done:both in a spreadsheet and in a GIS. For details on the steps and calculations in the spreadsheet,see the spreadsheet that is included on the CD/DVD with the digital guidelines.
3.9.7 Results of damage assessments
The damage assessments results of the focal areas in Cambodia have been generated by districtusing the absolute damage approach. Table 3.6 shows the results for Koh Andet for events withdifferent probabilities. The results can also be shown on maps. Figure 3.12 and Figure 3.13display the total damage and the damage per hectare for paddies. In addition, the damagevalues obtained using the absolute method could be mapped.
Table 3.6 Damage data for different return periods for Koh Andet district. Damage is shown inmillion US $.
Probability (1/year)Damage 1% 5% 10% 50%Housing 0.05 0.04 0.03 0.00Infrastructureand relief
1.14 0.75 0.69 0.10
Agriculture 2.15 1.58 1.48 0.35Total 3.35 2.37 2.20 0.45
By combining the above damage assessments with the estimates of the probability the risk canbe assessed, as will be shown in Section 4.5.
Textbox 2
Example 1: Cambodia, creating a housing damage map based on relative damage curves
The ISIS based flood or water depth maps can be combined with the village location maps,resulting in known water depths (by return period) for each village. Using house damagecurves (see Figure 3.9), knowing district average house values and having the number ofhouseholds per village, the housing damage per village and per commune can be calculated(see spreadsheet on CD/DVD). By exporting the data from the spreadsheet to a GIS theseresults can be displayed on a map.
Example 2: Cambodia, creating a paddy damage map based on relative damage curves
To calculate damages to rice for different flooding return periods, the JICA land use mapsupplies the areas cultivated with rice. The paddies that are flooded once every two yearsare considered to be the �‘early flood�’ paddies, while the other paddies (on higher grounds)are considered to be the �‘rainy season�’ paddies. By combining the flood depth maps (byreturn period) with these paddy maps in a GIS, exporting these GIS data to a spreadsheetand by combining these with the rice damage curves (of e.g. July for �‘early flood�’ rice; seeFigure 3.9) in the spreadsheet, the rice damage can be calculated (see spreadsheet onCD/DVD). These results can be exported to a GIS for showing the rice damages on a mapwith districts or communes: see Figure 3.13.

MRC Flood Management and Mitigation Programme Component 2: Structural Measures and Flood Proofing
Guidelines Flood Risk Assessment 91 December 2009
Figure 3.12 Example of a damage map based on relative damage curves, showing total paddydamage in 3 districts and their communes.

MRC Flood Management and Mitigation Programme Component 2: Structural Measures and Flood Proofing
Guidelines Flood Risk Assessment 92 December 2009
Figure 3.13 Example of a damage map based on relative damage curves, showing paddy damageper hectare in 3 districts and their communes.

MRC Flood Management and Mitigation Programme Component 2: Structural Measures and Flood Proofing
Guidelines Flood Risk Assessment 93 December 2009
CHAPTER4FLOOD RISK ASSESSMENT

MRC Flood Management and Mitigation Programme Component 2: Structural Measures and Flood Proofing
Guidelines Flood Risk Assessment 94 December 2009

MRC Flood Management and Mitigation Programme Component 2: Structural Measures and Flood Proofing
Guidelines Flood Risk Assessment 95 December 2009
4 FLOOD RISK ASSESSMENT
4.1 Introduction
In the risk assessment the results of the hazard and damage assessments are combined. Thischapter describes the approach for risk assessment (Section 4.2) and several options forpresenting the assessment results (Section 4.3). Section 4.4 describes how the results of a riskassessment can be used to evaluate the effects of measures and the level of acceptable risk.The final section demonstrates how the risk is determined for a case study area for the LowerMekong Basin.
4.2 General approach
Flood risk is generally defined as follows:
Risk = Probability x Damage (4.1)
For example, if an area has a probability of flooding of 1% per year (or 1/100 per year) and thedamage is $ 20 million, the risk equals $ 200,000 per year. As this risk number reflects theaverage expected economic damage per year, it is also referred to as yearly expected economicdamage.
In flood risk assessment both the probabilities and consequences of flood events have to beassessed. Figure 4.1 shows conceptually the process of risk determination for a river and itincludes the following steps:
1. The starting point is information on the frequency of certain river discharges. Thisinformation can e.g. be obtained from historical data or probabilistic analysis ofhydrological processes.
2. Next, the relationship between the discharge and the water (flood) depth should beobtained, e.g. by means of a hydraulic model or a stage discharge relationship. These firsttwo steps are described in more detail in Chapter 2 on flood hazard assessment.
3. To assess the flood damage a relationship between the flood characteristics and the levelof flood damage is needed, the so called damage function (see Chapter 3 on flood damageassessment).
4. By combining these steps the return period of a certain damage level can be assessed.
In Section 4.4 this approach is elaborated for areas in the Lower Mekong Basin.

MRC Flood Management and Mitigation Programme Component 2: Structural Measures and Flood Proofing
Guidelines Flood Risk Assessment 96 December 2009
Discharge Q
Return period T
1) Probabilistic analysis of river discharges
Discharge Q
2) Hydraulic modeling
Water depth h
Water depth h
3) Damage assessment
Damage D
Return period T
Damage D 4) Determination of the risk
Figure 4.1 Conceptual approach for determination of flood risk.
4.3 Presentation of the results of risk assessments
4.3.1 Economic risk
To estimate the flood risk of an area, information is needed on the probabilities andconsequences of flood events that could affect that area. For a full probabilistic analysis a largenumber of flood events should be analysed with numerical models. This can be done in a socalled Monte Carlo analysis in which a lot of events are numerically simulated. This way theflood hazards and damage values can be determined for all events and they are combined toestimate the risk.
However, usually a practical approach is followed by analysing a limited number of floods whichare representative for the spectrum of possible floods. For example, the annual flood, the 1/2,1/5, 1/10 and 1/100 (read: once per 100) year events could be analysed. For each flood ahydraulic simulation and damage assessment can be made.
Table 4.1 Example of a table that summarizes the damage and probability calculations for arange of flood scenarios.
Return period (year) 2 5 10 100
Probability of exceedance
(per year)1/2 1/5 1/10 1/100
Flood damage ($) Damage1/2 Damage1/5 Damage1/10 Damage1/100
The flood scenarios can be defined depending on their return period, i.e. the averagerecurrence interval between the occurrence of two floods with a certain flood level andcorresponding damage value. It is also possible to determine the probability of exceedance of
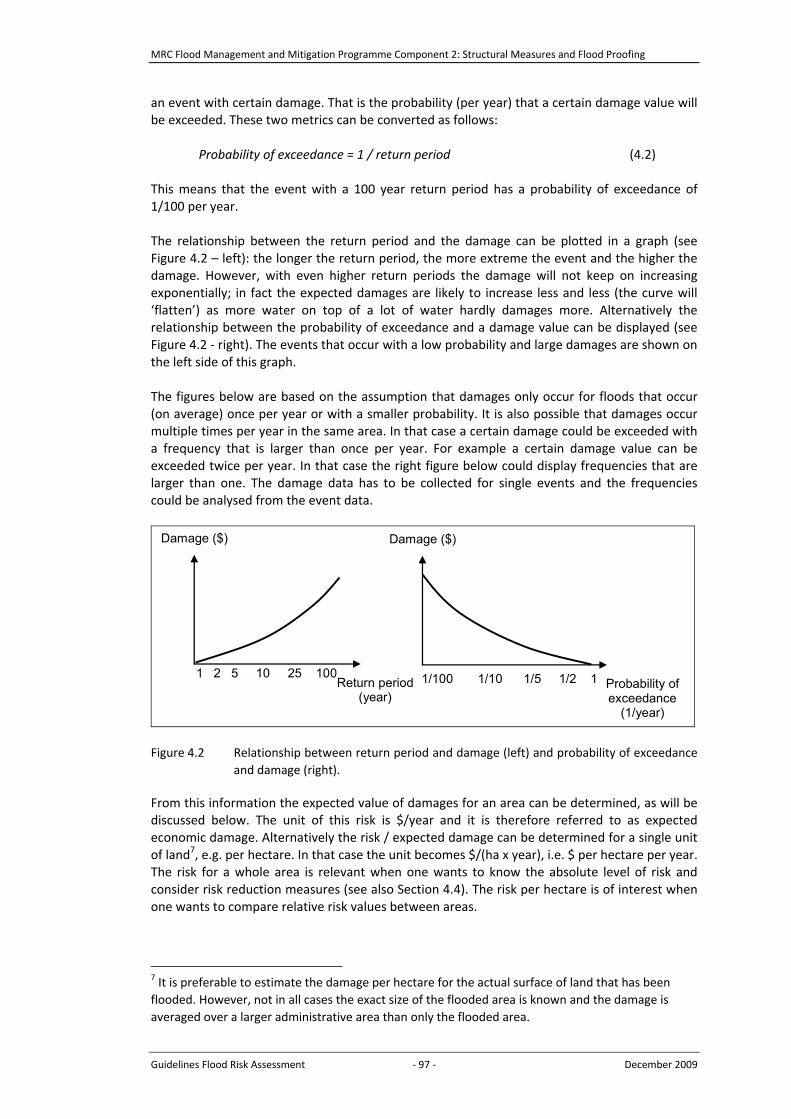
MRC Flood Management and Mitigation Programme Component 2: Structural Measures and Flood Proofing
Guidelines Flood Risk Assessment 97 December 2009
an event with certain damage. That is the probability (per year) that a certain damage value willbe exceeded. These two metrics can be converted as follows:
Probability of exceedance = 1 / return period (4.2)
This means that the event with a 100 year return period has a probability of exceedance of1/100 per year.
The relationship between the return period and the damage can be plotted in a graph (seeFigure 4.2 �– left): the longer the return period, the more extreme the event and the higher thedamage. However, with even higher return periods the damage will not keep on increasingexponentially; in fact the expected damages are likely to increase less and less (the curve will�‘flatten�’) as more water on top of a lot of water hardly damages more. Alternatively therelationship between the probability of exceedance and a damage value can be displayed (seeFigure 4.2 right). The events that occur with a low probability and large damages are shown onthe left side of this graph.
The figures below are based on the assumption that damages only occur for floods that occur(on average) once per year or with a smaller probability. It is also possible that damages occurmultiple times per year in the same area. In that case a certain damage could be exceeded witha frequency that is larger than once per year. For example a certain damage value can beexceeded twice per year. In that case the right figure below could display frequencies that arelarger than one. The damage data has to be collected for single events and the frequenciescould be analysed from the event data.
Damage ($) Damage ($)
Return period (year)
Probability of exceedance
(1/year)
1 2 5 10 25 100 1/100 1/10 1/5 1/2 1
Figure 4.2 Relationship between return period and damage (left) and probability of exceedanceand damage (right).
From this information the expected value of damages for an area can be determined, as will bediscussed below. The unit of this risk is $/year and it is therefore referred to as expectedeconomic damage. Alternatively the risk / expected damage can be determined for a single unitof land7, e.g. per hectare. In that case the unit becomes $/(ha x year), i.e. $ per hectare per year.The risk for a whole area is relevant when one wants to know the absolute level of risk andconsider risk reduction measures (see also Section 4.4). The risk per hectare is of interest whenone wants to compare relative risk values between areas.
7 It is preferable to estimate the damage per hectare for the actual surface of land that has beenflooded. However, not in all cases the exact size of the flooded area is known and the damage isaveraged over a larger administrative area than only the flooded area.

MRC Flood Management and Mitigation Programme Component 2: Structural Measures and Flood Proofing
Guidelines Flood Risk Assessment 98 December 2009
The risk/ expected damage can be determined by calculating the area under the curve thatshows the relationship between probability of exceedance and the damage (Figure 4.3). In thefigure the risk is found by summing areas A, B, C, D and E. For a more precise estimate also theareas �‘a�’, �‘b�’, �‘c�’, �‘d�’ and �‘e�’ can be approximated by triangles and added to find the total risk.
Note that just multiplying the damages from Table 4.1 with their probability of exceedancewould lead to double counting and an overestimation of the damage. Figure 4.3 shows why: byjust multiplying Damage1/2 with a return period of ½ per year one would �‘extend�’ area E all theway to the y axis, overlapping partly A, B, C and D. Instead, one should calculate (prob. 1/2 �–prob. 1/5) x Damage1/2. The same applies to the other damages/ probabilities.
Dam
age
[US
$/ha
]
Probability [-]1/100 1/25 1/10 1/5 1/2
BC
D
E
b
c
dA
e
Figure 4.3 The area below the curve, the total risk or expected damage (US$/year), isapproximated by summing A, B, b, C, c, D, d, E and e.
When a large number of events with different return periods is known, the stepwise curve willlikely approach a continuous curve. In that case the risk / expected value can be approximatedby just summing the areas of blocks A, B, C, D and E and the triangles a, b, c, d and e can beomitted.
The general experience is that the events with the highest probabilities (or lowest returnperiods) form a major part of the risk. Although damages for events with high return periods(e.g. 100 years) can be very high, this effect is often largely compensated by the low probability.
The results of risk calculation can be shown on maps. For example the expected economicdamage for different areas can be shown. The advantage of the use of flood risk maps is thatthey give insight in the spatial distribution of flood risks and thus to the contribution of specificareas to the overall flood risks. This implies that �‘hot spots�’ with the largest contribution to theoverall risk level can be easily identified. Also finding the relation with the presence or absenceof flood protection works or other flood related themes can be facilitated by a map. Examplesof risk maps for the Lower Mekong Basin are included in Section 4.5.
4.3.2 Risk to life
An important indicator in risk evaluation and decision making is the risk to life (loss of life). Toestimate this type of risk loss of life data and related flood event data are required. The loss oflife can be estimated with the approaches described in Section 3.6. Again a table could be madethat shows for several events or scenarios the probability of exceedance and the loss of life(similar to Table 4.1).

MRC Flood Management and Mitigation Programme Component 2: Structural Measures and Flood Proofing
Guidelines Flood Risk Assessment 99 December 2009
The risk to life is generally referred to as societal risk. It can be shown in a so called FN curve,which shows the probability of exceedance of a certain number of fatalities. Both axes areshown at a logarithmic scale, meaning that the difference between two axis units is a factor 10.Figure 4.4 shows and example of an FN curve8.
Probability of exceedance (1/yr)
Fatalities 10 100 1000
10-3
10-5
10-7
Figure 4.4 Example of a FN curve.
In addition the individual risk of flooding (death of a person) can be calculated. The individualrisk due to flooding can be compared to individual risks for other activities, e.g. the risks oftraffic or disease. These results can be used as input for decision making; see Section 4.3 forfurther details.
4.4 Risk reduction measures and risk evaluation
4.4.1 Effects of measures on the risk
The results of a flood risk assessment could be very useful to evaluate the effects of measures.Basically there are two types of measures:
1. Measures to reduce the probability of flooding;2. Measures to reduce the consequences of flooding.
Figure 4.5 gives an overview of possible measures and schematically shows the effects of thesemeasures on risk. It assumes that measures to reduce the probability will completely eliminatethe damage up to a protection level with a certain probability of exceedance. In that case floodswith larger probabilities (smaller return periods) will be controlled and will not cause anydamage. This is for example the case when dikes or embankments are built to provideprotection to an area up to a certain protection level, e.g. for a 50 year return period.
Measures to reduce the consequences, e.g. adaptation of land use and buildings, will reduce theconsequences of an event for a given return period. Measures can be combined, so there will bea combined reduction in risks.
Finally, compensation and insurance are also often mentioned as measures to reduce theconsequences. However, these measures do not reduce the total damage, but imply only afinancial reallocation of the flood damage.
8 A FN curve is very similar to the curve that shows the probability of exceedance of a certaindamage value. The difference is that the damage value (in this case loss of life) is shown on thehorizontal axis of the FN curve.

MRC Flood Management and Mitigation Programme Component 2: Structural Measures and Flood Proofing
Guidelines Flood Risk Assessment 100 December 2009
Measures to reduce flooding probability:Strengthening of dikes and embankmentsRiver widening (�“room for rivers�”)Retention and emergency storage
Measures to reduce floodingconsequences:Land use planningSecondary flood defencesFlood proof buildings (e.g. raising)
Damage ($)
Probability of exceedance
(1/year)
1/100 1/10 1/5 1/2
Damage ($)
Probability of exceedance
(1/year)
1/100 1/10 1/5 1/2
Figure 4.5 Effects of measures on flood risk.
4.4.2 Basics of cost benefit analysis
In order to evaluate whether a certain measure achieves enough risk reduction, a cost benefitanalysis can be carried out. A project should result in an increase of economic welfare, i.e. thebenefits generated by the project should exceed its costs (or disbenefits). Further informationon cost benefit analysis in the context of flood management is given in (Penning Rowsell andChatterton, 1977) or the guidelines for cost benefit analysis (CBA) developed in the UK (MAFF,1999, 2000) and Australia (BTRE, 2001).
Every effect of an investment project can be systemically estimated and, wherever possible,given a monetary value. The cost benefit analysis gives an overview of distribution effects,alternatives and uncertainties, since an overall assessment by politicians and others requirescomplete information. This requires that all relevant effects, also the intangible effects, aretaken into account. However, in the analysis of the costs and benefits of projects in practice, theanalysis is often narrowed to tangible monetary effects.
In such a �‘limited�’ cost benefit analysis the economic benefits of an activity are compared withthe costs of the activity. If the benefits are higher than the costs, the activity is attractive (itgenerates an increase in economic welfare). If the benefits are lower, the activity is notattractive. In flood management this means that the costs of measures for increasing the safetyagainst flooding (e.g. dike strengthening of flood proofing) are compared with the decrease inthe yearly expected economic flood damage. In the cost figure different types of costs have tobe included: costs of investment (fixed and variable) and the costs of maintenance andmanagement. As said, the benefits are represented by the reduction of the expected economicdamage.
A project or measure is attractive according to the cost benefit analysis if:
)(DEI (4.3)
where: I = investment in project / measure [$/yr]E(D) = reduction of expected economic damage [$/yr]

MRC Flood Management and Mitigation Programme Component 2: Structural Measures and Flood Proofing
Guidelines Flood Risk Assessment 101 December 2009
The reduction of the risk / expected economic damage can be calculated with:
NDEDEDE )()()( 0 (4.4)
where: E(D)0 = expected economic damage in the original situation [$/yr]E(D)N = expected economic damage after measures/ project completion [$/yr]
The expected economic damage can be determined with the approach outlined in Section 4.2.
The change in the expected damage value due to different types of measures can bedetermined according to the principles presented in Section 4.3.1.
The above approach works if both the investments and the benefits can be expressed inmonetary units for the same unit of time (e.g. $/yr). In many cases investments in flood riskreduction are one time costs, e.g. a dike construction project, whereas the benefits areexpressed per year. In that cases the benefits have to be discounted over the life time of theproject to determine the net present value of the costs and benefits. The following generalformula can be used for that:
n
tii
rCB
NPV1 )'1( (4.5)
where: NPV = net present value [$]Bi = benefits in year i [$]Ci = costs in year I [$]t = time [year]r�’ = reduced interest rate [ ]
The reduced interest rate r�’ is generally used for discounting and it equals the economic growthminus the inflation. When one assumes an infinite time horizon the discount factorapproximates 1/r�’ and the net present value of the benefits becomes E(D)/r�’.
4.4.3 Economic optimisation
A specific form of the cost benefit analysis is the economic optimisation. This approach isapplicable to determine an optimal level of protection when the investments in the protectionand the risk are dependent on the level of protection. This is for example the case for floodprone areas that are protected by dikes. In that case the decision problem becomes the choiceof the height and thus the choice for the protection level that the dikes provide.
The economic optimisation was applied to flood protection systems by the Delta Committee inthe Netherlands. This Committee investigated possibilities for new safety standards after amajor flooding caused enormous damage in the Netherlands in 1953.
According to the method of economic optimisation, the total costs in a system are determinedby the sum of the expenditure for a safer system and the expected value of the economicdamage. In this economic optimisation the incremental investments in more safety arebalanced with the reduction of the risk. The investments consist of the costs to strengthen andraise the dikes. In a simple approach it is assumed that flooding could only occur due toovertopping of the flood defences. Thereby each dike height corresponds to a certainprobability of flooding (the higher the dikes the smaller the probability of flooding) and anassociated damage. By summing the costs and the expected damage or risk, the total costs areobtained as a function of the safety level. A point can be determined where the total costs are

MRC Flood Management and Mitigation Programme Component 2: Structural Measures and Flood Proofing
Guidelines Flood Risk Assessment 102 December 2009
minimal, the so called optimum: see Figure 4.6. In the optimum the corresponding dike height isknown. Because the statistics of the water levels is also known a corresponding protection levelin terms of a probability can be defined.
The approach has been applied after the Dutch 1953 storm surge to determine an optimalsafety level for the largest flood prone area, South Holland (van Dantzig, 1956). Eventually theseresults have been used to derive safety standards for flood defences in the Netherlands. Forcoastal areas protection has been chosen with exceedance probabilities of 1/4,000 per year and1/10,000 per year. For the Dutch river areas the safety standards were set at 1/1,250 per yearand 1/2,000 per year.
High probability Small probability
Figure 4.6 Principle of economic optimization.
The economic optimisation can also be applied to other types of problems at various scales. Forexample, the optimal level of raising a house can be determined while taking into account theadditional costs of raising the building, the damage to the structure in case of flooding and theprobabilities of several water levels that would lead to flooding.
4.4.4 Risk evaluation for loss of life
The estimates of risk to life can be included in risk evaluation and decision making. It is possibleto define certain standards that indicate the acceptable level of individual or societal risk (seeSection 4.3.2 for definitions). More information on this topic is found in (Vrijling et al., 1998;Jonkman et al., 2009), but a summary of the main concepts is given below.
For individual risk a threshold level can be set to indicate the tolerable risk due to a certainactivity, for example a probability of death of 10 5 per year. If the actual calculated risk is higher(e.g. 10 4 per year) the situation is not acceptable and risk reduction measures are necessary.
For societal risk a limit can be determined by means of a limit line in the FN curve (see Figure4.7). The limit line shows that an event with larger consequences is acceptable only with asmaller probability. The calculated risk can be compared with the limit line. If the calculated riskis below the limit line the situation is acceptable. If the calculated risk is above the limit line thesituation is not acceptable and additional measures are needed.

MRC Flood Management and Mitigation Programme Component 2: Structural Measures and Flood Proofing
Guidelines Flood Risk Assessment 103 December 2009
Acceptable societal risk Probability of
exceedance (1/yr)
Fatalities 10 100 1000
10-3
10-5
10-7
Limit line
Calculated risk
Unacceptable societal risk Probability of
exceedance (1/yr)
Fatalities 10 100 1000
10-3
10-5
10-7
Limit line
Calculated risk
Figure 4.7 Societal risk and limit line.
The above concepts for limits for individual and societal risk are currently explored in theNetherlands where new safety standards are developed that are also based on risk to life.However, there are no other (known) examples of countries that use this type of safetystandard for flooding.
4.4.5 Risk matrix
A tool to evaluate the risk is the risk matrix (see below). It gives a ranking of the probability(vertical axis) and consequences (horizontal axis). Based on the magnitude of probability andconsequences a certain risk can be ranked to be acceptable (green), unacceptable (red) orsubject to further discussion on acceptability (orange). In order to categorise the consequences,different consequence types (economic damage, loss of life, environmental or social impacts)can be taken into account.
The choice of the boundaries between the categories is an arbitrary choice. The outcomes ofrisk assessment can only provide information on the level of risk and not on the acceptability.
HighMediumLow
Low Medium High
Prob
ability
Consequences
Figure 4.8 Structure of a risk matrix.

MRC Flood Management and Mitigation Programme Component 2: Structural Measures and Flood Proofing
Guidelines Flood Risk Assessment 104 December 2009
4.5 Risk assessment for the Lower Mekong Basin
4.5.1 Introduction and approach
In this section the results of the risk assessment are presented. This means that the results ofthe flood hazard analyses (Chapter 2) and damage assessments (Chapter 3) are combined. Thebenefits of flooding are not discussed in detail here, but could be relevant in an overallevaluation.
Figure 4.9 outlines the approach that was followed in the project to estimate the risk. From thetime series output of the ISIS hydraulic model (graph upper left), the probability of occurrenceof different water levels can be analysed (upper right). On the other hand the relation betweenflood level or flood depth and damage (lower left) is known. By combining the damage with theflood probability the damage probability curve can be established (lower right).
Hydrological data
4
4.5
5
5.5
6
6.5
7
7.5
8
8.5
1910
1914
1918
1922
1926
1930
1934
1938
1942
1946
1950
1954
1958
1962
1966
1970
1974
1978
1982
1986
1990
1994
1998
2002
2006
Year
Floo
d / w
ater
leve
l (m
+ M
SL)
Flood depth - Probability
1
1.5
2
2.5
3
3.5
1/10
01/
50
1/10 1/
5
1/2
Probability (-)
Floo
d / w
ater
dep
th(m
+ fi
eld
leve
l)
Damage
0
10
20
30
40
50
60
70
0 0.5 1 1.5 2 2.5 3 3.5
Flood / water depth (m + field level)
Dam
age
(% o
f hou
se v
alue
)
Risk
0
200
400
600
800
1000
1200
1400
1600
1800
2000
1/10
01/
50
1/10 1/
5
1/2
Probability (-)
Dam
age
($ /
ha)
Figure 4.9 Approach for estimation of the risk.
It is illustrated below which results were obtained with this approach for three districts inCambodia that were analysed as focal areas in the stage 1. These are the districts Koh Andet,Koh Thom and Kampong Trabek.
4.5.2 Results of risk assessment
As part of the risk assessment the floods that occurred between the years 1910 and 2006 weresimulated. The damage curves from Section 3.8 were used to estimate the damages for theseflood events. By combining these results the following probability damage curve was obtained.From the figure it can be seen that Koh Andaet has the largest damage for most return periods,especially for events with a relatively large probability of exceedance (40% 60%). The Koh Tumdistrict has the lowest overall risk curve.
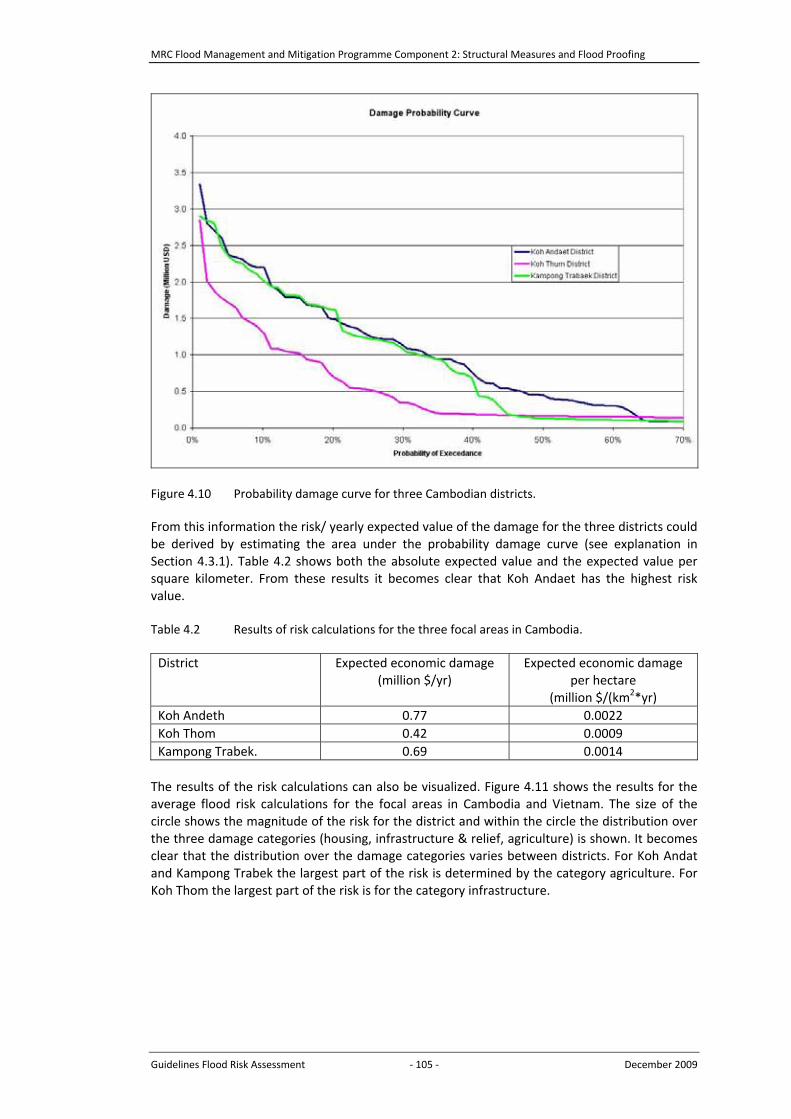
MRC Flood Management and Mitigation Programme Component 2: Structural Measures and Flood Proofing
Guidelines Flood Risk Assessment 105 December 2009
Figure 4.10 Probability damage curve for three Cambodian districts.
From this information the risk/ yearly expected value of the damage for the three districts couldbe derived by estimating the area under the probability damage curve (see explanation inSection 4.3.1). Table 4.2 shows both the absolute expected value and the expected value persquare kilometer. From these results it becomes clear that Koh Andaet has the highest riskvalue.
Table 4.2 Results of risk calculations for the three focal areas in Cambodia.
District Expected economic damage(million $/yr)
Expected economic damageper hectare
(million $/(km2*yr)Koh Andeth 0.77 0.0022Koh Thom 0.42 0.0009Kampong Trabek. 0.69 0.0014
The results of the risk calculations can also be visualized. Figure 4.11 shows the results for theaverage flood risk calculations for the focal areas in Cambodia and Vietnam. The size of thecircle shows the magnitude of the risk for the district and within the circle the distribution overthe three damage categories (housing, infrastructure & relief, agriculture) is shown. It becomesclear that the distribution over the damage categories varies between districts. For Koh Andatand Kampong Trabek the largest part of the risk is determined by the category agriculture. ForKoh Thom the largest part of the risk is for the category infrastructure.

MRC Flood Management and Mitigation Programme Component 2: Structural Measures and Flood Proofing
Guidelines Flood Risk Assessment 106 December 2009
Figure 4.11 Flood risks by district for selected areas in Cambodia and Vietnam.
The figure shows clearly that the risk values on the Vietnamese side are much higher. This is dueto the fact that the Vietnamese areas are more densely populated.

MRC Flood Management and Mitigation Programme Component 2: Structural Measures and Flood Proofing
Guidelines Flood Risk Assessment 107 December 2009
CHAPTER5REFERENCES

MRC Flood Management and Mitigation Programme Component 2: Structural Measures and Flood Proofing
Guidelines Flood Risk Assessment 108 December 2009

MRC Flood Management and Mitigation Programme Component 2: Structural Measures and Flood Proofing
Guidelines Flood Risk Assessment 109 December 2009
5 REFERENCES
Abt S.R., Wittler R.J., Taylor A., Love D.J. (1989) Human stability in a high flood hazard zone,Water Resources Bulletin Vol. 25 No.4, pp. 881 890.
Adamson, P.T. (2007). Strengthening of the Flood Management capacity for the Kok River Basinin Chiang Rai Province, Thailand. Hydrological Baseline Study. Information and KnowledgeManagement Programme, MRC, September.Ahern M., Kovats S.R., Wilkinson P., Few R., Matthies F. (2005) Global health impacts of floods:
epidemiologic evidence, Epidemiologic Reviews Vol. 27 pp. 36 46.Anonymous (2009), Development and use of DACA in de lower Mekong basin �– executivesummary.Bennet, G.(1970) Bristol Floods 1968 �– Controlled Survey of Effects on Health of Local
Community Disaster, British Medical Journal Vol. 3, pp.454 458.BTRE (2001). Economic Costs of Natural Disasters in Australia. Report 103, Bureau of Transport
and Regional Economics, Disaster Mitigation Research Working Group, Paragon Printers.Canberra: Commonwealth of Australia.
Clausen, L.K. (1989) Potential Dam Failure: Estimation of Consequences, and Implications forPlanning. Unpublished M.Phil. thesis at the School of Geography and Planning at MiddlesexPolytechnic collaborating with Binnie and Partners, Redhill.
Dutta, D., Herath S., Musiake K. (2003). A mathematical flood loss estimation, Journal ofHydrology, 277:24 �–49.FEMA (2003). HAZUS: Multi hazard loss estimation model methodology �– flood model. FederalEmergency Management Agency, Washington.Hajat S., Ebi K.L., Kovats S., Menne B., Edwards S., Haines A. (2003) The human health
consequences of flooding in Europe and the implications for public health, Journal ofApplied Environmental Science and Public Health Vol 1 No. 1 pp. 13 21.
Hosking, J.R.M. and J.R. Wallis (1997). Regional frequency analysis: an approach based on Lmoments. Cambridge University Press, Cambridge, U.K.Jonkman S.N. (2007) Loss of life estimation in flood risk assessment, Phd thesis, Delft University.Jonkman S.N., Bockarjova M., Kok M., Bernardini P. (2008) Integrated Hydrodynamic and
Economic Modelling of Flood Damage in the Netherlands, Ecological Economics 66, pp. 7790.
Jonkman S.N., Penning Rowsell E. (2008) Human instability in flood flows, Journal of theAmerican Water Resources Association (JAWRA) Vol. 44 No. 4 August 1008, pp. 1 11.
Jonkman S.N., Vrijling J.K., Kok M. (2008) Flood risk assessment in the Netherlands: A case studyfor dike ring South Holland, Risk Analysis Vol. 28, No. 5, pp.1357 1373.
Karvonen R.A., Hepojoki A., Huhta H.K., Louhio A. (2000) The use of physical models in dambreak analysis, RESCDAM Final Report, Helsinki University of Technology, Helsinki, Finland.
Karvonen R.A., Hepojoki A., Huhta H.K., Louhio A. (2000) The use of physical models in dambreak analysis, RESCDAM Final Report, Helsinki University of Technology, Helsinki, Finland.
Kelman I. (2002) Physical vulnerability of residential properties in coastal, eastern England, PhDdissertation, Cambridge University.
Kelman, I. and R. Spence (2004) An Overview of Flood Actions on Buildings. Engineering Geology73. pp. 297�–309.
Kok M., Huizinga H.J., Vrouwenvelder A.C.W.M., van den Braak W.E.W. (2005)Standaardmethode2005 schade en slachtoffers als gevolg van overstromingen, HKV reportPR999.10 draft translation is available as: Standard method for Predicting Damage andCasualties as a Result of Floods.
Leenders, J.K., Roelevink, A., Parodi, G. & J. Wagemaker (2009a). Development andDemonstration of DACA (Damage and Casualties Assessment) in the Chiang Rai Region, Lelystad:HKV Consultants and ITC.

MRC Flood Management and Mitigation Programme Component 2: Structural Measures and Flood Proofing
Guidelines Flood Risk Assessment 110 December 2009
MAFF (1999). Flood and Coastal Project Appraisal Guidance. Economic Appraisal (eds. K. Riddell& C. Green). London, UK: Ministry of Agriculture, Fisheries and Food, Flood and Coastal DefenseEmergencies Division.MAFF (2000). National Appraisal of Assets from Flooding and Coastal Erosion. HalcrowMaritime, HR Wallingford, Flood Hazard Research Centre for the Ministry of Agriculture,Fisheries and Food, Flood and Coastal Defence Emergencies Division, London, UK.Merz B., Kreibich H., Thieken A., Schmidtke R. (2004) Estimation uncertainty of direct monetary
flood damage to buildings, Natural Hazards and earth System Sciences Vol. 4, pp. 153 �– 163Messner, F., Meyer, V. (2005): Flood damage, vulnerability and risk perceptions; HKV:Implementation of DACA.Messner, F., Penning Rowsell, E., Green, C., Meyer, V., Tunstall, S., Veen, A. van der (2007).Evaluating Flood Damages: Guidance and Recommendations on Principles and Methods.FLOODsite Consortium, Wallingford, UK.Parker D.J., Green C.H., Thompson P.M.,(1987) Urban flood protection benefits �– a project
appraisal guide. Gower Technical press.Penning Rowsell, E.C., Chatterton, J.B., (1977). The benefits of flood alleviation �– a manual ofassessment techniques, Saxon House, ISBN 0566001908.Roos, W. (2003) Damage to buildings. Delft Cluster report DC1 233 9.Royal Haskoning (2008) Flood damages and flood risks in focal areas. Annex 2 to the draft stage1 evaluation report, (August 2008).Stuyt L.C.P.M., Reinders J.E.A., van der Hoek E.E., Hermans A.G.M., Muinck Keizer de M.,
Kamperveen J.P., Hoogvliet M.C., Gerritsen A.L., Hounjet M.W.A., Bontenbal M.P., HoefslootF.V.J., Icke J. (2003) Environmental impact of flooding, Delft Cluster Report DC1 233 8.
Thieken, A., Muller, M., Kreibich, H., Merz, B. (2005). Flood damage and influencing factors: newinsights from the August 2002 flood in Germany, Water Resources Research, 41:1 16.USBR (United States Bureau of Reclamation) (2001) Downstream hazard classificationguidelines. Acer Technical Memorandum no. 11.Van Dantzig D. (1956) Economic decision problems for flood prevention, Econometrica Vol. 24
pp. 276 287.Van der Veen A., Steenge A.E., Bockarjova M., Logtmeijer C.J.J. (2003) Structural economic
effects of large scale inundation: a simulation of the Krimpen breakage, Delft Cluster reportDC1 233 12.
Viessman, W., G.L. Lewis and J.W. Knapp (1989). Introduction to Hydrology. Third edition,Harper Collins Publishers.Vrijling J.K., van Gelder P.H.A.J.M. (2002) Probabilistic design in hydraulic engineering. TU Delft
lecture note WA5310.Vrijling, J.K., Hengel, W. van, Houben, R.J. (1998) Acceptable risk as a basis for design, Reliability
Engineering and System Safety Vol. 59 pp. 141 150.Watkins, L.H. and D. Fiddes (1984). Highway and urban hydrology in the tropics. Pentech PressLtd, London.

MRC Flood Management and Mitigation Programme Component 2: Structural Measures and Flood Proofing
Guidelines Flood Risk Assessment 111 December 2009
APPENDICES

MRC Flood Management and Mitigation Programme Component 2: Structural Measures and Flood Proofing
Guidelines Flood Risk Assessment 112 December 2009

MRC Flood Management and Mitigation Programme Component 2: Structural Measures and Flood Proofing
Guidelines Flood Risk Assessment 113 December 2009
APPENDIX 1 APPROACH TO FLOOD DAMAGE AND RISK ASSESSMENT IN EUROPE
In this Appendix the European Union�’s Flood Directive is presented, along with preliminarystudies and guidelines produced by EXCIMAP and FLOODsite, and the Dutch DACA approach toshow how flood damage and flood risk are handled in Europe.
In 2007 the European Parliament and the Council of the European Union promulgated Directive2007/60/EC9 on the assessment and management of flood risks. This directive compels the 27member states of the European union to (preliminarily) assess their flood risks (by 2011),prepare flood hazard and flood risks maps (by 2013), and to prepare flood risk managementplans (by 2015).
The Flood Directive introduces a number of key principles, which could be relevant andapplicable also for other regions or river basins: Member States shall, for each river basin or the portion of an international river sub basin
lying within their territory, undertake a preliminary flood risk assessment in accordancewith an assessment of the potential adverse consequences of future floods for humanhealth, the environment, cultural heritage and economic activity, taking into account as faras possible issues such as the topography, the position of watercourses and their generalhydrological and geo morphological characteristics, including floodplains as naturalretention areas, the effectiveness of existing manmade flood defence infrastructures, theposition of populated areas, areas of economic activity and long term developmentsincluding impacts of climate change on the occurrence of floods.
In the case of an international river basin or sub basin which is shared with other MemberStates, Member States shall ensure that exchange of relevant information takes placebetween the competent authorities concerned.
Flood risk management plans shall take into account relevant aspects such as costs andbenefits, flood extent and flood conveyance routes and areas which have the potential toretain flood water, such as natural floodplains, environmental objectives, soil and watermanagement, spatial planning, land use, nature conservation, navigation and portinfrastructure.
Flood risk management plans shall address all aspects of flood risk management focusingon prevention, protection, preparedness, including flood forecasts and early warningsystems and taking into account the characteristics of the particular river basin or subbasin.
Flood risk management plans may also include the promotion of sustainable land usepractices, improvement of water retention as well as the controlled flooding of certainareas in the case of a flood event.
In the interests of solidarity, flood risk management plans established in one Member Stateshall not include measures which, by their extent and impact, significantly increase floodrisks upstream or downstream of other countries in the same river basin or sub basin,unless these measures have been coordinated and an agreed solution has been foundamong the Member States concerned.
Member States shall make available to the public the preliminary flood risk assessment,the flood hazard maps, the flood risk maps and the flood risk management plans.
Member States shall encourage active involvement of interested parties in the production,review and updating of the flood risk management plans.
9 http://eur lex.europa.eu/LexUriServ/LexUriServ.do?uri=CELEX:32007L0060:EN:NOT

MRC Flood Management and Mitigation Programme Component 2: Structural Measures and Flood Proofing
Guidelines Flood Risk Assessment 114 December 2009
EXCIMAP
In order to carry out the tasks set by this directive, a large number of European countriesorganised themselves into the European Exchange Circle on Flood Mapping EXCIMAP. In 2007they produced the Handbook on Good Practice for Flood Mapping in Europe10, which focuses onthe first steps required by the Directive.
Flood maps are to indicate the geographical areas which could be covered by flood waters fromall natural sources at several levels of probability. The effect of floods is always the same: waterand or sediments in unwanted places outside the normal water course. The Guidelinedistinguishes between: (i) river flooding in flood plains, (ii) sea water flooding, (iii) mountaintorrent activity or rapid run off from hills, (vi) flash floods in Mediterranean ephemeral watercourses (wadi�’s), (v) groundwater flooding, (vi) lake flooding.
Flood maps can show flood extent according to: (i) probability classes, (ii) historic events, (iii)flood depth, (iv) flow velocity, (v) flood propagation, and (vi) degree of danger. These maps canbe used for: (i) land use planning and management, (ii) water shed management, (iii) hazardassessment, (iv) emergency planning and management, (v) planning of technical measures, and(vi) overall awareness building.
For flood risk management, flood maps are useful tools in answering questions such as: (i)where is the greatest risk? (ii) where should investments be targeted? (iii) which investmentsmay have the highest cost effectiveness?
Flood hazard maps
Flood hazard maps need to be prepared for low, medium and high probabilities of occurrence.For each probability the extent, inundation depth or water level, and where appropriate thewater velocity should be indicated. These maps are to be prepared using hydraulic models,statistical analysis and observations.
Flood danger maps indicate a degree of danger by combining information on probability level,flood depth, velocity and debris content. These maps are not required by the Flood Directive,but are used in some member countries for land use planning.
Flood event maps record historical flooding and can be seen as a first approach to flood hazardmaps. The can be used in awareness raining, for follow up of flood hazard assessment, for thecalibration of models, and an emergency management and planning tool.
Flood vulnerability maps
Flood vulnerability maps show the assets at risk: (i) population, (ii) assets and economic activity,and (iii) potentially affected installations causing pollution. For the Netherlands such maps havebeen prepared on a provincial level and are available for the public and specialised services11.
10 http://ec.europa.eu/environment/water/flood_risk/flood_atlas/index.htm11 www.risicokaart.nl

MRC Flood Management and Mitigation Programme Component 2: Structural Measures and Flood Proofing
Guidelines Flood Risk Assessment 115 December 2009
Flood risk maps
The EU Flood Directive defines �‘flood risk�’ as the combination of the probability of a flood eventand of the potential adverse consequences for human health, the environment, culturalheritage and economic activity associated with a flood event.
These maps should therefore indicate: (i) the number of inhabitants potentially affected, (ii) thetype of economic activity potentially affected, (iii) installations which might create incidentalpollution, and (iv) other information such as high content of transported sediments and debrisand other significant sources of pollution.
Risk may be calculated as:
Risk = C * Phwhere: C = potential adverse consequence and Ph the probability of the
hazardous process.
This way, risk is expressed as a potential loss in a particular area or unit area (ha) within a giventime period (one year):
C = V * S * Ewhere: V, S and E are vulnerability parameters:
V = value of element at risk (in monetary terms or human life)S = susceptibility: damage effect on element at risk (as a function of
magnitude of hazard; e.g. depth damage and damage duration curves(factor ranging from 0 to 1)
E = exposure: the probability of the element at risk to be present while theevent occurs (factor ranging from 0 to 1)
FLOODsite12 is a research oriented project supporting the member states in complying with therequirements stipulated in the EU Flood Directive and runs from 2004 09. FLOODsite covers thephysical, environmental, ecological and socio economic aspects of floods from rivers, estuariesand the sea. It considers flood risk as a combination of hazard sources, pathways and theconsequences of flooding on the �“receptors�” �– people, property and the environment. TheFLOODsite consortium includes 37 of Europe�’s leading institutes and universities and the projectinvolves managers, researchers and practitioners from a range of government, commercial andresearch organisations, specialising in aspects of flood risk management. FLOODsite research isbeing integrated through decision support technologies, uncertainty estimation and pilotapplications for river, estuary and coastal sites in Belgium, the Czech Republic, France,Germany, Hungary, Italy, the Netherlands, Spain, and the UK.
FLOODsite has prepared a discussion paper13 reviewing the flood damage evaluation methodsapplied in the UK, the Netherlands, the Czech Republic and selected German States. Based onthis review, a guideline for flood damage evaluation has been prepared14. The final outcome ofthe project will include modelling tools and a �“flood knowledge map�”, in which persons,organisations and pilot projects can be located.
12 www.floodsite.net13 Meyer, V.(2005): National flood damage evaluation methods14 Messner, F. et al. (2007): Evaluating flood damages: guidance and recommendations on principlesand methods
MRC Flood Management and Mitigation Programme Component 2: Structural Measures and Flood Proofing
Guidelines Flood Risk Assessment 116 December 2009
Dutch Damage and Casualties Assessment Tool15
Traditionally flood defence planning focused on safety standards, such as dike design levels orreservoir volumes required to ensure predefined protection levels for population and economy.Protection of the community against floods with a frequency of once in 1,250 years and more isa good example, as is the case with the flood protection law of the Netherlands. However, thisapproach neglects the amount of valuables protected by a defence system and, hence,disregards the efficiency of flood protection measures. While economic costs of alternativeflood defence options are usually considered in the decision making process, the benefits offlood protection in the form of prevented damages should be taken into account too.
The new paradigm for flood risk management includes the economic analysis of costs andbenefits of flood protection and mitigation measures. Here, not only the safety of a defencesystem and its associated costs are considered, but also the damages to be expected in case ofits failure. As a consequence of the application of cost benefit and risk analysis, safety standardscould better be adjusted to the specific circumstances, because it could turn out that the costsof ensuring an overall safety standard considerably exceed the benefits in some areas.
Usually there are two integral parts in the state of the art ex ante estimation of flood damages.Firstly, the flood hazard needs to be determined by means of exposure indicators, using floodparameters like expected inundation area and depth, velocity and flood duration. Secondly, theexpected damage needs to be estimated. For this all valuable property located within theendangered area, i.e. the damage potential, needs to be quantified. The expected damage isthen calculated by using depth damage functions showing the total damage of the properties(buildings, cars, roads, etc) or its relatively damaged share as a function of inundation depth.
Depending on whether the functions relate to the absolute damage or the damage share, theyare called absolute or relative depth damage functions. Over the past decades a variety ofmethods for the ex ante estimation of flood damages emerged. According to their scale andgoal, these methods can be roughly divided into three categories: macro , meso and microscale analyses. Macro scale analyses consider areas of inter/national and should providedecision support for national flood mitigation policies. Meso scale analyses deal with researchareas of regional scale, i.e. river basins or coastal areas. Here, the planning level refers to largescale flood mitigation strategies. The aim of micro scale analyses is the assessment of singleflood protection measures on a local level.
In the Netherlands a standard method for flood damage and casualties assessment has beendeveloped and used since 1999 (HIS SSM). It is used to assess the change of risk followingnational and regional decisions on water management measures in the Netherlands. Moreover,from 2007 onwards all Dutch water projects of national importance must be evaluated usingthis tool. It is also used in the production of the Dutch flood vulnerability maps mentioned inSection 3.7.
The Damage and Casualties Assessment Tool (DACA) is a GIS based application in which landuse, inundation depth damage functions per land use and maximum damage values of eachland use are combined with a model generated flood hazard. This is in line with the �‘bottom upapproach�’ or �‘relative approach�’ described in Section 3.3.4.
In parallel with the FMMP C2 project, HKV Consultants carried out a pilot project with the ThaiDirectorate of Water Resources to test the applicability of the DACA approach in Thailand.
15 Based on: Messner, F. and Meyer, V. (2005)

MRC Flood Management and Mitigation Programme Component 2: Structural Measures and Flood Proofing
Guidelines Flood Risk Assessment 117 December 2009
APPENDIX 2 APPROACHES FOR THE ASSESSMENT OF STRUCTURAL DAMAGE TOBUILDINGS
An important source of economic damage is the structural damage to buildings. Figure 5.1shows how economic damage is connected to structural damage. The level of structural damagecaused by the flood will be determined by the flood actions (or loads) and the buildingresistance (or strength) (Kelman and Spence 2004). The degree of structural damage dependson the intensity and magnitude of the flood actions, i.e. hydrostatic and hydrodynamic forces,and on the building�’s resistance to flooding. The next step is the economic valuation of thephysical damages. To convert the structural damage to economic estimates insight in thebuilding�’s pre disaster market value and the replacement cost is required. Apart from damageto the structure, the damage estimation in monetary terms will also include damage to theinventory of the structure.
In the earlier presented damage functions the economic damage estimate is directly related tothe flood characteristics. However, for some applications it could be relevant to have insight inthe degree of structural damage. The level of structural damage is also important for humansafety and loss of life as buildings are important shelters during flood events.
Figure 5.1 Scheme of structural flood damage analysis.
Especially flow velocity is an important factor for building damages as it determines thehydrodynamics loads. Several models have been developed that relate the physical damage tohouses to the combination of flood depth and flow velocity. As an example Figure 5.2 presentsthe damage criterion from brick and masonry houses (Clausen, 1989). In combination with inputfrom flood simulations, such criteria can be used to develop flood risk maps that exhibitdifferent levels of expected damage. Other researchers have investigated building vulnerability.Kelman (2002) and Kelman and Spence (2004) investigated physical vulnerability of residentialproperties in coastal areas and added the influence of rise rate. Roos (2003) developed acomprehensive probabilistic model for collapse of buildings, which takes into account twofailure modes that can lead to partial or full collapse of a building. These are 1) the scour offoundations and 2) the failure of walls. The model of Roos considers hydrostatic andhydrodynamic loads, as well as the impacts of waves and pounding debris. Also the strength(resistance) of the building type is considered. A general weakness of these �‘collapse ofbuildings�’ models concerns their limited practical validation. Most of the presentedrelationships are based on theory or scale model tests.

MRC Flood Management and Mitigation Programme Component 2: Structural Measures and Flood Proofing
Guidelines Flood Risk Assessment 118 December 2009
Figure 5.2 Damage criterion for brick and masonry houses proposed by Clausen, figure from(Karvonen et al., 2000).
In general the advantage of the above approach is that the actual flood conditions (depth,velocity) are taken into account. A related disadvantage is that a lot of detailed (GIS) data isneeded to relate the local flood conditions to the vulnerability of an individual building.
The degree of damage will also be highly dependent on the type of structure that is affected.For example wooden houses will have a different damage pattern than concrete or brickhouses. Measures and construction techniques, e.g. building houses on poles, will also affectthe degree of structural damage. Therefore it is not recommended to directly transfer existingmodels and relations for structural damage to other regions and housing types without adetailed assessment of building types and their vulnerability.

MRC Flood Management and Mitigation Programme Component 2: Structural Measures and Flood Proofing
Guidelines Flood Risk Assessment 119 December 2009
APPENDIX 3 FUNDAMENTAL ISSUES IN ECONOMIC EVALUATION
There exist different rationales of the evaluation. Financial evaluations look at damage from aperspective of a single person or firm, neglecting public affairs and focusing on the actualfinancial burden that individual or firm has to pay for. Economic evaluations have a broaderperspective and want to assess the impact on national or regional welfare, including impacts onintangible goods and services. This broader economic perspective is the appropriate one toapply if calculations of flood damage are to be designed for supporting public policy decisions.
Several principles of economic evaluation need to be considered in order to conduct acomprehensive flood damage evaluation study in a consistent way. The most importantprinciples as regards the economic evaluation of flood damage are specified in the followingsections. The application of the principles of economic evaluation is crucial for an appropriateexamination of flood damage, and the use of their results in flood risk analysis. Therefore, It isessential to follow these principles as closely as practicable.
Economic point of views
Economic aspects of flood damage evaluation and analysis require a determination of flooddamages to the national economy. There is no matter of who would pay for the damages andwho would receive the benefits (if any) as result from the flood.
The analyst has to point out the flood damages in a view point of the society as a whole. Toreflect a view point of the society, the economic and/or shadow prices of good and servicesopportunity cost are used in estimating flood damages and benefits. Thus, anything thatreduces national income is a damage and anything that increases national income is a benefit.
In an economic damage study, depreciated values should be applied in order to reflect the valueof a good at the time when it is damaged by a flood. Using replacement cost is anoverestimation of damage from a broader economic perspective, because replacement usuallyinvolves improvements: old houses/goods which are damaged during a flood are usuallysubstituted by new, more productive and better performing ones.
Apply economic prices for evaluation of damages
The economic evaluation of goods and services which are traded in the market is a task that isrelatively easy to accomplish. However, according to economic theory several rules need to beconsidered to identify the �”correct�“ value. As stated in most economic textbooks, the value of amarket good corresponds to its scarcity price. And a scarcity price emerges in the context of anideal competitive market with many competing actors involved and without governmentintervention. Since these ideal conditions are never fulfilled in a real world market, adjustmentsare necessary in order to calculate the ideal �“shadow price�“ of the good under examination.This means, real world market prices must be translated into shadow prices by excluding all kindof transfer payments like taxes and subsidies and by converting monopolistic market prices intocompetitive market prices.
Time value of money
To simplify the idea, we take the following example: if we have $100 today and lend it tosomeone or put it in a bank, we expect to be paid interest for the use of the money (say 10%per year). It means that from $100 today we will get $110 in one year later or in another words,the value of $100 today worth $110 next year.
In economic analysis the economist compares value of money at a different time instead of theamount of money. To do this the economist uses discounting technique for converting value of

MRC Flood Management and Mitigation Programme Component 2: Structural Measures and Flood Proofing
Guidelines Flood Risk Assessment 120 December 2009
money to a specific time/date . There are some key converting factors often used in economicanalysis as presented bellow:
Compounding factorThe factor is used to determine future value (FV) of a present amount (PV) at the end of nth
period at the interest rate of i:
FV = PV (1 + i)n
Compounding factor for 1 per annumIt is used to calculate the future accumulated value (FV) at the end of nth period at an interestrate of i with a sequence of equal payments (A).
(1 + i)n 1FV = A
i
Capital recovery factorIt is used to calculate the amount of each payment (A) at the end of each n period to recoverthe present amount (PV) with the interest rate of i:
i (1 + i)n
A = PV(1 + i)n 1
Net Present Value (NPV)Net Present Value is the present worth of the incomes stream generated by an investment. Itcan be calculated by:
NPV =n
tt
tt
iCB
1 )1()(
where: B = benefit; C: cost of investment and annual costT = time from year 1 to year n; and i: discount rate
Constant price
Flood damage evaluation is carried out in a specific year (say 2007) but the cost and damageswere pricing at the time it occurred (say 2000, 2001, etc.). It is therefore economist has toconvert nominal damage value to constant/fixed value at the time doing the analysis bydeflating the current pricing value of damage in the past years.
Constant or fixed price refers to a value from which the overall effect of a general price inflationhas been removed. Where current prices are adjusted for general inflation, it is assumed thatinflation will affect the prices of the inputs and outputs at same extent, such that prices retainthe same general relationship to each other. Using constant prices ensures that the past andfuture costs and benefits of the identified alternatives are estimated in the same units as thecosts and benefits measured at the time of evaluation for decision.

MRC Flood Management and Mitigation Programme Component 2: Structural Measures and Flood Proofing
Guidelines Flood Risk Assessment 121 December 2009
APPENDIX 4 ANALYSIS OF HUMAN INSTABILITY IN FLOOD FLOWS
For smaller scale floods where velocities are more important, loss of stability (i.e. toppling) forpeople in flood flows can be an important reason of death. Criteria have been developed toassess this. These can be used to assess the flood risks at a local level. Different series ofexperiments have been undertaken (Abt et al., 1989; Karvonen et al., 2000). For the availabletest data Figure 5.3 shows the combinations of depth and velocity that resulted in instability.Overall it shows that people lose stability in flows with limited depth velocity products. Theobtained critical depth velocity products range from 0.6 m2/s to about 2 m2/s. The differencesin the reported test results can be related to test circumstances (bottom friction, testconfiguration) or personal characteristics (weight, length, clothing). Further backgroundinformation regarding human instability is given in (Jonkman and Penning Rowsell, 2008).
0
0,5
1
1,5
2
0 1 2 3 4
flow velocity (m/s)
wat
er d
epth
(m) data Abt et al.
data Rescdamhv=1,35m2/shv=0,6m2/shv=2m2/s
Figure 5.3 Observations from experimental series regarding the combination of water depthand flow velocity that resulted in instability.
Based on such tests criteria have been developed that show different levels of danger as afunction of water depth and flow velocity. An example of such a criterion is shown in Figure 5.4.A distinction is made between three zones with different levels of danger. The above criteriacan be used to determine risk zones for certain flood conditions.
Figure 5.4 Criteria for danger to people in flood flows (USBR, 2001).

MRC Flood Management and Mitigation Programme Component 2: Structural Measures and Flood Proofing
Guidelines Flood Risk Assessment 122 December 2009
Finally, indirect flooding effects (e.g. on local food supply) and longer term health impacts (e.g.diseases) can also contribute to loss of life. However, there are no quantitative approaches todirectly estimate the effects of these processes on the loss of life. It is expected that theprocesses will be dependent on the area that is affected and the social and economicalconditions.

MRC Flood Management and Mitigation Programme Component 2: Structural Measures and Flood Proofing
Guidelines Flood Risk Assessment 123 December 2009
APPENDIX 5 THE BEST PRACTICE GUIDELINES AND PROJECT PHASES/ STAGES
In order to manage an engineering project properly, it is normally divided in project phases.Common is a division in the following five phases:
1. Initiation2. Planning/ Development/ Design3. Production/ Execution4. Monitoring/ Control5. Closure
A project starts with an idea to solve or mitigate a problem, create a product or structure etc. Inthe initiation phase finances are mobilised, a project team is formed, the equipment and toolsare acquired, and the idea is given its first shape. The second phase is the planning/development/ design phase. The feasibility of the idea is tested, and, if successful, a project planis elaborated and the design is made. In Phase 3 the plans and designs are implemented, i.e. theproduction takes place, the project is being executed. Monitoring during execution may revealthe necessity to correct the planning and/or design, and make adjustments in the execution.After completion of the works the project will be closed, i.e. the team will break up, theaccounts will be closed, and the product or result may be handed over to a client.
Figure 5.5 The phases of an engineering project.
The Best Practise Guidelines are almost exclusively applicable to Phase 2: Planning/Development/ Design. This phase can be subdivided in various stages: see the list below. Thenumber and content of the stages may differ, depending mainly on project type or countryspecific preferences. The preliminary design stage for example is in engineering projects oftenincluded in the feasibility study.
a) Preliminary/ prefeasibility studyb) Feasibility study & overall planningc) Preliminary designd) Detailed design & detailed planninge) Construction/ bid documents
Each section of the guidelines applies to one or more of the above stages. In the guidelines thiswill be indicated by displaying the above symbols in the page margin.
Initiation Planning/ Development/
Design
Production/ Execution
Monitoring/ Control Closure

MRC Flood Management and Mitigation Programme Component 2: Structural Measures and Flood Proofing
Guidelines Flood Risk Assessment 124 December 2009
The five stages of Phase 2 contain the following:
a) Preliminary/ prefeasibility study
A prefeasibility study is the precursor to a feasibility and design study. Its main purposeis to decide whether it is worthwhile to proceed to the feasibility study stage and toensure there is a sound basis for undertaking a feasibility study.
A prefeasibility study generally includes: Definition of achievable project outcomes; Analysis of the development situation and constraints the project is to address, based on
collected data; Identification of related (government and other stakeholders) policies, programs and
activities; Preliminary assessment of the viability of alternative approaches; Preliminary identification of likely risks to feasibility and benefits (including risks to
sustainability).
b) Feasibility study & overall planning
If a project is considered to be feasible based on the prefeasibility study, a morethorough feasibility study can start. A feasibility study defines the project and itsobjectives in detail, and look at various forms of feasibility:
Technical feasibility: Can the measures technically be realised in local context? Operational feasibility: Will the implemented measures be manageable by the local
people? Economic feasibility: Is the cost benefit analysis positive? Social feasibility: Are the objectives and measures socially acceptable? Environmental feasibility: Are the environmental impacts acceptable? Political feasibility: Will the measures be supported by the politicians? Overall feasibility: Will implementation of the envisaged measures result in
accomplishment of the project objectives?
Field surveys, hydrological and hydraulic analyses (in flood mitigation projects), social andenvironmental assessments, stakeholder meetings, costs estimates etc. are the basis foranswering the above questions. If the answers are positive, the operations/ managementstructure and management method will be defined, and any initial planning will be detailed.
c) Preliminary design
If a project is deemed feasible, the preliminary design stage can start. This stagefocuses on the technical measures and includes the following:
Site surveys and investigations and computer modeling provide the data for preliminarydesign criteria;
The design criteria are translated into the preliminary design of structures and measures inan integrated and balanced system in which the envisaged management activities aregeared to one another;
A review of the cost benefit analysis (construction and operation) and analysis ofenvironmental, social and political factors still show the viability of the project.
If necessary, the project planning will be adjusted based on new insights gained in this stage.
MRC Flood Management and Mitigation Programme Component 2: Structural Measures and Flood Proofing
Guidelines Flood Risk Assessment 125 December 2009
d) Detailed design & detailed planning
During the final design stage the detailed architectural and engineering drawings(the blueprints) of all physical components of the project are produced. Virtuallyall design problems must have been resolved before the end of the final designstage. Sufficient detail must be provided by the drawings and the report to allow reasonablyaccurate estimates of construction and operating costs, as well as the construction scheduling.
e) Construction documents/ bid documents
The detailed designs and construction scheduling are incorporated in constructiondocuments and bid specifications, giving the contractors the information theyneed for construction.
If sections of the guidelines refer to other than the above described phases (e.g.the construction or monitoring phase), the following symbol will be used:

MRC Flood Management and Mitigation Programme Component 2: Structural Measures and Flood Proofing
Guidelines Flood Risk Assessment 126 December 2009

MRC Flood Management and Mitigation Programme Component 2: Structural Measures and Flood Proofing
Guidelines Flood Risk Assessment 127 December 2009
APPENDIX 6 FLOW CHART TO CREATE FLOOD MAPS WITH A GIS
METHODOLOGY TO CREATE FLOOD MAPS WITH ARCGIS BASED ON ISIS HYDROLOGICAL MODELING RESULTSLegend:
Notes: This diagram assumes the creation of separate layers for Cambodia and Viet Nam.
To create water level or water depth maps on the basis of output of the hydrological model (ISIS), the full diagram needs to be followed.Is the ISIS node information already transferred to the GIS and are the water levels already included in the Access tabel (.mdb; see A-7), than only the lower grey section needs to be followed for mapping of a different level/ depth.
If the ISIS schematisation changes, the whole diagram has to be followed again.For water levels not yet included in Access, both grey areas need to be redone.
B-13
C-1
C-3
ISIS node names (ID's) and coordinates of
reservoir and cross-section nodes
(.csv)
ISIS node names (ID's) and water levels
(e.g. for return periods or scenarios)
(.csv)
ISIS polylines of river cross-sections
(.shp)
ISIS polygons of reservoirs
(.shp)
Import and cleanin Excel and transfer to
Access
Import and cleanin Excel and transfer to
Access
ISIS node names (ID's), type,
coordinates, location and w.l.'s in one table
(.mdb)
Combine in e.g. Access using queries
Add to ArcGIS project and clean
Add to ArcGIS project and clean
Import in ArcGIS, georeference and save in
shape-format (.shp)
Split in Reservoir and (River) Cross-section
points layers for Camb. & Vietn.
ISIS reservoir nodes (names, location and
w.l.'s) of Camb.(.shp)
ISIS cross-section nodes (names,
location and w.l.'s) of Camb.(.shp)
ISIS reservoir nodes (names, location and
w.l.'s) of Viet Nam(.shp)
Base data originating from
ISIS or MRC
Derived or created data by
FMMP-C2
Performed action on data
Draw 150 m buffer polygons around
polylines
Assign data of nodewithin polygon to polygon
('spatial join'); remove poly-gons with >1 node inside
Assign data of nodewithin buffer to buffer ('spatial join'); remove buffers with >1
node inside
Import and process in e.g. MatLab ('return
period' data)
Assign data of bufferto cross-section polylines;
remove polylines without node data
ISIS cross-section polylines in Viet Nam
with node ID and water levels(.shp)
ISIS cross-section polylines in Camb. with
node ID and water levels(.shp)
Convert polylines to points (e.g. 15 points/
polyline)
Convert polygons to points (e.g. 15 points /
polygon)
Put all points (original nodes + derived points)
in one layer
ISIS nodes, polyline points (and polygon points) in Viet Nam
with node ID and w.l.'s(.shp)
ISIS nodes, polyline points (and polygon
points) in Camb. with node ID and w.l.'s
(.shp)
Convert polygons to rasters using required
water level value
Create raster of requiredw.l. by interpolation (cell size as DTM); check ISIS whether
to use all points
Rectangular area (raster) containing
focal area in Camb. with w.l.'s
(.adf)
Rectangular area (raster) containing
focal area in Viet Nam with w.l.'s
(.adf)
Superimpose reservoir raster on point-based
raster (using 'con')
Remove the raster outside the focal areas
('mask')
Files/ processes to be updated when new w.l.-values become available (whole scheme when ISIS configuration changes)
DTM: 50m or 100m cells, vert. accuracy ±
0.5 m (?)(.adf)
Subtract DTM from focal area rasters
A-1
A-2
B-4
B-3
B-2B-1
A-7
A-6
A-5
A-4
A-3
B-5B-7
B-6B-8
(B-11)
(B-12) (B-10) (B-9)
B-15
B-17
(B-16)
C-7
C-5
B-14C-4
C-6
C-2
C-13
C-10
C-8Focal area (raster) in
Camb. with w.l.'s(.adf)
Focal area (raster) in Viet Nam with w.l.'s
(.adf)
C-9
Focal area (raster) in Camb. with water
depths(.adf)
Focal area (raster) in Viet Nam with water
depths(.adf)
ISIS reservoir polygons in Camb. with
node ID and water levels(.shp)
ISIS reservoir polygons in Viet Nam with node
ID and water levels(.shp)
C-11
C-12
Section CCreation of
flooding maps
Section BCreation of
spatial data set
Section ATransfer of ISIS water levelsinto 'georeferenceable' table
ISIS reservoirs (raster) in Viet Nam with w.l.'s
(.adf)
ISIS reservoirs (raster) in Camb. with w.l.'s
(.adf)
Mask of focal area in Camb.(.shp)
Mask of focal area in Viet Nam
(.shp)
ISIS cross-section nodes (names,
location and w.l.'s) of Viet Nam
(.shp)
A-5: step(B-11): optional step, depending on base data set