the mediterranean diet and its components and the … · 4.1.1 dietary pattern analysis and...
TRANSCRIPT

| i
The Mediterranean Diet and its Components and the Risk of Heart
Failure in the European Prospective Investigation into Cancer and
Nutrition (EPIC)-Potsdam Study – A Top-Down Approach
vorgelegt von
Diplom-Oecotrophologin,
Master of Food Science,
Master of Science in Epidemiology,
Janine Wirth
geb. in Warendorf
von der Fakultät VII – Wirtschaft und Management
der Technischen Universität Berlin
zur Erlangung des akademischen Grades
Doktorin der Gesundheitswissenschaften / Public Health
– Dr. P.H. –
Genehmigte Dissertation
Promotionsausschuss:
Vorsitzende: Prof. Dr. Jacqueline Müller-Nordhorn Gutachterin: PD Dr. Cornelia Weikert Gutachter: Prof. Dr. Reinhard Busse Gutachter: Prof. Dr. Heiner Boeing
Tag der wissenschaftlichen Aussprache: 27.02.2015
Berlin 2015

| ii
CONTENTS
ACKNOWLEDGEMENT ............................................................................................................ v
INDEX OF TABLES, FIGURES AND ABBREVIATIONS .................................................................. vi
ABSTRACT ............................................................................................................................ x
ZUSAMMENFASSUNG ........................................................................................................... xiii
1. INTRODUCTION
1.1 Scope and Structure of the Thesis ........................................................................ 1
1.2 Heart Failure ......................................................................................................... 2
1.2.1 Definition and Classification ........................................................................... 2
1.2.2 Epidemiology and Pathophysiology ............................................................... 4
1.2.3 Diagnosis and Treatment ............................................................................... 6
1.3 Exposure Nutrition................................................................................................. 8
1.3.1 From Single Nutrients to Food Pattern Analysis ............................................ 8
1.3.2 The Scientific Evidence on Nutrition and Heart Failure ................................. 9
1.3.3 The Mediterranean Diet ............................................................................... 14
1.4 Objectives ........................................................................................................... 19
2. MATERIAL AND METHODS
2.1 Material ............................................................................................................... 20
2.1.1 Study Design and Population....................................................................... 20
2.1.2 Exposure and Covariate Assessment .......................................................... 21
2.1.3 Outcome Ascertainment .............................................................................. 23
2.2 Methods .............................................................................................................. 25
2.2.1 The Top-Down Approach ............................................................................. 25
2.2.2 Statistical Analyses ...................................................................................... 25

| iii
3. RESULTS
3.1 Characteristics of the Study Participants ............................................................ 31
3.1.1 Characteristics According to Heart Failure Status ....................................... 31
3.1.2 Baseline Characteristics According to the Mediterranean Diet .................... 32
3.2 The Mediterranean Diet, its Components and the Risk of Heart Failure ............. 39
3.2.1 Dietary Pattern Analysis............................................................................... 39
3.2.2 Analysis of Food Groups and Subgroups .................................................... 43
3.2.3 Analyses of Macro- and Micronutrients ........................................................ 52
4. DISCUSSION
4.1 Interpretation of Results ...................................................................................... 61
4.1.1 Dietary Pattern Analysis and Selection of Relevant Components ............... 61
4.1.2 Analysis of Food Groups and Subgroups .................................................... 62
4.1.3 Analysis of Macro- and Micronutrients ......................................................... 65
4.2 Critical Appraisal of Methods .............................................................................. 67
4.3 Limitations and Strengths.................................................................................... 71
4.3.1 Limitations .................................................................................................... 71
4.3.2 Strengths ..................................................................................................... 73
4.4 Conclusions ........................................................................................................ 73
REFERENCES ...................................................................................................................... 75
INDEX OF APPENDICES ....................................................................................................... xvii
EIDESSTATTLICHE ERKLÄRUNG ............................................................................................. xl

| iv
“The head is round so that thought can change its direction”
Francis Picabia (1824-1912)

Acknowledgement | v
ACKNOWLEDGEMENT
I would like to take the opportunity to express my gratitude to those who contributed to this
work by their great support:
First, I thank my supervisors PD Dr. Weikert, Prof. Dr. Boeing and Prof. Dr. Busse for their
kind support:
A special thank goes to Cornelia Weikert, who gave me the opportunity to work on this
project and inspired me again and again with resourceful input.
Thank you, Heiner Boeing, for the critical and always helpful discussions.
Last but not least, thank you Mr. Busse for the possibility to receive the doctorate at the
Technical University in Berlin and your kind and adjuvant support.
Many thanks appertain to my mother, from whom I inherited the ambition that has brought
me as far as I have come until now.
Thanks also to my father who supported me, whenever it was needed.
Thanks to my sister Melanie, who every now and then served as my medical specialist,
and furthermore came up with exciting entertainment actions to bring me back down to
earth.
Many thanks to my brother, who showed me alternative ways and, therefore, quite plainly
the importance of the path I chose finally.
Furthermore, I am indebted to Romina (‘mia cara’), who critically evaluated this work and
made the fundament for a great working atmosphere: Thank you!
Not to forget, many thanks to my colleagues and friends, especially Silke, who has always
arranged necessary distraction from work and has, since long, been more than just a
colleague.
Anna, Anne and Angelika: Many thanks to you for the critical review and proofreading of
this work and for always being there for me.
Thank you very much indeed!

Index of Tables, Figures and Abbreviations | vi
INDEX OF TABLES, FIGURES AND ABBREVIATIONS
Tables
Table 1: Symptoms and Signs Typical of Heart Failure (ESC Guidelines 2012, p 811)1 2
Table 2: NYHA Classification of Heart Failure Severity (Source: ESC-Guidelines 2012,
p 810)1 .............................................................................................................. 4
Table 3: Summary of Prospective, Population-based Cohort Studies on Nutrients and
Heart Failure Risk ........................................................................................... 10
Table 4: Summary of Prospective, Population-based Cohort Studies on Fish Intake and
Heart Failure Risk ........................................................................................... 12
Table 5: Summary of Prospective, Population-based Cohort Studies on Different Food
Groups and Heart Failure Risk ....................................................................... 13
Table 6: The Characteristics of the Traditional and the Alternate Mediterranean Diet
Score ............................................................................................................... 17
Table 7: Median Dietary Intakes* (by sex) of Mediterranean Diet Score Components
Comparing EPIC-Potsdam and EPIC-Greece ................................................ 22
Table 8: General Baseline Characteristics of Study Participants (n=24,008) According
to their Heart Failure Status at Follow-up ....................................................... 31
Table 9: Clinical Characteristics of Heart Failure Cases in EPIC-Potsdam According to
Definite, Probable and Possible Heart Failure ................................................ 32
Table 10: Daily Consumption of Components of the Traditional Mediterranean Diet
Score and its Food Groups and Subgroups among Men and Women
(n=24,008) ...................................................................................................... 34
Table 11: Daily Consumption of Components of the Traditional Mediterranean Diet
Score and its Subgroups and Main Sources among Men and Women
(n=24,008) ...................................................................................................... 36
Table 12: Daily Intake of Score Components across the Traditional Mediterranean Diet
Score using Greek Cut-points ......................................................................... 37
Table 13: Baseline Characteristics of Study Participants (n= 24,008) According to
Achieved Points in the Traditional Mediterranean Diet Score ......................... 38
Table 14: Association between the Adherence to the Mediterranean Diet and the Risk of
Heart Failure ................................................................................................... 39
Table 15: Association between the Adherence to Individual Traditional Mediterranean
Diet Score Components and the Risk of Heart Failure ................................... 40
Table 16: Age- and Sex-adjusted Intakes of Selected Food Groups and Nutrients
according to Quintiles of Total Meat Consumption ......................................... 43
Table 17: Associations between the Consumption of Total Meat and Different Meat
sources and the Risk of Heart Failure ............................................................. 44
Table 18: Hazard Ratios per Portion Sizes of Different Meat Sources ........................... 45

Index of Tables, Figures and Abbreviations | vii
Table 19: Association between Intakes of Wine and Beer and the Risk of Heart Failure in
Men ................................................................................................................. 48
Table 20: Association between Intakes of Wine and Beer and the Risk of Heart Failure in
Women ............................................................................................................ 49
Table 21: Age- and Sex-adjusted Baseline Characteristics according to Quintiles of Fish
Consumption ................................................................................................... 50
Table 22: Association between Fish Intake and the Risk of Heart Failure ...................... 51
Table 23: Crude and Partial Spearman Correlation Coefficients for Nutrients from Meat
and from the Whole Diet ................................................................................. 52
Table 24: Relationship between the Intakes of Total Fat and Overall and Meat-Specific
Saturated Fatty Acids and the Risk of Heart Failure ....................................... 54
Table 25: Relationship between Cholesterol Intake and the Risk of Heart Failure ......... 56
Table 26: Relationship between Animal Protein Intake and the Risk of Heart Failure .... 57
Table 27: Relationship between Iron Intake and the Risk of Heart Failure ..................... 58
Table 28: Crude and Partial Spearman Correlation Coefficients for Omega-3 Fatty Acids
and Fish .......................................................................................................... 59
Table 29: Association between Intakes of Total Omega 3 Fatty Acids and Omega 3 Fatty
Acids from Fish and Other Sources and the Risk of Heart Failure ................. 60
Figures
Figure 1: Schematic Illustration of the Different Levels of Nutrition ................................. 8
Figure 2: Results from a Meta-analysis on Alcohol Consumption and the Risk of Heart
Failure ............................................................................................................. 11
Figure 3: The Mediterranean Diet Pyramid (Source: Supreme Scientific Health Council
1999, p 519)62 ................................................................................................. 15
Figure 4: Flow Chart of the Validation Procedure for Heart Failure Classification,
according to Diagnostic Evidence (Source: Wirth 201398, p. 28) ................... 24
Figure 5: Graph of Exposure-Disease Associations ...................................................... 26
Figure 6: Directed Acyclic Graph (DAG 1) for the Association between the
Mediterranean Diet and Heart Failure ............................................................. 27
Figure 7: Directed Acyclic Graph (DAG 2) for the Association between the
Mediterranean Diet and Heart Failure ............................................................. 28
Figure 8: Panel Chart of the Scoring Distribution among Participants who did and did
not Develop Incident Heart Failure during Follow-up ...................................... 33
Figure 9: Graphs of Fish Consumption and Ethanol Intake and Heart Failure Risk
Derived by Restricted Cubic Spline Cox Regression Analysis ....................... 41

Index of Tables, Figures and Abbreviations | viii
Figure 10: Hazard Ratios and 95% Confidence Intervals for a Two Unit Increment in
Mediterranean Diet Score (tMED) and after Subtracting each of its
Components .................................................................................................... 42
Figure 11: Association between Total Meat Intake and the Risk of Heart Failure and after
Subtracting each of the Meat Subgroups ........................................................ 46
Figure 12: Percentage of Total Ethanol Intake by Alcoholic Beverages in EPIC-Potsdam
........................................................................................................................ 47
Figure 13: Main Contributing Food Sources to Total Intakes of Saturated Fatty Acids,
Cholesterol, Iron and Animal Protein in EPIC-Potsdam .................................. 53
Figure 14: Main Contributing Food Sources to Total Marine Omega-3 Fatty Acids in
EPIC-Potsdam ................................................................................................ 59
Abbreviations
ACC/AHA American College of Cardiology / American Heart Association
ACE Angiotensin Converting Enzyme
aMED Alternate Mediterranean diet score
ARIC Atherosclerosis Risk in Communities Study
BMI Body mass index
CHD Coronary heart disease
CHS Cardiovascular Health Study
CI Confidence interval
CSM Cohort of Swedish Men
CVD Cardiovascular disease
DAG Directed acyclic graph
DASH Dietary Approaches to Stop Hypertension
DHA Docosahexaenoic acid
ECG Electrocardiography
EPA Eicosapentaenoic acid
EPIC European Prospective Investigation into Cancer and Nutrition
ESC European Society of Cardiology
FFQ Food frequency questionnaire
FUP Follow-up time
HF Heart failure
HF-PEF Heart failure with preserved ejection fraction

Index of Tables, Figures and Abbreviations | ix
HF-REF Heart failure with reduced ejection fraction
HR Hazard ratio
ICD-10 International Classification of Disease, tenth version
IQR Interquartile range
JACC Japan Collaborative Cohort
KI Konfidenzintervall
LVSD Left ventricular systolic dysfunction
MUFA Monounsaturated fatty acid
n.s. not significant
n3FA omega-3 fatty acids
NHANES National Health and Nutrition Examination Survey
NYHA New York Heart Association
PAR Population attributable risk
PHS Physicians' Health Study
pnonlin p value for nonlinearity
PREDIMED PREvención con DIeta MEDiterránea
ptrend p value for linear trend
PUFA Polyunsaturated fatty acids
RR Relative risk
RS Rotterdam Study
SD Standard deviation
SFA Saturated fatty acid
SMC Swedish Mammography Cohort
tMED traditional Mediterranean diet score / traditioneller Mediterrane Ernährungs-
Score
WHI Women’s Health Initiative

Abstract | x
ABSTRACT
Background and Aims
Heart failure is a complex syndrome with growing burden to public health. In spite of
improved therapeutic opportunities, heart failure is still the third leading cause of death in
Germany and linked to high hospitalization rates, treatment costs and impaired quality of
life.
Cardio-protective effects of the Mediterranean diet have been well documented: inverse
associations have been reported between adherence to the diet and several
cardiovascular outcomes. The Mediterranean diet is characterised by a high intake of
fruits and vegetables, cereals, fish and legumes. On the other side, the proportion of
saturated fats is usually low due to a frequent use of olive oil in salads and dishes and low
consumption of meat. Another typical component of the diet is the moderate consumption
of alcohol, mainly in form of wine, during meals. The use of scores to assess adherence to
the Mediterranean diet and the building of scores is widely used in observational studies.
Despite its great potential in heart failure prevention, the Mediterranean diet has yet not
been investigated in relation to heart failure development in prospective studies based on
the general population.
Therefore, the aim of the present thesis was to examine the association between the
Mediterranean dietary pattern and the risk of heart failure. By analyzing different levels of
nutrition (i.e. dietary pattern, food groups, nutrients), components should be identified that
influenced most strongly the overall effect of this dietary pattern and could provide more
insights into possible underlying mechanisms.
Methods
The study was carried out in 9,225 men and 14,783 women of the European Prospective
Investigation into Cancer and Nutrition (EPIC)-Potsdam study who were free of coronary
heart disease at baseline. To assess the adherence to the Mediterranean diet, the revised
traditional Mediterranean diet score (tMED) was generated using Greek median intakes
as cut-points. By means of a top-down approach the diet-disease association was
investigated systematically, starting with the examination of the relationship between
tMED categories and the risk of heart failure up to selected relevant components of the
score (food groups) to the most representative nutrients of these components. Cox
proportional hazards regression analysis was performed to calculate hazard ratios (HRs)
and 95% confidence intervals (95%CIs) of heart failure according to the adherence to the
Mediterranean-style diet. Three methods were used to assess the relevance of the score

Abstract | xi
components: 1. Calculation of HRs of heart failure for continuous intakes of the food
groups covered by tMED components using restricted cubic spline Cox regression
analyses, 2. computing HRs of heart failure according to tMED components on a
dichotomous scale (receiving one point versus zero point), and 3. calculating the relative
changes in the HRs per two units increase of tMED before and after exclusion of each of
the score components. Relevant components were then disaggregated into its
constituents (i.e.: food subgroups, and main representative macro-and micronutrients),
and the relationship with the risk of developing heart failure was further investigated on
these lower levels of nutrition.
Results
After a mean follow-up period of 8.2 years, 209 heart failure cases occurred. Adherence to
the Mediterranean diet was generally low (mean score points: 3.5). An inverse relationship
between the adherence to the Mediterranean diet and the risk of heart failure was
observed. After multivariable adjustment, individuals who received five or more score
points had a 37% decreased risk compared to participants who were assigned a score of
zero to two points. However, this association narrowly missed the significance level
(ptrend=0.06).
Further analysis revealed that not every tMED component contributed to the heart failure
risk reduction of the overall score. Three components were identified as being the most
influencing factors for the overall inverse association, namely high fatty fish intake,
moderate alcohol consumption, and low consumption of meat and meat products,
especially processed meat. High meat consumption was associated with a 2.5-fold
increased risk of heart failure relative to low consumption after adjustment for age, sex,
education, physical activity, smoking, and intakes of the remaining score components. In
contrast, moderate alcohol consumption was associated with a 33% (95% CI: 11%-49%)
lower risk of heart failure compared to low or high intakes. Intake of canned fish (mainly
comprising fatty fish) was also inversely associated with heart failure risk (HR (95% CI) for
the highest versus the lowest quintile of intake: 0.59 (0.36-0.96).
Analyses on nutrient level indicated that in particular fat quality might explain these
findings: cholesterol and especially saturated fat intakes were positively associated with
heart failure risk, whereas the intake of marine omega-3 fatty acids was inversely
associated.

Abstract | xii
Conclusion
The results of the present thesis indicate that the adherence to a Mediterranean-style
dietary pattern may reduce the risk of developing heart failure. Of the nine components
that were used in the tMED, only three played a major role for heart failure risk. These
were: low intakes of meat and meat products, moderate consumption of alcohol and a
high intake of fish. Saturated fat and cholesterol seem most likely to be responsible for the
risk-increasing effect of meat consumption, while the containing omega-3 fatty acids might
explain the protective effect of fatty fish intake.
The results indicate that even a moderate change of dietary habits might have strong
impact on heart health, when primarily the three identified factors are involved.
Responsible and moderate alcohol consumption (in particular of wine), increasing the
intake of fatty fish and lowering consumption of meat products in the diet are, furthermore,
messages easy to communicate by public health policies. However, the consumption of
alcohol should not be recommended to abstainers only for the suspected health benefits.
Furthermore, the use of a score to assess the Mediterranean diet in this non-
Mediterranean population was a challenging task, as types of foods (especially the fat
sources), preparation, and the amount of consumption differ to a great extend from those
in Mediterranean countries. It was demonstrated that there is a persistent need to improve
application of these scores in non-Mediterranean countries. One suggestion to increase
the validity of a Mediterranean diet score might be to modify certain components. This
could be achieved e.g. by a replacement of the fat-ratio component with intakes of
saturated fatty acids. A second modification might be the weighting of score components
according to the importance to the effect on health outcomes.
Further studies are warranted to replicate and validate the findings observed in this thesis.

Zusammenfassung | xiii
ZUSAMMENFASSUNG
Hintergrund und Ziele
Herzinsuffizienz ist ein komplexes Syndrom das eine zunehmende Belastung für die
öffentliche Gesundheit darstellt. Ungeachtet der verbesserten therapeutischen
Möglichkeiten ist Herzinsuffizienz weiterhin die dritthäufigste Todesursache in
Deutschland und mit einer hohen Krankenhausaufenthaltsrate, teuren Behandlungskosten
und einer starken Beeinträchtigung der Lebensqualität verbunden.
Kardio-protektive Effekte der mediterranen Ernährung wurden bereits vielfach
beschrieben: von inversen Assoziationen zwischen der Einhaltung dieser Ernährung und
diversen kardiovaskulären Ereignissen wurden berichtet. Die Mediterrane Kost zeichnet
sich durch eine hohe Aufnahme von Obst und Gemüse, Getreide, Fisch und
Hülsenfrüchte aus. Auf der anderen Seite ist der Anteil der gesättigten Fette in der Regel
gering aufgrund der häufigen Verwendung von Olivenöl in Salaten und anderen Gerichten
und des geringen Verzehrs von Fleisch. Ein weiterer typischer Bestandteil der Ernährung
ist der moderate Konsum von Alkohol, hauptsächlich in Form von Wein, während der
Mahlzeiten. Zur Bewertung der Einhaltung eines mediterranen Ernährungsmusters ist die
Verwendung von Scores in Beobachtungsstudien weit verbreitet.
Trotz des großen Potenzials für die Herzinsuffizienz-Prävention wurde die Mediterrane
Ernährung noch nicht in prospektiven, auf der Allgemeinbevölkerung basierenden,
Studien bezüglich ihre Assoziation zur Herzinsuffizienz-Entwicklung untersucht.
Das Ziel der vorliegenden Studie war es daher, den Zusammenhang zwischen dem
Mediterranen Ernährungsmuster und dem Risiko von Herzinsuffizienz zu erforschen.
Durch die Analyse verschiedener Ebenen der Ernährung (d.h. Ernährungsmuster,
Lebensmittelgruppen und Nährstoffe) sollten Komponenten identifiziert werden, die den
Gesamteffekt dieses Ernährungsmusters am stärksten beeinflussen und mehr Einblicke in
mögliche zugrundeliegende Mechanismen liefern.

Zusammenfassung | xiv
Methoden
Die Studie wurde mit 9.225 Männern und 14.783 Frauen der European Prospective
Investigation into Cancer and Nutrition (EPIC)-Potsdam-Studie durchgeführt, bei denen zu
Studienbeginn keine koronare Herzkrankheit vorlag. Um das Einhalten der Mediterranen
Ernährung zu beurteilen, wurde der erweiterte traditionelle Mediterrane Ernährungs-Score
(tMED) unter Verwendung griechischer Grenzwerte (mediane Aufnahmemenge) erzeugt.
Durch einen Top-down-Ansatz wurde die Ernährungs-Erkrankungs-Beziehung
systematisch untersucht, beginnend mit der Analyse der Assoziation zwischen tMED-
Kategorien und dem Risiko von Herzinsuffizienz, über ausgewählte relevante
Komponenten des Scores (Lebensmittelgruppen) bis hin zu den repräsentativsten
Nährstoffe dieser Komponenten. Eine Cox-Regressionsanalyse wurde durchgeführt, um
Hazard Ratios (HRs) und 95% Konfidenzintervalle (95% KI) für Herzinsuffizienz zu
berechnen. Drei Methoden wurden angewendet, um die Relevanz der Score-
Komponenten zu beurteilen: 1. Die Berechnung der HRs der Herzinsuffizienz für
kontinuierliche Aufnahmen der Lebensmittelgruppen jeder Komponente durch „Restricted
cubic spline“ Cox-Regressionen, 2. mittels Errechnen der HRs von Herzinsuffizienz nach
tMED-Komponenten auf dichotomer Skalierung (Erreichen eines Punktes im Vergleich zu
keinem) und 3. Durch die Berechnung der relativen Veränderung der HRs pro zwei tMED-
Einheiten vor und nach Ausschluss jeder Score-Komponente. Die so ausgewählten
Komponenten wurden dann in ihre Bestandteile zerlegt (d.h. Lebensmittelgruppen und
repräsentative Makro- und Mikronährstoffe) und die Risiko-Beziehung zur Herzinsuffizienz
wurde weiter auf diesen tieferen Ebenen der Ernährung untersucht.
Ergebnisse
Nach einer mittleren Nachbeobachtungszeit von 8,2 Jahren traten 209 Fälle von
Herzinsuffizienz auf. Im Allgemeinen war die Einhaltung des Mediterranen
Ernährungsmusters eher gering (durchschnittlicher Score: 3,5 Punkte). Eine inverse
Beziehung zwischen den erreichten Punkten im tMED und dem Risiko einer
Herzinsuffizienz wurde beobachtet. Nach multivariabler Adjustierung wiesen Personen,
die fünf oder mehr Punkte erhalten hatten, ein um 37% geringeres Herzinsuffizienz-Risiko
auf als Teilnehmer denen null bis zwei Punkte vergeben wurden. Doch diese Assoziation
verfehlte knapp das Signifikanzniveau (ptrend = 0,06).
Eine weitere Analyse ergab, dass nicht jede der tMED-Komponenten zu der
Herzinsuffizienz-Risikoreduktion des Scores beigetragen hat. Drei Komponenten wurden
als die wichtigsten Einflussfaktoren für die insgesamt inverse Assoziation identifiziert,
nämlich eine hohe Aufnahme von Fettfisch, moderater Alkoholkonsum, sowie ein geringer
Konsum von Fleisch und Fleischprodukten, insbesondere verarbeitetem Fleisch. Nach

Zusammenfassung | xv
Adjustierung für Alter, Geschlecht, Bildung, körperlicher Aktivität, Rauchverhalten und der
Aufnahme der übrigen Score-Komponenten war ein hoher Fleischkonsum verglichen zu
geringem Konsum mit einem 2,5-fach erhöhten Risiko für Herzinsuffizienz verbunden. Im
Gegensatz dazu wurde moderater Alkoholkonsum mit einem um 33% (95% KI: 49% -
11%) niedrigeren Risiko für Herzinsuffizienz in Verbindung gebracht im Vergleich zu
niedrigem oder hohem Konsum. Der Verzehr von Fischkonserven (hauptsächlich aus
fettem Fisch bestehend) stand ebenfalls in einem inversen Zusammenhang mit dem
Herzinsuffizienz-Risiko (HR (95% KI) für das höchste gegenüber dem niedrigsten Quintil
der Aufnahme: 0,59 (0,36-0,96)).
Die Untersuchungen auf Nährstoff-Ebene deuteten darauf hin, dass besonders die
Fettqualität diese Ergebnisse erklären könnte: die Aufnahmen von Cholesterin und vor
allem gesättigten Fettsäuren zeigten eine positive Assoziation zum Herzinsuffizienzrisiko,
während marine Omega-3-Fettsäuren invers mit dem Herzinsuffizienzrisiko assoziiert
waren.
Schlussfolgerungen
Die Ergebnisse der vorliegenden Analyse zeigen, dass die Einhaltung eines Mediterranen
Ernährungsmusters das Risiko der Entwicklung einer Herzinsuffizienz reduzieren kann.
Von den neun Komponenten, die in dem tMED verwendet wurden, spielten nur drei eine
wichtige Rolle für das Herzinsuffizienz-Risiko. Diese waren: eine geringe Aufnahme von
Fleisch und Fleischprodukten, mäßiger Alkoholkonsum und eine hoher Verzehr von Fisch.
Gesättigte Fettsäuren und Cholesterin scheinen höchstwahrscheinlich für die risiko-
steigernde Wirkung von Fleischkonsum verantwortlich zu sein, während die enthaltenden
Omega-3-Fettsäuren die Schutzwirkung durch Fischkonsum erklären könnten.
Die Ergebnisse weisen darauf hin, dass bereits eine moderate Änderung der Ernährungs-
gewohnheiten einen starken Einfluss auf die Gesundheit des Herzens haben könnte,
wenn in erster Linie die drei identifizierten Faktoren beteiligt sind. Ein
verantwortungsvoller und moderater Alkoholkonsum, eine hohe Aufnahme von fettem
Fisch und ein geringer Verzehr von Fleischprodukten in der Ernährung sind darüber
hinaus einfach von der öffentlichen Gesundheitspolitik zu kommunizierende Botschaften.
Jedoch sollte davon abgesehen werden Abstinenzlern den Konsum von Alkohol nur
wegen des vermuteten gesundheitlichen Nutzens zu empfehlen.
Des Weiteren war die Verwendung eines Scores zur Beurteilung der Mediterranen
Ernährung in dieser nicht-Mediterranen Bevölkerung eine anspruchsvolle Aufgabe, da
sich Lebensmittelsorten (vor allem die Fettquellen), die Zubereitung sowie die
Verzehrsmengen stark von denen in Mittelmeerländern unterscheiden. Dennoch wurde

Zusammenfassung | xvi
Die vorliegende Arbeit demonstrierte die immer noch bestehende Notwendigkeit die
Anwendbarkeit dieser Scores in Nicht-Mittelmeerländern zu verbessern. Ein Vorschlag zur
Steigerung der Validität ist die Veränderung bestimmter Komponenten. Dies könnte
beispielsweise durch den Austausch der Fettverhältnis-Komponente mit der Aufnahme
von gesättigten Fettsäuren erreicht werden. Eine zweite Modifikation könnte die
Gewichtung der Score-Komponenten nach ihrer Bedeutung für die gesundheitlichen
Folgen darstellen.
Weitere Studien sind erforderlich, um die in dieser Arbeit beobachteten Ergebnisse und
Schlussfolgerungen zu validieren und zu bekräftigen.

Introduction | 1
1. INTRODUCTION
1.1 Scope and Structure of the Thesis
There is growing evidence that nutrition might be a critical factor in the prognosis and
treatment of heart failure (HF). Compared to other cardiovascular diseases (CVD),
examinations about the influence of nutritional intakes and the risk of HF are still scarce
and often based on limited data. An investigation of nutrition and its impact on HF, which
is based on latest data, can contribute important insights to prevention and health
promotion.
In advance, some research work has taken place to search for an a priori dietary pattern
that might be associated to HF risk. For this purpose, the existing literature has been
scrutinized for investigations that examined the association between diet (on different
nutritional levels) and HF risk. The Mediterranean diet was identified as a dietary pattern
with great preventive potential, as it is part of several guidelines and recommendations for
primary and secondary prevention of CVD endpoints. Further literature review revealed
several Mediterranean diet scores to assess this type of diet in observational studies.
Despite its great potential in HF prevention, the Mediterranean diet and its association to
HF risk has not yet been studied in a population of apparently healthy adults.
Thus, the present doctoral thesis deals with the primary research question whether the
adherence to a Mediterranean-style diet, and/or the intakes of individual components of
this diet, are associated with the risk of developing HF. This work was carried out at the
German Institute of Human Nutrition in the Department of Epidemiology, Research Group
of Cardiovascular Epidemiology. Data from the European Prospective Investigation into
Cancer and Nutrition (EPIC)-Potsdam – a prospective cohort study in Eastern Germany -
were used to answer the research question. It was hypothesized that greater adherence
to the diet is inversely associated to the risk of HF and that the contribution of dietary
elements to the overall effect might differ assuming higher importance of particularly high
fish intake.
The present thesis is structured as follows: In the current Chapter 1, an introduction in the
disease HF and nutrition as an exposure is following. In the latter part, a special focus lies
on the Mediterranean diet regarding its characteristics, the estimation of adherence and
its potential for heart health. After that, the applied methods and materials are described in
Chapter 2, followed by the presentation of results according to the three levels of nutrition
(Chapter 3). The thesis concludes with a detailed discussion in Chapter 4.

Introduction | 2
1.2 Heart Failure
In the following chapter the disease HF is introduced starting with commonly used
definitions and classifications, a short overview about epidemiologic and pathophysiologic
characteristics up to a brief summary of current diagnostic and treatment opportunities.
1.2.1 Definition and Classification
HF is “(…) an abnormality of cardiac structure or function leading to failure of the heart to
deliver oxygen at a rate to commensurate with the requirements of the metabolizing
tissues, despite normal filling pressures (or only at the expense of increased filling
pressures).” (McMurray 2012, p. 808)1 This makes HF a complex clinical syndrome that
combines various symptoms and signs (Table 1) and may occur in different entities.
Table 1: Symptoms and Signs Typical of Heart Failure (ESC Guidelines 2012, p 811)1
SYMPTOMS SIGNS
Typical More specific
Breathlessness Elevated jugular venous pressure
Orthopnea Hepatojugular reflux
Paroxysmal nocturnal dyspnea Third heart sound (gallop rhythm)
Reduced exercise tolerance Laterally displaced apical impulse
Fatigue, tiredness, increased time
to recover after exercise
Cardiac murmur
Ankle swelling
Less typical Less specific
Nocturnal cough Peripheral edema (ankle, sacral, scrotal)
Wheezing Pulmonary crepitations
Weight gain (>2 kg/week)
Reduced air entry and dullness to percussion at lung
bases (pleural effusion)
Weight loss (in advanced heart failure) Tachycardia
Bloated feeling Irregular pulse
Loss of appetite Tachypnea (>16 breaths/min)
Confusion (especially in the elderly) Hepatomegaly
Depression Ascites
Palpitations Tissue wasting (cachexia)
Syncope
Abbreviation: ESC, European Society of Cardiology

Introduction | 3
Several attempts have been made to define HF satisfactory. Since 1995 the European
Society of Cardiology (ESC) publishes Guidelines for the diagnosis and treatment of heart
failure approximately every four years to provide an overview of symptoms, signs and
diagnostic procedures of HF to practitioners. According to the ESC Guidelines from 20052
two criteria should be fulfilled to define HF:
1. presence of typical HF symptoms and
2. objective evidence of cardiac dysfunction
There are some other common - more medically focused - criteria3 and in the meanwhile
the ESC criteria have been extended.1 However, to conform to the relevant time frame of
the investigation and the specific study population of the present work, only the above
mentioned definition is considered relevant.
Furthermore, HF can be distinguished by function (diastolic versus systolic), location (left
versus right), and disease progression (chronic versus acute). The most commonly used
HF terminologies are summarized as follows.
Definition of Heart Failure by Functional Cardiovascular Abnormalities
Systolic and diastolic HF are commonly used terms to distinguish the disease by its
functional condition. In systolic HF (also referred to HF with reduced ejection fraction (HF-
REF)) a left-ventricular systolic dysfunction (LVSD) is present - an impairment of the heart
to pump adequate amounts of blood through the circulation during systole.4 LVSD is
indicated by an ejection fraction of <35-40%. In contrast, diastolic HF is characterized by
maintained LVS function and therefore generally termed as HF with preserved ejection
fraction (henceforth HF-PEF).5 In this case, a normal end-diastolic volume of the left
ventricle can be achieved only at the expense of an increased filling pressure. Diastolic
and systolic dysfunctions are not necessarily mutually exclusive; therefore the
classification by ejection fraction might be more appropriate.4 It is assumed that
approximately half of all HF patients suffer from diastolic HF.4
Definition of Heart Failure by Severity
In contrast to acute HF, which requires emergency hospital treatment and is usually
caused by pulmonary edema with life-threatening breathlessness, HF is generally a
chronic condition commonly indicated by shortness of breath and fatigue on exertion.5 For
chronic HF different stages of severity are described that are most commonly measured
using the New York Heart Association (NYHA) scale (Table 2).1, 4

Introduction | 4
Table 2: NYHA Classification of Heart Failure Severity (Source: ESC-Guidelines 2012, p 810)1
NYHA CLASS DESCRIPTION
Class I No limitation of physical activity. Ordinary physical activity does not cause undue
breathlessness, fatigue, or palpitation
Class II Slight limitation of physical activity. Comfortable at rest, but ordinary physical
activity results in undue breathlessness, fatigue and palpitations.
Class III Marked limitation of physical activity. Comfortable at rest, but less than ordinary
physical activity results in undue breathlessness, fatigue and palpitations
Class IV Unable to carry on any physical activity without discomfort. Symptoms at rest
can be present. If any physical activity is undertaken, discomfort is increased
Abbreviations: ESC, European Society of Cardiology; NYHA, New York Heart Association
According to NYHA, HF is separated into four classes starting with asymptomatic
conditions up to HF with symptoms even at rest.
Another classification by stages of disease progression is given by the American College
of Cardiology / American Heart Association (ACC / AHA).6 It also includes stages prior to
the onset of HF and therefore aims at primary prevention measures (Appendix I).
However, this classification is not used in the present work and, therefore, not explained
further.
Differentiation of HF by its location is not recommended and thus also not be considered
in the present work.4
1.2.2 Epidemiology and Pathophysiology
Occurrence of Heart Failure
The overall prevalence of HF is 1-2% in Western societies but it increases considerably
with age reaching about 10% in the age of 70-80 years.1, 5 In Germany, about 1.8 million
people are affected with approximately 300,000 new cases annually. Data about the
occurrence of HF are scarce. In the USA, lifetime risk of developing HF is estimated at
20% and is similar in men and women above 40 years.7
Nevertheless, little is known about the temporal course of prevalence and incidence rates,
except from some investigations that indicate a stagnation of incidence while prevalence
is rising.8, 9 This development may be attributed to improved therapeutic opportunities and
survival probabilities. Nevertheless, hospitalization is still frequent and cost-intensive,10, 11
e.g. the disease-specific mean costs of patients with atrial fibrillation are 3,274 ± 5,134
Euro, of which a large proportion is attributed to HF therapy.12

Introduction | 5
In spite of increasing therapeutic opportunities (pharmacological and non-
pharmacological), the prognosis of HF remains poor. Patients still have shorter life
expectancies (5-years survival after HF diagnosis: ~50%) with death mainly due to
cardiovascular causes, especially sudden cardiac death (~43% of deaths) and
progressive HF (~32% of deaths).3, 5 In Germany, HF is subsequent to chronic ischemic
heart disease and acute myocardial infarction the most common cause of death, with
nearly 50,000 deaths per years.13 Since high mortality is still a major problem in HF
patients various survival scores have been generated to assess individual risk and need
for treatment: e.g. the Heart Failure Survival Score14, or scores introduced by Bouvy et al.
15, Lee et al. 16, Kearney et al. 17, and Levy et al..18
Risk Factors for Heart Failure
Risk factors for HF include coronary heart disease (CHD, meaning myocardial infarction
and angina pectoris), hypertension, cardiomyopathies, arrhythmias, pericardial and valve
disease, intoxication (e.g. by alcohol abuse) and infection.1, 5, 19 In Western populations
CHD is the predominant cause of HF, about one third of patients developing HF within
seven to eight years after myocardial infarction.5 More than 60% of HF cases are
attributed to prevalent CHD in the USA (population attributable risk (PAR): 61.6%, relative
risk and 95% confidence interval (RR (95%CI)): 8.1 (6.95-9.46).20 Therefore, risk factors
for cardiovascular diseases are similarly relevant for HF development. Results from the
U.S. National Health and Nutrition Examination Survey (NHANES) showed that smoking
(PAR: 17.1%, RR: 1.59 (1.39-1.83), hypertension (PAR: 10.1%, RR: 1.40 (1.24-1.59),
overweight (PAR: 8.0%, RR: 1.30 (1.12-1.52), diabetes (PAR: 3.1%, RR: 1.85 (1.51-2.28),
low education (PAR: 8.9%, RR: 1.22 (1.04-1.42) and low physical activity (PAR: 9.2%,
RR: 1.23 (1.09-1.38) all are associated with higher risk of HF.20 However, results from the
Framingham Heart Study suggest a greater impact of hypertension, rather than of
myocardial infarction, due to a higher prevalence, especially in women (PAR of
hypertension: 39% for men and 59% for women; PAR of myocardial infarction: 34% for
men, 13% for women). A possible explanation might be the older study population of the
Framingham Heart Study compared to NHANES. However, it is generally difficult to
determine the impact of individual risk factors in the development of HF, since most of
them coexist.
Despite the growing evidence about the role of diet in the context of HF development,
data are still inconclusive. An overview of the scientific evidence on this topic is presented
in Chapter 1.3.2.

Introduction | 6
Disease Development, Progression and Compensatory Mechanisms
The development of HF can take many pathways. The most common one in developed
countries is via CHD. If the heart suffers a myocardial infarction, parts of the muscle may
be irreparably damaged resulting in decreased pumping capacity. The impaired heart
function is compensated by increased heart rate and blood pressure to preserve cardiac
output. Chronically, these mechanisms promote further dysfunction and failure. Release of
cytokines and growth factors activates fibrosis and hypertrophy as well as apoptosis and
necrosis. A vicious circle ensues. 4, 21
HF due to hypertension frequently leads to LV hypertrophy which preserves contractile
function and is therefore often the underlying cause of HF-PEF, but progressed LV
hypertrophy also results in systolic dysfunction.4 Yet, maintenance of contractile function
necessitates an increase in pulmonary venous pressure, which results in pulmonary
edema along with typical HF symptoms such as breathlessness.
Valve diseases may be a primary and a secondary (consequence of other factors, e.g.
prior myocardial infarction) cause of HF. Often it is triggered by chronic inflammation
followed by calcification of the valve. Generally, HF due to valve disease progresses
slowly and may be asymptomatic in early stages. Furthermore, valve diseases are rare
and the impact on HF development is not considered very high (PAR: 2.2%, RR: 1.46
(1.17-1.82)).20
Another pathway is possible via cardiomyopathies due to, or along with, arrhythmia. Atrial
fibrillation might be the most important arrhythmia in this context that induces reduced
cardiac output when untreated. However, it is difficult to disentangle whether arrhythmias
are the cause or the consequence of HF. Conversely, dilated cardiomyopathies may also
be induced by alcohol abuse (>90g/d).4
1.2.3 Diagnosis and Treatment
Apparently, symptoms and signs of HF (Table 1) are often non-specific and to
discriminate HF and other disorders (e.g. lung diseases) purely on the basis of symptoms
is rather impossible. Therefore, the diagnosis of HF often requires a combination of
several tests. Certain diagnostic procedures are available to identify HF signs. Some of
these procedures are presented as follows. Furthermore, a brief overview of HF treatment
is given.

Introduction | 7
General Diagnostic Procedures in Heart Failure
Echocardiogram is a non-invasive method for cardiac imaging and considered as gold
standard in HF diagnosis, since it is applicable for the evaluation of both systolic and
diastolic dysfunction.
Another useful diagnostic device is the electrocardiography (ECG) provides detailed
information on underlying prevalent CHD and any type of arrhythmia, which may be
related to HF.
Chest x-ray can additionally be applied to detect edema in HF as well as ventricular
hypertrophy and cardiomegaly. However, it is most commonly used to identify alternative
explanations for the patients’ symptoms and signs and, therefore, to exclude HF.22
Lastly, cardiac catheterization is a valuable measure to gain information about filling
pressure, vascular resistance and cardiac output. However, the use in clinical practice is
limited due to its invasive nature. Generally, it is applied more frequently prior to cardiac
transplantation than in routine diagnosis of HF.1, 22
The diagnosis of HF is generally classified according to the disease classification of the
World Health Organization, the International Classification of Disease, tenth version (ICD-
10). Based on this, it is distinguished between congestive HF (I50.0), left ventricular failure
(I50.1), and unspecified HF (I50.9).23
Treatment of Heart Failure
The pharmacological treatment of HF aims essentially at relieving symptoms and
improving quality of life. Typically this includes the prevention of tachycardia, the
normalization of blood pressure and treatment of congestion, edema and LV hypertrophy.
The main agents of pharmacological therapy in HF are, thus, antihypertensive drugs (e.g.
angiotensin converting enzyme (ACE) inhibitors or beta blockers) and diuretics (e.g. loop
diuretics and thiazides).
Beside the pharmacological therapy, devices may help where drugs fail, especially in case
of arrhythmias. By implantation of cardioverter-defibrillators the risk of sudden death is
strongly declined. Other surgical procedures include bypasses, valve surgeries and in
end-stage HF heart transplantation, to name a few. Invasive therapies are often a
consequence of CHD, resistant disease symptoms and severity and always rely on
individual case decisions.1, 21, 22, 24

Introduction | 8
1.3 Exposure Nutrition
The following chapter provides a brief introduction to nutrition and gives an overview of
the current scientific knowledge about the impact of nutrition on the risk of HF. Special
emphasis is given to the Mediterranean diet, which is presented in Chapter 1.3.3.
1.3.1 From Single Nutrients to Food Pattern Analysis
In the field of nutritional epidemiology, it is generally distinguished between three levels of
dietary exposures: the level of nutrients, food groups and dietary patterns. Further
subgroups can be defined, as depicted in Figure 1.
While analyses based on single nutrients or food groups are easy to implement and
communicate, this approach carries several limitations. Nutrients reflect only a small part
of the diet and interactive or synergistic effects between nutrients or food groups are often
not adequately taken into account. Single components might highly correlate or interact
with each other. With the development of dietary patterns the entire diet is considered and
the problem of multicollinearity is taken into account. Nowadays, different methods to
generate food patterns are implemented, e.g. factor analysis, cluster analysis or
scores/indices. While factor- and cluster analyses are a posteriori methods based on the
data observed, the use of scores is usually an a priori approach and based upon dietary
recommendations.25
Figure 1: Schematic Illustration of the Different Levels of Nutrition

Introduction | 9
As demonstrated in Figure 1, dietary patterns are covering a large proportion of the entire
diet. They consist of food groups that comprise one or more food items. The level of food
items is the level at which diet is normally assessed in observational studies, often by
means of food frequency questionnaires (FFQs).
Contrary to micronutrients (like vitamins and minerals), macronutrients are usually defined
as nutrients that supply energy: fat, protein, carbohydrates and alcohol.26 In the present
work, fiber (subgroup of carbohydrates) and cholesterol (subgroup of lipids) are counted
as macronutrients (see Appendix II). Although nutrients are embedded in food groups and
items, they cross to a certain extent all dimensions of nutrition as outlined in Figure 1.
1.3.2 The Scientific Evidence on Nutrition and Heart Failure
In the last decades, clinical studies have shown that diet plays an important role in the
treatment and prognosis of HF. In this context, investigations were initially performed at
the level of nutrients investigating malnutrition and resulting nutrient deficiencies. The
family of B vitamins, but also vitamin D, iron, selenium, and zinc have been examined in
this context.27 28 29 Also the harmful effect of salt and sodium intake and the influence of
sodium restriction were investigated in relation to CVD risk and HF development and
prognosis.30-32 However, despite the numerous studies showing successful improvements
in the prognosis of HF, so far no clear conclusions can be drawn about the role of these
nutrients.
Few prospective studies exist that investigated the dietary impact on HF incidence at the
level of nutrients. These were furthermore contradictory and focussed mainly on intakes of
fatty acids, especially marine omega-3-fatty acids (n3FAs). In Table 3, prospective cohort
studies on nutrients (fatty acids, vitamins and minerals) and the risk of HF are
summarized.
Within the last decade, first prospective studies appeared investigating the level of food
groups, especially fish consumption. Besides the eight studies listed in Table 4, three
meta-analyses were published recently.33-35 Djousse et al.35 and Li et al.34 observed an
inverse association between fish intake and HF, while Hou et al.33 found no association
between fish and HF incidence but an increased HF risk with consumption of fried fish.
There is some support of a beneficial effect of whole grain intake22, 23 on HF development.
However, most other food groups were investigated by only few studies with controversial
results. In this context, red meat, eggs and dairy products seemed more likely to be
associated with an increased risk of HF.36, 37 These and further examined foods are
summarized in Table 5.

Introduction | 10
Table 3: Summary of Prospective, Population-based Cohort Studies on Nutrients and Heart Failure Risk
FIRST AUTHOR, YEAR STUDY, COUNTRY POPULATION EXPOSURE RESULT
Number Cases Sex Age [range]
FUP§ [years]
Dietary intake of…
Fatty acids
Levitan et al., 201238
SMC, Sweden 36,234 651 w 48-83 ~9 α-linolenic/ linoleic acid no association to HF risk
Lemaitre et al., 201239
CHS, USA 4,432 1,072 m/w ≥65* ~12 α-linolenic acid no association to HF risk
Wilk et al., 201240
PHS, USA 19,097 703 m 58.7§ ~8 n3FA no association to HF risk
Belin et al., 201141
WHI, USA 84,493 1,858 w 50-79 ~10 n3FA, trans fatty acids no association to HF risk
Levitan et al., 201042
SMC, Sweden 36,234 651 w 48-83 ~9 n3FA inverse association to HF risk
Dijkstra et al, 200943
RS, The Netherlands 5,299 669 m ≥55* ~11 n3FA no association to HF risk
Levitan et al., 200944
CSM, Sweden 39,367 597 m 45-79 ~7 n3FA U-shaped association to HF risk
Yamagishi et al., 2008
45
JACC, Japan 57,972 307 m/w 40-79 ~13 n3FA inverse association to fatal HF risk
Vitamins
Cui et al., 201046
JACC, Japan 58,730 318 m/w 40-79 ~14$ folate, vitamin B6,
vitamin B12
inverse association to fatal HF risk
positive association to fatal HF risk (n.s.)
Rautiainen et al., 201347
SMC, Sweden 33,713 894 w 49-83 ~11 total antioxidant capacity of diet
inverse association to HF risk
Minerals
Zhang et al., 201248
JACC, Japan 58,615 431 m/w 40-79 ~15$ magnesium inverse association to fatal HF
risk in women
He et al., 200249
NHANES I, USA 10,362 1,092 m/w 25-74 ~19 sodium positive association to HF risk
* Minimum age;
§ arithmetic mean,
$ median
Abbreviations: CHS, Cardiovascular Health Study; CSM, Cohort of Swedish Men; FUP, follow-up time; HF, heart failure; JACC, Japan Collaborative Cohort; n3FA, omega-3 fatty acids; NHANES, National Health and Nutrition Examination Survey; n.s., not significant; PHS, Physicians' Health Study; RS, Rotterdam Study; SMC, Swedish Mammography Cohort; WHI, Women’s Health Initiative

Introduction | 11
Regarding beverages, meta-analyses have been published for alcohol intake50 (Figure 2)
and for coffee consumption51 in relation to HF development. Both coffee and alcohol
consumption turned out to be inversely associated with HF risk if consumed moderately.
Figure 2: Results from a Meta-analysis on Alcohol Consumption and the Risk of Heart Failure
This figure is a modified version of Figure 1, Padilla, 201050
Abbreviations: CI, confidence interval
Similarly, the research on dietary patterns in relation to HF development is limited to three
publications.52-54 The DASH diet, a diet rich in fruits, vegetables, nuts, legumes, low-fat
dairy and whole grain, but low in sodium, sweetened beverages and red and processed
meat, has potential for risk reduction of HF.21, 22 The dietary glycemic index or glycemic
load, however, seems not to influence the development of HF. 52
Despite the growing evidence about the role of nutrition in HF development, literature is
still insufficient to draw firm conclusions on the association between dietary components
and the incidence of HF, even regarding the extensively examined food group fish.
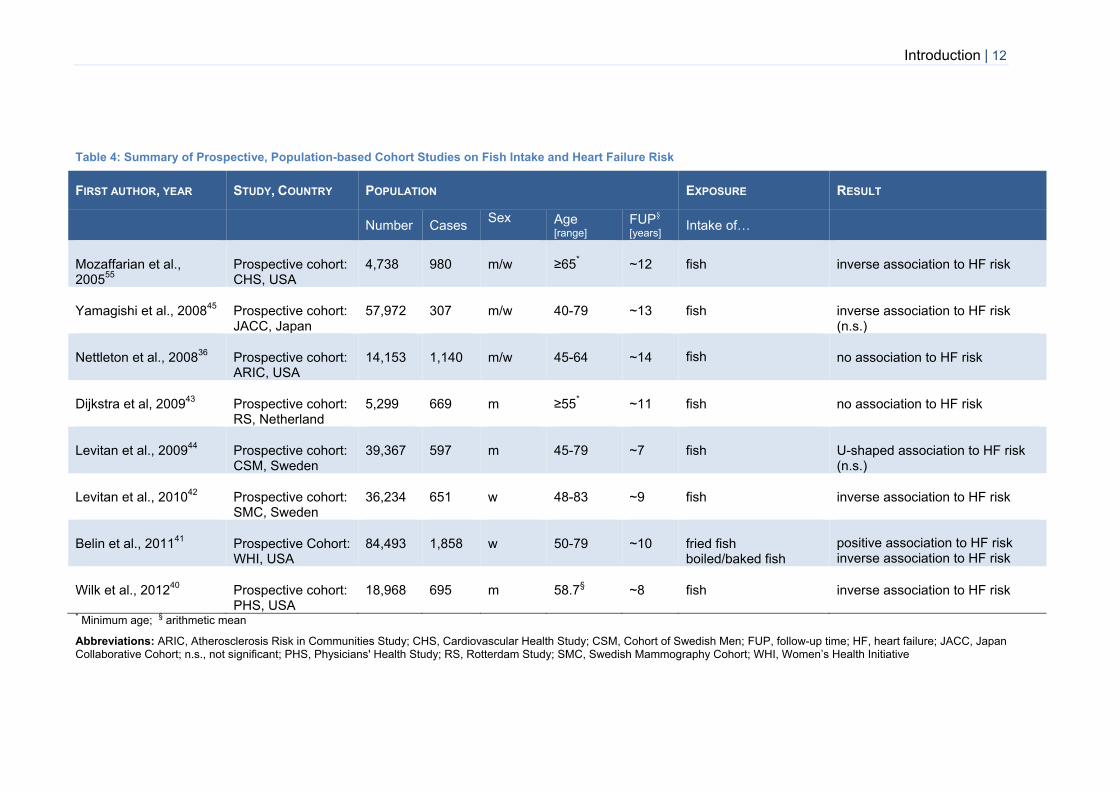
Introduction | 12
Table 4: Summary of Prospective, Population-based Cohort Studies on Fish Intake and Heart Failure Risk
FIRST AUTHOR, YEAR STUDY, COUNTRY POPULATION EXPOSURE RESULT
Number Cases Sex
Age [range]
FUP§ [years]
Intake of…
Mozaffarian et al., 2005
55
Prospective cohort: CHS, USA
4,738 980 m/w ≥65* ~12 fish inverse association to HF risk
Yamagishi et al., 200845
Prospective cohort: JACC, Japan
57,972 307 m/w 40-79 ~13 fish inverse association to HF risk (n.s.)
Nettleton et al., 200836
Prospective cohort: ARIC, USA
14,153 1,140 m/w 45-64 ~14
fish no association to HF risk
Dijkstra et al, 200943
Prospective cohort: RS, Netherland
5,299 669 m ≥55* ~11 fish no association to HF risk
Levitan et al., 200944
Prospective cohort: CSM, Sweden
39,367 597 m 45-79 ~7 fish U-shaped association to HF risk (n.s.)
Levitan et al., 201042
Prospective cohort: SMC, Sweden
36,234 651 w 48-83 ~9 fish inverse association to HF risk
Belin et al., 201141
Prospective Cohort: WHI, USA
84,493 1,858 w 50-79 ~10 fried fish boiled/baked fish
positive association to HF risk inverse association to HF risk
Wilk et al., 201240
Prospective cohort: PHS, USA
18,968
695
m 58.7§ ~8 fish inverse association to HF risk
* Minimum age;
§ arithmetic mean
Abbreviations: ARIC, Atherosclerosis Risk in Communities Study; CHS, Cardiovascular Health Study; CSM, Cohort of Swedish Men; FUP, follow-up time; HF, heart failure; JACC, Japan Collaborative Cohort; n.s., not significant; PHS, Physicians' Health Study; RS, Rotterdam Study; SMC, Swedish Mammography Cohort; WHI, Women’s Health Initiative

Introduction | 13
Table 5: Summary of Prospective, Population-based Cohort Studies on Different Food Groups and Heart Failure Risk
FIRST AUTHOR, YEAR STUDY, COUNTRY POPULATION EXPOSURE RESULT
Number Cases Sex
Age [range]
FUP§ [years]
Intake of…
Djoussè et al., 200756
PHS, USA 21,376 1,018 m 40-86 ~20 breakfast cereals inverse association to HF risk (limited to whole grain cereals)
Djoussè et al., 200857
PHS, USA 21,275 1,084 m 53.7§ ~20 eggs positive association to HF risk
Nettleton et al., 200836
ARIC, USA 14,153 1,140 m/w 45-64 ~14 whole grains,
high-fat dairy, eggs fruits/vegetables nuts, red meat
inverse association to HF risk
positive association to HF risk no association to HF risk
Djoussè et al., 200858
PHS, USA 20,976 1,093 m 54.6§ ~20 nuts no association to HF risk
Ashaye et al., 201020
PHS, USA 21,120 1,204 m 54.6§ ~20 red meat positive association to HF risk
Mostofsky et al., 201059
SMC, Sweden 31,823 419 w 48-83 ~9 chocolate U-shaped association to HF risk
Kaluza J et al., 2014 60
CSM, Sweden 37,035 3,157 m 45-79 11.8 Processed meat Unprocessed meat
Positive association to HF risk No association to HF risk
§ arithmetic mean
Abbreviations: ARIC, Atherosclerosis Risk in Communities Study; FUP, follow-up time; HF, heart failure; PHS, Physicians' Health Study; SMC, Swedish Mammography Cohort

Introduction | 14
1.3.3 The Mediterranean Diet
In Mediterranean countries such as Greece or Italy, a typical lifestyle and diet is common,
which in parts is considerably different from the diet in other European countries due to,
amongst others, closeness to the sea and the subtropical climate. Physical activity is also
part of the Mediterranean lifestyle, as field and kitchen work were characteristics of the
Mediterranean area in the 1960s along with low occurrence of obesity.61 In addition, the
Mediterranean diet represents a social component: meals are eaten together with family
and friends and are an expression of enjoyment, stress relief and pleasure.61
Characteristics of the Mediterranean Diet
The Mediterranean diet is characterised by a high proportion of plant foods like
vegetables, fruits, cereals, legumes, seeds and bread. Furthermore, meals are generally
consumed fresh or minimally processed. The proportion of saturated fatty acids (SFAs) is
usually low due to low consumption of red meat, while olive oil is the principal fat source.
Intakes of fish exceed the intakes of poultry and are consumed in moderate amounts.
Another component of the diet is the consumption of wine, typically in low to moderate
amounts and during meals. Fresh fruit is usually eaten as dessert.
The typical Mediterranean diet reflects the nutritional pattern of Greek (especially Crete)
and south Italian regions in the 1960s and was defined and operationalized by means of a
Mediterranean diet pyramid by Willett et al. in 1995.61 Figure 3 shows a similar
Mediterranean diet pyramid, introduced by the Supreme Scientific Health Council of the
Ministry of Health and Welfare in 1999.62

Introduction | 15
Figure 3: The Mediterranean Diet Pyramid (Source: Supreme Scientific Health Council
1999, p 519)62
Mediterranean Diet Scores
In the scientific literature, a vast amount of publications is available on attempts for
defining and estimating adherence to the Mediterranean diet. The majority of them
computed the adherence by means of a priori (derived from prior knowledge) defined
Mediterranean diet scores.63
The first score, the traditional Mediterranean diet score (tMED), was introduced by
Trichopoulou et al. in 199564 and generated by using median intakes of a Greek
population to specify adherence to the diet (Table 6). Six positive (health-promoting) and
two negative (detrimental) components were considered. The tMED was widely used by

Introduction | 16
other investigators, especially the one, which was revised by Trichopoulou et al.65 in 2003
to include fish as a seventh positive component. A further modification was performed by
the same author66 to allow application of the score in non-Mediterranean populations. The
main difference to the previous score was the inclusion of polyunsaturated fatty acids
(PUFAs) in the numerator of the fat-ratio, since monounsaturated fatty acids (MUFAs, that
represent olive oil in Mediterranean countries) originate from other - presumably unhealthy
- sources in the nutrition of non-Mediterranean populations.
Besides Trichopoulou’s own modifications, other investigators modified the tMED due to
the type of their research question, data collection, general health recommendations, or
the differing distribution of the components’ intakes in the population under investigation.
The main changes were the exclusion of alcohol or the use of different definitions of
moderate alcohol consumption, the exclusion of nuts or dairy products from the score, and
the pooling of two components (e.g. legumes with vegetables or nuts, and potatoes with
cereals or vegetables). Some researchers also split meat into red meat and poultry or
excluded the latter from the score. One more recent study should be mentioned here: Sofi
et al.67 combined the tMED with a posteriori (based on empirical data) defined cut-points.
Participants were assigned 0, 1 or 2 points according to their amount of intakes (with 2
points reflecting higher adherence than 1 point). This score ranged from 0 to 18 points.
Apart from the tMED, another score was widely used in the scientific literature: the
alternate Mediterranean diet score (aMED).68 This score was generated in the Nurses’
Health Study and therefore adapted to a U.S. American population. It was a modified
version of the revised tMED in order to integrate associations to lower risks of chronic
diseases. Therefore, only whole-grain and red meat were included, nuts were regarded as
separate component and dairy products were excluded from the score. Additionally, the
amount of moderate alcohol consumption was modified to fit U.S. American standard
portion sizes (Table 6).
Many more investigators came up with other scores that differed in their components and
weighting of these, or they used different cut-points for score construction (percentages,
tertiles, or categories). However, those were not used in the present work and therefore
were not further explained. An overview of the present Mediterranean scores that are
used in observational studies is given in Appendix III-Appendix VI.

Introduction | 17
Table 6: The Characteristics of the Traditional and the Alternate Mediterranean Diet Score
FIRST AUTHOR, YEAR
STUDY
POPULATION NO. OF
COMPONENTS POSITIVE COMPONENTS NEGATIVE COMPONENTS SCORE CUT
POINTS SCORE
RANGE ACCOUNT FOR
ENERGY ADAPTED OR
MODIFIED BY
1) Traditional Mediterranean Diet Score (tMED)
Trichopoulou 1995
64
Residents from 3 Greek villages
8 1. MUFA/SFA-ratio 2. moderate alcohol 3. legumes 4. cereals/ potatoes 5. fruits and nuts 6. vegetables
1. meat/meat products 2. milk/milk products
Sex-specific medians*
0-8 Intakes were adjusted to 2000 kcal (women) /2500 kcal (men)
6 studies
Revised in
200365
EPIC-Greece
9
Changes: - Inclusion of fish as positive component - Definition of moderate alcohol consumption:
women: 5-25g/d, men: 10-50g/d
Sex-specific medians*
0-9
adjusting for energy-expenditure index
70 studies
Modified in
200566
EPIC-Elderly, 10 European countries
9 Changes: - (PUFA+MUFA)/ SFA-ratio - fruits did not include nuts
Sex-specific medians*
0-9 adjusting for energy intake
10 studies
2) Alternate Mediterranean Diet Score (aMED)
Fung, 200568
Nurses’ Health study
9 1. MUFA/SFA-ratio 2. moderate alcohol
(w: 5-15g/d, m:10-25g/d) 3. legumes 4. whole-grain cereals 5. fruits 6. nuts 7. vegetables 8. fish
1. red and processed meat
Sex-specific medians*
0-9 adjusting for energy intake in the regression model
21 studies
* persons receive 0 points for intakes median and 1 point for intakes ≥ median in case of positive components and reverse for negative components Abbreviations: EPIC, European Prospective Investigation into Cancer and Nutrition; MUFA, monounsaturated fatty acids; PUFA, polyunsaturated fatty acids; SFA, saturated fatty acids

Introduction | 18
The Mediterranean Diet and Heart Health
The Mediterranean diet gained notoriety ever since the protective effect against ischaemic
heart disease has been recognized by Keys in the Seven Countries Study,69 where
mortality rates of CHD were compared between populations from Mediterranean
countries, Japan, North European countries and the USA. The lowest death rates were
observed in Greece, which was attributed to the high MUFAs and simultaneously low SFA
content of their diet.70
Since then, much research has been conducted in this area to understand the health-
promoting ability of the Mediterranean diet. Cardio-protective properties have been well
documented by ecologic, cohort as well as intervention studies, and in different settings
and populations of primary and secondary prevention.71-76 The clear regional variation in
cardiovascular mortality within Europe, showing a north-east to south-west gradient, is
thought to be related to differing risk profiles including lifestyle and diet (together with
alcohol consumption).71 The Mediterranean diet has already been reported to be inversely
associated to cardiovascular risk factors and precursors of CVD and HF.68, 77-82
Furthermore, to incident CHD73, 75 and CVD mortality73, 75, 76 in the general population, and
to survival after myocardial infarction74 and HF83 (although not significant in HF). A meta-
analysis of 20 prospective cohort studies by Sofi et al.84 that investigated the relationship
between adherence to the Mediterranean diet and the incidence and mortality from CVD
reported a 10% risk-reduction per two points increase in Mediterranean diet score.
Recently, the CVD risk-protective effects of the Mediterranean diet have also been
confirmed in the PREDIMED study (PREvención con DIeta MEDiterránea), a large
randomized dietary trial in a population at high cardiovascular risk.72 Participants who
were assigned to a Mediterranean diet supplemented with either olive-oil or nuts, had an
approximately 30% reduced risk of developing major cardiovascular events compared to
the control group which was advised to reduce total dietary fat.72
Behind this background, it is not surprising that the Mediterranean diet has become an
important tool of preventive measures for cardiovascular health and is part of several
guidelines and recommendations for primary and secondary prevention of CVD endpoints,
especially CHD.85-87 The secondary prevention of CHD appears to be closely related to
primary prevention of HF, at least of systolic nature, since HF-related deaths are quite
common among persons with established CHD.86, 88 Following a Mediterranean-style
dietary pattern seems to be the most promising dietary behaviour in the primary
prevention of HF as it is a recommended nutritional pattern in the secondary prevention of
CHD.86 Furthermore, it combines most of the previously identified dietary components that
may be relevant in HF development as outlined in Chapter 1.3.2.

Introduction | 19
1.4 Objectives
Against the presented background, the research question of this thesis was whether the
adherence to a Mediterranean-style dietary pattern is associated with the risk of
developing HF in a population of apparently healthy adults, and whether this association is
driven by certain components of the diet.
The objective of this thesis is therefore to evaluate associations between adherence to the
Mediterranean diet and the risk of HF on different levels of nutrition. To reach this goal, a
top-down approach was applied; beginning with analyses on an established
Mediterranean diet score65, continuing with the dietary components on which the score
was based, up to the level of single subgroups, macronutrients and micronutrients (see
Appendix II) depending on the results derived from the respective higher level. Data of a
large German prospective cohort study, EPIC-Potsdam, were used for these analyses.
The top-down approach was structured into the following steps:
1. Evaluation of the association between the adherence to an a priori defined
Mediterranean dietary pattern and the risk of HF by using a common established
Mediterranean diet score
2. Analyses on components of the score to identify the main contributors to the diet-
disease association, or - in case of no association with the overall score - to identify
whether individual score components (and subgroups of these) are associated to HF
risk
3. Evaluation of the association between the main representatives of the respective
identified foods and the risk of HF on macro- and/or micronutrient level.

Material and Methods | 20
2. MATERIAL AND METHODS
2.1 Material
2.1.1 Study Design and Population
EPIC is a large-scale multi-center cohort study with a total of nearly 520,000 participants
from ten European countries and 23 centers.89 The German Institute of Human Nutrition is
one of the two German centers and is located in Potsdam (north-east of Germany). From
initially about 75,000 invited residents from Potsdam and surrounded areas, 27,548
(22.7%) agreed to participate and were recruited between 1994 and 1998.90, 91
Participants gave their written informed consent and all study procedures were approved
by the Ethics Committee of the Federal State Brandenburg.
Recruitment included physical examinations as well as personal interviews and
questionnaires on lifestyle and health factors that are of interest in studies aimed to
investigate the relationship between nutrition and chronic diseases, particularly cancer.91
Every two to three years, participants were re-contacted and interviewed by
questionnaires about lifestyle and newly diagnosed diseases.92 Up to the fourth follow-up,
response rates exceeded 90% at each occasion.
Some exclusion was required for the current analyses. This involved 3,540 participants
(including 116 incident HF cases). In detail, 125 participants with either a prevalent/not
verifiable HF at baseline, 612 participants who never filled out any follow-up
questionnaire, and 135 participants with an age lower than 35 were excluded. Further
exclusion criteria were missing information about covariates (n=247), and implausible
energy intake (top and bottom 1% of total energy intakes) to minimize the problem of
over- and underreporting (n=528). As CHD (herein angina pectoris or myocardial
infarction) is a severe disease where dietary changes can be expected and it is also an
important risk factor for HF, 1,863 participants (including 100 incident HF cases) with
prevalent CHD were excluded. Finally, 24,008 participants (23,799 non-cases and 209
incident HF cases) remained for analyses.

Material and Methods | 21
2.1.2 Exposure and Covariate Assessment
Dietary Assessment
Habitual dietary intakes during the year preceding enrolment were assessed by means of
a semi-quantitative self-administered FFQ. In this questionnaire it was asked about the
frequencies and portion sizes (supported by photographs) of 148 food items and possible
answers were scaled from ‘once a month or less’ to ‘five times a day or more’. Food items
have then been summarized into 49 food groups as described previously.93 For each
participant, intakes were converted into grams per day or milliliters per day, and various
nutrients, as well as total energy intakes were calculated by a link to the German Nutrient
Data Base.94
The FFQ data was validated by comparison to 24h dietary recalls in a subset of 104
EPIC-Potsdam participants as previously described.95, 96 The validity of the FFQ was
reported to be low for food groups consumed in low amounts and mainly at weekends
(which were not covered by the 24h dietary recalls), such as legumes (Spearman
correlation coefficient (r) =0.14), nuts (r=0.18) and fish (r= 0.21). Moderate validity was
observed for intakes of vegetables (r=0.34), cereals (r=0.42), cheese (r=0.47), fruits
(r=0.50), red meat (r=0.53), milk products (r=0.56), and processed meat (r=0.56). The
relative validity of alcoholic beverages was high (r=0.90).93 On the level of nutrients,
observed Pearson correlation coefficients were moderate for intakes of total energy
(r=0.59), SFAs (r=0.57), MUFAs (r=0.53), and cholesterol (r=0.51), while it was high for
ethanol (r=0.88).96
Selection and Building of the Mediterranean Diet Score
To investigate the Mediterranean dietary pattern, in a first step, two established
Mediterranean diet scores were used, namely the revised modified tMED by Trichopoulou
et al.66 and the aMED created by Fung et al.68 (for both see Table 6). These two scores
were selected because they sufficiently differed in terms of components and construction
and they were both established in a wide range of previous studies. Furthermore, the
revised modified tMED was generated to be applied in non-Mediterranean countries, and
the aMED was constructed in line with recommendations to prevent chronic diseases and,
therefore, both seemed to be the most appropriate ones.
However, after the first analyses (see Appendix VII), it was decided to change to the
traditional revised tMED65 with the initial used cut-points (median intake values of the
Greek population), as this seemed to reflect the ‘true’ Mediterranean diet more properly.
Two main issues were identified when keeping at study-specific median cut-points:

Material and Methods | 22
First, it was noted, that the dietary intakes according to score points in some parts did not
much differ between the groups (Appendix VIII and Appendix IX). In case of the tMED this
was conspicuous especially for the consumption of meat (mean intakes were equal in all
three groups of adherence). With respect to the aMED, the proportion of persons
receiving a point for several individual components was not differing much across the
groups (e.g. 45% received a point for high vegetable intake in group 1 versus 53% in
group 3 of aMED adherence). Second, great differences between the consumed intakes
of the initial Greek population and the EPIC-Potsdam study participants were recognized
(Table 7). By using the Greek cut-points an inverse relationship was expected which
corresponded more to the ‘true’ effect of the Mediterranean diet.
Thus, the finally used score included nine components (for structure and composition see
Appendix X) with a possible range from 0 to 9 points (minimum to maximum adherence).
One point was assigned for intakes at or above the sex-specific median intakes of the
Greek population (Table 7) for components considered to be healthy (vegetables, fruit and
nuts, legumes, cereals, fish, and the ratio between MUFAs and SFAs). Persons received
no point when the intakes were lower. In terms of components considered detrimental
(meat products and milk products) the scoring was reversed. Regarding alcohol, a value
of one was assigned for moderate consumption (men: ≥10 g/d – 50 g/d, women ≥ 5g/d –
25 g/d) and no point for lower and higher intakes.
Table 7: Median Dietary Intakes* (by sex) of Mediterranean Diet Score Components
Comparing EPIC-Potsdam and EPIC-Greece
COMPONENT MEN WOMEN
EPIC-P EPIC-G65
EPIC-P EPIC-G65
Fish 23.0 23.7 16.4 18.8
Fruits and nuts 126.1 362.5 156.8 356.3
Vegetables 81.8 549.9 97.3 499.6
Legumes 23.4 9.1 14.6 6.7
MUFA/SFA-ratio 0.87 1.72 0.84 1.74
Cereals 221.6 177.7 172.9 139.7
Meat products 135.1 120.8 87.1 89.8
Milk products 154.0 196.7 190.4 191.1
* Median dietary intakes include consumers and non-consumers Abbreviations: EPIC, European Prospective Investigation into Cancer and Nutrition; EPIC-G, EPIC-Greece; EPIC-P, EPIC-Potsdam

Material and Methods | 23
Assessment of Covariates
Information on non-dietary factors such as prevalent diseases (e.g. CHD, diabetes,
hypertension and hyperlipidemia), lifestyle and socio-demographic factors were obtained
at baseline by computer-guided questionnaires and personal interviews.89-91 Further, a
physical examination covered, amongst others, measurements of anthropometric
parameters and blood pressure. Body mass index (BMI) was calculated by dividing body
weight by body height squared (kg/m2). For the present analysis, prevalent hypertension
was defined as systolic blood pressure ≥140mmHg or diastolic blood pressure ≥90mmHg
or self-reporting of a diagnosis or use of antihypertensive medication. Prevalent CHD was
defined as either myocardial infarction or angina pectoris prior to baseline. The prevalence
of diabetes at baseline was assessed by using information on self-reported medical
diagnosis, medication records and dieting behaviour. Persons were considered to have
prevalent hyperlipidemia, if they reported a diagnosis or the use of lipid lowering drugs.
Physical activity was defined as the mean time spent on leisure time physical activities
and cycling (hours/week) during summer and winter. All interviews and physical
examinations were standardized and conducted by trained personnel.91
2.1.3 Outcome Ascertainment
In the present analyses only medically confirmed HF cases were used. Those were
identified by several sources of information:
- Self-report
- Death certificates (diagnosis I50 of ICD-10 as underlying cause of death)
- Link to the hospital information system of the major hospital in the Potsdam area.
- Validation of participants who suffered from incident myocardial infarction or reported
the use of medications typical for the treatment of HF
In the fourth follow-up round a question about HF was first incorporated in the
questionnaires (see Appendix XII) to determine newly diagnosed outcomes by self-report.
The participants were asked, whether they ever had been diagnosed with a weak heart or
HF. If they affirmed, the date of diagnosis and the treating physician was obtained.
Attending physicians were then contacted and asked to fill out a validation form (Appendix
XIII), in which the diagnosis and the respective date should be confirmed.
In addition, HF cases were classified in accordance to the diagnostic criteria of the ESC
Guidelines,2 as previously described.97 Briefly, HF cases were divided into definite,
probable, possible and indefinite cases by the degree of diagnostic information (Figure 4).

Material and Methods | 24
Figure 4: Flow Chart of the Validation Procedure for Heart Failure Classification, according
to Diagnostic Evidence (Source: Wirth 201398
, p. 28)
* Identified by self-report, death certificates (diagnosis ICD-10 I50 as underlying cause), and by link to the hospital information system of the major hospital in the Potsdam area. In addition, participants were validated, who suffered an incident myocardial infarction or reported the use of medications that are commonly prescribed for the treatment of HF. Only HF cases confirmed by the general practitioner are further validated for the discrimination between definite, probable or possible cases. # Evidence from electrocardiogram, x-ray or cardiac catheterization; Note that this figure includes all reported HF cases without any exclusion Abbreviations: HF, heart failure; DC, death certificate

Material and Methods | 25
2.2 Methods
2.2.1 The Top-Down Approach
After selection of the final Mediterranean diet score, the overall association between the
adherence to the diet and HF risk was evaluated (see the following Chapter 2.2.2, Risk
Analysis for details). To decide which score components play a role for the development
of HF and, therefore, should be analyzed further on lower levels of nutrition (top-down),
three approaches were used:
1. HF risk analysis of each individual component on a dichotomous scale
2. Evaluation of the shape of the association between each individual component and
HF risk on a continuous scale
3. A ‘subtraction method’, removing alternately each one component at a time as
proposed by Trichopoulou et al.99 to determine the relative impact of these
components on HF risk
The components that were considered relevant according to these approaches were
further studied in detail. Therefore, food subgroups and their main representatives on
macro- and/or micronutrient level (taking into account the amount of substances within the
food group and possible underlying mechanisms related to HF risk) were examined. In
order to increase the ability to differentiate between associations of highly correlated
nutrients (as a natural consequence of their common origin) these analyses were
conducted both source-specific and by total nutritional intakes.
2.2.2 Statistical Analyses
All statistical analyses were performed using the SAS software package, release 9.4 (SAS
Institute, Cary, NC). A p value <.05 was considered statistical significant. For
investigations of interactions, a p value of 0.1 was selected to take into account large
variances and resulting lower statistical power in detecting interactions.100
Descriptives
Baseline characteristics of the study participants were compared across categories of
tMED and across intakes of selected food groups using analysis of covariance. All
characteristics except participants’ age and sex were calculated adjusted for age and sex.
Sex-specific categories (in most cases quintiles) of food groups (e.g. total meat),
subgroups (e.g. poultry, red- and processed meat) and nutrients (e.g. SFAs) were
generated to investigate its association to HF risk. Analyses of alcoholic beverages were
performed separately for men and women using categories defined in accordance to
standard portion sizes.101 As beer consumption was much higher in men than in women,

Material and Methods | 26
five and four categories were generated, respectively (men: non-consumers, consumers
of less than a quarter of a glass of beer (250ml), consumers of 250ml to less than 500ml,
consumers of 500ml to less than one liter, consumers of more or equal to one liter;
women: non-consumers, consumers of less than 125ml, consumers of 125ml to less than
250ml, consumers of at least 250ml). The intakes of wine did not differ much between
men and women, therefore both were categorized equally (non-consumers, consumers of
less than one glass per week (35.7ml), consumers of more than one glass per week and
less than half a glass per day (125ml), consumers of more than half a glass and less than
one glass per day (250ml), consumers of one or more glasses per day). The lowest
category of consumers served as reference group as non-consumers may reflect a
mixture of never drinkers and former drinkers who quit drinking as a result of a disease.
Spearman partial correlation coefficients (adjusted for age and sex) were calculated to
describe the correlation between nutrients and food groups.
Selection of Covariates
In the present work, directed acyclic graphs (DAGs) were implemented to identify the
minimal sufficient adjustment set of covariates to investigate the association between a
Mediterranean-style dietary pattern and HF risk.102 DAGs support the user’s
understanding in underlying relationships (causal and non-causal) and help to distinguish
between confounders and mediators (see Figure 5). The DAG program (v0.21) was used
to identify minimally sufficient adjustment sets to estimate the total effect of the
Mediterranean diet on HF risk.
Figure 5: Graph of Exposure-Disease Associations
In green: causal pathway via mediator; black: non-causal pathway in which the confounder is influencing the relationship between exposure and outcome; blue and highlighted by question mark: the association of interest between exposure and outcome.
Two competing DAGs were generated (Figure 6 and Figure 7). Some factors, like age,
sex and educational or occupational attainment are well known HF risk factors and also
determinants of lifestyle habits, including diet;103-109 e.g. in older age, health

Material and Methods | 27
consciousness rises and leads to greater compliance to health recommendations,
including the adherence to the Mediterranean diet.106, 108, 109 Diet in turn may be a direct
cause of adiposity or comorbidities like diabetes, hypertension, and hyperlipidemia. If
people do not change their dietary habits after diagnosis - probably depending on disease
severity, duration from diagnosis to dietary assessment and the degree of health
consciousness - associations will result in DAG 1 (Figure 6).
Figure 6: Directed Acyclic Graph (DAG 1) for the Association between the Mediterranean Diet and
Heart Failure
Boxes include factors with similar associations to the remaining elements which were summarized for simplicity purposes. The minimal sufficient adjustment set of this DAG consists of lifestyle factors, education and age & sex. Green: the possible causal pathway from exposure to disease via mediator (comorbidities). Blue: the pathway that is to be examined Abbreviations: tMED, traditional Mediterranean diet score
On the other hand, prevalent diseases often trigger lifestyle changes like smoking
cessation, reduction of alcohol intake and dietary changes. In this case, the DAG will
present like illustrated in Figure 7. Thus, it cannot be figured out with certainty, whether
the mentioned prevalent diseases are confounding or mediating the association between
diet and HF. Actually, it is assumed that the ‘true’ association between the adherence to
the Mediterranean diet and the development of HF may be a mixture of both DAGs.

Material and Methods | 28
Figure 7: Directed Acyclic Graph (DAG 2) for the Association between the Mediterranean Diet and
Heart Failure
Boxes include factors with similar associations to the remaining elements and which were summarized for simplicity purposes. The minimal sufficient adjustment set of this DAG consists of comorbidities, lifestyle factors, education and age & sex. Red: arrows whose direction cannot be determined unambiguously and which might run conversely (see Figure 6). Blue: the pathway that is to be examined Abbreviations: tMED, traditional Mediterranean diet score
Accordingly, three statistical models were used, a basic model containing a minimum of
covariates (model 1), a second model considering covariates from DAG 1 (model 2), and
a third model which contains potential mediators resulting from DAG 2 (model 3):
Model 1: adjusted for sex and total energy intake (MJ/d), stratified for age
Model 2: Model 1 further adjusted for educational degree (no vocational
training/vocational training (reference); technical college; university; used
as indicator variables), physical activity (continuously in hours/week),
smoking status (never smoker (reference); past smoker; smoker <20
cigarettes/day, smoker 20 cigarettes/day; used as indicator variables)
Model 3: Model 2 further adjusted for BMI and waist circumference (continuously),
and prevalent diseases (diabetes mellitus, hypertension, hyperlipidemia
(present/absent))
For analyses on individual food groups and nutrients covariates included all remaining
score components in the model.

Material and Methods | 29
Risk Analysis
Cox proportional hazards regression was performed to determine the association between
the adherence to the Mediterranean-style diet, the intakes of its components as well as
the main representing nutrients and the risk of HF. Age was used as the underlying time
variable in the counting process. Entry and exit time were defined as the participants’ age
at recruitment and age at time of HF diagnosis or censoring, respectively. One central
assumption of Cox regression analyses is that the ratio of the hazards of exposed and
non-exposed individuals remain constant over time. The proportional hazards assumption
was checked with the Kolmogorov-type supremum test (based on a sample of 1,000
simulated residual patterns) and revealed no violation.
Hazard ratios (HRs) and 95% confidence intervals (CIs) were calculated according to
categories of the Mediterranean diet score (0-2 points (reference), 3-4 points and ≥5
points) and per two units increase in the score. The presence of effect modification was
explored by using cross product terms of tMED (per two units increase) and the most
important risk factors for HF (age (<60 / ≥60 years), sex, current smoking (yes / no),
obesity (BMI ≥ 30kg/m2) (yes / no), and prevalent diabetes, hypertension, and
hyperlipidemia (yes / no)) in the final multivariable adjusted Cox regression model.
For selection of the ‘relevant’ score components, Cox regression analyses was performed
using components on a dichotomous scale. HRs and 95% CIs of HF were calculated for
persons who received one point for each of the individual components compared to the
reference group (persons who did not receive a point for the respective score component).
Furthermore, restricted cubic spline Cox regression analysis with three knots (5th, 50th
(reference) and 95th percentile) was used to analyze the shapes of the association
between the food group intakes (g/d) that are reflected by each score component and HF
risk in the fully adjusted model. A third approach to select ‘relevant’ components was the
‘subtraction method’ introduced by Trichopoulou et al.99 By using this method, HRs of HF
per two unit increment in tMED were calculated for the overall score and the scores that
were derived by subtracting alternately one of the components. To account for the
different scaling (nine versus eight possible score points) the estimated logarithms of the
HRs were multiplied by 9/10 before exponentiation. The percentage change in the
estimate was calculated to assess the proportion to the overall association of each score
component.99
HRs and 95% CIs of HF according to intakes of selected food groups/subgroups and
nutrients were calculated per sex-specific categories of intakes (in most cases quintiles)
using the first category as reference.

Material and Methods | 30
To calculate linear trends of HRs across categories (ptrend) ordinal variables for successive
categories were used (coded 1-5). For intakes of alcoholic beverages, the p value for
nonlinearity (pnonlin) was obtained by the Wald chi-square test following restricted cubic
spline Cox regression performed in statistical model 3.
Several sensitivity analyses were performed to deal with the remaining problems of
confounding. First, as an alternative to the use of Greek medians, further cut-points were
applied to classify participants in adhering or not adhering to the Mediterranean diet.
Therefore, the population-specific third tertile of intake was used and, analyses were
performed using the cut-off values proposed by Sofi and colleagues.67
Second, to cope with the problem of reverse causality, in a further analysis early HF cases
(occurring within the first two years of follow-up) were excluded. These persons might
have already changed lifestyle and diet as a result of first symptoms prior to recruitment.
Additionally, for the same reason, persons were excluded who reported a dietary change
during the year preceding the recruitment. Further, the issue of possible misclassification
of cases was addressed by repeating analyses excluding both possible and probable HF
cases.
Lastly, the analyses at nutrient level have, furthermore, been repeated adjusting for other
nutrients to conform to most other investigations. Thus, in model 2 nutrients were mutually
adjusted for intakes of total ethanol, total iron, total fiber, total cholesterol, total SFAs, and
total animal protein in the overall analysis, and additionally included the respective nutrient
of the other source in sub-analyses. For example intakes of cholesterol from meat were
adjusted for intakes of total ethanol, total fiber, total SFAs, total animal protein, total iron
and cholesterol from sources other than meat. In case of SFAs, analyses were
additionally adjusted for MUFAs and PUFAs, and in case of animal protein for calcium
intake. Regarding n3FAs, analyses were adjusted for total ethanol, total SFAs, total
cholesterol, and total fiber intakes.

Results | 31
3. RESULTS
3.1 Characteristics of the Study Participants
3.1.1 Characteristics According to Heart Failure Status
After a mean follow-up period of 8.2 ± 1.6 years, 209 HF cases occurred. In Table 8,
baseline characteristics of the study participants are shown regarding their disease status
at follow-up. Incident HF cases were older, lower educated and more likely to be men,
overweight, current smokers, and suffering from hypertension, diabetes and
hyperlipidemia, than persons, who did not develop HF.
Table 8: General Baseline Characteristics of Study Participants (n=24,008)
According to their Heart Failure Status at Follow-up
HEART FAILURE
CHARACTERISTICS NO (N=23,799) YES (N=209)
n (cases)
Gender, % female 61.8 37.8
Age, years 49.9 (8.8) 57.9 (6.8)
Body mass index, kg/m2 26.2 (0.03) 27.4 (0.29)
Waist circumference, cm
Men 94.5 (0.1) 97.3 (0.9)
Women 80.3 (0.1) 86.6 (1.2)
University Degree, % 40.1 34.0
Current smoking, % 21.5 34.4
Physical activity, hrs/wk 2.78 (0.02) 2.68 (0.23)
Total Energy Intake, MJ,d 9,072 (16) 8,986 (162)
Alcohol intake, g/d 15.6 (0.1) 12.5 (1.1)
Medical History, %
Prevalent hypertension 46.3 60.6
Prevalent diabetes 4.4 15.8
Prevalent hyperlipidemia 27.2 34.8 Baseline characteristics are expressed as age- and sex-adjusted mean (standard error) or percentages, age and sex are unadjusted means (standard deviation) or percentages, respectively
More than half of the cases fulfilled the ESC criteria and were regarded as definite HF. In
Table 9, clinical characteristics that were used for case classification are summarized.

Results | 32
Table 9: Clinical Characteristics of Heart Failure Cases in EPIC-Potsdam According to Definite,
Probable and Possible Heart Failure
DIAGNOSTIC CATEGORY
All cases Definite Probable Possible
No. of events (%) 209 118 (57) 40 (19) 51 (24)
Symptoms n (%) 152 (73) 118 (100) 22 (55) 12 (24)
Pathological finding n (%)
Echocardiogram 136 (65) 118 (100) 18 (45) 0 (0)
Cardiac catheterization 75 (36) 65 (55) 7 (18) 3 (6)
Chest x-ray 92 (44) 71 (60) 21 (53) 0 (0)
Electrocardiogram 101 (48) 80 (68) 20 (50) 1 (2)
NYHA classification n (%)
I 29 (14) 13 (11) 10 (25) 6 (12)
II 53 (25) 41 (35) 10 (25) 2 (4)
III 25 (12) 22 (19) 3 (8) 0 (0)
IV 13 (6) 12 (10) 0 (0) 1 (2)
unknown 89 (43) 30 (25) 17 (43) 37 (73)
Function of HF n (%)
Diastolic 15 (7) 10 (8) 5 (13) 0 (0)
Systolic 56 (27) 47 (40) 9 (23) 0 (0)
Both 32 (15) 24 (20) 5 (13) 3 (6)
Unknown 68 (33) 37 (31) 21 (53) 48 (94)
For NYHA classification see Table 2 Abbreviations: HF, heart failure; NYHA, New York Heart Association
Beside the necessary information (presence of symptoms and objective evidence from
echocardiogram), for most definite cases information on at least one other diagnostic tool
was present. Most cases where information was available were classified as NYHA II
(25%). Furthermore, more systolic (27%) than diastolic (7%) HF was diagnosed. However,
Information about severity and function of the disease were available more often for
definite compared to probable and possible cases. Possible ones, however, were mainly
fatal events (41 of 51 cases) that have been ascertained from death certificates.
Therefore, information on NYHA classification and diagnostic procedures were frequently
missing.
3.1.2 Baseline Characteristics According to the Mediterranean Diet
Using the median intake values of the Greek population resulted in a tMED score ranging
from 0 to 7 (of 9 possible points), and an average score of 3.5 points in EPIC-Potsdam.
The distribution of the scoring is illustrated in Figure 8.

Results | 33
Figure 8: Panel Chart of the Scoring Distribution among Participants who did and did not Develop
Incident Heart Failure during Follow-up
The upper panel shows the entire graph, while the bottom panel depicts a section of low values for better illustration. Abbreviation: tMED, traditional Mediterranean diet score
Distribution of Nutritional Parameters
In Table 10, the consumptions of seven tMED components and the food groups to which
each of them belong are listed. The components comprise one to five food groups, as
summarized previously.93
The intakes of the components fruits and nuts, vegetables, and milk and milk products
were in general higher in women, while cereals, meat and meat products, fish and
legumes were consumed in greater amounts by men. This is partly different regarding the
individual subgroups. For example, within the cereals component male intakes were
higher only for other bread, while the remaining food groups were consumed in similar
amounts in both sexes. The same was observed for milk and milk products, where a
higher intake in women is only seen for low-fat dairy products.

Results | 34
Table 10: Daily Consumption of Components of the Traditional Mediterranean Diet Score and its Food Groups and Subgroups among Men and Women (n=24,008)
TMED COMPONENT
FOOD GROUP
MEN (N=9,225) WOMEN (N=14,783) NON-CONSUMERS
CONSUMERS NON-CONSUMERS
CONSUMERS
N (%) MEAN (SD) MEDIAN [IQR] 1ST P / 99TH P N (%) MEAN (SD) MEDIAN [IQR] 1ST P / 99TH P
Fruits and nuts 0 (0.00) 125.2(89.2) 97.0 [69.1-169.4] 13.3 / 446.0 3 (0.02) 156.4 (97.2) 133.9 [91.1-198.5] 22.7/ 473.4
Fresh fruits 3 (0.03) 121.6 (88.6) 94.2 [66.6-163.3] 12.5 / 442.5 5 (0.03) 153.6 (96.6) 131.0 [89.5-195.6] 20.8/ 469.3
Nuts 1,241 (13.5) 4.3 (8.6) 0.8 [0.4-4.1] 0.4 / 35.6 2,129 (14.4) 3.3 (7.2) 0.8 [0.4-4.1] 0.4 / 35.6
Vegetables 1 (0.01) 90.0 (49.5) 81.3 [57.0-111.1] 17.5 / 256.8 0 (0.0) 107.8 (56.3) 96.9 [71.9-132.0] 24.2 / 305.5
Raw vegetables 9 (0.1) 47.6 (39.1) 37.9 [23.2-64.1] 4.2 / 200.6 8 (0.1) 61.7 (46.8) 52.0 [32.5-71.7] 6.6 / 231.8
Cooked vegetables 3 (0.03) 27.2 (17.1) 23.6 [15.8-35.1] 3.4 / 78.3 2 (0.01) 29.9 (18.4) 26.1 [17.6-37.9] 4.8 / 89.0
Mushrooms 410 (4.4) 2.0 (2.4) 1.2 [0.6-2.5] 0.1 / 11.1 667 (4.5) 2.1 (2.4) 1.3 [0.7-2.8] 0.1 / 10.9
Cabbage 33 (0.4) 13.4 (13.4) 9.4 [4.8-17.1] 0.5 / 64.2 27 (0.2) 14.2 (14.2) 10.4 [5.6-18.1] 0.6 / 65.9
Garlic 4,861 (52.7) 0.24 (0.48) 0.08 [0.02-0.28] 0.02 / 2.14 7,355 (49.8) 0.28 (0.65) 0.14 [0.03-0.28] 0.02 / 2.14
Cereals ─ 232.3 (86.4) 223.2 [173.3-283.9] 63.9 / 480.0 ─ 178.6 (65.0) 173.2 [131.6-217.2] 54.6 / 358.1
Whole-grain bread 1,397 (15.1) 48.0 (59.0) 24.2 [8.4-65.0] 0.6 / 269.2 948 (6.4) 51.5 (52.8) 34.2 [12.2-75.3] 0.7 / 233.2
Other bread 49 (0.5) 169.8 (86.7) 163.3 [106.7-220.7] 8.7 / 412.2 149 (1.0) 107.6 (62.8) 99.1 [62.0-146.4] 3.6 / 281.2
Grain flakes 6,189 (67.1) 14.3 (23.6) 4.1 [0.8-17.8] 0.4 / 100.0 7,378 (49.9) 11.9 (18.7) 4.1 [0.8-17.8] 0.4 / 100.0
Cornflakes 6,661 (72.2) 5.0 (9.2) 1.6 [0.7-5.7] 0.3 / 40.0 8,801 (59.5) 4.8 (8.4) 1.6 [0.7-5.7] 0.3 / 40.0
Pasta and rice 229 (2.5) 17.1 (15.1) 13.5 [6.3-22.8] 0.7 / 73.9 120 (0.8) 16.2 (14.5) 12.5 [6.6-21.3] 0.8 / 70.1
Meat and meat products 19 (0.2) 147.6 (71.5) 136.2 [98.3-183.5] 28.5 / 373.4 70 (0.5) 94.2 (48.3) 87.3 [61.5-118.2] 13.2 / 244.9
Red meat 37 (0.4) 54.2 (34.3) 47.1 [31.6-69.8] 6.1 / 168.4 127 (0.9) 34.7 (22.6) 30.7 [19.5-44.7] 2.6 / 112.9
Processed meat 41 (0.4) 78.9 (51.3) 65.7[44.7-101.1] 8.2 / 250.4 139 (0.9) 48.4 (33.1) 43.3 [25.8-59.7] 3.7 / 161.9
Poultry 210 (2.3) 15.0 (13.7) 11.0 [5.5-20.2] 1.0 / 65.6 252 (1.7) 11.6 (11.1) 8.3 [4.2-15.4] 0.8 / 52.3
Fish 223 (2.4) 28.4 (28.8) 23.0 [11.5-33.9] 1.6 / 135.3 333 (2.3) 21.4 (21.3) 16.4 [9.9-28.5] 1.6 / 99.7
Canned fish 572 (6.2) 14.7 (23.0) 8.2 [4.1-14.2] 0.8 / 100.0 1,193 (8.1) 9.6 (15.9) 8.2 [1.6-14.2] 0.8 / 71.2
Baked, fried fish 369 (4.0) 14.5 (13.3) 14.8 [3.0-20.5] 1.6 / 64.1 502 (3.4) 12.5 (11.4) 8.2 [3.0-14.8] 1.6 / 64.1
Milk and milk products 10 (0.1) 213.8 (218.2) 153.2 [81.3-265.1] 12.3 / 1,066 13 (0.1) 241.0 (211.5) 190.1 [108.7-304.0] 19.9 / 1,037
High-fat dairy products 359 (3.9) 101.9 (164.4) 51.6 [12.8-128.7] 0.1/ 753.0 519 (3.5) 104.5 (146.9) 57.3 [12.8-150.3] 0.1 / 665.8
Low-fat dairy products 3,484 (37.8) 126.2(193.8) 53.4[12.3-158.2] 1.2 / 912.3 3,647 (24.7) 141.8 (197.8) 74.8 [21.4-176.7] 1.2 / 907.0
High-fat cheese 515 (5.6) 33.3 (27.6) 30.7 [13.2-39.2] 0.4 / 122.5 952 (6.4) 28.5 (23.2) 26.2 [11.6-36.9] 0.2 / 107.5
Low-fat cheese 6,687 (72.5) 20.4 (22.6) 12.5 [4.8-28.9] 0.3 / 99.4 9,374 (63.4) 18.0 (17.9) 12.5 [5.0-26.5] 0.3 / 78.2
Legumes 22 (0.2) 28.9 (23.2) 23.3 [11.6-40.0] 2.1 / 106.2 62 (0.4) 19.3 (15.7) 14.6 [8.1-27.0] 1.1 / 72.2
Daily consumption is expressed in grams per day; Abbreviations: IQR, interquartile range; p, percentile; SD, standard deviation; tMED, traditional Mediterranean diet score

Results | 35
As shown in Table 10, the proportion of non-consumers is very low at the individual
components, but for some food groups (garlic, grain flakes, cornflakes and low-fat cheese)
it exceeds 50%, particularly in men. Additionally, the intakes of some food groups were
very low (median ≤10 g/day), such as nuts, mushrooms, cabbage, garlic, grain flakes,
cornflakes and poultry (women).
In Table 11 the contents and sources of the two remaining macronutrient components of
the tMED (alcohol and fat-ratio) are shown. Among consumers, the main source of fat
(disregarding indirect sources such as meat) is margarine, while the intakes of vegetable
and other fats (including olive oil) are negligible. Regarding alcoholic beverages, beer is
consumed in higher amounts by men when compared to women, while the consumption
of wine is more common in women than beer but is in a comparable range for both sexes.
Both beer and wine represent the main source of daily ethanol intake (~80%).

Results | 36
Table 11: Daily Consumption of Components of the Traditional Mediterranean Diet Score and its Subgroups and Main Sources among Men and Women (n=24,008)
TMED COMPONENT
SOURCE
MEN (N=9,225) WOMEN (N=14,783) NON-CONSUMERS CONSUMERS NON-CONSUMERS CONSUMERS N (%) MEAN (SD) MEDIAN [IQR] 1ST P / 99TH P N (%) MEAN (SD) MEDIAN [IQR] 1ST P / 99TH P
Fat-ratio ─ 0.87 (0.11) 0.86 [0.79-0.94] 0.65 / 1.17 ─ 0.84 (0.11) 0.84 [0.77-0.90] 0.63 / 1.15
Monounsaturated fat ─ 33.3 (11.5) 31.4 [25.1-39.3] 14.0 / 68.9 ─ 25.5 (8.7) 24.2 [19.3-30.2] 10.8 / 51.8
Polyunsaturated fat ─ 16.6 (6.3) 15.5 [12.2-19.8] 6.6 / 37.3 ─ 13.3 (5.0) 12.4 [9.7-15.9] 5.2 / 28.8
Saturated fat ─ 38.9 (14.3) 36.6 [28.6-46.6] 15.5 / 84.1 ─ 30.8 (11.4) 29.1 [22.6-36.9] 12.1 / 65.6
Butter 1,418 (15.4) 12.4 (15.0) 6.1 [1.4-20.0] 0.1 / 70.2 1,904 (12.9) 9.0 (11.3) 4.3 [1.2-11.5] 0.1 / 52.5 Margarine 990 (10.7) 20.2 (16.7) 20.0 [7.1-30.3] 0.2 / 72.3 1,555 (10.5) 15.8 (13.3) 11.3 [5.3-20.9] 0.2 / 56.4 Vegetable fat 709 (7.7) 3.26 (3.04) 2.51 [1.25-4.33] 0.08 / 14.46 768 (5.2) 3.83 (3.44) 2.99 [1.56-4.99] 0.14 / 16.69 Other fat 7,037 (76.3) 1.45 (1.17) 1.17 [0.55-2.08] 0.04 / 5.20 11,931 (80.7) 1.18 (0.90) 0.98 [0.54-1.58] 0.05 / 4.14
Ethanol 286 (3.1) 23.3 (21.7) 18.3 [8.3-31.7] 0.4 / 91.9 387 (2.6) 8.6 (10.6) 5.3 [2.1-10.5] 0.2 / 50.2
Beer 686 (7.4) 422 (478) 356 [82-500] 4.1 / 2,000 5,801 (39.2) 77.6 (153.8) 20.5 [8.2-71.2] 4.1 / 712.3
Wine 1,551 (16.8) 60.4 (107.4) 20.5 [8.2-71.2] 2.1 / 500 1,244 (8.4) 57.9 (88.2) 35.6 [8.2-71.2] 2.1 /500
Spirits 1,810 (19.6) 6.3 (14.0) 2.8 [0.7-5.7] 0.2 / 60 7.123 (48.2) 2.1 (5.1) 0.3 [0.3-1.6] 0.1 /21.4
Other 1,383 (15.0) 13.0 (20.7) 6.6 [2.5-16.4] 0.8 / 95.9 916 (6.2) 15.1 (24.7) 8.2 [3.3-17.3] 0.8 / 106.8
Daily consumption is expressed in grams per day, except for the fat-ratio which has no measurement unit; Abbreviations: IQR, interquartile range; p, percentile; SD, standard deviation; tMED, traditional Mediterranean diet score

Results | 37
Table 12 depicts the distribution of each score component according to categories of
adherence to the Mediterranean-style diet.
Table 12: Daily Intake of Score Components across the Traditional Mediterranean Diet Score
using Greek Cut-points
TMED
CHARACTERISTICS 0-2 3-4 ≥ 5
n (cases) 4,272 (38) 15,197 (142) 4,539 (29)
Total energy intake, MJ/d 8,990 (36) 9,108 (19) 9,023 (35)
Scored Components
Alcohol intake, g/d
# 13.2 (0.2) 15.6 (0.1) 17.4 (0.2)
Moderate*, % 14.9 48.4 86.6
Fruits and nuts intake, g/d# 127 (1.4) 139 (0.8) 160 (1.4)
≥ Greek Median, % 0.6 2.7 9.2
Vegetable intake, g/d# 92.8 (0.8) 98.9 (0.4 ) 104.4 (0.8)
≥ Greek Median, % 0.0 0.1 0.2
Cereals intake, g/d# 178 (1.1) 208 (0.6) 223 (1.1)
≥ Greek Median, % 43.2 73.5 92.6
Fish intake, g/d# 15.6 (0.4) 23.7 (0.2) 34.2 (0.4)
≥ Greek Median, % 12.9 40.7 78.5
Legumes intake, g/d# 18.4 (0.3) 24.5 (0.2) 27.0 (0.3)
≥ Greek Median, % 56.2 84.4 96.4
Fat-ratio# 0.84 (0.0) 0.86 (0.0) 0.87 (0.0)
≥ Greek Median, % 0.0 0.0 0.1
Meat intake, g/d# 131.0 (0.9) 122.7 (0.5) 104.7 (0.9)
< Greek Median, % 29.7 46.6 70.1
Milk products intake, g/d# 316 (3.2) 223 (1.7) 160 (3.1)
< Greek Median, % 24.3 55.2 82.0
# intakes are expressed as age- and sex-adjusted mean (standard error) or percentages; Greek medians are used for score building: fruits: men= 362.5 g, women= 356.3 g; vegetables: men= 549.9 g, women= 499.6 g; cereals: men= 177.7 g, women= 139.7 g; legumes: men= 9.1 g, women= 6.7 g; fish: men= 23.7 g, women= 18.8 g; ratio of monounsaturated to saturated fat: men= 1.72, women= 1.74; meat products: men= 120.8, women= 89.8; milk products: men= 196.7, women= 191.1. * low: men <10g/d, women <5 g/d; moderate: men ≥10 g/d – 50 g/d, women ≥ 5g/d – 25 g/d; high: men >50 g/d, women > 25 g/d Abbreviation: tMED, traditional Mediterranean diet score
The contribution to the overall score differs for individual food groups. The components
fat-ratio, vegetables and fruits and nuts counted towards zero to the overall score because
very few persons consumed amounts higher than the Greek medians (fat-ratio:
men=0.01%, women=0.03%; vegetables: men=0.04%, women=0.1% and fruits and nuts:
men=2.5%, women=4.3%). On the other hand many persons received points for
components like legumes, milk and milk products and cereals even in the lowest category
of adherence (persons who received a point for legumes: men=83%, women=81%,
cereals: men=73%, women=71% and milk products: men=61%, women=50%).
Nevertheless, age- and sex-adjusted mean intakes of fruits and nuts, vegetables and the

Results | 38
fat-ratio showed slightly higher mean intakes in the highest adherence group compared to
the lowest. This was also true for meat and meat products (overall 41% of men and 53%
of women received a point), which is in contrast to the first analyses that used median
intakes of EPIC-Potsdam study participants (see Appendix VIII). The number of persons
achieving one point was moderate regarding high fish intakes (men=43%, women=44%)
and moderate alcohol consumption (men=57%, women=44%).
Demographics, Lifestyle, and Health status
The distribution of non-dietary parameters according to categories of adherence to the
Mediterranean-style diet is shown in Table 13. Persons with scorings equal to or above
five points were more likely to be male, non-smokers and had a higher educational
attainment. Regarding prevalent diseases, the proportion of diabetics was slightly lower in
the highest adherence group, while hypertension and hyperlipidemia were equally
distributed across the categories.
Table 13: Baseline Characteristics of Study Participants (n= 24,008) According to Achieved Points in
the Traditional Mediterranean Diet Score
TMED
CHARACTERISTICS 0-2 3-4 5-7
n (cases) 4,272 (38) 15,197 (142) 4,539 (29)
Gender, % female 66.6 61.2 57.0
Age, mean, years 49.5 (8.8) 50.0 (8.8) 50.3 (8.8)
Body mass index, kg/m2 26.3 (0.1) 26.3 (0.0) 26.0 (0.1)
Waist circumference, cm
Men 94.8 (0.3) 94.6 (0.1) 94.1 (0.2)
Women 80.5 (0.2) 80.5 (0.1) 79.8 (0.2)
University Degree, % 34.7 40.0 45.1
Current smoking, % 24.3 21.3 20.2
Physical activity, hours/week 2.52 (0.1) 2.79 (0.0) 2.98 (0.1)
Medical History, %
Prevalent hypertension 45.5 46.8 45.9
Prevalent diabetes 5.8 4.5 3.4
Prevalent hyperlipidemia 27.5 27.4 26.5 Baseline characteristics are expressed as age- and sex-adjusted mean (standard error) or percentages, age and sex are unadjusted means (standard deviation) or percentages, respectively. Abbreviation: tMED, traditional Mediterranean diet score

Results | 39
3.2 The Mediterranean Diet, its Components and the Risk of Heart Failure
3.2.1 Dietary Pattern Analysis
Association between the Mediterranean Diet and Heart Failure Risk
Table 14 shows prospective associations between the adherence to the Mediterranean-
style diet and the risk of developing HF. Persons who were assigned a tMED score of 5 or
more points had an about 40% decreased risk to develop HF compared to participants
with zero to two points. However, this association was attenuated after adjustment for
smoking, education and physical activity. Adjustment for potential mediators (model 3)
further weakened the diet-disease relationship.
Table 14: Association between the Adherence to the Mediterranean Diet and the Risk of Heart Failure
TMED
0-2 3-4 5-7
per 2 units
n (cases) 4,272 (38) 15,197 (142) 4,539 (29)
Person-years 35,310 125,266 37,458
HR HR (95%CI) HR (95%CI) ptrend HR (95%CI)
Model 1 1 0.95 (0.67-1.37) 0.59 (0.36-0.96) 0.03 0.76 (0.60-0.97)
Model 2 1 0.99 (0.69-1.41) 0.63 (0.39-1.02) 0.06 0.80 (0.62-1.02)
Model 3 1 1.00 (0.70-1.43) 0.66 (0.41-1.08) 0.10 0.82 (0.64-1.05)
Model 1: adjusted for sex and energy intake, stratified for age; Model 2: further adjusted for lifestyle (smoking, education, physical activity); Model 3: further adjusted for anthropometry (BMI and waist circumference) and prevalent comorbidities (diabetes, hypertension and hyperlipidemia) Abbreviations: CI, confidence interval; HR, hazard ratio; tMED, traditional Mediterranean diet score
Analyses performed using the third tertile of the study-specific intakes or using cut-points
suggested by Sofi et al.67 (Appendix XI) to define adherence to the Mediterranean diet did
not show a diet-disease association.
Sensitivity analyses that took into account the problem of reverse causality (exclusion of
either cases that occurred within the first two years of follow-up, or persons that reported a
dietary change during the year preceding recruitment) yielded minor attenuations of the
association but did not change the results substantially (data not shown). The exclusion of
probable and possible cases, however, attenuated the association (HRs and 95% CIS
across categories: 1 (reference), 1.04 (0.64-1.71), 0.78 (0.42-1.47), ptrend=0.43). No
significant interaction was observed between tMED scoring and various risk factors (all p
values >0.3)

Results | 40
Selection of Relevant Components for Further Analysis
To choose potentially relevant score components, three approaches were conducted:
First, for each single component HRs and 95% CIs of HF were calculated for persons who
received a point compared to those who did not. Results are outlined in Table 15. This
analysis led to significant inverse associations with HF risk only by moderate alcohol
consumption and low meat intake after multivariable adjustment.
Table 15: Association between the Adherence to Individual Traditional Mediterranean Diet Score
Components and the Risk of Heart Failure
MODEL 1 MODEL 2
<Median intake ≥Median intake <Median intake ≥Median intake
Score component HR HR (95%CI) HR HR (95%CI)
Alcohol* 1 0.67 (0.51-0.89) 1 0.73 (0.55-0.97)
Fish 1 0.88 (0.67-1.17) 1 0.86 (0.65-1.14)
Vegetables# 1 n.e. 1 n.e.
Fruits and nuts 1 0.86 (0.38-1.96) 1 0.97 (0.43-2.21)
Cereals 1 0.96 (0.70-1.31) 1 0.99 (0.73-1.36)
Legumes 1 1.18 (0.80-1.75) 1 1.09 (0.73-1.62)
Fat-ratio# 1 n.e. 1 n.e.
Milk products 1.23 (0.92-1.65) 1 1.18 (0.88-1.58) 1
Meat products 0.64 (0.47-0.86) 1 0.72 (0.54-0.98) 1
Model 1: Adjusted for sex and total energy intake, stratified by age; Model 2: Further adjusted for education, smoking, physical activity, BMI, waist circumference, comorbidities (diabetes, hyperlipidemia, hypertension) and all other tMED components; * in case of alcohol consumption, moderate consumption (women: 5-25g/d, men=10-50g/d) was compared to non-moderate consumption (including low and high intakes) # the number of participants who received a point was too low to calculate risk estimates Abbreviation: BMI, body mass index; CI, conficence interval; HR, hazard ratio; n.e., not evaluable
A second approach was the performance of restricted cubic spline Cox regression
analysis for intakes of all score components on a continuous scale to investigate the
shape of the association to HF risk. This analysis identified two relevant components: fish
and ethanol intake, both showing significant inverse linear associations with HF risk
(Figure 9). On the other hand, meat intake was positively associated with HF risk.
However, this association lost statistical significance after adjustment for comorbidities
(model 3). Graphs of all remaining score components are provided in Appendix XIV.
The third method to derive potentially relevant food groups of the tMED, the subtraction
method according to Trichopoulou et al.,99 resulted in minor changes of the overall risk
estimate. The exclusion of e.g. ethanol, meat and meat products, fish shifted the
estimates towards the 1, therefore these food groups contributed to the overall inverse
tendency between the adherence to the Mediterranean-style diet and the risk of HF.
Conversely, factors that shifted the estimates away from the 1 might be not or positively
related to HF risk (e.g. legumes and milk and milk products).

Results | 41
Figure 9: Graphs of Fish Consumption and Ethanol Intake and Heart Failure
Risk Derived by Restricted Cubic Spline Cox Regression Analysis
Restricted cubic spline regression analysis was performed using knots at the 5th, 50th
(reference) and 95th percentile. Hazard ratios and 95% confidence bands (dotted lines) are stratified by age and adjusted for sex, total energy intake, education, smoking, physical activity, BMI, waist circumference, prevalent comorbidities (diabetes, hypertension, hyperlipidemia) and
all remaining tMED score components (continuously). P for nonlinearity was computed by Wald chi-square test. Abbreviations: BMI, body mass index; HR, hazard ratio; tMED, traditional Mediterranean diet

Results | 42
Figure 10: Hazard Ratios and 95% Confidence Intervals for a Two Unit Increment in Mediterranean
Diet Score (tMED) and after Subtracting each of its Components
Hazard ratios and 95% confidence intervals are stratified by age and adjusted for sex, total energy intake, education, smoking, physical activity, body mass index, waist circumference, prevalent comorbidities (diabetes, hypertension, hyperlipidemia) and corresponding subtracted component (dichotomous). The estimated logarithms of the hazard ratios were multiplied by 9/10 before exponentiation to correct for the nine point scale of the overall score
99
The contributions of the individual tMED components to the overall association were
highest for moderate ethanol intake (11.7 %), low meat intake (8.4 %) and high fish intake
(4.6 %) as depicted in Figure 10. Noteworthy, the exclusion of milk products led to a lower
HF risk which was statistically significant even in the multivariable adjusted model.
Based on the results of these different approaches, three components of the tMED were
considered relevant for HF development and selected for further analyses at the level of
food groups, subgroups and nutrients: meat and meat products, fish, and moderate
ethanol intake.

Results | 43
3.2.2 Analysis of Food Groups and Subgroups
To follow the top-down approach, the associations between fish, meat and meat products
and ethanol, and the risk of HF were further analyzed. In terms of meat and meat
products, total meat intake was investigated as well as its subgroups poultry, red meat
and processed meat. For fish, the subgroups canned fish and baked, cooked and fried
fish were examined in addition to total fish intake. As ethanol was already studied on the
level of nutrients, the two major contributors to total ethanol intake have been
investigated, namely beer and wine.
Meat and Meat Products
In general, women had lower meat intakes than men and persons in higher quintiles of
meat consumption were younger than in the lower ones. After adjustment for age and sex,
participants with higher meat intake had generally poorer health conditions: they were
more likely to be overweight, smokers, less physically active and less educated. Besides,
prevalent diabetes and hypertension were more frequently present (data not shown). With
approximately 50%, the food group processed meat contributes most to total meat
consumption. Poultry was consumed in lower amounts in the study population (Table 16).
Table 16: Age- and Sex-adjusted Intakes of Selected Food Groups and Nutrients according to
Quintiles of Total Meat Consumption
QUINTILES OF TOTAL MEAT INTAKE
TOTAL MEAT INTAKE* 1 2 3 4 5
Men [g/d] Women [g/d]
65.7 (19.9) 37.1 (14.0)
105.5 (8.6) 66.4 (6.1)
136.1 (9.3) 86.9 (5.9)
172.6 (12.9) 110.8 (8.8)
256.4 (62.9) 167.4 (41.9)
n (cases) 4801 (27) 4803 (49) 4802 (41) 4800 (42) 4802 (50)
Poultry* 6.3 (6.0) 9.4 (7.8) 12.0 (9.3) 14.5 (11.4) 21.1 (17.8)
Red meat* 18.3 (12.0) 31.0 (14.7) 39.4 (17.7) 49.7 (23.4) 71.2 (38.7)
Processed meat* 23.5 (14.9) 41.0 (17.6) 54.4 (22.4) 70.3 (29.5) 109.4 (58.5)
Total energy, [MJ/d] 7831 (31) 8382 (31) 8852 (31) 9564 (31) 10711 (31)
Intake of tMED Components
Alcohol intake 13.5 (0.2) 14.8 (0.2) 15.4 (0.2) 16.6 (0.2) 17.3 (0.2)
Fruits and nuts intake 146.7 (1.4) 138.7 (1.4) 137.9 (1.4) 137.0 (1.4) 142.7 (1.4)
Vegetable intake 95.4 (0.8) 93.7 (0.8) 96.0 (0.8) 99.7 (0.8) 109.5 (0.8)
Cereals intake 194 (1.1) 198 (1.1) 202 (1.1) 210 (1.1) 224 (1.1)
Fish intake 22.4 (0.4) 22.6 (0.4) 23.5 (0.4) 25.2 (0.4) 27.7 (0.4)
Legumes intake 19.7 (0.3) 21.8 (0.3) 23.7 (0.3) 25.8 (0.3) 28.8 (0.3)
Fat-ratio 0.82 (0.00) 0.84 (0.00) 0.85 (0.00) 0.87 (0.00) 0.89 (0.00)
Milk products intake 254 (3.1) 230 (3.1) 218 (3.1) 219 (3.1) 215 (3.1) Intakes are expressed as age- and sex-adjusted means (standard error) and shown in grams per day (or as otherwise indicated). The fat-ratio is the ratio between monounsaturated and saturated fat and has no unit. * Meat subgroups are presented as unadjusted means (standard deviation) Abbreviations: tMED, traditional Mediterranean diet score

Results | 44
As outlined in Table 16, total energy intake and the intakes of most other score
components were positively associated with total meat intake. One exception was the
group milk and milk products that showed lower intakes with higher intakes of meat.
In Table 17, associations between intakes of total meat and meat subgroups and the risk
of HF are shown. Total meat intake was positively associated with HF risk after
multivariable adjustment.
Table 17: Associations between the Consumption of Total Meat and Different Meat sources and the
Risk of Heart Failure
QUINTILES OF MEAT INTAKE
TOTAL MEAT 1 3 5
Men [g/d] Women [g/d]
65.7 (19.9) 37.1 (14.0)
136.1 (9.3) 86.9 (5.9)
256.4 (62.9) 167.4 (41.9)
Person-years 39,754 39,693 39,510
n (cases) 4801 (27) 4802 (41) 4802 (50)
HR HR (95%CI) HR (95%CI) ptrend
Model 1 1 1.67 (1.02-2.72) 3.04 (1.83-5.07) <.01
Model 2 1 1.60 (0.97-2.63) 2.50 (1.44-4.33) <.01
Model 3 1 1.40 (0.85-2.31) 2.04 (1.17-3.55) 0.01
POULTRY 1 3 5
Men [g/d] Women [g/d]
2.5 (1.3) 2.0 (1.0)
10.8 (1.6) 8.2 (1.2)
36.2 (15.0) 28.4 (13.1)
n (cases) 4,825 (40) 4,803 (39) 4,794 (42)
HR HR (95%CI) HR (95%CI) ptrend
Model 1 1 1.02 (0.66-1.59) 1.16 (0.75-1.79) 0.69
Model 2* 1 1.01 (0.65-1.58) 1.10 (0.69-1.75) 0.80
Model 3* 1 1.03 (0.66-1.61) 1.07 (0.67-1.71) 0.93
RED MEAT 1 3 5
Men [g/d] Women [g/d]
17.6 (7.2) 9.5 (3.9)
46.9 (4.1) 30.3 (2.8)
107.4 (32.6) 69.5 (21.2)
n (cases) 4,801 (35) 4,801 (46) 4,802 (48)
HR HR (95%CI) HR (95%CI) ptrend
Model 1 1 1.35 (0.87-2.10) 1.54 (0.99-2.42) <.01
Model 2* 1 1.20 (0.77-1.89) 1.15 (0.71-1.86) 0.18
Model 3* 1 1.14 (0.73-1.78) 1.01 (0.62-1.64) 0.42
PROCESSED MEAT 1 3 5
Men [g/d] Women [g/d]
26.6 (10.7) 13.3 (6.3)
66.3 (6.9) 42.9 (3.2)
157.7 (52.1) 98.5 (35.3)
n (cases) 4,801 (37) 4,801 (42) 4,802 (49)
HR HR (95%CI) HR (95%CI) ptrend
Model 1 1 1.24 (0.79-1.93) 2.12 (1.33-3.37) <.01
Model 2* 1 1.14 (0.72-1.81) 1.82 (1.09-3.03) <.05
Model 3* 1 1.05 (0.67-1.66) 1.56 (0.93-2.61) 0.16
Model 1: stratified by age, adjusted for sex and energy intake; Model 2: further adjusted for education, smoking, physical activity and all remaining score components (continuously) like listed in Table 16; Model 3: further adjusted for anthropometry (BMI and waist circumference) and prevalent comorbidities (diabetes, hypertension and hyperlipidemia); * the adjustment set includes each of the other two meat subgroups (continuously); for simplicity reasons only quintiles 1, 3 and 5 are shown. Abbreviations: HR, hazard ratio; CI, confidence interval

Results | 45
Analyses based on different meat sources showed significant positive associations only
for the food groups red meat and processed meat. However, after adjusting for lifestyle
factors and the prevalence of comorbidities the associations were no longer significant for
both red meat and processed meat.
To better account for the higher consumption of processed meat, a sensitivity analysis
was performed with standardized portion sizes for all meat subgroups (Table 18).
Although not significant, in this analysis higher risk estimates were observed per each 50g
of poultry consumption. Nevertheless, the results of total and processed meat
consumption were similar and statistically significant in models 1 and 2, whereas the
association between red meat consumption and HF risk was only present in the basic
adjustment model.
Table 18: Hazard Ratios per Portion Sizes of Different Meat Sources
MODEL 1 MODEL 2 MODEL 3
HR (95% CI) HR (95% CI) HR (95% CI)
Total meat (per 50g) 1.25 (1.12-1.40) 1.16 (1.02-1.32) 1.09 (0.95-1.24)
Poultry (per 50g) 1.48 (0.92-2.37) 1.40 (0.85-2.32)# 1.27 (0.78-2.08)
#
Red meat (per 50g) 1.31 (1.06-1.63) 1.07 (0.85-1.36) # 1.00 (0.79-1.27)
#
Processed meat (per 50g) 1.26 (1.09-1.46) 1.18 (1.00-1.39) # 1.12 (0.94-1.32)
#
Model 1: stratified by age, adjusted for sex and energy intake; Model 2: further adjusted for education, smoking, physical activity and all remaining score components (continuously) like listed in Table 16; Model 3: further adjusted for anthropometry (BMI and waist circumference) and prevalent comorbidities (diabetes, hypertension and hyperlipidemia); # the adjustment set includes each of the other two meat subgroups (continuously) Abbreviations: HR, hazard ratio; CI, confidence interval
In a further analysis, it was investigated whether the association between total meat intake
and HF risk was depending on the individual meat subgroups. Therefore, meat
consumption was investigated by subtracting alternately each of the three subgroups. The
exclusion of red meat and poultry resulted in slightly attenuated risk estimates of HF
across quintiles of total meat intake that, however, remained significant in the higher
intake group. On the other hand, the exclusion of processed meat attenuated the
association and lost its statistical significance across all quintiles (Figure 11).

Results | 46
Figure 11: Association between Total Meat Intake and the Risk of Heart Failure and after Subtracting
each of the Meat Subgroups
Hazard ratios and 95% confidence intervals are stratified for age and adjusted for sex, total energy intake, education,
smoking, physical activity, body mass index, waist circumference, comorbidities (diabetes, hypertension,
hyperlipidemia), and other score components including the subtracted food group (continuously).
Abbreviation: HR, hazard ratio
Overall, total meat intake was associated with an increased risk of HF, but this association
seemed to be mainly driven by the intake of processed meat, the main contributor to total
meat consumption in EPIC-Potsdam.
Furthermore, the intakes of animal protein, cholesterol, iron and SFAs were selected in
the context of the top-down approach to further investigate the association with HF risk at
the level of macro- and micronutrients (see Chapter 3.2.3). These nutrients are the main
representatives of meat consumption and may be responsible for the risk-increase of HF
due to total meat consumption.

Results | 47
Alcoholic Beverages
Beer and wine were the main contributors of total ethanol consumption in the EPIC-
Potsdam cohort (Figure 12)
Figure 12: Percentage of Total Ethanol Intake by Alcoholic Beverages in EPIC-Potsdam
Percentages are approximates and calculated from mean intake values of the total EPIC-Potsdam cohort (n=24,008). Beer was equivalent to 4g ethanol/100ml, wine: 9g ethanol/100ml, spirits: 32g ethanol/100ml and other alcoholic beverages: 5-24g ethanol/100ml according to the German Nutrient Data Base
94
Abbreviation: EPIC, European Prospective Investigation into Cancer and Nutrition
Baseline characteristics according to beer and wine intakes differed substantially: Wine
intake was associated to a more prudent lifestyle (less smoking, more physical activity), a
higher education and a lower presence of overweight and prevalent diseases. However, in
the highest intake group there were more smokers and diabetics compared to the second
highest group. Furthermore, with higher consumptions of wine a more ‘healthy’ diet was
present (Appendix XV and Appendix XVI). On the contrary, beer consumption was
associated with a less favorable risk profile, especially in men: a lower physical activity,
more overweight, more prevalent diseases and a higher consumption of meat with
simultaneously lower intake of fruits. With higher intakes of beer, more current smoking
was present, but the non-consumers smoked most. These were also more often diabetics
(Appendix XVII and Appendix XVIII).
Tables 19 and 20 show the associations between wine and beer consumption and the risk
of HF in men and women.
In men, the consumption of both wine and beer was significantly associated with a
decreased risk of HF (Table 19). This was more pronounced in case of wine intake but
followed a U-shaped tendency, while the association appeared linear with beer
consumption. For women, results showed the same tendency but were less pronounced
than in men and did not reach statistical significance (Table 20).
Beer 52%
Wine 34%
Spirits 6%
Others 8%

Results | 48
Table 19: Association between Intakes of Wine and Beer and the Risk of Heart Failure in Men
CATEGORIES OF INTAKE*
WINE 1 2 3 4 5
Intake, ml 0 1-<35.7* 35.7*-<125 125-<250 ≥ 250
n (cases) 1,511 (40) 4,491 (69) 2,243 (13) 542 (2) 398 (6)
Person-years 12,299 37,046 18,773 4,448 3,236
HR (95%CI) HR HR (95%CI) HR (95%CI) HR (95%CI) ptrend pnonlin
Model 1 1.61 (1.09-2.38) 1 0.38 (0.21-0.69) 0.27 (0.07-1.09) 1.10 (0.47-2.55) <.01 <.01
Model 2 1.35 (0.90-2.03) 1 0.42 (0.23-0.76) 0.29 (0.07-1.17) 1.13 (0.48-2.65) <.01 0.01
Model 3 1.27 (0.85-1.91) 1 0.42 (0.23-0.76) 0.28 (0.07-1.15) 1.20 (0.51-2.84) <.01 0.03
BEER 1 2 3 4 5
Intake, ml 0 1-<250 250-<500 500-<1000 ≥1000
n (cases) 686 (13) 4,155 (62) 1,270 (19) 1,643 (23) 1,471 (13)
Person-years 5,444 34,280 10,526 13,572 11,981
HR (95%CI) HR HR (95%CI) HR (95%CI) HR (95%CI) ptrend pnonlin
Model 1 1.32 (0.72-2.40) 1 1.13 (0.67-1.89) 0.97 (0.60-1.57) 0.66 (0.36-1.21) 0.15 0.77
Model 2 0.99 (0.54-1.82) 1 1.11 (0.66-1.88) 0.89 (0.55-1.46) 0.53 (0.28-1.00) 0.10 0.47
Model 3 0.94 (0.51-1.74) 1 1.10 (0.66-1.86) 0.86 (0.52-1.41) 0.45 (0.24-0.86) 0.04 0.39 Model 1: stratified by age, adjusted for energy intake; Model 2: further adjusted for education, smoking, physical activity and the remaining score components (continuously) including ethanol from other alcoholic beverages, Model 3: further adjusted for BMI, waist circumference and prevalent comorbidities (diabetes, hypertension and hyperlipidemia), pnonlin was calculated by restricted cubic spline Cox regression analyses (Wald chi-square test) with continuous intake of the respective alcoholic beverage (g/d) and 3 knots (5th, 50th (ref) and 95th percentile); * Categories of intakes based on standard portion sizes in Germany (wine=250ml, beer=500ml), 35.7ml of wine reflect an intake of one glass per week Abbreviations: BMI, body mass index; CI, confidence interval; HR, hazard ratio; pnonlin, p value for nonlinearity; SD, standard deviation

Results | 49
Table 20: Association between Intakes of Wine and Beer and the Risk of Heart Failure in Women
CATEGORIES OF INTAKE*
WINE 1 2 3 4 5
Intake, ml 0 1-<35.7* 35.7*-<125 125-<250 ≥ 250
n (cases) 1,244 (13) 7,624 (44) 4,325 (18) 966 (2) 624 (2)
Person-years 10,003 63,215 35,891 8,022 5,100
HR (95%CI) HR HR (95%CI) HR (95%CI) HR (95%CI) ptrend pnonlin
Model 1 1.45 (0.78-2.71) 1 0.81 (0.47-1.41) 0.50 (0.12-2.08) 0.68 (0.16-2.84) 0.08 0.20
Model 2 1.41 (0.75-2.65) 1 0.83 (0.48-1.46) 0.54 (0.13-2.26) 0.70 (0.17-2.97) 0.12 0.26
Model 3 1.02 (0.53-1.96) 1 0.87 (0.50-1.53) 0.56 (0.13-2.36) 0.67 (0.16-2.88) 0.37 0.58
BEER 1 2 3 4
Intake, ml 0 1-<125 125-<250 ≥250
n (cases) 5,801 (40) 7,469 (34) 845 (3) 668 (2)
Person-years 47,503 62,170 7,020 5,538
HR (95%CI) HR HR (95%CI) HR (95%CI) ptrend pnonlin
Model 1 1.35 (0.85-2.15) 1 0.88 (0.27-2.87) 0.81 (0.19-3.39) 0.18 <.05
Model 2 1.27 (0.79-2.04) 1 0.87 (0.26-2.84) 0.71 (0.17-3.01) 0.22 0.09
Model 3 1.04 (0.64-1.68) 1 0.91 (0.27-2.99) 0.71 (0.17-3.04) 0.62 0.37 Model 1: stratified by age, adjusted for energy intake; Model 2: further adjusted for education, smoking, physical activity and the remaining score components (continuously) including ethanol from other alcoholic beverages, Model 3: further adjusted for BMI, waist circumference and prevalent comorbidities (diabetes, hypertension and hyperlipidemia), pnonlin was calculated by restricted cubic spline Cox regression analyses (Wald chi-square test) with continuous intake of the respective alcoholic beverage (g/d) and 3 knots (5th, 50th (ref) and 95th percentile); * Categories of intakes based on standard portion sizes in Germany (wine=250ml, beer=500ml), 35.7ml of wine reflect an intake of one glass per week Abbreviations: BMI, body mass index; CI, confidence interval; HR, hazard ratio; pnonlin, p value for nonlinearity; SD, standard deviation

Results | 50
To sum up, a lower HF risks was observed in relation to beer (linear relationship) and
wine (U-shaped relationship) consumption. Components of wine (polyphenols) other than
ethanol might explain the observed protective effects on HF risk. However, it was not
possible to test this hypothesis as the dietary assessment did not allow the differentiation
between white and red wine.
Fish
The consumption of fish was related to a slightly more unfavorable HF risk profile. The
proportion of current smokers and persons with overweight and prevalent diseases
(diabetes, hypertension and hyperlipidemia) was higher among participants of the highest
group of consumption compared to the lowest. However, persons within the fifth quintile of
fish consumption were more physically active and more educated compared to
participants in quintile 1 (data not shown). The intakes of all score components showed a
positive association with fish intake (Table 21).
Table 21: Age- and Sex-adjusted Baseline Characteristics according to Quintiles of Fish Consumption
QUINTILES OF FISH INTAKE
FISH INTAKE 1 2 3 4 5
Men [g/d]
Women [g/d]
5.0 (3.1)
3.0 (1.6)
14.7 (2.4)
10.3 (1.9)
22.3 (2.2)
16.9 (1.6)
31.7 (3.2)
25.1 (2.8)
66.3 (43.1)
50.4 (31.1)
n (cases) 5,084 (48) 4,609 (40) 4,786 (39) 4.824 (51) 4,705 (31)
Canned fish 1.7 (2.0) 5.1 (4.1) 6.6 (4.8) 11.2 (6.1) 29.6 (34.8)
Baked, cooked and fried fish 2.1 (1.6) 6.9 (4.4) 12.4 (5.3) 16.4 (6.0) 27.0 (17.4)
Total energy intake, MJ/d 8,484 (32) 8,761 (34) 8,909 (33) 9,315 (33) 9,928 (33)
Medical History, %
Prevalent hypertension 45.6 45.3 46.0 47.0 48.2
Prevalent diabetes 4.3 4.7 4.1 4.6 4.9
Prevalent hyperlipidemia 26.5 27.5 27.0 27.4 27.8
Intake of tMED Components
Alcoholic intake 13.9 (0.2) 15.0 (0.2) 15.3 (0.2) 16.4 (0.2) 17.2 (0.2)
Fruits and nuts intake 131 (1.3) 137 (1.4) 140 (1.4) 145 (1.4) 152 (1.4)
Vegetable intake 89.3 (0.7) 94.9 (0.8) 98.3 (0.8) 102.5 (0.8) 110.1 (0.8)
Cereal intake 205 (1.0) 205 (1.1) 203 (1.1) 206 (1.1) 210 (1.1)
Meat intake 113 (0.8) 115 (0.9) 120 (0.8) 125 (0.8) 131 (0.9)
Legumes intake 21.2 (0.3) 22.5 (0.3) 23.5 (0.3) 25.8 (0.3) 26.9 (0.3)
Fat-ratio 0.84 (0.00) 0.84 (0.00) 0.85 (0.00) 0.86 (0.00) 0.89 (0.00)
Milk products intake 206 (3.0) 220 (3.2) 221 (3.1) 233 (3.1) 258 (3.1) Baseline characteristics are expressed as age- and sex-adjusted mean (standard error) or percentages, age and sex are unadjusted means (standard deviation) or percentages, respectively. The fat-ratio is the ratio between monounsaturated and saturated fat and has no unit. * Fish subgroups are presented as unadjusted means (standard deviation) Abbreviations: tMED, traditional Mediterranean diet

Results | 51
The contribution of baked, cooked and fried fish to total fish intake was slightly higher
compared to canned fish. The relation between the consumptions of total fish and the fish
subgroups to the risk of HF is shown in Table 22. High fish intake was associated with
lower HF risk. This association did not reach statistical significance across categories of
total fish and baked, cooked and fried fish, but for canned fish in model 3.
Table 22: Association between Fish Intake and the Risk of Heart Failure
QUINTILES OF FISH INTAKE
TOTAL FISH 1 3 5
Men, mean (SD), [g/d]
Women, mean (SD), [g/d]
5.0 (3.1)
3.0 (1.6)
22.3 (2.2)
16.9 (1.6)
66.3 (43.1)
50.4 (31.1)
n (cases) 5,084 (48) 4,786 (39) 4,705 (31)
Person-years 41,725 39,568 38,812
HR HR (95%CI) HR (95%CI) ptrend
Model 1 1 0.81 (0.53-1.25) 0.62 (0.39-0.99) 0.14
Model 2 1 0.83 (0.54-1.28) 0.63 (0.39-1.01) 0.17
Model 3 1 0.84 (0.55-1.29) 0.59 (0.36-0.95) 0.11
CANNED FISH 1 3 5
Men, mean (SD), [g/d]
Women, mean (SD), [g/d]
1.06 (0.68)
1.01 (0.63)
8.07 (0.44)
8.03 (0.46)
39.06 (38.17)
36.57 (33.65)
n (cases) 8,120 (69) 6,453 (62) 3,617 (24)
Person-years 66,480 53,377 29,799
HR HR (95%CI) HR (95%CI) ptrend
Model 1 1 1.02 (0.72-1.45) 0.59 (0.37-0.95) 0.06
Model 2 1 1.04 (0.74-1.48) 0.59 (0.36-0.96) 0.07
Model 3 1 1.04 (0.73-1.48) 0.56 (0.35-0.92) 0.05
BAKED, COOKED AND FRIED FISH 1 3 5
Men, mean (SD), [g/d]
Women, mean (SD), [g/d]
2.11 (1.02)
1.87 (0.89)
14.73 (0.18)
14.64 (0.25)
33.32 (17.01)
31.67 (14.29)
n (cases) 7,306 (60) 7,255 (57) 4,026 (35)
Person-years 60,272 59,964 33,076
HR HR (95%CI) HR (95%CI) ptrend
Model 1 1 0.79 (0.55-1.14) 0.82 (0.53-1.25) 0.43
Model 2 1 0.81 (0.56-1.17) 0.85 (0.55-1.30) 0.48
Model 3 1 0.80 (0.56-1.16) 0.81 (0.52-1.25) 0.32 Model 1: stratified by age, adjusted for sex and energy intake; Model 2: further adjusted for education, smoking, physical activity, and all remaining score components (continuously) like listed in Table 21; Model 3: further adjusted for anthropometry (BMI and waist circumference) and prevalent comorbidities (diabetes, hypertension and hyperlipidemia Abbreviations: DHA, docosahexaenoic acid; EPA, eicosapentaenoic acid and HR, hazard ratio; CI, confidence interval; SD, standard deviation
In summary, these findings support an inverse relationship between fish intake, especially
canned fish, and HF risk, at least at high fish consumptions. To continue the top-down
approach, marine n3FAs (eicosapentaenoic acid (EPA) and docosahexaenoic acid (DHA))
were further investigated and presented in Chapter 3.2.3.

Results | 52
3.2.3 Analyses of Macro- and Micronutrients
In the following chapter the selected components fish and meat and meat products are
examined further regarding their most representative compounds on the level of macro-
and/or micronutrients. The association between ethanol intake and HF risk has already
been presented in Chapter 3.2.1.
Saturated Fatty Acids, Cholesterol, Iron and Animal Protein from Meat
To continue the top-down approach with main representatives of meat and meat products,
animal protein, cholesterol, iron and SFAs were selected to further investigate the
association to HF risk on the level of macro- and micronutrients, because of their high
content in meat and the potential of these nutrients to influence the overall HF risk-
increasing effect of total meat consumption demonstrated in Chapter 3.2.1.
Intakes of nutrients exclusively derived from meat were highly correlated with each other
(Table 23, upper part). Total meat intake and animal protein from meat were nearly
perfectly direct correlated (partial Spearman r = 0.99). Regarding total nutrient intakes,
correlations were lower (Table 23, lower part). Analyses on nutrient level were, therefore,
investigated for total intake and source-specific intakes of the respective nutrient, to be
less prone to the problem of multicollinearity.
Table 23: Crude and Partial Spearman Correlation Coefficients for Nutrients from Meat and from the
Whole Diet
NUTRIENT / FOOD
GROUP SFA* Cholesterol
* Iron
*
Animal
protein*
Total meat Poultry
Red meat
Proc. meat
SFA* 0.90 0.84 0.88 0.92 0.29 0.51 0.90
Cholesterol* 0.91 0.91 0.97 0.97 0.47 0.71 0.76
Iron* 0.87 0.93 0.86 0.87 0.33 0.64 0.72
Animal protein* 0.90 0.97 0.89 0.99 0.48 0.74 0.76
Total meat 0.93 0.97 0.89 0.99 0.45 0.71 0.80 Poultry 0.31 0.46 0.35 0.49 0.46 0.38 0.13 Red meat 0.58 0.75 0.69 0.77 0.75 0.40 0.27 Processed meat 0.92 0.79 0.75 0.79 0.83 0.17 0.36
NUTRIENT / FOOD
GROUP SFA# Cholesterol
# Iron
#
Animal
protein#
Total meat Poultry
Red meat
Proc. meat
SFA# 0.83 0.59 0.67 0.45 0.14 0.28 0.42
Cholesterol# 0.84 0.60 0.74 0.56 0.28 0.44 0.44
Iron# 0.63 0.64 0.63 0.49 0.24 0.32 0.41
Animal protein# 0.70 0.76 0.67 0.69 0.38 0.48 0.54
Total meat 0.51 0.62 0.55 0.73 0.45 0.71 0.80 Poultry 0.17 0.30 0.26 0.40 0.46 0.38 0.13 Red meat 0.35 0.49 0.40 0.54 0.75 0.40 0.27 Processed meat 0.49 0.50 0.48 0.60 0.83 0.17 0.36 Values are all significant (<.01) and expressed as crude Spearman correlation coefficients (highlighted in blue), and partial Spearman correlation coefficients (adjusted for age and sex); * only nutrients from meat are shown; # Total nutrients from all food sources are shown Abbreviation: SFA, saturated fatty acid

Results | 53
Meat contributed to 23-44% to the average overall intakes of SFAs, cholesterol, iron and
animal protein that were present in the EPIC-Potsdam cohort as shown in Figure 13.
Figure 13: Main Contributing Food Sources to Total Intakes of Saturated Fatty Acids, Cholesterol, Iron and Animal Protein in EPIC-Potsdam
Percentages are approximates calculated by multiplying nutrient content of the food group (mg/g or g/g)94
with average food group intake in EPIC-Potsdam (g/d) relative to the average total nutrient amount derived from the whole diet (mg/d or g/d) Abbreviation: SFA, Saturated fatty acid
The associations between the intakes of total SFAs, SFAs from meat and SFAs from
other sources and the risk of HF are depicted in Table 24. All investigated SFA sources
showed significantly positive associations with HF risk across all adjusted models.

Results | 54
Table 24: Relationship between the Intakes of Total Fat and Overall and Meat-Specific Saturated Fatty Acids and the Risk of Heart Failure
QUINTILES OF FAT INTAKE
TOTAL SFAS 1 2 3 4 5
Men, mean (SD), [g/d] Women, mean (SD), [g/d]
22.3 (3.6) 17.5 (2.8)
30.2 (1.8) 23.9 (1.5)
36.6 (1.9) 29.1 (1.5)
44.3 (2.7) 35.1 (2.1)
61.1 (10.9) 48.4 (8.5)
n (cases) 4,810 (36) 4,797 (39) 4,803 (44) 4,797 (47) 4,801 (43)
HR HR (95%CI) HR (95%CI) HR (95%CI) HR (95%CI) ptrend
Model 1 1 1.39 (0.87-2.22) 1.83 (1.12-2.98) 2.42 (1.42-4.12) 3.26 (1.68-6.29) <.01
Model 2 1 1.25 (0.78-2.01) 1.59 (0.96-2.61) 1.96 (1.13-3.41) 2.34 (1.14-4.81) <.01
Model 3 1 1.33 (0.82-2.13) 1.81 (1.09-2.99) 2.39 (1.36-4.20) 2.85 (1.38-5.89) <.01
SFAS FROM MEAT 1 2 3 4 5
Men, mean (SD), [g/d] Women, mean (SD), [g/d]
3.5 (1.2) 1.8 (0.7)
5.8 (0.5) 3.5 (0.4)
7.7 (0.6) 4.7 (0.4)
10.1 (0.8) 6.1 (0.5)
16.0 (4.7) 9.7 (3.1)
n (cases) 4,801 (29) 4,806 (44) 4,798 (42) 4,801 (45) 4,802 (49)
HR HR (95%CI) HR (95%CI) HR (95%CI) HR (95%CI) ptrend
Model 1 1 1.61 (1.01-2.58) 1.60 (0.99-2.59) 1.89 (1.16-3.06) 2.77 (1.67-4.60) <.01
Model 2 1 1.56 (0.97-2.50) 1.47 (0.90-2.38) 1.68 (1.03-2.75) 2.33 (1.39-3.92) <.01
Model 3 1 1.41 (0.88-2.26) 1.27 (0.78-2.06) 1.40 (0.85-2.28) 1.79 (1.06-3.03) 0.06
SFAS FROM OTHER SOURCES 1 2 3 4 5
Men, mean (SD), [g/d] Women, mean (SD), [g/d]
16.0 (2.9) 13.8 (2.4)
22.6 (1.6) 19.4 (1.3)
28.1 (1.6) 23.9 (1.3)
34.7 (2.3) 29.4 (2.0)
49.8 (10.2) 41.8 (8.0)
n (cases) 4,801 (38) 4,802 (45) 4,801 (37) 4,802 (45) 4,802 (44)
HR HR (95%CI) HR (95%CI) HR (95%CI) HR (95%CI) ptrend
Model 1 1 1.30 (0.84-2.03) 1.18 (0.73-1.92) 1.65 (1.00-2.73) 2.00 (1.10-3.65) 0.02
Model 2 1 1.30 (0.83-2.04) 1.18 (0.72-1.95) 1.71 (1.00-2.91) 2.06 (1.06-4.02) 0.04
Model 3 1 1.36 (0.87-2.14) 1.37 (0.83-2.27) 2.11 (1.22-3.64) 2.63 (1.34-5.17) <.01 Model 1: stratified by age, adjusted for sex and energy intake; Model 2: further adjusted for education, smoking, physical activity, and all remaining score components (continuously), except ‘meat and meat products’, ‘milk and milk products’ and the ratio between monounsaturated and saturated fatty acids (milk products were included in analyses of SFA from meat and meat was included in analyses on SFA from other sources); Model 3: further adjusted for anthropometry (BMI and waist circumference), and prevalent comorbidities (diabetes, hypertension and hyperlipidemia) Abbreviations: BMI, body mass index; CI, confidence interval; HR, hazard ratio; SD; standard deviation; SFA, saturated fatty acid

Results | 55
Regarding cholesterol, the results were similar to those observed for SFAs. Both total and
source-specific cholesterol intake were positively related to the risk of HF. However, risk
estimates comparing the highest versus the lowest intakes of cholesterol from other
sources than meat were significant only in model 3 (Table 25).
For total animal protein intake, a significant positive association was observed, which,
however, disappeared after adjustment for prevalent diseases and anthropometry (Table
26). Animal protein from meat sources showed significantly higher HRs across all quintiles
of intake compared to the first, and remained significant in all applied statistical models.
Table 27 shows the results of the analyses on total and source-specific iron intake and the
risk of HF. Overall, the intake of total iron showed no clear association with HF risk. But
contradictory associations can be noticed when considering the different iron sources. Iron
from meat was positively associated with HF risk, while the intake of iron from other
sources appeared to be inversely associated. However, regarding iron from meat the
association was attenuated and lost its significance after multivariable adjustment.
Sensitivity analyses that were adjusted for nutrients did not substantially alter the results
(data not shown).

Results | 56
Table 25: Relationship between Cholesterol Intake and the Risk of Heart Failure
QUINTILES OF CHOLESTEROL INTAKE
TOTAL CHOLESTEROL 1 2 3 4 5
Men, mean (SD), [mg/d] Women, mean (SD), [mg/d]
202.6 (34.3) 157.2 (27.6)
276.7 (15.8) 216.6 (13.1)
331.8 (17.0) 261.2 (13.4)
399.5 (23.7) 314.7 (18.1)
546.9 (102.7) 428.3 (91.3)
n (cases) 4,802 (36) 4,802 (40) 4,805 (43) 4,804 (52) 4,795 (38)
Person-years 39,320 39,650 39,692 39,805 39,567
HR HR (95%CI) HR (95%CI) HR (95%CI) HR (95%CI) ptrend
Model 1 1 1.28 (0.81-2.02) 1.63 (1.01-2.61) 2.23 (1.37-3.63) 2.08 (1.14-3.78) <.01
Model 2 1 1.26 (0.79-2.00) 1.56 (0.96-2.52) 2.01 (1.21-3.33) 1.72 (0.90-3.27) 0.02
Model 3 1 1.23 (0.78-1.96) 1.54 (0.95-2.49) 2.07 (1.24-3.44) 1.65 (0.86-3.19) 0.02
CHOLESTEROL FROM MEAT 1 2 3 4 5
Men, mean (SD), [mg/d] Women, mean (SD), [mg/d]
48.9 (15.1) 27.5 (10.5)
78.4 (6.4) 49.5 (4.5)
101.3 (6.9) 64.9 (4.4)
128.9 (9.8) 82.8 (6.3)
192.1 (47.1) 125.4 (3.1)
n (cases) 4,801 (28) 4,802 (43) 4,802 (49) 4,801 (42) 4,802 (47)
HR HR (95%CI) HR (95%CI) HR (95%CI) HR (95%CI) ptrend
Model 1 1 1.56 (0.97-2.51) 1.89 (1.18-3.02) 1.85 (1.13-3.03) 2.44 (1.48-4.04) <.01
Model 2 1 1.52 (0.94-2.46) 1.80 (1.12-2.88) 1.65 (1.00-2.73) 2.01 (1.20-3.39) 0.01
Model 3 1 1.37 (0.85-2.22) 1.54 (0.96-2.47) 1.42 (0.85-2.35) 1.55 (0.92-2.61) 0.15
CHOLESTEROL FROM OTHER SOURCES 1 2 3 4 5
Men, mean (SD), [mg/d] Women, mean (SD), [mg/d]
124 (25) 108 (21)
181 (13) 155 (11)
224 (13) 192 (11)
277 (18) 237 (15)
402 (90) 336 (87)
n (cases) 4,801 (46) 4,802 (39) 4,801 (40) 4,802 (42) 4,802 (42)
HR HR (95%CI) HR (95%CI) HR (95%CI) HR (95%CI) ptrend
Model 1 1 0.92 (0.60-1.42) 1.01 (0.65-1.57) 1.20 (0.75-1.90) 1.29 (0.76-2.20) 0.23
Model 2 1 0.95 (0.61-1.46) 1.08 (0.69-1.68) 1.27 (0.79-2.04) 1.43 (0.82-2.47) 0.13
Model 3 1 1.00 (0.65-1.55) 1.19 (0.76-1.88) 1.45 (0.90-2.33) 1.66 (0.95-2.91) 0.04 Model 1: stratified by age, adjusted for sex and energy intake; Model 2: further adjusted for education, smoking, physical activity, and all remaining score components (continuously), except meat, and the ratio between MUFAs and SFAs (milk products were not included and meat was included in analyses of cholesterol from other sources); Model 3: further adjusted for anthropometry (BMI and waist circumference), and prevalent comorbidities (diabetes, hypertension and hyperlipidemia) Abbreviations: BMI, body mass index; CI, confidence interval; HR, hazard ratio; SD; standard deviation; SFA, saturated fatty acid

Results | 57
Table 26: Relationship between Animal Protein Intake and the Risk of Heart Failure
QUINTILES OF ANIMAL PROTEIN INTAKE
TOTAL ANIMAL PROTEIN 1 2 3 4 5
Men, mean (SD), [g/d] Women, mean (SD), [g/d]
33.5 (5.3) 26.3 (4.4)
45.0 (2.5) 35.3 (2.0)
53.5 (2.6) 42.0 (2.0)
63.9 (3.5) 50.0 (2.7)
86.0 (15.4) 67.3 (13.1)
n (cases) 4,801 (36) 4,802 (34) 4,801 (50) 4,802 (53) 4,802 (36)
Person-years 39,328 39,554 39,643 39,835 39,675
HR HR (95%CI) HR (95%CI) HR (95%CI) HR (95%CI) ptrend
Model 1 1 1.01 (0.63-1.63) 1.53 (0.97-2.40) 1.79 (1.11-2.87) 1.54 (0.87-2.73) 0.02
Model 2 1 1.05 (0.65-1.69) 1.58 (0.99-2.50) 1.82 (1.12-2.96) 1.57 (0.86-2.87) 0.02
Model 3 1 0.96 (0.59-1.54) 1.39 (0.88-2.21) 1.48 (0.91-2.41) 1.12 (0.61-2.06) 0.23
ANIMAL PROTEIN FROM MEAT 1 2 3 4 5
Men, mean (SD), [g/d] Women, mean (SD), [g/d]
12.5 (3.8) 7.1 (2.7)
20.1 (1.7) 12.7 (1.2)
26.0 (1.8) 16.6 (1.1)
32.9 (2.5) 21.1 (1.7)
48.9 (11.7) 32.0 (7.8)
n (cases) 4,801 (27) 4,802 (47) 4,801 (42) 4,802 (42) 4,802 (51)
HR HR (95%CI) HR (95%CI) HR (95%CI) HR (95%CI) ptrend
Model 1 1 1.79 (1.11-2.88) 1.71 (1.05-2.79) 1.91 (1.16-3.14) 2.97 (1.79-4.93) <.01
Model 2 1 1.76 (1.09-2.84) 1.66 (1.01-2.73) 1.73 (1.04-2.89) 2.44 (1.42-4.19) <.01
Model 3 1 1.61 (1.00-2.60) 1.44 (0.87-2.36) 1.51 (0.90-2.53) 1.99 (1.15-3.43) <.05
ANIMAL PROTEIN FROM OTHER SOURCES 1 2 3 4 5 Men, mean (SD), [g/d] Women, mean (SD), [g/d]
14.5 (3.0) 13.9 (2.7)
21.0 (1.5) 19.8 (1.3)
26.0 (1.6) 24.3 (1.3)
32.3 (2.2) 29.8 (2.0)
47.5 (12.1) 43.5 (11.7)
n (cases) 4,801 (51) 4,802 (36) 4,801 (40) 4,802 (44) 4,802 (38)
HR HR (95%CI) HR (95%CI) HR (95%CI) HR (95%CI) ptrend
Model 1 1 0.65 (0.42-1.00) 0.72 (0.47-1.11) 0.77 (0.50-1.19) 0.69 (0.42-1.13) 0.29
Model 2 1 0.70 (0.45-1.09) 0.82 (0.53-1.28) 0.93 (0.59-1.49) 0.93 (0.53-1.61) 0.88
Model 3 1 0.64 (0.41-0.99) 0.75 (0.48-1.18) 0.80 (0.50-1.28) 0.70 (0.40-1.22) 0.45 Model 1: stratified by age, adjusted for sex and energy intake; Model 2: further adjusted for education, smoking, physical activity and the remaining score components (continuously), except ‘meat and meat products’(milk products were included in analyses of animal protein from meat and meat was included in analyses on animal protein from other sources) ; Model 3: further adjusted for anthropometry (BMI and waist circumference), and prevalent comorbidities (diabetes, hypertension and hyperlipidemia), Abbreviations: BMI, body mass index; CI, confidence interval; HR, hazard ratio; SD, standard deviation

Results | 58
Table 27: Relationship between Iron Intake and the Risk of Heart Failure
QUINTILES OF IRON INTAKE
TOTAL IRON 1 2 3 4 5 Men, mean (SD), [mg/d] Women, mean (SD), [mg/d]
10.0 (1.2) 8.5 (0.9)
12.5 (0.5) 10.5 (0.4)
14.3 (0.5) 12.0 (0.4)
16.4 (0.7) 13.6 (0.6)
20.8 (2.9) 16.9 (2.1)
n (cases) 4,802 (38) 4,802 (51) 4,800 (43) 4,802 (46) 4,802 (31)
Person-years 39,478 39,688 39,757 39,507 39,605
HR HR (95%CI) HR (95%CI) HR (95%CI) HR (95%CI) ptrend
Model 1 1 1.26 (0.81-1.94) 1.03 (0.64-1.67) 1.12 (0.67-1.89) 0.77 (0.39-1.51) 0.53
Model 2 1 1.16 (0.74-1.80) 0.88 (0.53-1.44) 0.90 (0.52-1.56) 0.50 (0.23-1.06) 0.12
Model 3 1 1.18 (0.76-1.83) 0.85 (0.52-1.40) 0.86 (0.50-1.50) 0.44 (0.20-0.95) 0.07
IRON FROM MEAT 1 2 3 4 5
Men, mean (SD), [mg/d] Women, mean (SD), [mg/d]
1.33 (0.44) 0.70 (0.28)
2.25 (0.20) 1.31 (0.13)
2.98 (0.23) 1.77 (0.14)
3.95 (0.35) 2.36 (0.21)
6.62 (2.22) 3.89 (1.23)
n (cases) 4,802 (27) 4,801 (37) 4,801 (51) 4,802 (47) 4,802 (47)
HR HR (95%CI) HR (95%CI) HR (95%CI) HR (95%CI) ptrend
Model 1 1 1.39 (0.85-2.30) 1.95 (1.22-3.13) 1.85 (1.13-2.98) 1.91 (1.16-3.15) <.01
Model 2 1 1.31 (0.79-2.16) 1.75 (1.09-2.83) 1.63 (1.00-268) 1.54 (0.92-2.60) 0.08
Model 3 1 1.22 (0.74-2.01) 1.60 (0.99-2.59) 1.41 (0.86-2.32) 1.32 (0.78-2.24) 0.30
IRON FROM OTHER SOURCES 1 2 3 4 5
Men, mean (SD), [mg/d] Women, mean (SD), [mg/d]
7.6 (1.0) 7.1 (0.8)
9.6 (0.4) 8.8 (0.4)
11.0 (0.4) 10.0 (0.4)
12.6 (0.6) 11.4 (0.5)
16.0 (2.1) 14.3 (1.8)
n (cases) 4,801 (46) 4,802 (49) 4,801 (44) 4,802 (41) 4,802 (29)
HR HR (95%CI) HR (95%CI) HR (95%CI) HR (95%CI) ptrend
Model 1 1 0.95 (0.63-1.44) 0.81 (0.52-1.28) 0.73 (0.45-1.21) 0.50 (0.26-0.95) 0.04
Model 2 1 0.93 (0.61-1.42) 0.79 (0.49-1.27) 0.70 (0.40-1.20) 0.45 (0.21-0.96) 0.06
Model 3 1 0.93 (0.60-1.42) 0.76 (0.47-1.23) 0.66 (0.38-1.15) 0.38 (0.18-0.83) 0.03 Model 1: stratified by age, adjusted for sex and energy intake; Model 2: further adjusted for education, smoking, physical activity and the remaining score components (continuously), except ‘meat and meat products’ and cereals (cereals were included in analyses iron from meat and meat was included in analyses iron from other sources); Model 3: further adjusted for anthropometry (BMI and waist circumference), and prevalent comorbidities (diabetes, hypertension and hyperlipidemia) Abbreviations: BMI, body mass index; CI, confidence interval; HR, hazard ratio; SD, standard deviation

Results | 59
Marine Omega-3 Fatty Acids from Fish
EPA and DHA were further investigated as the most representative components in fatty
fish to follow the top-down approach. Unlike the nutrients shown before, the intakes of
EPA and DHA are mainly depending on fish consumption (Figure 14).
Figure 14: Main Contributing Food Sources to Total Marine Omega-3 Fatty Acids in EPIC-Potsdam Percentages are approximates calculated by multiplying nutrient content of the food group (mg/g)
94 with average
food group intake in EPIC-Potsdam (g/d) relative to the total nutrient amount derived from the whole diet (mg/d) Abbreviation: DHA, docosahexaenoic acid; EPA, eicosapentaenoic acid
Canned fish contributes to marine n3FAs about double compared to baked, cooked and
fried fish. That is also reflected by higher correlations (Table 28).
Table 28: Crude and Partial Spearman Correlation Coefficients for Omega-3 Fatty Acids and Fish
NUTRIENT / FOOD GROUP Total DHA and EPA
DHA and EPA from fish
Total fish Canned fish Baked fish
Total DHA and EPA 0.97 0.95 0.86 0.68 DHA and EPA from fish 0.97 0.97 0.89 0.68 Total fish 0.95 0.97 0.76 0.83 Canned fish 0.86 0.89 0.76 0.34 Baked fish 0.68 0.69 0.83 0.35
Values are all significant (<.01) and expressed as crude Spearman correlation coefficients (highlighted in blue), and partial Spearman correlation coefficients (adjusted for age and sex); Abbreviations: DHA, docosahexaenoic acid; EPA, eicosapentaenoic acid
Table 29 shows the associations between total and source-specific marine n3FAs intake
and the risk of HF. An inverse association was observed for DHA and EPA from fish and
all sources but not from other sources than fish. Persons in the fifth quintile of total marine
n3FAs intake had only half the risk of developing HF compared to persons in the lowest
category. For DHA and EPA from other sources, a risk increase was observed which,
however, remained significant after multivariable adjustment but showed no linear trend.

Results | 60
Table 29: Association between Intakes of Total Omega 3 Fatty Acids and Omega 3 Fatty Acids from Fish and Other Sources and the Risk of Heart Failure
QUINTILES OF OMEGA-3-FATTY ACIDS INTAKE
TOTAL DHA+EPA 1 2 3 4 5
Men, mean (SD), [mg/d] Women, mean (SD), [mg/d]
122 (35) 87 (24)
226 (26) 161 (21)
315 (25) 231 (22)
418 (37) 316 (30)
878 (602) 623 (426)
n (cases) 4,801 (45) 4,802 (42) 4,801 (48) 4,802 (49) 4,802 (25)
Person-years 39,477 39,427 39,790 39,695 39,644
HR HR (95%CI) HR (95%CI) HR (95%CI) HR (95%CI) ptrend
Model 1 1 0.90 (0.59-1.37) 1.03 (0.68-1.55) 1.03 (0.68-1.56) 0.54 (0.32-0.89) 0.09
Model 2 1 0.89 (0.58-1.36) 1.03 (0.68-1.56) 0.98 (0.64-1.50) 0.50 (0.30-0.84) 0.06
Model 3 1 0.87 (0.57-1.34) 1.01 (0.66-1.53) 0.97 (0.63-1.48) 0.46 (0.27-0.78) 0.03
DHA+EPA FROM FISH 1 2 3 4 5
Men, mean (SD), [mg/d] Women, mean (SD), [mg/d]
42.8 (27.1) 33.7 (19.8)
141.3 (20.1) 102.1 (18.8)
227.8 (19.8) 162.0 (21.1)
327.1 (37.7) 243.9 (28.3)
815.4 (620.9) 539.1 (424.9)
n (cases) 5,264 (47) 4,616 (43) 4,720 (45) 4,808 (50) 4,600 (24)
HR HR (95%CI) HR (95%CI) HR (95%CI) HR (95%CI) ptrend
Model 1 1 0.91 (0.60-1.37) 0.96 (0.64-1.45) 0.98 (0.66-1.47) 0.52 (0.32-0.86) 0.06
Model 2 1 0.94 (0.62-1.43) 0.98 (0.65-1.48) 1.02 (0.68-1.54) 0.52 (0.31-0.87) 0.07
Model 3 1 0.94 (0.62-1.43) 0.98 (0.64-1.48) 1.00 (0.66-1.50) 0.50 (0.30-0.83) 0.04
DHA+EPA FROM OTHER SOURCES 1 2 3 4 5
Men, mean (SD), [mg/d] Women, mean (SD), [mg/d]
49.0 (9.9) 36.1 (7.9)
70.3 (4.7) 53.5 (4.1)
87.1 (4.8) 66.9 (3.9)
106.6 (6.9) 82.2 (5.4)
151.2 (31.9) 116.3 (28.4)
n (cases) 4,801 (31) 4,802 (52) 4,801 (46) 4,802 (43) 4,802 (37)
HR HR (95%CI) HR (95%CI) HR (95%CI) HR (95%CI) ptrend
Model 1 1 1.97 (1.26-3.10) 1.88 (1.18-3.00) 2.08 (1.28-3.39) 2.12 (1.24-3.64) 0.01
Model 2* 1 1.93 (1.23-3.03) 1.79 (1.12-2.88) 1.87 (1.13-3.09) 1.76 (1.00-3.09) 0.09
Model 3* 1 1.88 (1.20-2.97) 1.74 (1.08-2.80) 1.76 (1.07-2.91) 1.57 (0.88-2.80) 0.21
Model 1: stratified by age, adjusted for sex and energy intake; Model 2: further adjusted for education, smoking physical activity, and all remaining score components (continuously), except ‘fish’; Model 3: further adjusted for anthropometry (BMI and waist circumference), and prevalent comorbidities (diabetes, hypertension and hyperlipidemia), * fish was included in the adjustment Abbreviations: BMI, body mass index; CI, confidence interval; DHA, docosahexaenoic acid; EPA, eicosapentaenoic acid; HR, hazard ratio

Discussion | 61
4. DISCUSSION
The aim of the present study was to examine the association between the adherence to
the Mediterranean diet and the risks of HF. Data of a prospective non-Mediterranean
cohort study (EPIC-Potsdam) were used to pursue this goal. By means of a top-down
approach, it was explored whether a Mediterranean-style diet as a whole, in its individual
components, and at micro- and macronutrient level was associated with the risk of HF.
Thereby, the most important elements of this diet with respect to HF risk were identified
and examined in detail.
4.1 Interpretation of Results
4.1.1 Dietary Pattern Analysis and Selection of Relevant Components
In the present work, a higher adherence to the Mediterranean-style diet was associated
with a lower risk of HF. EPIC-Potsdam participants who received five or more score points
had an about 40% decreased HF risk compared to participants who were assigned a
score of zero to two points. However, this relationship was attenuated after multivariable
adjustment and was further weakened after adjustment of prevalent comorbidities and
anthropometric measurements. Moreover, the exclusion of probable and especially
possible cases attenuated the association notably.
Nevertheless, this result is considered to be likely reliable for the following reasons:
First, as addressed in Chapter 2.2.2 (Selection of Covariates), comorbidities and
anthropometric measurements are suspected mediators within the causal pathway
between diet and HF development and, therefore, more emphasis may be given to model
2 that was borderline significant (p = 0.06). Furthermore, risk estimates across categories
of tMED remained rather stable in all applied statistical models. Third, possible cases
consisted mainly of fatal events that suggest more severe endpoints and/or farther
disease progression. An effect might be stronger in those participants and thus may
explain the attenuation of risk estimates after exclusion of these cases. Fourth, the
effectiveness of the Mediterranean diet on mortality has been reported to be higher in
Mediterranean countries than in non-Mediterranean ones.99 This might also be true
concerning HF.
In the present work, of the nine components that were used in the tMED, only three were
identified to play a major role in the investigated population with respect to HF risk
reduction. These were: low intakes of meat and meat products, moderate consumption of

Discussion | 62
alcohol and a high intake of fish. The observed finding is quite similar to one of an
investigation in a Greek population. In this study, low meat and moderate alcohol
consumption were identified as the first two main contributors to the overall inverse
association between the Mediterranean diet and mortality.99 However, with regards to HF,
studies on dietary patterns are very scarce. So far, only the consistency with the DASH
diet has been reported to be associated with a decreased risk of HF in men and women.52,
53 The DASH diet shares a number of tMED components and was associated with a 22%
lower risk of HF in men52 and a 37% lower risk in women51 comparing the highest versus
the lowest adherence groups. However, the DASH diet score differed from the tMED in
the fact that sodium and sweetened beverages were included, while fish, alcohol and the
fat-ratio were not. In addition, low-fat dairy products were considered as positive
component, cereals were limited to whole grains and poultry was excluded from total
meat.
4.1.2 Analysis of Food Groups and Subgroups
The components identified as being the main contributors to the overall inverse diet-
disease relationship were further analyzed according to relevant food subgroups of which
they were composed.
Total meat consumption was related to a two to three-fold increased risk of developing HF
comparing persons in the highest versus those in the lowest quintile of consumption. In
fact, all meat subgroups (processed meat, red meat and poultry) contributed to a certain
extent to this overall association (Figure 11), but processed meat was the crucial factor in
the investigated population. Men and women who consumed at least ~150g and ~100g of
processed meat per day had an 82% higher risk to develop HF compared to men and
women with lowest intakes (27g and 13g per day, respectively). For red meat and poultry
no independent association was observed but exclusion of these from total meat
attenuated the positive association to HF risk.
So far, three investigations studied the impact of red and processed meat consumption on
the risk of HF.36, 60, 110 Nettleton et al.36 did not observe any association in a cohort of men
and women (ARIC), while two investigations in men are in accordance to the results of the
present thesis. Both Ashaye et al.117 and Kaluza and colleagues61 observed significantly
higher risks of HF with higher intakes of red and processed meat. In one of those studies
the risk increase was restricted to processed meat consumption.61 This is in line with the
results of the present thesis. None of the mentioned studies investigated the intake of
poultry. However, the association between poultry intake and CHD risk seems to be
negligible, although studies including consumers of high amounts are lacking.111

Discussion | 63
As a second component of the tMED, fish consumption was inversely associated with HF
risk. This was particularly true for canned fish (containing mainly fatty fish such as tuna or
pickled herring) but not baked, fried or cooked fish. This finding is in agreement to most of
the previous ones, although results were somewhat conflicting. Three meta-analyses have
addressed this topic recently, all drawing different conclusions.33-35 Two of them
summarized results from the same studies but differed in the comparison groups. Djoussé
et al.35 reported a 15% (95% CI: 27%-1%) lower HF risk for persons in the highest versus
the lowest category of consumption, while Li and colleagues34 computed HRs of HF
according to specific frequencies of consumption and reported a HR of 0.91 (95% CI:
0.84-0.99) comparing one serving of fish per week with lower or equal to one serving per
month. These analyses contrasted with the meta-analysis of Hou et al.34 who included the
null finding of Nettleton et al.36 and observed no association between fish consumption
and HF risk (HR (95% CI): 1.00 (0.81-1.24) for the highest versus the lowest quartile of
consumption). On the contrary, in a second analysis limited to fried fish, the same authors
observed an increase in HF risk with higher consumption (HR (95% CI): 1.40 (1.22-1.61).
This analysis included only two studies but, however, could be an explanation for the lack
of an inverse association with baked, fried and cooked fish observed in the present work.
Two further studies are published on that topic, both not covered by any of the mentioned
meta-analyses. Both Wilk et al.41 and Yamagishi et al.46 observed an inverse association
between fish intake and HF risk, although the latter was not significant and only included
fatal HF events. Overall, evidence of an inverse association between fish consumption
and HF risk is growing and now supported also by the present study.
Ethanol intake was inversely associated with the risk of HF in EPIC-Potsdam. As shown in
Figure 9, this relationship appeared quite linear rather than U-shaped assuming a benefit
in terms of HF risk no matter how high the intakes were. Apart from the potential
increased risk of some cancers according to high ethanol consumption,112 it must be noted
that among EPIC-Potsdam participants a quite moderate intake of ethanol was present
(see Table 11). Most participant were far away from the reported amount of <90g ethanol
per day that induces cardiomyopathies (median intake [interquartile range] of ethanol in
consumers: men 18.3 [8.3-31.7] and women: 5.3 [2.1-10.5]).4 The consumed amounts of
the study participants were, thus, in a range in which the second half of a probable U-
shape might not yet have been detectable. The ‘sick quitters bias’ might furthermore
explain the especially higher risk of HF observed with lowest intakes.
The overall protective effect of ethanol consumption on the risk of HF has been
summarized earlier in a meta-analysis of six prospective studies and is in line with the
results of the present thesis.50 The authors observed an inverse association that was not

Discussion | 64
U-shaped either, and they argued with the lack of adequate data on heavy drinkers.
Reported cardio-protective properties of moderate ethanol consumption are manifold and
well documented. Ethanol has been linked to improved insulin sensitivity, increased
plasma HDL cholesterol,113 and reduced inflammation and platelet aggregation.114
Additionally, a ‘fish-like’ effect of ethanol was proposed, as alcohol intake was observed to
increase concentrations of marine n3FAs in plasma and blood.115, 116
So far, there are few insights to what extent the association with HF risk might differ
between types of alcoholic beverages. One of the studies included in the meta-analysis of
Padilla et al.50 addressed this subject and found no association between liquor intakes
and HF risk, but similar risk reductions due to wine and beer consumption.117 However,
this was only seen in men and HF that was related to CHD. In the present thesis, the
analyses of wine and beer revealed that the intakes of both were associated with reduced
HF risk. In agreement with the result of Klatsky et al,117 this was more pronounced and
significant only in men. Men in the highest intake group of beer had approximately half the
risk of developing HF compared to drinkers in the lowest category. The corresponding HR
in women was 0.71 (95% CI: 0.17-3.01). Men who drank between half and one glass of
wine per day even had an about 70% lower risk of HF compared to wine consumers
drinking a maximum of one glass a week (~50% in women). A possible additional
protective effect of wine compared to other alcoholic beverages might be explained by its
high antioxidant capacity, especially due to polyphenols in red wine.118 The observed sex-
differences might be due to lower consumption of alcohol and lower HF incidence rates in
women compared to men and, thus, lower power in detecting significant associations.
Interestingly, wine consumption showed the expected U-shaped association with HF risk,
while beer intakes showed a linear relationship with HF risk. Unmeasured confounding
might have impacted these differences. Persons who preferably drink beer appeared very
different to persons who favor wine. This might also be reflected in drinking behavior.
Daily moderate consumption of alcohol and binge drinking have been associated with
opposing cardiovascular effects.119 While binge drinking is associated to an increased risk
of cardiovascular outcomes even in generally moderate consumers, regular (daily) but
responsible alcohol consumption is reported to be beneficial. Although speculative, beer
drinkers in the highest group of consumption might have taken advantage of a regular and
responsible consumption rather than a very high consumption on a few days per week or
months.114 120, 121 However, this could not be answered in the present study.

Discussion | 65
4.1.3 Analysis of Macro- and Micronutrients
The main nutrients of meat and meat products and fish, which were presumably
responsible for the overall association with HF risk, have been further investigated.
In case of meat and meat products, analyses were conducted for SFAs, cholesterol, iron
and animal protein.
Intakes of SFA and cholesterol showed quite similar trends. For both, a positive
association to HF risk was observed regardless of the source that was studied. Persons
with the highest intakes of total SFAs, SFAs from meat and SFAs originating from other
foods showed a more than two-fold increased HF risk relative to persons in the lowest
intake group. These associations remained significant even after adjustment for potential
mediators.
Regarding cholesterol, similar risk-increasing trends were observed for total and source-
specific cholesterol intakes. However, an increase in HF risk was more pronounced for
cholesterol from meat than cholesterol from other sources.
Few prospective studies investigated the impact of nutrients on HF risk (Table 3). As far
as known, none of them included the intakes of SFAs or dietary cholesterol. Nevertheless,
a sufficient body of evidence exists that supports the present findings, although this mostly
refers to the impact on CHD risk.70, 122, 123 The main adverse effect of dietary cholesterol
and SFAs on heart health is suggested to be the LDL cholesterol-increasing effect due to
the inhibition of the LDL receptor activity.122 It is furthermore discussed that a high intake
of SFAs and cholesterol simultaneously might exacerbate this effect.122
Concerning animal protein, inconsistent results were observed for intakes calculated from
meat and other sources. Total animal protein intake was associated with an increased risk
of HF. However, this association seemed to depend on the risk increase due to animal
protein from meat, while animal protein derived from other sources was not associated
with HF risk. As illustrated in Table 23, animal protein from meat was highly correlated to
total meat consumption and, therefore, might simply replicate the findings observed for
total meat. HRs of HF calculated for animal protein were very similar to those observed for
total meat consumption. The scientific evidence on the relation between animal protein
intake and the risk of CVD endpoints is very scarce. In the Nurses’ Health Study no
association was observed between overall animal protein intake and CHD, which is in
contrast with the present findings.124 However, an increase in risk due to protein from
meat rather than milk products (as the main source of other animal protein) may be
explained by different preparation techniques. Meat is typically eaten baked, grilled, fried
or cooked, while milk products like yogurt are normally not heated before consumption.
Heating processes alter the protein structure and induce the production of detrimental

Discussion | 66
compounds like heterocyclic aromatic amines during Maillard reaction. The carcinogenic
effect of these amines is well known and the impact on heart health is yet not clear.125
A similar pattern of association was seen for iron intake. Iron from meat appeared to be
positively related to HF risk, whereas the intake of iron from other sources showed an
inverse association to HF development. Some investigations support an adverse effect of
heme iron that might explain these differences.126-128 Heme iron was reported to increase
the risk of e.g. gallstones128 and diabetes,129 which both might be intermediates of CVD
and thus HF.130 One possible explanation might be that heme iron - that is only present in
animal products - may act pro-oxidative and therefore induce damages to organ tissues,
for instance the pancreas.129, 131 However, both the association between intakes of iron
from meat and from other sources were not significant after multivariable adjustment,
suggesting that probably iron intake does not contribute to the risk-increasing association
observed between meat intake and HF risk.
Although a ‘true’ positive association between iron or animal protein from meat and HF
risk cannot be ruled out, less emphasis is given to these results as the mentioned
pathways are mainly speculative and adequate evidence from other studies is lacking.
Marine n3FAs were examined as fat source driving the inverse association observed
between fatty fish intake and HF risk. As expected, high intakes of DHA and EPA were
associated with a decreased risk of HF. However, as the correlation between n3FAs and
total fish consumption was very high, risk estimates were very similar to the ones
observed in the analyses of fish consumption. Total and fish-specific DHA and EPA
consumption were associated with a decreased risk of HF when consumed in high
amounts. Regarding DHA and EPA from other sources no clear picture was observed,
though HRs tended to a rather risk-increasing effect. Nevertheless, marine n3FAs from
other sources than fish contributed only about 20% to total marine n3FA intakes and were
mainly derived from meat and egg consumption. Residual confounding and correlations to
detrimental components (like SFAs and cholesterol) might have impacted this finding.
The observed results are in agreement with the results from previous studies that
examined the intakes of marine n3FAs and the risk of HF.42, 44, 45 35 However, in the
present work, a significant lower risk of HF was only observed in the highest versus the
lowest quintile of intake. The general mechanisms behind the cardio-protective effect of
EPA and DHA have been well explored. Marine n3FAs are reported to have anti-
inflammatory, anti-thrombotic and anti-arrhythmic properties. Furthermore, the lipid-
lowering effect of n3FAs has been described.132, 133

Discussion | 67
4.2 Critical Appraisal of Methods
In the present thesis, a dietary pattern has been identified a priori that seemed to be most
promising to reduce the risk of HF: The Mediterranean diet. This diet has been related to
heart health in ecologic, interventional and observational studies.
For analyses of the relationship between the adherence to the Mediterranean diet and the
risk of HF a well-established Mediterranean diet score was used, the tMED. However, it
was assumed that using the Greek median intake values as cut-points to separate
participants into adherent and non-adherent to the diet, would increase the validity of the
score to measure the Mediterranean diet in this non-Mediterranean population more
accurately. The question arises whether this change of cut-points is somewhat arbitrary or
justified. To answer this question, it is important to understand the consequences of this
change: By using the median intakes of EPIC-Potsdam participants all tMED components
were equivalent; for each component 50% of the population received either one or no
point, respectively. One might think that, thus, all components contributed equally to the
overall score. But not only is the percentage of persons that scored in a component of
interest, it is rather the gradient of this percentage across the score categories. The first
analyses (using the revised modified tMED with median values of EPIC-Potsdam as cut-
points) demonstrated that the proportion of persons that received one point for a
component was higher with higher overall scores, except for meat that was consumed in
similar amounts in all categories. With the change to the Greek cut-points two main things
happened: First, the uniform distribution of zeros and ones in each score component was
abolished. Henceforth, in some components participants scored more and in some less
frequently. Practically speaking, the contribution of vegetables, fat-ratio and fruits and nuts
to the overall score was very low, since few participants received one point. Conversely
more than 70% of the population scored in the groups of legumes and cereals. Second,
the proportions of participants who were assigned one point for a certain component were
redistributed across score categories. As a result, particularly the components meat and
meat products, alcohol and fish experienced a considerably steeper slope across score
categories, i.e. a more sufficient exposure gradient, compared to the first analysis using
EPIC-Potsdam median intakes to generate the tMED. For instance, before changing to
the Greek cut-points, 42% and 58% of persons received one point for the meat
component in the lowest and highest tMED category, respectively. With the use of the
Greek medians the respective proportions were 30% and 70%.
To sum up, there has thus been a shift of contributions of score components and the
question remains whether this shift is justified or arbitrary. Actually, the change to the
Greek median cut-points has led to a better discrimination of intakes of the food groups

Discussion | 68
that were identified as being the most important contributors to the inverse effect of the
dietary pattern. In fact, the equalization of all score components without considering the
scientific evidence and the components' proportions in the diet has already been criticized
in the use of Mediterranean diet scores.63 Furthermore, the identification of the most
contributing components was independent of the analysis of the overall score and three
methods were applied. One of these methods has previously been performed in the Greek
population and moderate alcohol consumption and low intake of meat and meat products
appeared to be the most contributing factors of the Mediterranean diet regarding mortality
risk reduction, underlying the fact that a higher weighting of these food groups may be
reasonable.99
However, until now the scientific literature revealed no clear picture of how to evaluate the
Mediterranean diet properly. Many Mediterranean diet scores have been generated and at
least as many changes have been made to the existing ones. There is no consensus
about which components should be included in a score, and which not. Similarly, there are
many approaches on appropriate cutoff values. However, so far the use of the Greek
median values to define adherence was used only cross-sectionally.134, 135
In the present thesis, two main reasons were figured out that might have impacted the
effectiveness of the Mediterranean diet defined by this score:
1. Adherence to the Mediterranean Diet was too low among EPIC-Potsdam Participants
to Provide a Sufficient Exposure Gradient
The present study population generally showed a low adherence to the Mediterranean-
style diet. The average score was 3.5 and score values reached only a maximum of seven
out of nine possible points. Few participants achieved a score of more than 5 points (n =
687). On the other hand, similarly few people were assigned a scoring of zero or one point
(n = 743). The comparison between the highest and the lowest adherence group was,
thus, mainly a comparison between persons with two and persons with five score points.
Taking this into account, it is not surprising that the overall diet-disease association
narrowly missed the significance level. Despite these circumstances, a fairly strong
association was observed, supporting the overall protective effect of the Mediterranean
diet.
2. Low Feasibility to Depict the 'Real' Mediterranean Diet in Non-Mediterranean
Populations
Only three out of nine Mediterranean diet score components were identified to play a role
for HF development in the present study. However, it was assumed that an inverse

Discussion | 69
relationship between intakes of other score components and the risk of HF probably may
exist, but that this could not sufficiently been demonstrated by the score.
The ratio between MUFAs and SFAs did not show a beneficial effect in terms of the risk of
HF (see Appendix XIV and Figure 10). Even the inclusion of PUFAs in the numerator of
the ratio did not alter this result (data not shown). Beside the generally low MUFA/SFA
ratio in EPIC-Potsdam compared to the Greek population (on average <0.9 versus >1.7) it
is believed that this lack of association arises from low comparability between fat sources
of non-Mediterranean populations and the ones of Mediterranean countries.136 In EPIC-
Potsdam the fat-ratio reflected to a large extent the ratio between margarine and butter
intake and was, furthermore, positively associated with meat consumption (data not
shown). Thus, this component has little resemblance to the fat-ratio in Mediterranean
countries where olive oil is the main source of fat. Margarine from mostly hydrogenated
fats hardly contains essential fatty acids but may be a source of trans-fats that are related
to adverse effects on the heart.137 On the other hand, olive oil is rich in MUFAs (especially
oleic acid) and thus may be a very important contributor to the cardio-protective effects of
the Mediterranean diet.109 A recent primary prevention trial demonstrated the preventive
potential (regarding CVD morbidity and mortality) of a Mediterranean diet enriched with
extra-virgin olive oil.72
Vegetable fat (including olive oil) was consumed in small amounts in EPIC-Potsdam.
Therefore, in the current work the component fat-ratio was actually not present and,
hence, the potential of the overall protective effect of the Mediterranean diet was
weakened.
For similar reasons, the expected HF risk-lowering association might not have been
confirmed in analyses of fruits and nuts and vegetables (Appendix XIV). The average daily
intakes of these foods were very low compared to intakes of the Greek population (Table
7) and only few participants reached the German national recommended daily intakes of
650g of fruits and vegetables.138 Besides the amount of intakes, food diversity and
preparation methods may influence the heart health-promoting properties of these food
groups. On the one hand, vitamins from vegetables may be lost due to cooking or
discarding of washing water.136 Furthermore, the proportion of raw consumed vegetables
is higher in Mediterranean countries compared to non-Mediterranean ones. On the other
hand, fruits in Mediterranean countries are presumably consumed more ripe and are
richer in vitamins than the ones from non-Mediterranean countries.136 Moreover, the
proportion of tree nuts to peanuts might influence possible salutary effect of nut
consumption (raw tree nuts eaten with skin in Mediterranean countries versus
consumption of roasted and salted peanuts eaten in Western populations).136 Therefore,

Discussion | 70
the tMED components fruits and nuts and vegetables might have shown no association to
HF risk.136 However, in line with the present study the few U.S. American studies that
examined the association between these food groups and the risk of HF did not observe
an association either, suggesting that there might be only a minor impact on heart health
according to the consumption of vegetables, nuts and fruits.36, 58
In case of the components cereals and legumes risk-lowering associations might be
masked due to putative harmful agents that are often consumed in parallel: The largest
proportion of cereals came from bread, which might be salted or sweetened and
consumed together with fat spread and sausage.136 Sodium was reported to be positively
associated to HF risk.49 Furthermore, intakes of whole grain products were low, and
especially consumption of these types of cereals have previously been associated to
reduce HF risk.36, 56 Legumes, interestingly eaten in higher amounts in EPIC-Potsdam
compared to EPIC-Greece (see Table 7), might also be prepared in combination with fatty
meat and salt.136
Moreover, there is a debate on how to include dairy products into Mediterranean diet
scores. Of the 15 scores shown in Table 6 and Appendix III - Appendix VI, seven did not
use this food group like initially suggested by Trichopoulou et al.64: two studies excluded
milk products entirely from the score,70, 139 in two investigations milk products were
assessed as positive component,140, 141 and another three research groups used whole-
milk but not skimmed milk products as negative element of the score.142-144 Actually,
results of the present thesis indicate a HF risk-lowering tendency rather than a risk
increase with higher intakes of milk products (Appendix XIV). Excluding milk products
from the overall score even strengthened the inverse association between the adherence
to the Mediterranean-style diet and HF risk (Figure 10). The intake of dairy products may
imply a cardiovascular risk in Mediterranean populations but not in non-Mediterranean
ones probably due to the higher fat content of dairy products in Mediterranean
countries.136 So far, only high-fat dairy products have been linked to increased HF risk.36
Despite these mentioned issues, an inverse relationship was observed between the
adherence to the Mediterranean-style diet and the risk of HF that nearly reached the
significance level. By means of a top-down approach, the main contributors of the inverse
effect have been identified and with the further step on the nutrient level, possible agents
have been detected that may have triggered these associations.

Discussion | 71
4.3 Limitations and Strengths
4.3.1 Limitations
The major limitation of the analysis on dietary pattern level was the low feasibility of the
score to depict the Mediterranean diet properly in this non-Mediterranean population. At
the level of nutrients, the ability to provide valid results was reduced due to the problem of
multicollinearity. Compared to the analyses conducted at nutrient or dietary pattern level,
those performed at the level of food group might, therefore, be considered more reliable.
Further limitations of this study warrant discussion:
First, in the present work diet was assessed by FFQ and nutrient intake was estimated by
a link to the German Nutrient Data Base.94 Thus, recall bias and measurement errors
cannot be ruled out. However, the FFQ was validated by comparison with repeated 24h
dietary recalls and due to the prospective study design, misclassification of exposure is
supposed to be non-differential.95 However, some food groups were not evaluated
thoroughly enough to draw conclusions on their nutrient contents. For example, no
distinction was made between tree nuts and peanuts or the varieties of fish species to
assess precisely the intake of fatty fish. In addition, the validity of the FFQ data was
relatively low for fish, nuts and legumes but might be underestimated as data of weekend
consumption have not been considered in the validation study.95 The questions included
in the FFQ did also not allow distinguishing between red and white wine consumption.
Furthermore, it was not possible to examine the influence of eating or drinking patterns
over the day or week and a possible dietary change during follow-up. Also, reporting bias
cannot be excluded though it is considered relatively low due to the generally high
educational attainment of the study participants and the exclusion of implausible high or
low energy intakes.
Second, the present study cannot prove causality. With the analyses at nutrient level it
was possible to get more insights on the putative pathophysiological mechanisms
underlying the results at higher nutritional levels (food groups), but to proof causality the
conduction of interventional trials is necessary.
Third, HF cases were identified by self-report during the fourth follow-up wave. The
possibility of false-positive and false-negative cases cannot be ruled out. However, due to
the larger sample size of non-cases compared to cases, the impact of false-positives on
the results is considered much stronger than that of false-negative ones. Many efforts

Discussion | 72
have been made to exclude false-positive cases, including validation by the study
physician and application of ESC criteria. Moreover, agreement between case
ascertainment by self-reporting and by physician diagnosis is supposed to be very high
(sensitivity: 88.5%).145 Therefore, the possibility of false-positive cases is considered
relatively low.
Fourth, the study did not provide sufficient cases of each type of HF to allow these to be
examined separately. Less diastolic than systolic HF cases have been diagnosed in the
analyses, although it was suggested that incidence rates of both types might be similar.4
Results may, therefore, be more representative for systolic HF. However, as the diagnosis
of diastolic HF appears to be more critical, the proportion of diastolic HF cases among
‘unknown’ cases might be larger compared to systolic HF cases.
Furthermore, like all prospective observational studies, also the present one was prone to
potential uncontrolled or imperfectly measured confounders. Similar to the ‘sick quitters
bias’, where results may be distorted due to misclassification and misinterpretation of an
alleged non-smoker or non-drinker, who has actually desisted from smoking / drinking due
to an onset of illness, this ‘sick quitters bias’ may also be relevant for nutritional behaviour
and a change in the diet (e.g. quitting meat consumption or starting vegetable
consumption). However, sensitivity analyses excluding persons that reported a dietary
change in the previous years and the exclusion of cases that occurred during the first two
years did not change the result.
Lastly, the effectiveness of the Mediterranean diet in Mediterranean countries is thought to
be not only influenced by diet, but also by other lifestyle factors (siesta, sociability) and the
exposure to sun. All factors which were less important in Western populations and were
not assessed in the present study. Furthermore, other parts of the Mediterranean diet –
not included in the used score - might be important for heart health. The literature
research revealed possible health-promoting effects of moderate coffee consumption that
is also common practice in Mediterranean countries.146, 147 On the other hand,
consumption of eggs has been found to be positively associated to HF risk in two
studies.36, 57 Three servings of eggs per week is the amount of intake suggested in the
Mediterranean diet pyramid (Figure 3). Similarly the role of salt/sodium might be important
which could not be investigated in the present study.49, 52, 53

Discussion | 73
4.3.2 Strengths
Major strengths of the present study include the prospective design and the large sample
size based on a general population. Furthermore, it was possible to adjust for a various
set of covariates. Moreover, a top-down approach is regarded as a useful method to
illustrate comprehensively the relationships between diet and disease outcomes on the
basis of hypotheses drawn upon prior knowledge. Thereby, it was possible to identify
most important factors of the Mediterranean diet (regarding the prevention of HF) on the
basis of evidence-based hypotheses with the public health goal to contribute to specific
recommendations in a still little explored area of research.
4.4 Conclusions
The present work is the first to report on the association between the adherence to a
Mediterranean-style dietary pattern and the development of HF in a non-Mediterranean
population of apparently healthy adults. Furthermore, it is the first investigation that
systematically examined aspects of the diet on different levels of nutrition on the basis of
prior knowledge, thereby offering key factors that contribute most to the overall effect of
the dietary pattern. This allows deeper insights in possible underlying mechanisms linking
diet to the risk of HF.
The results indicate that the adherence to a Mediterranean-style diet may play an
important role in the prevention of HF. So far, a number of studies have investigated
possible relationships between some of the single food groups included in the
Mediterranean diet score and HF risk. However, in most investigations single food groups
were examined without being able to compare the impact of single dietary components in
a context of a diet. In the present work it was possible to draw conclusions about the
relative importance of the intake of individual food groups within a Mediterranean-style
dietary pattern. The results suggest that the cardio-protective effect essentially relies on
three factors of the diet, namely moderate alcohol consumption, low consumption of meat
and meat products and high fish intake. Beside the moderate consumption of beer and
especially wine, particularly fatty fish was inversely and processed meat was positively
associated with the risk of developing HF. The fat quality was identified as a possible
reason for these findings.
To investigate the Mediterranean diet in a non-Mediterranean country was quite
challenging. There is still a need for a more precise and quantified definition of the
Mediterranean dietary pattern. The present work has dealt particularly with the feasibility
of Mediterranean diet scores and provides useful information to improve applicability in

Discussion | 74
non-Mediterranean countries. Considered problematic were particularly the lack of
consumption of some Mediterranean components (e.g. olive oil), the very divergent
median intakes of the present population compared to that of Mediterranean countries
(e.g. fruits and vegetables), and the different foods reflected by some components (e.g.
cooked vegetables in non-Mediterranean countries versus mainly raw vegetables, like
salads in Mediterranean ones).
The assessment of compliance by means of population-specific median values might not
be appropriate to depict the ‘true’ Mediterranean diet in non-Mediterranean countries. The
use of Greek median values seems superior, but seems not applicable for some elements
of the diet. However, changing the cut-points alone may not be sufficient enough to
improve the validity of the score. It might be reasonable to think of a proper way to weight
the score components according to the importance of the effects on health outcomes.
Based on the presented results, it is suggested that a change from the commonly used
fat-ratio to the amount / proportion of SFA in the diet might be reasonable, at least in a
non-Mediterranean country where olive oil is hardly consumed.
Findings of the present thesis might be of great public health relevance, as HF is an
outcome that covers several sorts of heart disorders more comprehensively than CHD, for
instance. Health promoting strategies for HF prevention, therefore, might be more
effective to improve general heart health. The intakes of specific foods are most
appropriate to communicate public health recommendations. Thus, the presented results
could be translated in the public health message that a moderate change of dietary habits
may have strong impact on heart health, when primarily the three identified factors are
involved: lowering the intakes of meat (particularly processed meat), increasing the intake
of fatty fish, and consuming moderate amounts of alcoholic beverages, mainly in form of
red wine. However, it should not be recommended to non-drinkers to drink alcohol only for
the suspected health benefits, and those drinking excessively it should be recommended
to stop as the risks of abuse and / or addiction may exceed the protective potential of a
moderate and responsible alcohol use.
The identified food groups might also be included in HF risk prediction models, in addition
to the already established conventional risk factors to improve HF risk stratification.
However, further studies are warranted to replicate and validate the findings observed in
this thesis.

References | 75
REFERENCES
1. McMurray JJ, Adamopoulos S, Anker SD, et al. ESC guidelines for the diagnosis
and treatment of acute and chronic heart failure 2012: The Task Force for the
Diagnosis and Treatment of Acute and Chronic Heart Failure 2012 of the
European Society of Cardiology. Developed in collaboration with the Heart Failure
Association (HFA) of the ESC. Eur J Heart Fail. Aug 2012;14(8):803-869.
2. Swedberg K, Cleland J, Dargie H, et al. [Guidelines for the Diagnosis and
Treatment of Chronic Heart Failure: executive summary (update 2005)]. Rev Esp
Cardiol. Sep 2005;58(9):1062-1092.
3. Roger VL. The heart failure epidemic. Int J Environ Res Public Health. Apr
2010;7(4):1807-1830.
4. McDonagh TA, Gardner RS, Clark AL, Dargie HJ. Heart Failure. Oxford: Oxford
University Press; 2011.
5. Mosterd A, Hoes AW. Clinical epidemiology of heart failure. Heart. Sep
2007;93(9):1137-1146.
6. Jessup M, Abraham WT, Casey DE, et al. 2009 focused update: ACCF/AHA
Guidelines for the Diagnosis and Management of Heart Failure in Adults: a report
of the American College of Cardiology Foundation/American Heart Association
Task Force on Practice Guidelines: developed in collaboration with the
International Society for Heart and Lung Transplantation. Circulation. Apr 14
2009;119(14):1977-2016.
7. Lloyd-Jones DM, Larson MG, Leip EP, et al. Lifetime risk for developing
congestive heart failure: the Framingham Heart Study. Circulation. Dec 10
2002;106(24):3068-3072.
8. Kannel WB. Incidence and epidemiology of heart failure. Heart Fail Rev. Jun
2000;5(2):167-173.
9. Owan TE, Hodge DO, Herges RM, Jacobsen SJ, Roger VL, Redfield MM. Trends
in prevalence and outcome of heart failure with preserved ejection fraction. N Engl
J Med. Jul 20 2006;355(3):251-259.
10. Rich MW, Nease RF. Cost-effectiveness analysis in clinical practice: the case of
heart failure. Arch Intern Med. Aug 9-23 1999;159(15):1690-1700.
11. Avery CL, Loehr LR, Baggett C, et al. The population burden of heart failure
attributable to modifiable risk factors: the ARIC (Atherosclerosis Risk in
Communities) study. J Am Coll Cardiol. Oct 23 2012;60(17):1640-1646.
12. Reinhold T, Rosenfeld S, Muller-Riemenschneider F, et al. [Patients suffering from
atrial fibrillation in Germany. Characteristics, resource consumption and costs].
Herz. Aug 2012;37(5):534-542.
13. Bundesamt S. Todesursachen in Deutschland 2010. Vol 12. Wiesbaden; 2012.
14. Zugck C, Kruger C, Kell R, et al. Risk stratification in middle-aged patients with
congestive heart failure: prospective comparison of the Heart Failure Survival

References | 76
Score (HFSS) and a simplified two-variable model. Eur J Heart Fail. Oct
2001;3(5):577-585.
15. Bouvy ML, Heerdink ER, Leufkens HG, Hoes AW. Predicting mortality in patients
with heart failure: a pragmatic approach. Heart. Jun 2003;89(6):605-609.
16. Lee DS, Austin PC, Rouleau JL, Liu PP, Naimark D, Tu JV. Predicting mortality
among patients hospitalized for heart failure: derivation and validation of a clinical
model. JAMA. Nov 19 2003;290(19):2581-2587.
17. Kearney MT, Fox KA, Lee AJ, et al. Predicting death due to progressive heart
failure in patients with mild-to-moderate chronic heart failure. J Am Coll Cardiol.
Nov 20 2002;40(10):1801-1808.
18. Levy WC, Mozaffarian D, Linker DT, et al. The Seattle Heart Failure Model:
prediction of survival in heart failure. Circulation. Mar 21 2006;113(11):1424-1433.
19. Gottdiener JS, Arnold AM, Aurigemma GP, et al. Predictors of congestive heart
failure in the elderly: the Cardiovascular Health Study. J Am Coll Cardiol. May
2000;35(6):1628-1637.
20. He J, Ogden LG, Bazzano LA, Vupputuri S, Loria C, Whelton PK. Risk factors for
congestive heart failure in US men and women: NHANES I epidemiologic follow-
up study. Arch Intern Med. Apr 9 2001;161(7):996-1002.
21. Armstrong PW. Left ventricular dysfunction: causes, natural history, and hopes for
reversal. Heart. Sep 2000;84 Suppl 1:i15-17:discussion i50.
22. Dickstein K, Cohen-Solal A, Filippatos G, et al. ESC guidelines for the diagnosis
and treatment of acute and chronic heart failure 2008: the Task Force for the
diagnosis and treatment of acute and chronic heart failure 2008 of the European
Society of Cardiology. Developed in collaboration with the Heart Failure
Association of the ESC (HFA) and endorsed by the European Society of Intensive
Care Medicine (ESICM). Eur J Heart Fail. Oct 2008;10(10):933-989.
23. World Health Organization (WHO). International Classification of Diseases (ICD).
Available at: http://www.who.int/classifications/icd/en/. Accessed 07/31, 2014.
24. Zannad F, Agrinier N, Alla F. Heart failure burden and therapy. Europace. Nov
2009;11 Suppl 5:v1-9.
25. Hu FB. Dietary pattern analysis: a new direction in nutritional epidemiology. Curr
Opin Lipidol. Feb 2002;13(1):3-9.
26. Willett WC. Nutritional Epidemiology. Oxford, New York: Oxford University Press;
2013.
27. Azizi-Namini P, Ahmed M, Yan AT, Keith M. The role of B vitamins in the
management of heart failure. Nutr Clin Pract. Jun 2012;27(3):363-374.
28. McKeag NA, McKinley MC, Woodside JV, Harbinson MT, McKeown PP. The role
of micronutrients in heart failure. J Acad Nutr Diet. Jun 2012;112(6):870-886.
29. Avni T, Leibovici L, Gafter-Gvili A. Iron supplementation for the treatment of
chronic heart failure and iron deficiency: systematic review and meta-analysis. Eur
J Heart Fail. Apr 2012;14(4):423-429.

References | 77
30. Taylor RS, Ashton KE, Moxham T, Hooper L, Ebrahim S. Reduced dietary salt for
the prevention of cardiovascular disease: a meta-analysis of randomized
controlled trials (Cochrane review). Am J Hypertens. Aug 2011;24(8):843-853.
31. He FJ, Burnier M, Macgregor GA. Nutrition in cardiovascular disease: salt in
hypertension and heart failure. Eur Heart J. Dec 2011;32(24):3073-3080.
32. Cotugna N, Wolpert S. Sodium recommendations for special populations and the
resulting implications. J Community Health. Oct 2011;36(5):874-882.
33. Hou LN, Li F, Zhou Y, et al. Fish intake and risk of heart failure: A meta-analysis of
five prospective cohort studies. Exp Ther Med. Sep 2012;4(3):481-486.
34. Li YH, Zhou CH, Pei HJ, et al. Fish consumption and incidence of heart failure: a
meta-analysis of prospective cohort studies. Chin Med J (Engl). Mar
2013;126(5):942-948.
35. Djousse L, Akinkuolie AO, Wu JH, Ding EL, Gaziano JM. Fish consumption,
omega-3 fatty acids and risk of heart failure: a meta-analysis. Clin Nutr. Dec
2012;31(6):846-853.
36. Nettleton JA, Steffen LM, Loehr LR, Rosamond WD, Folsom AR. Incident heart
failure is associated with lower whole-grain intake and greater high-fat dairy and
egg intake in the Atherosclerosis Risk in Communities (ARIC) study. J Am Diet
Assoc. Nov 2008;108(11):1881-1887.
37. Ashaye A, Gaziano J, Djousse L. Red meat consumption and risk of heart failure
in male physicians. Nutr Metab Cardiovasc Dis. Dec 2011;21(12):941-946.
38. Levitan EB, Wolk A, Hakansson N, Mittleman MA. alpha-Linolenic acid, linoleic
acid and heart failure in women. Br J Nutr. Oct 2012;108(7):1300-1306.
39. Lemaitre RN, Sitlani C, Song X, et al. Circulating and dietary alpha-linolenic acid
and incidence of congestive heart failure in older adults: the Cardiovascular Health
Study. Am J Clin Nutr. Aug 2012;96(2):269-274.
40. Wilk JB, Tsai MY, Hanson NQ, Gaziano JM, Djousse L. Plasma and dietary
omega-3 fatty acids, fish intake, and heart failure risk in the Physicians' Health
Study. Am J Clin Nutr. Oct 2012;96(4):882-888.
41. Belin RJ, Greenland P, Martin L, et al. Fish intake and the risk of incident heart
failure: the Women's Health Initiative. Circ Heart Fail. Jul 2011;4(4):404-413.
42. Levitan EB, Wolk A, Mittleman MA. Fatty fish, marine omega-3 fatty acids and
incidence of heart failure. Eur J Clin Nutr. Jun 2010;64(6):587-594.
43. Dijkstra SC, Brouwer IA, van Rooij FJ, Hofman A, Witteman JC, Geleijnse JM.
Intake of very long chain n-3 fatty acids from fish and the incidence of heart failure:
the Rotterdam Study. Eur J Heart Fail. Oct 2009;11(10):922-928.
44. Levitan EB, Wolk A, Mittleman MA. Fish consumption, marine omega-3 fatty acids,
and incidence of heart failure: a population-based prospective study of middle-
aged and elderly men. Eur Heart J. Jun 2009;30(12):1495-1500.
45. Yamagishi K, Iso H, Date C, et al. Fish, omega-3 polyunsaturated fatty acids, and
mortality from cardiovascular diseases in a nationwide community-based cohort of

References | 78
Japanese men and women the JACC (Japan Collaborative Cohort Study for
Evaluation of Cancer Risk) Study. J Am Coll Cardiol. Sep 16 2008;52(12):988-996.
46. Cui R, Iso H, Date C, Kikuchi S, Tamakoshi A, Japan Collaborative Cohort Study
G. Dietary folate and vitamin b6 and B12 intake in relation to mortality from
cardiovascular diseases: Japan collaborative cohort study. Stroke. Jun
2010;41(6):1285-1289.
47. Rautiainen S, Levitan EB, Mittleman MA, Wolk A. Total antioxidant capacity of diet
and risk of heart failure: a population-based prospective cohort of women. Am J
Med. Jun 2013;126(6):494-500.
48. Zhang W, Iso H, Ohira T, Date C, Tamakoshi A, Group JS. Associations of dietary
magnesium intake with mortality from cardiovascular disease: the JACC study.
Atherosclerosis. Apr 2012;221(2):587-595.
49. He J, Ogden LG, Bazzano LA, Vupputuri S, Loria C, Whelton PK. Dietary sodium
intake and incidence of congestive heart failure in overweight US men and women:
first National Health and Nutrition Examination Survey Epidemiologic Follow-up
Study. Arch Intern Med. Jul 22 2002;162(14):1619-1624.
50. Padilla H, Michael Gaziano J, Djousse L. Alcohol consumption and risk of heart
failure: a meta-analysis. Phys Sportsmed. Oct 2010;38(3):84-89.
51. Mostofsky E, Rice MS, Levitan EB, Mittleman MA. Habitual coffee consumption
and risk of heart failure: a dose-response meta-analysis. Circ Heart Fail. Jul 1
2012;5(4):401-405.
52. Levitan EB, Wolk A, Mittleman MA. Consistency with the DASH diet and incidence
of heart failure. Arch Intern Med. May 11 2009;169(9):851-857.
53. Levitan EB, Wolk A, Mittleman MA. Relation of consistency with the dietary
approaches to stop hypertension diet and incidence of heart failure in men aged
45 to 79 years. Am J Cardiol. Nov 15 2009;104(10):1416-1420.
54. Levitan EB, Mittleman MA, Wolk A. Dietary glycemic index, dietary glycemic load,
and incidence of heart failure events: a prospective study of middle-aged and
elderly women. J Am Coll Nutr. Feb 2010;29(1):65-71.
55. Mozaffarian D, Bryson CL, Lemaitre RN, Burke GL, Siscovick DS. Fish intake and
risk of incident heart failure. J Am Coll Cardiol. Jun 21 2005;45(12):2015-2021.
56. Djousse L, Gaziano JM. Breakfast cereals and risk of heart failure in the
physicians' health study I. Arch Intern Med. Oct 22 2007;167(19):2080-2085.
57. Djousse L, Gaziano JM. Egg consumption and risk of heart failure in the
Physicians' Health Study. Circulation. Jan 29 2008;117(4):512-516.
58. Djousse L, Rudich T, Gaziano JM. Nut consumption and risk of heart failure in the
Physicians' Health Study I. Am J Clin Nutr. Oct 2008;88(4):930-933.
59. Mostofsky E, Levitan EB, Wolk A, Mittleman MA. Chocolate intake and incidence
of heart failure: a population-based prospective study of middle-aged and elderly
women. Circ Heart Fail. Sep 2010;3(5):612-616.

References | 79
60. Kaluza J, Akesson A, Wolk A. Processed and Unprocessed Red Meat
Consumption and Risk of Heart Failure: A Prospective Study of Men. Circ Heart
Fail. Jun 12 2014.
61. Willett WC, Sacks F, Trichopoulou A, et al. Mediterranean diet pyramid: a cultural
model for healthy eating. Am J Clin Nutr. Jun 1995;61(6 Suppl):1402S-1406S.
62. Supreme Scientific Health Council MoHaWoG. Dietary guidelines for adults in
Greece. Arch Hellen Med. 1999;16:516-524.
63. Bach A, Serra-Majem L, Carrasco JL, et al. The use of indexes evaluating the
adherence to the Mediterranean diet in epidemiological studies: a review. Public
Health Nutr. Feb 2006;9(1A):132-146.
64. Trichopoulou A, Kouris-Blazos A, Wahlqvist ML, et al. Diet and overall survival in
elderly people. BMJ. Dec 2 1995;311(7018):1457-1460.
65. Trichopoulou A, Costacou T, Bamia C, Trichopoulos D. Adherence to a
Mediterranean diet and survival in a Greek population. N Engl J Med. Jun 26
2003;348(26):2599-2608.
66. Trichopoulou A, Orfanos P, Norat T, et al. Modified Mediterranean diet and
survival: EPIC-elderly prospective cohort study. BMJ. Apr 30 2005;330(7498):991.
67. Sofi F, Abbate R, Gensini GF, Casini A, Trichopoulou A, Bamia C. Identification of
change-points in the relationship between food groups in the Mediterranean diet
and overall mortality: an 'a posteriori' approach. Eur J Nutr. Mar 2012;51(2):167-
172.
68. Fung TT, McCullough ML, Newby PK, et al. Diet-quality scores and plasma
concentrations of markers of inflammation and endothelial dysfunction. Am J Clin
Nutr. Jul 2005;82(1):163-173.
69. Keys A. Coronary heart disease in seven countries. I. The study program and
objectives. Circulation. Apr 1970;41(4 Suppl):I1-8.
70. Keys A, Menotti A, Karvonen MJ, et al. The diet and 15-year death rate in the
seven countries study. Am J Epidemiol. Dec 1986;124(6):903-915.
71. Müller-Nordhorn J, Binting S, Roll S, Willich SN. An update on regional variation in
cardiovascular mortality within Europe. Eur Heart J. May 2008;29(10):1316-1326.
72. Estruch R, Ros E, Salas-Salvado J, et al. Primary prevention of cardiovascular
disease with a Mediterranean diet. N Engl J Med. Apr 4 2013;368(14):1279-1290.
73. Fung TT, Rexrode KM, Mantzoros CS, Manson JE, Willett WC, Hu FB.
Mediterranean diet and incidence of and mortality from coronary heart disease and
stroke in women. Circulation. Mar 3 2009;119(8):1093-1100.
74. de Lorgeril M, Salen P, Martin JL, Monjaud I, Delaye J, Mamelle N. Mediterranean
diet, traditional risk factors, and the rate of cardiovascular complications after
myocardial infarction: final report of the Lyon Diet Heart Study. Circulation. Feb 16
1999;99(6):779-785.
75. Hoevenaar-Blom MP, Nooyens AC, Kromhout D, et al. Mediterranean style diet
and 12-year incidence of cardiovascular diseases: the EPIC-NL cohort study.
PLoS One. 2012;7(9):e45458.

References | 80
76. Knoops KT, de Groot LC, Kromhout D, et al. Mediterranean diet, lifestyle factors,
and 10-year mortality in elderly European men and women: the HALE project.
JAMA. Sep 22 2004;292(12):1433-1439.
77. Dai J, Lampert R, Wilson PW, Goldberg J, Ziegler TR, Vaccarino V. Mediterranean
dietary pattern is associated with improved cardiac autonomic function among
middle-aged men: a twin study. Circ Cardiovasc Qual Outcomes. Jul
2010;3(4):366-373.
78. Fito M, Estruch R, Salas-Salvado J, et al. Effect of the Mediterranean diet on heart
failure biomarkers: a randomized sample from the PREDIMED trial. Eur J Heart
Fail. Feb 24 2014.
79. Grosso G, Mistretta A, Marventano S, et al. Beneficial Effects of the Mediterranean
Diet on Metabolic Syndrome. Curr Pharm Des. Dec 5 2013.
80. Grosso G, Mistretta A, Frigiola A, et al. Mediterranean diet and cardiovascular risk
factors: a systematic review. Crit Rev Food Sci Nutr. 2014;54(5):593-610.
81. Kastorini CM, Milionis HJ, Esposito K, Giugliano D, Goudevenos JA, Panagiotakos
DB. The effect of Mediterranean diet on metabolic syndrome and its components:
a meta-analysis of 50 studies and 534,906 individuals. J Am Coll Cardiol. Mar 15
2011;57(11):1299-1313.
82. Bonaccio M, Di Castelnuovo A, De Curtis A, et al. Adherence to the Mediterranean
diet is associated with lower platelet and leukocyte counts: results from the Moli-
sani study. Blood. Mar 31 2014.
83. Levitan EB, Lewis CE, Tinker LF, et al. Mediterranean and DASH diet scores and
mortality in women with heart failure: The Women's Health Initiative. Circ Heart
Fail. Nov 2013;6(6):1116-1123.
84. Sofi F, Macchi C, Abbate R, Gensini GF, Casini A. Mediterranean diet and health
status: an updated meta-analysis and a proposal for a literature-based adherence
score. Public Health Nutr. Nov 29 2013:1-14.
85. Hu FB, Willett WC. Optimal diets for prevention of coronary heart disease. JAMA.
Nov 27 2002;288(20):2569-2578.
86. de Lorgeril M, Salen P. Mediterranean diet in secondary prevention of CHD. Public
Health Nutr. Dec 2011;14(12A):2333-2337.
87. Mead A, Atkinson G, Albin D, et al. Dietetic guidelines on food and nutrition in the
secondary prevention of cardiovascular disease - evidence from systematic
reviews of randomized controlled trials (second update, January 2006). J Hum
Nutr Diet. Dec 2006;19(6):401-419.
88. Adabag S, Smith LG, Anand IS, Berger AK, Luepker RV. Sudden cardiac death in
heart failure patients with preserved ejection fraction. J Card Fail. Oct
2012;18(10):749-754.
89. Riboli E, Hunt KJ, Slimani N, et al. European Prospective Investigation into Cancer
and Nutrition (EPIC): study populations and data collection. Public Health Nutr.
Dec 2002;5(6B):1113-1124.

References | 81
90. Boeing H, Korfmann A, Bergmann MM. Recruitment procedures of EPIC-
Germany. European Investigation into Cancer and Nutrition. Ann Nutr Metab.
1999;43(4):205-215.
91. Boeing H, Wahrendorf J, Becker N. EPIC-Germany--A source for studies into diet
and risk of chronic diseases. European Investigation into Cancer and Nutrition.
Ann Nutr Metab. 1999;43(4):195-204.
92. Bergmann MM, Bussas U, Boeing H. Follow-up procedures in EPIC-Germany--
data quality aspects. European Prospective Investigation into Cancer and
Nutrition. Ann Nutr Metab. 1999;43(4):225-234.
93. Schulze MB, Hoffmann K, Kroke A, Boeing H. Dietary patterns and their
association with food and nutrient intake in the European Prospective Investigation
into Cancer and Nutrition (EPIC)-Potsdam study. Br J Nutr. Mar 2001;85(3):363-
373.
94. Dehne LI, Klemm C, Henseler G, Hermann-Kunz E. The German Food Code and
Nutrient Data Base (BLS II.2). Eur J Epidemiol. Apr 1999;15(4):355-359.
95. Bohlscheid-Thomas S, Hoting I, Boeing H, Wahrendorf J. Reproducibility and
relative validity of food group intake in a food frequency questionnaire developed
for the German part of the EPIC project. European Prospective Investigation into
Cancer and Nutrition. Int J Epidemiol. 1997;26 Suppl 1:S59-70.
96. Bohlscheid-Thomas S, Hoting I, Boeing H, Wahrendorf J. Reproducibility and
relative validity of energy and macronutrient intake of a food frequency
questionnaire developed for the German part of the EPIC project. European
Prospective Investigation into Cancer and Nutrition. Int J Epidemiol. 1997;26 Suppl
1:S71-81.
97. Wirth J, Buijsse B, di Giuseppe R, et al. Relationship between N-terminal pro-brain
natriuretic peptide, obesity and the risk of heart failure in middle-aged German
adults. PLoS One. 2014;in revision.
98. Wirth J. Relationship Between Obesity and N-terminal Pro-Brain Natriuretic
Peptide Level and the Risk of Heart Failure in the EPIC-Potsdam Study [Master
thesis]. not published, Berlin School of Public Health; 2013.
99. Trichopoulou A, Bamia C, Trichopoulos D. Anatomy of health effects of
Mediterranean diet: Greek EPIC prospective cohort study. BMJ. 2009;338:b2337.
100. Selvin S. Statistical Analysis of Epidemiologic Data. New York: Oxford University
Press 1991.
101. Schütze M, Schulz M, Steffen A, et al. Beer consumption and the 'beer belly':
scientific basis or common belief? Eur J Clin Nutr. Sep 2009;63(9):1143-1149.
102. Knüppel S, Stang A. DAG program: identifying minimal sufficient adjustment sets.
Epidemiology. Jan 2010;21(1):159.
103. Westenhoefer J. Age and gender dependent profile of food choice. Forum Nutr.
2005(57):44-51.

References | 82
104. Reime B, Novak P, Born J, Hagel E, Wanek V. Eating habits, health status, and
concern about health: a study among 1641 employees in the German metal
industry. Prev Med. Apr 2000;30(4):295-301.
105. Hulshof KF, Brussaard JH, Kruizinga AG, Telman J, Lowik MR. Socio-economic
status, dietary intake and 10 y trends: the Dutch National Food Consumption
Survey. Eur J Clin Nutr. Jan 2003;57(1):128-137.
106. Deeks A, Lombard C, Michelmore J, Teede H. The effects of gender and age on
health related behaviors. BMC Public Health. 2009;9:213.
107. Wakimoto P, Block G. Dietary intake, dietary patterns, and changes with age: an
epidemiological perspective. J Gerontol A Biol Sci Med Sci. Oct 2001;56 Spec No
2:65-80.
108. Scali J, Richard A, Gerber M. Diet profiles in a population sample from
Mediterranean southern France. Public Health Nutr. Apr 2001;4(2):173-182.
109. Kossioni A, Bellou O. Eating habits in older people in Greece: the role of age,
dental status and chewing difficulties. Arch Gerontol Geriatr. Mar-Apr
2011;52(2):197-201.
110. Ashaye A, Gaziano J, Djousse L. Red meat consumption and risk of heart failure
in male physicians. Nutr Metab Cardiovasc Dis. Jul 30 2010.
111. Bernstein AM, Sun Q, Hu FB, Stampfer MJ, Manson JE, Willett WC. Major dietary
protein sources and risk of coronary heart disease in women. Circulation. Aug 31
2010;122(9):876-883.
112. Schütze M, Boeing H, Pischon T, et al. Alcohol attributable burden of incidence of
cancer in eight European countries based on results from prospective cohort
study. BMJ. 2011;342:d1584.
113. Rimm EB, Williams P, Fosher K, Criqui M, Stampfer MJ. Moderate alcohol intake
and lower risk of coronary heart disease: meta-analysis of effects on lipids and
haemostatic factors. BMJ. Dec 11 1999;319(7224):1523-1528.
114. Standridge JB, Zylstra RG, Adams SM. Alcohol consumption: an overview of
benefits and risks. South Med J. Jul 2004;97(7):664-672.
115. de Lorgeril M, Salen P, Martin JL, Boucher F, de Leiris J. Interactions of wine
drinking with omega-3 fatty acids in patients with coronary heart disease: a fish-
like effect of moderate wine drinking. Am Heart J. Jan 2008;155(1):175-181.
116. de Leiris J, Besse S, Boucher F. Diet and heart health: moderate wine drinking
strengthens the cardioprotective effects of fish consumption. Curr Pharm
Biotechnol. Dec 2010;11(8):911-921.
117. Klatsky AL, Chartier D, Udaltsova N, et al. Alcohol drinking and risk of
hospitalization for heart failure with and without associated coronary artery
disease. Am J Cardiol. Aug 1 2005;96(3):346-351.
118. Sanchez-Moreno C, Cao G, Ou B, Prior RL. Anthocyanin and proanthocyanidin
content in selected white and red wines. Oxygen radical absorbance capacity
comparison with nontraditional wines obtained from highbush blueberry. J Agric
Food Chem. Aug 13 2003;51(17):4889-4896.

References | 83
119. O'Keefe JH, Bybee KA, Lavie CJ. Alcohol and cardiovascular health: the razor-
sharp double-edged sword. J Am Coll Cardiol. Sep 11 2007;50(11):1009-1014.
120. Ettinger PO, Wu CF, De La Cruz C, Jr., Weisse AB, Ahmed SS, Regan TJ.
Arrhythmias and the "Holiday Heart": alcohol-associated cardiac rhythm disorders.
Am Heart J. May 1978;95(5):555-562.
121. de Lorgeril M, Salen P, Corcos T, et al. Is moderate drinking as effective as
cholesterol lowering in reducing mortality in high-risk coronary patients? Eur Heart
J. Jan 2008;29(1):4-6.
122. Siri-Tarino PW, Sun Q, Hu FB, Krauss RM. Saturated fatty acids and risk of
coronary heart disease: modulation by replacement nutrients. Curr Atheroscler
Rep. Nov 2010;12(6):384-390.
123. Oster G, Thompson D. Estimated effects of reducing dietary saturated fat intake
on the incidence and costs of coronary heart disease in the United States. J Am
Diet Assoc. Feb 1996;96(2):127-131.
124. Hu FB, Stampfer MJ, Manson JE, et al. Dietary protein and risk of ischemic heart
disease in women. Am J Clin Nutr. Aug 1999;70(2):221-227.
125. Adamson RH, Thorgeirsson UP. Carcinogens in foods: heterocyclic amines and
cancer and heart disease. Adv Exp Med Biol. 1995;369:211-220.
126. Khechaduri A, Bayeva M, Chang HC, Ardehali H. Heme levels are increased in
human failing hearts. J Am Coll Cardiol. May 7 2013;61(18):1884-1893.
127. Qi L, van Dam RM, Rexrode K, Hu FB. Heme iron from diet as a risk factor for
coronary heart disease in women with type 2 diabetes. Diabetes Care. Jan
2007;30(1):101-106.
128. Tsai CJ, Leitzmann MF, Willett WC, Giovannucci EL. Heme and non-heme iron
consumption and risk of gallstone disease in men. Am J Clin Nutr. Feb
2007;85(2):518-522.
129. Pan A, Sun Q, Bernstein AM, et al. Red meat consumption and risk of type 2
diabetes: 3 cohorts of US adults and an updated meta-analysis. Am J Clin Nutr.
Oct 2011;94(4):1088-1096.
130. Wirth J, Giuseppe RD, Wientzek A, et al. Presence of gallstones and the risk of
cardiovascular diseases: The EPIC-Germany cohort study. Eur J Prev Cardiol. Oct
31 2013.
131. Biesalski HK, Köhrle J, Schürmann K, et al. Vitamine, Spurenelemente und
Mineralstoffe: Prävention und Therapie mit Mikronährstoffen. Stuttgart: Georg
Thieme Verlag; 2002.
132. Adkins Y, Kelley DS. Mechanisms underlying the cardioprotective effects of
omega-3 polyunsaturated fatty acids. J Nutr Biochem. Sep 2010;21(9):781-792.
133. Xin W, Wei W, Li XY. Short-term effects of fish-oil supplementation on heart rate
variability in humans: a meta-analysis of randomized controlled trials. Am J Clin
Nutr. May 2013;97(5):926-935.

References | 84
134. Woo J, Woo KS, Leung SS, et al. The Mediterranean score of dietary habits in
Chinese populations in four different geographical areas. Eur J Clin Nutr. Mar
2001;55(3):215-220.
135. Haveman-Nies A, Tucker KL, de Groot LC, Wilson PW, van Staveren WA.
Evaluation of dietary quality in relationship to nutritional and lifestyle factors in
elderly people of the US Framingham Heart Study and the European SENECA
study. Eur J Clin Nutr. Oct 2001;55(10):870-880.
136. Hoffman R, Gerber M. Evaluating and adapting the Mediterranean diet for non-
Mediterranean populations: a critical appraisal. Nutr Rev. Sep 2013;71(9):573-584.
137. Gillman MW, Cupples LA, Gagnon D, Millen BE, Ellison RC, Castelli WP.
Margarine intake and subsequent coronary heart disease in men. Epidemiology.
Mar 1997;8(2):144-149.
138. DGE Info (German Nutrition Society). Ernährungsbericht 2008. 04.02.2009.
Available at: http://www.dge.de/modules.php?name=News&file=article&sid=909.
139. Agnoli C, Krogh V, Grioni S, et al. A priori-defined dietary patterns are associated
with reduced risk of stroke in a large Italian cohort. J Nutr. Aug 2011;141(8):1552-
1558.
140. Rumawas ME, Dwyer JT, McKeown NM, Meigs JB, Rogers G, Jacques PF. The
development of the Mediterranean-style dietary pattern score and its application to
the American diet in the Framingham Offspring Cohort. J Nutr. Jun
2009;139(6):1150-1156.
141. van Staveren WA, de Groot LC, Haveman-Nies A. The SENECA study: potentials
and problems in relating diet to survival over 10 years. Public Health Nutr. Dec
2002;5(6A):901-905.
142. Schroder H, Marrugat J, Vila J, Covas MI, Elosua R. Adherence to the traditional
mediterranean diet is inversely associated with body mass index and obesity in a
spanish population. J Nutr. Dec 2004;134(12):3355-3361.
143. Issa C, Darmon N, Salameh P, Maillot M, Batal M, Lairon D. A Mediterranean diet
pattern with low consumption of liquid sweets and refined cereals is negatively
associated with adiposity in adults from rural Lebanon. Int J Obes (Lond). Feb
2011;35(2):251-258.
144. Panagiotakos DB, Pitsavos C, Chrysohoou C, Skoumas J, Stefanadis C. Status
and management of blood lipids in Greek adults and their relation to socio-
demographic, lifestyle and dietary factors: the ATTICA Study. Blood lipids
distribution in Greece. Atherosclerosis. Apr 2004;173(2):353-361.
145. Baumeister H, Kriston L, Bengel J, Harter M. High agreement of self-report and
physician-diagnosed somatic conditions yields limited bias in examining mental-
physical comorbidity. J Clin Epidemiol. May 2010;63(5):558-565.
146. di Giuseppe R, Wirth J, Weikert C. Coffee and risk of cardiovascular disease: an
overview. In: Preedy VR, ed. Coffee in Health and Disease Prevention”: in press.

References | 85
147. SASI Group, Newman M. Coffee Consumption. Available at:
http://www.worldmapper.org/posters/worldmapper_1038_coffee_consumption_ver
2.pdf. Accessed 18.09., 2014.
148. Asghari G, Mirmiran P, Rashidkhani B, Asghari-Jafarabadi M, Mehran M, Azizi F.
The association between diet quality indices and obesity: Tehran Lipid and
Glucose Study. Arch Iran Med. Oct 2012;15(10):599-605.
149. Buckland G, Gonzalez CA, Agudo A, et al. Adherence to the Mediterranean diet
and risk of coronary heart disease in the Spanish EPIC Cohort Study. Am J
Epidemiol. Dec 15 2009;170(12):1518-1529.
150. Alberti-Fidanza A, Fidanza F. Mediterranean Adequacy Index of Italian diets.
Public Health Nutr. Oct 2004;7(7):937-941.
151. Fidanza F, Alberti A, Lanti M, Menotti A. Mediterranean Adequacy Index:
correlation with 25-year mortality from coronary heart disease in the Seven
Countries Study. Nutr Metab Cardiovasc Dis. Oct 2004;14(5):254-258.
152. Sanchez-Villegas A, Martinez JA, De Irala J, Martinez-Gonzalez MA. Determinants
of the adherence to an "a priori" defined Mediterranean dietary pattern. Eur J Nutr.
Dec 2002;41(6):249-257.
153. Panagiotakos DB, Pitsavos C, Stefanadis C. Dietary patterns: a Mediterranean
diet score and its relation to clinical and biological markers of cardiovascular
disease risk. Nutr Metab Cardiovasc Dis. Dec 2006;16(8):559-568.
154. Bertoia ML, Triche EW, Michaud DS, et al. Mediterranean and Dietary Approaches
to Stop Hypertension dietary patterns and risk of sudden cardiac death in
postmenopausal women. Am J Clin Nutr. Feb 2014;99(2):344-351.

Index of Appendices | xvii
INDEX OF APPENDICES
Appendix I: ACC/AHA Classification of Heart Failure (Source: ACC/AHA Guidelines,
p. 1981) 6 ................................................................................................ xviii
Appendix II: Component Levels of the traditional Mediterranean Dietary Pattern ....... xix
Appendix III: Mediterranean Diet Scores Based on Medians as Cut Point for Adherence
and Non-Adherence to the Mediterranean Dietary Pattern ...................... xx
Appendix IV: Mediterranean Diet Scores Based on Tertiles as Cut Point for Adherence
and Non-Adherence to the Mediterranean Dietary Pattern ...................... xxi
Appendix V: Mediterranean Diet Scores Based on Percentages of Adherence and
Non-Adherence to the Mediterranean Dietary Pattern ............................ xxii
Appendix VI: Mediterranean Diet Scores Based on Frequencies and other Cut Points
............................................................................................................... xxiii
Appendix VII: Association between the Revised Modified tMED Score and the aMED
Score and the Risk of Heart Failure ....................................................... xxiv
Appendix VIII: Baseline Characteristics* of the Study Population according to Scoring of
the Revised traditional Mediterranean Diet Score (tMED) using EPIC-
Potsdam Median cut-off Values .............................................................. xxv
Appendix IX: Baseline Characteristics* of the Study Population according to Scoring of
the Alternate Mediterranean Diet Score (aMED) ................................... xxvi
Appendix X: The traditional revised Mediterranean diet according to Trichopoulou et al.
65 and its components and composition of food items as used in EPIC-
Potsdam ................................................................................................ xxvii
Appendix XI: Association between the Modified tMED Score using Cut-Points Proposed
by Sofi et al. and the Risk of Heart Failure ............................................ xxix
Appendix XII: Extract from the Questionnaire of the Fourth Follow-up including the
Question about Heart Failure .................................................................. xxx
Appendix XIII: Validation Form for Heart Failure in EPIC .............................................. xxxi
Appendix XIV: Results from Restricted Cubic Spline Cox Regression Analyses
Regarding Individual Mediterranean Diet Score Components and the Risk
of Heart Failure ..................................................................................... xxxii
Appendix XV: Baseline Characteristics According to Wine Consumption in Men ...... xxxvi
Appendix XVI: Baseline Characteristics According to Wine Consumption in Women xxxvii
Appendix XVII: Baseline Characteristics According to Beer Consumption in Men ..... xxxviii
Appendix XVIII: Baseline Characteristics According to Beer Consumption in Women
............................................................................................................. xxxix

Index of Appendices | xviii
Appendix I: ACC/AHA Classification of Heart Failure (Source: ACC/AHA Guidelines, p. 1981) 6
STAGE DESCRIPTION
A High risk for HF but no structural heart disease or symptoms of HF (e.g. patients with
hypertension, diabetes, obesity, …)
B Structural heart disease but no signs* or symptoms
* of HF (e.g. patients with previous
myocardial infarction, asymptomatic valve disease, …)
C Structural heart disease with prior or current symptoms of HF (e.g. patients with known
structural heart disease and shortness of breath or reduced exercise tolerance, …)
D Refractory HF requiring specialized intervention (e.g. patients with symptoms at rest
despite maximal medical therapy, …)
*symptoms and signs of HF are described in in Chapter 1.2.2 Abbreviation: ACC, American College of Cardiology; AHA, American Heart Association; HF, heart failure

Index of Appendices | xix
Appendix II: Component Levels of the traditional Mediterranean Dietary Pattern
Black outlines are the components of the Mediterranean diet score like proposed by Trichopoulou et al.65
Abbreviations: MUFA; monounsaturated fatty acids; n3FA, omega-3 fatty acid; PUFA, polyunsaturated fatty acids; SFA, saturated fatty acids

Index of Appendices | xx
Appendix III: Mediterranean Diet Scores Based on Medians as Cut Point for Adherence and Non-Adherence to the Mediterranean Dietary Pattern
FIRST AUTHOR
YEAR STUDY
POPULATION NO. OF
COMPONENTS POSITIVE COMPONENTS NEGATIVE COMPONENTS SCORE CUT
POINTS SCORE
RANGE ACCOUNT FOR
ENERGY ADAPTED OR
MODIFIED BY
3) Adapted Mediterranean Diet Score (AMED)
Van Staveren 2002
141
SENECA-study, 12 European countries
7 1. MUFA/SFA-ratio 2. Moderate alcohol 3. Legumes/nuts/seeds 4. Cereals 5. Fruits/vegetables 6. Moderate milk/milk products
1. Meat/meat products
Sex-specific medians*
p25th
-p75th
for dairy, ≥p75
th for
alcohol in women
0-7 Intakes were adjusted to 2000 kcal (women) /2500 kcal (men)
─
4) Mediterranean Diet (MD)
Issa 2011143
Random sample of residents from Mount Lebanon
11 1. Olive oil/SFA ratio 2. Legumes 3. Total cereals 4. Whole grains 5. Fruits 6. Vegetables 7. Fish
1. Meat/poultry 2. Whole milk/dairy
products 3. Sweetened
beverages 4. Refined grains
Sex-specific medians*
0-11 Not accounted for
─
5) Mediterranean Diet Scale (MDS)
Asghari 2012
148
Teheran Lipid and Glucose Study (TLGS)
10 1. PUFA/SFA ratio 2. Legumes 3. Whole grains 4. Fruits 5. Nuts 6. Vegetables 7. Fish
1. Ratio of red and processed to white meat
2. Dairy products 3. Refined grains
Medians* 0-10 Adjusted for total energy intake
1 study
* persons receive 0 points for intakes median and 1 point for intakes ≥ median in case of positive components and reverse for negative components, Please note that names and abbreviations of the scores are partly arbitrary chosen and not used by the authors who generated them Abbreviations: MUFA, monounsaturated fatty acids; p, percentile; PUFA, polyunsaturated fatty acids; SENECA, Survey in Europe on Nutrition and the Elderly; a Concerted Action; SFA, saturated fatty acids

Index of Appendices | xxi
Appendix IV: Mediterranean Diet Scores Based on Tertiles as Cut Point for Adherence and Non-Adherence to the Mediterranean Dietary Pattern
FIRST AUTHOR
YEAR STUDY
POPULATION NO. OF
COMPONENTS POSITIVE COMPONENTS NEGATIVE COMPONENTS SCORE CUT
POINTS SCORE
RANGE ACCOUNT FOR
ENERGY ADAPTED OR
MODIFIED BY
6) Mediterranean Diet Score (Mediscore)
Schröder
2004142
Spanish men and women from the province of Girona
9 1. Moderate red wine (>0g- 20g/d=3, otherwise=1)
2. Legumes 3. Cereals 4. Fruits 5. Vegetables 6. Nuts 7. Fish
1. Meat/meat products
2. High-fat dairy
T1=1, T2=2, T3=3 points for positive components, vice versa for negative
9-27 Adjusted for total energy intake
1 study
7) Relative Mediterranean Diet Score (rMED)
Buckland 2009
149
EPIC-Spain 9 1. Olive oil 2. Moderate alcohol (w: 5-
25g/d, m=10-50g/d) 3. Legumes 4. Cereals 5. Fruits/seeds/nuts 6. Vegetables 7. Fish
1. Meat/meat products 2. Milk/milk products
T1=0, T2=1, T3=2 points for positive components, vice versa for negative
0-18 All components were expressed as energy density (g/1000kcal/d or g/2000kcal/d))
8 studies
8) Italian Mediterranean Index (IMI)
Agnoli 2011
139
EPICOR, cohort of Italian volunteers from EPIC-Italy
11 1. Olive oil 2. Moderate alcohol (>0-
≤12g/d) 3. Legumes 4. Pasta 5. Fruits 6. Typical Italian vegetables 7. fish
1. Red meat 2. Butter 3. Soft drinks 4. Potatoes
T1&T2=0, T3=1 point for positive components, vice versa for negative
0-11 Adjusted for total energy intake
─
Please note that names and abbreviations of the scores are partly arbitrary chosen and not used by the authors who generated them Abbreviations: EPIC, European Prospective Investigation into Cancer and Nutrition; T, tertile

Index of Appendices | xxii
Appendix V: Mediterranean Diet Scores Based on Percentages of Adherence and Non-Adherence to the Mediterranean Dietary Pattern
FIRST AUTHOR
YEAR STUDY
POPULATION NO. OF
COMPONENTS POSITIVE COMPONENTS NEGATIVE COMPONENTS SCORE CUT
POINTS SCORE
RANGE ACCOUNT FOR
ENERGY ADAPTED OR
MODIFIED BY
9) Mediterranean Adequacy Index (MAI)
Alberti-Fidanza & Fidanza 2004,
150
(also see Fidanza 2004
151)
different areas of Italy
18 1. Vegetable oil 2. Red wine 3. Legumes 4. Cereals 5. Fruits 6. Vegetables 7. Fish 8. Bread 9. Potatoes
1. Milk 2. Cheese 3. Eggs 4. Animal fats 5. Margarine 6. Sweet beverages 7. Cakes 8. Pies and cookies 9. Sugar
% of total energy from positive components divided by % of total energy from negative components
No finite range, higher scores reflect higher adherence (normal: 4-8 points)
Intakes expressed as % of total energy intake
6 studies
10) Mediterranean-style Dietary Pattern Score (MSDPS)
Rumawas 2009
140
Framingham Offspring Study
13 1. Olive oil (exclusive) 2. Moderate alcohol (w:1.5,
m:3/d) 3. Olives/legumes/nuts (4
s/wk) 4. Whole grains (8 s/d) 5. Fruits (3 s/d) 6. Vegetables (6 s/d) 7. Dairy products (2 s/d) 8. Fish (6 s/wk) 9. Poultry (4 s/wk)
1. Meat (1 serving/week)
2. Sweets (3 s/wk) 3. Potatoes/starchy
roots (3 s/wk) 4. Eggs (3 s/wk)
% of achieved recommendation 100%=10 points 60%/140%=6 points
0-100 Weighted by the proportion of energy consumed from Mediterranean diet foods
5 studies
11) Mediterranean Dietary Pattern (MDP)
Sanchez-Villegas 2002
152
Cohort of alumni of university of Navarra
9 1. MUFA/SFA ratio 2. Moderate alcohol (w:
20g/d, m: 30g/d) 3. Legumes 4. Cereals/potatoes 5. Fruits 6. Vegetables
1. Meat/meat products
2. Milk/milk products 3. Trans fat
Standardized to SD, converted to relative %, score= sum of standardized components
0-100 Energy-adjusted values of intake
1 study
Please note that names and abbreviations of the scores are partly arbitrary chosen and not used by the authors who generated them Abbreviations: MUFA, monounsaturated fatty acid; s/d, serving per day; s/wk, servings per week; SD, standard deviation; SFA, saturated fatty acid

Index of Appendices | xxiii
Appendix VI: Mediterranean Diet Scores Based on Frequencies and other Cut Points
FIRST AUTHOR
YEAR STUDY
POPULATION NO. OF
COMPONENTS POSITIVE COMPONENTS NEGATIVE COMPONENTS SCORE CUT
POINTS SCORE
RANGE ACCOUNT FOR
ENERGY ADAPTED OR
MODIFIED BY
12) Mediterranean Diet Quality Index (MDQI)
Scali 2001108
Random sample, Southern France
7 1. Olive oil 2. Cereals 3. Fruits/vegetables 4. Fish
1. Meat 2. Cholesterol 3. % SFA
Points (0-2) possible depending on specific cut points
0-14 Lower= healthier
Not further accounted for (but in SFA included)
1 study
13) Mediterranean Diet Score (MED)
Panagiotakos 2004
144/2006
1
53
ATTICA, Greece
11 1. Olive oil 2. Moderate alcohol 3. Legumes 4. Non-refined cereals 5. Fruits 6. Vegetables 7. Fish 8. Potatoes
1. Red and processed meat
2. Poultry 3. Full-fat dairy
products
Frequencies 0-5 points for no to almost daily consumption
0-55 Not accounted for in 2004 In 2006 regression models were adjusted for energy intake
11 studies
14) Modified Traditional Score (MTS)
Bertoia 2014
154
WHI, USA 10 1. % fat from PUFA+MUFA 2. Legumes/nuts 3. Whole grains 4. Fruits 5. Vegetables 6. Fish
1. Red meat 2. Poultry 3. Dairy products
<25th
percentile =1, 25
th-75
th=2,
>75th
=3
0-40 Adjusted for total energy intake
─
15) Modified Mediterranean Diet Score (mMEDI)
Yang 2014 Cohort of firefighters, US Midwest
10 1. Olive oil/others (0-4 points) 2. Moderate alcohol (0-4 points) 3. Wine (2 points) 4. Type of drinks (0-4 points) 5. Type of cereals (0-4 points) 6. Fruits/vegetables (0-8 points) 7. Fish (0-4 points)
1. Fast/take-out food (4-0 points)
2. Sweet dessert (4-0 points)
3. Fried foods (4-0 points)
Depending on category/ frequency
0-42 Not accounted for
─
Please note that names and abbreviations of the scores are partly arbitrary chosen and not used by the authors who generated them Abbreviations: ATTICA, region in Greece; MUFA, monounsaturated fatty acid; PUFA, polyunsaturated fatty acid; SFA, saturated fatty acid; WHI, Women’s Health Initiative

Index of Appendices | xxiv
Appendix VII: Association between the Revised Modified tMED Score and the aMED Score and the
Risk of Heart Failure
TMED SCORE
*
0-3 4-5 6-9
n (cases) 6,307 (53) 11,172 (113) 6,529 (43)
Person-years 52,038 92,073 53,923
HR HR (95% CI) HR (95% CI) p for trend per 2 units increase
Model 1 1 1.31 (0.82-2.12) 0.96 (0.65-1.41) 0.07 0.83 (0.70-0.99)
Model 2 1 1.21 (0.75-1.96) 0.89 (0.60-1.32) 0.22 0.87 (0.73-1.04)
Model 3 1 1.30 (0.80-2.09) 0.93 (0.63-1.38) 0.10 0.84 (0.71-1.00)
AMED SCORE
#
0-3 4-5 6-9
n (cases) 4,272 (38) 15,197 (142) 4,539 (29)
Person-years 35,310 125,266 37,458
HR HR (95% CI) HR (95% CI) p for trend per 2 units increase
Model 1 1 1.03 (0.75-1.41) 0.69 (0.47-1.01) 0.07 0.89 (0.75-1.04)
Model 2 1 1.10 (0.80-1.51) 0.79 (0.53-1.16) 0.27 0.94 (0.80-1.11)
Model 3 1 1.07 (0.78-1.46) 0.75 (0.51-1.10) 0.17 0.92 (0.78-1.08)
Model 1: adjusted for sex and energy intake, stratified for age; Model 2: further adjusted for lifestyle (smoking, education, physical activity); Model 3: further adjusted for anthropometry (BMI and waist circumference) and prevalent comorbidities (diabetes, CHD, hypertension and hyperlipidemia); *based on the score by Trichopoulou et al.
66; # based on the score by
Fung et al.68

Index of Appendices | xxv
Appendix VIII: Baseline Characteristics* of the Study Population according to Scoring of the
Revised traditional Mediterranean Diet Score (tMED) using EPIC-Potsdam Median cut-off
Values
TMED SCORE
§
CHARACTERISTICS 0-3 4-5 6-9
n (cases) 6,307 (53) 11,172 (113) 6,529 (43)
Demographics, Lifestyle and Medical History
Gender, % female 63.8 61.5 59.6
Age, mean, years 49.5 (8.8) 50.1 (8.8) 50.2 (8.8)
Body mass index, kg/m2 26.2 (0.1) 26.3 (0.0) 26.3 (0.1)
Waist circumference, cm
Men 94.3 (0.2) 94.6 (0.2) 94.8 (0.2)
Women 80.1 (0.2) 80.5 (0.1) 80.4 (0.2)
University Degree, % 36.1 39.7 44.4
Current smoking, % 16.6 15.0 13.7
Physical activity, hrs/wk 2.46 (0.04) 2.72 (0.03) 3.19 (0.04)
Medical History, %
Prevalent hypertension 44.8 46.7 47.3
Prevalent diabetes 4.7 4.3 4.7
Prevalent hyperlipidemia 26.2 26.8 28.9
Total energy intake, MJ/d 8,850 (30) 9,054 (22) 9,310 (29)
Scored Components
Alcohol intake, g/d 14.5 (0.2) 15.4 (0.2) 16.8 (0.2)
Moderate intake§
28.3 51.7 72.8
Fruits and nuts intake, g/d 100 (1.1) 140 (0.9) 180 (1.1)
≥ Median, % 23.0 49.3 76.4
Vegetables intake, g/d 72.7 (0.6) 97.6 (0.5) 125.9 (0.6)
≥ Median, % 20.6 49.1 79.1
Cereal intake, g/d 184 (0.9) 206 (0.7) 225 (0.9)
≥ Median, % 30.2 49.9 69.3
Fish intake, g/d 16.7 (0.3) 23.8 (0.2) 32.3 (0.3)
≥ Median, % 25.7 51.4 76.8
Legumes intake, g/d 17.5 (0.2) 23.8 (0.2) 30.3 (0.2)
≥ Median, % 26.3 49.7 72.5
Fat-ratio 1.19 (0.00) 1.31 (0.00) 1.43 (0.00)
≥ Median, % 22.1 50.3 76.7
Meat products intake, g/d 122 (0.7) 121 (0.6) 118 (0.7)
< Median, % 42.4 49.2 58.1
Milk products intake, g/d 283 (2.7) 222 (2.0) 183 (2.6)
< Median, % 32.4 50.3 66.4 *Baseline characteristics are expressed as age- and sex-adjusted means (standard error) or percentages, age and sex are unadjusted means (standard deviation) or percentages; § tMED was calculated according to Trichopoulou et al.
66 using median values of the EPIC-Potsdam population: fruits: men= 94.2 g, women=
130.9 g; vegetables: men= 81.3 g, women= 96.9 g; cereals: men= 223.2 g, women= 173.2 g; legumes: men= 23.2 g, women= 14.5 g; fish: men= 23.0 g, women= 16.4 g; (MUFA+PUFA)/SFA-ratio: men= 1.32, women= 1.29; meat: men= 136.0, women= 87.0; milk: men= 152.9, women= 189.9 g; § moderate consumption is defined as follows: men ≥10 g/d – 50 g/d, women ≥ 5g/d – 25 g/d Abbreviations: MUFA, monounsaturated fatty acid; PUFA, polyunsaturated fatty acid; SFA, saturated fatty acid; tMED, traditional Mediterranean diet score

Index of Appendices | xxvi
Appendix IX: Baseline Characteristics* of the Study Population according to Scoring of the Alternate
Mediterranean Diet Score (aMED)
AMED SCORE§
CHARACTERISTICS 0-3 4-5 6-9
n (cases) 4,272 (38) 15,197 (142) 4,539 (29)
Demographics, Lifestyle and Medical History
Gender, % female 66.6 61.5 57.0
Age, mean, years 49.5 (8.8) 50.0 (8.8) 50.3 (8.8)
Body mass index, kg/m2 26.3 (0.1) 26.3 (0.0) 26.0 (0.1)
Waist circumference, cm
Men 94.8 (0.3) 94.6 (0.1) 94.1 (0.2)
Women 80.5 (0.2) 80.5 (0.1) 79.8 (0.2)
University Degree, % 34.7 40.0 45.1
Current smoking, % 16.2 14.7 15.3
Physical activity, hrs/wk 2.52 (0.05) 2.79 (0.03) 2.98 (0.05)
Medical History, %
Prevalent hypertension 45.5 46.8 45.9
Prevalent diabetes 5.8 4.5 3.4
Prevalent hyperlipidemia 27.5 27.4 26.5
Total energy intake, MJ/d 8,990 (36) 9,108 (19) 9,023 (35)
Scored Components
Alcohol intake, g/d 13.3 (0.2) 15.6 (0.1) 17.4 (0.2)
Moderate intake§
10.1 33.1 59.4
Fruits intake, g/d 124 (1.4) 135 (0.8) 156 (1.4)
≥ Median, % 46.3 49.6 54.2
Vegetables intake, g/d 92.8 (0.8) 98.9 (0.4) 104.4 (0.8)
≥ Median, % 44.9 50.2 53.4
Whole grain Cereal intake, g/d 40.0 (0.9) 50.0 (0.5) 58.0 (0.9)
≥ Median, % 42.7 50.0 56.6
Fish intake, g/d 15.6 (0.4) 23.7 (0.2) 34.2 (0.4)
≥ Median, % 24.7 50.1 81.5
Legumes intake, g/d 18.4 (0.3) 24.5 (0.2) 27.0 (0.3)
≥ Median, % 34.3 51.7 58.1
Fat-ratio 0.84 (0.00) 0.86 (0.00) 0.87 (0.00)
≥ Median, % 42.8 50.7 54.8
Nuts intake, g/d 2.92 (0.1) 3.30 (0.1) 3.67 (0.1)
≥ Median, % 53.6 59.7 64.2
Red and processed Meat intake, g/d 118 (0.8) 110 (0.4) 92 (0.8)
< Median, % 34.7 48.4 68.3
*Baseline characteristics are expressed as age- and sex-adjusted means (standard error) or percentages, age and sex are unadjusted means (standard deviation) or percentages; § aMED was calculated according to Fung et al.
68 using median values of the EPIC-Potsdam population: fruits: men= 94.2 g, women= 130.9
g; vegetables: men= 81.3 g, women= 96.9 g; whole grain cereals: men= 19.9 g, women= 36.6 g; legumes: men= 23.2 g, women= 14.5 g; fish: men= 23.0 g, women= 16.4 g; MUFA/SFA-ratio: men= 0.86, women= 0.84; red and processed meat: men= 122.3 g, women= 75.7 g; nuts: men= 0.82 g, women= 0.82 g; § moderate consumption was defined as follows: men ≥10 g/d – 25 g/d, women ≥ 5g/d – 15 g/d Abbreviations: aMED, alternate Mediterranean diet score; MUFA, monounsaturated fatty acid; PUFA, polyunsaturated fatty acid; SFA, saturated fatty acid

Index of Appendices | xxvii
Appendix X: The traditional revised Mediterranean diet according to Trichopoulou et al. 65 and its
components and composition of food items as used in EPIC-Potsdam
MEDITERRANEAN
FOOD COMPOUND
(LOADING)
CONTAINING FOOD
GROUPS CONTAINING FOOD ITEMS (LIKE IN THE FFQ)
Vegetables (+) Raw vegetables
1. Head, endive, lettuce, Chinese cabbage and / or lettuce 2. Mixed salad 3. Carrots 4. Seeds, sprouts 5. Raw peppers, chili pepper 6. Cucumber 7. Radish, radishes, cabbage salad 8. Red tomato 9. Raw onion
Cabbage 1. Cauliflower, red cabbage, white cabbage, kohlrabi, broccoli or other cruciferous vegetables
Cooked vegetables
1. Tomato vegetables, tomato sauce 2. Cooked pepper 3. Zucchini, eggplant or other fruit vegetables 4. Spinach 5. Cooked carrots 6. Leek 7. Salsify, celeriac 8. Asparagus 9. Cooked peas and carrots, ‘Leipziger Allerlei’, Ratatouille 10. Pickled cabbage
Garlic 1. Cooked/roasted garlic
Mushrooms 1. Meals with mushrooms 2. Fresh mushrooms (not canned mushrooms)
Fruits and nuts (+) Fresh fruit
1. Apple (winter and summer) 2. Pear 3. Peach, nectarine 4. Cherries, prunes, mirabelles or other stone fruit 5. Grapes 6. Strawberries 7. Currants, raspberries, blackberries, or other berry fruits 8. Kiwi, fresh pineapple, mango (in summer) 9. Banana 10. Orange and grapefruit 11. Mandarins
Nuts 1. Nuts (like peanuts, walnuts, Brazil nuts, ...)
Legumes (+) Legumes 1. Green pea 2. Green beans 3. Lentil, pea, bean stew
Fish (+) Fish 1. Canned fish, smoked fish (e.g. tuna, pickled herring, salmon, smoked trout)
2. Fish (e.g. fish fillet natural or breaded, fish sticks, ...)
alcohol from beverages (+/-)
1. Beer 2. Beer
2. Wine 1. Wine
3. Spirits 1. Spirits (e.g. brandy, whiskey, fruit brandy, rum, ...)
4. Other alcoholic beverages
1. Fruit wine (e.g. apple cider, ...) 2. Sparkling wine 3. Aperitif, dessert wine, liqueurs (e.g. sherry, port)
Abbreviations: FFQ, food frequency questionnaire

Index of Appendices | xxviii
Appendix X continued
MEDITERRANEAN
FOOD COMPOUND
(LOADING)
CONTAINING FOOD
GROUPS CONTAINING FOOD ITEMS (LIKE IN THE FFQ)
Meat (-) 1. Red meat
1. Beef steak, tenderloin, loin 2. Roast beef, boiled meat 3. beef rolls 4. Beef stew, beef strips 5. Pork goulash, Strips of pork 6. Smoked pork, pork ribs 7. Boiled pork, pork knuckle, knuckle 8. Pork belly 9. Meatball, hamburger, meatloaf 10. Meat sauce, hash 11. Liver 12. Veal, lamb, rabbit
2. Processed meat
1. Fried sausage 2. ‘Wieners‘, ‚Frankfurters‘, bockwurst, knackwurst, German
meatloaf
3. Poultry 1. Broiler 2. Sliced turkey, turkey cutlets, chicken fricassee, duck, goose
Fat-ratio (+) MUFA/SFA
1. Butter 2. Margarine 3. Other vegetable fat 4. Other fat 5. Fat from all other sources*
Cereals (+) 1. Whole grain bread
1. Whole grain bread 2. Dark and whole meal rolls
2. Other bread 1. Brown bread, rye bread, rye bread 2. White bread, wheat bread, toast 3. Bread roll 4. Croissants, pretzels
3. Grain flakes 1. Cereal flakes, grains, muesli
4. Cornflakes 1. Cornflakes, crisps,…
5. Pasta and rice 1. Pasta (e.g. spaghetti, ravioli, lasagna, ... main dish or side order) 2. Rice (risotto, paella, ... main dish or side order)
Dairy products (-)
1. Low fat dairies
1. Milk, milk drink (≤1.5% fat) 2. Yogurt (natural) (1.5% fat or less) 3. Yoghurt (fruit) (1.5% fat or less) 4. Soured milk, kefir 5. Curd, curd cheese with herbs (no fruit curd) (low fat)
2. High fat dairies
1. High fat curd (natural/with herbs), milk, milk drink (3.5% fat) 2. Yogurt (natural) (3.5% fat or more) 3. Yoghurt (fruit) (3.5% fat or more) 4. Whipped cream
3. Low fat cheese
1. Cream cheese (low fat) 2. Hard cheese (low fat) 3. Soft cheese (low fat)
4. High fat cheese
1. Cream cheese (high fat) 2. Hard cheese (high fat) 3. Soft cheese (high fat) 4. Cheese spread
Abbreviations: FFQ, food frequency questionnaire; MUFA, monounsaturated fatty acid; SFA, saturated fatty acid

Index of Appendices | xxix
Appendix XI: Association between the Modified tMED Score using Cut-Points Proposed by Sofi et al.
and the Risk of Heart Failure
TMED*
0-5 6-8 9-13
per 2 units
n (cases) 2,850 (20) 12,253 (93) 8,905 (96) Person-
years 23,515 101,258 73,261
HR HR (95%CI) HR (95%CI) p for trend HR (95%CI)
Model 1 1 0.88 (0.54-1.43) 1.09 (0.67-1.77) 0.33 1.06 (0.92-
1.23)
Model 2 1 0.93 (0.57-1.52) 1.20 (0.74-1.95) 0.17 1.10 (0.95-
1.27)
Model 3 1 0.91 (0.56-1.48) 1.21 (0.74-1.97) 0.07 1.12 (0.96-
1.30) Model 1: adjusted for sex and energy intake, stratified for age; Model 2: further adjusted for lifestyle (smoking, education, physical activity); Model 3: further adjusted for anthropometry (BMI and waist circumference) and prevalent comorbidities (diabetes, CHD, hypertension and hyperlipidemia); *based on the score by Trichopoulou et al.
66, modified
by Sofi et al.67

Index of Appendices | xxx
Appendix XII: Extract from the Questionnaire of the Fourth Follow-up including the Question about
Heart Failure

Index of Appendices | xxxi
Appendix XIII: Validation Form for Heart Failure in EPIC

Index of Appendices | xxxii
Appendix XIV: Results from Restricted Cubic Spline Cox Regression Analyses Regarding
Individual Mediterranean Diet Score Components and the Risk of Heart Failure
Restricted cubic spline regression analysis was performed using knots at the 5th, 50th (reference) and 95th percentile.
Hazard ratios and 95% confidence bands (dotted lines) are stratified by age and adjusted for sex, total energy intake, education, smoking, physical activity, BMI, waist circumference, prevalent comorbidities (diabetes, hypertension,
hyperlipidemia) and all remaining tMED score components (continuously). P for nonlinearity was computed by Wald chi-square test. Abbreviations: BMI, body mass index; HR, hazard ratio; MUFA, monounsaturated fatty acid; SFA, saturated
fatty acid; tMED, traditional Mediterranean diet

Index of Appendices | xxxiii
Appendix XIV continued
Restricted cubic spline regression analysis was performed using knots at the 5th, 50th (reference) and 95th percentile.
Hazard ratios and 95% confidence bands (dotted lines) are stratified by age and adjusted for sex, total energy intake, education, smoking, physical activity, BMI, waist circumference, prevalent comorbidities (diabetes, hypertension,
hyperlipidemia) and all remaining tMED score components (continuously). P for nonlinearity was computed by Wald chi-square test. Abbreviations: BMI, body mass index; HR, hazard ratio; tMED, traditional Mediterranean die

Index of Appendices | xxxiv
Appendix XIV continued
Restricted cubic spline regression analysis was performed using knots at the 5th, 50th (reference) and 95th percentile.
Hazard ratios and 95% confidence bands (dotted lines) are stratified by age and adjusted for sex, total energy intake, education, smoking, physical activity, BMI, waist circumference, prevalent comorbidities (diabetes, hypertension,
hyperlipidemia) and all remaining tMED score components (continuously). P for nonlinearity was computed by Wald chi-square test. Abbreviations: BMI, body mass index; HR, hazard ratio; tMED, traditional Mediterranean diet

Index of Appendices | xxxv
Appendix XIV continued
Restricted cubic spline regression analysis was performed using knots at the 5th, 50th (reference) and 95th percentile.
Hazard ratios and 95% confidence bands (dotted lines) are stratified by age and adjusted for sex, total energy intake, education, smoking, physical activity, BMI, waist circumference, prevalent comorbidities (diabetes, hypertension,
hyperlipidemia) and all remaining tMED score components (continuously). P for nonlinearity was computed by Wald chi-square test. Abbreviations: BMI, body mass index; HR, hazard ratio; tMED, traditional Mediterranean diet

Index of Appendices | xxxvi
Appendix XV: Baseline Characteristics According to Wine Consumption in Men
CATEGORIES OF WINE CONSUMPTION*
CHARACTERISTICS 1 2 3 4 5
Intake, ml 0 1-<35.7 35.7-<125 125-<250 ≥ 250
n (cases) 1,511 (40) 4,491 (69) 2,243 (13) 542 (2) 398 (6)
Age, mean, years 52.9 (8.1) 51.8 (7.9) 51.9 (7.8) 50.9 (7.7) 51.0 (7.8)
Body mass index, kg/m2 27.3 (0.1) 26.8 (0.1) 26.9 (0.1) 26.6 (0.2) 26.7 (0.2)
Waist circumference, cm 95.9 (0.3) 94.4 (0.1) 94.3 (0.2) 93.7 (0.4) 93.6 (0.5)
University Degree, % 26.8 49.6 59.4 70.4 68.3
Current smoking, % 40.6 23.8 18.9 16.8 24.4
Physical activity, hours/week 2.65 (0.09) 2.62 (0.05) 2.84 (0.08) 3.23 (0.15) 3.53 (0.18)
Medical History, %
Prevalent hypertension 60.4 53.0 52.9 53.2 52.4
Prevalent diabetes 10.3 5.1 4.7 3.6 5.2
Prevalent hyperlipidemia 35.1 31.2 33.2 34.1 33.2
Scored Components
Total energy intake, MJ/d 10,156 (67) 10,066 (39) 10,375 (55) 10,318 (113) 10,680 (132)
Total alcohol intake, g/d 20.0 (0.5) 19.3 (0.3) 23.5 (0.4) 31.1 (0.9) 52.9 (1.0)
Fruits and nuts intake, g/d 121 (1.3) 122 (1.3) 130 (1.9) 137 (3.8) 137 (4.5)
Vegetable intake, g/d 87 (1.3) 88 (0.7) 93 (1.0) 100 (2.1) 98 (2.5)
Cereals intake, g/d 227 (2.2) 236 (1.3) 234 (1.8) 229 (3.7) 212 (4.3)
Fish intake, g/d 25.9 (0.7) 26.3 (0.4) 29.5 (0.6) 31.3 (1.2) 35.1 (1.4)
Legumes intake, g/d 31.2 (0.6) 28.4 (0.3) 28.3 (0.5) 28.0 (1.0) 28.5 (1.2)
Fat-ratio 0.87 (0.0) 0.87 (0.0) 0.87 (0.0) 0.88 (0.0) 0.89 (0.0)
Milk products intake, g/d 206 (5.5) 213 (3.3) 219 (4.6) 215 (9.4) 218 (10.9)
Meat intake, g/d 156 (1.8) 146 (1.1) 147 (1.5) 137 (3.0) 142 (3.6) Baseline characteristics are expressed as age- and sex-adjusted mean (standard error) or percentages, age is shown as unadjusted means (standard deviation). * Categories of intakes based on standard portion sizes in Germany (wine=250ml), 35.7ml of wine reflect an intake of one glass per week

Index of Appendices | xxxvii
Appendix XVI: Baseline Characteristics According to Wine Consumption in Women
CATEGORIES OF WINE CONSUMPTION*
CHARACTERISTICS 1 2 3 4 5
Intake, ml 0 1-<35.7 35.7-<125 125-<250 ≥ 250
n (cases) 1,244 (13) 7,624 (44) 4,325 (18) 966 (2) 624 (2)
Age, mean, years 51.1 (9.5) 49.2 (9.2) 48.2 (8.9) 46.5 (8.6) 47.6 (8.7)
Body mass index, kg/m2 26.4 (0.1) 25.7 (0.1) 25.7 (0.1) 25.0 (0.1) 25.0 (0.2)
Waist circumference, cm 82.8 (0.3) 80.3 (0.1) 80.2 (0.2) 78.8 (0.3) 79.1 (0.4)
University Degree, % 18.8 27.1 32.0 41.4 42.8
Current smoking, % 28.8 15.9 16.6 18.0 27.6
Physical activity, hours/week 2.68 (0.10) 2.68 (0.04) 2.90 (0.05) 3.27 (0.11) 3.02 (0.13)
Medical History, %
Prevalent hypertension 43.8 39.5 39.7 34.7 38.7
Prevalent diabetes 8.4 3.6 2.4 2.4 2.9
Prevalent hyperlipidemia 29.7 22.4 20.8 23.1 22.7
Scored Components
Total energy intake, MJ/d 7,746 (60) 7,801 (24) 8,037 (32) 8,269 (68) 8,546 (85)
Total alcohol intake, g/d 2.9 (0.2) 4.1 (0.1) 10.1 (0.1) 21.1 (0.2) 39.9 (0.3)
Fruits and nuts intake, g/d 149 (2.8) 155 (1.1) 160 (1.5) 164 (3.1) 150 (3.9)
Vegetable intake, g/d 104 (1.6) 107 (0.6) 109 (0.9) 114 (1.8) 116 (2.2)
Cereals intake, g/d 178 (1.8) 180 (0.7) 177 (1.0) 179 (2.1) 169 (2.6)
Fish intake, g/d 18.7 (0.6) 19.9 (0.2) 22.2 (0.3) 24.3 (0.7) 23.9 (0.8)
Legumes intake, g/d 20.2 (0.4) 19.0 (0.2) 19.2 (0.2) 18.7 (0.5) 20.2 (0.6)
Fat-ratio 0.83 (0.0) 0.84 (0.0) 0.85 (0.0) 0.85 (0.0) 0.87 (0.0)
Milk products intake, g/d 260 (6.0) 244 (2.4) 236 (3.2) 230 (6.8) 216 (8.5)
Meat intake, g/d 92.7 (1.4) 93.3 (0.6) 95.4 (0.7) 91.7 (1.6) 92.3 (1.9) Baseline characteristics are expressed as age- and sex-adjusted mean (standard error) or percentages, age is shown as unadjusted means (standard deviation). * Categories of intakes based on standard portion sizes in Germany (wine=250ml), 35.7ml of wine reflect an intake of one glass per week

Index of Appendices | xxxviii
Appendix XVII: Baseline Characteristics According to Beer Consumption in Men
CATEGORIES OF BEER CONSUMPTION*
CHARACTERISTICS 1 2 3 4 5
Intake, ml 0 1-<250 250-<500 500-<1000 ≥1000
n (cases) 686 (13) 4,155 (62) 1,270 (19) 1,643 (23) 1,471 (13)
Age, mean, years 52.5 (8.0) 52.3 (8.0) 51.1 (7.7) 51.9 (7.7) 51.1 (7.7)
Body mass index, kg/m2 26.8 (0.1) 26.8 (0.1) 27.0 (0.1) 27.0 (0.1) 27.1 (0.1)
Waist circumference, cm 93.8 (0.4) 93.9 (0.2) 94.6 (0.3) 94.9 (0.2) 96.2 (0.3)
University Degree, % 36.6 54.0 53.1 52.9 40.4
Current smoking, % 36.7 20.7 21.4 25.8 34.3
Physical activity, hours/week 3.2 (0.1) 2.8 (0.1) 2.7 (0.1) 2.7 (0.1) 2.4 (0.1)
Medical History, %
Prevalent hypertension 54.2 51.5 53.1 53.8 63.1
Prevalent diabetes 9.9 5.8 4.3 4.6 6.4
Prevalent hyperlipidemia 32.6 31.2 32.1 32.9 36.7
Scored Components
Total energy intake, MJ/d 10,214 (99) 9,836 (40) 10,001 (73) 10,384 (64) 11,173 (68)
Total alcohol intake, g/d 5.0 (0.5) 11.2 (0.2) 21.4 (0.4) 29.1 (0.3) 56.9 (0.4)
Fruits and nuts intake, g/d 140 (3.4) 133 (1.4) 125 (2.5) 116 (2.2) 108 (2.3)
Vegetable intake, g/d 94 (1.9) 91 (0.8) 91 (1.4) 89 (1.2) 87 (1.3)
Cereals intake, g/d 233 (3.3) 236 (1.3) 232 (2.4) 236 (2.1) 218 (2.2)
Fish intake, g/d 27.7 (1.1) 26.8 (0.4) 27.8 (0.8) 29.0 (0.7) 28.5 (0.8)
Legumes intake, g/d 27.9 (0.9) 28.0 (0.4) 28.6 (0.6) 29.1 (0.6) 31.6 (0.6)
Fat-ratio 0.86 (0.0) 0.86 (0.0) 0.88 (0.0) 0.88 (0.0) 0.89 (0.0)
Milk products intake, g/d 269 (8.2) 244 (3.3) 196 (6.0) 181 (5.3) 153 (5.6)
Meat intake, g/d 148 (2.7) 138 (1.1) 149 (2.0) 154 (1.7) 164 (1.8) Baseline characteristics are expressed as age- and sex-adjusted mean (standard error) or percentages, age is shown as unadjusted means (standard deviation). * Categories of intakes based on standard portion sizes in Germany (beer=500ml)

Index of Appendices | xxxix
Appendix XVIII: Baseline Characteristics According to Beer Consumption in Women
CATEGORIES OF BEER CONSUMPTION
CHARACTERISTICS 1 2 3 4
Intake, ml 0 1-<125 125-<250 ≥250
n (cases) 5,801 (40) 7,469 (34) 845 (3) 668 (2)
Age, mean, years 49.1 (9.5) 48.7 (8.9) 47.9 (8.7) 48.3 (8.4)
Body mass index, kg/m2 26.1 (0.1) 25.5 (0.1) 25.3 (0.2) 24.9 (0.2)
Waist circumference, cm 81.0 (0.1) 80.0 (0.1) 79.9 (0.4) 79.6 (0.4)
University Degree, % 25.3 31.4 36.7 33.4
Current smoking, % 20.0 14.9 22.0 26.1
Physical activity, hours/week 2.74 (0.04) 2.82 (0.04) 3.09 (0.12) 2.67 (0.13)
Medical History, %
Prevalent hypertension 40.4 38.8 38.9 41.5
Prevalent diabetes 4.5 3.0 1.5 3.9
Prevalent hyperlipidemia 24.1 21.9 20.2 20.6
Scored Components
Total energy intake, MJ/d 7,758 (28) 7,951 (24) 8,305 (73) 8,647 (82)
Total alcohol intake, g/d 5.1 (0.1) 8.0 (0.1) 16.4 (0.3) 30.0 (0.4)
Fruits and nuts intake, g/d 161 (1.3) 157 (1.1) 145 (3.3) 126 (3.7)
Vegetable intake, g/d 108 (0.7) 108 (0.7) 106 (1.9) 102 (2.2)
Cereals intake, g/d 176 (0.9) 181 (0.8) 183 (2.2) 174 (2.5)
Fish intake, g/d 20.2 (0.3) 21.0 (0.2) 23.0 (0.7) 23.0 (0.8)
Legumes intake, g/d 18.6 (0.2) 19.2 (0.2) 20.7 (0.5) 21.6 (0.6)
Fat-ratio 0.84 (0.0) 0.84 (0.0) 0.84 (0.0) 0.85 (0.0)
Milk products intake, g/d 251 (2.8) 238 (2.4) 226 (7.3) 202 (8.2)
Meat intake, g/d 90.0 (0.6) 94.3 (0.6) 102 (1.7) 109 (1.9) Baseline characteristics are expressed as age- and sex-adjusted mean (standard error) or percentages, age is shown as unadjusted means (standard deviation). * Categories of intakes based on standard portion sizes in Germany (beer=500ml)

Eidesstattliche Erklärung | xl
EIDESSTATTLICHE ERKLÄRUNG
Hiermit versichere ich an Eides statt, dass ich die am Fachbereich
Gesundheitswissenschaften der Technischen Universität Berlin eingereichte
Dissertation mit dem Titel „The Mediterranean Diet and its Components and the Risk of
Heart Failure in the European Prospective Investigation into Cancer and Nutrition
(EPIC)-Potsdam Study – A Top-Down Approach“ selbstständig angefertigt und verfasst
habe und keine anderen als die angegebenen Quellen und Hilfsmittel benutzt wurden.
Die Dissertation wurde noch nicht veröffentlicht oder einer anderen Prüfungsbehörde
vorgelegt.
Berlin, den 29.09.2014 ........................................
(Unterschrift)