the measurement of diffusion and perfusion in … measurement of diffusion and perfusion in...
TRANSCRIPT

Phys. Med. Biol. 45 (2000) R97–R138. Printed in the UK PII: S0031-9155(00)99102-4
TOPICAL REVIEW
The measurement of diffusion and perfusion in biologicalsystems using magnetic resonance imaging
David L Thomas†‡‖, Mark F Lythgoe‡, Gaby S Pell§, Fernando Calamante‡and Roger J Ordidge†† Department of Medical Physics and Bioengineering, University College London,Shropshire House, 11–20 Capper Street, London WC1E 6JA, UK‡ RCS Unit of Biophysics, Institute of Child Health, University College London Medical School,30 Guilford Street, London WC1N 1EH, UK§ Division of Medical Physics, Nathan Kline Institute for Psychiatric Research,140 Old Orangeburg Road, Orangeburg, NY10962, USA
E-mail: [email protected]
Received 12 November 1999
Abstract. The aim of this review is to describe two recent developments in the use of magneticresonance imaging (MRI) in the study of biological systems: diffusion and perfusion MRI.Diffusion MRI measures the molecular mobility of water in tissue, while perfusion MRI measuresthe rate at which blood is delivered to tissue. Therefore, both these techniques measure quantitieswhich have direct physiological relevance. It is shown that diffusion in biological systems is acomplex phenomenon, influenced directly by tissue microstructure, and that its measurement canprovide a large amount of information about the organization of this structure in normal and diseasedtissue. Perfusion reflects the delivery of essential nutrients to tissue, and so is directly related toits status. The concepts behind the techniques are explained, and the theoretical models that areused to convert MRI data to quantitative physical parameters are outlined. Examples of currentapplications of diffusion and perfusion MRI are given. In particular, the use of the techniques tostudy the pathophysiology of cerebral ischaemia/stroke is described. It is hoped that the biophysicalinsights provided by this approach will help to define the mechanisms of cell damage and allowevaluation of therapies aimed at reducing this damage.
Contents
1. Introduction R982. Imaging of diffusion using MRI R98
2.1. Diffusion theory: random molecular motion R982.2. NMR and diffusion R992.3. Diffusion in biological systems R1022.4. Implementation of the NMR diffusion technique R108
3. Imaging of perfusion using MRI R1103.1. What is perfusion? R1103.2. Measurement of perfusion using bolus tracking methods R1103.3. Measurement of perfusion using arterial spin-labelling methods R1143.4. Advantages and disadvantages of MR perfusion techniques R1213.5. Other techniques for measuring perfusion-related parameters R122
‖ Address for correspondence: RCS Unit of Biophysics, Institute of Child Health, University College London MedicalSchool, 30 Guilford Street, London WC1N 1EH, UK.
0031-9155/00/080097+42$30.00 © 2000 IOP Publishing Ltd R97

R98 D L Thomas et al
4. Applications of diffusion and perfusion imaging R1234.1. Diffusion-weighted imaging in biological systems R1234.2. Perfusion imaging R128
5. Conclusion R131References R131
1. Introduction
Diffusion and perfusion magnetic resonance imaging (MRI) are two of the most recentlydeveloped and rapidly evolving areas of biomedical imaging, with applications rangingfrom diagnosis of hyperacute and chronic disease to the study of the microvascular andhaemodynamic changes associated with functional cerebral activation. The aim of this reviewis to describe how the development of these techniques has enabled physiology and function(particularly of the brain) to be imaged directly using MRI. This compares to previous MRIapproaches that have traditionally used contrast which is dependent on the relaxation times T1
and T2. Although qualitatively useful, T1- and T2-weighted images are influenced by a largenumber of factors, making direct interpretation of a change in contrast in these images difficult.Even when quantitative T1 and T2 mapping approaches are taken, the values are dependenton the static field strength of the MR magnet in which they are measured, which complicatesthe comparison of results from different centres working at different field strengths. Thedevelopment of diffusion and perfusion MRI has opened up the possibility to study the brainin ways which were previously unachievable, with results that are universally comparable.
MRI is now a well established modality in both clinical and experimental investigationsof the body. In this review, we will assume familiarity with the basic principles of MR dataacquisition and image formation. Those requiring a comprehensive description of nuclearmagnetic resonance (NMR) and MRI theory are referred to the relevant references (e.g.Stark and Bradley 1998, Gadian 1995). This review takes the following format: after thisintroduction, sections 2 and 3 describe the theoretical and practical issues relevant to the designand implementation of diffusion and perfusion imaging respectively. In section 2, diffusionis described mathematically as a fundamental molecular phenomenon, and the sensitivity ofNMR to this phenomenon via the manipulation of magnetic field gradients is introduced. Thecomplexity of diffusion in biological systems is explored, and MR pulse sequences whichhave been designed to investigate this are described and evaluated. In section 3, perfusion isdefined and two methods for measuring perfusion (exogenous contrast agent bolus trackingand arterial spin labelling) are described in detail and compared. The review concludes withsection 4 which describes the range of applications in which all these techniques have so farbeen used.
2. Imaging of diffusion using MRI
2.1. Diffusion theory: random molecular motion
The classic description of diffusion relates the macroscopic flux density, J , to an establishedconcentration gradient, ∇C in the following manner:
J = D∇C (2.1)
where the proportionality constant, D, is known as the diffusion coefficient (units:[length2/time], usually [mm2 s−1]). This is known as Fick’s law (Crank 1975). The timedependent form of this equation allows a determination of D from the measured concentration

Measuring diffusion and perfusion using MRI R99
profile of a tracer. In these experiments, microscopic displacements are of the order of mmas the observation period is over a period of minutes. In contrast to this classical approach todiffusion measurements, the NMR method directly monitors the net molecular displacementsof an ensemble of spins. The dependence of this displacement on the measurement durationis defined by the Einstein relationship
〈r2〉 = 6Dt (2.2)
where t is the observation (i.e. diffusion) time and 〈r2〉 is the mean squared displacement ofan ensemble of spins in three dimensions and corresponds to the variance of the displacementdistribution. The proportionality constant in this relationship is D, the diffusion coefficient.The diffusion coefficient’s almost linear dependence on temperature (Le Bihan 1995d) reflectsthe origins of the mean displacement in the random thermal (Brownian) motion of molecules.
The fundamental relationship (equation (2.2)) followed Einstein’s insight concerning theincorporation of the diffusion coefficient into the conditional probability distribution thatcharacterizes molecular displacement. This distribution is denoted P(r2, r1, τD) and is theconditional Gaussian probability of finding a given spin initially at point r1 between positionsr2 and r2 + dr2 after a time interval τD (Einstein 1926). For free diffusion in three dimensions,the distribution is given by
P(r2, r1, τD) = 1√(4πDτD)3
exp
(−(r1 − r2)2
4DτD
). (2.3)
This expression acts as the diffusion propagator. The Gaussian nature of this distributionunderlies the quantification of the diffusion coefficient with NMR.
2.2. NMR and diffusion
The effect of diffusion on an ensemble of magnetized spins can be understood in terms of thephase, �, of the magnetization in the transverse plane of the rotating reference frame, and itsbehaviour in an applied magnetic field gradient. A gradient pulse encodes the static spins ineach voxel with a spatially varying resonant frequency and, therefore, with a characteristicphase dispersion that can be rephased in a relatively easy manner. For diffusing spins, thisintravoxel phase dispersion becomes more complicated and incoherent as the spins randomlytranslate with varying velocities along the direction of the applied gradient. The variance ofthe distribution of intravoxel phase dispersion is magnified (in a similar way to the conditionaldisplacement distribution (equation (2.3))) even though the average phase remains zero. Theoverall signal from the voxel is attenuated due to destructive interference of the ensemble ofphase-dispersed spins, and this attenuation is a function of the diffusion coefficient. This canbe contrasted to the effect of bulk, coherent motion of the sample which results in a globalphase shift without signal attenuation.
The mechanism of diffusion weighting can be understood by consideration of the phasechanges during the simple bipolar pulsed gradient experiment (Stejskal and Tanner 1965). Infigure 1(a), G is the gradient amplitude, � is the time interval between gradient pulses and δ isthe duration of the individual gradient pulses. The general expression for the phase evolutionof a spin at position z1 along the z-axis, after a time τ , is given by
� = γ
∫ τ
0Gz1 dt = γGz1τ. (2.4)
The initial 90◦ radio-frequency (RF) pulse creates coherent transverse magnetization and thesubsequent gradient pulse induces a spatially dependent phase shift. For the simple case of amobile two-spin system depicted in figure 1(b) that initially extends over a distance a along

R100 D L Thomas et al
Figure 1. Schematic representation of the Stejskal–Tanner pulsed gradient experiment and its effecton diffusing molecules. (a) The pulse sequence, with its timing and gradient variables. (b) The stateof the transverse magnetization in the rotating frame at four stages during the diffusion experiment(i–iv) for diffusing spins, in the case of a simple two-spin system which begins with positionsz = {−a/2, a/2} and diffuses to z = {−a/2+ε1, a/2+ε2} (depicted at the bottom). The transversemagnetization before (i, iii) and after (ii, iv) each of the two diffusion gradient pulses is represented.�1,2 represents the phase shift caused by the application of the diffusion gradients. To simplifythe situation, T2 relaxation is ignored. The echo forms at a time t = TE from the application ofthe 90◦ RF pulse, and has an amplitude which depends on the phase coherence remaining betweenthe two spins. For stationary spins, �1 = �′
1 and �2 = �′2 so that the application of diffusion
gradients has no effect on the echo amplitude.
the z-axis of the magnet (i.e. spin 1 and 2 at z = {−a/2, a/2}), the overall phase dispersion,�A, across the spin system in the presence of a z-gradient, G, is given (from equation (2.4))by
�A = �1 + �2 = γGδa
2+γGδa
2= γGδa (2.5)
where �1 and �2 are the phase shift accrued by spin 1 and spin 2 respectively due to theapplication of G. The phase shifts are reversed by the subsequent 180◦ RF pulse. If the spinsdiffuse during the� interval between the diffusion gradients, by the time of the second gradientpulse, the spin positions will have changed to {−a/2+ε1,+a/2+ε2} where ε1 and ε2 representrandom displacements in the z-direction. The total phase dispersion, �B , is then given by
�B = �′1 + �′
2 = γGδ
(a
2− ε1
)+ γGδ
(a
2+ ε2
)= γGδ(a + ε2 − ε1). (2.6)
The net dephasing during the experiment, ��, is therefore given by
�� = �B − �A = γGδ(ε2 − ε1). (2.7)
For static spins, ε1 = ε2 = 0, and the second gradient pulse simply refocuses the effect of thefirst pulse. However, a system of mobile spins experiences a net dephasing (figure 1(b)). For anensemble of spins, it can be shown that the resultant signal attenuation is a function of the phasedispersion and the conditional probability expression P(r2, r1, τD) of equation (2.3) (Le Bihan1995a). The signal attenuation is, therefore, directly related to the diffusion coefficient. Withthe assumption of a Gaussian form for the probability term, the attenuation is given by theStejskal–Tanner equation (Stejskal and Tanner 1965):
ln
(S(G,�, δ)
S(0)
)= −γ 2G2δ2
(� − δ
3
)D (2.8)

Measuring diffusion and perfusion using MRI R101
Figure 2. (a) T2-weighted image showing regions of grey matter, white matter and CSF-filledventricles obtained in vivo from the cat brain. (b) Diffusion ellipsoid image constructed from theeffective diffusion tensor, estimated in each voxel for the ROI enclosed by the black rectangle.(Image kindly provided by Dr Peter Basser, reprinted with permission.)
where S(G,�, δ) and S(0) are the amplitudes of the diffusion-weighted and non-diffusion-weighted magnetizations respectively. The effects of gradient strength and timing can beconveniently grouped together in the so-called b-factor (units: [time/length2]) so that thegeneral expression becomes
S(b) = S(0) exp(−bD). (2.9)
As will be discussed in the next section, this expression is only valid for a homogeneous, non-restricted (isotropic) medium such as free water in which the mobility shows no directionaldependence, and the effects of imaging gradients have also been neglected. The signalattenuation can be calculated for any combination of diffusion gradients with the use ofthe diffusion-modified Bloch equations (Torrey 1956). The general expression of the signalattenuation of the signal in an isotropic medium is given by
ln
(S(b)
S(0)
)= −D
∫ TE
0k(t ′) · k(t ′) dt ′ (2.10a)
where k is the k-space vector (Ljunggren 1983):
k(t) = γ
∫ TE
0G(t ′) dt ′ (2.10b)
so that
b =∫ TE
0k(t ′) · k(t ′) dt ′. (2.10c)
Maps of the diffusion coefficient can be obtained by acquiring images over a range of diffusionweightings (i.e. different b-factors) and fitting to equation (2.9) on a pixel-by-pixel basis(see figure 2). From equation (2.8), it can be seen that stronger diffusion sensitization canbe achieved in one of two ways: (i) an increase in the amplitude of the gradient pulses, or(ii) an increase in the diffusion time, τD (i.e. the dephasing duration) which incorporates thelength of the diffusion sensitizing gradients (δ) and the interval between them (�). For theStejskal–Tanner experiment, τD ≈ (� − δ/3).

R102 D L Thomas et al
Table 1. Typical values of the ADC in free water and in human brain with approximate standarddeviations. Cerebrospinal fluid (CSF) and grey matter (GM) values from (Turner et al 1990).White matter (WM) values are obtained from Le Bihan et al (1993) in which diffusion-sensitizinggradients were placed parallel and orthogonal to the direction of the fibre axes.
Substance Diffusion coefficient [mm2 s−1]
Water (room temperature) (2.30 ± 0.02) × 10−3
CSF (2.94 ± 0.05) × 10−3
Grey matter (0.76 ± 0.03) × 10−3
White matter ortho. (0.45 ± 0.03) × 10−3
para. (0.95 ± 0.03) × 10−3
2.3. Diffusion in biological systems
The contrast in diffusion-weighted images is dependent on the diffusive mobility of thesubstance under study. For the same degree of diffusion weighting, the signal from free wateror cerebrospinal fluid (CSF) will be highly attenuated compared to the signal from the restrictedwater in the tissue compartments (see table 1). The decreased diffusion coefficient of tissuewater with respect to free water offers an indication of the greatly confined environment withinbiological systems. As table 1 shows, a single axis diffusion gradient measurement providesvalues of D that vary according to the alignment of the gradient with the fibre direction.Diffusion in biological tissues is a complex phenomenon that can only be approximated bythe classic treatment described thus far. The sophisticated, heterogeneous microstructure oftissue modifies the concept of free diffusion due to the presence of internal structure andbarriers. Exchange must be considered between the multiple compartments. Furthermore, thediffusion of water molecules becomes an orientation-dependent (anisotropic) phenomenon.A non-Gaussian form of the conditional probability function (equation (2.3)) is, therefore,predicted, and the use of a scalar diffusion measurement that is independent of experimentalfactors becomes unrealistic. For these reasons, the diffusion parameter measured in biologicalsystems is termed the apparent diffusion coefficient (ADC) in order to acknowledge theseconsiderations which are described in more detail in the following sections.
2.3.1. Multiple compartments. Tissue water is contained within multiple compartments,with the most obvious division being the intra/extra-cellular environments. Another proposeddivision describes the water residing in a thin layer around the cell membrane and is restricteddue to its proximity to the cellular surface (Helmer et al 1995). In the intracellular environment,the existence of compartmentalization has been demonstrated (e.g. between the cytoplasmand the nucleus) during investigations of single neurones (Schoeniger et al 1994). Water isalways in a state of continuous exchange between the various compartments. The observedsignal attenuation in the diffusion experiment, therefore, depends on the rate of exchange andthe diffusion (measurement) time, τD . In the limit of slow exchange with the water spinsremaining within their compartments during the diffusion time, this will be reflected by amulti-exponential form of the signal attenuation. An expression for the signal behaviour in atwo-compartment system (e.g. intra/extra-cellular compartments) is then given by
S(b) = S0[f1 exp(−b1ADC1) + f2 exp(−b2ADC2)] (2.11)
where f1 and f2 are the volume fractions within each of the two compartments (so thatf1 +f2 = 1); ADC1 and ADC2 are the apparent diffusion coefficients in the two compartments.
In contrast to this, in the limit of fast exchange with complete redistribution of waterbetween the compartments during the diffusion time, the signal attenuation will follow a single

Measuring diffusion and perfusion using MRI R103
exponential behaviour. The observed apparent diffusion coefficient for a two-compartmentsystem is then approximated by
ADC = f1ADC1 + f2ADC2. (2.12)
Instead of the existence of either slow or fast exchange within the system, an intermediateregime is most likely. In investigations of the multi-compartmental nature of tissue, it is alsoimportant to take into account the absolute water concentrations and, more significantly, thedifferent T2 relaxation times (von Meerwall 1982, Buckley et al 1999) within the differentcompartments, since this affects signal intensity at a given echo time. The intracellular T2
is expected to be significantly smaller than the corresponding extracellular value due to thediffering water mobilities in the two compartments. This will affect the determination of thecompartmental volume fractions. In most practical situations, the biexponential behaviour ofsignal attenuation described by equation (2.11) is not observed, and it is therefore commonpractice to fit data to the single exponential decay model and to quote a volume-averagedADC.
2.3.2. Restricted diffusion. The free diffusive motion of water in tissue is restricted by thepresence of natural barriers such as cell membranes. The diffusion time of the experimentdetermines the experimental sensitivity to the diffusion restriction. For a short diffusion time,most water molecules do not have time to reach the barriers, and diffusion will be relativelyfree. With increasing diffusion times, an increasing number of molecules will strike theboundaries of the restricted system and the diffusion displacement will deviate from a Gaussianbehaviour. The effect of the restriction on the diffusive displacement will strongly depend onthe morphology and the degree of permeability of the barriers and obstacles.
In biological systems, the diffusive displacement will deviate from its expected linearrelationship with the diffusion time, τD (predicted by equation (2.2)) and will plateau at a levelcorresponding to the size of the restricting volume. An experimental determination of thedegree of restriction can, therefore, be obtained by examining the diffusion time dependenceof the diffusion experiment. Restriction is indicated by the decrease of the ADC with anincreasing diffusion time. If diffusion is restricted in the classical sense (i.e. by impermeablebarriers), the diffusion time dependence of the ADC would be expected to be observed even atrelatively long values of τD (i.e. ∼1 s) (Stejskal and Tanner 1965). Experimental evidence forsuch a phenomenon is lacking for diffusion times above 20 ms (i.e. for diffusion displacementsof ∼5 µm which are of the order of the size of certain tissue microstructures) (Moonen et al1991, Le Bihan et al 1993). However, evidence of restriction at lower diffusion times (<20 ms)in brain tissue has been reported (Le Bihan et al 1993, Niendorf et al 1994). This apparentrestriction implicates the presence of either permeable barriers (Stanisz et al 1997, Le Bihan1995c) or a modified explanation of the concept of restriction (see next section).
2.3.3. Tortuosity and hindered diffusion. In order to retain the concept of classical restricteddiffusion by impermeable barriers and maintain consistency with the experimental findingsmentioned above (i.e. diffusion time independence of the ADC when τD is long), an alternativehypothesis has been suggested. In the presence of impermeable obstacles, extracellular waterwill remain unrestricted if the molecules are able to diffuse around the restricting volume. Themean path between two points is thereby lengthened so that the measured ADC for a fixedτD is lowered with respect to a corresponding measurement in the free medium. This aspectof hindered diffusion can be quantified by the concept of tortuosity that has its origins in thestudy of solid-boundary porous media (Mitra et al 1993, Latour et al 1993). In the limit oflong diffusion times, each water molecule in the extracellular space has sampled an equivalent

R104 D L Thomas et al
volume of the restricting system and the measured ADC will not deviate further with increasingτD . The tortuosity coefficient, λ, can then be defined as
ADC = D0
λ2(2.13)
where D0 is the diffusion coefficient observed in the absence of obstacles (i.e. in the freemedium). Tissue water can diffuse over unlimited distances (cf restricted diffusion) asthere is no real barrier to diffusion. The ADC will, therefore, only show a diffusion timedependence at short values of τD when the hindered and free path lengths are similar. Thiswould occur at the shorter τD values (<∼20 ms) that have been reported in studies of thetime dependence (Le Bihan et al 1993, Niendorf et al 1994). The deviation of the ADCat very short diffusion times is not dependent on the size of the restricting volume andcan be used to provide information on the local structure of the medium. In this manner,evaluation of the surface-to-pore-volume ratio, S/V , in porous media (Mitra et al 1993)with the use of NMR, has been extended to the study of cerebral tumours (Helmer et al1995). Hindered diffusion and tortuosity provides an explanation for the non-monoexponentialbehaviour of the signal attenuation without requiring distinct compartmentalization of tissuewater (Helmer et al 1995, Pfeuffer et al 1998) but instead dependence on the underlyinggeometrical structure. Measurements of the tortuosity have classically been obtained with theuse of ion-sensitive microelectrodes to follow the diffusion of a purely extracellular marker(e.g. TMA) (Nicholson and Philips 1981). The correspondence of these data with MRI resultsfrom observable water, which is probably in continuous exchange between compartments,remains to be clarified.
2.3.4. Anisotropy. In addition to the dependence of the experiment on its time scale,the direction of the measurement also plays a crucial role in the evaluation of ADC. Thediffusion of water in biological systems is an orientation-dependent (anisotropic) phenomenon.The scalar measurement of effective diffusivity described in section 2.1 is essentially aone-dimensional measure of diffusive mobility and cannot, therefore, describe the three-dimensional translational mobility of water within tissue. The most obvious practicaldemonstration of anisotropy is the dependence of the ADC measurement in white matter(Moseley et al 1990a) and skeletal muscle (Cleveland et al 1976) on the relative anglebetween the applied diffusion gradient and the grain or fibre tract axis (see table 1). Diffusiondisplacement in these media is greater when measured with the diffusion sensitization gradientin a direction parallel to the fibre-tract direction as demonstrated by a higher ADC value.This corresponds to a macroscopic degree of structural anisotropy. Orientation-dependentrestriction is, therefore, the underlying cause of anisotropy in these cases, but is not a requisitecharacteristic since permeable structures with a degree of spatial organization can also displayanisotropy, such as in the grey matter of the cerebral cortex (Lythgoe et al 1997).
Anisotropy implicates the correlation of water mobility along different directions sothat diffusion gradients in orthogonal directions can interact with each other. AccurateADC measurements, therefore, requires the consideration of all gradients—whether diffusion,imaging or background gradients—and in all directions—whether parallel, oblique orperpendicular to each other. In this respect, diffusion cannot be considered a vector quantity.Instead, diffusive transport can be characterized by nine diffusion coefficients grouped in aneffective second-rank tensor, D, so that
D =[Dxx Dxy Dxz
Dyx Dyy Dyz
Dzx Dzy Dzz
]. (2.14)

Measuring diffusion and perfusion using MRI R105
The conditional probability distribution (equation (2.3)) is also modified by incorporation of thetensor description (Basser et al 1995, Basser and Pierpaoli 1996). The off-diagonal elementsof the tensor (e.g. Dxy , Dzy) reflect correlations between displacements in perpendiculardirections. This can be understood by consideration of the physical structure of anisotropicmedia in which translational mobility will be biased along particular directions but awayfrom others. These off-diagonal elements can be as large as the diagonal components. Sincediffusion must be described by real values and the tensor can be shown to be Hermitian,the tensor elements are symmetric (i.e. Dij = Dji) (Basser et al 1995). The tensor’s sixindependent terms and S(0) can be extracted from a series of measurements with diffusiongradients applied in a range of directions (diffusion-tensor MRI). A minimum of seven weightedimages are required. The expression for the signal attenuation in an anisotropic medium can beshown to be provided by the following matrix-based expression which evaluates to a nine-termsum of products (cf equation (2.10)):
ln
(S(b)
S(0)
)= −
∫ TE
0k(t ′)TD · k(t ′) dt ′ (2.15)
where T denotes the transpose of the matrix. This equation can be simplified to provide anequivalent expression for equation (2.9)
ln
(S(b)
S(0)
)= −
3∑i=1
3∑j=1
bijDij (2.16)
where bij represents the components of the matrix of b-factors (the b-matrix) and Dij are thecomponents of the diffusion tensor.
The b-matrix weights the relative contributions of the components of the diffusion tensorto the signal attenuation. The cross-terms, bij where i �= j , describe interactions of orthogonalgradient directions that are associated with the off-diagonal elements of the tensor. Forexample, the application of the y and z diffusion gradients in a spectroscopy experiment(i.e. without imaging gradients) provides the following expanded form of equation (2.15):
ln
(S(b)
S(0)
)= −byyDyy − bzzDzz − 2byzDyz. (2.17)
This can be compared to the situation of an isotropic material. In this case, the diagonal termsof the tensor are equivalent (Dxx = Dyy = Dzz) while the off-diagonal terms vanish i.e. there isno preferred direction of displacement, so that equation (2.15) becomes ln[S(b)/S(0)] = −bD
where b = byy + bzz.In imaging experiments, the influence of imaging gradients can be significant and must
be incorporated into the evaluation of the overall b-matrix in order to accurately characterizethe tensor. Both the direct, self-mediated signal attenuation due to these gradients (self-terms)and their mathematical interactions with other gradients (cross-terms) must be considered.Therefore, in an anisotropic material, the contributions of every gradient to the signalattenuation must be considered. The proportional contribution of a diffusion gradient, Gd ,and an accompanying background (e.g. imaging) gradient, Gb, to the overall b-factor in ananisotropic medium can be written as
bTOTAL ∝ α|Gd |2 + β|Gb|2 + γGdGb (2.18)
where the second and third terms are the background gradient’s self-term and cross-termsrespectively; the variables, α, β and γ , include the timing factors (∝[time3]). For acquisitionswith differing degrees of diffusion weighting, it can be seen that the self-term of the backgroundgradients will cancel since this term will be present in each image. However, the cross-term

R106 D L Thomas et al
remains as it is proportional to the changing diffusion gradient, and if not suitably treated, thisterm will introduce a systematic error into the ADC measurement. The additional diffusionweighting as a result of the imaging gradients will generally lead to an overestimation ofthe ADC. It should be noted that the unique sign-dependence of the b-factor cross-term inequation (2.18) allows the presence of background gradients to be ascertained with the use ofdiffusion gradients of alternate sign in two successive experiments. It is important to note thateven in an isotropic medium, the self-terms are relevant and must be considered.
2.3.5. Principal diffusivities. The magnitude of the tensor components depends on the subjectorientation within the laboratory frame of reference defined by the read, phase and slice gradientdirections {x, y, z}. Rotation of the sample will change the individual components and thetensor is, therefore, non-unique. The sample will, however, possess a unique local orthogonalcoordinate system {ε1, ε2, ε3} (the principal coordinate axes) in which the displacements alongthe orthogonal directions appear uncorrelated. The diffusion coefficients along these threeprincipal directions are termed λ1, λ2 and λ3 (the principal diffusivities). The principalcoordinate axes and diffusivities correspond mathematically to the eigenfactors and eigenvaluesrespectively of the diagonalized diffusion tensor, so that the following relationship applies:
DE = E( where E = (ε1|ε2|ε3) and ( =(λ1 0 00 λ2 00 0 λ3
). (2.19)
In macroscopically anisotropic media such as white matter, these principal directionscorrespond to the orthotropic directions of the internal structure.
2.3.6. Diffusion ellipsoid. The properties of the diffusion tensor can be visualized in terms ofan effective diffusion ellipsoid (Basser et al 1995). This geometric formulation defines a three-dimensional surface of constant translational displacement probability for a given diffusiontime. The principal axes of the ellipsoid are the mean effective diffusive displacements alongthe principal coordinate axes. The visual interpretation of the form of the ellipsoid correspondsto the state of a drop of ink after being added to a water-filled container. The dispersion of theink droplet in the isotropic medium will be direction independent and the resulting sphericalvolume represents the shape of the diffusion ellipsoid in an isotropic material. If the water issubstituted for an anisotropic medium, the spatially distributed dispersion of the droplet willfollow the directional dependence of the tensor. The magnitude of the radii of the resultingellipsoid (i.e. its overall size) when compared to the corresponding geometry of the sphericalsurface in the isotropic situation reflects the general differences in diffusivity. The ellipsoidrepresentation of the tensor can be determined for each voxel in an image in order to providea striking visual indication of the degree of directional dependence and structural similarity(see figure 2).
2.3.7. Scalar invariants. The orientation dependence of the diffusion tensor can be usedto provide important physiological and morphological information concerning the biologicalsystem under consideration. However, an objective measure of the inherent diffusivity of thesample is precluded unless the diffusion gradient axes are aligned with the principal coordinateaxes of the object. The coincidence of these two frames of reference is unlikely due to theunpredictability and variability of the principal axes. However, matrix algebra predicts theexistence of certain invariant, scalar combinations of the elements of the diffusion tensor.These measurements will possess rotational and translational invariance and thus will not

Measuring diffusion and perfusion using MRI R107
Figure 3. Calculation of unidirectional (X, Y,Z) ADC maps and maps of the trace of the diffusiontensor, from three sets of single axis (X, Y,Z) diffusion-weighted images at different b-values. Allimages were acquired 2 hours following middle cerebral artery occlusion in the rat. The effect oftissue anisotropy on lesion delineation (left side of image) is observed in the X, Y and Z ADCmaps. The chequered bars depict the process of image combination (e.g. by fitting of the imagesignal intensity to the monoexponential decay model, see inset top right) to generate the next levelof information and eliminate confounding image dependences.
depend on the sample orientation within the laboratory coordinate system. The best known ofthese invariant quantities is the trace of the diffusion tensor, Trace(D) which is given by
Trace(D) = Dxx + Dyy + Dzz = λ1 + λ2 + λ3 (2.20)
where the second and third expressions are the diagonal terms in the laboratory and principalframes of reference respectively. The invariant is scaled to provide a parameter, Dav, whereDav = 1
3 Trace(D). Figure 3 displays the procedure of obtaining a map of the trace parameterfrom the component images. In the example shown, ADC maps are generated by acquiringthree images with different diffusion weighting in each direction (x, y, z). The three ADCmaps are then averaged to create a Dav map. This parameter represents a comparable andconsistent measure of the mean diffusivity. It can be seen from the preceding discussion(sections 2.3.5 and 2.3.6) and equation (2.20) that Dav is proportional to the averaged sumof squares of the major and minor radii of the corresponding diffusion ellipsoid. It has beenshown that the measurement of the trace improves contrast between normal and ischaemictissue which would otherwise have been confounded by the anisotropy-related subjectivity ofthe diffusion measurement (van Gelderen et al 1994, Lythgoe et al 1997). It should be notedthat in an imaging experiment, the individual determination of each of the diagonal tensorelements is a time-consuming process and must include the analysis of the contributions of thebackground gradients (Basser 1995). In order to optimize the time efficiency and in order toreduce the sensitivity to background gradients, single shot trace sequences have been devised(Mori and van Zijl 1995, Wong et al 1995). Simultaneous application of gradient pulses inmultiple directions provides equal diffusion weighting to the elements of the diagonal tensorwhile the off-diagonal elements cancel out.

R108 D L Thomas et al
In a similar manner to the previous discussion of invariant measures of intrinsicdiffusivity, the characterization of the degree of anisotropy in a medium also requires a scalar,rotationally invariant measurement. A variety of such quantities incorporating combinationsof the principal diffusivities have been devised which possess this attribute such as thelattice anisotropy index (Pierpaoli and Basser 1996). However, a methodology for simplevisualization of the degree of anisotropy (usually with the use of colour coding schemes) isstill being sought.
2.3.8. Background gradients. The importance of the imaging gradients to the accuracy ofthe ADC measurement has already been described. The background gradients (i.e. gradientswhose specific purpose is not to provide diffusion weighting) also include a contributiondue to the gradients that are generated within the sample itself. These are generated as aresult of inter/intra-subject differences in the bulk susceptibility. The effect of intravascularsusceptibility variation is especially significant (Zhong et al 1991). The deleterious effect ofthese background gradients on ADC quantitation can be more significant than for the imaginggradients since the sample gradients are active during the entire experiment. The resultingsystematic error in the measured ADC can be either manifested by an under- or over-estimationof the value (Zhong et al 1991, Does et al 1999) and the diffusion-time-dependent effects ofrestriction will also be modified (Zhong et al 1991). Both self-terms and cross-terms willbe generated by the sample gradients but the self-mediated losses are usually eliminated bymultiple acquisitions (see section 2.3.4). The significance of the cross-terms can be reduced byoptimized positioning of the diffusion gradients in the pulse sequence, such as the placement ofbipolar diffusion gradient pairs around the 180◦ pulse (Hong and Dixon 1992) or the alternationof gradient polarity in a multi-echo sequence (Karlicek and Lowe 1980).
2.3.9. Discussion. As the uses of diffusion NMR are being demonstrated in an increasinglywide variety of applications, the complexity of the relationships between the external structureof a biological system, and the translational mobility within it, is becoming increasingly clear.
The underlying assumption of a Gaussian form for the conditional probability distributionupon which much of the preceding theoretical description of diffusion is based, is affected bythe impeding cellular architecture such as membranes, fibres and organelles. The experimentalobservation of non-monoexponential signal attenuation plots is the most obvious indicator ofthe deviation of theory from reality. However, the appearance of this behaviour in experimentaldata can reflect any one of the interrelated complications discussed in the preceding sections—restriction, background gradient, multiple compartments, exchange or anisotropy—and it ismore likely that a host of these and other factors contribute to this observation. Hence,a theoretical model of the tissue is ideally required in order to relate the diffusion NMRmeasurements to the physical and geometrical properties of the tissue (Szafer et al 1995,Pfeuffer et al 1998). A complete characterization of tissue at the cellular level is the ultimategoal of the diffusion technique but requires a more complete understanding of the organizationof biological systems.
2.4. Implementation of the NMR diffusion technique
2.4.1. Hardware. In order to implement diffusion imaging with a satisfactory degree ofaccuracy and precision, a number of practical issues have to be addressed. In addition to thepotential biophysical issues described in the previous sections, system-related factors are also asignificant consideration. The gradients obviously play a crucial role by inducing the diffusionweighting and a high degree of gradient stability is sought in order to provide reproducible

Measuring diffusion and perfusion using MRI R109
ADC values. Any gradient mismatch between a pair of diffusion gradients would induceartefactual signal loss. A well calibrated and highly linear gradient set with well definedcontrol of amplitude and direction is required. Errors in the gradient strength can be especiallysevere in diffusion imaging due to the eddy currents which arise as a result of the rapid andpowerful pulsing of the gradient coils (Ahn and Cho 1991). Eddy current fields are induced inthe presence of conducting structures such as the cryostat shield and oppose the main magneticfield in accordance with Lenz’s law of electromagnetic induction. The fields persist, decayingwith multi-exponential characteristics whose time constants are associated with the resistanceand the inductance of the current path and may be of the order of hundreds of ms. For thediffusion experiment, this can result in an imbalance between the diffusion-sensitizing gradientsand, therefore, unintended signal dephasing. The effects of eddy currents can be reduced withpre-emphasis compensation techniques or, more efficiently, by hardware modifications suchas actively shielded gradients (Mansfield and Chapman 1987).
Another important source of inaccuracies is the sensitivity of the technique to bulk subjectmotion even to the extent of physiological pulsations. The resulting phase errors will bemanifested as ghosting and smearing artefacts in the phase-encoding direction of an imageacquired with a 2D-Fourier transform (FT) sequence. Phase discontinuities arise betweensuccessive phase encoding cycles such that the lines of k-space are acquired with an interveningrecovery time (TR) that may be close to the period of the motion. The motion artefacts can besignificantly reduced in such sequences with the use of a navigator-echo-based phase correctionin which an extra non-phase-encoded echo is acquired together with each k-space line (Ordidgeet al 1994, Anderson and Gore 1994). The motion-induced relative phase changes of thesenavigator echoes with respect to a reference echo can then be used to back-correct the respectivek-space lines. The use of comfortable subject restraints and single shot MRI methods (seenext section) have virtually eliminated the problem of motion artefacts.
2.4.2. Pulse sequences. Any imaging strategy can conceivably be implemented for diffusionimaging whether on its own or in combination with a separate diffusion preparation period.However, quantitative studies may preclude the use of certain techniques due to the difficultyin ascertaining the overall b-factor and signal pathways. Bipolar gradients (i.e. immediaterefocusing) are commonly incorporated in gradient-echo-based methods. A pair of monopolargradients (i.e. delayed refocusing) positioned around a refocusing 180◦ pulse in a spin-echo-based sequence is an efficient manner of prolonging the diffusion time at the expense ofadditional T2-mediated signal decay (as shown in figure 1). Stimulated echo sequencescomprise three (usually 90◦) RF pulses with diffusion gradients placed after the first andthird pulses. This scheme allows the investigation of variable diffusion times without as severea penalty in T2 signal loss (Merboldt et al 1991). The signal similarly undergoes delayedrefocusing, but the signal is stored along the longitudinal axis during much of the preparationperiod. Signal decay is, therefore, via T1 relaxation (where usually T1 � T2) but signal tonoise (SNR) is reduced by 50% with respect to spin-echo preparation.
Single shot techniques for signal acquisition have become the standard procedure fordiffusion imaging due to the improved SNR per unit time and the elimination of motionartefacts. An entire set of echoes needed to form an image is collected within a singleacquisition period (∼25–300 ms). High speed fast low angle shot (FLASH) imaging (Leeand Price 1994, Thomas et al 1998) steady-state free precession (SSFP, also called CE-FAST)(Le Bihan 1988, Merboldt et al 1989) and high speed stimulated echo (Merboldt et al 1992)have been implemented. The method of echo-planar imaging (EPI) has become establishedas the technique of choice for systems with the appropriate hardware (Turner 1998). Rapidgradient switching enables the attainment of acquisition times of <100 ms. EPI images are,

R110 D L Thomas et al
however, especially vulnerable to distortion and signal dropout (susceptibility artefact) and tothe misregistration of the fat signal (chemical shift artefact). Various techniques are currentlyunder development to reduce or eliminate these problems (e.g. see Fischer and Ladebeck 1998).
3. Imaging of perfusion using MRI
3.1. What is perfusion?
This section describes various MRI methods that can be used to measure the parameter knownas perfusion. The term perfusion describes the amount of blood delivered to the capillary bedsof a block of tissue in a certain period of time. Its units are therefore millilitres of blood per100 g of tissue per minute. It is important to distinguish between perfusion and bulk bloodflow (which occurs along major arteries and veins). Perfusion is blood flow at the capillarylevel, and is closely related to the delivery of oxygen and other nutrients to the tissue. It isthis quantity which determines whether the energy status of the tissue is likely to becomecompromised. Perfusion is therefore an essential parameter, and for this reason much efforthas been put into its measurement. Two main MRI approaches have been developed: bolustracking and arterial spin labelling. This section describes the basic principles behind thesetechniques.
3.2. Measurement of perfusion using bolus tracking methods
3.2.1. Introduction to MR bolus tracking using dynamic susceptibility contrast agents.Paramagnetic contrast agents have been used for the past ten years to obtain informationabout different physiological parameters related to CBF, cerebral blood volume (CBV) and themean transit time (MTT) of blood through a volume of tissue. This technique, usually referredto as dynamic susceptibility contrast (DSC) MRI, involves the injection of a bolus of contrastagent and the rapid measurement of the MRI signal loss due to spin dephasing (i.e., decreasein T2 and T ∗
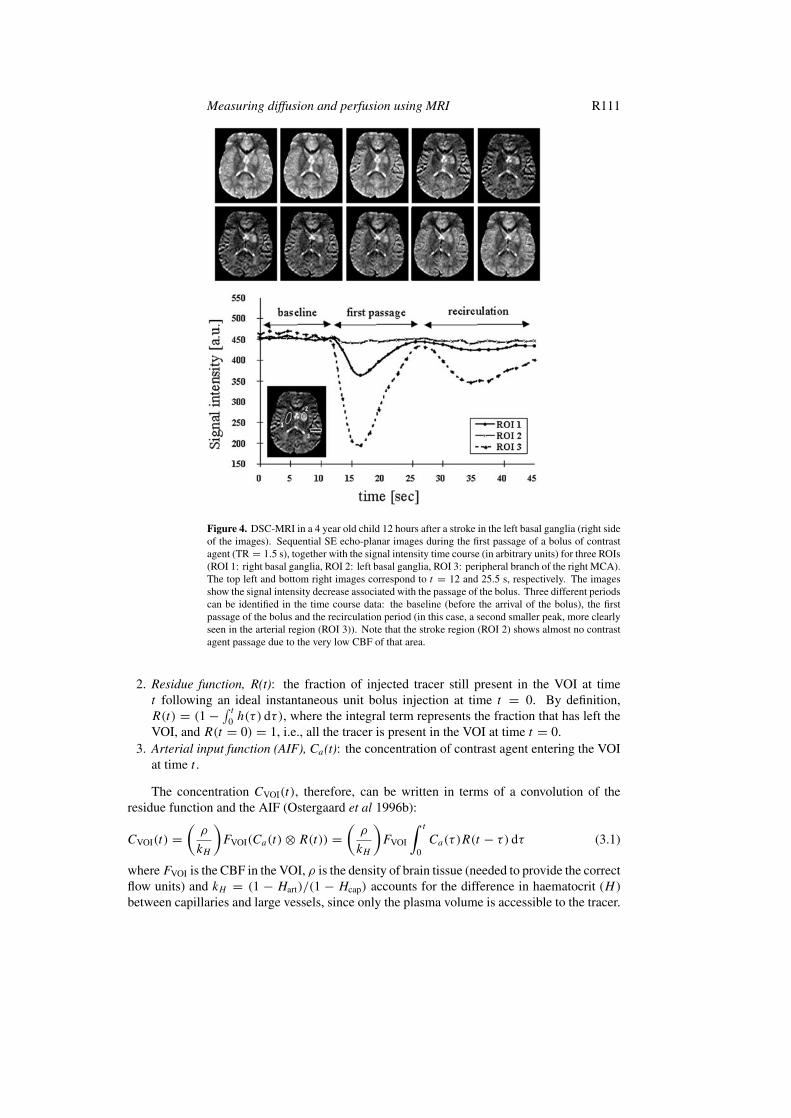
2 ) during its fast passage through the tissue (Villringer et al 1988). Although thevascular space is a small fraction of the total tissue volume (∼5% in the human brain), thecompartmentalization of contrast agent within the intravascular space leads to a significanttransient drop in signal. This susceptibility effect extends beyond the vascular space (Gillisand Koenig 1987, Villringer et al 1988) and, in regions with an intact blood:brain barrier(BBB), dominates over the more local T1 relaxation enhancement. Since the transit time of thebolus through the tissue is only a few seconds, a fast imaging technique is required to obtainsequential images during the wash-in and wash-out of the contrast material (figure 4). Thechoice of the imaging technique depends on many factors, such as region of the brain, regionalcoverage, time resolution and hardware specifications.
3.2.2. Perfusion model for intravascular MR contrast agents. The model used for perfusionquantification is based on the principles of tracer kinetics for non-diffusable tracers (Zierler1962, 1965, Axel 1980), and relies on the assumption that in the presence of an intact BBB, thecontrast material remains intravascular. The concentration CVOI(t) of tracer in a given volumeof interest (VOI) can be described in terms of three functions (Axel 1995, Ostergaard et al1996b):
1. Transport function, h(t): the probability density function of transit time t through theVOI following an ideal instantaneous unit bolus injection. This reflects the distribution oftransit times through the voxel, which is dependent upon the vascular structure and flow.
Measuring diffusion and perfusion using MRI R111
Figure 4. DSC-MRI in a 4 year old child 12 hours after a stroke in the left basal ganglia (right sideof the images). Sequential SE echo-planar images during the first passage of a bolus of contrastagent (TR = 1.5 s), together with the signal intensity time course (in arbitrary units) for three ROIs(ROI 1: right basal ganglia, ROI 2: left basal ganglia, ROI 3: peripheral branch of the right MCA).The top left and bottom right images correspond to t = 12 and 25.5 s, respectively. The imagesshow the signal intensity decrease associated with the passage of the bolus. Three different periodscan be identified in the time course data: the baseline (before the arrival of the bolus), the firstpassage of the bolus and the recirculation period (in this case, a second smaller peak, more clearlyseen in the arterial region (ROI 3)). Note that the stroke region (ROI 2) shows almost no contrastagent passage due to the very low CBF of that area.
2. Residue function, R(t): the fraction of injected tracer still present in the VOI at timet following an ideal instantaneous unit bolus injection at time t = 0. By definition,R(t) = (1 − ∫ t
0 h(τ) dτ), where the integral term represents the fraction that has left theVOI, and R(t = 0) = 1, i.e., all the tracer is present in the VOI at time t = 0.
3. Arterial input function (AIF), Ca(t): the concentration of contrast agent entering the VOIat time t .
The concentration CVOI(t), therefore, can be written in terms of a convolution of theresidue function and the AIF (Ostergaard et al 1996b):
CVOI(t) =(
ρ
kH
)FVOI(Ca(t) ⊗ R(t)) =
(ρ
kH
)FVOI
∫ t
0Ca(τ)R(t − τ) dτ (3.1)
whereFVOI is the CBF in the VOI, ρ is the density of brain tissue (needed to provide the correctflow units) and kH = (1 − Hart)/(1 − Hcap) accounts for the difference in haematocrit (H )between capillaries and large vessels, since only the plasma volume is accessible to the tracer.
R112 D L Thomas et al
This expression can be interpreted by considering the AIF as a superposition of consecutiveideal boluses Ca(τ) dτ injected at time τ . For each ideal bolus, the concentration still presentin the VOI at time t will be proportional to Ca(τ)R(t − τ) dτ , and the total concentrationCVOI(t) will be given by the sum (or integral) of all these contributions. Therefore, in order tocalculate CBF, equation (3.1) must be deconvolved to isolate FVOIR(t), and the flow obtainedfrom its value at time t = 0.
As mentioned above, CBV can be also obtained from DSC-MRI data. For an intact BBB,CBV is proportional to the normalized total amount of tracer,
CBV =(kH
ρ
) ∫CVOI(t) dt∫Ca(t) dt
. (3.2)
The normalization to the AIF accounts for the fact that, independent of the CBV, if more traceris injected, a greater concentration will reach the VOI.
The third physiological parameter that can be calculated, MTT, is the average time requiredfor any given particle of tracer to pass through the tissue, following an ideal instantaneous bolusinjection. By using the definition of the transport function, MTT can be written as the ratio ofthe first moment of the transport function to its zeroth moment:
MTT =∫th(t) dt∫h(t) dt
. (3.3)
In the classical outflow experiment (where the concentration in the venous output, COUT(t),is measured rather than the concentration at the VOI), the MTT can be calculated from thefirst moment of the tracer concentration (Axel 1995). However, as pointed out by Weisskoffet al (1993), this MTT is distinct from the first moment of CVOI(t). Therefore, calculationof MTT cannot be performed without solving first equation (3.3), and the first moment ofCVOI(t) is just an approximation and depends on the topology of the vasculature. CBF,CBV and MTT are related through the central volume theorem (Stewart 1894, Meier andZierler 1954) by MTT = CBV/FVOI. Therefore, once CBF and CBV are known, MTT canalso be calculated directly. Conversely, some studies have used the central volume theoremto estimate a ‘perfusion index’ (‘CBFi’) from the ratio of the CBV to the first moment ofthe concentration–time curve (used as an approximation to MTT). However, apart from thepreviously mentioned dependency on the underlying vascular structure, this ‘perfusion index’is influenced by the shape of the bolus, since the first moment contains contributions from boththe MTT and the first moment of the AIF (Axel 1995).
To use this model with MRI data it is necessary to convert the observed MR signal intensityvariations to changes in contrast agent concentration. It has been shown, both empirically(Villringer et al 1988, Rosen et al 1990, Hedehus et al 1997) and using Monte Carlo simulations(Fisel et al 1991, Weisskoff et al 1994, Boxerman et al 1995, Kennan et al 1994), that thetracer concentration is approximately proportional to the observed change in the relaxation rateR2 = 1/T2 (orR∗
2 ) in normally perfused tissue. By assuming a single exponential relationship,the change in relaxation rate (�R2) can be obtained from the change in signal intensity fromthe baseline signal before contrast administration (S0),
CVOI(t) = κVOI �R2 = −κVOI
TEln
(SVOI(t)
S0
)(3.4)
where SVOI(t) is the signal intensity measured in the VOI at time t , and TE is the echo time ofthe pulse sequence. The proportionality constant κVOI depends on the tissue, the contrast agent,the field strength and the pulse sequence parameters. An equivalent relationship is assumedfor the concentration of the tracer in the arterial input (with a proportionality constant κart).

Measuring diffusion and perfusion using MRI R113
Figure 5. T2-weighted turbo spin-echo (TSE) (top left), diffusion-weighted image (top middle),average ADC map and DSC-MRI data from the same 4 year old child as in figure 4, 12 hours aftera stroke in the left basal ganglia (right side of the images). The images in the bottom row are theCBF, MTT and CBV maps obtained from the dynamic data shown in figure 4. A subtle region ofhyperintensity can be seen in the TSE image. This ischaemic region is much more clearly seen onthe diffusion and perfusion maps.
There are a number of assumptions for the model described above apart from the alreadymentioned intact BBB: first, that the flow is stable during the measurement, and that the contrastagent is really a tracer (it has no effect on the CBF and has negligible volume itself); second,that the change in T1 relaxation is negligible; third, that the recirculation of the tracer (seefigure 4) is negligible or eliminated. This can be achieved, either by truncating the curve, orby fitting a portion of the curve to an assumed bolus shape function, typically a gamma-variatefunction (Starmer and Clark 1970, Berninger et al 1981). Finally, since the AIF is estimatedfrom a major vessel (such as the MCA), the dispersal and delay of the bolus as it reaches theVOI must not be significant. This last assumption is likely to be invalid during ischaemia andcan introduce an underestimate of the calculated perfusion.
3.2.3. Quantitative parameters available from DSC-MRI. Although deconvolution methodsallow regional CBF, CBV and MTT to be calculated (as shown in figure 5), quantificationusing more simplistic approaches has commonly been used. These different approaches to thequantification of data obtained using DSC-MRI can be divided into three main categories:
(a) quantification of absolute CBF;(b) quantification of relative CBF (relCBF) and(c) quantification using summary parameters, such as time to peak (TTP), bolus arrival time
(BAT), maximum peak concentration (MPC), full width at half maximum (FWHM), peakarea (PA) and first moment of the peak (C(1)
VOI), as well as parameters defined from thecoefficients of the gamma-variate function.

R114 D L Thomas et al
The first two approaches are very technically demanding since they require an accuratecharacterization of the AIF and its deconvolution from the residue function. The AIF dependsnot only on the shape of the injected bolus, but also on the cardiac output, the vascular geometryand the cerebral vascular resistance. The AIF can be estimated by measuring the signal lossin a region of interest positioned on a feeding cerebral artery, such as the carotid artery or themiddle cerebral artery (MCA) (Porkka et al 1991, Rosen et al 1991, Perman et al 1992), andit has been shown to be proportional to measurements obtained invasively by arterial bloodsampling in animals (Porkka et al 1991, Rosen et al 1991). Several methods to deconvolveequation (3.1) have been proposed. Ostergaard et al (1996b) have recently compared theperformance of some of them, both using Monte Carlo simulations and experimental data.From the methods studied, they concluded the model-independent approach using the singularvalue decomposition (SVD) technique was the most accurate, independent of the underlyingvascular structure (R(t)) and volume (CBV).
The use of summary parameters, on the other hand, does not require the deconvolutionof the measured signal and it has been widely used, both in animal and human studiesdue to its much simpler and less time-consuming processing. However, there is no simplerelationship between the summary parameters and CBF. They also depend on other factors,such as CBV, MTT, bolus volume and shape, injection rate and cardiac output. This makestheir interpretation less straightforward, and in general it will depend on assumptions aboutthe underlying vascular structure (Weisskoff et al 1993, Gobbel et al 1991). Furthermore,accurate comparisons between subjects, or repeated measurements in follow-up studies, arenot possible. However, when no information about the AIF is accessible, summary parametersare the only quantitative option and, in many cases, they can be useful in helping to distinguishbetween various pathological and physiological situations.
3.3. Measurement of perfusion using arterial spin-labelling methods
3.3.1. Introduction to arterial spin labelling (ASL). The arterial spin-labelling (ASL)methods for perfusion measurement are based on the fact that the magnetization and relaxationcharacteristics of tissue water are affected by the inflow of blood water. An MR image can bemade sensitive to CBF if the magnetic state of blood water spins is different to that of the tissuewater spins. In general, two images are acquired in an ASL experiment: one in which bloodand tissue water magnetizations are different (the spin-labelled image) and one in which thetwo magnetic states are the same (the control image). Subtraction of the spin-labelled fromthe control image results in an image whose intensity is directly related to perfusion. Thissection outlines the model used to quantify perfusion and describes the most common pulsesequences used in ASL techniques.
3.3.2. Tissue model for quantification of perfusion with ASL. Longitudinal relaxation oftissue water magnetization is classically described by the Bloch equation (Abragam 1961):
dMz(t)
dt= M0
z − Mz(t)
T1(3.5)
where Mz(t) is the longitudinal magnetization per gram of tissue at time t , M0z is the fully
relaxed value ofMz(t) and T1 is the longitudinal relaxation time. This equation can be extendedto include the effects of flow by the addition of two extra terms:
dMz(t)
dt= M0
z − Mz(t)
T1+ fMa(t) − fMv(t). (3.6)

Measuring diffusion and perfusion using MRI R115
The first term (fMa(t)) represents the gain of magnetization by the tissue caused by inflow,and the second term (fMv(t)) accounts for the loss of magnetization due to outflow (Ma(t)
is the magnetization of the inflowing (arterial) blood per ml, Mv(t) is the magnetization ofthe outflowing (venous) blood per ml and f is blood flow (in ml g−1 s−1). In a well mixedcompartment, such as brain tissue and microvasculature, the magnetization of the venousblood is related to that of the brain tissue via the blood:brain partition coefficient of water λ(Herscovitch and Raichle 1985), by:
Mv(t) = Mb(t)
λ(3.7)
where Mb(t) is the longitudinal magnetization per gram of brain tissue water, and soequation (3.6) can be written as:
dMb(t)
dt= M0
b − Mb(t)
T1+ fMa(t) − f
λMb(t). (3.8)
Therefore, it can be seen that by altering the state of the arterial magnetization Ma , one canmodify the apparent relaxation and magnetization of the brain tissue water. If the state ofthe inflowing blood water is known and the change of magnetization of the tissue water ismeasured, then solving equation (3.8) for f will enable the calculation of blood flow. Ingeneral, arterial magnetization is ‘labelled’ in ASL by spin inversion. The different ways inwhich this can be achieved constitute the various ASL techniques, as described in the followingsections.
3.3.3. Continuous arterial spin labelling. The original ASL technique, proposed by Detreet al (1992, Williams et al 1992), is now known generally as continuous arterial spin labelling(CASL). In this approach, blood water is continuously inverted as it flows into the brain for aperiod of several seconds, allowing a flow-dependent steady state of brain tissue magnetizationto develop (see figure 6(a)). An image is then acquired using a rapid imaging technique suchas echo-planar imaging (EPI). A control image is acquired in which spin labelling of arterialwater is not performed. The difference between these two images can be calculated fromequation (3.8), and leads to the following equation for blood flow (Williams et al 1992):
f = λ
T1app
(Mcontb − M label
b )
2αMcontb
(3.9)
where α is the efficiency of spin inversion (see next paragraph), Mcontb and M label
b are the steadystate control and spin-labelled tissue magnetizations respectively, and T1app is the longitudinalrelaxation time of brain tissue including the effect of flow i.e.
1
T1app= 1
T1+f
λ. (3.10)
Equation (3.10) is a fundamental equation of ASL, showing how the apparent longitudinalrelaxation time is directly related to perfusion.
Continuous arterial spin inversion is achieved using adiabatic fast passage (AFP). An off-resonance radio-frequency (RF) pulse is applied in the presence of a magnetic field gradient inthe slice select direction. As blood flows into the brain, the effective magnetic field experiencedby the blood water sweeps from being parallel to the main field to being anti-parallel. As longas the adiabatic condition (Abragam 1961) is satisfied, i.e.
1/T1a, 1/T2a � (1/B1)Gv � γB1 (3.11)
(where T1a , T2a are the longitudinal and transverse relaxation times of arterial blood water,B1 is the amplitude of the RF pulse, G is the amplitude of the field gradient, v is the blood

R116 D L Thomas et al
Figure 6. Spin-labelling strategies for the three most common ASL techniques: (a) continuousASL, (b) EPISTAR and (c) FAIR. In (a), the dashed line indicates the plane of inversion of theadiabatic fast passage RF pulse. In (b) and (c), the shaded areas indicate the regions which areinverted for pulsed spin labelling. The imaging slice is represented by diagonal lines.
velocity and γ is the magnetogyric ratio), then the magnetization of the flowing spins willremain aligned with the effective magnetic field, and so will switch from being fully relaxed tobeing inverted. In practice, this means that inversion must take place in a major artery wherethe blood velocity is sufficient to satisfy the above condition. However, a range of velocitiesmay be present, some of which may meet the adiabatic condition and others of which may not.This results in imperfect inversion of arterial blood water magnetization. To account for thiseffect, a term known as the inversion efficiency (α) is introduced into equation (3.9) above. αis defined as follows: if all flowing water is inverted using an AFP pulse, α has a value of 1;if no inversion occurs, α = 0. Values of α using AFP in vivo are typically in the region of0.7–0.8.
Several additional factors affect the accuracy of a perfusion measurement made usingCASL. The most important of these are:
• Magnetization transfer (MT). The application of a long off-resonance RF pulse whichis used to perform the AFP inversion of arterial blood water has a secondary effect onthe tissue magnetization in the slice of interest. Although no direct saturation of MRI-observable water in the imaging slice occurs due to the pulse being applied several kHzoff-resonance, the magnetization of water bound to macromolecules can be affected, since
Measuring diffusion and perfusion using MRI R117
the resonance peak of this group of spins is very wide. Magnetization transfer between‘free’ and ‘bound’ tissue water then causes the observed MRI signal to decrease. Fora more complete discussion of MT see Wolff and Balaban (1989), but suffice it to saythat these effects will cause the expected signal difference between the spin-labelled andcontrol CASL images to decrease. Proper quantification of perfusion then requires MTeffects to be accounted for (Zhang et al 1992, McLaughlin et al 1997). The most importantconsequence of this relates to the acquisition of the control CASL image. In order for thecontrol image to experience exactly the same MT effects as the spin-labelled image, anoff-resonance RF pulse must be applied prior to its acquisition. This is usually done withthe magnetic field gradient reversed in polarity, so that the ‘plane of inversion’ for thecontrol image is positioned above the head of the subject, and no blood water inversionresults (see figure 6).
• Arterial transit times. The equation for the calculation of blood flow (equation (3.9)) wasderived assuming that blood water arrives at the tissue of interest in a state defined by α,the inversion efficiency. However, during the time it takes for the blood to travel fromthe point where it is inverted to where it reaches the capillary bed and exchanges into thetissue, relaxation causes the degree of inversion to decrease. To account for this effect,one could measure the transit time and incorporate it into the Bloch equation analysisdescribed above (Zhang et al 1992). However, in most situations, a range of transit timeswill exist across an image, and signal-to-noise and time restrictions prevent determinationof transit time on a pixel-by-pixel basis in practical applications of the technique (Yeet al 1997). In 1996, Alsop and Detre introduced a modification of the standard CASLtechnique in which they put a delay between the end of the labelling period and the imageacquisition (Alsop and Detre 1996b). They showed this approach allows quantificationof perfusion without sensitivity to differences in transit times, as long as the delay usedis longer than the longest transit time present and the T1-values of blood and the tissueof interest are approximately the same. Although there is a loss of signal to noise in thedifference images (control − labelled) using this technique, the resulting CBF maps areof higher quality (see figure 7) due to their insensitivity to transit time effects and theabsence of vascular artefacts (see next paragraph).
• Vascular signal contamination. The Bloch equation model described above predicts thebehaviour of tissue water magnetization in the presence of flow. In addition to tissue, atypical MRI voxel also contains blood signal from capillaries and possibly from largervessels. The signal in the larger vessels is labelled by the AFP inversion pulse, and sowill potentially contribute to a signal difference between the spin-labelled and controlimages. However, if the blood in these vessels does not perfuse tissue in the same voxel,its contribution to the difference signal is not desired. The blood is merely passing throughthe voxel, possibly en route to perfusing tissue further downstream. In order to eliminatethe signal from these larger vessels, flow-sensitive crusher gradients can be used (Detreet al 1992, Ye et al 1997). Alternatively, the technique of Alsop and Detre described above(Alsop and Detre 1996b), in which a delay is inserted between the end of the labellingperiod and the image acquisition, allows most of the faster moving blood to wash out ofthe imaging slice prior to image acquisition. In this way, vascular artefacts are eliminated,except in regions where extended transit times cause spin-labelled blood to still be presentin the vasculature at the time of image acquisition (such as regions with collateral flow).
• Multi-slice CASL imaging. Due to the need for equivalent MT effects in both thespin-labelled and control CASL images, multi-slice acquisition using this technique iscomplicated. Two methods have been proposed to tackle this problem. In one (Silva et al1995), an RF surface coil with a small spatial range is placed on the neck and used to

R118 D L Thomas et al
Figure 7. Multi-slice perfusion images acquired using continuous ASL with various post-labellingdelays. With short delays, the majority of spin-labelled blood resides in the vasculature (top row).As the delay increases, spin-labelled blood distributes throughout the brain tissue in a mannerdirectly related to CBF. Vascular artefacts are greatly reduced at long delay times (lower rows).(Image kindly provided by Dr David Alsop.)
perform spin labelling. The B1 field generated by this coil does not reach the imagingslices and thus causes no MT effect. In the second approach (Alsop and Detre 1996a,1998), the control RF pulse is designed to achieve identical MT effects to the inversionpulse throughout the whole brain. For the exact details of these sequences, the reader isreferred to the relevant reference. While not yet in wide use, these methods hold greatpromise for the future if CASL is to become a practical clinical and research tool.
An example of a CASL image acquired using various post-labelling delays is shown infigure 7. The images show that with a short delay, the difference signal is higher but has avery non-uniform distribution throughout the brain, consistent with the signal deriving mostlyfrom arteries and arterioles. As the delay increases, the vascular contamination and transittime sensitivity are reduced, resulting in more uniform and accurate CBF maps.
3.3.4. Pulsed arterial spin labelling. The difference between CASL and pulsed arterialspin-labelling (PASL) techniques is the way in which spin labelling is performed. In PASL, ashort (i.e. several millisecond) RF pulse is used to invert the magnetization of all the water in aregion adjacent to the imaging slice(s). Blood in this region then flows into the imaging sliceduring an inflow time TI, at the end of which the image is acquired. A second image is requiredin which flow weighting is not applied, and subtraction of the two images results in a differenceimage whose signal intensity is proportional to flow. The advantages of PASL over CASL arethat the inversion region can be placed very close to the imaging slice (since the inversionprocess does not rely on blood velocity), thus minimizing transit time effects, and that the

Measuring diffusion and perfusion using MRI R119
magnetization transfer effects are less for short RF pulses compared to long continuous pulses.The main disadvantage of PASL is a reduced sensitivity to flow, since the inverted blood waterrelaxes during the inflow time. Several distinct pulse sequences have been developed whichuse PASL to measure perfusion:
1. Echo-planar imaging and signal targeting with alternating radio-frequency (EPISTAR)was the first PASL sequence to be proposed (Edelman et al 1994) and is shown schematically infigure 6(b). The general principle of the technique is similar to the CASL approach. Followingsaturation of the imaging slice (to reduce unwanted signal from static tissue water), a slab ofwater proximal to the imaging slice is inverted and blood from this region is allowed to flow intothe imaging slice during TI. As with CASL, the inflow of inverted blood water reduces the tissuemagnetization in the imaging slice. A control image with equivalent MT effects is acquiredby either applying the inversion distal to the imaging slice (Edelman et al 1994) or by using adouble inversion pulse to remove the spin label (Edelman and Chen 1998). The difference insignal between the labelled and control images can be calculated from equation (3.8), and isgiven by (Calamante et al 1996, Kwong et al 1995):
�M = 2αM0b
f
λ
(exp(−TI/T1app) − exp(−TI/T1a)
1/T1a − 1/T1app
)(3.12)
where all parameters are as defined previously. If one assumes the T1 of blood and tissue tobe the same, α = 1 and f/λ � 1, equation (3.12) can be simplified to:
�M = 2M0b TI
f
λexp
(−TI
T1
). (3.13)
This equation is commonly used to calculate blood flow from PASL measurements. It shouldbe noted, however, that under certain circumstances (e.g. measuring blood flow in white matter,where the T1 of tissue and blood are significantly different) the assumptions made to derivethis equation are invalid and the full equation (3.12) must be used for accurate quantification ofperfusion. It is also interesting to compare equation (3.13) with equation (3.9), which showsthat the expected signal difference for PASL is a factor of approximately [exp(−TI/T1)] lessthan CASL under ideal conditions.
2. Flow-sensitive alternating inversion recovery (FAIR) (Kwong et al 1995, Kim 1995)is the second of the two main PASL techniques. It is based on the acquisition of a pair ofinversion recovery images (see figure 6(c)). The first image is acquired following a slice-selective inversion pulse, and the second image is acquired following a global inversion. Inboth cases the inflow time TI is the same, and so the signal from static tissue in the imaging sliceis the same. The difference between the images comes from the difference in magnetizationof inflowing blood in the two acquisitions: in the slice-selective inversion recovery (ssIR)image, inflowing blood is fully relaxed and so increases the apparent relaxation rate of thetissue water; in the global (non-selective) inversion recovery (nsIR) image, inflowing bloodis initially inverted and subsequently relaxing during TI and so affects the relaxation rate ofthe tissue water less. In fact, the signal difference due to perfusion in FAIR follows exactlythe same behaviour as that of EPISTAR (equations (3.12) and (3.13)), despite the raw imagecontrast being very different (since EPISTAR raw images are acquired after a saturation andFAIR raw images are acquired following an inversion). The reason for this is that the signaldifference derives from exactly the same source: inflowing blood being fully inverted in onecase and fully relaxed in the other. This point is illustrated in figure 8, which shows the rawspin-labelled images for EPISTAR and FAIR at several inflow times and the correspondingsubtraction images. The subtraction images are very similar for the two techniques.

R120 D L Thomas et al
Figure 8. Raw images and subtraction images (control − labelled) for EPISTAR and FAIR asa function of inversion time TI. (a) EPISTAR raw images, (b) FAIR raw images, (c) EPISTARsubtraction images and (d) FAIR subtraction images. TI values from left to right: 200, 400, 600,800, 1000 and 1200 ms. While the static tissue contrast is very different, the subtraction imagesare dependent only on the inflow of spin-labelled blood, and so are very similar. (Image kindlyprovided by Dr Eric C Wong, reprinted with permission.)
In order to properly quantify blood flow using FAIR, it is necessary to acquire imagesat a range of inflow times and fit the signal differences to the biexponential curve defined byequation (3.12). There are a total of five unknowns in this equation (α, M0
b , f , T1app andT1a). Three of these (α, M0
b and T1app) can be obtained by fitting the ssIR data to a standardinversion recovery monoexponential curve (MssIR = M0
b (1 − 2α exp(−TI/T1app))]). Fittingthe biexponential curve of equation (3.12) for f and T1a (or preferably just f if T1a is knownor measured separately) will then yield a value for CBF. Using this method, it is also possibleto estimate transit time effects (Yang et al 1998); however, the total time for a single CBFmeasurement is rather long (approximately 30 minutes).
The main limitations of PASL techniques are similar to those of CASL, though the extentof their effect may be different:
• Transit time effects are reduced in PASL compared to CASL since the edge of the labellingregion is generally closer to the imaging slice in PASL. This means that the physicaldistance that spins have to travel is less, and ideally is very short indeed. The mainlimiting factor for the proximity of the labelled region and imaging slice is the shape ofthe respective pulse profiles. Usually, adiabatic hyperbolic secant inversion pulses (Silveret al 1984) are used in PASL, which produce inversions with quite sharply defined edges.However, the distance between the edge of the labelled region and the imaging slice istypically of the order of the imaging slice thickness itself (several millimetres). Thiscompares typically to several centimetres in CASL. Nevertheless, transit times can causeproblems for CBF quantification in PASL, and methods have been proposed to reduce thesensitivity to these effects, either by pulse sequence manipulation (Wong et al 1998) or

Measuring diffusion and perfusion using MRI R121
by the use of sharper inversion pulses (FOCI pulses; see Ordidge et al 1996 and Yongbiet al 1999).
• Vascular contribution to the perfusion signal is not accounted for in the PASL model (in thesame way that it is not included in the CASL model). If an inflow time of sufficient lengthis used, it is reasonable to assume that all spin-labelled blood will either have exchangedwith tissue or washed through the imaging slice. However, to properly quantify CBF,PASL images are needed at a range of inversion times. Motion-sensitive crusher gradientscan be used to destroy signal from water which is moving rapidly, though the choice ofamplitude of these gradient is rather arbitrary. This is a problem which has yet to beproperly resolved.
• Multi-slice PASL can be performed fairly easily for both EPISTAR (in which severalimages are acquired progressively further from the inversion region) and FAIR (in whichthe slice-selective inversion is widened to accommodate extra imaging slices). However,this causes problems by introducing a range of transit times for the different slices. Transit-time-insensitive techniques are therefore preferable for multi-slice imaging, though theseare still under development and subject to certain limitations (see Wong et al 1997).
3.4. Advantages and disadvantages of MR perfusion techniques
Although neither ASL nor DSC-MRI require ionizing radiation, ASL has the extra benefitof using an endogenous contrast agent. This allows multiple measurements to be performedwithout any restriction. However, a drawback of ASL is that the intrinsic perfusion signal (i.e.the difference between the spin-labelled and control images) is generally only a few per centof the control image intensity, requiring good signal to noise for an accurate measurement.In DSC, signal intensity changes of the order of tens of per cent are observed at normal CBFlevels.
Both techniques behave reasonably well in the range of normal CBF values, although theyhave difficulties when dealing with very high or very low flow. In the limit of very low flow, thefirst obvious limitation is the low SNR of the measurement. This can be improved in the ASLtechnique by increasing the number of averages, which is not an option in the typical singlebolus DSC studies, due to its dynamic character. A further problem when measuring low flowsis related to the presence of long arrival delays for the arterial blood to the VOI, such as thoseresulting from collateral circulation in stroke regions. Although the latest ASL sequencesproposed (Alsop and Detre 1996b, Wong et al 1998) are less sensitive to differences in transittime (provided the appropriate sequence parameters are chosen), very long transit times maymake use of the required parameters impractical. In PASL, the transit time insensitivity canbe further improved by slice profile optimization (Pell et al 1998). Another possibility is totake account of the different transit times, by measuring them (Zhang et al 1992, Ye et al1997), or by using the bolus arrival time information from a DSC experiment. However, thisproblem is one of the fundamental limitations of the ASL technique for measuring CBF in thepresence of very long transit time delays. In the case of a very long delay, it may be impossibleto have tagged signal arriving at the tissue and, therefore, no effect will be observed. Thepresence of very long bolus arrival times is also a problem in DSC studies. The transit ofthe bolus from the site of injection (typically a vein) to the VOI can introduce a delay anddispersion (spread of the bolus shape). If these are not accounted for, they may cause anoverestimation of MTT and underestimation of CBF (Ostergaard et al 1996a, 1998, 1999,Schreiber et al 1998). While one can account for the dispersion from the site of injection(vein) to the artery where the AIF is measured, the extra dispersion from the artery to the inputof the VOI (where the true AIF should be obtained) cannot be easily ascertained. This extra

R122 D L Thomas et al
dispersion is particularly significant in cases of collateral flow to ischaemic areas. To addressthis problem, Ostergaard et al (1999) have recently incorporated a mathematical vascularmodel into the DSC analysis. They show that the vascular model approach is less sensitiveto vascular delay and dispersion than the conventional deconvolution approach. Their resultsare very promising, but further validation on a large number of patients with cerebrovasculardiseases is needed.
The case of very high flows can also be problematic for both MRI perfusion techniques.For ASL, the assumption of complete exchange may become invalid (Silva et al 1997a,b), andif this is not taken into account the perfusion will be underestimated (since only a fractionof the arterial magnetization is exchanged). In the DSC method, very high flow will causenarrowing of the �R2 response curve, making it potentially difficult to accurately characterizefor a given time resolution. However, in practice this does not seem to be a source of difficulty,since dispersion from the site of injection causes the bolus to be quite widely spread even whenCBF is high.
Both techniques can be used in a multi-slice protocol, although the maximum number ofslices is limited in each case. In DSC-MRI, the coverage is given by a compromise betweenthe number of slices and the time resolution (for typical repetition time values, a coverage of10–15 slices can be achieved using EPI). For the case of ASL, transit times limit the maximumnumber of slices (typically between five and ten slices can be obtained, depending on thespatial resolution). Another possibility for whole brain coverage is the use of 3D acquisitionmethods (Petrella et al 1997, Alsop and Detre 1999), though this tends to reduce the spatialresolution.
3.5. Other techniques for measuring perfusion-related parameters
In addition to the techniques which have been designed specifically to obtain quantitativemeasures of CBF, several other approaches have been developed in parallel which derivetheir contrast from parameters closely related to perfusion. These approaches will be brieflysummarized here, though for a full description of these methods, the reader is referred to therelevant literature.
3.5.1. Blood-oxygen-level-dependent (BOLD) imaging. Blood-oxygenation-level-dependent (BOLD) MRI is based on the magnetic properties of blood, which are dependenton the oxygenation state of haemoglobin (Thulborn et al 1982, Ogawa et al 1990). Becausedeoxygenated haemoglobin is more paramagnetic than oxygenated blood and normal tissue,it can act as an endogenous intravascular paramagnetic contrast agent. Deoxygenationresults in an increased magnetic susceptibility difference (due to an increase of paramagneticdeoxyhaemoglobin) in and around the vascular compartment, and thereby is expected to causesignal loss in both T ∗
2 - and T2-weighted images. This phenomenon is now widely used forMR functional neuroimaging (fMRI), in which local increases of image intensity have beenobserved in association with specific brain activation tasks (see section 4.2.2). However,the most elementary analysis of the biophysical and haemodynamic events relating to brainactivation lead to the conclusion that many factors can affect the MR signal in such studies. Thelist includes blood volume, blood flow, arterial and venous haemoglobin saturation, oxygenextraction rate, blood viscosity and haematocrit. This makes direct interpretation of BOLDimages very difficult. For an extensive review of the BOLD technique, see Ogawa et al(1998).

Measuring diffusion and perfusion using MRI R123
3.5.2. Steady-state contrast agents for measurement of blood volume. The duration of theeffect of the contrast agents used in DSC-MRI is limited to the time taken for the bolusto pass through the vasculature of the organ of interest; recirculation of the tracer after thefirst pass is minimal. However, certain intravascular contrast agents, such as ultrasmallsuperparamagnetic iron oxide (USPIO), have longer blood half-lives, since they are only slowlyeliminated from the blood pool (Weissleder et al 1990). As a result, it is possible to estimatedynamic changes in blood volume by measuring changes in R2 and R∗
2 of the tissue, whichare directly related to the blood volume containing the contrast agent. The paramagnetismof USPIO completely overwhelms any effects due to changes in the levels or concentrationof deoxyhaemoglobin, thus simplifying the analysis of the signal intensity changes. Undercertain circumstances CBV and CBF are very closely correlated, and so using this method it ispossible to estimate CBF behaviour. However, this is not generally the case, and measurementof CBV alone can usually only provide a limited amount of information regarding perfusionstatus.
3.5.3. Intra-voxel incoherent motion (IVIM). The structure of the microvasculature of thebrain is such that, on the scale of a typical imaging voxel, the flow of blood through capillariescan be viewed as incoherent, pseudo-random motion. Each voxel contains typically severalthousand capillaries, all of which are made up of multiple ‘straight’ segments oriented at manydifferent angles (Le Bihan 1995b). Blood flowing through the capillaries can thus be modelledas random, diffusion-like motion with an effective diffusion coefficient D∗. The value of D∗
will depend on factors such as the vascular geometry and the rate of perfusion, and will generallybe much higher than the effective diffusion coefficient of tissue water. The application ofdiffusion-sensitizing gradients (as described in section 2.2) will cause the signal intensity froma voxel to decay with biexponential characteristics: a rapid initial decrease as the microvascularsignal is eliminated at relatively low b-values, followed by a more gradual decline which isdetermined by the tissue ADC. Quantification of perfusion based on measurement of the lowb-value behaviour of signal intensity has been attempted, but dynamic range problems (due tolow CBV compared to tissue volume) and uncertainty of a correct vascular model have limitedthe usefulness of this method (see King et al 1992 and Pekar et al 1992).
4. Applications of diffusion and perfusion imaging
4.1. Diffusion-weighted imaging in biological systems
Diffusion-weighted imaging (DWI) (see section 2) and measurements of the apparent diffusioncoefficient (ADC) (see section 2.3.2) of water have been applied to various organs in the body,including brain, liver, pancreas, uterus, breast, bone and muscle. This holistic applicabilityhas meant that a diversity of conditions and systems may be studied in both research andclinical environments. Examples of such conditions include neurological disease (see below);brain myelination; liver cirrhosis or carcinomas; pancreatic cysts or tumours; bone marrowimaging for compression fractures; osteogenic sarcomas; musculoskeletal neoplasms; breastpathologies; uterus anisotropy and hyaline cartilage deterioration.
Due to the sensitivity of the diffusion-weighted images to motion, it is essential that theorgan or system of interest remains stationary, or that the imaging technique used is insensitiveto any gross movement. Because the brain is situated within the confines of the skull, andtherefore suffers less motion than organs of the chest or abdomen, it is well suited to the DWIand has therefore been the focus of attention for many years (Hoehn-Berlage 1995). Thereare reports of DWI changes in numerous neurological conditions such as stroke, subarachnoid
R124 D L Thomas et al
haemorrhage, Alzheimer’s disease, AIDS, epilepsy, head injury and brain tumours. Despitethe applicability of DWI to a range of neurological conditions the main area of interest hasbeen, and continues to be, in the field of stroke research (Moseley et al 1990, Baird and Warach1998).
In the following section we discuss why DWI has become so predominant in theinvestigation of stroke. We will also demonstrate that DWI provides not only the opportunityto identify the very early changes following a stroke, but also the opportunity to investigate theunderlying pathophysiology and treatment of this condition (Moseley et al 1990b, Van Bruggenet al 1994). Further we examine DWI in the context of the mechanisms of change duringcerebral ischaemia; CBF thresholds; metabolic correlations; temporal evolution of diffusionchange in experimental and human stroke and reperfusion.
4.1.1. Diffusion-weighted imaging: why the focus on stroke? Ischaemic stroke, which iscommonly caused by thrombotic or embolic occlusion of a cerebral artery resulting in tissuedamage, is the most common neurological disorder causing death or disability among adultsliving in industrialized nations. Stroke is a devastating condition and ranks third as a cause ofdeath, surpassed only by heart disease and cancer (Mas and Zuber 1991). In any given year inBritain, 250 000 people suffer from some form of stroke, and in 1990, the Office of PopulationCensus and Surveys for England and Wales reported a mortality of approximately 15 000 menand 26 000 women (Warlow 1998). In the United States, it is estimated that annually, that thereare as many as 550 000 hospitalizations and 150 000 deaths, and the average cost of treatmentper person for the first stroke is estimated to be $103 000. The total cost of stroke for 1990 inthe USA was $40.6 billion (Taylor et al 1998). Despite substantial declines in incidents duringthe last two decades (Mas and Zuber 1991), stroke is still a leading neurological reason forhospitalization and one of the most common causes of long term disability. From the abovestatistics we can see that stroke is a significant problem, and for the clinician investigating andtreating a stroke patient, an accurate diagnosis together with a technique to assess the effect oftherapy is essential. Before the advent of DWI, stroke patients would undergo a computerizedtomography (CT) scan or standard MRI investigation. However, ischaemic changes in the CTscan or standard magnetic resonance images were not observed until approximately 6 hoursfollowing the initial stroke event. In 1991, introduction of DWI allowed the identification ofa stroke minutes following the initial event, with the opportunity to monitor therapy and aidin a prognosis for the patient (Baird and Warach 1998); the reasons and interpretation for thechange in water diffusion are discussed below.
4.1.2. Mechanisms of DWI changes following a stroke. Moseley et al observed the first DWIchanges in cerebral ischaemia and attributed this ADC reduction of tissue water diffusion toan osmotically obliged shift of extracellular water to intracellular compartments, as a resultof a disruption of ion homeostasis and formation of cytotoxic oedema (Moseley et al 1990b).This occurs due to the following chain of events: a decreased blood supply following a strokereduces the amount of oxygen and glucose delivered to the tissue, and this is accompanied bya decrease in the available adenosine triphosphate (ATP), the main source of cellular energy.ATP normally provides energy to pump Na+ out of and K+ into the cell to maintain ionichomeostasis. When the supply of ATP ceases, there is an accumulation of intracellular Na+;this causes an influx of osmotically obliged water, which leads to cell swelling (cytotoxicoedema) and, in time, cell death.
Later work by Benveniste et al supported Moseley’s early hypothesis, with studies in whichthe ADC decreased during induction of cytotoxic oedema by ouabain (a specific inhibitor of

Measuring diffusion and perfusion using MRI R125
Na+, K+-ATPase) administration (Benveniste et al 1992). It was suggested that the reductionof ADC is indeed caused by an influx of extracellular water, which has a high intrinsicdiffusion, to intracellular compartments, where the water diffusion would be retarded dueto various intracellular obstacles and the relatively high cytoplasmic viscosity. Consequently,it is now accepted that an ischaemia-induced drop of the tissue water ADC is associated withthe development of cytotoxic oedema.
Despite this work, the exact biophysical mechanisms of water ADC reduction remainunclear. Several further hypotheses have been suggested to account for the mechanismsunderlying the ADC changes in ischaemia. Latour et al have suggested, for example, that DWIchanges are caused by a reduction in extracellular diffusion due to an increase in the tortuosityof the extracellular space that occurs after cell swelling (see section 2.3.3) (Latour et al 1994,Hasegawa et al 1996). Alternatively, Helpern et al suggested that a reduction in cell membranepermeability is a possible cause (Helpern et al 1992), whereas DWI of intracellular metabolitesand compartment specific markers indicate that a decrease in intracellular diffusivity mightbe involved (van der Toorn et al 1994, Duong et al 1998). This reduction in intracellulardiffusivity may be due to a decrease in the intracellular circulation or an increase in viscosity(Duong et al 1998).
A further parameter that may be calculated from diffusion-weighted images is that of tissueanisotropy (see section 2.3.4). Anisotropy gives an indication of the directional dependenceof water movement and therefore the confines of the biophysical environment, which may beexpected to change under such conditions as stroke. This indeed is the case, and followinga stroke it is not only the ADC that changes but also the tissue anisotropy. Although bothgrey and white matter are anisotropic (Lythgoe et al 1997), it is a change in the anisotropyof the cerebral white matter that is notable during the first 24 hours following an ischaemicevent (Sorensen et al 1999b), with changes in grey matter at later times (Zelaya et al 1999).This information provides a novel technique to probe the changes in cellular structure due toa reduction in cerebral blood flow.
4.1.3. Relation of diffusion-weighted imaging to cerebral blood flow. In 1992, using a gerbilmodel of forebrain ischaemia, Busza et al found that DWI signal enhancement only occurredwhen the CBF fell below 20 ml/100 g min−1 (Busza et al 1992). This is similar to the flowthreshold for the maintenance of tissue high-energy metabolites necessary for normal cellularion homeostasis (Crockard et al 1987, Allen et al 1988). These results differ from thoseachieved for the CBF threshold in a rat model of focal ischaemia, which is approximately35 ml/100 g min−1 (Perez Trepichio et al 1995, Kohno et al 1995). This discrepancy may bedue to the differences in species, properties of global and focal ischaemic lesions or techniquefor the measurement of CBF. Further work, using a middle cerebral artery occlusion (MCAO)rat model, has shown a time-dependent increase in CBF threshold from 34 ml/100 g min−1
(30 minutes) to 41 ml/100 g min−1 (120 minutes) over a 4 hour period, indicating the growingsensitivity of the tissue to perfusion deficits (Kohno et al 1995). This work was confirmed byMancuso et al who demonstrated that after 30 minutes the area occupied by more than 15%reduction in ADC corresponded to CBF levels below 25 ml/100 g min−1, and after 90 minutesthis threshold had increased to 30–35 ml/100 g min−1 (Mancuso et al 1995). In summary theCBF must be reduced to a certain level to induce an ADC decrease, although this threshold isdependent upon species and duration of the reduced CBF.
4.1.4. Relationship of DWI to metabolic alterations. Mintorovitch et al correlated DWI signalchange during ischaemia, with tissue water content, ATPase activity, and electrolyte content

R126 D L Thomas et al
(Mintorovitch et al 1994). Within 30 minutes of ischaemia, DWI changes had occurred witha concomitant decrease of 30% to 40% in ATPase activity, while tissue water content andelectrolyte concentrations were normal. By 60 minutes the ATPase activity had decreasedfurther, the water and sodium content had increased and the potassium concentration waslowered. These data indicate that DWI monitors very early disturbances of cellular ionpumps, at times when such changes are thought to be potentially reversible. Autoradiographictechniques for measuring CBF, ATP, glucose, lactate and pH have been used to study the spatialrelationship between DWI changes and metabolism following MCAO in the rat (Kohno et al1995). In contrast to changes observed in global ischaemia, in which the CBF thresholds forchanges in DWI and high-energy metabolites are similar (Busza et al 1992, Allen et al 1988),Kohno et al reported that during the early phase of focal cerebral ischaemia (30 minutes) thearea of hyperintensity seen on DWI was significantly larger than the region of ATP depletion,although it matched the area exhibiting tissue acidosis (Kohno et al 1995). This differencebecame progressively smaller with the evolution of the lesion, such that by 7 hours the areaof tissue damage, as indicated by DWI, was identical to the region of ATP depletion andhistological infarction. If DWI changes result from an alteration in compartmentation oftissue water, then the latter observations indicate that water redistribution occurs prior to theloss of high energy metabolites. These observations do not necessarily contradict the formerstatements, since the anaerobic production of metabolites, including lactate, can also give riseto redistribution of water, which might be expected to result in DWI changes. Consistentwith this is a good agreement between lactate production and DWI change (Decanniere et al1995), and further that DWI changes precede anoxic depolarization following cardiac arrestin experimental studies (de Crespigny et al 1999). The understanding that DWI indicatesacute changes in the cellular dynamics is further emphasized in recent work using a pigletmodel of secondary energy failure, in which a gradual ADC decline is observed followinga hypoxic–ischaemic insult. Here a close relationship between a decrease in ADC and highenergy phosphates was observed, while a nonlinear relationship to decrease in the nuclidetriphosphate pool (Thornton et al 1998).
As mentioned previously, several studies have shown that cytotoxic-oedema-relatedchanges in brain tissue water ADC are paralleled by lactate accumulation, decrease in highenergy phosphates and intracellular pH, and an increase in inorganic phosphate. However,a recent study showed that administration of the neurotoxin N-methyl-D-aspartate (NMDA)results in a ADC reduction, which is interesting as the NMDA-mediated excitotoxicity neitherleads to profound energy failure nor to a significant lactate accumulation, but does promotedepolarization, ion movements and cell swelling. Therefore, the metabolic basis underlyingthe acute reduction in brain water ADC is different in an excitotoxic insult compared to cerebralischaemia (Dijkhuizen et al 1996).
4.1.5. Monitoring ischaemic lesion development in animals and humans. It was firstdemonstrated, by the use of DWI, that following occlusion of a cerebral artery, the resultantischaemic lesion in both rat and cat expands primarily during the first 2 hours after MCAO(Roussel et al 1994, Hoehn-Berlage et al 1995b). Although the lesion size has nearly fullyevolved at 2 hours, the ADC value continues to decrease for a period of up to 4–6 hoursfollowing MCAO (40% of control) (Knight et al 1994), with some studies indicating lowestADC values at 24 to 48 hours (40–50% of control) (Hoehn-Berlage et al 1995a; Kohno et al1995). In the chronic stages of cerebral ischaemia, the ADC of water exhibits a different pattern.At approximately 24–48 hours after a vessel occlusion, the ADC rises and slowly returns tonormal at 3 days (Knight et al 1991, Helpern et al 1993). Following this, a subsequentincrease in the diffusion of water above the ischaemic control can be observed after 1 week

Measuring diffusion and perfusion using MRI R127
(Verheul et al 1992, Knight et al 1994). The elevated ADC of tissue water, above controlvalues, is associated with cellular lysis, the loss of cellular barriers, combined with excessiveaccumulation of oedematous water (Pierpaoli et al 1993).
Following a stroke in man, a reduced ADC has been observed as early as 105 minutes afterthe initial onset (Warach et al 1992) and as with the animal studies, a pseudo-normalizationoccurs at between 4 and 10 days (Baird and Warach 1998). The large variation in human resultsmay depend on the both the site and size of the lesion and depth of ischaemia, together withmethod for the calculation of ADC with respect to diffusion anisotropy (see section 2.3.4). Fordiagnostic purposes, temporal evolution of ADC following a stroke provides information todiscriminate between acute and chronic lesion, based on the low or high ADC value, providedthe insult is imaged at the appropriate time (Baird and Warach 1998).
4.1.6. Recirculation following cerebral ischaemia. There are four ADC patterns that occuron CBF recirculation subsequent to an ischaemic period:
• the ADC remains decreased at the ischaemic level (Busza et al 1992)• the ADC normalizes and remains normal (Mintorovitch et al 1991)• the ADC normalizes followed by a secondary decline at approximately 24 hours (Thornton
et al 1997)• the ADC normalizes for a short period, then gradually declines (Pell et al 1999a, Lythgoe
et al 1999).
In 1991 Mintorovitch et al first demonstrated that the hyperintense regions of the ischaemicbrain seen on DWI could be reversed if the occlusion was removed 33 minutes after the MCAOin the rat (Mintorovitch et al 1991). More recently it was shown that the size of the lesion basedon the diffusion-weighted images declined if the flow was restored 1 hour following occlusion,but not after 2 hours (Minematsu et al 1992). Even a 15 minute period of cardiac arrest in cats,which resulted in a decline of water ADC values, subsequently normalized within 30 minutesof successful cardiac resuscitation (Fisher et al 1995). At this point in time, DWI furnishedthe observer with information about regions of reversibility within the area of DWI change,provided that time of ischaemia was considered. In the quest for better prognostic information,the DWI data were further refined using quantitative measures of the ADC of water. ADCthresholds for reversibility of the lesion in a rat MCAO model have been estimated to beeither less than 0.55 × 10⁻³ mm2 s−1 (Dardzinski et al 1993) or a reduction of greater than0.25 × 10−3 mm2 s−1 relative to the contralateral hemisphere (Hasegawa et al 1994). DuringMCAO in cats, lesions were reversible if reperfusion occurred before the ADC decreased toless than 70% of the control. These data may point to a prognostic role for the measurementof ADC values, although the temporal component cannot be ignored.
After reperfusion of a previously ischaemic region, the low ADC values can returnto normal levels. However some studies are now reporting a secondary decline inADC, which, as yet, is little understood. The secondary decline had been termed‘secondary’ or ‘delayed’ energy failure and initial reports using MRS in infants sufferingan hypoxic/ischaemic insult during birth (birth asphyxia) demonstrated a delayed fall in[PCr]/[Pi] (phosphocreatine/inorganic phosphate) at 24–48 hours (Azzopardi et al 1989). Thishypoxic–ischaemic condition has been recently modelled in piglets and a secondary declinehas also been observed in ADC values (Thornton et al 1997). This effect is not limitedto a hypoxic/ischaemic insult, since a delayed ADC decrease, following normalization, hasbeen observed at 24 hours post-reperfusion in a rat MCAO model (Van Bruggen et al 1998).In another rat model, Dijkhuizen et al using 20 minutes of hypoxic/ischaemic insult in adultrats, demonstrated secondary reductions of ADC at 24 hours (Dijkhuizen et al 1998). This

R128 D L Thomas et al
delayed effect has also been confirmed in the immature rat and may be suggestive of delayedneuronal death (Tuor et al 1998). The underlying reasons for this process are still unclear.However, hypoperfusion following reperfusion produces gradual changes in ADC which couldresult from a mismatch between CBF and metabolic rate in the hypermetabolic post-ischaemicbrain, giving rise to a delayed ADC decrease (Pell et al 1999a). The final pattern is somewhatunusual, that is, following reperfusion the ADC normalizes for a short period then graduallydeclines over a prolonged period of several hours (Pell et al 1999a, Lythgoe et al 1999).Interestingly it is these regions which were previously thought to undergo delayed cell damage(tissue damage that occurs days after the initial event) (Crain et al 1988, Pulsinelli et al1982). As yet there are no clear explanations for the CBF changes and suggestions for theincreased vascular tone include abnormality of the synthesis or degradation of nitric oxidewithin the endothelium, or adhesion of platelets or leukocytes to the vascular wall (Hossmann1997).
4.2. Perfusion imaging
Over recent years, the methods for measuring perfusion using MRI (see section 3) have beenused in an increasing number of applications. This section outlines the use of perfusion imagingin both the research and clinical environments for the detection of blood flow changes duringischaemia and subsequent reperfusion, together with a comparison of the information gainedfrom DWI.
4.2.1. MRI perfusion measurements in ischaemia. While DWI may provide uniqueinformation about the effect of an ischaemic insult as early as a few minutes post-ictus, it isclearly desirable to obtain information regarding the integrity of the vascular bed. Pioneeringstudies in a primate model, showed that a reduction of CBF below 12 ml/100 g min−1 for>2 hours produces focal infarction or non-recoverable tissue, demonstrating a link betweendegree and duration of ischaemia and eventual tissue injury (Morawetz et al 1974). Promptedby this work, MRI techniques have been developed to measure CBF and its related parameters(see section 3), which are now integrated into both the experimental and clinical environments.Early DSC-MRI experiments in a rat model of focal cerebral ischaemia, demonstrated anabsence of contrast agent in the ischaemic core of the lesion (Quast et al 1993). Interestingly,in the periphery of the lesion, a diffusion–perfusion mismatch was observed, that is, a decreasein CBF without a change in diffusion. This effect was also noted in a similar study usingDWI and DSC-MRI in a unilateral MCAO cat model, in which perfusion deficits not greatenough to cause energy failure may go unnoticed on DWI (Roberts et al 1993). The sensitivityof perfusion measurements to minor alterations in blood flow is further illustrated in a catmodel of hypoperfusion (Derugin and Roberts 1994). Here, the diffusion-weighted imagesshow no evidence of abnormality in the territory of the occluded MCA, whereas the DSC-MRIblood flow measurements show decreased CBF throughout the MCA region. This early workusing DSC-MRI has been followed by studies using the non-invasive ASL techniques forthe quantitation of CBF in animal models. The combined data of perfusion and diffusion,allows three tissue signatures to be assigned following an ischaemic insult: normal perfusionand diffusion, denoting a region of normal tissue; tissue that has a CBF decrease withoutdiffusion changes corresponding to a region of hypoperfusion; and a region in which thereis a concomitant diffusion and perfusion decrease, corresponding to a severely compromisedregion (Calamante et al 1999) (see figure 9).
Not only has DSC-MRI been useful to monitor CBF changes during ischaemia, but mayalso be applied to monitor the effects of reperfusion following the initial ischaemic insult.

Measuring diffusion and perfusion using MRI R129
Figure 9. Typical maps obtained from the rat brain following middle cerebral artery occlusion(MCAO). (a) Continuous ASL perfusion map showing reduced flow in the occluded (left)hemisphere, acquired 4 hours post-occlusion. (b) ADC map, also acquired 4 hours post-occlusion, showing the region of reduced diffusion which corresponds to the area of cytotoxicoedema. (c) Schematic representation of the rat brain after MCAO, highlighting three main areas:‘unaffected’ area; ‘moderately affected’ area, with reduced CBF but normal ADC, and ‘severelyaffected’ area, in which both CBF and ADC are significantly reduced.
Three patterns of reperfusion have been noted in a cat model following MCAO: completereperfusion (normal TTP, see section 3.2.3); initial hyperaemia (shortened TTP) and persistenthypoperfusion (prolonged TTP). These three CBF patterns have now been quantified usingthe non-invasive MRI technique of pulsed ASL (Pell et al 1999b) (see figure 10). In addition,in studies of transient ischaemia or hypoxic ischaemia, DSC-MRI has been used to detect thechange in CBV during and after the insult (D’Arceuil et al 1998). These data illustrate thatCBF measured with either contrast agent or arterial spin labelling techniques, can explicitlymeasure responses of various haemodynamic parameters under conditions of ischaemia andreperfusion, and provided additional information to that of DWI alone.
In addition to animal models of cerebral ischaemia, DSC-MRI and ASL techniques havenow been applied to the study of cerebral perfusion in humans. In patients studied withacute stroke, enlargement of the ischaemic lesion occurred when there was a larger perfusiondeficit (measured with relative MTT) but not when the perfusion abnormality was equivalentto or smaller than the DWI lesion (Baird and Warach 1998). In addition to the MTT andDWI volumes, Sorensen et al have studied the CBF and CBV perfusion parameters in acutestroke lesions. In 19 cases studied within 10 hours of onset, the volume of MTT abnormality(mean = 119 cm3) and CBF abnormality (mean = 112 cm3) were larger than the mean CBV(47 cm3) and the mean DWI volume (35 cm3). The final infarct volume (mean 67 cm3) wasbetween the DWI/CBV and the MTT/CBF volumes (Sorensen et al 1997). This indicates thatthe CBF images may reveal abnormalities not shown on the blood volume maps, althoughthe lesion areas from the CBV maps correlate better with final infarct regions (Sorensen et al1999a). These data indicated the importance of measuring multiple parameters, which enhancepredictive models and also raise the possibility of using time-dependent therapies to reduceinfarction during the investigation of stroke.

R130 D L Thomas et al
Figure 10. Non-invasive MR measurement of CBF using a pulsed ASL technique (FAIR), followingfive minutes of forebrain ischaemia in the gerbil brain. The time courses are taken from regionsof interest in the left and right cerebral cortex. Quantitative CBF measurements demonstrate aninitial rise following reperfusion, with subsequent prolonged hypoperfusion. MRI offers the onlymethods to obtain non-invasive longitudinal time course data in individual subjects.
4.2.2. Blood-oxygenation-level-dependent MRI: T2 and T∗2 in ischaemia. Since BOLD MRI
is sensitive to changes in regional tissue oxygenation status (see section 3.5.1) (Ogawa et al1998, van Zijl et al 1998), it can be used to monitor acute deoxygenation following inductionof ischaemia as well as reoxygenation after reperfusion (de Crespigny et al 1992, Rousselet al 1995). BOLD MR signal intensity, measured by T ∗
2 -weighted MRI, drops immediatelyupon the onset of ischaemia, and rises when reflow occurs. A transient overshoot in signalintensity during reperfusion has been described and may reflect post-reperfusion hyperaemia(de Crespigny et al 1992). These haemodynamic responses indirectly report on local changesin CBF, CBV and oxygen extraction fraction and their individual contributions cannot easilybe distinguished. More recently, early changes in T2-values have been reported in conditionsof ischaemia (Busza et al 1994, Grohn et al 1998, Calamante et al 1999) and oligaemia (Grohnet al 1998, Calamante et al 1999). In the latter studies of cerebral ischaemia, two patternswere observed following an initial T2 decrease:
1. T2-values remained depressed throughout the study without an ADC change—indicatinga mild hypoperfusion condition (Grohn et al 1998, Calamante et al 1999).
2. T2- and ADC values are decreased throughout the study, indicating a severe hypoperfusioncondition (Roussel et al 1995, Calamante et al 1999).
The combination of T ∗2 or T2 and ADC measurements may provide MRI tissue signatures
for the status of the tissue. These data highlight that changes in T2 are not alwaysrelated to vasogenic oedema and early changes in T2 may provide information as to thepathophysiological nature of ischaemia or oligaemia.
4.2.3. Functional magnetic resonance imaging (fMRI). Since the introduction of functionalmagnetic resonance imaging (fMRI), this technique, initially employing exogenous contrast

Measuring diffusion and perfusion using MRI R131
agents (Belliveau et al 1991) and subsequently using BOLD (Ogawa et al 1992) (seesection 3.5.1), has become a widespread method for investigating brain function. Manyexcellent review articles have been written on this subject, and the reader is referred to these forfurther information (e.g. Turner et al 1998, Le Bihan et al 1995, Bandettini and Wong 1997,Frackowiak et al 1997). However, BOLD fMRI has been criticized for its inability to makequantitative measurements of physiologically relevant parameters. It has become apparentthat perfusion, and to a lesser degree diffusion MRI, may have an important role to play in thequantification of haemodynamic parameters associated with neuronal activation. Recent workthat has performed simultaneous BOLD and perfusion MRI has shown that the informationmay be combined to estimate the change in cerebral metabolic rate of oxygen consumption(CMRO2) caused by cerebral activation (Davis et al 1998, Kim et al 1999, Hoge et al 1999).Also, it has been shown that diffusion imaging is sensitive to the magnetic field gradients set upby intravascular susceptibilty contrast agents, and that the measured ADC is proportional to theintravascular susceptibility shift (Does et al 1999). These developments, though still at a veryearly stage, show that there is good potential for MRI to perform quantitative brain mapping.
5. Conclusion
Although MRI scientists have sought to quantify the physically meaningful parameters of tissuewater diffusion and cerebral perfusion, the intricacies of biological tissue on a cellular scale, andthe numerous experimental difficulties encountered, have complicated the simple measurementand interpretation of these quantities. Nevertheless, it is clear that diffusion measurementsprovide a powerful tool for investigating tissue microstructure, and perfusion measurementsprovide a readily understood assessment of tissue function. As techniques develop further, andour understanding of the underlying relationships between these measurements and the tissuestructure and function improves, both methods offer great promise in extending our knowledgeof both normal tissues and tissue that has, or is suffering, damage. Since MRI is non-invasive,the measurements may be repeated to follow tissue changes over the time-scales of seconds,minutes, days or even years. The value of this information is enhanced by the additional abilityof MRI to provide high resolution structural images using standard MR contrast during the sameexamination. In addition, MR spectroscopy can provide important biochemical informationrelated to tissue health and function. These capabilities have ensured that both methods havefound extensive application in animal models of disease and human studies. With currentlyavailable hardware, diffusion imaging can be made accessible to the clinician (and radiologist)who is prepared to provide the acute scanning service necessary to make it a useful tool, andperfusion should follow closely. Future developments in MR hardware (i.e. improvements insystem stability and signal-to-noise performance) should make both these methods availablefor routine diagnostic studies.
References
Abragam A 1961 Principles of Nuclear Magnetism (Oxford: Clarendon)Ahn C B and Cho Z H 1991 Analysis of eddy currents in nuclear magnetic resonance imaging Magn. Reson. Med. 17
149–63Allen K L, Busza A L, Crockard H A, Frackowiak R S, Gadian D G, Proctor E, Ross Russell R W and Williams S R
1988 Acute cerebral ischaemia: concurrent changes in cerebral blood flow, energy metabolites, pH, and lactatemeasured with hydrogen clearance and 31P and 1H nuclear magnetic resonance spectroscopy: III Changesfollowing ischaemia J. Cereb. Blood Flow Metab. 8 816–21
Alsop D C and Detre J A 1996a Multi-slice perfusion imaging in human subjects using a pulsed magnetization transfercontrol Proc. 4th Annu. Meeting ISMRM p 12
——1996b Reduced transit-time sensitivity in noninvasive magnetic resonance imaging of human cerebral blood-flowJ. Cereb. Blood Flow Metab. 16 1236–49
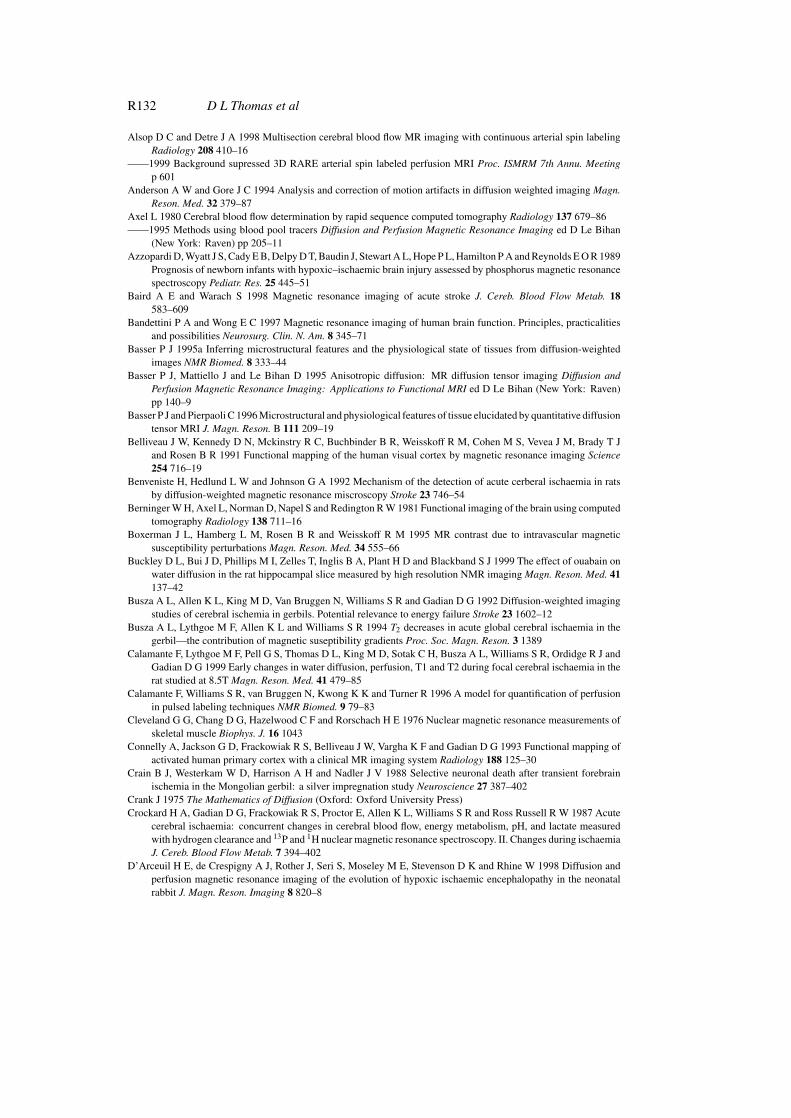
R132 D L Thomas et al
Alsop D C and Detre J A 1998 Multisection cerebral blood flow MR imaging with continuous arterial spin labelingRadiology 208 410–16
——1999 Background supressed 3D RARE arterial spin labeled perfusion MRI Proc. ISMRM 7th Annu. Meetingp 601
Anderson A W and Gore J C 1994 Analysis and correction of motion artifacts in diffusion weighted imaging Magn.Reson. Med. 32 379–87
Axel L 1980 Cerebral blood flow determination by rapid sequence computed tomography Radiology 137 679–86——1995 Methods using blood pool tracers Diffusion and Perfusion Magnetic Resonance Imaging ed D Le Bihan
(New York: Raven) pp 205–11Azzopardi D, Wyatt J S, Cady E B, Delpy D T, Baudin J, Stewart A L, Hope P L, Hamilton P A and Reynolds E O R 1989
Prognosis of newborn infants with hypoxic–ischaemic brain injury assessed by phosphorus magnetic resonancespectroscopy Pediatr. Res. 25 445–51
Baird A E and Warach S 1998 Magnetic resonance imaging of acute stroke J. Cereb. Blood Flow Metab. 18583–609
Bandettini P A and Wong E C 1997 Magnetic resonance imaging of human brain function. Principles, practicalitiesand possibilities Neurosurg. Clin. N. Am. 8 345–71
Basser P J 1995a Inferring microstructural features and the physiological state of tissues from diffusion-weightedimages NMR Biomed. 8 333–44
Basser P J, Mattiello J and Le Bihan D 1995 Anisotropic diffusion: MR diffusion tensor imaging Diffusion andPerfusion Magnetic Resonance Imaging: Applications to Functional MRI ed D Le Bihan (New York: Raven)pp 140–9
Basser P J and Pierpaoli C 1996 Microstructural and physiological features of tissue elucidated by quantitative diffusiontensor MRI J. Magn. Reson. B 111 209–19
Belliveau J W, Kennedy D N, Mckinstry R C, Buchbinder B R, Weisskoff R M, Cohen M S, Vevea J M, Brady T Jand Rosen B R 1991 Functional mapping of the human visual cortex by magnetic resonance imaging Science254 716–19
Benveniste H, Hedlund L W and Johnson G A 1992 Mechanism of the detection of acute cerberal ischaemia in ratsby diffusion-weighted magnetic resonance miscroscopy Stroke 23 746–54
Berninger W H, Axel L, Norman D, Napel S and Redington R W 1981 Functional imaging of the brain using computedtomography Radiology 138 711–16
Boxerman J L, Hamberg L M, Rosen B R and Weisskoff R M 1995 MR contrast due to intravascular magneticsusceptibility perturbations Magn. Reson. Med. 34 555–66
Buckley D L, Bui J D, Phillips M I, Zelles T, Inglis B A, Plant H D and Blackband S J 1999 The effect of ouabain onwater diffusion in the rat hippocampal slice measured by high resolution NMR imaging Magn. Reson. Med. 41137–42
Busza A L, Allen K L, King M D, Van Bruggen N, Williams S R and Gadian D G 1992 Diffusion-weighted imagingstudies of cerebral ischemia in gerbils. Potential relevance to energy failure Stroke 23 1602–12
Busza A L, Lythgoe M F, Allen K L and Williams S R 1994 T2 decreases in acute global cerebral ischaemia in thegerbil—the contribution of magnetic suseptibility gradients Proc. Soc. Magn. Reson. 3 1389
Calamante F, Lythgoe M F, Pell G S, Thomas D L, King M D, Sotak C H, Busza A L, Williams S R, Ordidge R J andGadian D G 1999 Early changes in water diffusion, perfusion, T1 and T2 during focal cerebral ischaemia in therat studied at 8.5T Magn. Reson. Med. 41 479–85
Calamante F, Williams S R, van Bruggen N, Kwong K K and Turner R 1996 A model for quantification of perfusionin pulsed labeling techniques NMR Biomed. 9 79–83
Cleveland G G, Chang D G, Hazelwood C F and Rorschach H E 1976 Nuclear magnetic resonance measurements ofskeletal muscle Biophys. J. 16 1043
Connelly A, Jackson G D, Frackowiak R S, Belliveau J W, Vargha K F and Gadian D G 1993 Functional mapping ofactivated human primary cortex with a clinical MR imaging system Radiology 188 125–30
Crain B J, Westerkam W D, Harrison A H and Nadler J V 1988 Selective neuronal death after transient forebrainischemia in the Mongolian gerbil: a silver impregnation study Neuroscience 27 387–402
Crank J 1975 The Mathematics of Diffusion (Oxford: Oxford University Press)Crockard H A, Gadian D G, Frackowiak R S, Proctor E, Allen K L, Williams S R and Ross Russell R W 1987 Acute
cerebral ischaemia: concurrent changes in cerebral blood flow, energy metabolism, pH, and lactate measuredwith hydrogen clearance and 13P and 1H nuclear magnetic resonance spectroscopy. II. Changes during ischaemiaJ. Cereb. Blood Flow Metab. 7 394–402
D’Arceuil H E, de Crespigny A J, Rother J, Seri S, Moseley M E, Stevenson D K and Rhine W 1998 Diffusion andperfusion magnetic resonance imaging of the evolution of hypoxic ischaemic encephalopathy in the neonatalrabbit J. Magn. Reson. Imaging 8 820–8

Measuring diffusion and perfusion using MRI R133
Dardzinski B J, Sotak C H, Fisher M, Hasegawa Y, Li L and Minematsu K 1993 Apparent diffusion coefficient mappingof experimental focal cerebral ischemia using diffusion-weighted echo-planar imaging Magn. Reson. Med. 30318–25
Davis T L, Kwong K K, Weisskoff R M and Rosen B R 1998 Calibrated functional MRI: mapping the dynamics ofoxidative metabolism Proc. Natl. Acad. Sci. USA 95 1834–9
de Crespigny A J, Rother J, Beaulieu C and Moseley M E 1999 Rapid monitoring of diffusion, DC potential, andblood oxygenation changes during global ischemia Stroke 30 2212–22
de Crespigny A J, Wendland M F, Derugin N, Kozniewska E and Moseley M E 1992 Real-time observation of transientfocal ischemia and hyperemia in cat brain Magn. Reson. Med. 27 391–7
Decanniere C, Eleff S, Davis D and Van Zijl P C M 1995 Correlation of rapid changes in the average water diffusionconstant and the concentrations of lactate and ATP breakdown products during global ischemia in cat brainMagn. Reson. Med. 34 343–52
Derugin N and Roberts T P L 1994 New and reproducible technique for experimentally induced middle cerebral arterystenosis Microsurgery 15 70–2
Detre J A, Leigh J S, Williams D S and Koretsky A P 1992 Perfusion imaging Magn. Reson. Med. 23 37–45Dijkhuizen R M, Knollema S, van der Worp H B, ter Horst G J, de Wildt D J, Berkelbach van der Spenkel J W,
Tullenken C A F and Nicolay K 1998 Dynamics of cerebral tissue injury and perfusion after temporary hypoxia–ischemia in the rat: evidence for region-specific sensitivity and delayed damage Stroke 29 695–704
Dijkhuizen R M et al 1996 Correlation between brain tissue water diffusion changes and cerebral metabolic status ina neonatal rat model of excitotoxicity NMR Biomed. 9 84–92
Does M D, Zhong J and Gore J C 1999 In vivo measurement of ADC change due to intravascular susceptibilityvariation Magn. Reson. Med. 41 236–40
Duong T Q, Ackerman J J H, Ying H S and Neil J J 1998 Evaluation of extra- and intracellular apparent diffusion innormal and globally ischemic rat brain via 19F NMR Magn. Reson. Med. 40 1–13
Edelman R R and Chen Q 1998 EPISTAR MRI: multislice mapping of cerebral blood flow Magn. Reson. Med. 40800–5
Edelman R R, Siewert B, Darby D G, Thangaraj V, Nobre A C, Mesulam M M and Warach S 1994 Qualitativemapping of cerebral blood-flow and functional localization with echo-planar mr-imaging and signal targetingwith alternating radio-frequency Radiology 192 513–20
Einstein A 1926 Investigations on the Theory of Brownian Motion (New York: Dover)Fischer H and Ladebeck R 1998 Echo-planar imaging image artifacts Echo-Planar Imaging ed F Schmitt, M Stehling
and R Turner (Berlin: Springer) pp 179–200Fisel C R, Ackerman J L, Buxton R B, Garrido L, Belliveau J W, Rosen B R and Brady T J 1991 MR contrast due
to microscopically heterogeneous magnetic susceptibility: numerical simulations and applications to cerebralphysiology Magn. Reson. Med. 17 336–47
Fisher M, Bockhorst K, Hoehn-Berlage M, Schmitz B and Hossmann K A 1995 Imaging of the apparent diffusioncoefficient for the evaluation of cerebral metabolic recovery after cardiac arrest Magn. Reson. Imaging 13 781–90
Frackowiak R S, Friston K, Frith C D, Dolan R J and Mazziotta J C 1997 Human Brain Function (San Diego:Academic)
Gadian D G 1995 NMR and its Applications to Living Systems 2nd edn (Oxford: Oxford University Press)Gillis P and Koenig S H 1987 Transverse relaxation of solvent protons induced by magnetized spheres: application
to ferritin erythrocytes and magnetite Magn. Reson. Med. 5 323–45Gobbel G T, Cann C E and Fike J R 1991 Measurement of regional cerebral blood flow using ultrafast computed
tomography: theoretical aspects Stroke 22 768–71Grohn O H J, Lukkarinen J A, Oja J M E, van Zijl P C, Ulatowski J A, Traystman R J and Kauppinen R A
1998 Noninvasive detection of cerebral hypoperfusion and reversible ischemia from reductions in the magneticresonance imaging relaxation time, T2 J. Cereb. Blood Flow Metab. 18 911–20
Hasegawa Y, Fisher M, Latour L L, Dardzinski B J and Sotak C H 1994 MRI diffusion mapping of reversible andirreversible ischemic injury in focal brain ischemia Neurology 44 1484–90
Hasegawa Y, Formato J E, Latour L L, Gutierrez J A, Liu K F, Garcia J H, Sotak C H and Fisher M 1996 Severetransient hypoglycemia causes reversible change in the apparent diffusion coefficient of water Stroke 27 1648–56
Hedehus M, Steensgaard A, Rostrup E and Larsson H B W 1997 Investigation of the linear relation between R∗2 and
gadolinium concentration in vivo Proc. ISMRM 5th Annu. Meeting p 1792Helmer K G, Dardzinski B J and Sotak C H 1995 The application of porous media theory to the investigation of
time-dependent diffusion in in vivo systems NMR Biomed. 8 297–306Helpern J A, Dereski M O, Knight R A, Ordidge R J, Chopp M and Qing Z X 1993 Histopathological correlations of
nuclear magnetic resonance imaging parameters in experimental cerebral ischemia Magn. Reson. Imaging 11241–6
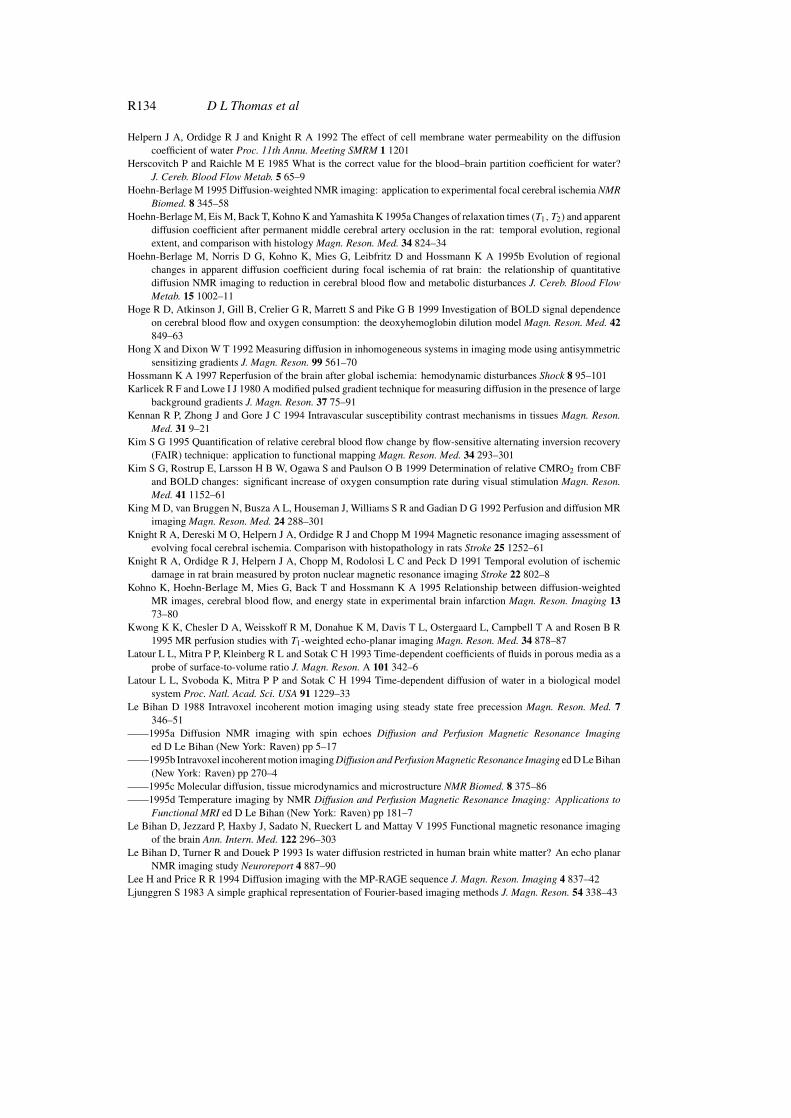
R134 D L Thomas et al
Helpern J A, Ordidge R J and Knight R A 1992 The effect of cell membrane water permeability on the diffusioncoefficient of water Proc. 11th Annu. Meeting SMRM 1 1201
Herscovitch P and Raichle M E 1985 What is the correct value for the blood–brain partition coefficient for water?J. Cereb. Blood Flow Metab. 5 65–9
Hoehn-Berlage M 1995 Diffusion-weighted NMR imaging: application to experimental focal cerebral ischemia NMRBiomed. 8 345–58
Hoehn-Berlage M, Eis M, Back T, Kohno K and Yamashita K 1995a Changes of relaxation times (T1, T2) and apparentdiffusion coefficient after permanent middle cerebral artery occlusion in the rat: temporal evolution, regionalextent, and comparison with histology Magn. Reson. Med. 34 824–34
Hoehn-Berlage M, Norris D G, Kohno K, Mies G, Leibfritz D and Hossmann K A 1995b Evolution of regionalchanges in apparent diffusion coefficient during focal ischemia of rat brain: the relationship of quantitativediffusion NMR imaging to reduction in cerebral blood flow and metabolic disturbances J. Cereb. Blood FlowMetab. 15 1002–11
Hoge R D, Atkinson J, Gill B, Crelier G R, Marrett S and Pike G B 1999 Investigation of BOLD signal dependenceon cerebral blood flow and oxygen consumption: the deoxyhemoglobin dilution model Magn. Reson. Med. 42849–63
Hong X and Dixon W T 1992 Measuring diffusion in inhomogeneous systems in imaging mode using antisymmetricsensitizing gradients J. Magn. Reson. 99 561–70
Hossmann K A 1997 Reperfusion of the brain after global ischemia: hemodynamic disturbances Shock 8 95–101Karlicek R F and Lowe I J 1980 A modified pulsed gradient technique for measuring diffusion in the presence of large
background gradients J. Magn. Reson. 37 75–91Kennan R P, Zhong J and Gore J C 1994 Intravascular susceptibility contrast mechanisms in tissues Magn. Reson.
Med. 31 9–21Kim S G 1995 Quantification of relative cerebral blood flow change by flow-sensitive alternating inversion recovery
(FAIR) technique: application to functional mapping Magn. Reson. Med. 34 293–301Kim S G, Rostrup E, Larsson H B W, Ogawa S and Paulson O B 1999 Determination of relative CMRO2 from CBF
and BOLD changes: significant increase of oxygen consumption rate during visual stimulation Magn. Reson.Med. 41 1152–61
King M D, van Bruggen N, Busza A L, Houseman J, Williams S R and Gadian D G 1992 Perfusion and diffusion MRimaging Magn. Reson. Med. 24 288–301
Knight R A, Dereski M O, Helpern J A, Ordidge R J and Chopp M 1994 Magnetic resonance imaging assessment ofevolving focal cerebral ischemia. Comparison with histopathology in rats Stroke 25 1252–61
Knight R A, Ordidge R J, Helpern J A, Chopp M, Rodolosi L C and Peck D 1991 Temporal evolution of ischemicdamage in rat brain measured by proton nuclear magnetic resonance imaging Stroke 22 802–8
Kohno K, Hoehn-Berlage M, Mies G, Back T and Hossmann K A 1995 Relationship between diffusion-weightedMR images, cerebral blood flow, and energy state in experimental brain infarction Magn. Reson. Imaging 1373–80
Kwong K K, Chesler D A, Weisskoff R M, Donahue K M, Davis T L, Ostergaard L, Campbell T A and Rosen B R1995 MR perfusion studies with T1-weighted echo-planar imaging Magn. Reson. Med. 34 878–87
Latour L L, Mitra P P, Kleinberg R L and Sotak C H 1993 Time-dependent coefficients of fluids in porous media as aprobe of surface-to-volume ratio J. Magn. Reson. A 101 342–6
Latour L L, Svoboda K, Mitra P P and Sotak C H 1994 Time-dependent diffusion of water in a biological modelsystem Proc. Natl. Acad. Sci. USA 91 1229–33
Le Bihan D 1988 Intravoxel incoherent motion imaging using steady state free precession Magn. Reson. Med. 7346–51
——1995a Diffusion NMR imaging with spin echoes Diffusion and Perfusion Magnetic Resonance Imaginged D Le Bihan (New York: Raven) pp 5–17
——1995b Intravoxel incoherent motion imaging Diffusion and Perfusion Magnetic Resonance Imaging ed D Le Bihan(New York: Raven) pp 270–4
——1995c Molecular diffusion, tissue microdynamics and microstructure NMR Biomed. 8 375–86——1995d Temperature imaging by NMR Diffusion and Perfusion Magnetic Resonance Imaging: Applications to
Functional MRI ed D Le Bihan (New York: Raven) pp 181–7Le Bihan D, Jezzard P, Haxby J, Sadato N, Rueckert L and Mattay V 1995 Functional magnetic resonance imaging
of the brain Ann. Intern. Med. 122 296–303Le Bihan D, Turner R and Douek P 1993 Is water diffusion restricted in human brain white matter? An echo planar
NMR imaging study Neuroreport 4 887–90Lee H and Price R R 1994 Diffusion imaging with the MP-RAGE sequence J. Magn. Reson. Imaging 4 837–42Ljunggren S 1983 A simple graphical representation of Fourier-based imaging methods J. Magn. Reson. 54 338–43

Measuring diffusion and perfusion using MRI R135
Lythgoe M F, Busza A L, Calamante F, Sotak C H, King M D, Bingham A C, Williams S R and Gadian D G 1997Effects of diffusion anisotropy on lesion delineation in a rat model of cerebral ischemia Magn. Reson. Med. 38662–8
Lythgoe M F, Pell G S, Thomas D L, Calamante F, King M D, Williams S R, Ordidge R J and Gadian D G 1999Secondary or gradual ADC decline following reperfusion: origins in delayed hypoperfusion Proc. ISMRM 7thAnnu. Meeting (Philadelphia, PA) vol 1, p 55
Mancuso A, Karibe H, Rooney W D, Zarow G J, Graham S H, Weiner M W and Weinstein P R 1995 Correlation ofearly reduction in the apparent diffusion coefficient of water with blood flow reduction during middle cerebralartery occlusion in rats Magn. Reson. Med. 34 368–77
Mansfield P and Chapman B 1987 Multishield active magnetic screening of coil structures in NMR J. Magn. Reson.72 211–23
Mas J L and Zuber M 1991 Epidemiology of ischaemic stroke Cerebrovasc. Dis. 1 36–44McLaughlin A C, Ye F Q, Pekar J J, Santha A K S and Frank J A 1997 Effect of magnetization transfer on
the measurement of cerebral blood flow using steady-state arterial spin tagging approaches: a theoreticalinvestigation Magn. Reson. Med. 37 501–10
Meier P and Zierler K L 1954 On the theory of the indicator-dilution method for measurement of blood flow andvolume Appl. Physiol. 6 731–44
Merboldt K-D, Bruhn H, Frahm J, Gyngell M L, Hanicke W and Deimling M 1989 MRI of diffusion in the humanbrain: new results using a CE-FAST sequence Magn. Reson. Med. 9 423–9
Merboldt K-D, Hanicke W, Bruhn H, Gyngell M L and Frahm J 1992 Diffusion imaging of the human brain in vivousing high speed STEAM MRI Magn. Reson. Med. 23 179–92
Merboldt K-D, Hanicke W and Frahm J 1991 Diffusion imaging using stimulated echoes Magn. Reson. Med. 19 233–9Minematsu K, Li L, Sotak C H, Davis M A and Fisher M 1992 Reversible focal ischemic injury demonstrated by
diffusion-weighted magnetic resonance imaging in rats Stroke 23 1304–11Mintorovitch J, Moseley M E, Chileuitt L, Shimizu H, Cohen Y and Weinstein P R 1991 Comparison of diffusion-
and T2-weighted MRI for the early detection of cerebral ischemia and reperfusion in rats Magn. Reson. Med.18 39–50
Mintorovitch J, Yang G Y, Shimizu H, Kucharczyk J, Chan P H and Weinstein P R 1994 Diffusion-weighted magneticresonance imaging of acute focal cerebral ischaemia: comparison of signal intensity with changes in brain waterand Na+, K+-ATPase activity J. Cereb. Blood Flow Metab. 14 332–6
Mitra P P, Sen P N, Schwartz L N and Le Doussal P 1993 Diffusion propogator as a probe of the structure of porousmedia Phys. Rev. Lett. 68 3555–8
Moonen C T W, Pekar J, de Vleeschouwer M H M, van Gelderen P, van Zijl P C M and Despres D 1991 Restricted andanisotropic displacement of water in healthy cat brain and in stroke studies by NMR diffusion imaging Magn.Reson. Med. 19 327–32
Morawetz R B, Crowell R H, De Girolami U, Marcoux F W, Jones T H and Halsey J H 1974 Regional cerebral bloodflow thresholds during cerebral ischaemia Fed. Proc. 38 2493–4
Mori S and van Zijl P C M 1995 Diffusion weighting by the trace of the diffusion tensor within a single scan Magn.Reson. Med. 33 41–52
Moseley M E, Cohen Y, Kucharczyk J, Mintorovich J, Asgari H S, Wendland M F, Tsuruda J and Norman D 1990aDiffusion-weighted MR imaging of anisotropic water diffusion in cat central nervous system Radiology 176439–45
Moseley M E, Cohen Y, Mintorovitch J, Chileuitt L, Shimizu H, Kucharczyk J, Wendland M F and Weinstein P R1990b Early detection of regional cerebral ischemia in cats: comparison of diffusion- and T2-weighted MRIand spectroscopy Magn. Reson. Med. 14 330–46
Nicholson C and Philips J M 1981 Ion diffusion modified by tortuosity and volume fraction in the extracellularmicroenvironment of the rat cerebellum J. Physiol. 321 225–57
Niendorf T, Norris D G and Leibfritz D 1994 Detection of apparent restricted diffusion in healthy rat brain at shortdiffusion times Magn. Reson. Med. 32 672–7
Ogawa S, Lee T M, Kay A R and Tank D W 1990 Brain magnetic resonance imaging with contrast dependent onblood oxygenation Proc. Natl. Acad. Sci. USA 87 9868–72
Ogawa S, Menon R S, Kim S G and Ugurbil K 1998 On the characteristics of functional magnetic resonance imagingof the brain Annu. Rev. Biophys. Biomol. Struct. 27 447–74
Ogawa S, Tank D W, Menon R, Ellermann J M, Ugurbil K, Kim S G and Merkle H 1992 Intrinsic signal changesaccompanying sensory stimulation: functional brain mapping with magnetic resonance imaging Proc. Natl.Acad. Sci. USA 89 5951–5
Ordidge R J, Helpern J A, Qing Z X, Knight R A and Nagesh V 1994 Correction of motional artifacts in diffusion-weighted MR images using navigator echoes Magn. Reson. Imaging 12 455–60
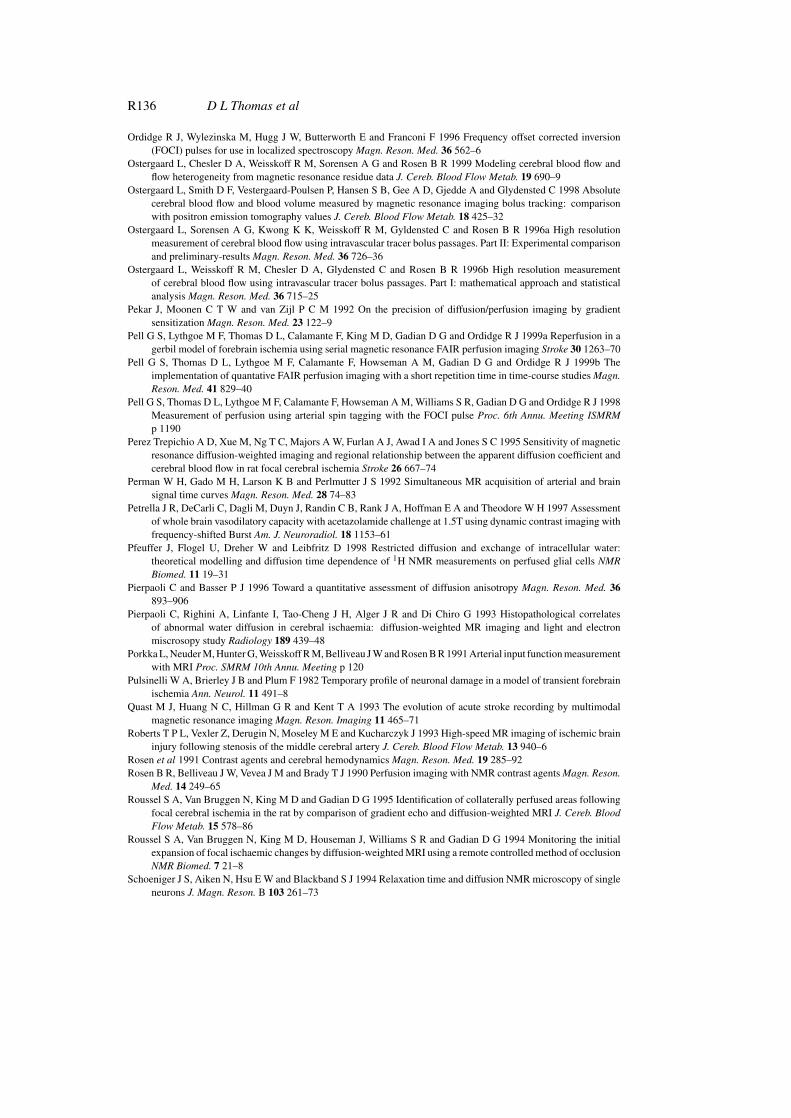
R136 D L Thomas et al
Ordidge R J, Wylezinska M, Hugg J W, Butterworth E and Franconi F 1996 Frequency offset corrected inversion(FOCI) pulses for use in localized spectroscopy Magn. Reson. Med. 36 562–6
Ostergaard L, Chesler D A, Weisskoff R M, Sorensen A G and Rosen B R 1999 Modeling cerebral blood flow andflow heterogeneity from magnetic resonance residue data J. Cereb. Blood Flow Metab. 19 690–9
Ostergaard L, Smith D F, Vestergaard-Poulsen P, Hansen S B, Gee A D, Gjedde A and Glydensted C 1998 Absolutecerebral blood flow and blood volume measured by magnetic resonance imaging bolus tracking: comparisonwith positron emission tomography values J. Cereb. Blood Flow Metab. 18 425–32
Ostergaard L, Sorensen A G, Kwong K K, Weisskoff R M, Gyldensted C and Rosen B R 1996a High resolutionmeasurement of cerebral blood flow using intravascular tracer bolus passages. Part II: Experimental comparisonand preliminary-results Magn. Reson. Med. 36 726–36
Ostergaard L, Weisskoff R M, Chesler D A, Glydensted C and Rosen B R 1996b High resolution measurementof cerebral blood flow using intravascular tracer bolus passages. Part I: mathematical approach and statisticalanalysis Magn. Reson. Med. 36 715–25
Pekar J, Moonen C T W and van Zijl P C M 1992 On the precision of diffusion/perfusion imaging by gradientsensitization Magn. Reson. Med. 23 122–9
Pell G S, Lythgoe M F, Thomas D L, Calamante F, King M D, Gadian D G and Ordidge R J 1999a Reperfusion in agerbil model of forebrain ischemia using serial magnetic resonance FAIR perfusion imaging Stroke 30 1263–70
Pell G S, Thomas D L, Lythgoe M F, Calamante F, Howseman A M, Gadian D G and Ordidge R J 1999b Theimplementation of quantative FAIR perfusion imaging with a short repetition time in time-course studies Magn.Reson. Med. 41 829–40
Pell G S, Thomas D L, Lythgoe M F, Calamante F, Howseman A M, Williams S R, Gadian D G and Ordidge R J 1998Measurement of perfusion using arterial spin tagging with the FOCI pulse Proc. 6th Annu. Meeting ISMRMp 1190
Perez Trepichio A D, Xue M, Ng T C, Majors A W, Furlan A J, Awad I A and Jones S C 1995 Sensitivity of magneticresonance diffusion-weighted imaging and regional relationship between the apparent diffusion coefficient andcerebral blood flow in rat focal cerebral ischemia Stroke 26 667–74
Perman W H, Gado M H, Larson K B and Perlmutter J S 1992 Simultaneous MR acquisition of arterial and brainsignal time curves Magn. Reson. Med. 28 74–83
Petrella J R, DeCarli C, Dagli M, Duyn J, Randin C B, Rank J A, Hoffman E A and Theodore W H 1997 Assessmentof whole brain vasodilatory capacity with acetazolamide challenge at 1.5T using dynamic contrast imaging withfrequency-shifted Burst Am. J. Neuroradiol. 18 1153–61
Pfeuffer J, Flogel U, Dreher W and Leibfritz D 1998 Restricted diffusion and exchange of intracellular water:theoretical modelling and diffusion time dependence of 1H NMR measurements on perfused glial cells NMRBiomed. 11 19–31
Pierpaoli C and Basser P J 1996 Toward a quantitative assessment of diffusion anisotropy Magn. Reson. Med. 36893–906
Pierpaoli C, Righini A, Linfante I, Tao-Cheng J H, Alger J R and Di Chiro G 1993 Histopathological correlatesof abnormal water diffusion in cerebral ischaemia: diffusion-weighted MR imaging and light and electronmiscrosopy study Radiology 189 439–48
Porkka L, Neuder M, Hunter G, Weisskoff R M, Belliveau J W and Rosen B R 1991 Arterial input function measurementwith MRI Proc. SMRM 10th Annu. Meeting p 120
Pulsinelli W A, Brierley J B and Plum F 1982 Temporary profile of neuronal damage in a model of transient forebrainischemia Ann. Neurol. 11 491–8
Quast M J, Huang N C, Hillman G R and Kent T A 1993 The evolution of acute stroke recording by multimodalmagnetic resonance imaging Magn. Reson. Imaging 11 465–71
Roberts T P L, Vexler Z, Derugin N, Moseley M E and Kucharczyk J 1993 High-speed MR imaging of ischemic braininjury following stenosis of the middle cerebral artery J. Cereb. Blood Flow Metab. 13 940–6
Rosen et al 1991 Contrast agents and cerebral hemodynamics Magn. Reson. Med. 19 285–92Rosen B R, Belliveau J W, Vevea J M and Brady T J 1990 Perfusion imaging with NMR contrast agents Magn. Reson.
Med. 14 249–65Roussel S A, Van Bruggen N, King M D and Gadian D G 1995 Identification of collaterally perfused areas following
focal cerebral ischemia in the rat by comparison of gradient echo and diffusion-weighted MRI J. Cereb. BloodFlow Metab. 15 578–86
Roussel S A, Van Bruggen N, King M D, Houseman J, Williams S R and Gadian D G 1994 Monitoring the initialexpansion of focal ischaemic changes by diffusion-weighted MRI using a remote controlled method of occlusionNMR Biomed. 7 21–8
Schoeniger J S, Aiken N, Hsu E W and Blackband S J 1994 Relaxation time and diffusion NMR microscopy of singleneurons J. Magn. Reson. B 103 261–73

Measuring diffusion and perfusion using MRI R137
Schreiber W G, Guckel F, Stritzke P, Schmiedek P, Schwartz A and Brix G 1998 Cerebral blood flow andcerebrovascular reserve capacity: estimation by dynamic magnetic resonance imaging J. Cereb. Blood FlowMetab. 18 1143–56
Silva A C, Williams D S and Koretsky A P 1997a Evidence for the exchange of arterial spin labeled water with tissuewater in rat brain from diffusion-sensitized measurements of perfusion Magn. Reson. Med. 38 232–7
Silva A C, Zhang W G, Williams D S and Koretsky A P 1995 Multislice MRI of rat brain perfusion during amphetaminestimulation using arterial spin labeling Magn. Reson. Med. 33 209–14
——1997b Estimation of water extraction fractions in rat brain using magnetic resonance measurement of perfusionwith arterial spin labeling Magn. Reson. Med. 37 58–68
Silver M S, Joseph R I and Hoult D I 1984 Highly selective π/2 and π pulse generation J. Magn. Reson. 59347–51
Sorensen A G, Copen W A, Ostergaard L, Buonanno F S, Gonzalez R G, Rordorf G, Rosen B R, Schwamm L,Weisskoff R M and Koroshetz W J 1999a Hyperacute stroke: simultaneous measurement of relative cerebralblood volume, relative cerebral blood flow, and mean transit time Radiology 210 519–27
Sorensen A G, Gonzalez R G, Copen W A, Schwamm L, Rordorf G, Ostergaard L, Weisskoff R M and Rosen B R1997 Quantitaion of diffusion/perfusion MRI mismatch in acute human cerebral infarction Stroke 28 252
Sorensen A G, Wu O, Copen W A, Davis T L, Gonzalez R G, Koroshetz W J, Reese T G, Rosen B R, Wedeen V Jand Weisskoff R M 1999b Human acute cerebral ischemia: detection of changes in water diffusion anisotropyby using MR imaging Radiology 212 785–92
Stanisz G J, Szafer A, Wright G A and Henkelman R M 1997 An analytical model of restricted diffusion in bovineoptic nerve Magn. Reson. Med. 37 103–11
Stark D D and Bradley W G 1998 Magnetic Resonance Imaging 3rd edn (St Louis: Mosby)Starmer C F and Clark D O 1970 Computer computations of cardiac output using the gamma function J. Appl. Phys.
28 219–20Stejskal E O and Tanner J E 1965 Spin diffusion measurements: spin echoes in the presence of a time dependent field
gradient J. Chem. Phys. 42 288–92Stewart G N 1894 Researches on the circulation time in organs and the influences which affect it J. Physiol. 15 1Szafer A, Zhong J, Anderson A W and Gore J C 1995 Diffusion-weighted imaging in tissues: theoretical models
NMR Biomed. 8 289–96Taylor T N, Davis P H, Torner J C, Holmes J, Meyer J W and Jacobson M F 1998 Lifetime cost of stroke in the United
States Stroke 27 1459–66Thomas D L, Pell G S, Lythgoe M F, Gadian D G and Ordidge R J 1998 A quantitative method for fast diffusion
imaging using magnetisation-prepared TurboFLASH Magn. Reson. Med. 39 950–60Thornton J S, Ordidge R J, Penrice J, Cady E B, Amess P, Punwani S, Clemence M and Wyatt J S 1997 Anisotropic
water diffusion in white and gray matter of the neonatal piglet brain before and after transient hypoxia–ischaemiaMagn. Reson. Imaging 15 433–40
——1998 Temporal and anatomical variations of brain water apparent diffusion coefficient in perinatal cerebralhypoxic–ischemic injury: relationships to cerebral energy metabolism Magn. Reson. Med. 39 920–7
Thulborn K R, Waterton J C, Matthews P M and Radda G K 1982 Oxygenation dependence of the transverse relaxationtime of water protons in whole blood at high field Biochim. Biophys. Acta 714 265–70
Torrey H C 1956 Bloch equations with diffusion terms Phys. Rev. 104 563–5Tuor U I, Kozlowski P, Del-Bigo D R, Ramjiawan B, Su S, Malisza K and Saunders J K 1998 Diffusion- and T2-
weighted increase in magnetic resonance images of immature brain during hypoxia–ischemia: transient reversalposthypoxia Exp. Neurol. 150 321–8
Turner R 1998 Diffusion imaging with echo planar imaging Echo-Planar Imaging ed F Schmitt, M Stehling andR Turner (Berlin: Springer) pp 311–24
Turner R, Howseman A, Rees G E, Josephs O and Friston K 1998 Functional magnetic resonance imaging of thehuman brain: data acquisition and analysis Exp. Brain Res. 123 5–12
Turner R, Le Bihan D, Maier J, Vaurek R, Hedges L K and Pekar J 1990 Echo-planar imaging of intravoxel incoherentmotion Radiology 177 407–14
Van Bruggen N, Roberts T P and Cremer J E 1994 The application of magnetic resonance imaging to the study ofexperimental cerebral ischaemia Cerebrovasc. Brain Metab. Rev. 6 180–210
Van Bruggen N, van Lookeren Campagne M, Thibodeaux H, Palmer J T, Williams S P and Thomas G R 1998 Evidencefor delayed cerebral infarction following focal ischaemia in the rat: a diffusion-weighted imaging study Proc.ISMRM, 6th Annu. Meeting (Sydney) vol 2, p 1180
van der Toorn A, Verheul H B, Berkelbach van der Spenkel J W, Tullenken C A F and Nicolay K 1994 Changesin metabolites and tissue water status after focal ischemia in cat brain assessed with localized proton MRspectroscopy Magn. Reson. Med. 32 685–91

R138 D L Thomas et al
van Gelderen P, de Vleeschouwer M H M, Despres D, Pekar J, van Zijl P C M and Moonen C T W 1994 Waterdiffusion and acute stroke Magn. Reson. Med. 31 154–63
van Zijl P C, Eleff S M, Ulatowski J A, Oja J M, Ulug A M, Traystman R J and Kauppinen R A 1998 Quantitativeassessment of blood flow, blood volume and blood oxygenation effects in functional magnetic resonance imagingNat. Med. 4 159–67
Verheul H B, Berkelbach van der Spenkel J W, Tullenken C A F, Tamminga K S and Nicolay K 1992 Temporalevolution of cerebral ischaemia in the rat assessed by T2-weighted and diffusion-weighted magnetic resonanceimaging Brain Topogr. 5 171–6
Villringer A, Rosen B R and Belliveau J W 1988 Dynamic imaging with lanthanide chelates in normal brain: contrastdue to magnetic susceptibility effects Magn. Reson. Med. 6 164–74
von Meerwall E D 1982 Interpreting pulsed gradient spin echo diffusion experiments in polydisperse specimensJ. Magn. Reson. 50 409–16
Warach S, Chien D, Li W, Ronthal M and Edelman R R 1992 Fast magnetic resonance diffusion-weighted imagingof acute human stroke Neurology 42 1717–23 (erratum 1992 Neurology 42 2192)
Warlow C P 1998 Epidemiology of stroke Lancet 352 (suppl III) 1–4Weisskoff R M, Chesler D A, Boxerman J L and Rosen B R 1993 Pitfalls in MR measurement of tissue blood flow
with intravascular tracers: which mean transit time? Magn. Reson. Med. 29 553Weisskoff R M, Zuo C S, Boxerman J L and Rosen B R 1994 Microscopic susceptibility variation and transverse
relaxation: theory and experiment Magn. Reson. Med. 31 601–10Weissleder R, Elizondo G and Wittenberg K 1990 Ultrasmall superparamagnetic iron oxide. Characterization of a
new class of contrast agents for MR imaging Radiology 175 489–93Williams D S, Detre J A, Leigh J S and Koretsky A P 1992 Magnetic resonance imaging of perfusion using spin
inversion of arterial water Proc. Natl Acad. Sci. USA 89 212–16Wolff S and Balaban R 1989 Magnetisation transfer contrast (MTC) and tissue water proton relaxation in vivo Magn.
Reson. Med. 10 135–44Wong E C, Buxton R B and Frank L R 1997 Implementation of quantitative perfusion imaging techniques for functional
brain mapping using pulsed arterial spin labeling NMR Biomed. 10 237–49——1998 Quantitative imaging of perfusion using a single subtraction (QUIPSS and QUIPSS II) Magn. Reson. Med.
39 702–8Wong E C, Cox R W and Song A W 1995 Optimized isotropic diffusion weighting Magn. Reson. Med. 34 139–43Yang Y H, Frank J A, Hou L, Ye F Q, Mclaughlin A C and Duyn J H 1998 Multislice imaging of quantitative cerebral
perfusion with pulsed arterial spin labeling Magn. Reson. Med. 39 825–32Ye F Q, Mattay V S, Jezzard P, Frank J A, Weinberger D R and McLaughlin A C 1997 Correction for vascular artifacts
in cerebral blood flow values measured by using arterial spin tagging techniques Magn. Reson. Med. 37 226–35Yongbi M N, Yang Y, Frank J A and Duyn J H 1999 Multislice perfusion imaging of the human brain using the
C-FOCI inversion pulse: comparison with hyperbolic secant Magn. Reson. Med. 42 1098–106Zelaya F, Flood N, Chalk J B, Wang D, Doddrell D M, Strugnell W, Benson M, Ostergaard L, Semple J and Eagle S
1999 An evaluation of the time dependence of the anisotropy of the water diffusion tensor in acute humanischemia Magn. Reson. Imaging 17 331–48
Zhang W, Williams D S, Detre J A and Koretsky A P 1992 Measurement of brain perfusion by volume-localized NMRspectroscopy using inversion of arterial water spins—accounting for transit-time and cross-relaxation Magn.Reson. Med. 25 362–71
Zhong J, Kennan R P and Gore J C 1991 Effects of susceptibility variations on NMR measurements of diffusionJ. Magn. Reson. 95 267–80
Zierler K L 1962 Theoretical basis of indicator-dilution methods for measuring flow and volume Circ. Res. 10 393–407——1965 Equations for measuring blood flow by external monitoring of radioisotopes Circ. Res. 16 309–21