the mathematics of call centre staffing: managing a workforce …€¦ · · 2018-01-09sponsored...
TRANSCRIPT
Sponsored by
The Mathematics of Call Centre Staffing:
Managing a Workforce by the Numbers

Copyright © 2011 The Call Center School, LLC
2
Overview
Running a successful call centre means managing by
the numbers and there is no more important number
than having the exact right number of people in place to
respond to customer contacts. Too many staff results in
excessive labor costs, while understaffing results in
poor service, unhappy customers, lost business, and
overworked staff.
This paper will present the mathematics of call centre
staffing. Part 1 will outline the fundamental steps of
calculating call centre staff. Part 2 will discuss the
many tradeoffs to consider in developing a staffing plan
that maximises staff and customer satisfaction while
minimising operating cost.

Copyright © 2011 The Call Center School, LLC
3
Overview ............................................................................. 2
Part 1: The Basics of Calculating Call Centre Staff ............. 4
Part 2: Understanding Call Centre Staffing Tradeoffs ......... 9
Part 3: Supporting Tools and Resources .......................... 17
About the Author ............................................................... 19

Copyright © 2011 The Call Center School, LLC
4
Part 1: The Basics of Calculating Call Centre Staff
Determining Staff Workload
The number of staff needed is a function of staff
workload and service goals. Staff workload is made up
of two components – call volume and average handle
time (AHT) – both outcomes of the forecasting process.
Workload is typically broken down into either hourly or
half-hourly segments, depending upon how staff
schedules will later be designed (to start every 60
minutes or 30 minutes).
Workload may be expressed in various time increments
as well. AHT may be expressed in seconds or minutes
(for example, an AHT of 180 seconds or 3 minutes),
meaning resulting workload may be expressed in either
seconds or minutes. It is also common to see workload
expressed as the number of hours of work to do in a
one-hour timeframe. For example, if a call centre
expects to receive 400 calls between 4:00 and 5:00pm
and the calls take 180 seconds each to handle, then the
workload would be 72,000 seconds, 1200 minutes, or
20 hours of workload. Expressing workload in terms of
hours of work to do in a one-hour timeframe is a useful
measure as it is easier to relate to the number of staff
hours needed to accomplish the work.

Copyright © 2011 The Call Center School, LLC
5
Understanding Call Arrival Patterns
Call centre staffing represents a unique kind of problem
in the sense that the work to do is out of the control of
the centre and it arrives in a random, unpredictable
pattern. It’s very different than work in other parts of
the business. For example, in a regular production
environment – like processing clerical tasks or
participating in assembly line work – the work tasks are
sequential. They arrive one behind the other and a
person can move from one to the next in a smooth
fashion, handling a full hour’s worth of work within an
hour timeframe. With this kind of work, 20 hours of
workload would simply require 20 people in place to
complete the work in one hour.
However, applying those same numbers in a call centre
scenario will yield a different staff requirement. Assume
the call centre expects to receive 400 calls in the same
hour representing 20 hours of telephone workload. The
work cannot be handled in the same way. At 4:05, there
may be 25 calls arriving, meaning all 20 agents are
busy, with 5 calls waiting in queue. Then at 8:15, there
may only be 12 calls in progress, meaning 8 staff are
idle. Those 8 people won’t be able to accomplish a full
hour’s work, simply because of the way the calls have
arrived. In an incoming call centre, the work doesn’t
arrive in a back-to-back fashion. Rather, the work
arrives whenever customers decide to place calls.
Therefore, there will be busy, backed-up periods at
some points during the hour and likewise there will be
periods of idle time where staff are just waiting on the
next call to arrive. When this idle, non-productive time is
added to the actual call workload, the result is more
than 20 hours of time. Therefore, with randomly
arriving telephone workload, a call centre will always
need more staff in place than the actual hours of work
to do.
In the example with 20 hours of call workload to
accomplish, the fundamental rule of call centre staffing
indicates that more than 20 staff would be required to
accomplish the work. But how many extra staff would
be needed? For 20 hours of workload, will 21 staff be
required? 22 staff? 25 staff? The answer is … it
depends. The number of staff needed depends on the
speed of answer the call centre wishes to deliver.
Obviously, the more staff available, the faster the speed
of answer will be. The fewer the staff, the longer the
caller will wait.
Defining Service Goals
There are two primary ways of defining speed of answer
goals. The most common approach is a two-part definition
called service level. The other definition is a simple
average delay time called average speed of answer or
ASA.
Service level is the most common way to define speed
of answer in a call centre. The level denotes a
percentage of calls to be handled within a defined
number of seconds. It is typically stated as x% of calls
handled in y seconds or less, with a common service
level goal in the call centre industry being to answer
80% of calls in 20 seconds or less. (Note: This number
is not to be considered an industry “standard” that
centres should strive to achieve. It is just a common
goal for many.)
Another common way to describe queue time or delay
time is average speed of answer or ASA. This statistic
represents the average delay of all calls for the period,
including those calls that experience no queue at all.
For example, if half the calls go into queue and wait an
average of 60 seconds, and the other half go to an
agent immediately and wait 0 seconds, the ASA would
be 30 seconds.
About two-thirds of call centres use service level as
their primary speed-of-answer measure with the other
third using ASA. Service level is generally preferred
since it provides more of a distribution view of the caller
experience rather than a simple average. Regardless
of which measure is used as the goal, it’s important to
consider the goal carefully as it will drive the number of
staff – the most expensive item in the call centre
operating budget. There is absolutely no such thing as
an “industry standard” for speed of service. Each call
centre’s service goal should be based on many different
factors, including the following:
Customer expectations. First and foremost, the
customer contact strategy, including the setting of
speed of answer goals, should be based on customer
needs and expectations. These expectations are
today being based on a myriad of service
experiences, and it is important to consider these in
defining a service goal to meet customer
expectations. Customers should be surveyed
regularly to see what their service expectations are in

Copyright © 2011 The Call Center School, LLC
6
terms of both quality and speed of service. It may be
appropriate to have faster speed of answer goals for
some customers than for others rather than having
one goal that applies to all calls.
Competitive influences. Certainly, most call centres
will want to also benchmark against what similar
companies are doing and how quickly they are
responding to customer contacts. To some degree,
the call centre may base its speed of answer goals
upon how captive its customer base is. If part of a
highly competitive industry where callers have many
options for service, the call centre may wish to set
more aggressive service goals, while those with a
monopoly on a product or service may settle for less
strenuous ones. Even in a single centre, multiple
situations may exist. For example, an automobile
insurance company may want fast speed of answer
on the sales lines, but not such an expensive goal for
staffing in the claims processing department.
Market position and branding. In some cases, speed
of answer may support the overall brand image and
reputation of a company. Those organisations known
for speedy service may wish to set high service level
goals to support the company’s brand image.
Budgetary guidelines. Ideally, service objectives
should drive staffing requirements and the budget.
But in reality, service objectives may be driven to
some degree by available budget pounds. While a
call centre might like to deliver a 90% in 10 seconds
speed of answer, there may simply be insufficient
budget to support such a high goal, and therefore the
objectives should be set to a level that is actually
attainable by the centre.
There are many factors that should be considered in
establishing a speed of answer goal and careful
consideration should be given to this number since it
dictates resource requirements and a significant portion of
the call centre’s operating budget. Careful thought should
be given to this objective on a regular basis to ensure the
objectives make sense in terms of budget pounds,
customer expectations, and support of the company’s
mission and goals. Too often call centres set service goals
and then never think about them again even as the
business grows and changes. It is recommended that
service objectives be evaluated every year as staffing
budgets are reviewed.
Applying a Call Centre Staffing Model
Once workload has been calculated and a speed of
answer objective established, staffing numbers can be
calculated. Due to the random arrival of calls and the
fact that some callers will find no agent available, it is
not simple to match workload with a given number of
staff. Finding the right number of staff involves the use
of detailed mathematical models that replicate the
unique staffing issues of the call centre.
There are several mathematical models that are used in
telephone traffic engineering applications. Some of
these are particularly suited to the unique operational
aspects of a call centre. The primary telephone traffic
model associated with call centre operations is called
Erlang C. (Note: For a discussion of additional
mathematical models and their application in call centre
operations, refer to Call Centre Staffing: The Complete,
Practical Guide to Workforce Management.)
The assumptions behind the Erlang C model are that
the events (or calls) arrive randomly within the work
period (hour or half-hour). The Erlang C model also
assumes that if a call attempt is made and no resource
(in this case, a call centre agent) is in place to handle
the call, the call will go into a queue and wait there until
there is a resource to handle it. It is the model used
most frequently in a simple call centre scenario where a
caller is asked to hold for the first available agent when
entering the queue.
The formula for Erlang C is outlined below. As you can
see, it’s a complicated one that does not lend itself
easily to computations with a pencil and a calculator!
However, it can be programmed into Excel for
calculation purposes, or there are a multitude of Erlang
calculator tools available. One popular one is The Call
Center School’s free QuikStaff tool, available at
www.quikstaff.com.

Copyright © 2011 The Call Center School, LLC
7
Let’s take a look at the Erlang C model applied to the
earlier example of 20 hours of workload. As you can
see in the table, if the service goal is to answer calls
with an average wait time of no more than 30 seconds,
then 23 staff would be required and 75% of the calls
would be handled within this threshold of time.
Workload Staff ASA
Service Level
(in 30 sec)
20 hours 21 137 sec 36%
20 hours 22 51 sec 59%
20 hours 23 25 sec 75%
20 hours 24 13 sec 85%
20 hours 25 7 sec 91%
One assumption within the Erlang C model is that all
calls that go into queue will wait there indefinitely until a
resource becomes available to process the call. It does
not account for the fact that some calls may abandon
the queue if the delay time is too long. Since some calls
are indeed likely to abandon, there will actually be less
workload to handle and queue times are shorter as a
result.
The fact that Erlang C does not incorporate abandoned
calls into the calculation of delays is illustrated by the
numbers in the table below. In this example, notice that
for the 9:00 time period, the forecast of calls was 173
and 180 actually arrived. Average handle time and staff
numbers were perfectly on target. More calls arrived
than were predicted; yet the actual service level as
shown on the ACD report is even better than the
forecasted service level. This is because the forecast
was based on an Erlang C model in which no calls
abandon, when in reality some actually do.
Some might argue that Erlang C is not a reliable model
to use in a call centre because abandoned calls should
be taken into account. There are several schools of
thought on this argument, but most would agree that
taking abandons into account when determining staff
numbers is risky. For example, if 10% of calls abandon,
and a call centre only staffs for ninety percent of the
calls, fewer staff would be put in place. But if the 10%
who abandon are doing so based on poor service, then
reducing the staff to handle the reduced calls will only
result in lower service levels and more abandons.
Should the callers exhibit greater than usual tolerance
for waiting and decide not to abandon, the service level
will be considerably worse than the forecast. It gets to
be a vicious cycle at some point, so beware of
modifying the Erlang model to account for abandoned
calls when calculating staff requirements. Erlang C is
the recommended and most widely used model
because it shows what would happen if all callers did
indeed choose to wait and staffs accordingly.
In explaining the differences between service level
predictions by half-hour and what the ACD shows as
actual numbers, look first to abandonment levels. If
they’re high, there will be a sizable variation between
forecast and actual numbers. Reducing the number of
abandons through shorter delays, better placement of
delay announcements, or more effective content in the
recordings will bring numbers closer to a perfect match.
The other limitation that should be mentioned
concerning Erlang C is its applicability in a more
complex staffing and scheduling scenario. It was stated
earlier that it is the recommended technique in a simple

Copyright © 2011 The Call Center School, LLC
8
queue scenario. Once complexities like queuing to
multiple groups and skill-based routing are introduced
into the call centre, the simple Erlang C model will need
to be replaced by a more sophisticated modeling
technique.
Time of
Day
Number of
Calls
Handle
Time
Number of
Staff
Service
Level
Number of
Calls
Handle
Time
Number
of Staff
Service
Level
8:00 125 240 20 78% 128 240 20 82%
8:30 148 240 23 73% 154 240 23 75%
9:00 173 240 27 80% 180 240 27 82%
Forecast Call and Service Level: Actual Calls and Service Level:

9
Part 2: Understanding Call Centre Staffing Tradeoffs
In determining the “just right” number of staff in the call
centre, there are many trade-offs to consider. In order
to evaluate these tradeoffs, it’s important to understand
the relationship between staffing and service, as well as
the effect that staffing levels have on productivity levels.
And every staffing decision should certainly be
evaluated in terms of its cost implications. Let’s exp lore
these three important service, productivity, and cost
tradeoffs
Service Implications
As seen in the previous Erlang C table, it is clear that
adding staff improves service and subtracting staff
causes service to worsen. But perhaps less obvious,
and even more important, is the degree of change in
service as staff are added or subtracted.
As seen in the staffing scenario below, with 600 calls
per hour and an average handle time of 300 seconds,
the workload is 50 hours or erlangs (the number of
hours of work to do in a one-hour period) To meet a
service goal objective of an ASA of <30 seconds, 55
staff would be required. Now look at what the impact
would be of adding or subtracting staff in this scenario.

10
Sample Staffing Scenario
Hourly Call
Volume
Average Handle Time
Staff Workload (in erlangs)
Number of Staff
Service Level (in
30 sec)
Delayed Portion
Delay of Delayed
Calls
ASA (in sec)
600 300 sec 50 hours 51 24% 84% 300 sec 252 sec
600 300 sec 50 hours 52 43% 70% 150 sec 105 sec
600 300 sec 50 hours 53 57% 58% 100 sec 58 sec
600 300 sec 50 hours 54 68% 47% 75 sec 35 sec
600 300 sec 50 hours 55 77% 38% 61 sec 23 sec
600 300 sec 50 hours 56 83% 31% 48 sec 15 sec
600 300 sec 50 hours 57 88% 25% 40 sec 10 sec
600 300 sec 50 hours 58 91% 19% 37 sec 7 sec
600 300 sec 50 hours 59 93% 15% 33 sec 5 sec
600 300 sec 50 hours 60 95% 12% 29 sec 3.5 sec
As each additional agent is added, service improves.
Increasing staff from 55 to 56 moves the ASA from 23
seconds to 15 seconds, an 8-second improvement. The
57th agent would improve ASA to 10 seconds (a 5-
second improvement); the 58th agent would drop ASA to
7 seconds (a 3-second improvement); the 59th agent
would improve ASA to 5 seconds (a 2-second
improvement). Every time an additional person is
added, service improves, but it does so in smaller
increments each time. This “law of diminishing returns”
means that at very good service levels, there is little
impact of adding an additional person.
On the other hand, look at what happens as staff
members are subtracted. Decreasing staff from 55 to 54
staff moves ASA from 23 seconds to 35 seconds (a 12-
second increase). Dropping to 53 staff would result in a
58-second ASA (a 23-second change), 52 staff would
yield a 105-second ASA (a 57-second increase), and
dropping to 51 staff would mean ASA would worsen to
252 seconds (a 147-second jump). Each time an agent
is subtracted, service worsens, and it does so by a
greater amount each time. The incremental change
gets larger and larger as the number of agents
approaches the hours of work to do.
This relationship of staff numbers and ASA is shown in
the graph below.
Staffing and Service Relationship
Note that as staff numbers decrease not only do more
calls go into queue, but the actual wait time in the
queue increases as well. For example, with 55 staff in
place, 38% of the callers will go into queue, with the
average queued call waiting 61 seconds (delay of
delayed calls), yielding an ASA of 23 seconds. With 54
staff, 47% of calls will go into queue, and the wait time
will be 75 seconds on average, yielding an ASA of 35

11
seconds. Therefore, the impact on ASA is driven by not
just more calls going into queue, but the delay time
there as well. This combination contributes to the
exponential rise in ASA as the number of staff
decreases.
A question frequently asked by agents in a call centre is
“What difference does just one person make on service
to customers?” And the answer is … “It depends.” The
actual impact on service depends upon where the call
centre is in the staffing and service curve. If staffing
levels are high and ASA is low, then adding or
subtracting just one person does not have much effect
on service. As evidenced in the table, the difference
between 57 staff and 58 staff in this scenario is only 3
seconds – a difference probably not noticeable to
callers.
On the other hand, if ASA is in the medium to high
range already, then taking just one more person off the
phones could affect service dramatically. Look at what
happens in the table when staff numbers dropped from
52 to 51 staff during the hour – a difference in ASA of
147 seconds! Just one person (in this example,
representing only 2% of the group) can have a
tremendous effect on service. The good news is that
adding a person at this level has a dramatically positive
impact. Therefore, call centres delivering long delay
times to customers can alter the service picture in a big
way by getting just one more person on the phones.
It is key to understand that this impact is a function of
the size of the group of agents who are handling a
specific call type. Large centres with 300+ agents think
that their size insulates them from these impacts. But
often, even the large centres break down the work
teams into smaller groups focused on specific call
types, so the impacts are still keenly felt.
Productivity and Occupancy
Another critical relationship to understand is the
relationship between staffing and agent occupancy. In
any staffing scenario, adding more staff means that
more people will be handling a given workload, so that
each individual agent is less busy. As staff members
are taken away, fewer people are left to accomplish the
work, and each person has to work harder.
The measure of how busy the agents are at processing
call workload is referred to as agent occupancy.
Occupancy compares the time the agent is actually
busy on a call or in after-call work to the time spend idle
waiting on the next call to arrive. The calculation is a
simple one -- workload hours divided by staff hours. In
other words, if there is 50 hours of work in the hour and
55 agents are available to handle calls, they will all be
occupied on calls 91% of the time and sitting in idle
state the other 9% of the hour.
In the 50-hour workload scenario, the last column
shows the level of agent occupancy associated with
varying staffing numbers.
Relationship of Staffing and Agent Occupancy
With only 52 agents handling 50 hours of workload, the
staff will be busy 96% of the time. In other words, there
will only be 4% idle time between calls (only 2.4
minutes out of the hour). On the other hand, with 58
people working, the agents would be busy only 86% of
the time they are logged in as available with a 14%
“breather” between calls.
In staffing a call centre, it is important to note this
occupancy number. With the efficiencies inherent in
larger call centres (to be discussed below), it is not
uncommon to see agent occupancy levels at 95% or
above. On the other hand, agent occupancy levels in a
smaller centre may only be at the 70% level, while
meeting the same service level goal as the larger
centre. This difference is illustrated in the table on the
next page.
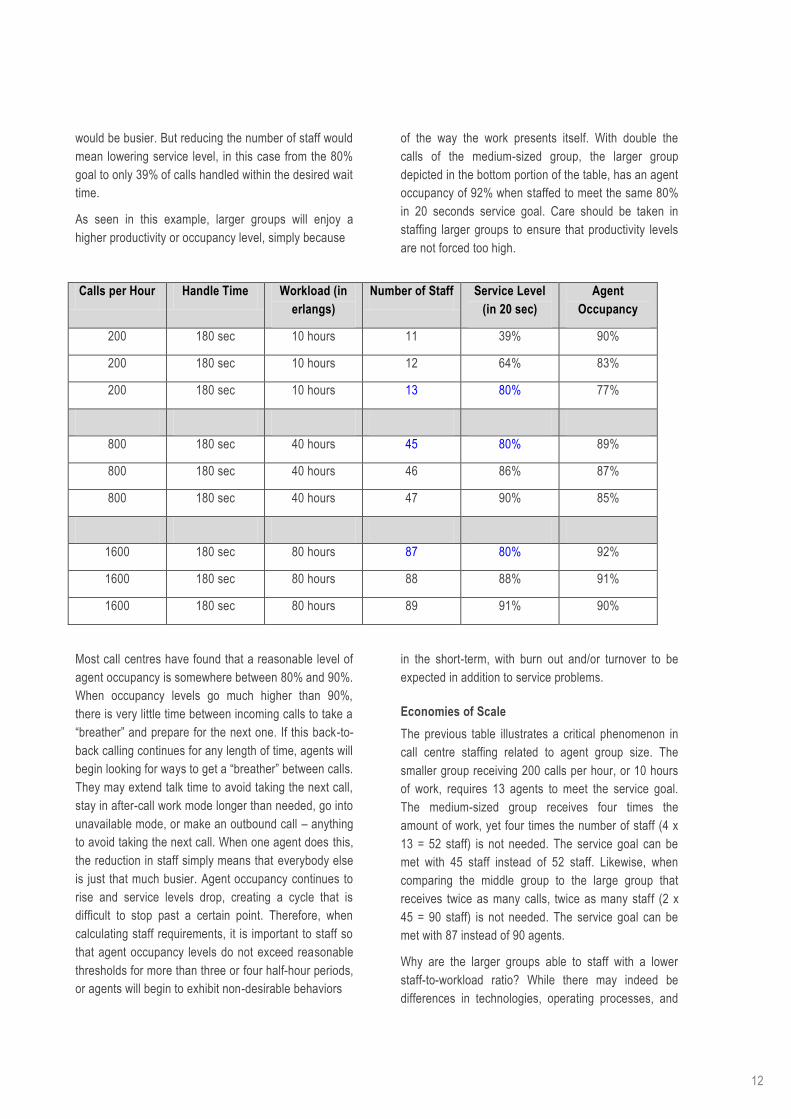
Effect of Group Size on Agent Occupancy Level
First compare the smaller group depicted in the upper
portion of the table with the medium-sized group in the
middle of the table. In the smaller group that receives
200 calls or 10 hours of workload, 13 agents are
required to meet an 80% in 20 seconds service level.
The resulting agent occupancy is 10/13 or 77%. In the
group that receives four times as many calls, or 40
hours of workload, 45 staff are needed to meet the 80%
in 20 seconds goal. The resulting level of agent
occupancy for this group is 40/45 or 89%. Even though
the two groups are staffed to meet the same 80% in 20
seconds service goal, the occupancy levels of the two
groups will be different. If the smaller group’s goal was
to have an occupancy level equivalent to the larger
group, that could be accomplished by reducing the
number of staff from 13 to 11. By doing so, a smaller
group would be handling the work and each person
12
would be busier. But reducing the number of staff would
mean lowering service level, in this case from the 80%
goal to only 39% of calls handled within the desired wait
time.
As seen in this example, larger groups will enjoy a
higher productivity or occupancy level, simply because
of the way the work presents itself. With double the
calls of the medium-sized group, the larger group
depicted in the bottom portion of the table, has an agent
occupancy of 92% when staffed to meet the same 80%
in 20 seconds service goal. Care should be taken in
staffing larger groups to ensure that productivity levels
are not forced too high.
Calls per Hour Handle Time Workload (in
erlangs)
Number of Staff Service Level
(in 20 sec)
Agent
Occupancy
200 180 sec 10 hours 11 39% 90%
200 180 sec 10 hours 12 64% 83%
200 180 sec 10 hours 13 80% 77%
800 180 sec 40 hours 45 80% 89%
800 180 sec 40 hours 46 86% 87%
800 180 sec 40 hours 47 90% 85%
1600 180 sec 80 hours 87 80% 92%
1600 180 sec 80 hours 88 88% 91%
1600 180 sec 80 hours 89 91% 90%
Most call centres have found that a reasonable level of
agent occupancy is somewhere between 80% and 90%.
When occupancy levels go much higher than 90%,
there is very little time between incoming calls to take a
“breather” and prepare for the next one. If this back-to-
back calling continues for any length of time, agents will
begin looking for ways to get a “breather” between calls.
They may extend talk time to avoid taking the next call,
stay in after-call work mode longer than needed, go into
unavailable mode, or make an outbound call – anything
to avoid taking the next call. When one agent does this,
the reduction in staff simply means that everybody else
is just that much busier. Agent occupancy continues to
rise and service levels drop, creating a cycle that is
difficult to stop past a certain point. Therefore, when
calculating staff requirements, it is important to staff so
that agent occupancy levels do not exceed reasonable
thresholds for more than three or four half-hour periods,
or agents will begin to exhibit non-desirable behaviors
in the short-term, with burn out and/or turnover to be
expected in addition to service problems.
Economies of Scale
The previous table illustrates a critical phenomenon in
call centre staffing related to agent group size. The
smaller group receiving 200 calls per hour, or 10 hours
of work, requires 13 agents to meet the service goal.
The medium-sized group receives four times the
amount of work, yet four times the number of staff (4 x
13 = 52 staff) is not needed. The service goal can be
met with 45 staff instead of 52 staff. Likewise, when
comparing the middle group to the large group that
receives twice as many calls, twice as many staff (2 x
45 = 90 staff) is not needed. The service goal can be
met with 87 instead of 90 agents.
Why are the larger groups able to staff with a lower
staff-to-workload ratio? While there may indeed be
differences in technologies, operating processes, and

13
skills between small and large groups, these reasons
do not explain the efficiencies. Rather, it is a situation in
which the agents in larger groups simply have an
opportunity to handle more calls during the period of
time they’re working. With a larger volume of calls,
there is a greater likelihood that when an agent is
finished with one call, there is another one arriving
immediately. There is less “down time” waiting for a call
to come in and the larger volume of calls represents a
“smoother” calling pattern. With each agent
presented with and capable of handling more calls
during the hour, each person can simply be more
efficient, and the call centre won’t need as many people
to accomplish the work. Each person will be busier or
more “occupied” with calls and therefore fewer staff
compared to the hours of workload will be needed. This
Phenomenon is referred to as the pooling principle or
economies of scale.
Consolidation Opportunities
These economies of scale should be taken into account
when staffing a call centre, particularly when staffing for
multiple groups or multiple call centres. For example,
suppose a call centre has different groups of customer
service agents assigned to different types of products.
Group A handles “gadgets” questions and Group B
handles inquiries about “widgets”. Each group receives
200 calls per hour that take three minutes each to
handle (or 10 erlangs of workload). As illustrated in
Exhibit 5.5, to meet a service goal of an ASA of 20
seconds or less, each group would require 13 staff, or a
total of 26 agents for the two groups.
Agent Group Consolidation Example
If the agents in this centre were cross-trained to handle
both “gadgets” and “widgets” calls, and all calls came
into one queue, only 24 staff would be needed. The
benefits of this consolidation could be viewed several
different ways. Two fewer agents would be required,
saving salary and benefits costs should these two
positions be eliminated. Or perhaps these staff would
stay on the payroll, but with fewer staff needed on the
phones at a given time, more time would be available to
rotate agents in and out of training and quality
programs. Alternatively, all 26 agents could take calls,
which would result in better service (an ASA of 4
seconds versus an average of 15 seconds). Or, the
same staff could provide the same level of service, and
simply handle more workload with the added available
time, meaning more calls or a longer handle time.
Of course, to accomplish the consolidation mentioned
above, cross-training would need to occur in order for
all agents to become universal agents who could
handle both types of calls. If the product lines are
similar, this training might be accomplished easily. On
the other hand, if the applications are very different, the
cost of training might outweigh the benefits to be
gained.
Anytime a consolidation of this type is considered, the
costs of consolidation must be compared against the
benefits. In weighing the benefits, one should look
realistically at the expected end result. In this scenario,
for example, the agents might be cross-trained to
handle another call type but it may take a considerable
amount of time for them to become fully competent with
Calls per Hour Handle Time Workload (in
erlangs)
Number of Staff ASA Agent
Occupancy
200 180 sec 10 hours 13 17 sec 77%
400 180 sec 20 hours 24 13 sec 83%

14
the new skill. If handling a mix of calls causes handle
times to increase from 180 seconds to 200 seconds per
call, the savings anticipated from the consolidation
might be wiped out entirely. Instead of the anticipated
savings of 26 staff to 24 staff, an extended handle time
could increase the staff needed to 27 staff, not to
mention the service impact on the customers by having
their calls handled by “generalists” instead of
“specialists”.
Cost Impact
In addition to the service and occupancy tradeoffs
discussed above, another consideration in arriving at
the “just right” staff number is related to cost. There are
cost implications of any staffing configuration and it is
important to consider these in making staffing and
budget decisions.
The number of staff in place during a given period has a
direct impact on how long callers will wait in queue. The
fewer staff in place, the longer the delay, and the higher
the occupancy level of the staff. In addition to these two
factors, the staffing design (and the resulting delay)
also has an impact on cost, especially if the call centre
is paying for the call through use of a toll-free service.
In this case, the centre must consider not just the cost
of talk time with the caller, but also the time the caller
spends waiting in queue, since the billing clock is
running during that time as well.
There are four main components of a call, as illustrated
on the right side.
Agent Agent Agent
Ring Time Delay
Time
Talk Time After-Call
Work
12sec 30sec 280 sec 20 sec
Phone Phone Phone
The average handle time used to calculate staff
requirements is made up of only talk time and after-call
work (280 seconds talk + 20 seconds after-call work =
300 seconds per call). The incoming telephone service
is being used during the ring time, the time the caller
spends in queue waiting to be answered, and
throughout the conversation (and during connection to
an IVR if one is used). These first three components
(ring + delay + talk) are used to calculate trunk or
network requirements and two of these elements (delay
+ talk) must be factored in to calculate the telephone
cost of each call.
Consider the following example that illustrates the
impact of staffing on the overall cost of delivering
service. In this example, the call centre expects to
receive 385 calls per hour and wishes to answer these
calls with an ASA of 30 seconds or less. This workload
would require 36 staff to be available, as illustrated
below. However, if some staff are missing and the
delays increase, there is an impact on cost as well as
service.
Understaffing Scenario
Consider what would happen if the three people were
missing. As shown in the table, with 33 staff handling
the 385 calls, the delay would increase from the desired
30 seconds to 268 seconds per call.
Not only does this understaffing situation cause a
problem with respect to service (a delay of over four
minutes compared to the goal of a half-minute) and
occupancy (a reasonable 88% increasing to 97%), but it
adds costs as well. Simply adding an additional 238
seconds of delay time to each of the 385 calls results in
an approximate additional telephone cost of £27 for this
hour alone (€.02 per minute x 1527 minutes additional
delay time). Several hours of understaffing per day can
easily add hundreds of pounds of cost each day.
In this example, there are additional costs that should
be considered in terms of the understaffing situation.

15
These costs include, but are not limited to, the
following:
If delay times increase to 268 seconds from a previous 30 seconds, callers are likely to complain, driving up call handle time.
With only 33 staff in place, occupancy levels would be at 97%, meaning that staff would likely spend longer in talk time or after-call work, driving up call handle time even further.
If occupancy levels remain at 97%, agents are likely to burn out quickly and may leave the centre. Turnover costs may include recruiting and screening costs, training costs, and additional supervisory costs, to name a few.
Poor service levels may result in lower customer satisfaction and reduced customer retention. The value of these lost customers’ transactions should also be considered a cost to the centre.
Quality is likely to suffer. Overworked staff will make mistakes, resulting in repeat calls or re-work of other tasks in the centre.
Clearly, there are many costs associated with
understaffing, and any staffing design should consider
these costs. If the same money is to be spent on either
higher telephone costs for long delays to give poor
service or spent on additional labor cost to give good
service, it seems like the latter is a better choice.
However, when the telecommunications budget is not
part of the call centre’s budget, this correlation is often
missed.
Revenue Call Centres
While most call centres use the steps outlined above in
calculating the number of staff needed to meet a
specified speed-of-answer goal, there is another
method of determining staff numbers that is worth
considering for call centres that make money when
answering calls. Determining the optimal number of
staff in a revenue-generating call centre such as a
catalog or reservations centre involves a relatively
simple cost calculation. This approach takes into
account overall costs of providing different levels of
service to pinpoint the combination that maximises the
bottom line.
The economic components to be considered in the
revenue optimisation approach are:
Potential Revenue. The average revenue per
call multiplied by the number of calls forecast for the period. Obviously, call centres taking catalog orders or reservation will have precise measures of this monetary value per call, while centres oriented more towards service and support rather than sales may have a more difficult time estimating this “value” per call.
Staffing Cost. Fully loaded hourly staffing cost including salary, benefits, supervision, equipment, and overhead.
Telephone Cost. Average cost/hour of answering calls, including long-distance and local charges.
Abandoned Call Cost. The cost of lost calls. Ignoring abandoned calls is not a “neutral” act. Consider the lost revenue of calls waiting too long in queue, based on caller tolerance levels and associated abandon rates.
Once the value of all these numbers has been
determined, the exact number of staff needed to
maximise net revenues of the centre can be calculated.
In optimising the bottom line, simply seek to balance the
cost of adding staff with the increased revenue those
staff will be able to generate. Up to a certain point,
revenue generated by additional staff will exceed their
additional cost. Beyond that number, the additional cost
exceeds their revenue.
Clearly, in a call centre where each call adds revenue to
the bottom line, take time to consider staffing to the
point at which net revenue (and therefore profitability) is
maximised. This approach is particularly effective in
helping to cost-justify additional staff even during
periods when hiring decisions are closely scrutinised.
This is also an effective method to use in determining
what the day-to-day service level goal ought to be.
Summary
One of the most important functions in the call centre is
workforce planning. Getting the “just right” number of
staff in place to respond to customer contacts is critical
to call centre success. Having too many people in
place in a given hour results in excessive labour costs
and lower overall productivity. On the other hand,
having too few people in place can seriously impact
service to customers, overload staff, and drive up
phone costs. It’s imperative to put proper staffing
models in place to ensure that the call centre has the
right number of “bodies in chairs” at all times.

16
When evaluating this proper number of staff, always
consider a staffing decision from the perspective of the
three major call centre stakeholders – customers,
agents, and senior management. Evaluate the impact
that adding or subtracting staff will have on queue times
and acceptable service delivery to callers. Consider
what staffing levels will mean in terms of the workload
distribution and whether or not the resulting occupancy
level results in too much idle time between calls or a
level that’s high enough to lead to agent stress and
burnout. Finally, consider senior management’s point
of view with an eye to bottom-line costs. Consider not
just the cost of labor, but also telephone delay costs
and other hidden costs that may increase with lower
staffing numbers.
Understanding and calculating these tradeoffs will
ensure informed workforce planning decisions. Getting
this “just right” number of staff in place will provide the
foundation for successful call centre management by
the numbers.

17
Part 3: Supporting Tools and Resources
While calculating staff requirements is a fairly
straightforward process for one hour of a workday,
when you multiply that by the many hours in the day,
days in the week, and weeks in a year, the calculations
can be a bit overwhelming. Add to this the need to
make good estimates of how many calls you expect to
receive each hour. And then there’s the need to take
all these staff requirements and formulate them into
efficient work schedules and manage them on a daily
basis.
That’s where automated workforce management
software comes into play. By automating and optimising
the forecasting, staffing, scheduling, and daily
management process, you can match your workforce to
the workload effectively to maximise service and
minimise cost.
InVision Software has all the elements you need to
make the most of your workforce planning and
management efforts. Our automated WFM tools

address all the critical components in the staffing
process:
Workload and Staffing Forecasts – Know how
many calls to expect along with the number of
staff needed with what skills
Work Schedule Creation – Get exactly the
right number of people in place at the right
time to maximise the personnel resource
Time Management – Administer employee’s
work time accounts to manage paid and
unpaid time
Analysis and Monitoring – Evaluate whether
your results match your plan with information
to take quick actions if deviations occur
Automating these workforce management tasks results
in better scheduling efficiency, more consistent delivery
of service to callers, higher staff satisfaction. If you’d
like to see how InVision Software can benefit your
centre, give us a call. Our consultants will be happy to
provide a demonstration of the software and work with
you to calculate the cost-effectiveness and potential
return on investment of InVision Software solutions.
Contact Information
InVision Software Ltd.
Chris Dealy
Sales Director
Baskerville House
Centenary Square, Birmingham B1 2 ND
United Kingdom
Phone: +44 7917 772365
E-mail: [email protected]
Web: www.invisionwfm.com

About the Author Penny Reynolds is a Co-Founder of The Call Center School where she heads up curriculum development. She develops
and teaches courses on a wide variety of call centre topics, including workforce management, performance
measurement, and call centre technologies. Penny is a popular speaker at industry conferences and association
meetings and a frequent contributor to industry trade publications. She is the author of several books, including Call
Center Staffing: The Practical Guide to Workforce Management, Business School Essentials for Call Center
Leaders, Call Center Supervision: The Complete Guide to Managing Frontline Staff, Power Phrasing, and The
Power of One. She has also co-authored the five textbooks for University of Phoenix’s call centre certification program.
An honors graduate of Vanderbilt University, Penny was one of the first recipients of Call Center Magazine’s prestigious
Call Center Pioneer award.
The Call Center School, LLC
Penny Reynolds
Co-Founder
568 Grant Highway
Lebanon, TN 37090
USA
Phone: +1 615 812 8410
E-mail: [email protected]
Web: www.thecallcenterschool.com