the many manifestations of downsizing: hierarchical galaxy ... · 3 inaf-osservatorio astronomico...
TRANSCRIPT

arX
iv:0
901.
1130
v2 [
astr
o-ph
.CO
] 13
May
200
9
Mon. Not. R. Astron. Soc.000, 000–000 (0000) Printed 13 May 2009 (MN LATEX style file v2.2)
The Many Manifestations of Downsizing: Hierarchical GalaxyFormation Models confront Observations.
Fabio Fontanot1, Gabriella De Lucia2,3, Pierluigi Monaco3,4, Rachel S. Somerville1,5,Paola Santini6,7
1 MPIA Max-Planck-Institute fur Astronomie, Koenigstuhl 17, 69117 Heidelberg, Germany2 MPA Max-Planck-Institute fur Astrophysik, Karl-Schwarzschild-Strasse 1, D-85748, Garching, Germany3 INAF-Osservatorio Astronomico di Trieste, Via Tiepolo 11,I-34131 Trieste, Italy4 Dipartimento di Astronomia, Universita di Trieste, via Tiepolo 11, 34131 Trieste, Italy5 Space Telescope Science Institute, 3700 San Martin Drive, Baltimore, MD 21218, USA6 INAF-Osservatorio Astronomico di Roma, via Frascati 33, I-00040 Monteporzio, Italy7 Dipartimento di Fisica, Universita di Roma “La Sapienza”,P.le A. Moro 2, 00185 Romaemail: [email protected], [email protected], [email protected], [email protected], [email protected]
Accepted ... Received ...
ABSTRACTIt has been widely claimed that several lines of observational evidence point towards a “down-sizing” of the process of galaxy formation over cosmic time.This behaviour is sometimestermed “anti-hierarchical”, and contrasted with the “bottom-up” (small objects form first) as-sembly of the dark matter structures in Cold Dark Matter models. In this paper we addressthree different kinds of observational evidence that have been described as “downsizing”: thestellar mass assembly (i.e. more massive galaxies assembleat higher redshift with respect tolow-mass ones), star formation rate (i.e. the decline of thespecific star formation rate is fasterfor more massive systems) and the ages of the stellar populations in local galaxies (i.e. moremassive galaxies host older stellar populations). We compare a broad compilation of availabledata-sets with the predictions of three different semi-analytic models of galaxy formationwithin theΛCDM framework. In the data, we see only weak evidence at best of “downsizing”in stellar mass and in star formation rate. Despite the different implementations of the phys-ical recipes, the three models agree remarkably well in their predictions. We find that, whenobservational errors on stellar mass and SFR are taken into account, the models acceptablyreproduce the evolution of massive galaxies (M > 1011 M⊙ in stellar mass), over the en-tire redshift range that we consider (0 <
∼z <∼
4). However, lower mass galaxies, in the stellarmass range109
− 1011 M⊙, are formed too early in the models and are too passive at latetimes. Thus, the models do not correctly reproduce the downsizing trend in stellar mass or thearchaeological downsizing, while they qualitatively reproduce the mass-dependent evolutionof the SFR. We demonstrate that these discrepancies are not solely due to a poor treatmentof satellite galaxies but are mainly connected to the excessively efficient formation of centralgalaxies in high-redshift haloes with circular velocities∼ 100 − 200 km/s. We conclude thatsome physical process operating on these mass scales — most probably star formation and/orsupernova feedback — is not yet properly treated in these models.
Key words: galaxies: formation - galaxies: evolution
1 INTRODUCTION
In the last decades, the parameters of the cosmological modelhave been tightly constrained (Komatsu et al. 2009, and referencestherein), and the CDM paradigm has proved to be very success-ful in reproducing a large number of observations, particularly onlarge scales. The current standard paradigm for structure formationpredicts that the collapse of dark matter (DM) haloes proceeds in a
“bottom-up” fashion, with smaller structures forming firstand latermerging into larger systems. It has long been known that galaxiesdo not share the same ‘bottom-up’ evolution, at least in their starformation histories. The most massive galaxies — mainly giant el-lipticals hosted in galaxy groups and clusters — are dominated byold stellar populations. In contrast, faint field galaxies appear tohave continued to actively form stars over the last billion years,

2 Fontanot et al.
and their stellar populations are dominated by young stars.This ev-idence is not necessarily in contrast with the hierarchicalclusteringof DM haloes as it relates to the “formation” of the main stellarpopulation of a galaxy, which does not necessarily coincidewiththe “assembly” of its stellar mass and/or the assembly of itsparentdark matter halo.
In the last decade, much observational effort has been devotedto quantifying the dependence of galaxy formation and assembly onstellar mass. In one of the earliest such studies, Cowie et al. (1996)showed that the maximum rest-frameK-band luminosity of galax-ies undergoing rapid star formation in the Hawaii deep field de-clines smoothly with cosmological time. Cowie and collaboratorscoined the term “downsizing” (hereafter DS) to describe this be-haviour. Since then, the same term has been extended to a numberof observational trends suggesting either older ages, earlier activestar formation, or earlier assembly for more massive galaxies withrespect to their lower mass counterparts. Using the same word todescribe very different kinds of observational results hasnaturallygenerated some confusion. The underlying thought has clearly beenthat these observations are allmanifestationsof the same underly-ing physical process. It is not clear to which degree this is in factthe case, nor to what degree these observational trends are “anti-hierarchical”, i.e. whether they are in fact in serious conflict withpredictions from models based onΛCDM cosmology.
It is useful, at this point, to summarise the different typesof“downsizing” that have been discussed in the literature. Clearly,each of the observational evidences discussed below has itsownset of uncertainties and potential biases. Here, we report the trendsas they have been claimed in the literature, and discuss in more de-tail the related uncertainties and caveats later. The first two types ofDS that we describe are based on the local “fossil record” andarerelated to the time of “formation” of the stellar population, i.e. theytell us that the bulk of the stars in more massive galaxies formedearlier and on shorter time-scales than in their lower mass counter-parts. These two types of DS are:
Chemo-archaeological DS: among elliptical galaxies, moremassive objects have higher (up to super-solar) [α/Fe] ratios. Thisresult was first reported by Faber et al. (1992) and Worthey etal.(1992), who suggested three possible (and equally acceptable atthat time) explanations: (i) different star formation time-scales; (ii)a variable Initial Mass Function (IMF); (iii) selective mass lossmechanisms. Several studies have since confirmed this observa-tional trend (Carollo et al. 1993; Davies et al. 1993; Trageret al.2000b; Kuntschner et al. 2001), and a standard interpretationhas become that of shorter formation time-scales in more lu-minous/massive galaxies (Matteucci 1994; Thomas et al. 2005),though other interpretations have not been conclusively ruled out.
Archaeological DS: more massive galaxies host older stellarpopulations than lower mass galaxies. A direct estimate of stellarages is hampered by the well-known age-metallicity degeneracy(e.g. Trager et al. 2000a, and references therein), although it haslong been known that there are some spectral features (like Balmerlines) that are more sensitive to age than to metallicity (see i.e.,Worthey 1994). Recent detailed analyses, based on a combinationof spectral indexes or on a detailed fit of the full high-resolutionspectrum, have confirmed a weak trend between stellar mass andage both in clusters (Thomas et al. 2005; Nelan et al. 2005, thoughsee Trager et al. 2008), and in the field (Trager et al. 2000a;Heavens et al. 2004; Gallazzi et al. 2005; Panter et al. 2007).
The second kind of observational evidence for DS comes from“lookback studies”, or observations of galaxies at different cosmicepochs:
DS in (specific) SFR: the mass of ‘star-forming galax-ies’ declines with decreasing redshift. This trend was firstseen by Cowie et al. (1996), and there have been manyclaimed confirmations by subsequent deeper and/or wider ob-servational programmes (Brinchmann et al. 2004; Kodama et al.2004; Feulner et al. 2005; Bauer et al. 2005; Papovich et al.2006; Bundy et al. 2006; Pannella et al. 2006; Bell et al. 2007;Noeske et al. 2007; Drory & Alvarez 2008; Vergani et al. 2008;Chen et al. 2009; Cowie & Barger 2008). This trend can also berecast as implying that the SFR density or specific star formationrate declines more rapidly for more massive systems; here thereare conflicting claims in the literature about whether such atrendis in fact seen or not (e.g. Juneau et al. 2005; Zheng et al. 2007;Conselice et al. 2007; Mobasher et al. 2009). This trend reflects inSSFRs of nearby spiral galaxies which are higher for lower massobjects (Boselli et al. 2001). A possibly related trend is the increasewith time of faint red-sequence galaxies in galaxy clusters(see,e.g., De Lucia et al. 2004, 2007; Gilbank et al. 2008), which maybe due to a differential decline of the SSFR.
DS in stellar mass: the high-mass end of the stellar massfunction (hereafter MF) evolves more slowly than the low-massend, indicating that massive galaxies were assembled earlierthan less massive ones. The same result is found both by cor-recting the B-band or K-band luminosity functions for “pas-sive” evolution (Cimatti et al. 2006) and by estimating the stel-lar mass using multi-wavelength photometry (Drory et al. 2004,2005; Bundy et al. 2006; Borch et al. 2006; Fontana et al. 2006;Pozzetti et al. 2007; Conselice et al. 2007; Perez-Gonzalez et al.2008; Marchesini et al. 2008). The significance of these claims hasbeen recently questioned by Marchesini et al. (2008).
DS in metallicity: the stellar metallicity of more massivegalaxies appears to decrease with redshift more slowly thanfor lessmassive galaxies (Savaglio et al. 2005; Erb et al. 2006; Andoet al.2007; Maiolino et al. 2008). It is important to note, however,that often different indicators are used at different redshifts, andthat there are large uncertainties in the metallicity calibration(Kewley & Ellison 2008).
DS in nuclear activity: the number density of Active Galac-tic Nuclei (AGNs) peaks at higher redshift when brighter objectsare considered. This trend is found both for X-ray (Ueda et al.2003; Hasinger et al. 2005) and for optically (Cristiani et al. 2004;Fontanot et al. 2007) selected AGNs, but it strongly dependson themodeling of obscuration (e.g., La Franca et al. 2005).
Downsizing trends have often been considered “anti-hierarchical”, suggesting expected and/or demonstrated difficul-ties in reconciling the observed trends with predictions from hi-erarchical galaxy formation models. The naive expectationis that,like for dark matter haloes, galaxy formation also proceedsin abottom-up fashion with more massive systems “forming” later. Ithas already been pointed out in early theoretical work (Baugh et al.1996; Kauffmann 1996) that the epoch of formation of the starswithin a galaxy does not necessarily coincide with the epochofthe galaxy’s assembly. Moreover, Neistein et al. (2006) (see alsoLi et al. 2008) suggested that a certain degree of “natural down-sizing” is actually expected in the CDM paradigm if one assumesthat there is a minimum halo mass that can support star forma-tion and considers the integrated mass in all progenitor haloesrather than just that in the main progenitor. However, several au-thors (Cimatti et al. 2006; Fontana et al. 2006; Fontanot et al. 2006;Cirasuolo et al. 2008) have argued that the observed mass assem-bly DS represents a challenge for modern hierarchical galaxy for-
Downsizing in Hierarchical Models 3
mation models. As well, CDM models have been unable1 to re-produce the observed chemo-archaeological DS (Thomas 1999;Thomas et al. 2005; Nagashima et al. 2005; Pipino et al. 2008),and Somerville et al. (2008) and Trager & Somerville (2008) haveshown that the modern generation of models does not quantitativelyreproduce the archaeological DS trend in the field or in rich clus-ters.
Early phenomenological models of joint galaxy-AGN forma-tion by Monaco et al. (2000) and Granato et al. (2001) produced”anti-hierarchical” formation of elliptical galaxies inΛCDM halosby delaying quasar activity in less massive halos. More recently, ithas been suggested that AGN feedback could provide a solution tothe “downsizing problem” (Bower et al. 2006; Croton et al. 2006).The suppression of late gas condensation in massive haloes givesrise to shorter formation time-scales for more massive galaxies(De Lucia et al. 2006), in qualitative agreement with the observedtrends. However, the recent work by Somerville et al. (2008)indi-cates that the predicted trends may not be as strong as the observedones, even in the presence of AGN feedback.
Moreover, AGN feedback does not stop the growth in stellarmass via mergers.ΛCDM models predict that the stellar masses ofthe most massive galaxies have increased by a factor two or moresince z ∼ 1 via gas-poor “dry mergers” (De Lucia et al. 2006;De Lucia & Blaizot 2007). It has been suggested that if mergersscatter a significant fraction of the stars in the progenitorgalaxiesinto a “diffuse stellar component”, then perhaps one can reconcilethe CDM predictions with the observed weak evolution in the stel-lar mass function sincez ∼ 1 (Monaco et al. 2006; Conroy et al.2007; Somerville et al. 2008), but observational uncertainties onthe amount of diffuse light are still too large to strongly constrainmodels of this process.
Despite the large number of papers related to the subject of“downsizing”, a detailed and systematic comparison between abroad compilation of observational data and predictions from hi-erarchical galaxy formation models is still missing. Our study isa first attempt in this direction. We present here predictions fromthree different semi-analytic models (see§2), all of which havebeen tuned to provide reasonably good agreement with the ob-served properties of galaxies in the local Universe, and comparethem to an extensive compilation of recent data on the evolutionof the stellar MF, SSFRs, and SFR densities, as well as with ob-servational determinations of stellar population ages as afunctionof mass in nearby galaxies. An important new aspect of our studyis that we consider three (claimed) “manifestations” of downsizingsimultaneously. Because these very different kinds of observationshave very different potential selection effects and biases, this al-lows us to make a strong argument that, when a discrepancy is seenbetween the models and all three kinds of observations, thisdis-crepancy is due to shortcomings in the physical ingredientsof themodels rather than errors or biases in the observations. Similarly, bymaking use of three independently developed semi-analyticmod-els, which include different implementations of the main physicalprocesses, we can hope to determine which conclusions are robustto model details.
In this study, we do not address the “Chemo-archaeological
1 It should be noted that the work by Thomas (1999) was not fullyself-consistent as they used star formation histories froma semi-analyticmodel in a “closed-box” chemical enrichment model. The later work byNagashima et al. (2005) has, however, confirmed the difficulties in repro-ducing the observed trends.
DS” or the “DS in metallicity”. Our chemical enrichment modelsare all based on an instantaneous recycling approximation whichprevents us from making detailed comparisons with observedele-mental abundances. We have also decided not to discuss here the“DS in AGN activity”, which depends strongly on the complicatedand poorly understood physics of accretion onto black holesand onits relation to star formation activity (see, e.g., Menci etal. 2004,2008; Fontanot et al. 2006).
The paper is organized as follows: in§2 we give a brief intro-duction to the models we use in our study. We then present our re-sults for the DS in stellar mass (§3), in SFR (§4), and on the archae-ological DS (§5). In §6, we discuss our results and give our con-clusions. Throughout this paper we assume a cosmological modelconsistent with the WMAP3 results.
2 MODELS
We consider predictions from three independently developed codesthat use semi-analytic modeling (SAM) techniques to simulate theformation of galaxies within theΛCDM cosmogony (for a reviewon these techniques see Baugh 2006). In SAMs, the evolution ofthe baryonic component of galaxies — which are assumed to formwhen gas condenses at the center of DM haloes — is modeled us-ing simple but physically motivated analytic ‘recipes’. The param-eters entering these analytic approximations of the various phys-ical processes are usually fixed by comparing model predictionsto observational data of local galaxies. Although the treatment ofthe physical processes is necessarily simplified, this technique al-lows modelers to explore (at least schematically) a broad range ofprocesses that could not be directly simulated simultaneously (e.g.,accretion onto SMBH on sub-pc scales within the framework ofcosmological structure formation), and to explore a wide parame-ter space.
Most of the various SAMs proposed in the literature are at-tempting to model the same basic set of physical processes. Whena comparison is made of several SAMs with observations, one mayfocus on differences between models, with the aim of understand-ing how the details of a particular implementation influencethepredictions of galaxy properties. Alternatively, one may concen-trate on comparing the model predictions with the observationaldata. In this case the focus shifts to assessing whether the generalframework, namelyΛCDM + the set of physical processes imple-mented, gives a plausible description of galaxy populations.
In this paper we take the second approach. We use threeSAMs: (i) the most recent implementation of the Munich model(De Lucia & Blaizot 2007) with its generalization to the WMAP3cosmology discussed in Wang et al. (2008, hereafter WDL08);(ii)the MORGANA model, presented in Monaco et al. (2007), adaptedto a WMAP3 cosmology, and with some minor improvementswhich will be presented in Lo Faro (2009), (iii) the fiducial modelpresented in Somerville et al. (2008, hereafter S08), whichbuildson the previous implementation discussed in Somerville et al.(2001). All models adopt, for the results discussed in this study,a Chabrier (2003) IMF.
In the following we briefly summarize the main physical in-gredients of SAMs, and then highlight the main differences be-tween the implementations of these ingredients in the threemodelsused here. For more details we refer to the original papers men-tioned above and to the references therein.
We first summarize the elements that are common to all threemodels. The backbone of all three SAM’s is a “merger tree”, which

4 Fontanot et al.
describes the formation history of dark matter haloes through merg-ers and accretion. When a halo merges with a larger virializedhalo, it becomes a “sub-halo” and continues to orbit until itis ei-ther tidally destroyed or merges with the central object. Gas coolsand condenses via atomic cooling, and forms a rotationally sup-ported disc. This cold disc gas becomes available for star formation,which is modeled using simple empirical (Schmidt-Kennicutt-like)recipes. Galaxy mergers trigger enhanced “bursts” of star forma-tion. After the Universe becomes reionized, gas infall is suppressedin low-mass haloes (<∼ 30–50 km/s) due to the photoionizing back-ground. Star formation deposits energy into the cold gas, and mayre-heat or expel this gas. The production of chemical elements bytype II supernovae is tracked using a simple instantaneous recy-cling approximation with the effective yield taken as a freepa-rameter. All three codes also track the formation of supermassiveblack holes, and differentiate between the so-called “bright-mode”(or “quasar-mode”) which is associated with luminous AGNs,and“radio-mode” accretion which is related to efficient productionof radio jets. The “bright-mode” is associated with galaxy-galaxymergers (WDL08 and S08) or Eddington-limited accretion rates(MORGANA), while the “radio-mode” is associated with low ac-cretion rates (few percent of Eddington). All three models include“radio mode” feedback (heating of the hot gas halo by giant radiojets). MORGANA and S08 also include galactic scale AGN-drivenwinds, which can remove cold gas from galaxies.
All three models are coupled with stellar population synthesismodels and a treatment of dust absorption, and are capable ofpre-dicting observable quantities like luminosities and colours in vari-ous bands. However, modeling these additional ingredients(espe-cially dust, as recently shown by Fontanot et al. 2009) introduces alarge number of additional uncertainties and degrees of freedom inboth the model-model and the model-data comparison. To simplifythe interpretation of our results, we therefore conduct ourentireanalysis in the space of “physical” quantities (e.g. stellar massesand SFRs), which are directly predicted by the models, and may beextracted from multi-wavelength observations.
Here we highlight a few of the differences between the modelimplementations:
• Cosmological and Numerical Parameters: All threesemi-analytic models adopt values of the cosmologicalparameters that are consistent with the WMAP3 resultswithin the quoted errors. WDL08 use a simulation boxof 125h−1Mpc3 on a side, with cosmological parameters(Ω0, ΩΛ, h, σ8, nsp) = (0.226, 0.774, 0.743, 0.722, 0.947).MORGANA uses a 144h−1 Mpc box, and adopts a cosmology with(Ω0, ΩΛ, h, σ8, nsp) = (0.24, 0.76, 0.72, 0.8, 0.96). S08 uses agrid of 100 realizations of 100 “root” haloes, with circularveloc-ities ranging from 60 km/s to 1200 km/s, and weights the resultswith the Sheth & Tormen (1999) halo mass function. The S08model used here assumes the following cosmological parameters(Ω0, ΩΛ, h, σ8, nsp) = (0.279, 0.721, 0.701, 0.817, 0.96). In allcases, the mass resolution is sufficient to resolve galaxieswithstellar mass larger than109 h−1 M⊙. The very small differences inthe cosmological parameters in the three models will have a nearlyundetectable impact on our predictions, and therefore we make noattempt to correct the results for the slightly different cosmologies.• merger trees: The WDL08 model uses merger trees extracted
from a dissipationless N-Body simulation (Springel et al. 2005),MORGANA uses the Lagrangian semi-analytic codePINOCCHIO
(Monaco et al. 2002), and S08 use a method based on the Extended
Press-Schechter formalism, described in Somerville & Kolatt(1999).• substructure: The WDL08 model explicitly follows dark
matter substructures in the N-body simulation until tidal trunca-tion and stripping reduce their mass below the resolution limit ofthe simulation (De Lucia et al. 2004; Gao et al. 2004). Beyondthatpoint the merger time of the satellite is computed using the clas-sical Chandrasekhar dynamical friction approximation (for moredetails see De Lucia & Blaizot 2007 and De Lucia & Helmi 2008).MORGANA and S08 do not track explicitly dark matter substruc-tures and assume satellite galaxies merge onto central galaxiesafter a dynamical friction time-scale which is assigned at thetime the satellite enters the virial radius of the remnant struc-ture, following Taffoni et al. (2003) in the case ofMORGANA andBoylan-Kolchin et al. (2008) in the case of S08. The same modelsalso account for tidal destruction of satellites.• cooling model: WDL08 and S08 use variations of the orig-
inal cooling recipe of White & Frenk (1991), whileMORGANA
uses a modified model, described and tested against simulationsin Viola et al. (2008), that predicts an enhanced cooling rate at theonset of cooling flows.• galaxy sizes, star formation, and SN feedback: The three
SAMs also differ in the details of the modeling of star formation,stellar feedback and galactic winds, as well as in the computationof galaxy sizes. We prefer not to discuss these processes in detailhere and we refer the reader to the original papers for more details.• BH growth and AGN feedback: In the WDL08 and S08
models, the radio mode is fueled by accretion from the hot gashalo, and only haloes that can support a quasi-hydrostatic halo aresubject to the radio mode heating (though the conditions used dif-fer, see Croton et al. (2006) and Somerville et al. (2008)). In MOR-GANA the radio mode accretion comes from the cold gas reser-voir surrounding the black hole. In the WDL08 and S08 mod-els, the “bright mode” or quasar mode is explicitly triggered bygalaxy-galaxy mergers (though again, the details of the implemen-tation differ), while inMORGANA it is associated with Eddington-limited high accretion rates (again coming from the cold reservoir).As noted above,MORGANA and S08 include galactic scale AGN-driven winds associated with the bright mode, while WDL08 donot.
The three models were each normalized to fit a subset oflow-redshift observations. The specific observations used, and theweight given to different observations in choosing a favored nor-malization are different for each of the three models, and werefer tothe original papers for details. The most important free parametersin all three models are those controlling the efficiency of supernovafeedback, star formation, and “radio mode” AGN feedback. The ef-ficiency of supernova feedback is primarily constrained by the ob-served low-mass slope of the stellar mass function (MORGANA andS08) or the faint-end slope of the luminosity function (WDL08).The efficiency of star formation is mainly constrained by observa-tions of gas fractions in nearby spiral galaxies (WDL08 and S08)or by the cosmic SFR density (MORGANA). The efficiency of the“radio mode” AGN feedback is constrained by the bright or high-mass end of the observed LF or SMF. Other important parametersare the effective yield of heavy elements, which is constrained bythe observed mass-metallicity relation atz = 0, and the efficiencyof black hole growth, which is constrained by the observedz = 0black hole mass vs. bulge mass relationship. We emphasize thatwe made no attempt to tune the models to match each other, or tomatch any of the high redshift data that we now compare with.

Downsizing in Hierarchical Models 5
z = 0.00 0.2<z<0.4 0.4<z<0.6
0.6<z<0.8 0.8<z<1.0 1.0<z<1.3
1.3<z<1.6 1.6<z<2.0 2.0<z<3.0
3.0<z<4.0 4.0<z<5.0
z = 0.00 0.2<z<0.4 0.4<z<0.6
0.6<z<0.8 0.8<z<1.0 1.0<z<1.3
1.3<z<1.6 1.6<z<2.0 2.0<z<3.0
3.0<z<4.0 4.0<z<5.0
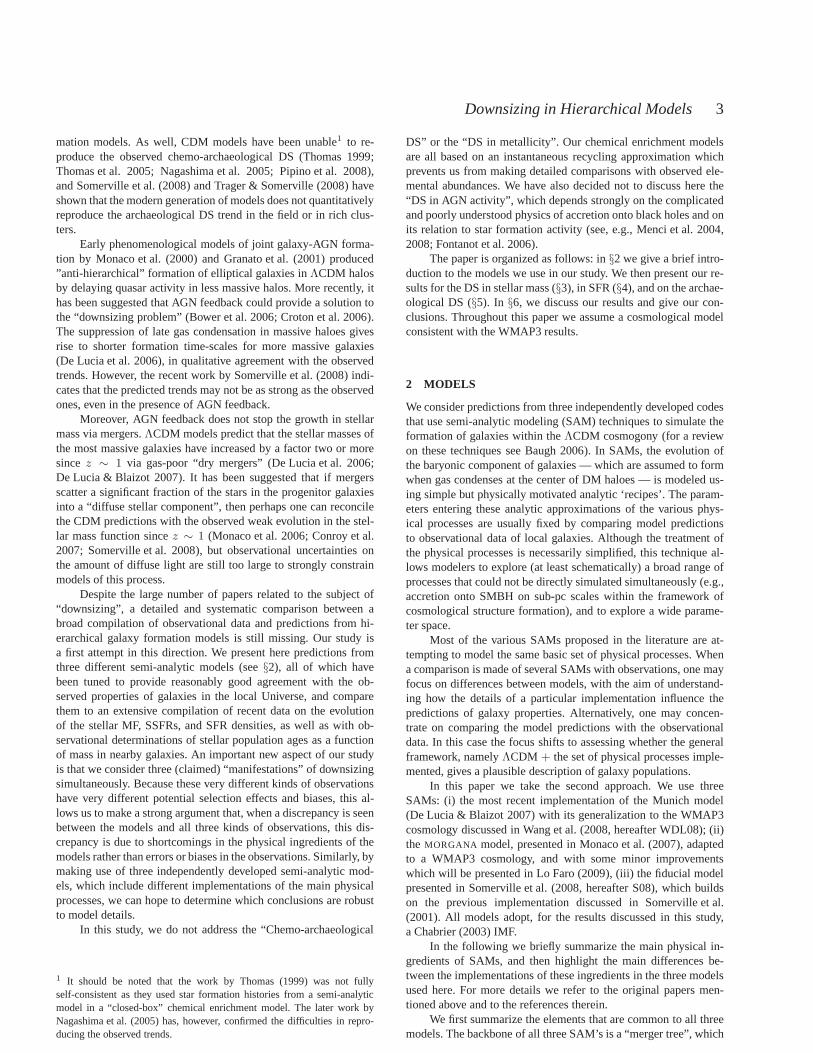
Figure 1. Galaxy stellar MF as a function of redshift. Solid, dashed, and dot-dashed lines refer to theMORGANA, WDL08, S08 models respectively. In theright panels, all model predictions have been convolved with a Gaussian error distribution onlog M⋆ with standard deviation of 0.25 dex. Green symbolscorrespond to observational measurements from Panter et al. (2007, SDSS,z = 0), Cole et al. (2001, 2MASS,z = 0), Bell et al. (2003, 2MASS+SDSS,z = 0), Borch et al. (2006, COMBO17,0.2 < z < 1), Perez-Gonzalez et al. (2008, Spitzer,0 < z < 4), Bundy et al. (2006, DEEP2,0.4 < z < 1.4),Drory et al. (2004, MUNICS,0.4 < z < 1.2), Drory et al. (2005, FDF+GOODS,0 < z < 5), Fontana et al. (2006, GOODS-MUSIC,0.4 < z < 4),Pozzetti et al. (2007, VVDS,0.05 < z < 2.5), Marchesini et al. (2008, MUSYC+FIRES+GOODS-CDFS,1.3 < z < 4). All observational measurementshave been converted to a Chabrier IMF, when necessary.
3 DOWNSIZING IN STELLAR MASS
In this section, we focus on the evolution of the galaxy stellar MF.Our model predictions are compared with a compilation of pub-lished observational estimates using different data-setsand meth-ods to compute stellar masses. In the past, the rest-frame near in-frared light has been widely used as a tracer of the galaxy stel-lar mass (Cole et al. 2001; Bell et al. 2003). In more recent times,most mass estimates (Drory et al. 2004, 2005; Bundy et al. 2006;Borch et al. 2006; Fontana et al. 2006; Perez-Gonzalez et al. 2008;Marchesini et al. 2008) have been based on multi-wavelengthSpec-tral Energy Distribution (SED) fitting algorithms. In this approach,broad-band photometry is compared to a library of syntheticSEDs,covering a relatively wide range of possible star formationhistories,metallicities, and dust attenuation values. A suitable algorithm isthen used to select the ‘best-fit’ solution, thus simultaneously deter-mining photometric redshift, galaxy stellar mass and SFR. Stellarmass estimates are therefore subject to several degeneracies (age,metallicity, and dust) and their accuracy depends sensitively onthe library of star formation histories employed, and on thewave-length range covered by observations (see e.g. Fontana et al. 2004;Pozzetti et al. 2007; Marchesini et al. 2008). In particular, most ofthese algorithms assume relatively simple analytic star formationhistories (with, in some cases, some bursty star formation episodessuperimposed), while SAMs typically predict much more complexstar formation histories, with a non-monotonic behavior and erraticbursts. This may result in certain biases in the physical parame-ters obtained from this method (Lee et al. 2008). Similarly,usingdifferent libraries of star formation histories has an effect on the fi-nal mass determination (Pozzetti et al. 2007; Stringer et al. 2009).
Additional sources of uncertainty may come from the physical in-gredients in the adopted stellar population models, e.g. tothe treat-ment of particular stages of stellar evolution, such as TP-AGB stars(Maraston et al. 2006; Tonini et al. 2008). Moreover, due to the rel-atively small volumes probed at high redshift, cosmic variance dueto large-scale clustering is a significant source of uncertainty, par-ticularly in the number density of high-mass objects.
When high signal-to-noise spectroscopy is available, galaxystellar masses can be estimated by comparison of the observedspectra with theoretical SEDs (e.g. Panter et al. 2007, for SDSSdata). In this case the finer details of the spectrum can be used togive tighter constraints on, e.g., stellar ages and metallicities. How-ever, the method is not free from uncertainties due to model degen-eracies, and contamination from AGN and/or strong emissionlines(usually not included in the theoretical SEDs) can in principle in-troduce systematic errors or simply limit the accuracy of the massestimate.
In Fig. 1, we show a compilation of different ob-servational measurements of the galaxy stellar MF from2MASS (Cole et al. 2001), 2MASS+SDSS (Bell et al. 2003),MUNICS (Drory et al. 2004), FDF+GOODS (Drory et al. 2005),COMBO17 (Borch et al. 2006), DEEP2 (Bundy et al. 2006),GOODS-MUSIC (Fontana et al. 2006), SDSS (Panter et al. 2007),VVDS (Pozzetti et al. 2007) Spitzer (Perez-Gonzalez et al. 2008),MUSYC+FIRES+GOODS-CDFS (Marchesini et al. 2008) (greenpoints; left and right panels show the same data). All estimates havebeen converted to a common (Chabrier) IMF when necessary; weuse a factor of 0.25 dex to convert from Salpeter to Chabrier.Thesestellar mass functions are fairly consistent among themselves, but

6 Fontanot et al.
the scatter becomes larger at higher redshift, in particular for thehigh-mass tail (which is significantly affected by cosmic variance).
A note on the errors and uncertainties associated with theseobservationally derived stellar mass functions is in order. Most pub-lished papers quote only Poisson errors on their mass function esti-mates. However, as noted above, both systematic and random errorscan arise from the unknown true star formation histories, metal-licities, and dust corrections, and also from photometric redshifterrors, differences in stellar population models, the unknown stel-lar IMF and its evolution, and cosmic variance. Marchesini et al.(2008) carry out an extensive investigation of the impact ofall ofthese sources of uncertainty on their derived stellar mass functions.In their Figures 13 and 14 they show a comparison of their results,including these comprehensive error estimates, with the three mod-els presented here. Their analysis shows that the evidence for dif-ferential evolution in the stellar mass function atz < 2, with moremassive galaxies evolving more slowly than less massive ones, be-comes weak when all sources of uncertainty in the stellar mass es-timates are considered. When this is done, the observed evolutionappears to be consistent with pure density evolution.
In order to make DS in stellar mass more evident, we dividegalaxies in bins of stellar mass and, by averaging over the MFes-timates of Fig 1, compute the stellar mass density of galaxies inthese stellar mass bins as a function of redshift. These stellar massdensities agree with estimates published by Conselice et al. (2007)and Cowie & Barger (2008) and are shown in Fig. 2 (left and rightpanels contain the same data). The quoted errors refer only to thescatter between the estimates from different samples (notethat thisscatter is larger than the quoted errors on individual determina-tions, confirming that these errors are underestimated, as discussedabove).
DS in stellar mass should consist of a differential growth ofstellar mass density, such that massive galaxies are assembled ear-lier and more rapidly than low mass galaxies. Examining Fig.2,it is hard to claim convincing evidence for such a behavior fromthese data: although the evidence for the growth of stellar massdensity is clear, its rate of growth is very similar for all mass bins.To further illustrate this point we perform a linear regression of theLogρ⋆ − z relation in each mass bin; the slopes we obtain are con-sistent within their statistical errors. We then rescale the densitiesto thez = 0 value of their regressions and fit the whole sample,obtaining the thick dotted line in the left panels of Fig. 2. The fit,valid in the109 < M⋆/M⊙ < 1012 range, has aχ2 probability of> 95%).
The predicted stellar MFs for theMORGANA, WDL08 and S08models (solid, dashed, and dot-dashed lines respectively)are shownin the left panels of Fig. 1 and 2, while in the right panels of the twofigures, the model stellar masses have been convolved with a statis-tical error onlog M⋆. As we have discussed above, this error distri-bution depends on many factors, such as the specific algorithm andstellar population models used to estimate stellar masses for eachsample, the magnitude and redshift of the galaxy, and characteris-tics of each observational survey, such as the volume covered andthe number and wavelength coverage of the photometric bandsthatare available. A detailed accounting of this complex error distribu-tion for each observational dataset is clearly beyond the scope ofthis paper. Rather than simply ignoring the impact of errorsin thestellar mass estimates on our data-model comparison, as hasusu-ally been done in the past, we adopt a simple approach that is meantto be illustrative rather than definitive. We assume that theerror hasa Gaussian distribution(independent of mass and redshift)with astandard deviation of0.25 dex. This assumed uncertainty roughly
corresponds to the mean value of the formal error in the stellar massdetermination from the GOODS-MUSIC catalogue (Fontana et al.2006, their Figure 2), is lower (by about 0.1 dex) than that estimatedby Bundy et al. (2006), and is roughly consistent with the findingsof Stringer et al. (2009).
The first thing to note is that the models give fairly consis-tent predictions. Secondly, as redshift increases, the intrinsic modelpredictions (i.e without convolution with errors) show a significantdeficit of massive galaxies (the two bins1011 < M⋆/M⊙ < 1011.5
andM⋆ > 1011.5 M⊙) with respect to the data. The error convo-lution does not affect the power-law part of the MF, but it hasasignificant impact upon its high mass tail, as already pointed outby Baugh (2006), Kitzbichler & White (2007), and more recentlyby Stringer et al. (2009). Because the models were tuned to matchthez = 0 stellar MF or LFwithouterrors, this convolution causesa small apparent overestimate of the number of the most massivegalaxies atz ∼ 0. This could be corrected by tuning the radio modeAGN feedback in the models. However, there are indications thatthe observed magnitudes and stellar masses of the brightestlocalgalaxies may be underestimated by significant amounts (see the dis-cussion in S08). Therefore we do not re-tune the models to correctthis apparent discrepancy. When these observational uncertaintiesare taken into account, model predictions for massive galaxies arein fairly good agreement with observations over the entire redshiftinterval probed by the surveys that we considered (withMORGANA
being∼ 2σ low at z > 2).In lower stellar mass bins (1010.5 < M⋆/M⊙ < 1011 and
in particular1010 < M⋆/M⊙ < 1010.5), all three models over-predict the observed stellar MF and stellar mass density at highredshift (z >
∼ 0.5), with the discrepancy increasing with increas-ing redshift. Thus, a robust prediction of the models seems to bethat the evolution of less massive galaxies is slower than that ofmore massive ones — i.e., the models do not predict stellar mass“downsizing” but rather the opposite behavior (sometimes called“upsizing”). This discrepancy has already been noted in previouspapers (Fontana et al. 2004; Fontanot et al. 2007), and extends toother models. Therefore, the models seem to be discrepant withobservations even if the real universe shows mass-independent den-sity evolution rather than downsizing. As a caveat, it is worth men-tioning that, although the different groups have performeddetailedcompleteness corrections, it is still possible that the high redshiftsamples may be incomplete at the lowest stellar masses. In Fig. 1and 2 we show data only for mass ranges where the correspondingauthors claim that no completeness correction is necessary.
In order to further investigate the evolution of the predictedgalaxy SMF, we consider separately the contribution from centraland satellite galaxies at different redshifts. Model predictions (con-volved with observational uncertainties as before) are shown in theleft panels of Fig. 3. As a reference, in each panel we show thetotal observedMFs at the considered redshift. The three modelspredict a similar evolution for the two subpopulations. It is evidentthat central galaxies are the main contributors to the overpredictionof low-mass galaxies atz < 2: the models predicts a roughly con-stantz < 2 number density of low-mass central galaxies, whilethe low-mass satellite population shows a gradual increasewhichis due to the infall of field galaxies into galaxy groups and clusters.This implies that small objects are over-produced while they arecentral galaxies, and the excess is not primarily due to inaccuraciesin the modeling of satellites.
In the right panels of Fig. 3 we show the evolution of thegalaxy SMF split in bins of parent halo mass at the consideredred-shift. Again, the three SAMs predict similar trends: it is evident that

Downsizing in Hierarchical Models 7
Figure 3. Left panel: solid and dashed lines refer to model galaxy SMFsfor central and satellite galaxies respectively. Right panel: model galaxy MFs inbins of parent DM halo mass. Different models are shown in different columns, as labeled. In both panels, observational measurements of the global SMFs atdifferent redshifts are shown as in fig. 1.
Figure 2. Stellar mass density in bins of galaxy stellar mass, as a function ofredshift. Blue asterisks are estimated from available observational estimatesof the galaxy stellar MF (see text for details). The thick redline in the leftpanels shows the expected evolution in a pure density evolution scenario.Solid, dashed, and dot-dashed lines refer to theMORGANA, WDL08, andS08 models respectively. In the right panels, the model predictions havebeen convolved with a Gaussian error onlog M⋆ with a standard deviationof 0.25 dex.
the main contributors at all redshifts to the low-mass end excess arelow-mass (1011 < Mh/M⊙ < 1012) dark matter halos. These re-sults suggest that, in order to cure the discrepancies seen in thesethree models and others, we should seek a physical process that cansuppress star formation in central galaxies hosted by intermediateto low-mass haloes (Mh/M⊙ < 1012).
4 DOWNSIZING IN STAR FORMATION RATE
The downsizing in galaxy SFR seen in lookback studies mostclosely corresponds to the original definition of DS. There are,however, several different forms in which the diagnostics of DSin SFR may been cast observationally. In addition, one can iden-tify two different trends that might be called “downsizing”: first,the normalization of the “star forming sequence” of galaxies shiftsdownwards with decreasing redshift; second, galaxies moveoff thestar forming sequence and become ‘quenched’ or passive as timeprogresses. These different behaviors may offer clues to the phys-ical mechanisms responsible, e.g., the downward shift of the SFsequence might be due to simple gas exhaustion by star formation,while “quenching” is presumably due to a more dramatic processsuch as AGN feedback. If downsizing is occuring, this evolutionshould happen in a differential way, with more massive objects be-ing quenched earlier and/or more rapidly. In order to probe thesedifferent possible “paths” for downsizing, we will consider severaldifferent ways of slicing and plotting the distribution function ofSFR as a function of stellar mass and redshift: 1) the 2-d distribu-tion of stellar mass and SFR in several redshift bins (2) the averageSFR as a function of stellar mass, plotted in redshift bins (3) theSFR density contributed by objects of different stellar masses, as afunction of redshift (4) the evolution of the stellar mass function ofactive vs. passive galaxies.

8 Fontanot et al.
Figure 4. The 2-dimensional distribution of specific star formation rates versus stellar mass for the three different SAMs at different redshifts, and for a compi-lation of observations. Model galaxies with SSFR< 10−13 yr−1 have been assigned SSFR= 10−13 yr−1. Observational data are from Schiminovich et al.(2007), Noeske et al. (2007) and Santini et al. (2009). Blue,red and green lines indicate the observedz = 0 “star-forming” sequence, the “quenched” sequenceand the “green valley”, respectively.
Star formation rates are estimated using different observa-tional tracers, such as H-α emission lines, UV, mid- and far-IRemission, and radio. SFR may also be estimated by fitting SF his-tories to multi-wavelength broadband SED’s, in a similar mannerused to estimated stellar masses. SFR estimates are impacted bymany of the same sources of uncertainty as stellar mass estimates(such as propagated errors from photometric redshift uncertaintiesand sensitivity to the assumed stellar population models, stellarinitial mass function, and star formation histories), and also eachtracer carries its own set of potential problems. For example, SFRestimates based on emission lines such as H-α are metallicity de-
pendent and (typically fairly large) corrections for dust extinctionmust be applied. A potential advantage to this approach is thatdust corrections can be fairly reliably estimated from the Balmerdecrement; however, these measurements are currently impracticalat high redshift as they would require highly multiplexed, deep NIRspectroscopy. SFR estimates based on the UV continuum alonesuf-fer mainly from the very large and uncertain dust corrections (ex-tinction estimates based on the UV spectral slope, while widelyused, are quite uncertain). Estimates based on the mid-IR (e.g. 24µ)suffer from highly uncertain k-corrections (as strong PAH featuresmove through the observed bandpass), potential strong contamina-

Downsizing in Hierarchical Models 9
Figure 5. Average SFR of galaxies in bins of stellar mass and redshift.Data are from Drory & Alvarez (2008, red open squares), Bell et al. (2007, blackfilled squares), Noeske et al. (2007, magenta open triangles), Chen et al. (2009, red crosses), Martin et al. (2007, blue asterisks), Elbaz et al. (2007, cyan stars),Daddi et al. (2007, blue crosses), Dunne et al. (2008, filled and open blue diamonds), and Santini et al. (2009, green filledcircles, open circles indicate upperlimits). Errorbars are shown where provided by the authors.The shaded area represents the confidence region for the lowest redshift bin. Solid, dashed anddot-dashed lines refer to theMORGANA, WDL08 and S08 models respectively. Model predictions havebeen convolved with the errors on stellar mass andSFR. Top row: all model galaxies are included in the average;second through fourth rows: Only active (SSFR> 10−11 yr−1) model galaxies have beenincluded in the average. The results for active and all galaxies are nearly indistinguishable for the high redshift (z > 1) bins, which is why we do not showboth cases.
tion by AGN, uncertainties in the IR SED templates (due to ourlackof knowledge about the composition and state of the emittingdust),and possibly contamination by heating from old stellar populations.Measurements of the longer wavelength thermal IR, near the peakof the dust emission (∼ 100µ) offer perhaps the most promisingapproach to obtaining robust estimates of total SFR. These are,however, currently available only for a small number of veryIR-luminous galaxies. Moreover, all these indicators are usually cali-
brated on local galaxy samples, and the systematics connected withapplying them to higher redshift are poorly known.
The observed SFRs used in this Section have been ob-tained from UV + Spitzer 24µm (Bell et al. 2007; Zheng et al.2007), Spitzer 24µm (Conselice et al. 2007), GALEX FUV(Schiminovich et al. 2007), emission lines + Spitzer 24µm(Noeske et al. 2007), SED-fitting continuum at 2800A(Drory & Alvarez 2008; Mobasher et al. 2009), GALEX FUV

10 Fontanot et al.
+ Spitzer 24µm (Martin et al. 2007), Balmer absorption lines(Chen et al. 2009), SED-fitting + Spitzer 24µm (Santini et al.2009), and radio (Dunne et al. 2008).
The comparison of models and data is also made difficult bythe complex selection criteria involved. Most SFR estimates usedhere have poor sensitivity to sources with low SFRs, leadingtomany upper limits; for instance, SFR estimates for passive objectsare poorly constrained by SED fitting techniques. Several authorshave attempted to correct for incompleteness by stacking imagesof objects with similar masses to obtain deeper detections,or byusing only galaxies with active star formation to compute the av-erage. A proper comparison should take into account the selectioneffects of each dataset; however, systematics are large andpoorlyunderstood, so a detailed comparison at this stage is of doubtfulutility. With all these caveats in mind, we compare our models tothe dataat face value, trying again to assess whether DS is seen inthe data and to what extent models are consistent with available ob-servations. Moreover, analogously with stellar masses, weconvolvemodel SFRs with a log-normal error distribution; for its amplitudewe use a value of 0.3 dex, roughly equal to the median formal errorof SFRs in GOODS-MUSIC. In the light of what said above, thisestimate is clearly naive, but it allows us to determine the gross ef-fect of (random) uncertainties in SFR determinations. We find thatour results are fairly insensitive to the inclusion of this error.
In Fig. 4 we show the 2-d distribution of specific SFR (SSFR)as a function of stellar mass, for several redshifts fromz = 2 to0, for all three models and for a compilation of observational data(Schiminovich et al. 2007; Noeske et al. 2007; Santini et al.2009).All model galaxies with SSFR< 10−13 yr−1 have been assignedSSFR= 10−13 yr−1 (this causes the thin quenched sequence atthe bottom of each panel). In each panel, we plot the locationsof the “star forming” and “quenched” sequences atz ∼ 0 fromlocal observations based on SDSS+GALEX (Salim et al. 2007;Schiminovich et al. 2007), and of the so-called “green valley” thatdivides the two sequences. We see that all three models show quali-tatively similar behavior. Perhaps the clearest discrepancy betweenthe models and data is that the SSFR of low-mass galaxies in allthree models are the same as or, in the case ofMORGANA, evenlower than those of massive galaxies, while in the observations aclear trend is seen such that lower mass galaxies have higherSSFR.In the models, the slope of the SF sequence does not appear tochange significantly over time betweenz ∼ 2 andz ∼ 0, whilethe normalization of this sequence decreases over time. Also in allthree models, there are few if any massive passive galaxies in placeat z ∼ 2; it remains to be seen whether this is in conflict withobservations.
In Figure 5 we show the evolution of the average SFR ofgalaxies as a function of stellar mass, for eight redshift binsfrom z ∼ 0.3 to ∼ 3.5; data are taken from Bell et al. (2007),Noeske et al. (2007), Martin et al. (2007), Drory & Alvarez (2008),Chen et al. (2009), Santini et al. (2009) and Dunne et al. (2008).For the GOODS-MUSIC data (Santini et al. 2009) we show withopen (filled) circles the bins where, according to the authors, theincompleteness is (is not) significant; open symbols are then upperlimits to the average SFR. In order to illustrate the redshift evo-lution of this quantity, in all panels the shaded cyan/yellow arearepresents the confidence region of thez ∼ 0 observations. Inthe top row, we show redshifts 0.3–0.7, and show model resultsin which we average over all galaxies. In the second row, we re-peat the redshift bins 0.3, 0.5, and 0.7 but this time includein themodel averages only star-forming galaxies (defined here as havingSSFR> 10−11 yr−1). The remaining panels show model averages
for active galaxies only, for higher redshifts1 < z < 3.5. We onlyshow the low redshift bins for both active and all galaxies becauseit is only at these redshifts that there are any significant differencein the results. We can see, however, that at low redshift, theinclu-sion of passive galaxies causes a turn-over in the average SFR athigh masses in the WDL08 and S08 models.
We first note again the good agreement between the resultsof the three different SAMs seen in figure 5, a result that wedid not necessarily expect given the different implementations ofstar formation and feedback. Regarding the comparison withob-servations, we find that the average SFR oflow-massgalaxies(M⋆
<∼ 1011M⊙) is underestimated by the models at all redshifts,
as we already noted from Figure 4. The average star formationrates for massive galaxies generally lie near the middle of therange of different observational estimates at low redshift, and nearthe lower envelope of observational estimates at higher redshift(z >
∼ 2). Several previous studies (Elbaz et al. 2007; Daddi et al.2007; Santini et al. 2009) compared the predictions of a slightlydifferent version of the WDL08 models with a single observationalestimate of the SFR as a function of stellar mass. Elbaz et al.(2007)found that the model predictions were lower than their observa-tional estimates atz ∼ 1 by about a factor of two, while Daddi et al.(2007) and Santini et al. (2009) found that the models were low bya factor of∼ 5 at z ∼ 2. Our results are entirely consistent withtheir findings, but we also see that (as already noted above) the dis-persion in different observational estimates of the average SFR atfixed stellar mass is as large, or larger, than the discrepancy betweenthe model predictions and the observational estimates of these pre-vious studies.
MORGANA produces too few massive, passive galaxies at latetimes, resulting in an overestimate of the SFR of massive objects atlow redshift. This was studied in more detail in Kimm et al. (2008),and is due to a less efficient, or delayed, quenching of the coolingflows in massive haloes via radio mode feedback.
Similar conclusions can be reached by considering the SFRdensity, as a function of redshift, contributed by galaxiesof differ-ent stellar mass (Fig. 6). We used the K-band selected GOODS-MUSIC catalogue, complete toK < 23.5 (Grazian et al. 2006),to compute the SFR density as a function of stellar mass. Follow-ing the discussion in Fontana et al. (2006), we translated the mag-nitude limit into a stellar mass limit, and computed SFRs eitherwith SED fitting using photometry from the NUV to the mid-IR, orwith Spitzer 24µm fluxes when available. We also plot several otherdata sets from the literature: local points from SDSS+GALEXfromSchiminovich et al. (2007); the results of Conselice et al. (2007),based on the Palomar/DEEP2 Survey; estimates from stacked 24µm flux from the COMBO-17 survey (Zheng et al. 2007); and es-timates from UV luminosity alone (Mobasher et al. 2009).
The three models again give fairly consistent results, althoughthe predictions diverge in the higher mass bins. All three modelsshow a gentle decline in the SFR density for low mass galaxies,and if anything a somewhat flatter behavior for the SFR densityin massive galaxies. This time the model predictions agree wellwith the observations for small mass galaxies, because the highernumber of small galaxies compensates for the lower SSFR of theobjects.
Another way to characterize DS in star formation is by di-viding galaxies into active (blue) and passive (red) populations,then computing the two stellar MFs or, alternatively, theK-bandluminosity functions. As pointed out by Borch et al. (2006),usingthe COMBO17 sample, and Bundy et al. (2006), using DEEP2, thetwo mass functions cross at a characteristic mass which grows with

Downsizing in Hierarchical Models 11
Figure 6. SFR density contributed by galaxies of different stellar mass(stellar mass is measured at the redshift of the plotted points). Data arefrom Zheng et al. (2007, blue filled diamonds); Mobasher et al. (2009, cyanstars); Schiminovich et al. (2007, magenta open circles); Conselice et al.(2007, red open squares) and from GOODS-MUSIC (green open andfilled circles). Solid, dashed and dot-dashed lines refer tothe MORGANA,WDL08, and S08 models respectively. Model predictions havebeen con-volved with errors in stellar mass and SFR as explained in thetext. Notethat the lower panels do not represent a mass sequence, in order to comparemodel predictions with observational determinations.
redshift. Instead of using the color criterion we divide oursam-ple into passive and active galaxies using a threshold valuefor theSSFR of10−11 yr−1 (Brinchmann et al. 2004). Figure 7 shows theevolution of the stellar MFs of active and passive galaxies as pre-dicted by the three models. The MF of active galaxies show almostno evolution sincez ∼ 2, whereas most of the evolution of theMF is due to the build-up of the passive population; this is quali-tatively consistent with the observational results. However, obser-vations (Bundy et al. 2006; Borch et al. 2006) show that the stellarMF of red (passive) galaxies peaks at∼ 1011M⊙ and decreasesat lower masses. In other words, in observed samples, low massgalaxies are predominantly blue (active), while in our models thelow-mass slope of the SMF is nearly the same for active and pas-sive galaxies. This result still holds when galaxies are divided usingcolours rather than SSFR, and this marks another discrepancy be-tween models and data for small galaxies.
In Fig. 8, we show the stellar mass-weighted integrals of thesefunctions, i.e., the stellar mass density contained in the active andpassive populations, as a function of stellar mass and redshift. Inall models, the stellar mass density (SMD) is dominated by activelystar forming galaxies at high redshift, with the SMD contributed bypassive objects growing rapidly atz <
∼ 1. These results are in quali-tative agreement with observational results atz <
∼ 1 (e.g. Bell et al.2007). Observational results at higher redshift will soon be avail-able from ongoing and future surveys.
Up until this point in this Section, we have discussed themodel-data comparison without assessing whether either the pre-
Figure 7. Stellar MFs of active (SSFR> 10−11 yr−1, upper panels) andpassive (SSFR< 10−11 yr−1, lower panels) galaxies. Solid, dashed, dot-dashed and long-short dashed lines refer toz = 0, 0.4 < z < 0.6, 1.0 <
z < 1.3 and1.6 < z < 2.0, respectively. Different columns show thethree different models, as labeled.
Figure 8. Stellar mass density of active (SSFR> 10−11 yr−1, blue solidlines) and passive (SSFR< 10−11 yr−1, red dashed lines) galaxies in binsof galaxy stellar mass, as a function of redshift. Model predictions havebeen convolved with a Gaussian error onlog M⋆ with a standard deviationof 0.25 dex.

12 Fontanot et al.
Figure 9. Archaeological DS. Observational constraints on the mean mass-weighted stellar age atz = 0 as a function of stellar mass. Solid, dashed anddot-dashed lines refer to theMORGANA, WDL08, S08 models respectively.Data from Gallazzi et al. (2005).
dicted or observed behavior constitutes “downsizing”. TheDS-likedifferential evolution would be seen as an earlier accumulation ofmassive passive galaxies in figure 4, and as a flattening of theslopeof the stellar mass–SFR relation in figure 5 with increasing time. Inboth figures 4 and 5 we see a clear downward shift over time of thestar-forming sequence both in the observations and in the models.Given, however, the significant discrepancies seen betweendiffer-ent datasets and different SF indicators, and the possible incom-pleteness of the observations of low-mass passive galaxiesat highredshift, we feel that it is difficult to claim that there is currentlyrobust evidence for this differential evolution (DS) in thedata ineither Figure. Once again, however, the models if anything show areversedownsizing trend, with passive low-mass galaxies appear-ing earlier than massive, passive galaxies. In Figure 6, thesignatureof DS would be a more rapid drop, with decreasing redshift, oftheSFR density for more massive galaxies. Although some previousstudies have claimed to see such an effect (e.g. Juneau et al.2005),the observational compilation that we have shown here does notshow clear evidence for this differential decline. The one bin inwhich a markedly sharp decline is seen (the highest mass bin,seediscussion in Santini et al. 2009) may be affected by cosmic vari-ance. Once again, the data appear to be consistent with a constantrate of decline in SFR density for galaxies of all masses.
5 ARCHAEOLOGICAL DOWNSIZING
In this section, we focus on the relation between thez = 0 galaxystellar mass and the average age of the stellar population (the ar-chaeological DS discussed in Section 1). In Figure 9 we com-pare the stellar mass-weighted age of the stellar populations ingalaxies as a function of their stellar mass (atz = 0) as pre-dicted by the three models with the observational estimatesfrom
Gallazzi et al. (2005). They use high-resolution SDSS spectra toobtain estimates for the ages and metallicities of∼ 170, 000 galax-ies withM⋆ > 109M⊙. They measure these by comparing a set ofabsorption features in the spectra (in particular the Lick indices andthe 4000A break) to a grid of synthetic SEDs covering a wide rangeof plausible star formation histories and metallicities. Both the cho-sen star formation histories and stellar population synthesis codesadopted are a likely source of systematic uncertainty in these esti-mates. Moreover, corrections must be made for in-filling by emis-sion lines in the age-sensitive spectral features (see Gallazzi et al.2005 for a complete discussion on how this correction was applied.
Our results show that the model massive galaxies are old, inagreement with the observations. However, two out of three mod-els predict only a mild trend in age from high mass to low massgalaxies, in conflict with the steeper trend seen in the observationalestimates (as already pointed out by S08).MORGANA behaves likemodels without AGN feedback, which produce an inverted trend(in which massive galaxies are younger than low-mass galaxies);Croton et al. (2006) and De Lucia et al. (2006) showed that includ-ing the “radio mode” AGN feedback makes the massive galax-ies older, improving the agreement with the observed trend.Onceagain, it is low-mass galaxies that are discrepant, in the sense thatthey form too early and thus have ages that are too old.
The inverted trend predicted byMORGANA is mainly due totwo different physical processes. The younger ages of massivegalaxies are related to the inefficient quenching of coolingflowsin massive halos atz < 1 (see the discussion in Kimm et al. 2008).The resulting higher level of star formation implies younger ageswith respect to WDL08 and S08. The older ages of intermediate-to-low mass sources are likely due to the enhanced cooling athigh-redshift discussed in Viola et al. (2008), and to the associated en-hanced star-formation at early times.
We note that the observational estimates are closer to be-ing luminosity-weighted more than stellar mass-weighted —De Lucia et al. (2006) showed that light-weighted ages show astronger trend with stellar mass — and also that the ages based onabsorption line indices (mainly Balmer lines) tend to actually re-flect the age of the most recent star formation episode, rather thanthe luminosity-weighted age (Trager et al. 2000b, 2008). However,Trager & Somerville (2008) find that when these observational bi-ases are modeled by extracting line strengths for the SAM galaxiesin the same way as is done for the observations, this effect cannotfully account for the discrepancy between the model ages andtheobserved ages for low-mass galaxies.
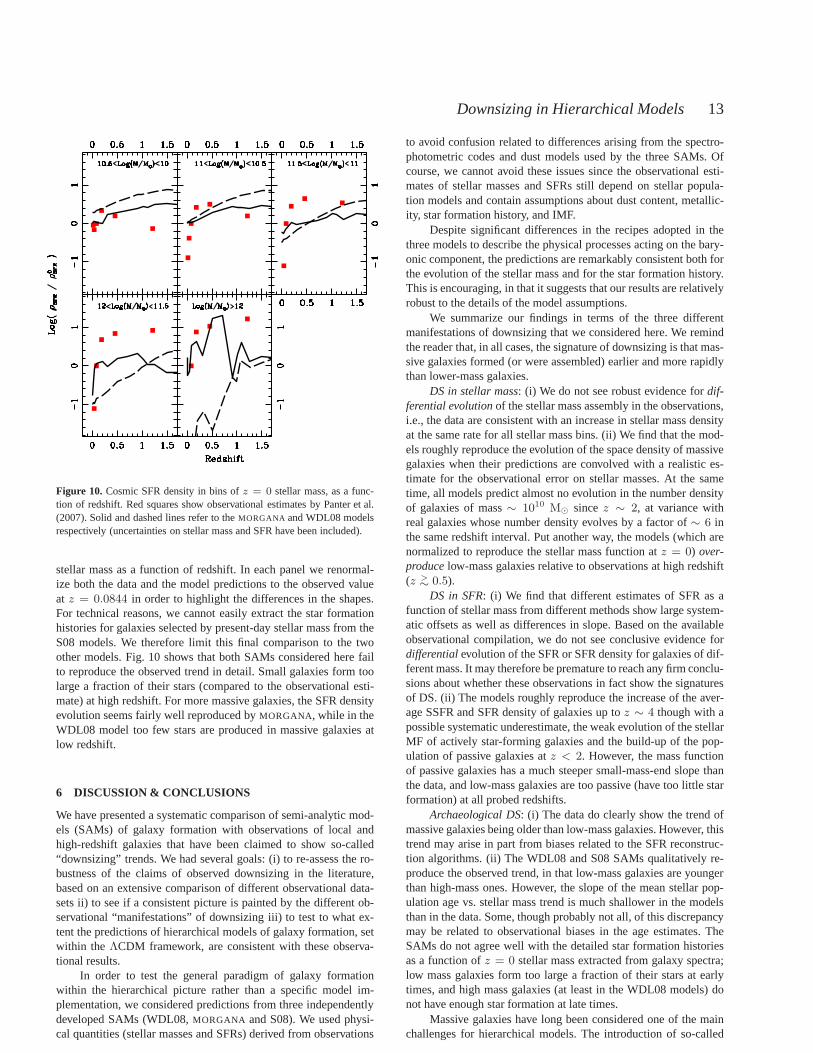
One can even go a step further and attempt to extract star for-mation histories from galaxy spectra (e.g. Panter et al. 2007) andto construct an average SF history for galaxies binned in terms oftheir stellar mass atz = 0. We compare our models with the re-sults of Panter et al. (2007), who applied the MOPED algorithmto high resolution (3 A) spectra from the SDSS. This algorithmis similar in spirit to the SED-fitting we described in sec. 3,butit treats the SFR as a free parameter (defined on an 11-bin grid),thus allowing for the reconstruction of the star formation history ofgalaxies. We stress that these measurements come with numerousuncertainties. Panter et al. (2007) showed that their reconstructedSF histories depend strongly on the input assumptions. In partic-ular, they demonstrated that the largest systematics are related tothe chosen spectrophotometric code, stellar population model, theassumed IMF, the dust attenuation prescription, and the calibrationof the observed spectra.
These observationally derived SF histories are shown inFig. 10, where we plot the cosmic SFR density in bins ofz = 0
Downsizing in Hierarchical Models 13
Figure 10. Cosmic SFR density in bins ofz = 0 stellar mass, as a func-tion of redshift. Red squares show observational estimatesby Panter et al.(2007). Solid and dashed lines refer to theMORGANA and WDL08 modelsrespectively (uncertainties on stellar mass and SFR have been included).
stellar mass as a function of redshift. In each panel we renormal-ize both the data and the model predictions to the observed valueat z = 0.0844 in order to highlight the differences in the shapes.For technical reasons, we cannot easily extract the star formationhistories for galaxies selected by present-day stellar mass from theS08 models. We therefore limit this final comparison to the twoother models. Fig. 10 shows that both SAMs considered here failto reproduce the observed trend in detail. Small galaxies form toolarge a fraction of their stars (compared to the observational esti-mate) at high redshift. For more massive galaxies, the SFR densityevolution seems fairly well reproduced byMORGANA, while in theWDL08 model too few stars are produced in massive galaxies atlow redshift.
6 DISCUSSION & CONCLUSIONS
We have presented a systematic comparison of semi-analyticmod-els (SAMs) of galaxy formation with observations of local andhigh-redshift galaxies that have been claimed to show so-called“downsizing” trends. We had several goals: (i) to re-assessthe ro-bustness of the claims of observed downsizing in the literature,based on an extensive comparison of different observational data-sets ii) to see if a consistent picture is painted by the different ob-servational “manifestations” of downsizing iii) to test towhat ex-tent the predictions of hierarchical models of galaxy formation, setwithin the ΛCDM framework, are consistent with these observa-tional results.
In order to test the general paradigm of galaxy formationwithin the hierarchical picture rather than a specific modelim-plementation, we considered predictions from three independentlydeveloped SAMs (WDL08,MORGANA and S08). We used physi-cal quantities (stellar masses and SFRs) derived from observations
to avoid confusion related to differences arising from the spectro-photometric codes and dust models used by the three SAMs. Ofcourse, we cannot avoid these issues since the observational esti-mates of stellar masses and SFRs still depend on stellar popula-tion models and contain assumptions about dust content, metallic-ity, star formation history, and IMF.
Despite significant differences in the recipes adopted in thethree models to describe the physical processes acting on the bary-onic component, the predictions are remarkably consistentboth forthe evolution of the stellar mass and for the star formation history.This is encouraging, in that it suggests that our results arerelativelyrobust to the details of the model assumptions.
We summarize our findings in terms of the three differentmanifestations of downsizing that we considered here. We remindthe reader that, in all cases, the signature of downsizing isthat mas-sive galaxies formed (or were assembled) earlier and more rapidlythan lower-mass galaxies.
DS in stellar mass: (i) We do not see robust evidence fordif-ferential evolutionof the stellar mass assembly in the observations,i.e., the data are consistent with an increase in stellar mass densityat the same rate for all stellar mass bins. (ii) We find that themod-els roughly reproduce the evolution of the space density of massivegalaxies when their predictions are convolved with a realistic es-timate for the observational error on stellar masses. At thesametime, all models predict almost no evolution in the number densityof galaxies of mass∼ 1010 M⊙ sincez ∼ 2, at variance withreal galaxies whose number density evolves by a factor of∼ 6 inthe same redshift interval. Put another way, the models (which arenormalized to reproduce the stellar mass function atz = 0) over-producelow-mass galaxies relative to observations at high redshift(z >
∼ 0.5).DS in SFR: (i) We find that different estimates of SFR as a
function of stellar mass from different methods show large system-atic offsets as well as differences in slope. Based on the availableobservational compilation, we do not see conclusive evidence fordifferentialevolution of the SFR or SFR density for galaxies of dif-ferent mass. It may therefore be premature to reach any firm conclu-sions about whether these observations in fact show the signaturesof DS. (ii) The models roughly reproduce the increase of the aver-age SSFR and SFR density of galaxies up toz ∼ 4 though with apossible systematic underestimate, the weak evolution of the stellarMF of actively star-forming galaxies and the build-up of thepop-ulation of passive galaxies atz < 2. However, the mass functionof passive galaxies has a much steeper small-mass-end slopethanthe data, and low-mass galaxies are too passive (have too little starformation) at all probed redshifts.
Archaeological DS: (i) The data do clearly show the trend ofmassive galaxies being older than low-mass galaxies. However, thistrend may arise in part from biases related to the SFR reconstruc-tion algorithms. (ii) The WDL08 and S08 SAMs qualitatively re-produce the observed trend, in that low-mass galaxies are youngerthan high-mass ones. However, the slope of the mean stellar pop-ulation age vs. stellar mass trend is much shallower in the modelsthan in the data. Some, though probably not all, of this discrepancymay be related to observational biases in the age estimates.TheSAMs do not agree well with the detailed star formation historiesas a function ofz = 0 stellar mass extracted from galaxy spectra;low mass galaxies form too large a fraction of their stars at earlytimes, and high mass galaxies (at least in the WDL08 models) donot have enough star formation at late times.
Massive galaxies have long been considered one of the mainchallenges for hierarchical models. The introduction of so-called

14 Fontanot et al.
“radio mode” AGN feedback helps keep massive galaxies fromforming stars down toz = 0, so that red and old massive galax-ies are now produced by the latest generation of SAMs. We findthat when the stellar mass errors are accounted for (Borch etal.2006; Baugh 2006; Kitzbichler & White 2007), discrepanciesinthe number densities of massive galaxies weaken or disappear. Anumber of problems still affect model predictions for the most mas-sive galaxies: according to the results shown above, their evolutionsincez ∼ 1, which is driven by mergers, is marginally inconsistentwith the data (Figure 2). Models may also underestimate the num-ber of massive galaxies atz > 2 (see also Marchesini et al. 2008).Depending in part on which observational estimates turn outto becorrect, at least in some of the models the SFR in massive galaxiesat high redshift may be too low. These residual discrepancies maybe solved by better modeling the known processes: the implemen-tation of AGN feedback is still extremely crude. The merger-drivenevolution atz < 1 may be slowed down by scattering of starsinto the diffuse stellar component of galaxy groups and clusters(Monaco et al. 2006; Conroy et al. 2007; Somerville et al. 2008).Moreover, better modeling of chemical evolution is needed to ad-dress what may be the most severe challenge for massive galaxies,the chemo-archaeological DS.
At the same time, we find serious discrepancies in the modelpredictions for less massive galaxies in the range109 − 1011 M⊙
in stellar mass: they form too early and have too little ongoingstar formation at later times, so their stellar populationsare tooold at z = 0. Their number density is nearly constant sincez ∼ 2, while observations show that it grows in time. Their SSFRis too low compared with observational data. The low-mass endslope of the SMF of passive galaxies is too steep, again indicatingan excess of low-mass passive galaxies. Part of this discrepancycould be due to the over-quenching problem for satellite galax-ies (Weinmann et al. 2006; van den Bosch et al. 2008; Kimm et al.2008; Gilbank & Balogh 2008), which is caused by the assumptionin all three SAMs that the hot halo is instantly stripped fromsatel-lites as they enter a larger host halo, thus shutting off any furthercooling onto satellite galaxies. However, as we showed in Figure 3,the problematic galaxies are predominantly central galaxies in DMhaloes with relatively high circular velocities,∼ 100 − 200 km/s.Therefore, mechanisms that only impact satellite galaxies(such asram pressure stripping), or that only work on very low mass haloes(like photo-ionization or, probably, pre-heating) are notviable so-lutions to this problem.
The paradox is that we must suppress the formation of low-mass galaxies in order to fit the low-mass end of the stellar massfunction or the faint end of the luminosity function within the CDMparadigm. In the three models presented here, as in probablyallΛCDM models in the literature, this is currently accomplished byimplementing very strong supernova feedback in low-mass galax-ies. Not only is it unclear that this strong SN feedback is physi-cally motivated or in agreement with direct observations ofwindsin low-mass galaxies, but apparently it does not produce thecorrectformation histories for low-mass galaxies.
Another hint may come from chemical DS: Maiolino et al.(2008) (see also Lo Faro 2009) showed that the models predictthat small galaxies at high redshift are much more metal-rich thanobserved galaxies at these mass scales. This could either indicatethat the metals are efficiently removed from these galaxies,e.g. bywinds, or that star formation (and therefore metal production) isinefficient.
Thinking of a plausible mechanism that can suppress the for-mation of galaxies in small but compact DM haloes at highz is
not so easy: their density is too high and their potential wells aretoo deep to suppress star formation with heating from an externalUV background, while massive galactic winds should not destroygalaxies of the same circular velocity at lower redshift. Therefore,the discrepancies discussed above call for a deep re-thinking of thefeedback schemes currently implemented in SAMs. Alternatively,the problem may be related to the nature of DM; if this is not com-pletely collisionless, the density profiles of small DM haloes maybe significantly different from the generally assumed Navarro et al.(1996) form, and this would influence cooling rates and infall times,galaxy sizes and SFRs.
All model predictions discussed in this paper and the datashown in Fig. 2 are available in electronic format upon request.
ACKNOWLEDGMENTS
We are grateful to Eric Bell and Anna Gallazzi for discussionandcareful explanation of their data, to Frank van den Bosch, MaurilioPannella and Nicola Menci for enlighting discussions, to AdrianoFontana, Andrea Grazian, Sara Salimbeni for help in understandingand extracting information from the GOODS-MUSIC catalogue, toDanilo Marchesini for sharing his data before publication,and toKai Noeske for providing his data in electronic form and for veryuseful discussions about star formation indicators. FF andGDL ac-knowledge hospitality at the Kavli Institute for Theoretical Physicsin Santa Barbara. This research was supported in part by the Na-tional Science Foundation under Grant No. NSF PHY05-51164.We thank the anonymous referee for suggestions that helped to im-prove this paper.
REFERENCES
Ando M., Ohta K., Iwata I., Akiyama M., Aoki K., Tamura N.,2007, PASJ, 59, 717
Bauer A. E., Drory N., Hill G. J., Feulner G., 2005, ApJ, 621, L89Baugh C. M., 2006, Reports of Progress in Physics, 69, 3101Baugh C. M., Cole S., Frenk C. S., 1996, MNRAS, 283, 1361Bell E. F., McIntosh D. H., Katz N., Weinberg M. D., 2003, ApJS,149, 289
Bell E. F., Zheng X. Z., Papovich C., Borch A., Wolf C., Meisen-heimer K., 2007, ApJ, 663, 834
Borch A., Meisenheimer K., Bell E. F., Rix H.-W., Wolf C., DyeS., Kleinheinrich M., Kovacs Z., Wisotzki L., 2006, A&A, 453,869
Boselli A., Gavazzi G., Donas J., Scodeggio M., 2001, AJ, 121,753
Bower R. G., Benson A. J., Malbon R., Helly J. C., Frenk C. S.,Baugh C. M., Cole S., Lacey C. G., 2006, MNRAS, 370, 645
Boylan-Kolchin M., Ma C.-P., Quataert E., 2008, MNRAS, 383,93
Brinchmann J., Charlot S., White S. D. M., Tremonti C., Kauff-mann G., Heckman T., Brinkmann J., 2004, MNRAS, 351, 1151
Bundy K., Ellis R. S., Conselice C. J., Taylor J. E., Cooper M.C.,Willmer C. N. A., Weiner B. J., Coil A. L., Noeske K. G., Eisen-hardt P. R. M., 2006, ApJ, 651, 120
Carollo C. M., Danziger I. J., Buson L., 1993, MNRAS, 265, 553Chabrier G., 2003, ApJ, 586, L133Chen Y.-M., Wild V., Kauffmann G., Blaizot J., Davis M., NoeskeK., Wang J.-M., Willmer C., 2009, MNRAS, 393, 406
Cimatti A., Daddi E., Renzini A., 2006, A&A, 453, L29

Downsizing in Hierarchical Models 15
Cirasuolo M., McLure R. J., Dunlop J. S., Almaini O., FoucaudS., Simpson C., 2008, ArXiv e-prints, 804
Cole S., Norberg P., Baugh C. M., Frenk C. S., Bland-HawthornJ., Bridges T., Cannon R., Colless M. e. a., 2001, MNRAS, 326,255
Conroy C., Wechsler R. H., Kravtsov A. V., 2007, ApJ, 668, 826Conselice C. J., Bundy K., Trujillo I., Coil A., Eisenhardt P., EllisR. S., Georgakakis A., Huang J., Lotz J., Nandra K., Newman J.,Papovich C., Weiner B., Willmer C., 2007, MNRAS, 381, 962
Cowie L. L., Barger A. J., 2008, ApJ, 686, 72Cowie L. L., Songaila A., Hu E. M., Cohen J. G., 1996, AJ, 112,839
Cristiani S., Alexander D. M., Bauer F., Brandt W. N.,Chatzichristou E. T., Fontanot F., Grazian A., Koekemoer A.,Lucas R. A., Monaco P., Nonino M., Padovani P., Stern D., TozziP., Treister E., Urry C. M., Vanzella E., 2004, ApJ, 600, L119
Croton D. J., Springel V., White S. D. M., De Lucia G., FrenkC. S., Gao L., Jenkins A., Kauffmann G., Navarro J. F., YoshidaN., 2006, MNRAS, 365, 11
Daddi E., Dickinson M., Morrison G., Chary R., Cimatti A., ElbazD., Frayer D., Renzini A., Pope A., Alexander D. M., Bauer F. E.,Giavalisco M., Huynh M., Kurk J., Mignoli M., 2007, ApJ, 670,156
Davies R. L., Sadler E. M., Peletier R. F., 1993, MNRAS, 262,650
De Lucia G., Blaizot J., 2007, MNRAS, 375, 2De Lucia G., Helmi A., 2008, MNRAS, 391, 14De Lucia G., Kauffmann G., Springel V., White S. D. M., LanzoniB., Stoehr F., Tormen G., Yoshida N., 2004, MNRAS, 348, 333
De Lucia G., Poggianti B. M., Aragon-Salamanca A., Clowe D.,Halliday C., Jablonka P., Milvang-Jensen B., Pello R., Poirier S.,Rudnick G., Saglia R., Simard L., White S. D. M., 2004, ApJ,610, L77
De Lucia G., Poggianti B. M., Aragon-Salamanca A., WhiteS. D. M., Zaritsky D., Clowe D., Halliday C., Jablonka P., vonder Linden A., Milvang-Jensen B., Pello R., Rudnick G., SagliaR. P., Simard L., 2007, MNRAS, 374, 809
De Lucia G., Springel V., White S. D. M., Croton D., KauffmannG., 2006, MNRAS, 366, 499
Drory N., Alvarez M., 2008, ApJ, 680, 41Drory N., Bender R., Feulner G., Hopp U., Maraston C., SnigulaJ., Hill G. J., 2004, ApJ, 608, 742
Drory N., Salvato M., Gabasch A., Bender R., Hopp U., FeulnerG., Pannella M., 2005, ApJ, 619, L131
Dunne L., Ivison R. J., Maddox S., Cirasuolo M., Mortier A. M.,Foucaud S., Ibar E., Almaini O., Simpson C., McLure R., 2008,ArXiv e-prints, 808
Elbaz D., Daddi E., Le Borgne D., Dickinson M., AlexanderD. M., Chary R.-R., Starck J.-L., Brandt W. N., Kitzbichler M.,MacDonald E., Nonino M., Popesso P., Stern D., Vanzella E.,2007, A&A, 468, 33
Erb D. K., Shapley A. E., Pettini M., Steidel C. C., Reddy N. A.,Adelberger K. L., 2006, ApJ, 644, 813
Faber S. M., Worthey G., Gonzales J. J., 1992, in Barbuy B., Ren-zini A., eds, The Stellar Populations of Galaxies Vol. 149 ofIAUSymposium, Absorption-Line Spectra of Elliptical Galaxies andTheir Relation to Elliptical Formation. pp 255–+
Feulner G., Gabasch A., Salvato M., Drory N., Hopp U., BenderR., 2005, ApJ, 633, L9
Fontana A., Pozzetti L., Donnarumma I., Renzini A., CimattiA.,Zamorani G., Menci N., Daddi E., Giallongo E., Mignoli M.,Perna C., Salimbeni S., Saracco P., Broadhurst T., Cristiani S.,
D’Odorico S., Gilmozzi R., 2004, A&A, 424, 23Fontana A., Salimbeni S., Grazian A., Giallongo E., PentericciL., Nonino M., Fontanot F., Menci N., Monaco P., Cristiani S.,Vanzella E., de Santis C., Gallozzi S., 2006, A&A, 459, 745
Fontanot F., Cristiani S., Monaco P., Nonino M., Vanzella E.,Brandt W. N., Grazian A., Mao J., 2007, A&A, 461, 39
Fontanot F., Monaco P., Cristiani S., Tozzi P., 2006, MNRAS,373,1173
Fontanot F., Monaco P., Silva L., Grazian A., 2007, MNRAS, 382,903
Fontanot F., Somerville R. S., Silva L., Monaco P., Skibba R.,2009, MNRAS, 392, 553
Gallazzi A., Charlot S., Brinchmann J., White S. D. M., TremontiC. A., 2005, MNRAS, 362, 41
Gao L., White S. D. M., Jenkins A., Stoehr F., Springel V., 2004,MNRAS, 355, 819
Gilbank D. G., Balogh M. L., 2008, MNRAS, 385, L116Gilbank D. G., Yee H. K. C., Ellingson E., Gladders M. D., LohY.-S., Barrientos L. F., Barkhouse W. A., 2008, ApJ, 673, 742
Granato G. L., Silva L., Monaco P., Panuzzo P., Salucci P., DeZotti G., Danese L., 2001, MNRAS, 324, 757
Grazian A., Fontana A., de Santis C., Nonino M., Salimbeni S.,Giallongo E., Cristiani S., Gallozzi S., Vanzella E., 2006,A&A,449, 951
Hasinger G., Miyaji T., Schmidt M., 2005, A&A, 441, 417Heavens A., Panter B., Jimenez R., Dunlop J., 2004, Nature, 428,625
Juneau S., Glazebrook K., Crampton D., McCarthy P. J., SavaglioS., Abraham R., Carlberg R. G., Chen H.-W., Le Borgne D.,Marzke R. O., Roth K., Jørgensen I., Hook I., Murowinski R.,2005, ApJ, 619, L135
Kauffmann G., 1996, MNRAS, 281, 487Kewley L. J., Ellison S. L., 2008, ApJ, 681, 1183Kimm T., Somerville R. S., Yi S. K., van den Bosch F. C., SalimS., Fontanot F., Monaco P., Mo H., Pasquali A., Rich R. M., YangX., 2008, ArXiv e-prints
Kitzbichler M. G., White S. D. M., 2007, MNRAS, 376, 2Kodama T., Yamada T., Akiyama M., Aoki K., Doi M., FurusawaH., Fuse T., Imanishi M. e. a., 2004, MNRAS, 350, 1005
Komatsu E., Dunkley J., Nolta M. R., Bennett C. L., Gold B.,Hinshaw G., Jarosik N., Larson D., Limon M., Page L., SpergelD. N., Halpern M., Hill R. S., Kogut A., Meyer S. S., TuckerG. S., Weiland J. L., Wollack E., Wright E. L., 2009, ApJS, 180,330
Kuntschner H., Lucey J. R., Smith R. J., Hudson M. J., DaviesR. L., 2001, MNRAS, 323, 615
La Franca F., Fiore F., Comastri A., Perola G. C., Sacchi N., BrusaM., Cocchia F., Feruglio C., Matt G., Vignali C., Carangelo N.,Ciliegi P., Lamastra A., Maiolino R., Mignoli M., Molendi S.,Puccetti S., 2005, ApJ, 635, 864
Lee S.-K., Idzi R., Ferguson H. C., Somerville R. S., WiklindT.,Giavalisco M., 2008, ArXiv e-prints
Li Y., Mo H. J., Gao L., 2008, MNRAS, 389, 1419Lo Faro B. e. a., 2009, submitted to MNRASMaiolino R., Nagao T., Grazian A., Cocchia F., Marconi A., Man-nucci F., Cimatti A., Pipino A. e. a., 2008, A&A, 488, 463
Maraston C., Daddi E., Renzini A., Cimatti A., Dickinson M.,Papovich C., Pasquali A., Pirzkal N., 2006, ApJ, 652, 85
Marchesini D., van Dokkum P. G., Forster Schreiber N. M., FranxM., Labbe’ I., Wuyts S., 2008, ArXiv e-prints
Martin D. C., Small T., Schiminovich D., Wyder T. K., Perez-Gonzalez P. G., Johnson B., Wolf C., Barlow T. A. e. a., 2007,

16 Fontanot et al.
ApJS, 173, 415Matteucci F., 1994, A&A, 288, 57Menci N., Fiore F., Perola G. C., Cavaliere A., 2004, ApJ, 606, 58Menci N., Fiore F., Puccetti S., Cavaliere A., 2008, ApJ, 686, 219Mobasher B., Dahlen T., Hopkins A., Scoville N. Z., Capak P.,Rich R. M., Sanders D. B., Schinnerer E., Ilbert O., Salvato M.,Sheth K., 2009, ApJ, 690, 1074
Monaco P., Fontanot F., Taffoni G., 2007, MNRAS, 375, 1189Monaco P., Murante G., Borgani S., Fontanot F., 2006, ApJ, 652,L89
Monaco P., Salucci P., Danese L., 2000, MNRAS, 311, 279Monaco P., Theuns T., Taffoni G., Governato F., Quinn T., StadelJ., 2002, ApJ, 564, 8
Nagashima M., Lacey C. G., Okamoto T., Baugh C. M., FrenkC. S., Cole S., 2005, MNRAS, 363, L31
Navarro J. F., Frenk C. S., White S. D. M., 1996, ApJ, 462, 563Neistein E., van den Bosch F. C., Dekel A., 2006, MNRAS, 372,933
Nelan J. E., Smith R. J., Hudson M. J., Wegner G. A., Lucey J. R.,Moore S. A. W., Quinney S. J., Suntzeff N. B., 2005, ApJ, 632,137
Noeske K. G., Faber S. M., Weiner B. J., Koo D. C., PrimackJ. R., Dekel A., Papovich C., Conselice C. J., Le Floc’h E., RiekeG. H., Coil A. L., Lotz J. M., Somerville R. S., Bundy K., 2007,ApJ, 660, L47
Pannella M., Hopp U., Saglia R. P., Bender R., Drory N., SalvatoM., Gabasch A., Feulner G., 2006, ApJ, 639, L1
Panter B., Jimenez R., Heavens A. F., Charlot S., 2007, MNRAS,378, 1550
Papovich C., Cool R., Eisenstein D., Le Floc’h E., Fan X., Kenni-cutt Jr. R. C., Smith J. D. T., Rieke G. H., Vestergaard M., 2006,AJ, 132, 231
Perez-Gonzalez P. G., Rieke G. H., Villar V., Barro G., BlaylockM., Egami E., Gallego J., Gil de Paz A., Pascual S., ZamoranoJ., Donley J. L., 2008, ApJ, 675, 234
Pipino A., Devriendt J. E. G., Thomas D., Silk J., Kaviraj S.,2008,ArXiv e-prints
Pozzetti L., Bolzonella M., Lamareille F., Zamorani G., FranzettiP., Le Fevre O., Iovino A., Temporin S. e. a., 2007, A&A, 474,443
Salim S., Rich R. M., Charlot S., Brinchmann J., Johnson B. D.,Schiminovich D., Seibert M., Mallery R. e. a., 2007, ApJS, 173,267
Santini P., Fontana A., Grazian A., Salimbeni S., Fiore F.,Fontanot F., Boutsia K., Castellano M., Cristiani S., De SantisC., Gallozzi S., Giallongo E., Menci N., Nonino M., Paris D.,Pentericci L., Vanzella E., 2009, ArXiv e-prints
Savaglio S., Glazebrook K., Le Borgne D., Juneau S., AbrahamR. G., Chen H.-W., Crampton D., McCarthy P. J., Carlberg R. G.,Marzke R. O., Roth K., Jørgensen I., Murowinski R., 2005, ApJ,635, 260
Schiminovich D., Wyder T. K., Martin D. C., Johnson B. D., SalimS., Seibert M., Treyer M. A., Budavari T. e. a., 2007, ApJS, 173,315
Sheth R. K., Tormen G., 1999, MNRAS, 308, 119Somerville R. S., Hopkins P. F., Cox T. J., Robertson B. E., Hern-quist L., 2008, MNRAS, 391, 481
Somerville R. S., Kolatt T. S., 1999, MNRAS, 305, 1Somerville R. S., Primack J. R., Faber S. M., 2001, MNRAS, 320,504
Springel V., White S. D. M., Jenkins A., Frenk C. S., Yoshida N.,Gao L., Navarro J., Thacker R., Croton D., Helly J., Peacock
J. A., Cole S., Thomas P., Couchman H., Evrard A., Colberg J.,Pearce F., 2005, Nature, 435, 629
Stringer M. J., Benson A. J., Bundy K., Ellis R. S., Quetin E. L.,2009, MNRAS, 393, 1127
Taffoni G., Mayer L., Colpi M., Governato F., 2003, MNRAS,341, 434
Thomas D., 1999, MNRAS, 306, 655Thomas D., Maraston C., Bender R., Mendes de Oliveira C., 2005,ApJ, 621, 673
Tonini C., Maraston C., Devriendt J., Thomas D., Silk J., 2008,ArXiv e-prints
Trager S. C., Faber S. M., Dressler A., 2008, MNRAS, 386, 715Trager S. C., Faber S. M., Worthey G., Gonzalez J. J., 2000a,AJ,120, 165
Trager S. C., Faber S. M., Worthey G., Gonzalez J. J., 2000b,AJ,119, 1645
Trager S. C., Somerville R. S., 2008, MNRAS, acceptedUeda Y., Akiyama M., Ohta K., Miyaji T., 2003, ApJ, 598, 886van den Bosch F. C., Aquino D., Yang X., Mo H. J., Pasquali A.,McIntosh D. H., Weinmann S. M., Kang X., 2008, MNRAS, 387,79
Vergani D., Scodeggio M., Pozzetti L., Iovino A., FranzettiP.,Garilli B., Zamorani G., Maccagni D. e. a., 2008, A&A, 487, 89
Viola M., Monaco P., Borgani S., Murante G., Tornatore L., 2008,MNRAS, 383, 777
Wang J., De Lucia G., Kitzbichler M. G., White S. D. M., 2008,MNRAS, 384, 1301
Weinmann S. M., van den Bosch F. C., Yang X., Mo H. J., CrotonD. J., Moore B., 2006, MNRAS, 372, 1161
White S. D. M., Frenk C. S., 1991, ApJ, 379, 52Worthey G., 1994, ApJS, 95, 107Worthey G., Faber S. M., Gonzalez J. J., 1992, ApJ, 398, 69Zheng X. Z., Bell E. F., Papovich C., Wolf C., Meisenheimer K.,Rix H.-W., Rieke G. H., Somerville R., 2007, ApJ, 661, L41