the manufacturing imperative -...
TRANSCRIPT
The Manufacturing Imperative
Gregory TasseyEconomic Analysis Office
National Institute of Standards and Technology
November 2011

Economic importance of Domestic Manufacturing (hardware and software):
1) Diversification:
a) Manufacturing contributes $1.6 trillion to GDP and employs 11 million workers
b) High-tech service jobs are increasingly ‘‘tradeable’’ and 30 economies have policies in place to promote service exports
2) Manufacturing accounts for 67% of US industry-performed R&D and a 57% share of U.S. industry’s scientists/engineers
3) Therefore, the fast-growing high-tech services sector must have close ties to its manufacturing base
4) Majority of trade is in manufactured products (but deficits for last 35 years)
2
Importance of the Policy Problem Importance of the Policy Problem –– ManufacturingManufacturing

0
20
40
60
80
100
120
140
0 5 10 15 20 25
Rate of Innovation vs. R&D Intensity: Percent of Companies in an Industry Reporting Product and/or Process Innovations, 2003-2007
Index
R&D Intensity
Source: Gregory Tassey, “Beyond the Business Cycle: The Need for a Technology-Based Growth Strategy,” forthcoming. Index = sum of percent of companies in an industry reporting product innovations and percent reporting process innovations. R&D intensity data from Science and Engineering Indicators 2010 , Appendix Table 4-14 (industry and other non-federal funds for R&D); innovation data from Mark Boroush, “NSF Releases New Statistics on Business Innovation,” NSF InfoBrief, October 2010
Minimum R&D Intensity
3
Importance of the Policy ProblemImportance of the Policy Problem –– R&D Intensity and Innovative OutputR&D Intensity and Innovative Output
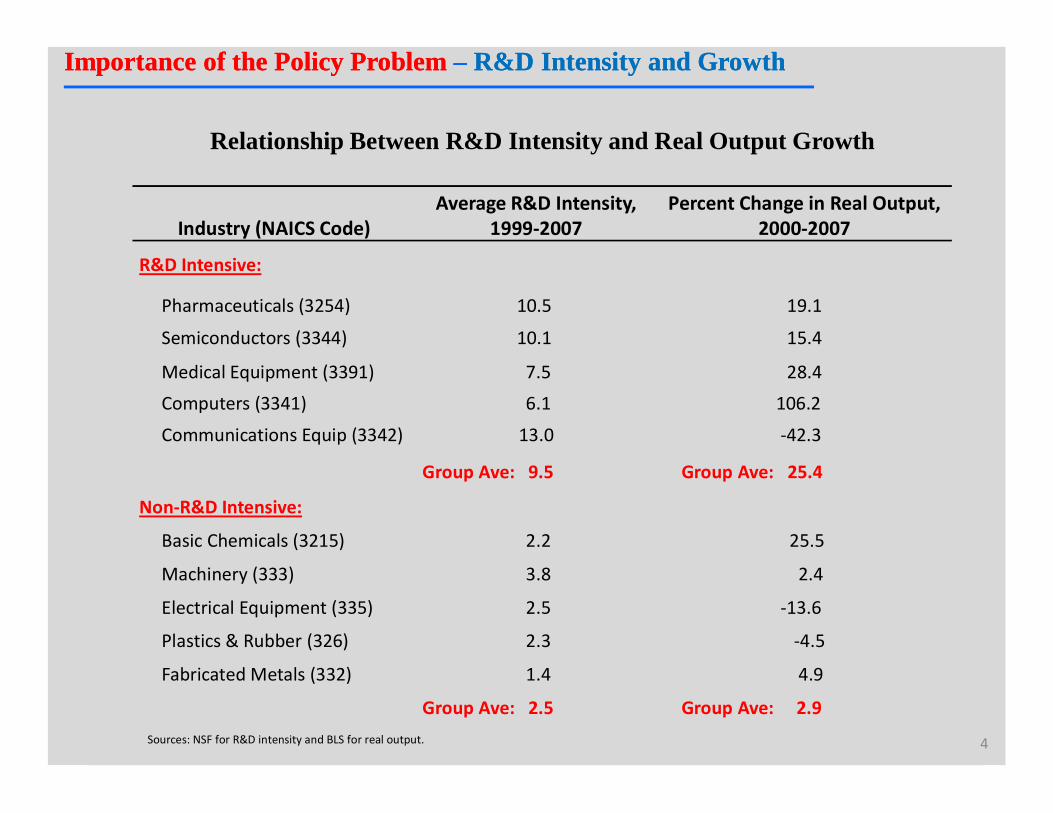
Relationship Between R&D Intensity and Real Output Growth
Industry (NAICS Code)Average R&D Intensity,
1999-2007Percent Change in Real Output,
2000-2007
R&D Intensive:
Pharmaceuticals (3254) 10.5 19.1
Semiconductors (3344) 10.1 15.4
Medical Equipment (3391) 7.5 28.4
Computers (3341) 6.1 106.2
Communications Equip (3342) 13.0 -42.3
Group Ave: 9.5 Group Ave: 25.4
Non-R&D Intensive:
Basic Chemicals (3215) 2.2 25.5
Machinery (333) 3.8 2.4
Electrical Equipment (335) 2.5 -13.6
Plastics & Rubber (326) 2.3 -4.5
Fabricated Metals (332) 1.4 4.9
Group Ave: 2.5 Group Ave: 2.9
Sources: NSF for R&D intensity and BLS for real output. 4
Importance of the Policy Problem Importance of the Policy Problem –– R&D Intensity and GrowthR&D Intensity and Growth
5
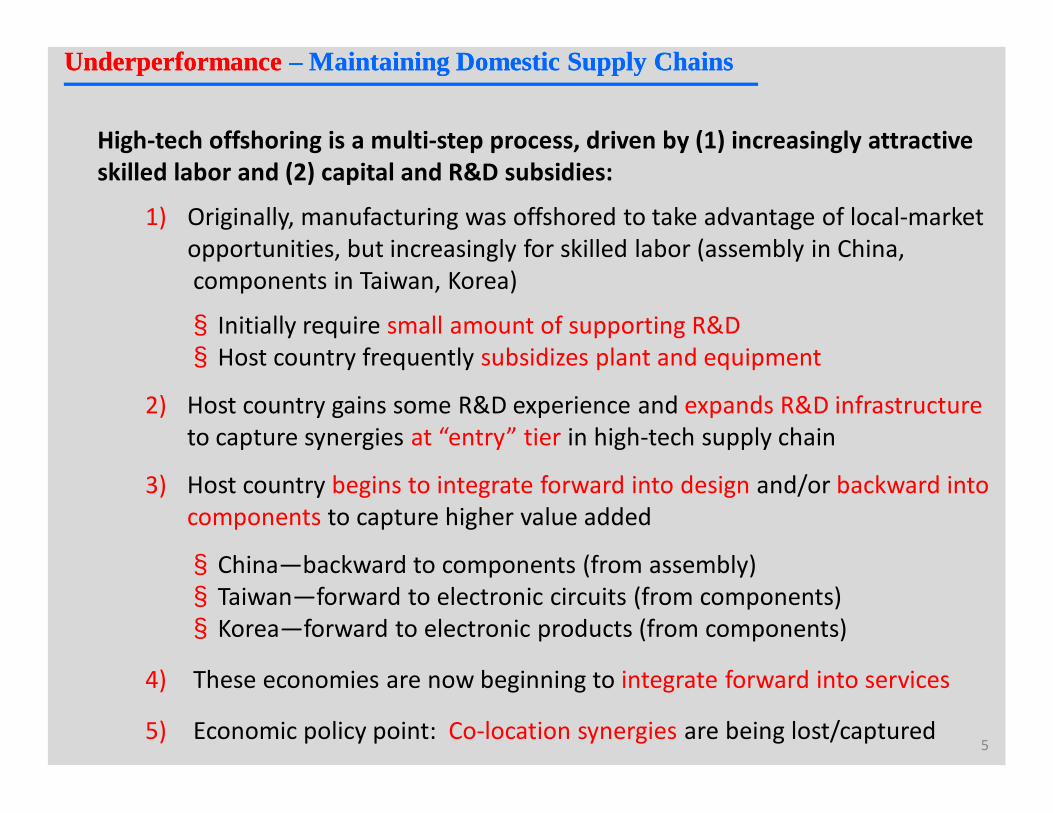
High-tech offshoring is a multi-step process, driven by (1) increasingly attractive skilled labor and (2) capital and R&D subsidies:
1) Originally, manufacturing was offshored to take advantage of local-market opportunities, but increasingly for skilled labor (assembly in China, components in Taiwan, Korea)
§ Initially require small amount of supporting R&D§ Host country frequently subsidizes plant and equipment
2) Host country gains some R&D experience and expands R&D infrastructure to capture synergies at “entry” tier in high-tech supply chain
3) Host country begins to integrate forward into design and/or backward into components to capture higher value added
§ China—backward to components (from assembly)§ Taiwan—forward to electronic circuits (from components)§ Korea—forward to electronic products (from components)
4) These economies are now beginning to integrate forward into services
5) Economic policy point: Co-location synergies are being lost/captured
Underperformance Underperformance –– Maintaining Domestic Supply ChainsMaintaining Domestic Supply Chains
6
Poor Technology Life-Cycle Management:
The United States has been the “first mover” and then lost virtually all market share in a wide range of materials and product technologies, including
• oxide ceramics
• semiconductor memory devices
• semiconductor production equipment such as steppers
• lithium-ion batteries
• flat panel displays
• robotics
• solar cells
• advanced lighting
Underperformance Underperformance –– Manufacturing Manufacturing
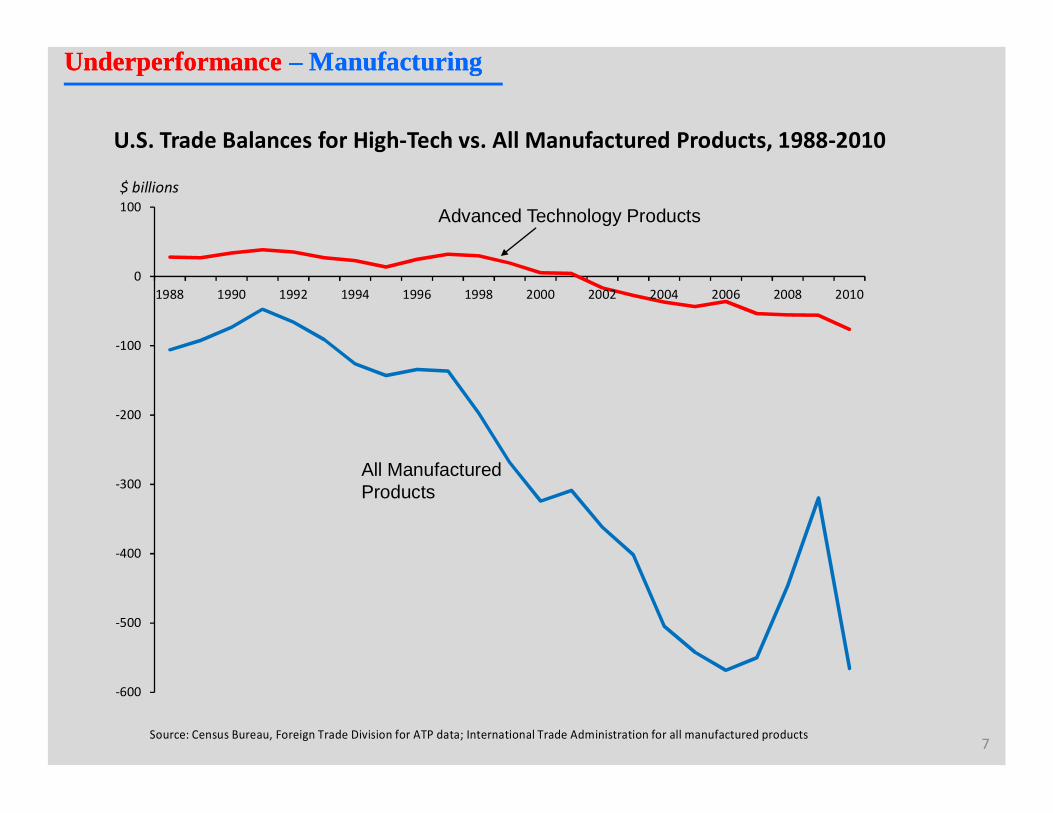
-600
-500
-400
-300
-200
-100
0
100
1988 1990 1992 1994 1996 1998 2000 2002 2004 2006 2008 2010
All Manufactured Products
Advanced Technology Products$ billions
Source: Census Bureau, Foreign Trade Division for ATP data; International Trade Administration for all manufactured products
U.S. Trade Balances for High-Tech vs. All Manufactured Products, 1988-2010
7
Underperformance Underperformance –– Manufacturing Manufacturing
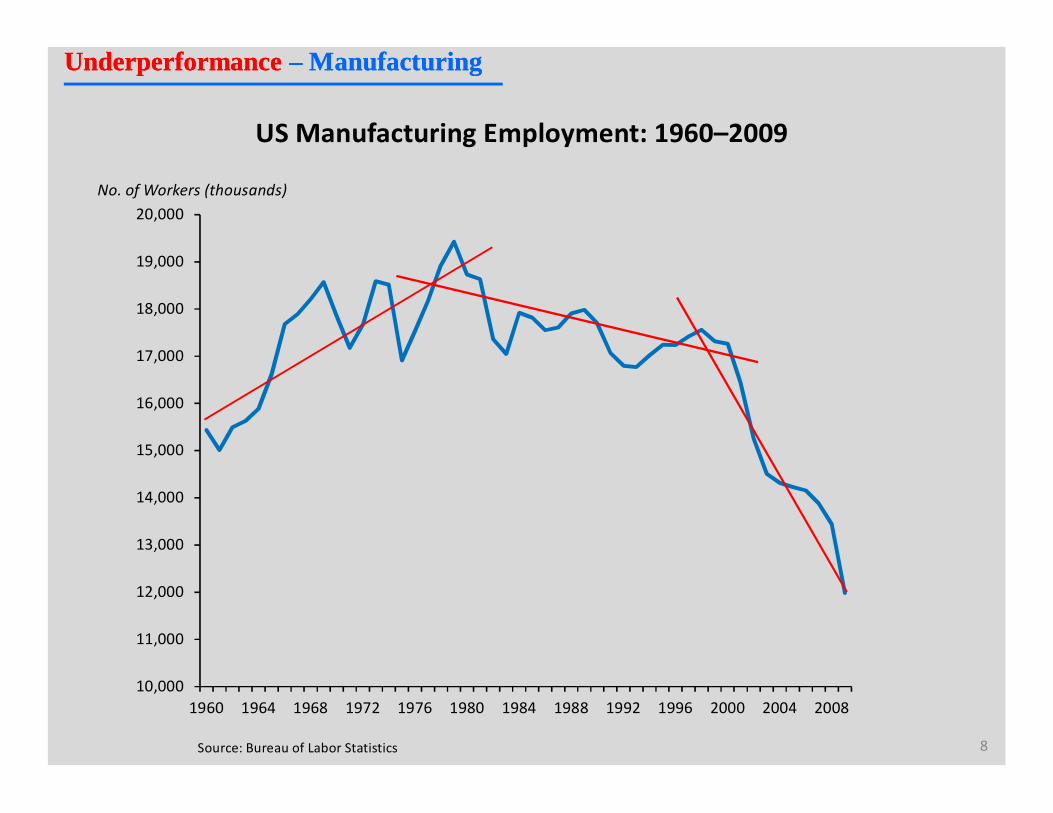
10,000
11,000
12,000
13,000
14,000
15,000
16,000
17,000
18,000
19,000
20,000
1960 1964 1968 1972 1976 1980 1984 1988 1992 1996 2000 2004 2008
US Manufacturing Employment: 1960–2009
Source: Bureau of Labor Statistics
No. of Workers (thousands)
8
Underperformance Underperformance –– Manufacturing Manufacturing

9
§ Germany has a trade surplus in manufacturing, even though, compared to the United States, it has a
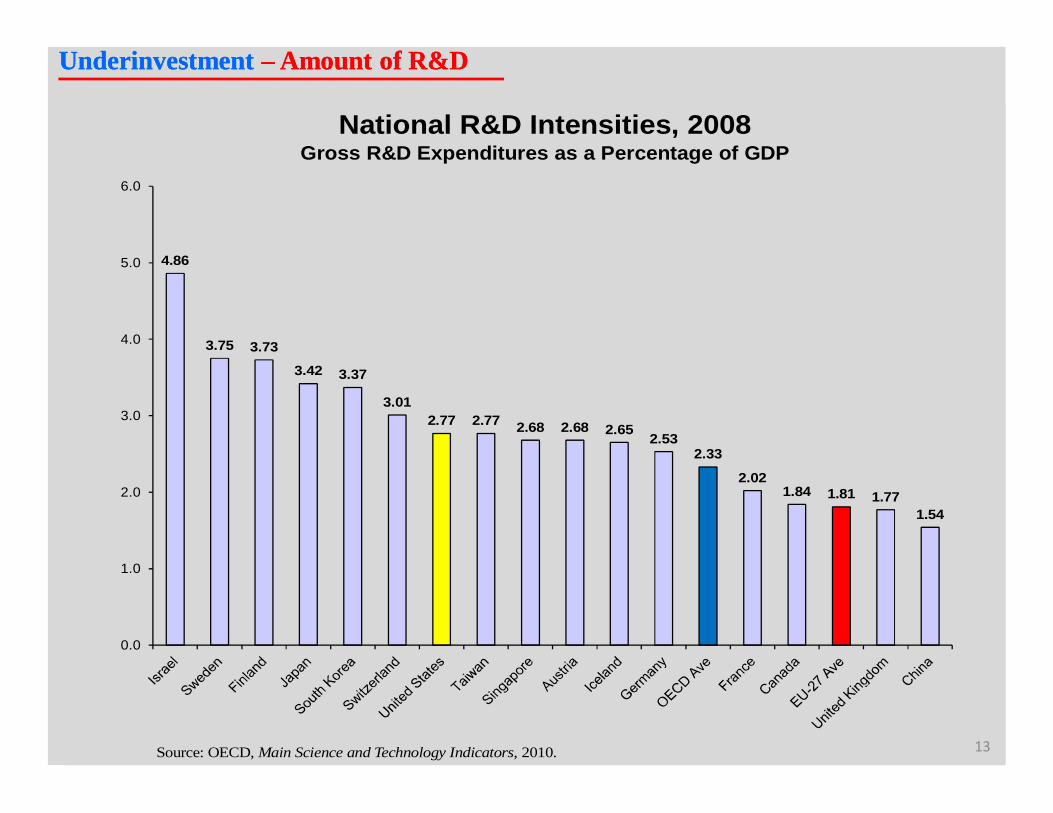
Ø 9 percent lower R&D intensity (2.53 percent vs. 2.77 percent for U.S.)
Ø 39 percent higher average hourly manufacturing labor compensation
Ø 12 percent higher corporate tax rate
§ However, Germany has a more comprehensive and intensively managed STID policy
Ø Highly skilled labor force across all technology occupations
Ø Optimized industry structure (support for both large firms and SMEs)
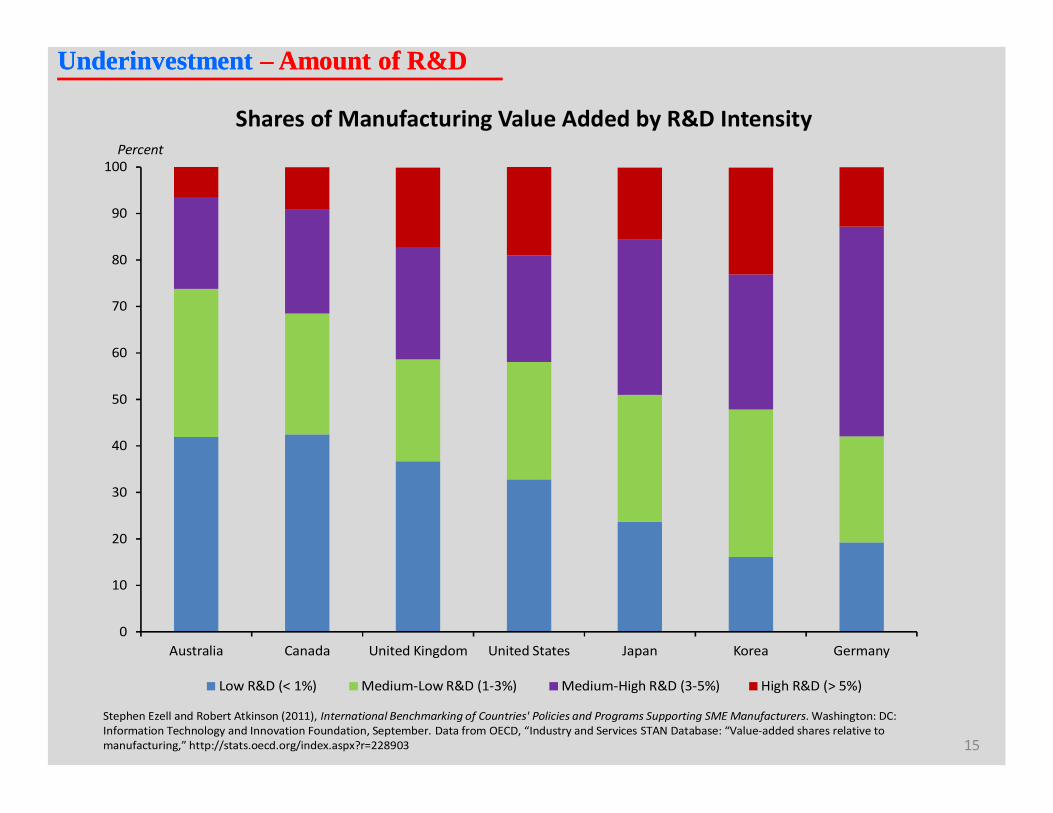
Ø Highest percentage of manufacturing value added from R&D-intensive industries
Underperformance Underperformance –– Manufacturing Manufacturing
10
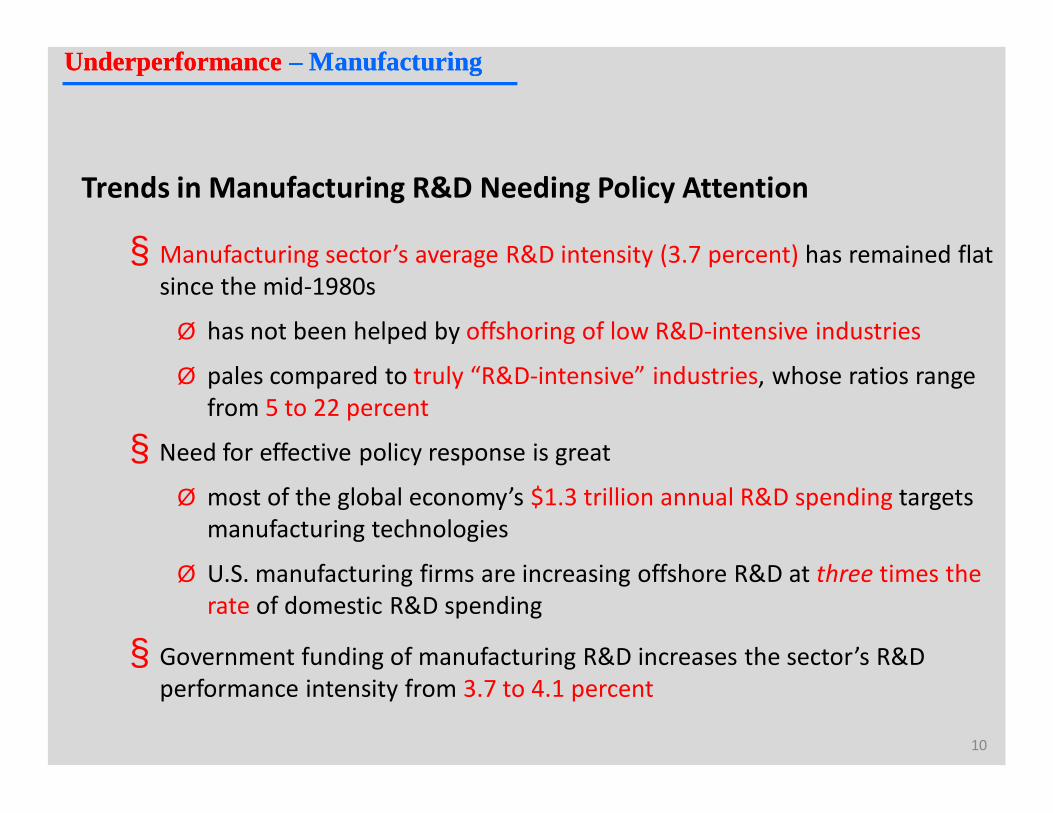
Trends in Manufacturing R&D Needing Policy Attention
§ Manufacturing sector’s average R&D intensity (3.7 percent) has remained flat since the mid-1980s
Ø has not been helped by offshoring of low R&D-intensive industries
Ø pales compared to truly “R&D-intensive” industries, whose ratios range from 5 to 22 percent
§ Need for effective policy response is great
Ø most of the global economy’s $1.3 trillion annual R&D spending targets manufacturing technologies
Ø U.S. manufacturing firms are increasing offshore R&D at three times the rate of domestic R&D spending
§ Government funding of manufacturing R&D increases the sector’s R&D performance intensity from 3.7 to 4.1 percent
Underperformance Underperformance –– Manufacturing Manufacturing
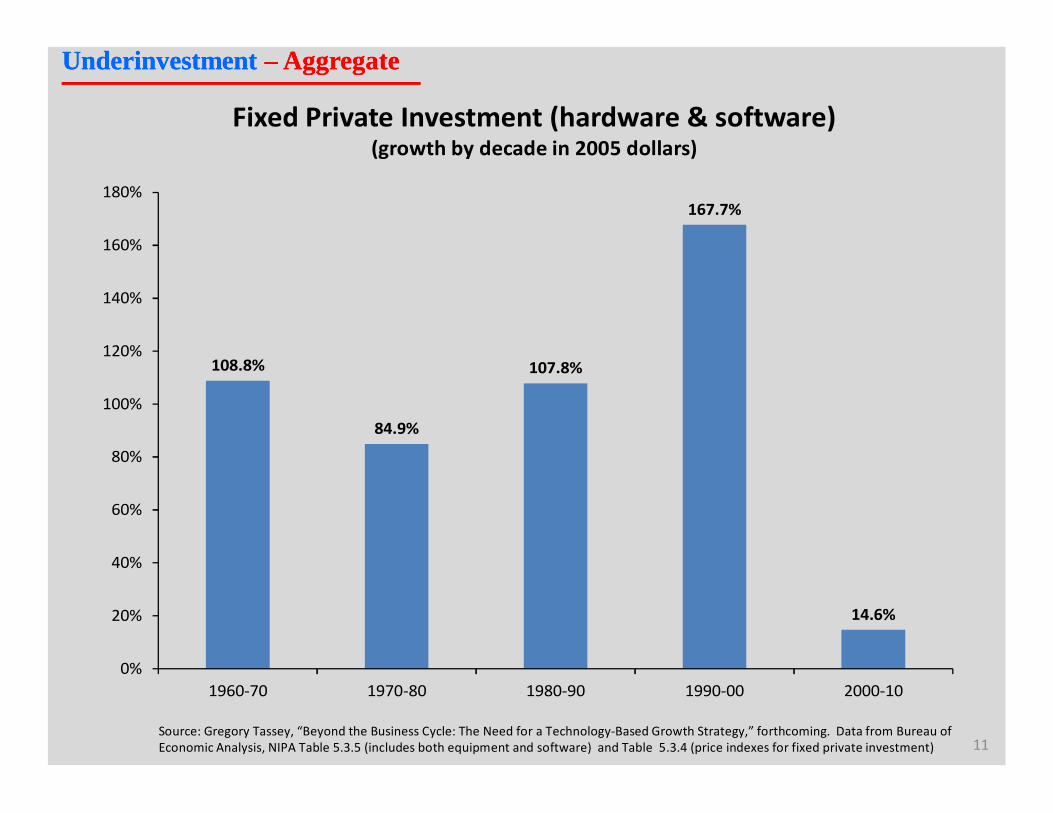
108.8%
84.9%
107.8%
167.7%
14.6%
0%
20%
40%
60%
80%
100%
120%
140%
160%
180%
1960-70 1970-80 1980-90 1990-00 2000-10
Fixed Private Investment (hardware & software) (growth by decade in 2005 dollars)
Source: Gregory Tassey, “Beyond the Business Cycle: The Need for a Technology-Based Growth Strategy,” forthcoming. Data from Bureau of Economic Analysis, NIPA Table 5.3.5 (includes both equipment and software) and Table 5.3.4 (price indexes for fixed private investment) 11
Underinvestment Underinvestment –– AggregateAggregate
0.0%
0.5%
1.0%
1.5%
2.0%
2.5%
3.0%
3.5%
1953 1957 1961 1965 1969 1973 1977 1981 1985 1989 1993 1997 2001 2005
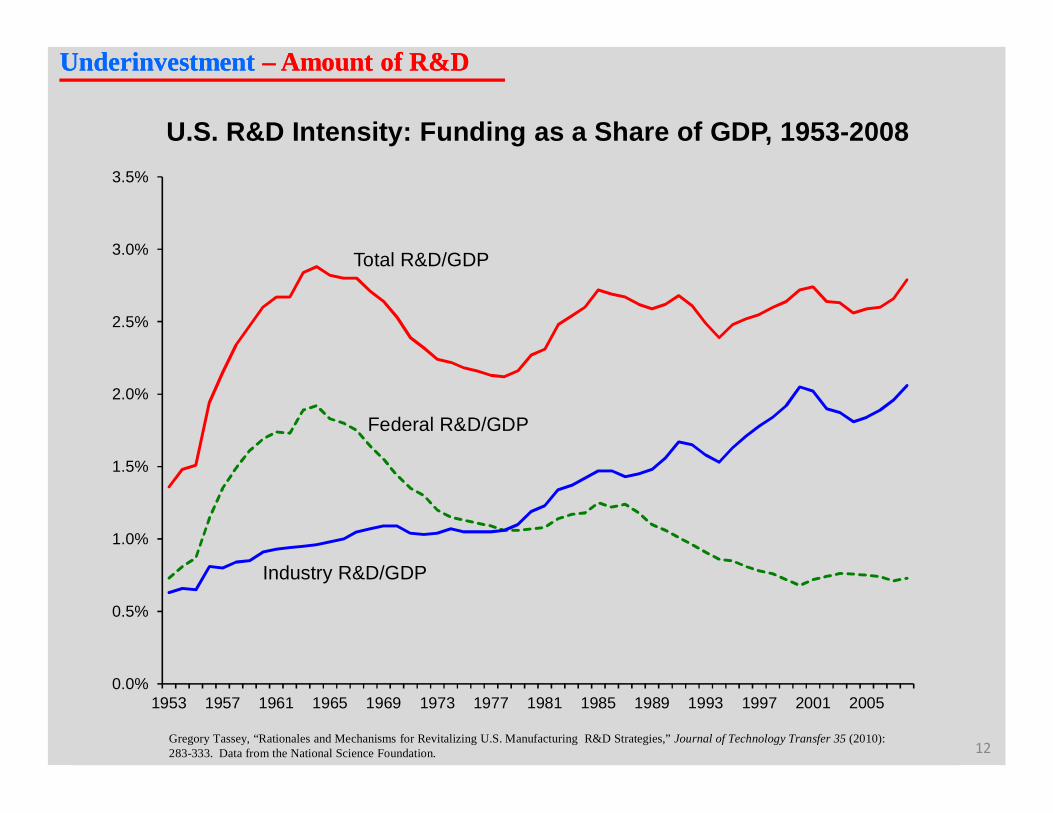
U.S. R&D Intensity: Funding as a Share of GDP, 1953-2008
Total R&D/GDP
Federal R&D/GDP
Industry R&D/GDP
Gregory Tassey, “Rationales and Mechanisms for Revitalizing U.S. Manufacturing R&D Strategies,” Journal of Technology Transfer 35 (2010): 283-333. Data from the National Science Foundation. 12
Underinvestment Underinvestment –– Amount of R&DAmount of R&D
4.86
3.75 3.73
3.42 3.37
3.012.77 2.77 2.68 2.68 2.65 2.53
2.33
2.021.84 1.81 1.77
1.54
0.0
1.0
2.0
3.0
4.0
5.0
6.0
Source: OECD, Main Science and Technology Indicators, 2010.
National R&D Intensities, 2008 Gross R&D Expenditures as a Percentage of GDP
13
Underinvestment Underinvestment –– Amount of R&DAmount of R&D
170.2%
135.1%
65.0%61.0%
42.2%
26.2%20.5%
10.4%
0%
20%
40%
60%
80%
100%
120%
140%
160%
180%
China Singapore Finland Taiwan South Korea Japan Germany United States
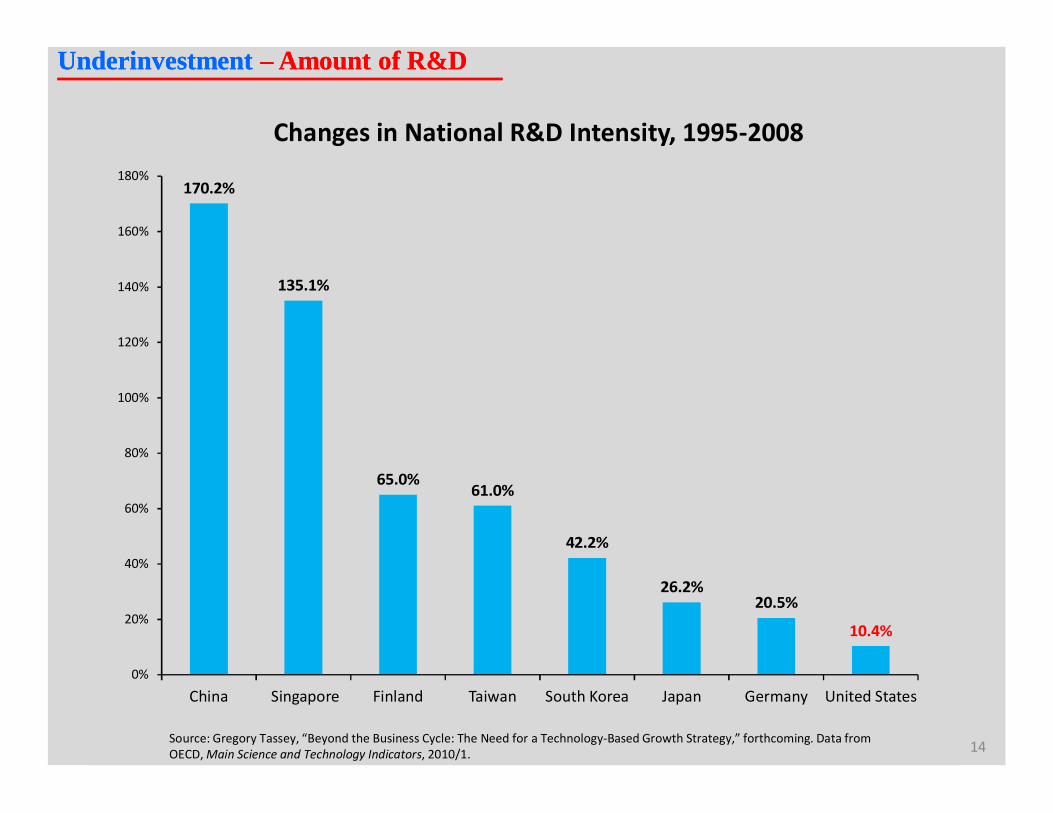
Source: Gregory Tassey, “Beyond the Business Cycle: The Need for a Technology-Based Growth Strategy,” forthcoming. Data from OECD, Main Science and Technology Indicators, 2010/1.
Changes in National R&D Intensity, 1995-2008
14
Underinvestment Underinvestment –– Amount of R&DAmount of R&D
0
10
20
30
40
50
60
70
80
90
100
Australia Canada United Kingdom United States Japan Korea Germany
Low R&D (< 1%) Medium-Low R&D (1-3%) Medium-High R&D (3-5%) High R&D (> 5%)
Shares of Manufacturing Value Added by R&D Intensity
Stephen Ezell and Robert Atkinson (2011), International Benchmarking of Countries' Policies and Programs Supporting SME Manufacturers. Washington: DC: Information Technology and Innovation Foundation, September. Data from OECD, “Industry and Services STAN Database: “Value-added shares relative to manufacturing,” http://stats.oecd.org/index.aspx?r=228903
Percent
15
Underinvestment Underinvestment –– Amount of R&DAmount of R&D
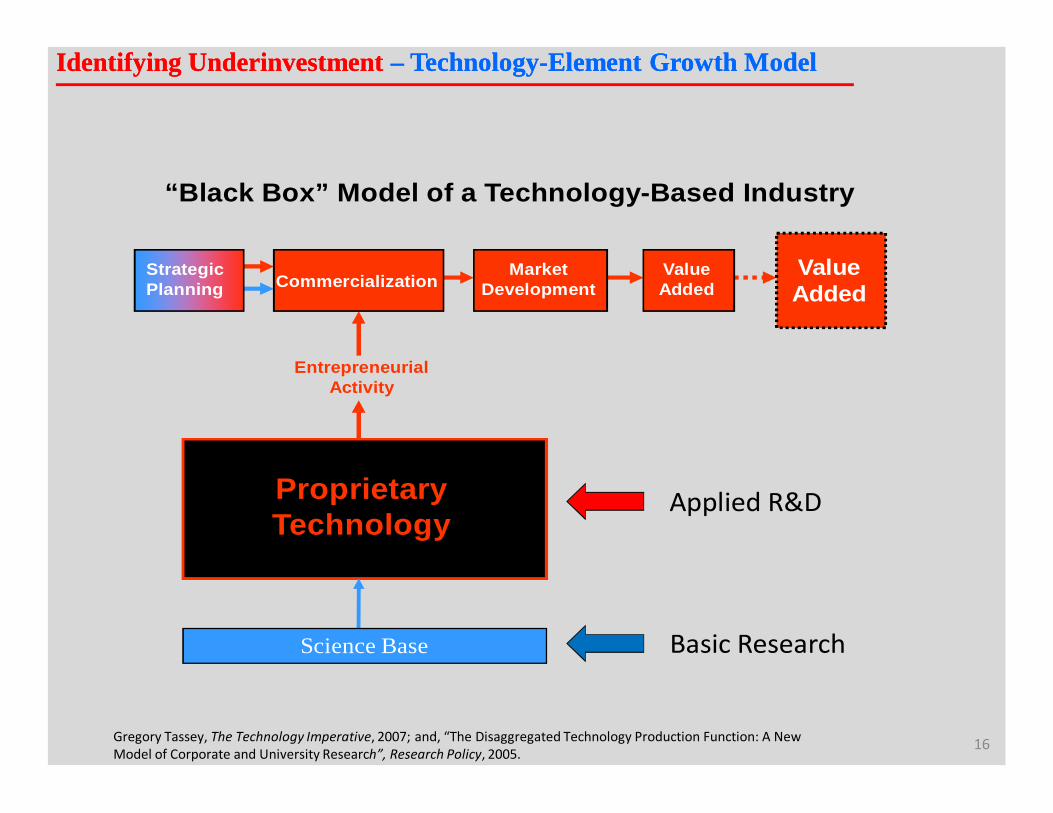
“Black Box” Model of a Technology-Based Industry
Proprietary Technology
EntrepreneurialActivity
Market Development
Value Added
Value Added
Strategic Planning Commercialization
Science Base
Applied R&D
Basic Research
16Gregory Tassey, The Technology Imperative, 2007; and, “The Disaggregated Technology Production Function: A New Model of Corporate and University Research”, Research Policy, 2005.
Identifying Underinvestment Identifying Underinvestment –– TechnologyTechnology--Element Growth ModelElement Growth Model
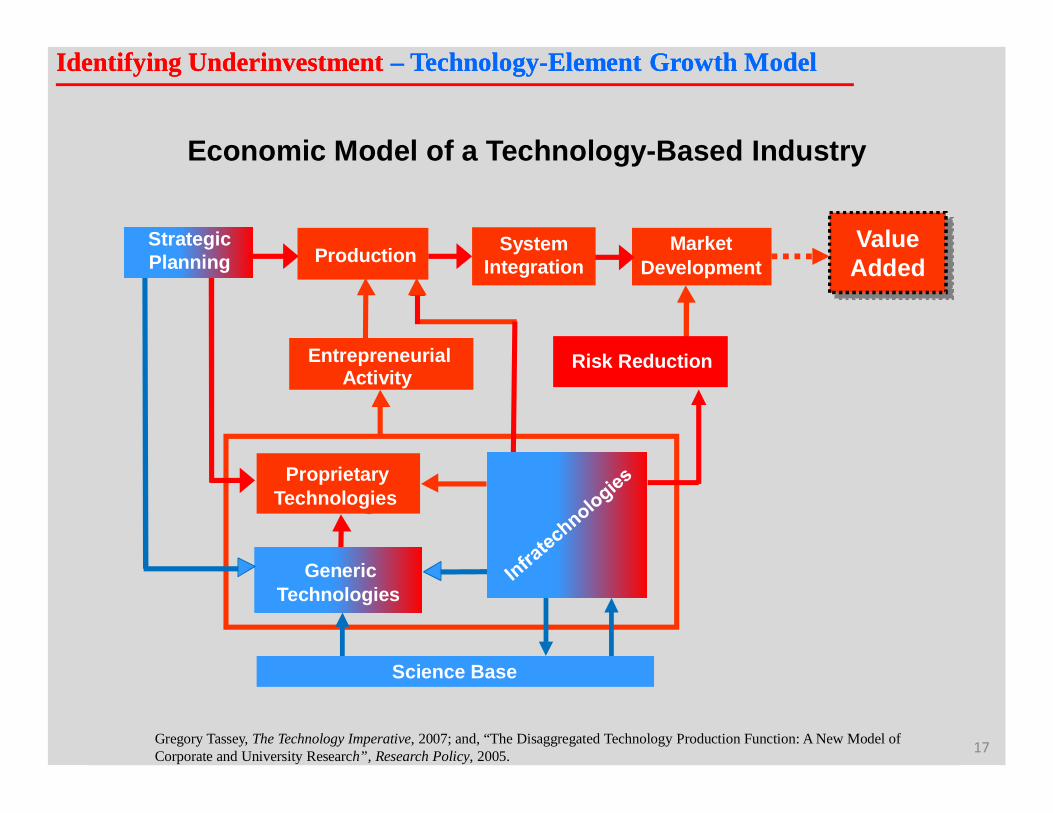
g Production MarketDevelopment
EntrepreneurialActivity
ProprietaryTechnologiesProprietary
Technologies
GenericTechnologies
Science Base
Economic Model of a Technology-Based Industry
ValueAdded
Gregory Tassey, The Technology Imperative, 2007; and, “The Disaggregated Technology Production Function: A New Model of Corporate and University Research”, Research Policy, 2005.
StrategicPlanning
Risk Reduction
System Integration
17
Identifying Underinvestment Identifying Underinvestment –– TechnologyTechnology--Element Growth ModelElement Growth Model

Application of the Technology-Element Model: Biotechnology
Science Base
Infratechnologies
Generic Technologies Product Process
Commercial Products
§ genomics § immunology § microbiology/
virology § molecular and
cellular biology § nanoscience § neuroscience § pharmacology § physiology § proteomics
§ bioinformatics § bioimaging § biomarkers § combinatorial
chemistry § DNA sequencing and
profiling § electrophoresis § fluorescence § gene expression
analysis § magnetic resonance
spectrometry § mass spectrometry § nucleic acid
diagnostics § protein structure
modeling & analysis techniques
§ antiangiogenesis § antisense § apoptosis § bioelectronics § biomaterials § biosensors § functional genomics § gene delivery
systems § gene testing § gene therapy § gene expression
systems § monoclonal
antibodies § pharmacogenomics § stem-cell § tissue engineering
§ cell encapsulation § cell culture § microarrays § fermentation § gene transfer § immunoassays § implantable delivery
systems § nucleic acid
amplification § recombinant
DNA/genetic engineering
§ separation technologies
§ transgenic animals
§ coagulation
inhibitors § DNA probes § inflammation
inhibitors § hormone
restorations § nanodevices § neuroactive
steroids § neuro-transmitter
inhibitors § protease inhibitors § vaccines
Public Technology Goods
Mixed Technology Goods
Private Technology Goods
18Gregory Tassey, The Technology Imperative, Edward Elgar, 2007
Identifying Underinvestment Identifying Underinvestment –– TechnologyTechnology--Element Growth ModelElement Growth Model
-40
-30
-20
-10
0
10
20
30
40
50
60
70
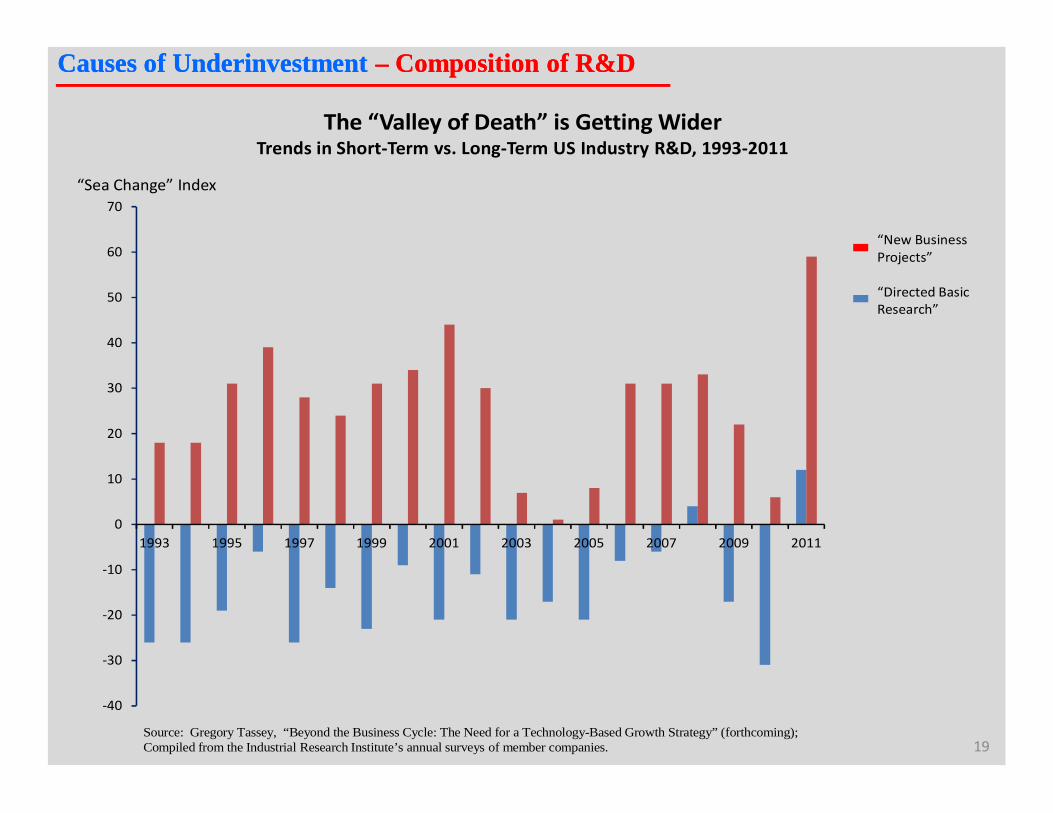
1993 1995 1997 1999 2001 2003 2005 2007 2009 2011
“Directed Basic Research”
“New Business Projects”
The “Valley of Death” is Getting Wider Trends in Short-Term vs. Long-Term US Industry R&D, 1993-2011
Source: Gregory Tassey, “Beyond the Business Cycle: The Need for a Technology-Based Growth Strategy” (forthcoming); Compiled from the Industrial Research Institute’s annual surveys of member companies.
“Sea Change” Index
19
Causes of Underinvestment Causes of Underinvestment –– Composition of R&DComposition of R&D
20
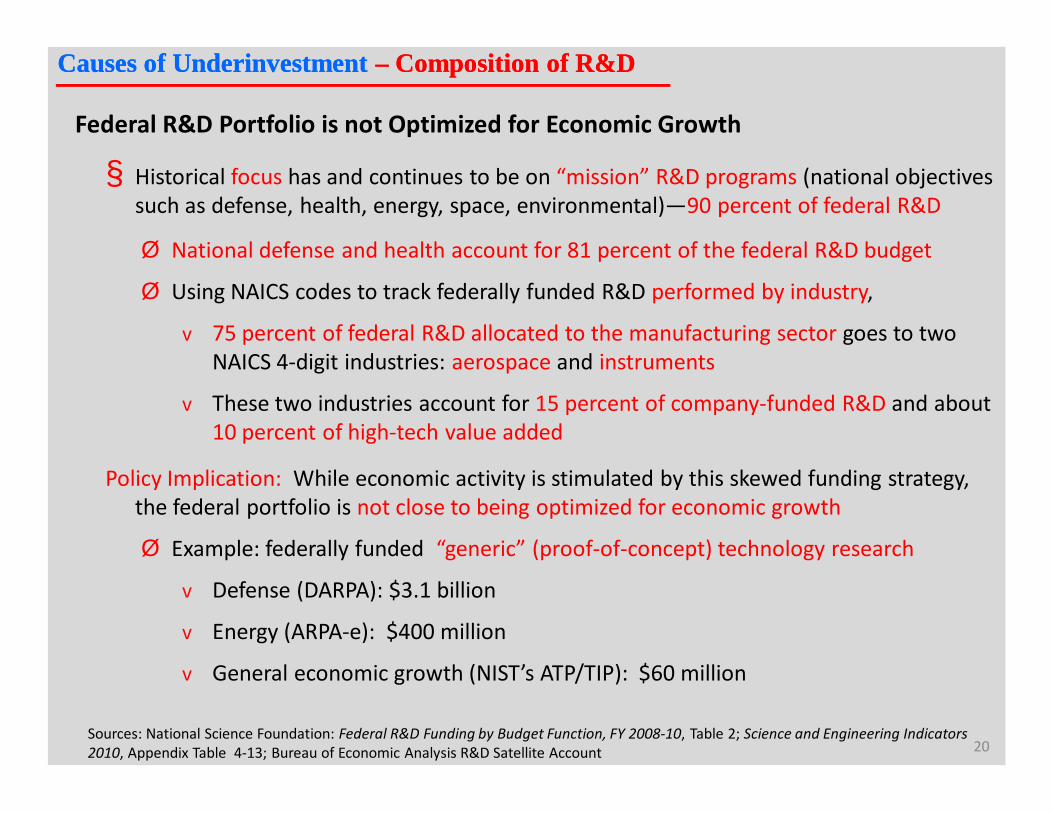
Federal R&D Portfolio is not Optimized for Economic Growth
§ Historical focus has and continues to be on “mission” R&D programs (national objectives such as defense, health, energy, space, environmental)—90 percent of federal R&D
Ø National defense and health account for 81 percent of the federal R&D budget
Ø Using NAICS codes to track federally funded R&D performed by industry,
v 75 percent of federal R&D allocated to the manufacturing sector goes to two NAICS 4-digit industries: aerospace and instruments
v These two industries account for 15 percent of company-funded R&D and about 10 percent of high-tech value added
Policy Implication: While economic activity is stimulated by this skewed funding strategy, the federal portfolio is not close to being optimized for economic growth
Ø Example: federally funded “generic” (proof-of-concept) technology research
v Defense (DARPA): $3.1 billion
v Energy (ARPA-e): $400 million
v General economic growth (NIST’s ATP/TIP): $60 million
Sources: National Science Foundation: Federal R&D Funding by Budget Function, FY 2008-10, Table 2; Science and Engineering Indicators 2010, Appendix Table 4-13; Bureau of Economic Analysis R&D Satellite Account
Causes of Underinvestment Causes of Underinvestment –– Composition of R&DComposition of R&D

Production
Gregory Tassey, “Rationales and Mechanisms for Revitalizing U.S. Manufacturing R&D Strategies,” Journal of Technology Transfer 35 (2010): 283-333.
StrategicPlanning
MarketDevelopment
EntrepreneurialActivity
RiskReduction
ProprietaryTechnologies
GenericTechnologies
Science Base
Joint Industry-Government Planning
Market Targeting Assistance and Procurement Incentives
Acceptance Test Standards and National Test Facilities (NIST)
Interface Standards (consortia, standards groups)
Technology Transfer/Diffusion (MEP)
National Labs (NIST), Consortia
Intellectual Property Rights (DoC)
National LabsDirect Funding of Firms & Universities (DARPA, ARPA-E, NRI, AMTech)
Tax Incentives
Incubators (states)
Managing the Entire Technology Life Cycle: Science, Technology, Innovation, Diffusion (STID) Policy Roles
ValueAdded
Scale-Up Incentives
System Integration
21
Policy ResponsePolicy Response
22
Policy ResponsePolicy Response
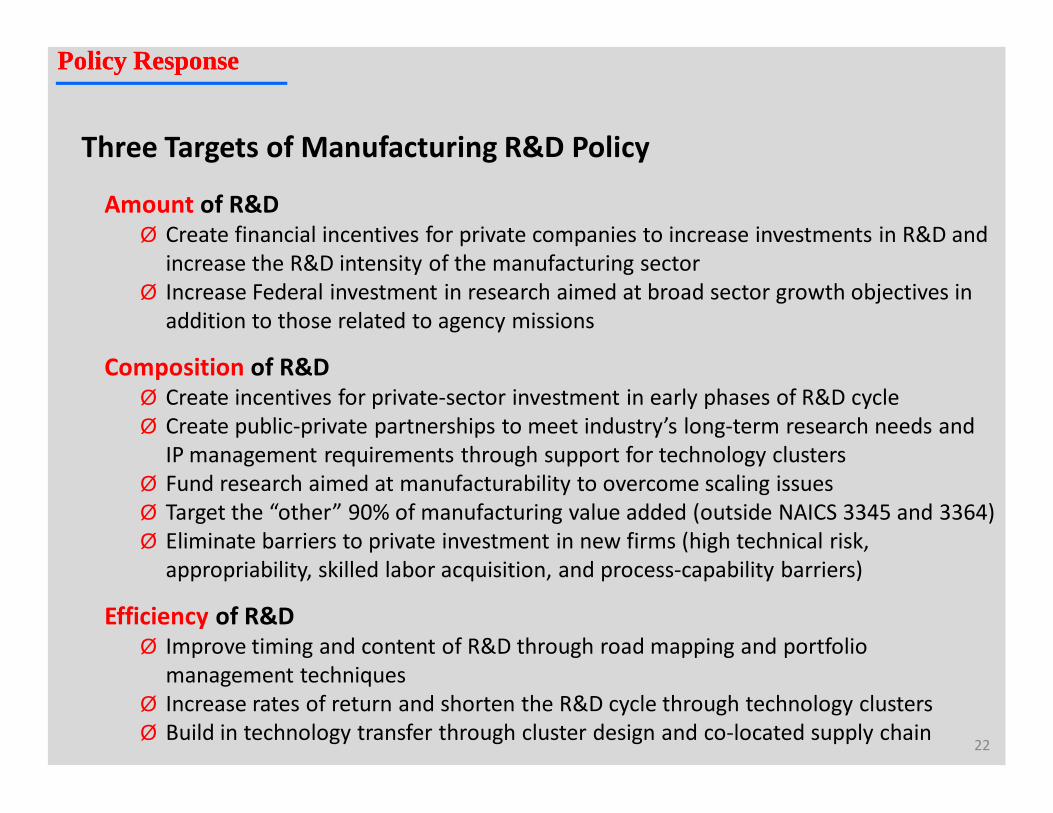
Three Targets of Manufacturing R&D Policy
Amount of R&DØ Create financial incentives for private companies to increase investments in R&D and
increase the R&D intensity of the manufacturing sectorØ Increase Federal investment in research aimed at broad sector growth objectives in
addition to those related to agency missions
Composition of R&DØ Create incentives for private-sector investment in early phases of R&D cycleØ Create public-private partnerships to meet industry’s long-term research needs and
IP management requirements through support for technology clustersØ Fund research aimed at manufacturability to overcome scaling issues Ø Target the “other” 90% of manufacturing value added (outside NAICS 3345 and 3364)Ø Eliminate barriers to private investment in new firms (high technical risk,
appropriability, skilled labor acquisition, and process-capability barriers)
Efficiency of R&DØ Improve timing and content of R&D through road mapping and portfolio
management techniquesØ Increase rates of return and shorten the R&D cycle through technology clustersØ Build in technology transfer through cluster design and co-located supply chain
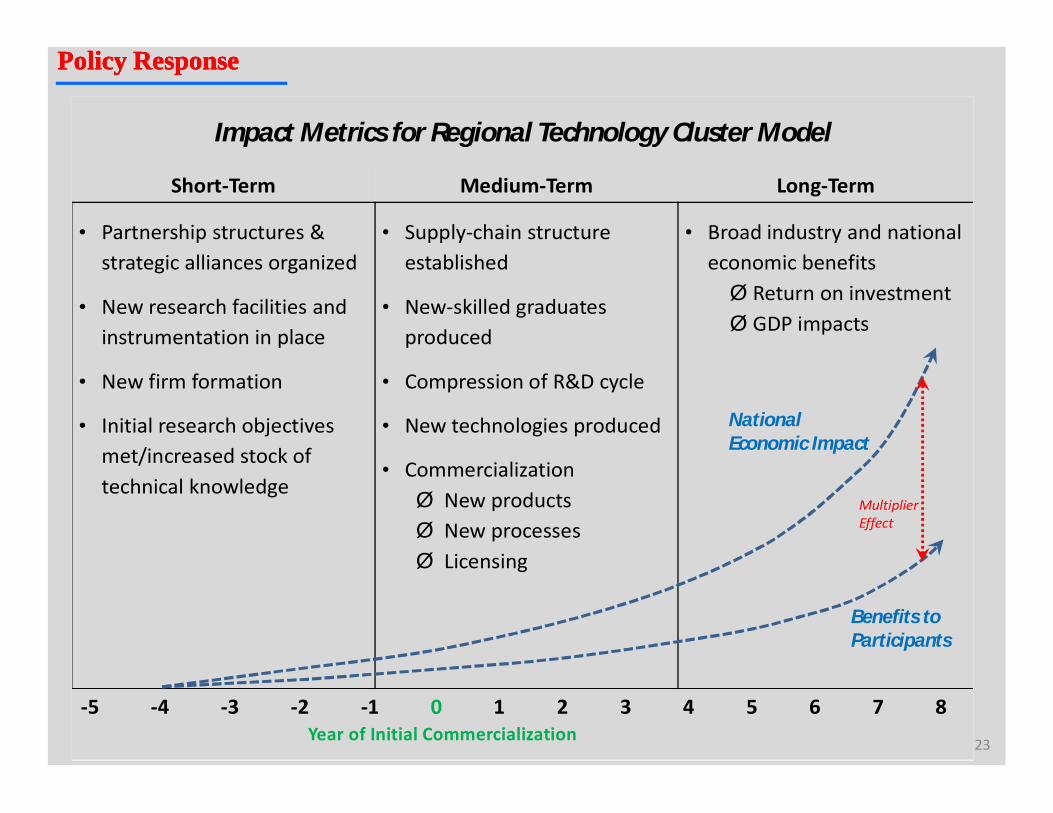
Impact Metrics for Regional Technology Cluster Model
Short-Term Medium-Term Long-Term
• Partnership structures & strategic alliances organized
• New research facilities and instrumentation in place
• New firm formation
• Initial research objectives met/increased stock of technical knowledge
• Supply-chain structure established
• New-skilled graduates produced
• Compression of R&D cycle
• New technologies produced
• CommercializationØ New productsØ New processesØ Licensing
• Broad industry and national economic benefitsØ Return on investmentØ GDP impacts
-5 -4 -3 -2 -1 0 1 2 3 4 5 6 7 8Year of Initial Commercialization
National Economic Impact
Benefits to Participants
Multiplier Effect
23
Policy ResponsePolicy ResponsePolicy ResponsePolicy Response

24
“Sooner or later, we sit down to a banquet of consequences”
– Robert Louis Stevenson