the manual for streets: redefining residential...
TRANSCRIPT

WHOSE STREET IS IT ANYWAY? REDEFINING RESIDENTIAL STREET DESIGN
Iain York
Annabel Bradbury TRL Limited
1 INTRODUCTION
1.1 Background The Department for Transport (DfT) and the Department for Communities and Local Government (DCLG, formerly Office of the Deputy Prime Minister) commissioned WSP, TRL1, Llewelyn Davis Yeang and Phil Jones Associates to develop the Manual for Streets (MFS) which will supersede Design Bulletin 32 (DB32) and its companion guide, Places, Streets and Movement. This paper reports on the evidence base for redefining residential street design, as outlined in the Manual for Streets document, which will be published in early 2007, along with a full technical report of the evidence outlined in this paper. The project is also supported by the Commission for Architecture and the Built Environment (CABE). CABE’s support has allowed for a greater number of study sites that provide a higher level of confidence in results obtained from the research and in understanding the influence of additional parameters on driver behaviour that particularly relate to the visual appearance of streets and their use as spaces. The MFS is intended to consolidate the necessary components for effective street design into a single source of information and guidance for practitioners who include the following:
• Developers • Local highway authorities • Local planning authorities • The emergency services • Utility and drainage companies • Access officers • Public transport providers
• Architects • Highway engineers • Landscape architects • Town planners • Transport planners • Urban designers
It will recognise the full range of design criteria necessary for the delivery of multi-functional streets, assisting practitioners in making informed decisions relating to appropriate street design. The manual will initially cover the design considerations for residential streets and other lightly trafficked local roads. The manual will deal with underlying values that can be creatively deployed by practitioners in order to pursue the Government’s ‘placemaking’ agenda of individually distinctive localities while ensuring streets remain functional and safe. The Manual for Streets will be prepared against a backdrop of sustainable development guidance and initiatives, including the Department
©Association for European Transport and contributors 2006

for Communities and Local Government’s Communities Plan ‘Sustainable Communities: Building for the Future' (ODPM, 2003) to ensure that it facilitates the long-term sustainability of streets, and contributes to an enhanced sense of place.
1.2 Research Objectives This research paper conveys the results of the primary research, which was led by TRL. The research examined the limits of design practice as currently specified in Design Bulletin 32 to consider whether more liberal geometric and visibility values may be incorporated into the Manual for Streets. The main outputs from the research aim to provide further research evidence into existing DB32 standards and to establish the relationships between different link and junction characteristics and road safety. In particular, this entailed conducting research to examine more flexible limits of practice, as currently specified in DB32, in order to consider whether relaxed geometric and visibility values may be incorporated into the MFS. Key objectives of the research were as follows:
• To establish the safety of roads which do not meet DB32 standards in terms of casualty numbers, driver behaviour and resident perceptions.
• To investigate highway layouts to determine whether more permeable layouts are associated with higher levels of casualties than spine and cul-de-sac layouts.
The main aims of conducting the primary research were to:
• Identify standards that differ from established approaches • Evaluate those standards for potential applicability to MFS • Assess the robustness of evidence underpinning those standards based
on primary research where the effects of standards can be assessed against available data, including:
- Driver behavioural response - Casualties - User satisfaction - Interaction with aesthetic elements
The research was undertaken at twenty case study sites across England (see Section 2 for a description of these sites) and considered the following research questions:
• Are junction geometries and road widths that do not meet DB32 standards acceptably safe in terms of recorded casualties?
• Do junction geometries and road widths that do not meet DB32 standards influence drivers to behave in a less risky way, signified by lower speeds?
• Are environments featuring junction geometries and road widths that do not meet DB32 standards perceived by residents to be safe?
• Are more permeable highway layouts, e.g. grids, associated with higher levels of casualties than spine and cul-de-sac layouts?
©Association for European Transport and contributors 2006

• Are junctions without signed priority acceptably safe in terms of casualties? Is there evidence that they cause drivers to adapt their behaviour?
• Does there appear to be a relationship between design/environmental quality and driver behaviour?
The evidence that has been compiled to answer these questions highlights that design standards can be significantly changed without compromising safety whilst enabling more people-friendly street designs.
2 SPEEDS AND GEOMETRY DATA The document DB32 is used to assist in designing new housing developments. It was created to remove the restrictive criteria imposed in the post-war period that resulted in a high degree of conformity between estates within the UK. Its purpose is to permit a more flexible approach to design that enables developments to be better tailored to the requirements of residents, for example home zones in which a variety of techniques (speed reductions and surface treatments) are used to create a greater impression of shared space. However, a number of requirements are included to ensure safety of pedestrians and road users within the estate. These include minimum sight distances in order that vehicles travelling at a design speed are able to react to a danger and safely stop. The sight distances are specified for an observer’s eye being between 1.05 and 2 metres above ground level and in the case of a junction, the car being 4.5 metres from the stop line. The required visibility distances are summarised in Table 1 and Figure 1.
Table 1: DB32 Visibility (Y) Distances for Different Design Speeds Speed (mph)
5 10 15 20 25 30
Speed (kph)
8 16 24 32 40 48
Distance (metres)
6 14 23 33 45 60
©Association for European Transport and contributors 2006

0
10
20
30
40
50
60
70
0 5 10 15 20 25 30 35
Speed (mph)
Y D
ista
nce
(met
res)
Figure 1: DB32 Visibility (Y) Distances for Different Design Speeds
However, according to “Places Streets and Movement: A Companion Guide To Design Bulletin 32, Residential Roads and Footpaths” these should be extended to 45m in a 20mph zone and 90m in a 30 mph zone to allow for drivers exceeding the speed limit by up to 10 kph. Also the Y distance (see Figure 2 and Table 2) should be measured for vehicles at the following distances from the stop line on the minor arm of the junction:
9.0m: The normal requirement for major new junctions and for the improvement of existing junctions between access roads and district or local distributor roads - for instances where the minor road is busy
•
• •
•
4.5m: For less busy minor roads and busy private access points. 2.4m: The minimum necessary for junctions within development to enable
a driver who has stopped at a junction to see down the major road without encroaching onto it.
2.0m: For single dwellings or small groups of up to half a dozen dwellings or thereabouts.
©Association for European Transport and contributors 2006

Figure 2: X and Y Distances (DMRB, 1999)
Table 2: Companion Guide Y-distances Speed (mph) 20 30 40 50 60 70Speed (kph) 32 48 64 80 97 113Distance (metres) allowing speeding
45 90 120 160 215 295
Distance (metres) 33 60 120 160 215 295 Consequently, consider a residential area with a 30 mph limit. A driver on a minor road approaching a junction should be able to see vehicles at a distance of 60 to 90 metres from the junction on the major road depending on whether the drivers on the major road remain within the speed limit. Further, they should have this field of view for a distance of 4.5 metres before the junction if showing caution, or 2.4 metres if they are stopping at the junction.
©Association for European Transport and contributors 2006

These calculations assume a design speed and the standard stopping model of a driver when presented with a danger: i.e. permitting a reaction time and then assuming the driver will apply a constant braking force. However, if site lines are reduced below the recommendation in these guidelines, do drivers react to the lack of visibility? If drivers reduce their speed when encountering reduced lines of sight and therefore increased danger, this could, in effect, result in the site being as safe as one with greater lines of sight. A major aspect of the research for the Manual for Streets was to collect data on the speeds of drivers at 20 sites throughout the country with a range of visibilities at junctions (Y distances) and on links. Driver speeds were used as an indicator of safety. The sites also varied in relation to:
Road width • • • • •
• •
• •
• •
Whether speed humps were present Whether parking was permitted Whether lines were present to indicate priorities The type of road surfacing used.
Initial work was performed to assess the site characteristics and visibilities at a wide range of potential features within the 20 sites: a feature being either a link or junction within the site. Information on their geometry (e.g. road width and sight distances), together with information on the marked priorities and other non-geometric factors (see above) that could influence speed, was recorded at each. In total, information was collected for:
190 junctions and 77 links.
A speed gun was used to record individual vehicle approach speeds. These observations were collated into an analysable form for:
57 junctions and 23 links
Also, automatic traffic counters (ATCs) were installed for one week on:
18 links The approach to 10 junctions
The speed gun survey provided a snapshot of the approach speeds of drivers across a wide range of different junctions and links, and therefore a wide range of geometries. In contrast, the ATC data was restricted to a smaller number of features, and therefore geometries, but gave a highly robust picture of the approach speeds used. The purpose of this section is to examine how the speeds varied across the features studied and identify the characteristics that influenced those speeds.
©Association for European Transport and contributors 2006

2.1 Site Ranges A general understanding of the effect of road layout, and the resulting visibilities, on drivers’ speeds can only be achieved if a wide range of different site conditions are studied. The selected 20 sites were consequently chosen to be representative of developments throughout the country. In terms of the type of sites studied there were (see Table 3):
6 historic sites • • • •
10 sites also used as good practice case studies 2 new build sites conforming to CABE good practice guidelines 2 sites conforming to DB32 specifications
Table 3: Summary of research sites
1 Reading New Town South East Urban Victorian Mixed High Grid2 Lavenham Suffolk South East Rural Medieval Residential Low Organic3 Oxford Jericho South East Urban Victorian Residential High Grid4 Bloxham Village Oxfordshire South East Rural Victorian Residential Low Organic5 Chichester West Sussex South East Urban Medieval Mixed High Organic6 London Belgravia South East Urban Victorian Mixed High Grid7 Charlton Down West Dorset South West Rural Post 90s & historicResidential High Organic8 Lichfield Darwin Park West Midlands Urban Post 90s Residential High Organic9 Eastleigh Former Pirelli Site South East Urban Post 90s Residential High Atypical grid
10 Newhall East Harlow East of EnglandSuburban Post 90s Residential High Organic11 Guildford Queen's Park South East Urban Post 90s Residential Mid Organic12 London Tower Hamlets South East Urban Post 90s Residential High Grid13 Glasgow Crown St Scotland Urban Post 90s Residential High Organic14 Chelmsford Windley Tye East of EnglandSuburban Post 90s Residential Low Court layout15 Chelmsford Beaulieu Park East of EnglandUrban Post 90s Residential Mid Atypical grid16 Manchester Hulme North West Urban 1990s Residential Low Grid17 New build Ipswich Rapier St South East Suburban Post 90s Residential High Atypical grid18 Portishead Port Marine South West Suburban Post 90s Residential Mid Organic19 Leicester Syston East Midlands Urban 1980> Residential Mid Cul-de-Sac with spine20 Reading Lower Earley South East Urban 1980> Residential Mid Cul-de-Sac with spine
Historic (pre-war)
Case study
DB32 Compliant
Road surfacing within the sites varied from tarmac (12 sites), through to a mixture of tarmac and block paving (3 sites) to wide-scale use of block paving (5 sites). Half the sites had no speed restricting measures present (e.g. road humps or horizontal deflections), whilst some were present in the others. The extent of on-street parking also varied across the sites with 7 sites having no parking near to junctions in evidence during the site visits, with some vehicles parked close to the junctions at other sites. Road widths (excluding footways) generally varied from 4 to 10 metres across the studied sites. Also, visibilities on links, and at junctions, varied from below 10 metres to approximately 100 metres. The sites can therefore be considered to be representative of the majority of situations occurring within developments within the UK. The following sections consider the effect of the forward visibility on links (and the visibility at junctions) and other relevant influencing factors on speed. The sites provide a good variation in factors that would be expected to influence speeds, such as geometries, parking, signing and speed reduction methods, as illustrated by Figures 3 and 4.
©Association for European Transport and contributors 2006

80.070.060.050.040.030.020.010.0
Measured Forward Visibility
70.00
60.00
50.00
40.00
30.00
20.00
10.00
Obs
erve
d Sp
eed
(km
/h)
Site 85th PercentileSite MeanOtherHistoricDB32 Compliant
Type Of Site
3 SPE It is proon the observethe anathe diffe
Figure 3: Speed Loop Data for Links (By Site Type)
80.070.060.050.040.030.020.010.0
Measured Forward Visibility
70.00
60.00
50.00
40.00
30.00
20.00
10.00
Obs
erve
d Sp
eed
(km
/h)
LichfieldManchesterLeicesterPortisheadBloxhamBeaulieuWindley TyeLavenhamIpswichTower HamletsEastleighChichesterNew Town, ReadingGuildfordLower Earley
Site Number
ED AD
bable throad. Ind averalysis warences
Figure 4: Speed Loop Data for Links
APTATION
at drivers adapt their speed according to the perceived danger itial investigation in the previous sections supports this as the ge speed on a link increased with forward visibility. The aim of s therefore to find significant trends in speeds explainable by between the junction and link layouts.
©Association for European Transport and contributors 2006

Speed is an indicator of safety on a road. If the average speed is lower, then the road is generally safer. There are two effects that make the road safer. First, the stopping distance of vehicles is less with reduced speed and therefore the probability that a driver will be able to stop and avoid an accident is higher. Second, should an accident occur, its severity could be less owing to the reduced impact speed. Reductions occurring through non-geometric treatments (including the type of road surface, speed humps and signing) would be expected to increase safety compared with a similar road without the same measures. However, the situation is more complicated with respect to geometric differences where lines of sight are affected. On the one hand drivers may reduce their speeds owing to the perceived danger, but there is an increase in danger through drivers being unable to see hazards until they are closer to them. These two effects may counteract each other. So, this research considers whether any observed speed reductions are sufficient for a link, or junction, with limited visibility to be as safe as one with good visibility.
3.1 Link Speeds Drivers within a development generally negotiate a number of links and junctions during their journey. They would be expected to have a highly variable driving pattern as they can be stationary at junctions, and possibly on links, to give way to other traffic. They would be expected to adapt their speed to perceived dangers such as parking and horizontal deflections that reduce their forward visibility. However, they will probably try to maintain the maximum speed to minimise their journey time. Higher speeds would be expected on links, as vehicles would not be expected to show the same caution as at junctions. Therefore lines of sight are important on links because, if lines of sight are reduced, and speeds are high, an unexpected occurrence such as a pedestrian stepping into the road is more likely to result in a serious accident. Two regression models were fitted to the available data. One was fitted to the manual speed data from 23 links and the other was fitted to the ATC data from 18 links. The results of the models are shown in Figures 5 and 6 respectively, and in Table 4.
©Association for European Transport and contributors 2006

05
1015202530354045
0 20 40 60 80 100 120
Forward Visibility (m)
Spe
ed (m
ph)
Road Width = 5 mRoad Width = 6 mRoad Width = 7 mRoad Width = 8 mRoad Width = 9 mRoad Width = 10 m
Figure 5: Link Model – Manual Speeds with Average Site Features
0
5
10
15
20
25
30
35
40
0 20 40 60 80 100 120
Forward Visibility (m)
Spee
d (m
ph)
Road Width = 5 mRoad Width = 6 mRoad Width = 7 mRoad Width = 8 mRoad Width = 9 mRoad Width = 10 m
Figure 6: Link Model – ATC Speeds
Table 4: Predicted changes across roads with 5 metre widths and
forward visibilities between 5 and 110 metres
Decrease (mph) No Parking to
Parking On Both Sides Of Link
Tarmac to Block Paving
Link Model
Minimum Maximum Minimum MaximumManual Speeds with Average Site Features 2.8 4.8 2.5 4.4
ATC Speeds 1.5 3.5 1.3 3.2 The regressions explained only between 20 and 22% of the total variation in the data. However, all the variables were significant at the 95% confidence level.
©Association for European Transport and contributors 2006

The models imply that either permitting parking on a link, or the use of block paving, can reduce link speeds by 2 to 5 mph which could improve safety, though there are clearly issues with pedestrians being obscured by parked vehicles. Similarly, reducing road width also has the effect of reducing vehicle speeds on the link. However, the two models featured in Figures 5 and 6 disagree about the extent of the reduction. The manual speed data (Figure 5) implies that a reduction in road width from 10 to 5 metres could reduce the link speeds by between 9 to 20 mph, depending on the forward visibility on the link. In contrast, the ATC data (Figure 6) implies the reduction is between 2 and 4 mph. It is the conservative estimate from the ATC data that is most likely to be accurate given that the analysis included more observations than the manual speed observations. Both models agree that drivers do adapt their speed according to the forward visibility on the link. According to the model based on the ATC data, drivers reduce their speeds by approximately 20 mph if the forward visibility on the link is reduced from 110 to 20 metres.
3.2 Junction Speeds Approach speeds at junctions are generally less than link speeds, as drivers slow and show caution on the approach, in case they need to give way to another driver with priority. The requirement to assess a number of factors during the approach both heightens awareness and also increases workload on the driver. Overall there appeared to be more accidents on the sites at junctions than on links: 110 accidents at 187 junctions compared with 21 accidents on 74 links. Hence reducing speeds and accidents at junctions is clearly important. Information was available on the visibility (Y distance) at each junction for a vehicle positioned at 2, 4.5 and 9 metres before the junction. Initial tests considered which visibility was the best predictor for the observed approach speeds. This modelling indicated that the visibility at 4.5 metres should be used within the regression modelling. Regression models were formed on both the manually collected speed data and on the ATC data. In addition, whilst the ATC data recorded the speeds of all approaching vehicles, the manual data also classified the vehicles as to whether they turned at the junction. Therefore a separate model was also formed for all vehicles that did not turn at the junction for this data set. A summary of the models is shown in Figures 7 to 9 and Table 5.
©Association for European Transport and contributors 2006

0
5
10
15
20
25
30
0 20 40 60 80 100 120
Y Distance (m)
Spee
d (m
ph)
Road Width = 5 mRoad Width = 6 mRoad Width = 7 mRoad Width = 8 mRoad Width = 9 mRoad Width = 10 m
Figure 7: Junction Model – Manual Speeds with Average Site Features
(All Vehicles)
0
5
10
15
20
25
30
0 20 40 60 80 100 120
Y Distance (m)
Spee
d (m
ph)
Road Width = 5 mRoad Width = 6 mRoad Width = 7 mRoad Width = 8 mRoad Width = 9 mRoad Width = 10 m
Figure 8: Junction Model – Manual Speeds with Average Site Features
(Non-Turners Only)
05
1015202530354045
0 20 40 60 80 100 120
Y Distance (m)
Spee
d (m
ph)
Road Width = 5 mRoad Width = 6 mRoad Width = 7 mRoad Width = 8 mRoad Width = 9 mRoad Width = 10 m
Figure 9: Junction Model – ATC Speeds
©Association for European Transport and contributors 2006
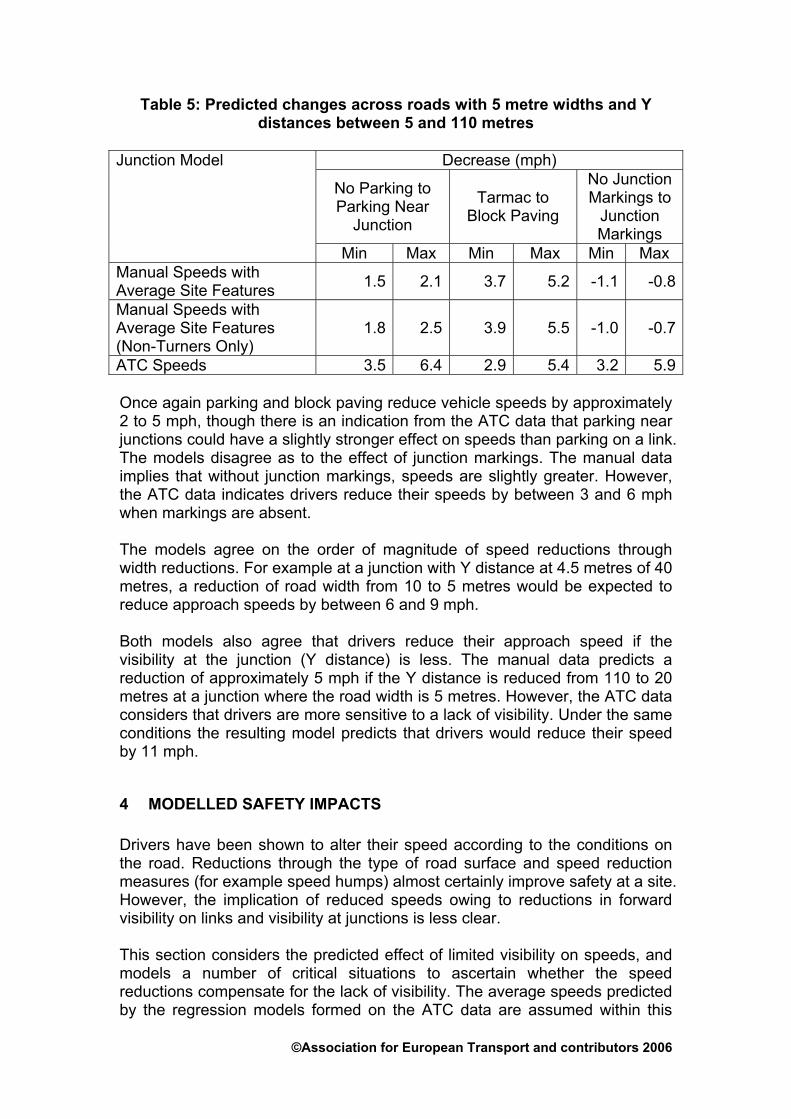
Table 5: Predicted changes across roads with 5 metre widths and Y distances between 5 and 110 metres
Decrease (mph)
No Parking to Parking Near
Junction
Tarmac to Block Paving
No Junction Markings to
Junction Markings
Junction Model
Min Max Min Max Min Max Manual Speeds with Average Site Features 1.5 2.1 3.7 5.2 -1.1 -0.8
Manual Speeds with Average Site Features (Non-Turners Only)
1.8 2.5 3.9 5.5 -1.0 -0.7
ATC Speeds 3.5 6.4 2.9 5.4 3.2 5.9 Once again parking and block paving reduce vehicle speeds by approximately 2 to 5 mph, though there is an indication from the ATC data that parking near junctions could have a slightly stronger effect on speeds than parking on a link. The models disagree as to the effect of junction markings. The manual data implies that without junction markings, speeds are slightly greater. However, the ATC data indicates drivers reduce their speeds by between 3 and 6 mph when markings are absent. The models agree on the order of magnitude of speed reductions through width reductions. For example at a junction with Y distance at 4.5 metres of 40 metres, a reduction of road width from 10 to 5 metres would be expected to reduce approach speeds by between 6 and 9 mph. Both models also agree that drivers reduce their approach speed if the visibility at the junction (Y distance) is less. The manual data predicts a reduction of approximately 5 mph if the Y distance is reduced from 110 to 20 metres at a junction where the road width is 5 metres. However, the ATC data considers that drivers are more sensitive to a lack of visibility. Under the same conditions the resulting model predicts that drivers would reduce their speed by 11 mph.
4 MODELLED SAFETY IMPACTS Drivers have been shown to alter their speed according to the conditions on the road. Reductions through the type of road surface and speed reduction measures (for example speed humps) almost certainly improve safety at a site. However, the implication of reduced speeds owing to reductions in forward visibility on links and visibility at junctions is less clear. This section considers the predicted effect of limited visibility on speeds, and models a number of critical situations to ascertain whether the speed reductions compensate for the lack of visibility. The average speeds predicted by the regression models formed on the ATC data are assumed within this
©Association for European Transport and contributors 2006

modelling as they are based upon the largest dataset, and the predictions are in approximate agreement with those formed on the manually collected data.
4.1 Braking Modelling It is possible to model relative safety of the schemes by considering the ability of the drivers to stop under different conditions. In order to create these braking models the following has been assumed:
The average reaction time of a driver is 1.4 seconds when stopping • • The average deceleration rate of drivers stopping is 4.5 m/s-2
4.2 Stopping Distances on Links A range of links have been examined in which the forward visibility generally varied from less than 10 metres to approximately 100 metres. It was found that the average speed of drivers reduced with forward visibility. In addition, block paving and parking on the link were found to affect speeds. To remove this complication, within this modelling it is assumed that the link has a tarmac surface and no parking is permitted on the link. Furthermore, it was found that link width also influences speeds. It is therefore assumed that the link is either 5 or 9 metres wide, i.e. a narrow or wide road. The situation considered is if an event occurs, for example a pedestrian stepping into the road at the limit of the driver’s forward visibility. It is assumed that the driver will react as fast as possible and apply a fairly high average deceleration to stop their vehicle. The distance required to stop is compared with the distance available for road widths of 5 and 9 metres in Figures 10 and 11 respectively. Further, the distance required to stop, assuming drivers had not altered their speeds owing to the reduced forward visibility, is included for reference in Table 6.
0
20
40
60
80
100
120
0 20 40 60 80 100 120
Forward Visibility (metres)
Tota
l Sto
ppin
g D
ista
nce
(met
res)
Total Stopping Distance (m)Stopping Distance If Speeds Not Altered (m)Available Distance (m)
Figure 10: Modelled Stopping Distances on a Link of Width 5 metres
©Association for European Transport and contributors 2006

0
20
40
60
80
100
120
0 20 40 60 80 100 120
Forward Visibility (metres)
Tota
l Sto
ppin
g D
ista
nce
(met
res)
Total Stopping Distance (m)Stopping Distance If Speeds Not Altered (m)Available Distance (m)
Figure 11: Modelled Stopping Distances on a Link of Width 9 metres
Table 6: Modelled Stopping Distances for Links of Varying Width
Forward Visibility
(m)
Road Width (m)
Stopping Distance If Speeds Not Altered
(m)
Estimated Stopping
Distance (m)
Distance Remaining
(m) 5 41.1 13.2 6.87 44.0 14.1 5.920 9 47.1 14.9 5.15 41.1 16.8 23.27 44.0 17.9 22.140 9 47.1 19.0 21.05 41.1 21.5 38.57 44.0 22.9 37.160 9 47.1 24.4 35.65 41.1 27.7 52.37 44.0 29.6 50.480 9 47.1 31.6 48.45 41.1 35.9 64.17 44.0 38.4 61.6100 9 47.1 41.1 58.9
Initially, consider the situation where drivers do not adapt their speeds as forward visibility reduces, i.e. that they do not perceive limited visibility as a danger and react to it. Then the model (based on actual forward visibility and driver speed) predicts that a collision would occur if visibility was less than 40 to 50 metres, depending on the width of the road. According to the regression modelling, drivers adapted their speeds. However, the reduction does not fully compensate for the reduction in forward visibility. In other words, the margin for error is reduced as visibility reduces. For example, with a forward visibility of 100 metres, should a pedestrian appear at the limit of their vision a driver is modelled as being able to stop with
©Association for European Transport and contributors 2006

approximately 60 metres to spare. However, the model predicts that the driver would be able to stop with just over 20 metres to spare under the same conditions if the forward visibility was 40 metres. This reduces to only 5 metres to spare with a forward visibility of 20 metres. Given the driver behaviour observed and the modelling assumptions, it would be expected that schemes in which forward visibility is less than 40 metres could be reasonably safe for average drivers under these conditions owing to the reduction in drivers’ approach speed. However, the margin for error decreases continually with forward visibility, and arguably, links with forward visibility of less than 20 metres are relatively unsafe.
4.3 Stopping Distances at Junctions The Y-distance (pictured in Figure 2) is the point at which an approaching driver on a minor road shall be able to clearly see points to the left and right on the nearer edge of the major road, measured from its intersection with the centreline. A range of junctions have been examined in which the Y-distance generally varied from less than 10 metres to approximately 100 metres. It was found that the average speed of drivers reduced with Y distance. Also, block paving, parking and the presence of lines to indicate priority at the junction were found to affect speeds. Within this modelling it is assumed that the junction has a tarmac surface, there is no parking at the junctions and no lines to indicate priority. The situation considered is when two vehicles approach a junction. The first vehicle is on a minor arm of the junction and so is assumed to show caution. It therefore decreases speed from its modelled (regression) approach speed to 5 mph over the 50 metres before the junction. The other vehicle has priority and will approach at the modelled approach speed. Modelling has been used to consider the effect of the first vehicle seeing the second vehicle on its approach. It considers the distance before the stop line at which it needs to see the vehicle in order that the driver can react (taking 1.4 seconds) and then apply a higher deceleration (4.5 m/s-2) and be stationary at the stop line. These have been calculated using standard equations of motion, allowing for changes in speed due to reduced visibility (shown in Figure 12).
©Association for European Transport and contributors 2006
0
1
2
3
4
5
6
7
0 20 40 60 80 100 12
Y Distance (metres)
Dist
ance
from
sto
p lin
e (m
etre
s)
0
Figure 12: Distance at which first vehicle must see second vehicle in
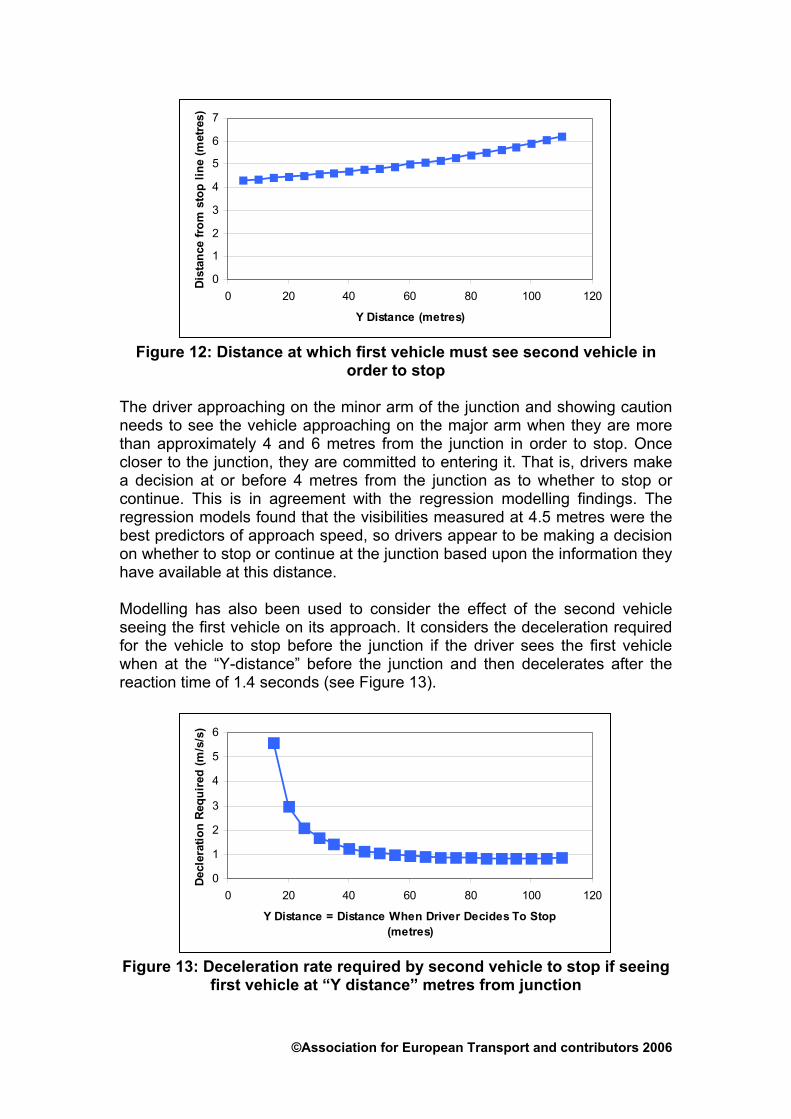
order to stop The driver approaching on the minor arm of the junction and showing caution needs to see the vehicle approaching on the major arm when they are more than approximately 4 and 6 metres from the junction in order to stop. Once closer to the junction, they are committed to entering it. That is, drivers make a decision at or before 4 metres from the junction as to whether to stop or continue. This is in agreement with the regression modelling findings. The regression models found that the visibilities measured at 4.5 metres were the best predictors of approach speed, so drivers appear to be making a decision on whether to stop or continue at the junction based upon the information they have available at this distance. Modelling has also been used to consider the effect of the second vehicle seeing the first vehicle on its approach. It considers the deceleration required for the vehicle to stop before the junction if the driver sees the first vehicle when at the “Y-distance” before the junction and then decelerates after the reaction time of 1.4 seconds (see Figure 13).
0
1
2
3
4
5
6
0 20 40 60 80 100 12
Y Distance = Distance When Driver Decides To Stop (metres)
Decl
erat
ion
Requ
ired
(m/s
/s)
0
Figure 13: Deceleration rate required by second vehicle to stop if seeing
first vehicle at “Y distance” metres from junction
©Association for European Transport and contributors 2006

If the visibility at the junction is greater than 40 metres a driver should easily be able to stop. Drivers have been shown to reduce their approach speed as the Y-distance reduces. However, it is insufficient to fully compensate for the potential reduced stopping distance available. The predicted reduction in approach speed results in drivers being able to stop using reasonable deceleration rates (less than 4.5 ms-2) under the modelled conditions if the Y-distance is between 20 and 40 metres. Below 20 metres the model implies it is unlikely that the driver will be able to stop before the junction, and an accident would be more likely.
4.4 Implications of Modelled Situations Table 7 indicates the relative safety of forward visibility and Y-distances for vehicles travelling at 30 mph, based on DB32 guidelines, the Places, Streets and Movement Companion Guide and the modelling undertaken as part of this research (based on actual geometric measurements and speed data).
Table 7: Comparing design standards
Forward visibility (m) Y-distance (m)
DB32 - 45-60 Companion - 90 Green (safe) Modelling >40 >40
Amber (caution) Modelling 20-40 20-40 Red (do not use) Modelling <20 <20 Table 7 indicates that Y-distances between 20 and 40 metres, and slightly below the recommended values may be possible, but caution needs to be shown as the percentage of drivers approaching at speeds that require large decelerations if a conflict occurs quickly increases. Below Y-distances of 20 metres, the modelling indicates that the reduction in speed observed amongst drivers is insufficient for the junction to be safe.
5 CONCLUSION In conclusion, the indicative results from the primary research undertaken to establish the evidence base for the Manual for Streets can be summarised as follows: • Visibility on links (stopping sight distance) and at junctions (Y-distance)
can be reduced from existing recommended standards in DB32 • Reduced visibility is correlated with lower vehicle speeds • Flexibility in geometric design can therefore be considered Road safety can be explored by observing behaviour and analysing trends in accident statistics. An investigation into observed behaviour showed that
©Association for European Transport and contributors 2006
©Association for European Transport and contributors 2006
drivers adapted their speed on links where forward visibility was low and in response to road width and other speed limiting factors. The same was also seen at junctions where visibility (the Y-distance) was small. Analysis of observed behaviour and road safety is currently in progress. A full analysis of the primary research data, including a literature review, analysis of observed safety, resident attitudes survey, review of junction spacing, and house frontages will be available in a published report along with the Manual for Streets, in early 2007. See www.manualforstreets.org.uk for more details.
References DMRB (1999). Design Manual for Roads and Bridges, Volume 6, Section 2, Part 6, TD 42/95, The Stationery Office, London ODPM (1998). Places, Streets and Movement: a Companion Guide to Design Bulletin 32, Office of the Deputy Prime Minister, London ODPM (2003). Sustainable Communities: Building for the Future, Office of the Deputy Prime Minister, London
1 The authors would like to acknowledge Louise Marsh, Ross Paradise and Tom Ewings who undertook the fieldwork and analysis of this research.