the lower stanislaus river - university of the pacific river a major tributary to the san joaquin...
TRANSCRIPT

The Lower Stanislaus River
Joseph E. Merz, Ph.D.Principal Scientist in Restoration Ecology

Lower Stanislaus River Discussion
• Watershed Context• Resources• Land use• Flow regulation• Sediment• Mining issues• Salmon resources
– Spawning– Emigration
• Water quality• Public Access• Questions

Stanislaus RiverA major tributary to the San Joaquin River, flows southwest from the Sierra Nevada range to its confluence with the San Joaquin River near the southern end of the Sacramento-San Joaquin Delta. •Drainage area ~ 600,000 acres •~ 40% of basin above snowline (Kondolf et al. 2001). •It is about 60 miles from the base of Goodwin Dam to the mouth of the Stanislaus.

A multiple use resource
• Flood Protection• Hydro‐power• Municipal Water• Irrigation Water• Delta water quality• Agricultural• Recreation• Residential• Ecosystem Services• Aesthetic • Cultural

Table 2. Land cover in the Stanislaus River basin from USFWS 1995.
Habitat Type Foothill Reach (ac) Valley Reach (ac)
Riparian 326.17 2,255.56
Wetland 6.35 1.08
Riverine 77.36 538.43
Gray Pine-Oak Woodland 55.85 1.40
Grassland 282.46 473.38
Rockland 31.31 0.00
Agriculture 230.80 3,924.19
Disturbed 225.24 500.46
Urban 126.44 696.19
Total 1,361.98 8,390.69
The lower Stanislaus River has been extensively developed to provide water, flood control, hydroelectric power, gravel, and conversion of floodplain habitat for agricultural and residential uses.
The lower watershed consists of ~86,400 acres.
As of 1995: • 61% in agricultural production
• 34% urban development and• 5% undeveloped

Flow Regulation• Natural hydrologic processes have been
altered on the Stanislaus, as they have been on most California rivers. More than 40 dams exist on the Stanislaus River.
• Collectively, these dams can store 240% of the average annual basin runoff. Approximately 85% of total storage capacity is in New Melones Reservoir (Schneider et al. 2003).
• Dams control the Stanislaus River for flood protection, power generation, irrigation and municipal water. This regulation reduces winter floods and spring snow melt runoff, and increases summer base flows to supply irrigation demand.
• New Melones Reservoir is operated to store water during the winter and spring and release it during the summer (San Joaquin River Group Authority 1999).
• Average monthly unimpaired flows at New Melones Dam are ~ 96,000 acre‐feet. These flows are reduced to ~57,000 acre‐feet near the confluence with the San Joaquin River due to flow diversion and regulation at Goodwin Dam.

What does river regulation do?
05000
10000150002000025000300003500040000450005000055000600006500070000
1938
1941
1944
1947
1950
1953
1956
1959
1962
1965
1968
1971
1974
1977
1980
1983
1986
1989
1992
1995
1998
2001
2004
Year
Flow
(CFS
)
05000
10000150002000025000300003500040000450005000055000600006500070000
1938
1941
1944
1947
1950
1953
1956
1959
1962
1965
1968
1971
1974
1977
1980
1983
1986
1989
1992
1995
1998
2001
2004
Year
Flow
(CFS
)
Stanislaus River Dam Construction•Goodwin 1913/1949•Melones 1926•Tulloch 1958•New Melones 1966 -1979

Regulation interrupts habitat maintenance

Table 1. Estimated amount of mined habitat in several different reaches of the lower Stanislaus River based on an evaluation of the 1972 CDFG riffle maps and spawning surveys in 1994 and 1995.
Reach
Percentage Mined
Spawning Riffles/Mile in
1972
Upper Goodwin Canyon, RM 58.5 to 56.0 0.04% 3.6
Knights Ferry, RM 54.7 to 53.5 0.0% 7.5
Lovers Leap, RM 53.5 to 51.6 97.0% 2.6
Below Willms Pond, RM 51.6 to 51.1 0.0% 12.0
Horseshoe Road, RM 51.1 to 49.75 97.5% 2.2
Honolulu Bar, RM 49.75 to 48.5 0.0% 7.2
Above Orange Blossom, RM 58.5 to 47.4 98.2% 0.9
Below Orange Blossom, RM 47.4 to 44.9 0.0% 6.8
Total: 13.15 miles 39.3% --
Sediment budget• Kondolf et al. (2001)
estimate a minimum of 1,031,800 yards3 of gravel were extracted from the active channel and an additional 5,292,500 yards3 were extracted from the floodplain between Goodwin Dam and Oakdale from 1939 to 1999 based on a reconnaissance‐level assessment.
• The total amount of gravel extracted is estimated to be 600% of the amount naturally supplied from the watershed between 1939 and 1999, which is about 1,033,900 yards3.

Potential mining pit problems• Captured mine pits trap bedload
sediment, store large volumes of sand and silt, and pass sediment‐starved water downstream to erode the channel (Kondolf et al. 2001).
• May cause bed erosion elongating pits both up and downstream.
• Dredged channels and pits reduce flow turbulence and thereby potentially reduce dissolved oxygen concentrations.
• Reduced dissolved oxygen may contribute to mortality of juvenile and adult salmonids when water temperatures are unsuitably warm in late spring and early fall.
• Mine pits also provide suitable habitat for predator species, such as striped bass.
• Concentrations of predator species in slow, flowing ditches that lack cover may also result in high rates of juvenile mortality.

Photo courtesy of JD Richey
Although gravel has been added by the CDFG, BOR and AFRP to several sites in Goodwin Canyon since 1997 and to 20 sites between Two-Mile Bar and Oakdale in 1998 (CMC 2002a), the amount of gravel added to the river is less than 1% of the estimated 1,031,800 yards3 of gravel that were excavated from the active channel between 1939 and 1999 (Kondolf et al. 2001).
Spawning Gravel
0
20,000
40,000
60,000
80,000
100,00019
52
1954
1956
1958
1960
1962
1964
1966
1968
1970
1972
1974
1976
1978
1980
1982
1984
1986
1988
1990
1992
1994
1996
1998
2000
2002
2004
2006
2008
2010
Production (natural production of fall-run forthe Stanislaus River)Adult escapement (Grand Tab)
Baseline (Mills and Fisher)
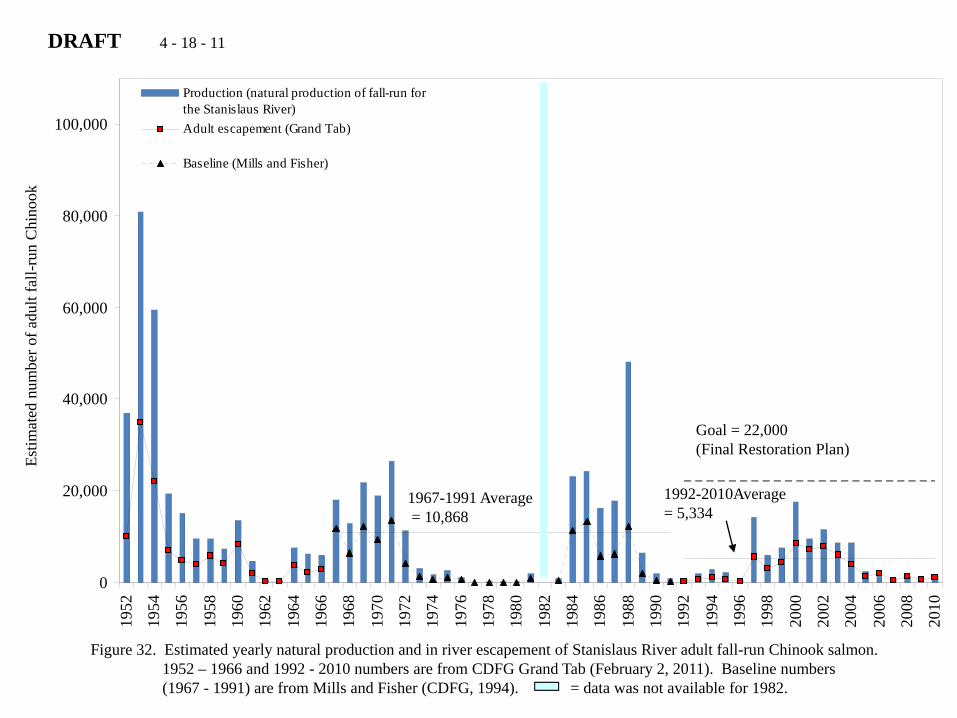
Figure 32. Estimated yearly natural production and in river escapement of Stanislaus River adult fall-run Chinook salmon. 1952 – 1966 and 1992 - 2010 numbers are from CDFG Grand Tab (February 2, 2011). Baseline numbers (1967 - 1991) are from Mills and Fisher (CDFG, 1994). = data was not available for 1982.
1967-1991 Average= 10,868
1992-2010Average= 5,334
DRAFTEs
timat
ed n
umbe
r of a
dult
fall-
run
Chi
nook
Goal = 22,000 (Final Restoration Plan)
4 - 18 - 11

26%
21%
52%
1%Merced Hatchery
MokelumneHatchery
StanislausRiver
Nimbus Hatchery
48% hatchery strays52% natal homing
Natal origins of adult spawners 2000 outmigration year
Barnett‐Johnson, unpublished data

400
300
200
100
5 10 15 20 25 30 35 40 45 50 55 60
400
300
200
100
Ele
vatio
n ab
ove
mea
n se
a le
vel (
ft)
Stanislaus-San Joaquin River Confluence
Oakdale Recreational
Area
Santa Fe Rd. Bridge (Riverbank)
Caswell Memorial
Park McHenry Ave.BridgeHwy 99
Bridge Hwy 20 Bridge
(Oakdale)
Kerr Park
Orange Blossom Bridge
Honolulu Bar
Lover’s Leap
Covered Bridge
(Knights Ferry)
Two Mile Bar
Goodwin Dam
Distance in River Miles
Caswell Screwtrap
Oakdale Screwtrap
Juvenile Chinook migration monitoring performed at Oakdale and Caswell.
Rotary screwtraps used to capture migrating juvenile salmonids

2011 Size and Lifestage Distributions To‐Date
25
35
45
55
65
75
85
95
105
115
125
135
145
Fork
Len
gth
(mm
)
Date
Size/Life Stage Distributions
Fry Parr Smolt Yearling

0%
20%
40%
60%
80%
100%
0
1,000
2,000
3,000
4,000
5,000
6,000
7,000
8,000
1996 1997 1998 1999 2000 2001 2002 2003 2004 2005 2006 2007 2008 2009
Surv
ival E
stim
ate
Tota
l Pas
sage
Est
imat
e (th
ousa
nds)
Year
Oakdale Passage
Caswell Passage
Survival Estimate
Juvenile Chinook SalmonPassage and Survival Estimates on the Stanislaus River
Annual Abundance EstimatesOakdale: 279 ---- 1259* 5434 4214 1154 1299 1701 2438 1334 --- --- --- ----Caswell: 67 89 1194 1544 2140 165 103 132 412 260 188 94 14 11
(in thousands)
* 1998 passage estimate at Oakdale is incomplete due operational conditions; survival estimate not included
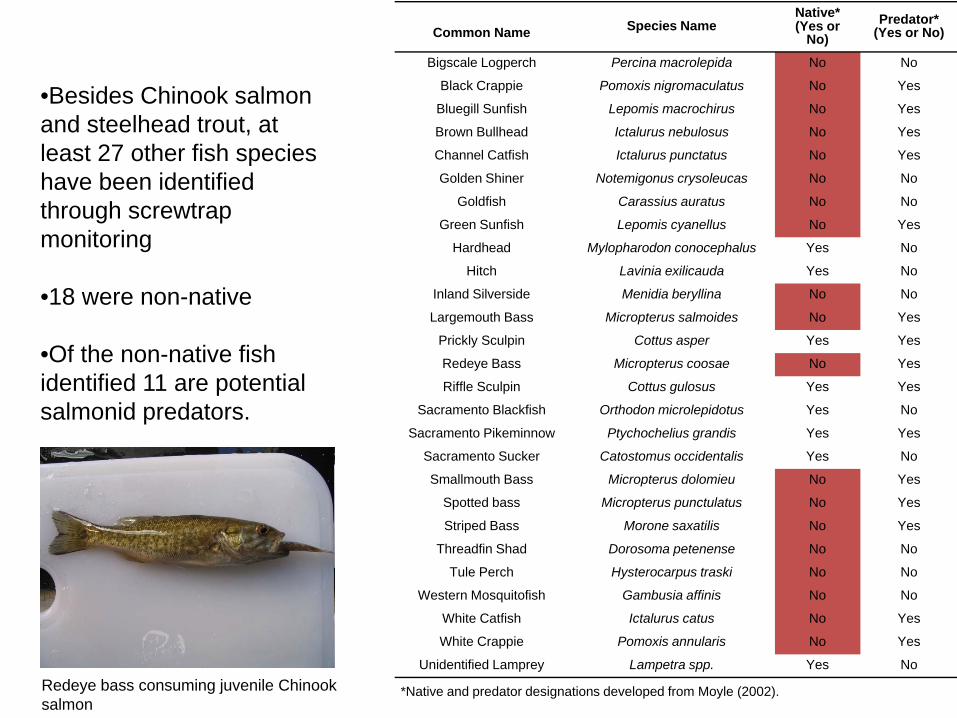
Common Name Species NameNative*(Yes or
No)Predator*
(Yes or No)
Bigscale Logperch Percina macrolepida No No
Black Crappie Pomoxis nigromaculatus No Yes
Bluegill Sunfish Lepomis macrochirus No Yes
Brown Bullhead Ictalurus nebulosus No Yes
Channel Catfish Ictalurus punctatus No Yes
Golden Shiner Notemigonus crysoleucas No No
Goldfish Carassius auratus No No
Green Sunfish Lepomis cyanellus No Yes
Hardhead Mylopharodon conocephalus Yes No
Hitch Lavinia exilicauda Yes No
Inland Silverside Menidia beryllina No No
Largemouth Bass Micropterus salmoides No Yes
Prickly Sculpin Cottus asper Yes Yes
Redeye Bass Micropterus coosae No Yes
Riffle Sculpin Cottus gulosus Yes Yes
Sacramento Blackfish Orthodon microlepidotus Yes No
Sacramento Pikeminnow Ptychochelius grandis Yes Yes
Sacramento Sucker Catostomus occidentalis Yes No
Smallmouth Bass Micropterus dolomieu No Yes
Spotted bass Micropterus punctulatus No Yes
Striped Bass Morone saxatilis No Yes
Threadfin Shad Dorosoma petenense No No
Tule Perch Hysterocarpus traski No No
Western Mosquitofish Gambusia affinis No No
White Catfish Ictalurus catus No Yes
White Crappie Pomoxis annularis No Yes
Unidentified Lamprey Lampetra spp. Yes No
*Native and predator designations developed from Moyle (2002).
•Besides Chinook salmon and steelhead trout, at least 27 other fish species have been identified through screwtrap monitoring
•18 were non-native
•Of the non-native fish identified 11 are potential salmonid predators.
Redeye bass consuming juvenile Chinook salmon

Water Quality• Stanislaus River flows during salmon migration appear to provide suitable
water depths and velocities but may not provide suitable temperatures. Preferred temperature for migration is 15°C (59°F). Recent temperatures in the lower river have been as high as 23°C (74°F) in late September which can be lethal to adult salmon. As a result, adult migration timing may be delayed for early returning spawners.
• Dissolved Oxygen ‐ Low DO levels may also inhibit or delay adult migration. While observation of DO levels generally exceed the >7 mg/l standard, the standard was not met on 43 days during the period of June 1999 through September 2005 (CDEC 2007).
• Within the lowest section of the river, water temperature and DO conditions reach lethal levels at different times of the year which further reduces the amount of available rearing habitat and may limit their ability to seasonally migrate into preferred habitat.
• DO and temperature have been issues in the Stockton Deepwater Channel during the fall migration period. Stanislaus River Chinook must migrate past this location to enter the river.

Pesticides• According to Hladik et al. (2009), the
Stanislaus River had the highest concentrations of certain insecticides and herbicides of all the tested San Joaquin Tributaries;
• Had significantly higher particulate organic carbon concentrations while having the lowest suspended sediment concentrations and low flow for the watershed size.
• Typically the Stanislaus River has low concentrations of dissolved pesticides originating from agriculture; the irrigation return flows do not appear to influence the Stanislaus River as much as some of the other San Joaquin River tributaries (Dubrovsky et al., 1998).
• The relatively high concentrations of bifenthrin, permethrin and piperonyl butoxide could be coming from the developed areas and not agriculture.

Public Information
• United States Fish and Wildlife Service– Anadromous Fish Restoration Program
• California Data Exchange Center (CDEC)
• United States Geological Service

Public Access
Sixteen (16) public access points on lower Stanislaus River between New Melones Reservoir and the confluence with the San Joaquin River. The green dots show the approximate locations of Stanislaus River Parks including: Two-Mile Bar (TMB), Knights Ferry (KF), Lovers Leap (LL), Horseshoe Road (HR), Honolulu Bar (HB), Buttonbush (BB), Orange Blossom (OB), Valley Oak (VO), Oakdale Recreational Park (OR), Riverbank (RB), Jacob Meyers (JM), McHenry Avenue (MHA), Ripon (RP), Mohler Road (MR), Caswell Memorial Park, and River’s End (RE).

Recent clean-up on 7 miles of lower river. Approximately 240 pounds of trash.
