the long-term effects of deforestation and farming...
TRANSCRIPT
The Long-term Effects of Deforestation and Farming on SoilInfiltration Rates and Soil Horizons
Allison Brigham, Natalie Havlin, Suzy King
ABSTRACT
Four locations in the Champlain Valley were studied in an attempt to determine to whatextent farming and deforestation affect soils. Three of the sites that were examined were locatedin Charlotte, VT, and the other was located in Shelburne, VT (Fig. 1). These sites with varyingreforestation ages were studied during October and November 2001. Another purpose of thestudy was to determine how long it takes for soil to return to its natural state after the land hasbeen farmed or deforested. The data that we collected at these sites supported our hypothesis thatfarming and deforestation affect the infiltration rates of soils. The data suggest that the longerthe land has gone without being farmed or deforested, the higher the infiltration rates of the soil.From oldest to youngest the infiltration rates were calculated to be 3.8 cm/min, 3.2 cm/min, 2.6cm/min, and .09 cm/min respectively. Another hypothesis concerns the rehabilitation ofdeforested soil. This hypothesis states: given enough time, soil will return to its natural state andthe soil stratigraphy will vary between the sites that have been farmed and deforested and thosethat have not. Our data also supports this hypothesis through the finding that the older the sites,have more developed the soil profiles than the younger sites. The percentage of loss on ignition(LOI), which is an indicator of organic material present in the soil layers, correlates with thelength of time that the land has been forested. The older the forest the more organic materialpresent in its soil layers. The average percent LOI of the soil layers ranged from 68% to 9%.Soil samples were also collected to determine whether or not there was a correlation between pHof soil layers and the age of the soil. The average pH measurements ranged from 4 to 7.

1
INTRODUCTION
General studies concerned with soil development suggest that over centuries, soil layers
become more distinct, horizon thickness changes, pH levels change and infiltration rates increase
(Heller, 1970). The relationship between deforestation and geologic processes in Chittenden
County, VT is an area of study by geomorphologists (Bierman, 1997). However, the long-term
effects of deforestation and farming on the infiltration rates and soil horizon in Chittenden
County have not been studied in detail. This study presents, analyzes, and discusses data that was
collected at four sites in Chittenden County.
The record of the diversity and percent of forests in Vermont dates back to the late 1700s
(Siccama, 1971). Original Champlain Valley land surveys describe a heavily forested landscape
dominated by white pine and white oak northern hardwood communities (Siccama, 1971).
However, the influx of settlers in the early 1800s introduced a pattern of deforestation that
eventually resulted in an 80% decrease in forested land (Albers, 2000). Farming and grazing
livestock was the impetus for the clearing of land in Chittenden County.
METHODOLOGY
To evaluate our hypothesis, we utilized direct sampling, historical, and geologic research.
Historical and geologic research was conducted at the University of Vermont (UVM) Bailey
Howe Library, the Charlotte Historical Society, and the UVM Environmental Program. Four
sites of varied ages with similar bedrock types, surficial materials and land-use history were
identified based on this research. Historical deforestation and farming records along with the
1974 Chittenden Soil Survey and the Vermont surficial and bedrock map (Doll 1970, 1960)
verified the different ages of the deforestation and land-use.

2
We excavated soil pits, collected samples from each soil horizon, and took GPS
measurements at each site. The organic content of each horizon was measured by the % loss-on-
ignition (LOI) process at the UVM Lake Lab. Soil horizon samples were dried for 48 hours,
weighed, and burned at 455 °C for three hours. After cooling, the remaining materials were
weighed and the LOI was calculated.
Infiltration rate was another procedure used to evaluate our hypothesis. The infiltration
rate measurements were taken by inserting a 500 ml can into the ground adjacent to the soil pit.
An initial 2cm of water was added to the soil sample in the can. Over a period of thirty minutes,
additional 2cm units of water were added when the water fully infiltrated the soil. We kept a
record of the total volume of water, the total length of water and the minutes between the
addition of water. With this data, we calculated the infiltration rate (cm/min).
The third procedure we used to evaluate our hypothesis was the measurement of the soil
pH. The color of the different layers was determined through the use of the Munsell Color Chart.
DATA AND RESULTS
WILLIAMS WOODS
Located at 18T 0639299, UTM 4903364 on Greenbush Rd., Charlotte, Williams Woods
acted as the control site, as it is considered an old growth white pine and white oak-transitional
northern hardwoods community (Poleman, 2000). Owned by the same family for 157 years,
portions of Williams Woods have never been deforested. The oldest trees here are 275-300 years
old (Moscowitch, 2000). The bedrock underlying Williams Woods is Cutting dolomite (Doll,
1961). The parent material is composed of lake bottom sediments (Doll, 1970). The predominate
soil type is Vergennes clay of the Covington association (Soil Survey of Chittenden County, VT,
1974). There are four major soil horizons at Williams Woods. Each layer has a distinct LOI, pH

3
and color (Fig. 2). The range in pH is 4 to 5 (Fig. 2.). The range of percent LOI is from 92% to
12 % (Fig. 3a.). The infiltration rate is 3.8 cm/min (Fig. 3b).
SHELBURNE POND
Shelburne Pond is located in Shelburne, VT and has a GPS coordinate of18T 0646248,
UTM 4915708. The white pine-white oak northern hardwood forest that surrounds Shelburne
Pond is 197 years old (Carlisle, 1973). Between the years 1730 and 1804, the portion of land
under observation was used for sheep pastures and farmland (Carlisle, 1973). The site bedrock is
Cutting Dolomite (Doll 1961. The soil type is the Farmington extremely rocky loam (Soil
Survey of Chittenden County, VT 1974).
There are four major soil horizons at Shelburne Pond. Each layer has a distinct LOI, pH
and color (Fig. 4, Fig. 5a). The pH ranges from 6 to 7 (Fig. 4). The LOI ranges from 3% to 22%
(Fig. 5a). The infiltration rate is 3.2 cm/min (Fig. 5b).
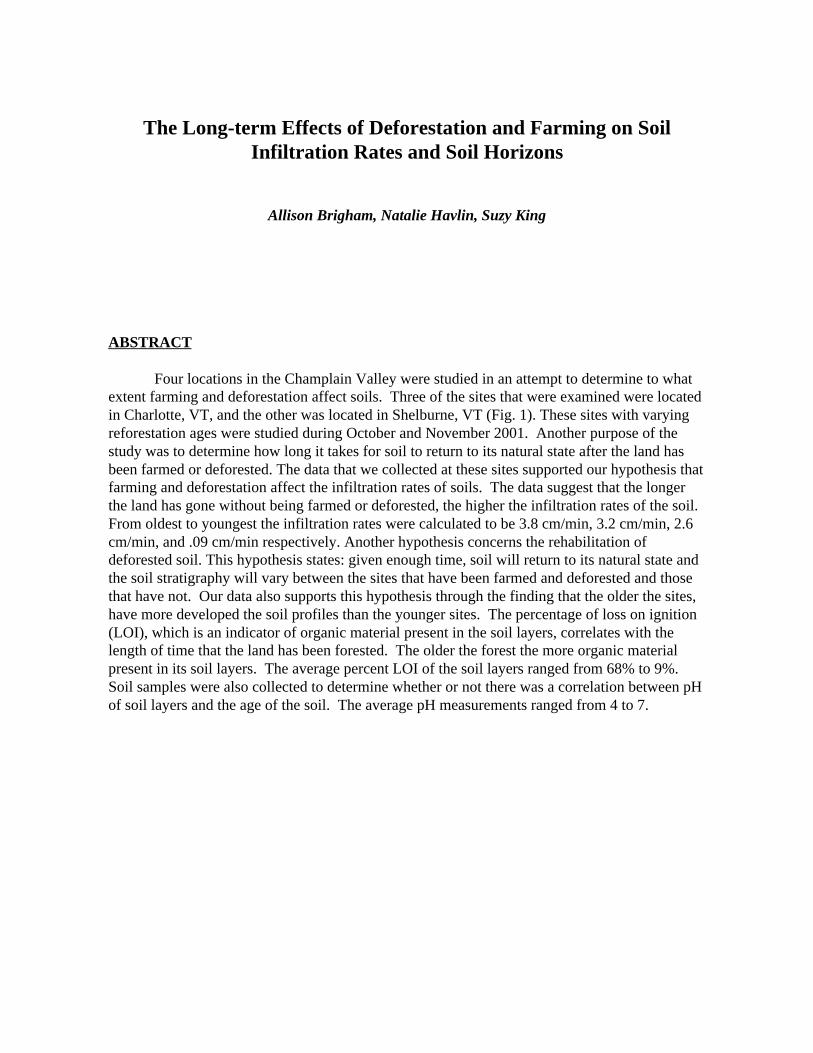
MT PHILO
Mt Philo is located on Mt Philo Road in Charlotte, Vermont. The GPS is 18T 0641874,
UTM 4904127. Last farmed in the spring/summer of 1900 (Carlisle, 1973), the base of Mt. Philo
is covered by a white pine-white oak northern hardwoods forest (Poleman, 2000). The Mt. Philo
bedrock is Stony Point Shale (Doll, 1961). The soil at the base of Mt Philo is Stockbridge and
Nellis extremely stony loams (Soil Survey of Chittenden County, Vt, 1974).
There are five major soil horizons at Mt. Philo. Each layer has a distinct LOI, pH and
color (Fig. 6). The pH ranges from 7 to 8 (Fig. 6). The %LOI ranges from 2% to 16% (Fig. 7a).
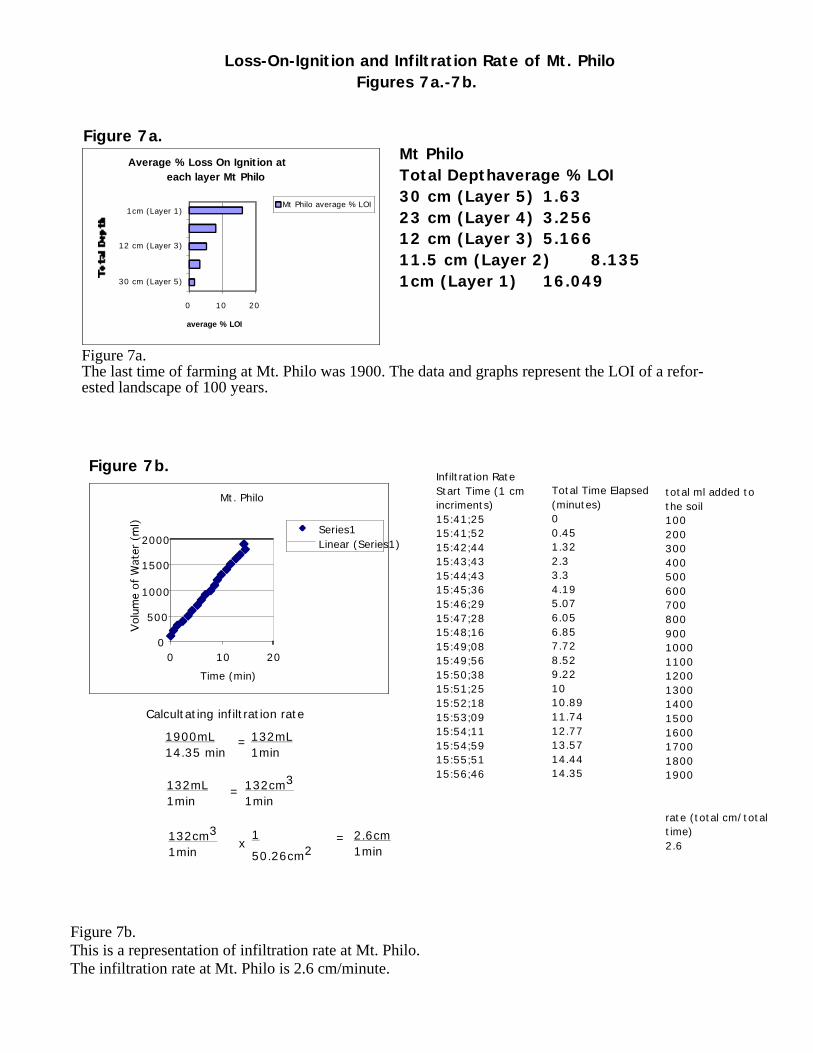
The infiltration rate is 2.6 cm/min (Fig. 7b).

4
CHARLOTTE FIELD
Located on Greenbush Road in Charlotte, VT (18T 0639399, UTM 4903234), the field
adjacent to Williams woods is currently in use by the Falby family. At the time of this study, the
field under observation was last tilled in the spring of 2000 (Falby, 2001). The underlying
bedrock is Cutting dolomite (Doll, 1961). The surficial material is lake bottom sediments (Doll,
1970). The predominate soil is Vergennes clay of the Covington association (Soil Survey of
Chittenden County, VT, 1974). There are three major soil horizons at Mt. Philo. Each layer has a
distinct LOI, pH and color (Fig. 8, Fig 9a). The range of pH is 6.5 to 8 (Fig. 8). The %LOI
ranges from 2% to 18% (Fig. 9a). The infiltration rate is .09 cm/min (Fig. 9b).
DISCUSSION AND INTERPRETATIONS
The soil profiles of the four sites indicate that there is a change in the depth and size of
the AP horizon and other horizons (Fig. 10). The calculated LOI of the four sites indicates a
trend based on the duration of forestation and the depth of the horizon. The LOI of the O layer at
Williams Woods is much higher than the organic content of the other four sites (Fig. 11). The
amount of organic material decreases as the time since tilling increases. One interpretation to
draw from this trend is that older and developed forest soils have had a longer period to
accumulate organic material.
The calculated LOI data also support the interpretation that the organic content of soils
decreases with depth (Fig. 11). The contents of the soil horizons match this trend. As depth
increases, pebbles and sand particles become more abundant. The proximity of the O and AP
horizons to the organic content source (trees and woody plants) enables the organic material of
these horizons to be retained through water percolation and deposition.

5
The infiltration rates of the four sites indicate that the infiltration rate increases with
length of forestation (Fig. 12). One interpretation from this comparison is that the more
developed the soil horizons, the greater accommodation of water by these soils. This occurs as a
result of the greater depth of the tree roots and the varying pore space of the different sediments
of the soil horizons. In a region with undeveloped soil horizons, the pore space does not differ
since the type of sediment is the same for some depth. This also corresponds to the relationship
between the decrease in pH with depth (Fig. 13). As more water percolates through the soil, the
amount of hydrogen ion exchange increases. This lowers the pH of the deeper and older soil
horizons.
CONCLUSIONS
The analysis of the data collected at Williams Woods, Shelburne Pond, Mt. Philo, and the
Charlotte Field (Fig. 14) suggests that there is relationship between the stage of reforestation and
soil development. As forest communities return to a previously farmed and deforested landscape,
soil horizons become more defined and the soil’s organic content increases in all horizons. The
AP horizon will decrease in thickness and the infiltration rate increases with age. The pH of the
soils decreases with the depth.
Soil development depends greatly on the influencing factors of natural forest
communities and human activities. When a landscape is disturbed through deforestation and
subsequent farming, the natural state of the soil is greatly altered. However, when a forest begins
to reclaim a previously deforested landscape over a period of 200 years, the soil will begin to
revert to its natural state. The sensitivity of the soil to deforestation is evident by the lack of well-
developed horizons. Further research is needed to determine those specific landscapes that have
the greatest risk of irrevocable change in response to deforestation.

6
References
Albers, J., Hands on the Land: A History of the Vermont Landscape, MIT Press,Cambridge, Mass., 2000.
Allen G., Soil Survey of Chittenden County, Vermont, Supt. Of Docs., U.S. Govt. PrintOff., 1974.
Bierman, P., Lini, A., Zehfuss, P., Church A., Davis, P.T., Southon, J., Baldwin, L.,“Postglacial Ponds and Alluvial Fans: Recorders of Holocene Landscape History”,GSA Today, 7, No. 10, 1-7, 1997.
Carlisle, Lilian Baker ed. Look Around Hinesburg and Charlotte, VermontBurlington, Vt.: Chittenden County, 1973
Dodge, Jr., H.W., The Geology of D.A.R. State Park, Mt. Philo State Forest Park, SandBar State Park, Vermont Geological Survey, 32, 1969.
Doll, Charles G., ed. Vermont Geologic Map Centennial : Guidebook. Washington:Supt. Of Docs., U.S. Govt. Print. Off., 1970.
Falby, George. Personal comments. 2001
Heller, R., Geology and Earth Sciences Sourcebook, Holt, Rinehart, & Winston Inc.,NY, 1970.
Moscowitch, J., “Williams Woods Natural Area: Interpretive Brochure”, The NatureConservancy of Vermont, 2000.
Poleman, W., Class Materials from “ENVS 195: Landscape Natural History”, UniversityOf Vermont, 2000.
Siccama, T., Pre-settlement and Present Forest Vegetation in Northern Vermont withSpecial Reference to Chittenden County, The American Midland Naturalist, 85,No. 1, 153, 1971.

491
492
493
64 65 66
490
LegendWilliams WoodsShelburne PondMt. PhiloCharlotte Field
N
declination=16˙
Figure b.
This is a transverse meractorprojection map of Chittenden County,Vermont. The four sites of study aremarked by colored circles.
0km 15kmScale 1:250,000
a.
b.
Figure a.This is a state map of Vermont. The site of the study is indicatedby the black box.
Location Maps of Williams Woods, Shelburne Pond, Mt. Philo and Charlotte FieldChittenden County, Vermont
Figure 1.
site of study in Chittenden County
N
declination=16˙0km 100km

Layer 1 Well sorted undecomposed organic materialLayer 2 Matted and decomposed organic materialLayer 3 Organic material mixed with coarse grained materialLayer 4 Fine grained dark material
Altitude= 57m18T 0639299UTM 4903364
0
2
4
6
8
10
12
14
16
18
20
22
24
26
28
30
CM
Williams Woods, Charlotte Vt Soil Profile
Figure 2.
Figure 2a. and 2b.The soil pit at Williams woods revealed four
distinct layers. Layer one is 1cm thick, layer two is6cm thick, layer four is 6cm thick, the fourth layercontinues deeper. The characteristics of each layerfollows. With a color of 10R 2.5/1, layer one has apH of 4 and consists of well sorted undecomposedorganic material. Layer two has a pH of 4.5, con-sists of matted and decomposed organic material,and has a color of 10YR 2/1. The third layer con-sists of reddish-brown organic material mixed withcoarse grained sand. The overall color for this layeris 10R 4/6. With a color of 5YR 7/2, layer fourconsists of fine grained silt/clay. This layer has apH of 5.
The average calculated loss-on-ignition forthe first layer of Williams Woods soil is 92 %. Thesecond layer has an average 79 % loss-on-ignition(LOI). The third layer has an average of 90 % LOI.The LOI of the fourth layer is 12 %.
To calculate the infiltration rate, we added
3200cm3 of water to a concentrated soil section
with an area of 50.26cm2 over a period of16.96min. The result was an infiltration rate of 3.8centimeters per minute.
Figure 2a.Figure 2b.

Figure 3a.Williams Woods has never been disturbed, therefore the data and graphs represent the LOI of oldgrowth forest. Layer 3 in Williams Woods does not fit the typical % LOI profile because it is a fallentree. It is composed almost entirely of organic material, therefore its % LOI is 90.
Average % Loss On Ignition at each layer Williams Woods
0 50 100
19.5 cm (Layer 4)
13 cm (Layer 3)
7 cm (Layer 2)
1 cm (Layer 1)
average % LOI
Williams Woods average
% LOI
Figure 3a.Williams WoodsTotal Depth average % LOI19.5 cm (Layer 4) 12.13 cm (Layer 3) 907 cm (Layer 2) 801 cm (Layer 1) 92
Infiltration rateStart Time (1 cmincriments)20:41;0920:41;1820:41;3020:42;0920:42;4320:43;2720:44;0020:44;3620:45;2420:45;4820:46;2220:46;5720:47;3220:48;0720:48;4520:49;0920:49;4820:51;1720:51;4720:52;3820:52;0520:53;4020:54;2020:55;0620:55;3320:55;5720:56;2020:56;4820:57;2020:57;5620:58;2920:59;07
Total TimeElapsed (minutes)00.150.3511.562.32.853.454.254.655.215.86.386.967.688.6510.1310.6311.4810.9312.5112.1512.9213.3713.7714.1814.6515.1815.7816.3316.96
total ml added to the soil10020030040050060070080090010001100120013001400150016001700180019002000210022002300240025002600270028002900300031003200
Williams Woods
0
500
1000
1500
2000
2500
3000
3500
0 10
20
Time(min)
Series1
LinearSeries1
Figure 3b.This is a representatino of the infiltration rate of Williams Wodds. The infiltration rate ofWilliams Woods is 3.8 cm/min
Figure 3b.
Loss-On-Ignition and Infiltration Rate of Williams WoodsFigures 3a.-3b.
Calcultating infiltration rate
189mL1min
189cm3
1min =
x189cm3
1min 1
50.26cm2 = 3.8cm
1min
3200mL16.96min
189mL1min
=

Shelbure Pond, Shelburne, VT Soil Profile
Layer 1 Well sorted organic material
Layer 2 Well sorted fine grain materialLayer 3 Very fine grained silt
and clayLayer 4 Shattered angular clasts within very fine grained silt/clay
18T 0646235UTM 4915714
Altitude= 153m
0
2
4
6
8
10
12
14
16
18
20
22
24
26
28
30
CM
Figure 4a. and 4b.The soil at Shelburne Pond consists of three
distinct layers. Layer one is a well-sorted organiclayer that is about 2 cm thick, has a pH of 7, and,according to the Munsell color guide, this layer hasa color of the layer is 10 YR 3/3. The calculatedaverage of the percentage of loss on ignition (LOI)for layer one is 22%. Layer two, which is a well-sorted fine grained material is about 5 cm thick. Ithas a pH of 6.5 and the color is 10 YR 6/3. Theaverage LOI for layer two is 11%. Layer three isthe thickest layer as it goes deeper than 30 cm.The pH of layer three is 6 and the color of thelayer is 10 YR 7/4. Included within layer three is athin layer of shattered angular clasts, which isfound around 8 cm down from the contact oflayers two and three. The average LOI for layerthree is 3%.
Figures 4a.-4b
Figure 4a. Figure 4b.

Shelburne PondTotal Depthaverage % LOI30 cm (Layer 3) 37.5 cm (Layer 2) 112 cm(Layer 1) 22
Average % Loss On Ignition at each layer Shelburne Pond
0 10 20 30
30 cm (Layer 3)
7.5 cm (Layer 2)
2 cm(Layer 1)
average %LOI
Shelburne Pondaverage % LOI
Figure 5a.Shelburne Pond was last farmed in the early 1800s. The data and graphs represent the LOI of areforested landscape of 200-197 years.
Figure 5a.
Infiltration RateStart Time(2 cm incriments)12:29;3130;4631;2733;1434;5636;2537;1138;5740;0241;0642;0844;0146;0248;1051;0254;0257;301:00;01
Total TimeElapsed (mintues)01.251.943.725.426.97.679.4410.5211.5912.6214.516.5218.6521.5224.5227.9930.5
Shelburne Pondvolume of can (ml)500
total ml addedto the soil200400500700800900100011001500120012501280132514001450150016001650
rate (total cm/totaltime min)3.2
Shelburne Pond
0200400600800
100012001400160018002000
0 10 20 30 40
Time (min)
Series1Linear (Series1)
Figures 5a-5b
Figure 5b.
Loss-On-Ignition and Infiltration Rate of Shelburne Pond
Figure 5b.This is a representation of the infiltration rate at Shelburne Pond.The infiltration rate at Shelburne Pond is 3.2 cm/min.
Calcultating infiltration rate
164mL1min
164cm3
1min =
x164cm3
1min 1
50.26cm2 = 3.2cm
1min
1650mL30.5 min
164mL1min
=

Layer 1 Well sorted organic material
Layer 2 Well sorted fine grain materialLayer 3 Transitional Layer
Layer 4 Sandy material with large cobblesLayer 5 Fine grained sand/silt/clay
Altitude= 357m18T 0641874UTM 4904127
0
2
4
6
8
10
12
14
16
18
20
22
24
26
28
30
CM
Mt. Philo, Charlotte, VT Soil Profile
Figure 6a. and 6b.The soil profile at Mt Philo is composed of
five distinct horizons. Layer 1 is 1 centimeter thickand it is a dark well sorted organic material. It is10YR 4/3 in color and has a pH of 7. Layer 2 is 10centimeters thick and it is a well sorted finegrained soil. It is 10 YR 3/2 in color and has a pHof 8. Layer 3 is .5 centimeter thick. It is the tran-sitional layer between the fine and coarsesediments. It is graded with fine grains near thetop of the layer and the coarse grains near thebottom of the layer. It is 10YR 4/6 in color andhas a pH of 7. Layer 4 is 11 centimeters thick andit is composed of sandy sediments and largecobbles. It is 10 YR 5/4 in color and has a pH of7.5. Layer 5 is 7 centimeters thick and it is com-posed of fine grained sands, silts, and clays. It is10YR 5/6 in color and has a pH of 7.
The average percent LOI for Layer 1 is 16.Layer 2 is 8. Layer 3 is 5. Layer 4 is 3. Layer 5 is2. (See LOI Mt Philo graph)
Figure 6a-6b.
Figure 6a. Figure 6b.
To calculate the infiltration rate, we added
1650cm3 of water to a concentrated soil section with
an area of 50.26cm2 over a period of 14 min. The resultwas an infiltration rate of 2.6 centimeters per minute.
Mt PhiloTotal Depthaverage % LOI30 cm (Layer 5) 1.6323 cm (Layer 4) 3.25612 cm (Layer 3) 5.16611.5 cm (Layer 2) 8.1351cm (Layer 1) 16.049
Average % Loss On Ignition at each layer Mt Philo
0 10 20
30 cm (Layer 5)
12 cm (Layer 3)
1cm (Layer 1)
average % LOI
Mt Philo average % LOI
Figure 7a.The last time of farming at Mt. Philo was 1900. The data and graphs represent the LOI of a refor-ested landscape of 100 years.
Figure 7a.
Infiltration RateStart Time (1 cmincriments)15:41;2515:41;5215:42;4415:43;4315:44;4315:45;3615:46;2915:47;2815:48;1615:49;0815:49;5615:50;3815:51;2515:52;1815:53;0915:54;1115:54;5915:55;5115:56;46
Total Time Elapsed(minutes)00.451.322.33.34.195.076.056.857.728.529.221010.8911.7412.7713.5714.4414.35
total ml added tothe soil1002003004005006007008009001000110012001300140015001600170018001900
rate (total cm/totaltime)2.6
Mt. Philo
0
500
1000
1500
2000
0 10 20
Time (min)
Series1Linear (Series1)
Loss-On-Ignition and Infiltration Rate of Mt. PhiloFigures 7a.-7b.
Figure 7b.This is a representation of infiltration rate at Mt. Philo.The infiltration rate at Mt. Philo is 2.6 cm/minute.
Figure 7b.
Calcultating infiltration rate
132mL1min
132cm3
1min =
x132cm3
1min 1
50.26cm2 = 2.6cm
1min
1900mL14.35 min
132mL1min
=

Figure 8a. and 8b.The soil profile of this section of Charlotte
has four distinct layers. A half a centimeter thick,the first layer is composed of undecomposedorganic material. The color of this layer is 7.5YR4/4 and the pH is 8. The second layer, half a centi-meter thick, consists of matted and decomposingorganic material. The pH of the second layer is 7and the color is 10YR 5/3. Layer three is 23cmthick and consists of highly mottled well sortedclay/sand. With occasional red-iron stains andwhite stains, the overall color of this layer is 10YR5/4. The pH is 7. The fourth layer of this profilebegins at 25cm below the ground surface and con-tinues past 34cm. The pH of the fourth layer is 6.5and the color of the layer is 7.5YR 8/1. The mate-rial of this layer is very fine grained clay.
The loss-on-ignition of the first layer of theCharlotte field is 18 %. Layer two of the field has aloss-on-ignition (LOI) of 9 %. The LOI of the thirdlayer is 4 % and the LOI of the fourth layer is 2 %.
Layer 1 Well sorted undecomposed organic materialLayer 2 Matted and decomposed organic materialLayer 3 Mottled well sorted material
Layer 4 White fine grained material
Altitude= 65m18T 0639399UTM 4903234
0
2
4
6
8
10
12
14
16
18
20
22
24
26
28
30
CM
Charlotte Farm Field, Charlotte, VTSoil Profile
Figure 8a.-8b.
Figure 8a.
Figure 8b.
To calculate the infiltration rate, we added
150cm3 of water to a concentrated soil section with
an area of 50.26cm2 over a period of 31.5 min. Theresult was an infiltration rate of .09 centimeters perminute.

Infiltration ratestarting time 19:42;00poured in 2cm waterat 20:13;34 it had infiltratedhalf a cm.
Total Time Elapsed(minutes)0
31.56
volume of can500ml
total ml added tothe soil200
150
rate (total cm/totaltime).09
Char lotte F ie ld
0
50
100
150
200
250
0 10 20 30 40
Tim e (min)
Ser ies1Linear(Ser ies1)
Charlotte FieldTotal Depthaverage % LOI30 cm (Layer 4) 223 cm (Layer 3) 41 cm (Layer 2) 9.5 cm (Layer 1) 18
Average % Loss On Ignition at each Layer Charlotte Field
0 10 20
30 cm (Layer 4)
23 cm (Layer 3)
1 cm (Layer 2)
.5 cm (Layer 1)
average % LOI
Charlotte Field average% LOI
Figure 9a.The Charlotte field was farmed in Spring 2000. This graph and data serves as representation of the LOIof an actively farmed field.
Figure 9a.
Figure 9b.This is a representation of infiltration rate at the Charlotte Field. The infiltration rateCharlotte is .09 cm/min.
Loss-On-Ignition and Infiltration Rate of Charlotte FieldFigures 9a.-9b.
Calcultating infiltration rate
5mL1min
5cm3
1min =
x5cm3
1min 1
50.26cm2 = .09cm
1min
150mL31.56 min
5mL1min
=
Figure 9b.

Layer 1 Well sorted undecomposed organic materialLayer 2 Matted and decomposed organic materialLayer 3 Organic material mixed with coarse grained materialLayer 4 Fine grained dark material
Williams Woods Soil ProfileAltitude= 57m18T 0639299UTM 4903364
Layer 1 Well sorted undecomposed organic materialLayer 2 Matted and decomposed organic materialLayer 3 Mottled well sorted material
Layer 4 White fine grained material
Charlotte Farm Field Soil ProfileAltitude= 65m18T 0639399UTM 4903234
Layer 1 Well sorted organic material
Layer 2 Well sorted fine grain materialLayer 3 Transitional Layer
Layer 4 Sandy material with large cobblesLayer 5 Fine grained sand/silt/clay
Mt. Philo Soil ProfileShelbure Pond Soil Profile
Layer 1 Well sorted organic material
Layer 2 Well sorted fine grain materialLayer 3 Very fine grained silt
and clayLayer 4 Shattered angular clasts within very fine grained silt/clay
18T 0646235UTM 4915714
Altitude= 153m
0
2
4
6
8
10
12
14
16
18
20
22
24
26
28
30
CM
Comparison of Soil Profiles from Chittenden CountyFigure 10
Altitude =357m18T 0641874UTM 4904127
Figure 10b. Figure 10c. Figure 10d.Figure 10a

Figure 10.This is an interpretation and comparison of the soil profiles at the four different sites.Williams Woods is the control site. As an example of an old growth forest, no clear-cutting or farming took place at Williams Woods. Farming ended at the site of ShelburnePond in 1804 (Carlise, 1973). The area surrounding Mt Philo was farmed until 1900(Carlise, 1973). The Charlotte field is still being farmed. The soil profile suggests aninterpretation that the earlier the time of reforestation, the more developed the soilprofile.
Figure 10a. The soil profile at Williams Woods has five distinct layers. An interpretationof the layers follows. Layer 1 is a well-developed Oi layer. Layer 2 is a well-developedOa layer. Layer 3 is a decomposing tree. It is organic in composition, and very red incolor due to oxidization and iron content. Layer 4 is the C layer composed of fine-grainedsilt and clay lake bottom parent material.
Figure 10b. The soil profile for Shelburne Pond shows three distinct layers and one semilayer within the third layer. An interpretation of the layers suggests that layer 1 is arelatively thick O layer. This is because it has been reforested longer and has had time todevelop this thicker organic layer. Layer 2 is a relatively thin AP layer. It has probablygotten thinner through time as the organic layer has developed. Layer 3 is probably the Clayer, composed of very fine-grained silt and clay lake bottom parent material. Withinthis layer three is a thin semi layer composed of shattered angular clasts with in thematrix of very fine-grained silt and clay.
Figure 10c. The Mt Philo soil profile is composed of has five distinct layers. Aninterpretation suggests that layer 1 is the O, or organic layer. This is composed ofdecomposing leaves and organic debris. Layer 2 is the AP layer; this is thinner than theCharlotte Field AP layer because it was plowed longer ago than the Charlotte Field.Layer 3 is the transitional layer between the AP layer possible stream parent material.Layer 4 is the possible stream parent material. The reason for the stream hypothesis isthe presence of large cobbles and coarse sand. It has almost no organic material. Layer 5is the C layer. It is composed of the surficial geological material which is fine grainedsand silt and clay from the lake bottom.
Figure 10d. The Charlotte Field soil profile has four distinct layers. An interpretation ofthe layers follows. Layer 1 is the Oi layer; this is composed loose leaves andundecomposed organic debris. Layer 2 is the Oa layer; this is composed of matted anddecomposed organic organic material. Layer 3 is the AP layer, or the plowed layer. Thislayer is very thick, probably due to the plowing methods used on the field and due to thefact that is the youngest soil profile seen. The AP layer is a mixture of the O, A, and Blayers, produced by the plow. Layer 4 is the E layer. The E layer is low in organicmatter because the organic matter has leached out of this layer. It is a concentration ofsand and silt.

Figure 11.
Figure 11.Mt Philo, Shelburne Pond and the Charlotte field each have fairly typical % LOI profiles. Layer 1 (theorganic layer) had the largest % LOI. Each successive layer has a lower % LOI due to the lack of organicmaterials as the depth increases. Williams Woods has the most organic material in all of its layers com-pared to the other three sites. There is a 92% LOI in Layer 1 at Williams Woods. Compared to a 16%LOI at Mt Philo, a 22% LOI at Shelburne Pond, and a 18% LOI at the Charlotte Field, this suggests thatthe older the forest, the greater percent of organic material.
Mt Philo Shelburne Pond WilliamsWoods Charlotte FieldLayer 5 2Layer 4 3 12 2Layer 3 5 3 90 4Layer 2 8 11 80 9Layer 1 16 22 92 18
C o m p a ris o n o f a v e ra g e % L O I b e t w e e n s it e s
0 2 0 40
6 0 8 0 1 0 0
L a y e r 5
L a y e r 4
L a y e r 3
L a y e r 2
L a y e r 1
a v e rag e % L O I
C h a rlo tte F ie ld
W illia m s W o o d s
S h e lb u rn e P o n d
M t P h ilo
Figure 11.
Comparison of Average %LOI

Comparison of Infiltration Rates
0
500
1000
1500
2000
2500
3000
3500
0 5 10 15 20 25 30 35
Time Elapsed(min)
Charlotte Field
Shelburne Pond
Williams Woods
Mt Philo
Figure 12.This is a representation of the comparison of the infiltration rates of soil at all four sites. The infiltration rate at Williams Woods is so high because the soil pro-file at this location is well developed and contains no AP layer. Because of this, water is able to easily infiltrate the soil. The infiltration rate at Shelburne Pondis less than that of Williams Woods due to the fact that the landscape at Shelburne Pond has been disturbed by deforestation and farming. When soil is plowed, itbecomes more compact, and although Shelburne Pond was last plowed between 200 and 250 years ago (Carlisle, 1973) the soil profile still contains the compact-ed AP layer (Figure 6a) which decreases the infiltration rate considerably. The infiltration rate of Mt Philo is less than that of Shelburne Pond and WilliamsWoods because Mt Philo was farmed last in the spring/summer of 1900 (Carlisle, 1973). The plow horizon here is thicker than that of Shelburne Pond (Figure6). This compact AP layer is the reason for the lessened infiltration rate. The infiltration rate at Charlotte field is much less than that of Williams Woods, Shel-burne Pond, and Mt Philo because it has such a large AP horizon (Figure 6) compared to the other three sites.
Figure 12
Comparison of Infiltration RatesFigure 12

Comparison of the pH of Soils
0
2
4
6
8
10
1 2 3 4 5
Layer #
Williams WoodsShelburne PondMt PhiloCharlotte Field
Comparison of Soil pHFigure 13.
layer #1 4 7 7 82 4.5 6.5 8 73 4 6 7 74 5 7.5 6.55 7
Figure 9.There are two major trends in the pH data. The first is that the older soils tend to bemore acidic. The soil at Williams Woods is both the oldest and the most acidic. This isdue to the centuries of accumulation of organic materials, especially pine needles, whichare themselves acidic. The pH of soils is also influenced by eluviation, which is the pro-cess of water percolating down the soil column while transporting both organic and inor-ganic materials (Poleman, 2000). As water passes through soil layers, H+ ions replaceCa+ and Mg+ ions that are present and those ions are then "washed" away by way ofdrainage. Since pH is a measure of the percentage of H+ ions, the more water that isable to infiltrate the soil, the more acidic the soil will be. The Charlotte field has thehighest overall pH (most basic). This is due to the fact that water does not infiltratethe soil well here; therefore H+ ions are not able to replace the Ca+ and Mg+ ions. Thesecond trend is that soils get more acidic with depth. This is due to the fact that thedeeper soils are found in illuviation zones where eluviated materials are deposited.Some of the discrepencies in this data may be the result of human error in measuringthe pH or may be due to the fact that some of the soils are in a recovery stage.
Williams Woods Shelburne Pond Mt. Philo Charlotte Field
Figure 13.

WilliamsWoods Shelburne Pond Mt Philo Charlotte FieldLayer 5 2Layer 4 12 3Layer 3 90 3 5 4Layer 2 80 11 8 9Layer 1 92 22 16 18
Comparison of %LOI
layer #1 4 7 7 82 4.5 6.5 8 73 4 6 7 74 5 7.5 6.55 7
Williams Woods Shelburne Pond Mt. Philo Charlotte Field
Comparison of pH
Figure 14
Comparison of Infiltration RateWilliams Woods Shelburne Pond Mt. Philo Charlotte Field
Minutes Elapsed 17 31 14 32Total Volume of Water (ml) 3200 1650 1900 50
Total area of can opening(cm2) 50.2 50.2 50.2 50.2Rate (cm/min) 3.8 3.2 2.6 .09
Williams Woods Shelburne Pond Mt. Philo Charlotte Field
Years since n/a 197 100 1Tilling
AVG pH 4 6.5 7 7
Williams W.AVG Shelburne AVG Mt. Philo AVG Charlotte AVG68 12 7 9
Table 14 a
Table 14 b
Table 14 c
Table 14 d
Summary Tables