the landscape for impact investing in southeast asia · 2018-07-31 · in the past decade, impact...
TRANSCRIPT
THE LANDSCAPE FOR IMPACT INVESTING IN SOUTHEAST ASIA
PHILIPPINES
ACKNOWLEDGMENTSThis project was generously supported by Investing in Women, an initiative of the Australian government.
This report was made possible through the contributions of many individuals, both within and beyond Southeast Asia. We would especially like to thank all the interviewees that gave their time, expertise, and data during the course of this study. Without their key insights, this report would not have been possible.
We would also like to thank Giselle Leung, Anantha Natalegawa, Katrina Ngo, Annie Olszewski, Aliana Pineiro, Kathryn Savasuk, Aditi Sethi, Sapna Shah, and Anil Sinha for review and input.
GIIN Advisory TeamAbhilash Mudaliar, Research Director
Rachel Bass, Research Senior Associate
Hannah Dithrich, Research Associate
Jennifer Lawrence, Communications Associate
Intellecap Advisory ServicesMukund Prasad, Associate Partner
Stefanie Bauer, Associate Partner
Amar Gokhale, Manager
Shreejit Borthakur, Senior Associate
Harish Reddy, Senior Associate
AUGUST 2018
COMMON ACRONYMSADB Asian Development Bank
ASEAN Association of Southeast Asian Nations
BPO Business Process Outsourcing
CSR Corporate Social Responsibility
DFI Development Finance Institution
ESG Environmental, Social, and Governance
FDI Foreign Direct Investment
Fintech Financial Technology
GDP Gross Domestic Product
GDP (PPP) Gross Domestic Product at Purchasing Power Parity
GLI Gender Lens Investing
GNI Gross National Income
GP General Partner
HDI Human Development Index
HNWI High-Net-Worth Individuals
ICT Information and Communications Technology
IFC International Finance Corporation
IT Information Technology
LP Limited Partner
OPIC Overseas Private Investment Corporation
PDR People's Democratic Republic
PE Private Equity
PHP Philippine Peso
PII Private Impact Investor
PPP Purchasing Power Parity
PRESENT Poverty Reduction Through Social Enterprise
R&D Research and Development
SDG Sustainable Development Goals
SME Small and Medium Enterprise
TA Technical Assistance
UNESCAP United Nations Economic and Social Commission for Asia and the Pacific
USD United States Dollar
VAT Value Added Tax
VC Venture Capital
PHILIPPINES: AN INTRODUCTION TO THE IMPACT INVESTING LANDSCAPE
TABLE OF CONTENTSCountry summary . . . . . . . . . . . . . . . . . . . . . . . . . . . . . . . . . . . . . . . . . . . . . . . . . . . . . . . . . . . . . . . . . . . . . . 2
Country context . . . . . . . . . . . . . . . . . . . . . . . . . . . . . . . . . . . . . . . . . . . . . . . . . . . . . . . . . . . . . . . . . . . . . . . . 4
Snapshot . . . . . . . . . . . . . . . . . . . . . . . . . . . . . . . . . . . . . . . . . . . . . . . . . . . . . . . . . . . . . . . . . . . . . . . . . . . 4
Economic overview . . . . . . . . . . . . . . . . . . . . . . . . . . . . . . . . . . . . . . . . . . . . . . . . . . . . . . . . . . . . . . . 5
Social overview . . . . . . . . . . . . . . . . . . . . . . . . . . . . . . . . . . . . . . . . . . . . . . . . . . . . . . . . . . . . . . . . . . . . 9
The supply of impact capital in the Philippines . . . . . . . . . . . . . . . . . . . . . . . . . . . . . . . . . . . . 11
Overview . . . . . . . . . . . . . . . . . . . . . . . . . . . . . . . . . . . . . . . . . . . . . . . . . . . . . . . . . . . . . . . . . . . . . . . . . . . 11
Private impact investors . . . . . . . . . . . . . . . . . . . . . . . . . . . . . . . . . . . . . . . . . . . . . . . . . . . . . . . . . . 12
Development finance institutions . . . . . . . . . . . . . . . . . . . . . . . . . . . . . . . . . . . . . . . . . . . . . . . 21
Gender lens investing . . . . . . . . . . . . . . . . . . . . . . . . . . . . . . . . . . . . . . . . . . . . . . . . . . . . . . . . . . . . 27
The landscape of demand for impact capital . . . . . . . . . . . . . . . . . . . . . . . . . . . . . . . . . . . . . . . 30
Overview . . . . . . . . . . . . . . . . . . . . . . . . . . . . . . . . . . . . . . . . . . . . . . . . . . . . . . . . . . . . . . . . . . . . . . . . . . . 31
Access to capital . . . . . . . . . . . . . . . . . . . . . . . . . . . . . . . . . . . . . . . . . . . . . . . . . . . . . . . . . . . . . . . . . . 32
Challenges to growth . . . . . . . . . . . . . . . . . . . . . . . . . . . . . . . . . . . . . . . . . . . . . . . . . . . . . . . . . . . . . 32
The enabling ecosystem . . . . . . . . . . . . . . . . . . . . . . . . . . . . . . . . . . . . . . . . . . . . . . . . . . . . . . . . . . . . . . 33
Challenges and opportunities . . . . . . . . . . . . . . . . . . . . . . . . . . . . . . . . . . . . . . . . . . . . . . . . . . . . . . . . 38
Supply-side challenges . . . . . . . . . . . . . . . . . . . . . . . . . . . . . . . . . . . . . . . . . . . . . . . . . . . . . . . . . . . 38
Demand-side challenges . . . . . . . . . . . . . . . . . . . . . . . . . . . . . . . . . . . . . . . . . . . . . . . . . . . . . . . . . 39
Ecosystem challenges . . . . . . . . . . . . . . . . . . . . . . . . . . . . . . . . . . . . . . . . . . . . . . . . . . . . . . . . . . . . 39
Supply-driven opportunities . . . . . . . . . . . . . . . . . . . . . . . . . . . . . . . . . . . . . . . . . . . . . . . . . . . . . 40
Demand-driven opportunities . . . . . . . . . . . . . . . . . . . . . . . . . . . . . . . . . . . . . . . . . . . . . . . . . . . 40
Ecosystem-driven opportunities . . . . . . . . . . . . . . . . . . . . . . . . . . . . . . . . . . . . . . . . . . . . . . . . 41
VI • THE LANDSCAPE FOR IMPACT INVESTING IN SOUTHEAST ASIA
ABOUT THIS REPORTMotivationImpact investing is a growing practice defined by its intent to generate positive social and environmental impact alongside a financial return. Impact investments are made across the globe, and developing economies provide ample opportunities for market-based solutions and investment capital to address social and environmental challenges. Southeast Asia is developing rapidly, but the region also faces social and environmental challenges that offer substantial potential for impact investments. Indeed, almost a third of impact investors invest in Southeast Asia, and 44% plan to grow their impact investing allocations to the region in the year ahead.1 The Landscape for Impact Investing in Southeast Asia report provides much-needed information about the impact investing market in Southeast Asia to inform investors already allocating capital or considering investing in the region.
This report provides detailed information about the investing activity and trends in 11 countries: Brunei, Cambodia, East Timor, Indonesia, Laos, Malaysia, Myanmar, the Philippines, Singapore, Thailand, and Vietnam. It outlines challenges and opportunities for impact investors and analyzes political and economic factors that may inform investment decisions in each country. The report comprises five chapters: an executive summary, three chapters examining Indonesia, the Philippines, and Vietnam in detail, and an overview of the region’s remaining countries.
ScopeImpact investments are defined as “investments made into companies, organizations, and funds with the intention to generate social and environmental impact alongside a financial return.” This report presents analysis of impact investing activity among private impact investors (PIIs) and development finance institutions (DFIs) in Southeast Asia between 2007 and 2017. Only direct capital deployments made into enterprises or projects were included; indirect deployments were excluded to avoid double counting. Investors’ capital commitments and liquid assets were also excluded.
MethodologyBuilding on existing research, the report uses deal-level data to provide quantitative analysis of the impact investing landscape in Southeast Asia. Findings are based on interviews conducted with over 100 stakeholders, a thorough review of existing research, and aggregate analysis of 514 impact deals between 2007 and 2017.2
More detailed information on methodology and scope is provided in the Executive Summary. All chapters of this report can be found at www.thegiin.org.
1 Abhilash Mudaliar, Rachel Bass, and Hannah Dithrich, 2018 Annual Impact Investor Survey (New York: Global Impact Investing Network, June 2018), https://thegiin.org/research/publication/annualsurvey2018.
2 The Research Team’s efforts focused on creating an exhaustive database of direct impact deals made in the region from 2007 to 2017.
MARKET OVERVIEW
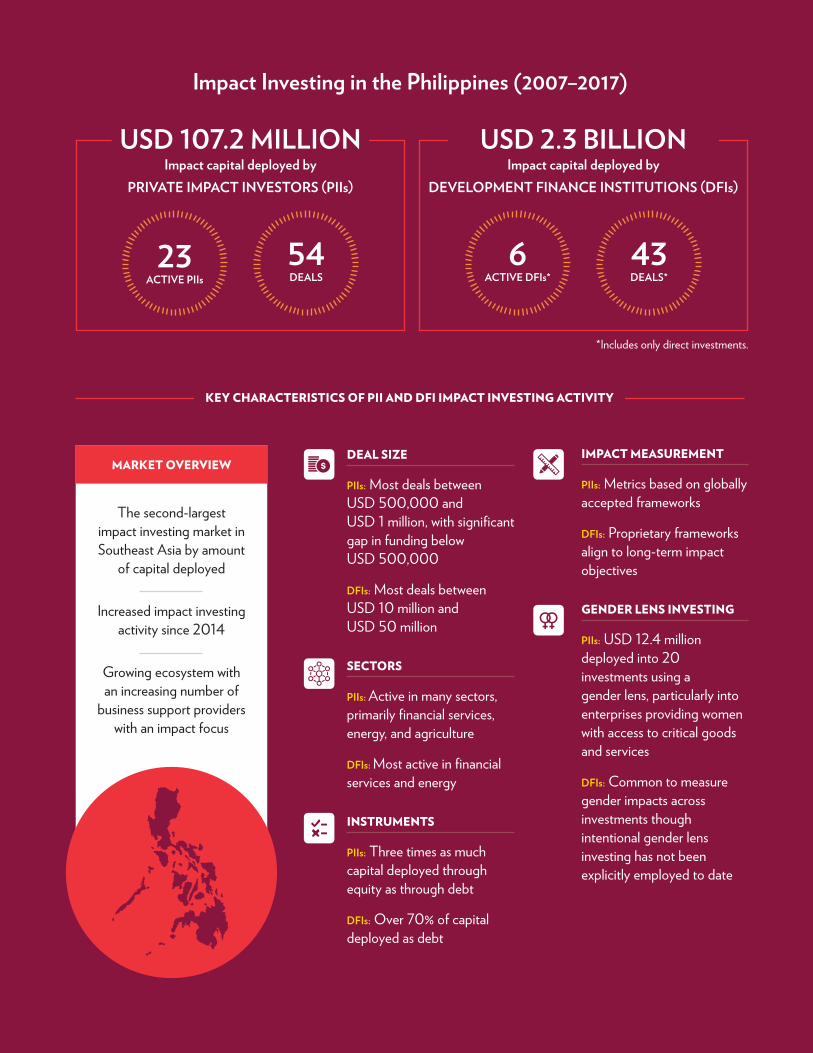
Impact Investing in the Philippines (2007–2017)
The second-largest impact investing market in Southeast Asia by amount
of capital deployed
Increased impact investing activity since 2014
Growing ecosystem with an increasing number of
business support providers with an impact focus
DEAL SIZE
PIIs: Most deals between USD 500,000 and USD 1 million, with significant gap in funding below USD 500,000
DFIs: Most deals between USD 10 million and USD 50 million
SECTORS
PIIs: Active in many sectors, primarily financial services, energy, and agriculture
DFIs: Most active in financial services and energy
INSTRUMENTS
PIIs: Three times as much capital deployed through equity as through debt
DFIs: Over 70% of capital deployed as debt
IMPACT MEASUREMENT
PIIs: Metrics based on globally accepted frameworks
DFIs: Proprietary frameworks align to long-term impact objectives
GENDER LENS INVESTING
PIIs: USD 12.4 million deployed into 20 investments using a gender lens, particularly into enterprises providing women with access to critical goods and services
DFIs: Common to measure gender impacts across investments though intentional gender lens investing has not been explicitly employed to date
*Includes only direct investments.
KEY CHARACTERISTICS OF PII AND DFI IMPACT INVESTING ACTIVITY
USD 2.3 BILLION
6ACTIVE DFIs*
43DEALS*
Impact capital deployed by DEVELOPMENT FINANCE INSTITUTIONS (DFIs)
USD 107.2 MILLION
54DEALS
23ACTIVE PIIs
Impact capital deployed by PRIVATE IMPACT INVESTORS (PIIs)
2 • THE LANDSCAPE FOR IMPACT INVESTING IN SOUTHEAST ASIA
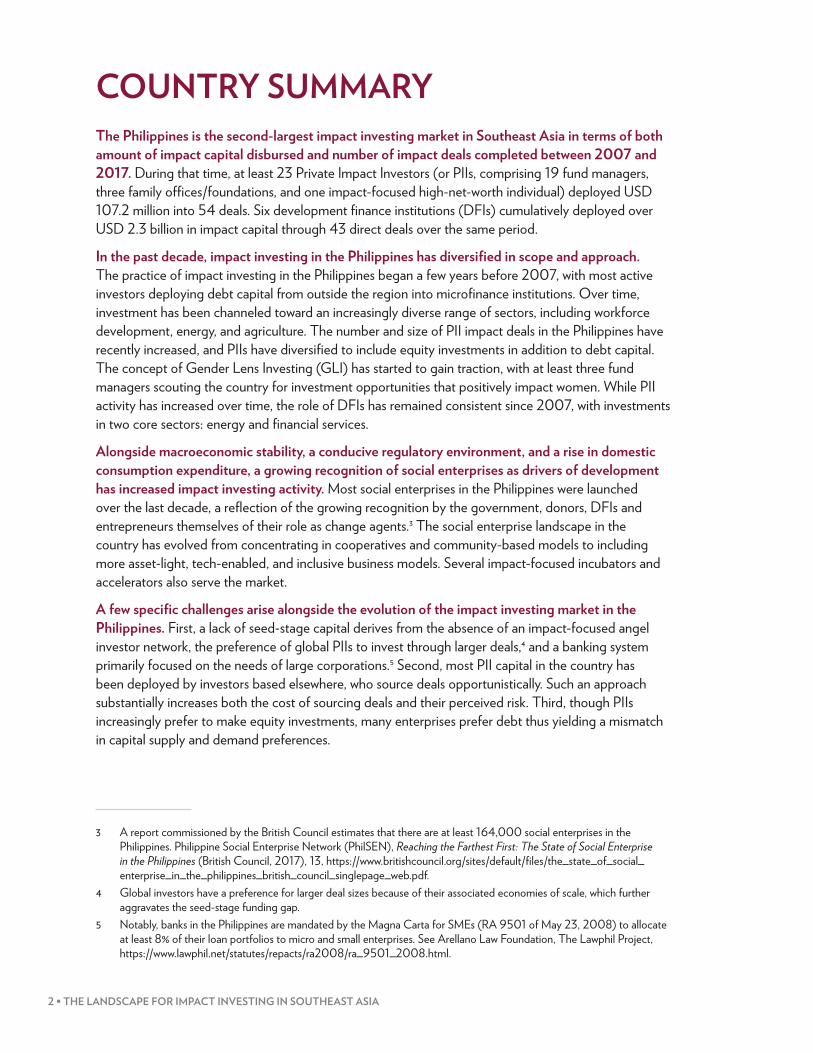
COUNTRY SUMMARYThe Philippines is the second-largest impact investing market in Southeast Asia in terms of both amount of impact capital disbursed and number of impact deals completed between 2007 and 2017. During that time, at least 23 Private Impact Investors (or PIIs, comprising 19 fund managers, three family offices/foundations, and one impact-focused high-net-worth individual) deployed USD 107.2 million into 54 deals. Six development finance institutions (DFIs) cumulatively deployed over USD 2.3 billion in impact capital through 43 direct deals over the same period.
In the past decade, impact investing in the Philippines has diversified in scope and approach. The practice of impact investing in the Philippines began a few years before 2007, with most active investors deploying debt capital from outside the region into microfinance institutions. Over time, investment has been channeled toward an increasingly diverse range of sectors, including workforce development, energy, and agriculture. The number and size of PII impact deals in the Philippines have recently increased, and PIIs have diversified to include equity investments in addition to debt capital. The concept of Gender Lens Investing (GLI) has started to gain traction, with at least three fund managers scouting the country for investment opportunities that positively impact women. While PII activity has increased over time, the role of DFIs has remained consistent since 2007, with investments in two core sectors: energy and financial services.
Alongside macroeconomic stability, a conducive regulatory environment, and a rise in domestic consumption expenditure, a growing recognition of social enterprises as drivers of development has increased impact investing activity. Most social enterprises in the Philippines were launched over the last decade, a reflection of the growing recognition by the government, donors, DFIs and entrepreneurs themselves of their role as change agents.3 The social enterprise landscape in the country has evolved from concentrating in cooperatives and community-based models to including more asset-light, tech-enabled, and inclusive business models. Several impact-focused incubators and accelerators also serve the market.
A few specific challenges arise alongside the evolution of the impact investing market in the Philippines. First, a lack of seed-stage capital derives from the absence of an impact-focused angel investor network, the preference of global PIIs to invest through larger deals,4 and a banking system primarily focused on the needs of large corporations.5 Second, most PII capital in the country has been deployed by investors based elsewhere, who source deals opportunistically. Such an approach substantially increases both the cost of sourcing deals and their perceived risk. Third, though PIIs increasingly prefer to make equity investments, many enterprises prefer debt thus yielding a mismatch in capital supply and demand preferences.
3 A report commissioned by the British Council estimates that there are at least 164,000 social enterprises in the Philippines. Philippine Social Enterprise Network (PhilSEN), Reaching the Farthest First: The State of Social Enterprise in the Philippines (British Council, 2017), 13, https://www.britishcouncil.org/sites/default/files/the_state_of_social_enterprise_in_the_philippines_british_council_singlepage_web.pdf.
4 Global investors have a preference for larger deal sizes because of their associated economies of scale, which further aggravates the seed-stage funding gap.
5 Notably, banks in the Philippines are mandated by the Magna Carta for SMEs (RA 9501 of May 23, 2008) to allocate at least 8% of their loan portfolios to micro and small enterprises. See Arellano Law Foundation, The Lawphil Project, https://www.lawphil.net/statutes/repacts/ra2008/ra_9501_2008.html.
PHILIPPINES • 3
Still, given the economy’s expected growth trajectory and the government’s commitment to meeting the UN Sustainable Development Goals (SDGs),6 the Philippines will likely see increased interest from global and regional impact investors. Its economy benefits from a young workforce, high literacy rate, rising consumption expenditure by the middle class, and recent government investments in infrastructure. In addition, a stable currency and benign outlook for inflation make the Philippines attractive to foreign investors.
6 Republic of the Philippines, National Economic and Development Authority, “Ph Reaffirms Commitments on Poverty Reduction, SDGs, and Migrant Rights at UN General Assembly” (news release), September 30, 2016, http://www.neda.gov.ph/2016/09/30/ph-reaffirms-commitments-on-poverty-reduction-sdgs-and-migrant-rights-at-un-general-assembly/.
4 • THE LANDSCAPE FOR IMPACT INVESTING IN SOUTHEAST ASIA
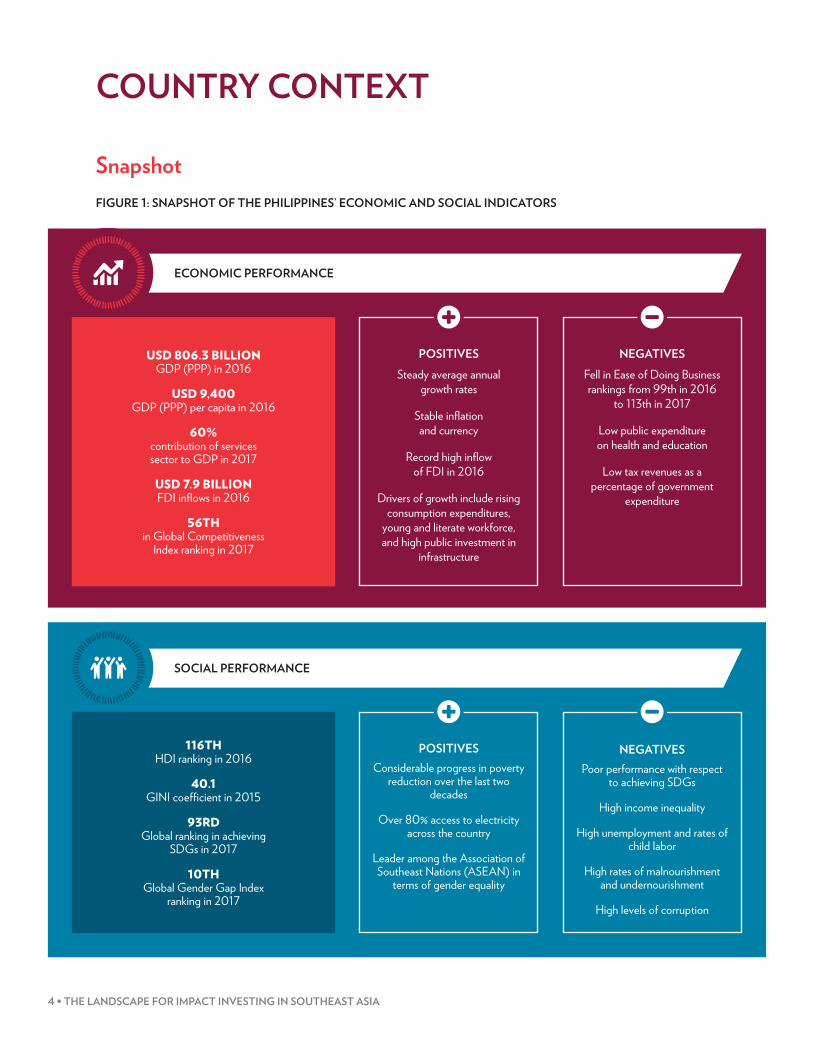
COUNTRY CONTEXT
SnapshotFIGURE 1: SNAPSHOT OF THE PHILIPPINES’ ECONOMIC AND SOCIAL INDICATORSFIGURE 1: SNAPSHOT OF THE PHILIPPINES’ SOCIAL AND ECONOMIC INDICATORS
SOCIAL PERFORMANCE
ECONOMIC PERFORMANCE
USD 806.3 BILLION GDP (PPP) in 2016
USD 9,400GDP (PPP) per capita in 2016
60%contribution of services sector to GDP in 2017
USD 7.9 BILLIONFDI infl ows in 2016
56TH in Global Competitiveness
Index ranking in 2017
POSITIVESSteady average annual
growth rates
Stable infl ation and currency
Record high infl ow of FDI in 2016
Drivers of growth include rising consumption expenditures,
young and literate workforce, and high public investment in
infrastructure
NEGATIVESFell in Ease of Doing Business rankings from 99th in 2016
to 113th in 2017
Low public expenditure on health and education
Low tax revenues as a percentage of government
expenditure
116THHDI ranking in 2016
40.1GINI coeffi cient in 2015
93RDGlobal ranking in achieving
SDGs in 2017
10THGlobal Gender Gap Index
ranking in 2017
POSITIVESConsiderable progress in poverty
reduction over the last two decades
Over 80% access to electricity across the country
Leader among the Association of Southeast Nations (ASEAN) in
terms of gender equality
NEGATIVESPoor performance with respect
to achieving SDGs
High income inequality
High unemployment and rates of child labor
High rates of malnourishment and undernourishment
High levels of corruption
PHILIPPINES • 5
Economic overview
GDP AND ECONOMIC GROWTH
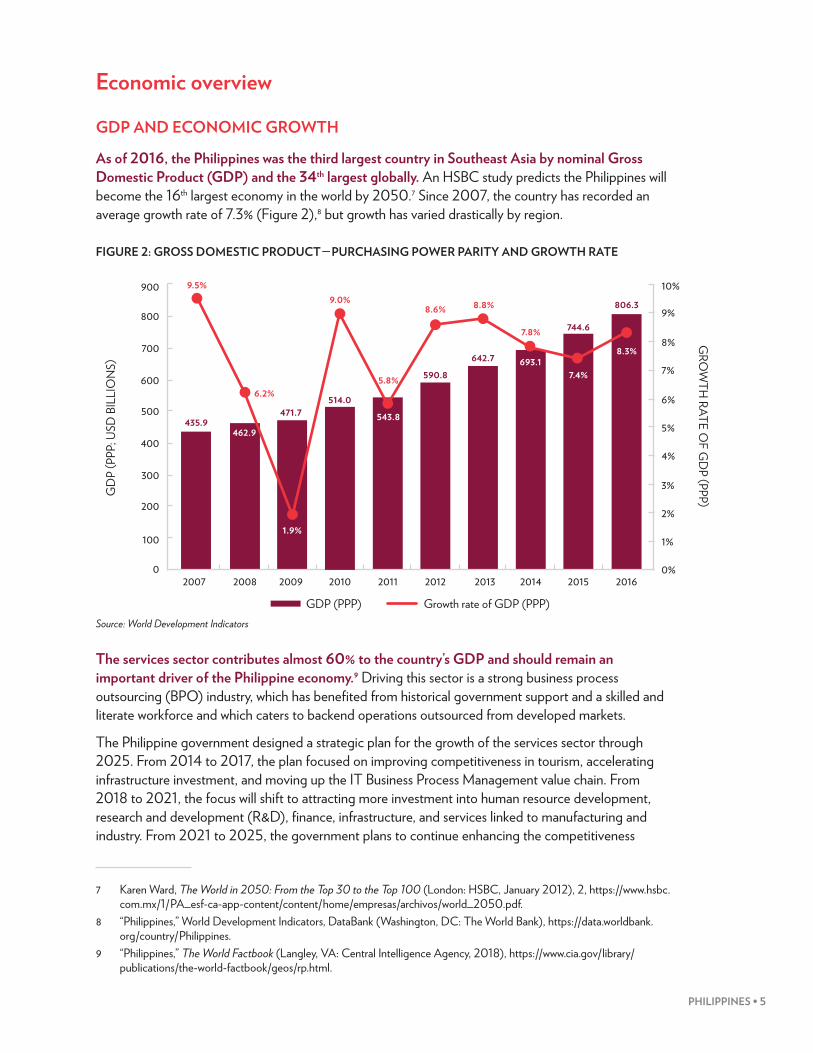
As of 2016, the Philippines was the third largest country in Southeast Asia by nominal Gross Domestic Product (GDP) and the 34th largest globally. An HSBC study predicts the Philippines will become the 16th largest economy in the world by 2050.7 Since 2007, the country has recorded an average growth rate of 7.3% (Figure 2),8 but growth has varied drastically by region.
FIGURE 2: GROSS DOMESTIC PRODUCT — PURCHASING POWER PARITY AND GROWTH RATE
Source: World Development Indicators
The services sector contributes almost 60% to the country’s GDP and should remain an important driver of the Philippine economy.9 Driving this sector is a strong business process outsourcing (BPO) industry, which has benefited from historical government support and a skilled and literate workforce and which caters to backend operations outsourced from developed markets.
The Philippine government designed a strategic plan for the growth of the services sector through 2025. From 2014 to 2017, the plan focused on improving competitiveness in tourism, accelerating infrastructure investment, and moving up the IT Business Process Management value chain. From 2018 to 2021, the focus will shift to attracting more investment into human resource development, research and development (R&D), finance, infrastructure, and services linked to manufacturing and industry. From 2021 to 2025, the government plans to continue enhancing the competitiveness
7 Karen Ward, The World in 2050: From the Top 30 to the Top 100 (London: HSBC, January 2012), 2, https://www.hsbc.com.mx/1/PA_esf-ca-app-content/content/home/empresas/archivos/world_2050.pdf.
8 “Philippines,” World Development Indicators, DataBank (Washington, DC: The World Bank), https://data.worldbank.org/country/Philippines.
9 “Philippines,” The World Factbook (Langley, VA: Central Intelligence Agency, 2018), https://www.cia.gov/library/publications/the-world-factbook/geos/rp.html.
FIGURE 2: GROSS DOMESTIC PRODUCT – PURCHASING POWER PARITY AND GROWTH RATE
900
800
700
600
500
400
300
200
100
0
10%
9%
8%
7%
6%
5%
4%
3%
2%
1%
0%2007 2008 2009 2010 2011 2012 2013 2014 2015 2016
GD
P (P
PP; U
SD B
ILLI
ON
S)G
ROW
TH RATE O
F GD
P (PPP)
9.5%
6.2%
9.0%8.6% 8.8%
7.8%
435.9471.7
514.0543.8
590.8642.7 693.1
744.6
806.3
1.9%
5.8% 7.4%
8.3%
Source: World Development Indicators
GDP (PPP) Growth rate of GDP (PPP)
462.9
6 • THE LANDSCAPE FOR IMPACT INVESTING IN SOUTHEAST ASIA
of the services sector for sustained job creation and economic growth, in part by relaxing foreign ownership restrictions on service companies.10
The industrial sector is the second-largest contributor to the Philippine economy, accounting for just over 30% of the country’s GDP. Within the industrial sector, manufacturing is the largest sub-sector, contributing around a quarter of GDP. As of 2014, manufacturing comprised 8% of all Philippine employment, and the government is committed to increasing this to 15%.11 Other key components of the industrial sector include construction and ship building.
Meanwhile, while the agricultural sector has declined from around 25% of GDP in 1980 to 9.4% at present,12 it still employs around 30% of the country’s labor force and is often characterized by high rates of disguised unemployment and underemployment.13
FOREIGN DIRECT INVESTMENT AND EASE OF DOING BUSINESS
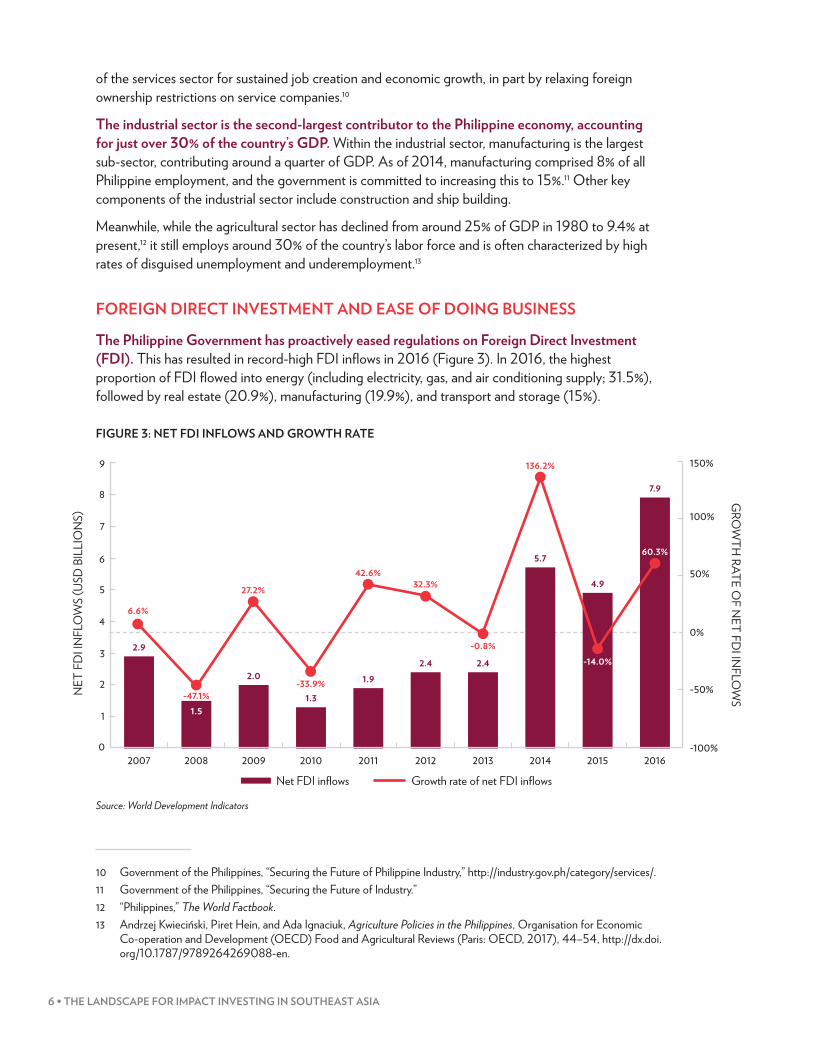
The Philippine Government has proactively eased regulations on Foreign Direct Investment (FDI). This has resulted in record-high FDI inflows in 2016 (Figure 3). In 2016, the highest proportion of FDI flowed into energy (including electricity, gas, and air conditioning supply; 31.5%), followed by real estate (20.9%), manufacturing (19.9%), and transport and storage (15%).
FIGURE 3: NET FDI INFLOWS AND GROWTH RATE
Source: World Development Indicators
10 Government of the Philippines, “Securing the Future of Philippine Industry,” http://industry.gov.ph/category/services/.11 Government of the Philippines, “Securing the Future of Industry.”12 “Philippines,” The World Factbook.13 Andrzej Kwieciński, Piret Hein, and Ada Ignaciuk, Agriculture Policies in the Philippines, Organisation for Economic
Co-operation and Development (OECD) Food and Agricultural Reviews (Paris: OECD, 2017), 44–54, http://dx.doi.org/10.1787/9789264269088-en.
FIGURE 3: NET FDI INFLOWS AND GROWTH RATE
9
8
7
6
5
4
3
2
1
02007 2008 2009 2010 2011 2012 2013 2014 2015 2016
NET
FD
I IN
FLO
WS
(USD
BIL
LIO
NS)
2.9
1.5
2.0
1.31.9
2.4 2.4
5.7
4.9
7.9
6.6%
-47.1%
27.2%
-33.9%
42.6%32.3%
-0.8%
136.2%
-14.0%
60.3%
150%
100%
50%
0%
-50%
-100%
GRO
WTH
RATE OF N
ET FDI IN
FLOW
S
Source: World Development Indicators
Net FDI infl ows Growth rate of net FDI infl ows
PHILIPPINES • 7
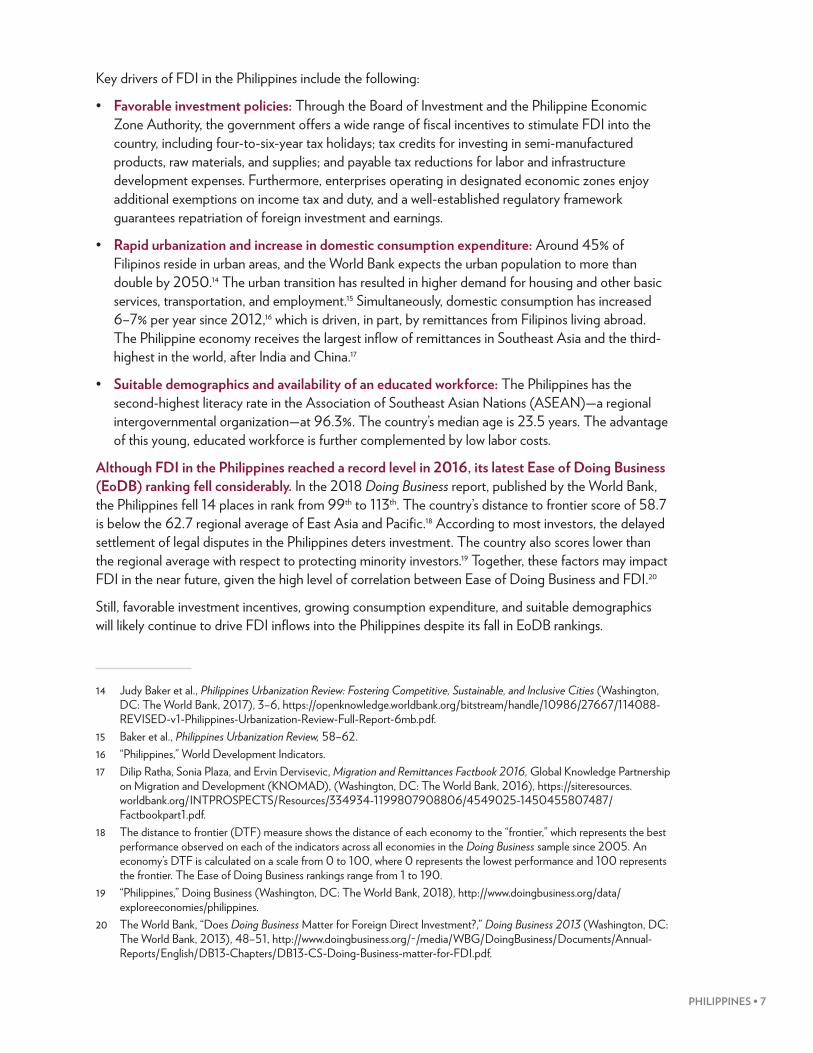
Key drivers of FDI in the Philippines include the following:
• Favorable investment policies: Through the Board of Investment and the Philippine Economic Zone Authority, the government offers a wide range of fiscal incentives to stimulate FDI into the country, including four-to-six-year tax holidays; tax credits for investing in semi-manufactured products, raw materials, and supplies; and payable tax reductions for labor and infrastructure development expenses. Furthermore, enterprises operating in designated economic zones enjoy additional exemptions on income tax and duty, and a well-established regulatory framework guarantees repatriation of foreign investment and earnings.
• Rapid urbanization and increase in domestic consumption expenditure: Around 45% of Filipinos reside in urban areas, and the World Bank expects the urban population to more than double by 2050.14 The urban transition has resulted in higher demand for housing and other basic services, transportation, and employment.15 Simultaneously, domestic consumption has increased 6–7% per year since 2012,16 which is driven, in part, by remittances from Filipinos living abroad. The Philippine economy receives the largest inflow of remittances in Southeast Asia and the third-highest in the world, after India and China.17
• Suitable demographics and availability of an educated workforce: The Philippines has the second-highest literacy rate in the Association of Southeast Asian Nations (ASEAN)—a regional intergovernmental organization—at 96.3%. The country’s median age is 23.5 years. The advantage of this young, educated workforce is further complemented by low labor costs.
Although FDI in the Philippines reached a record level in 2016, its latest Ease of Doing Business (EoDB) ranking fell considerably. In the 2018 Doing Business report, published by the World Bank, the Philippines fell 14 places in rank from 99th to 113th. The country’s distance to frontier score of 58.7 is below the 62.7 regional average of East Asia and Pacific.18 According to most investors, the delayed settlement of legal disputes in the Philippines deters investment. The country also scores lower than the regional average with respect to protecting minority investors.19 Together, these factors may impact FDI in the near future, given the high level of correlation between Ease of Doing Business and FDI.20
Still, favorable investment incentives, growing consumption expenditure, and suitable demographics will likely continue to drive FDI inflows into the Philippines despite its fall in EoDB rankings.
14 Judy Baker et al., Philippines Urbanization Review: Fostering Competitive, Sustainable, and Inclusive Cities (Washington, DC: The World Bank, 2017), 3–6, https://openknowledge.worldbank.org/bitstream/handle/10986/27667/114088-REVISED-v1-Philippines-Urbanization-Review-Full-Report-6mb.pdf.
15 Baker et al., Philippines Urbanization Review, 58–62.16 “Philippines,” World Development Indicators.17 Dilip Ratha, Sonia Plaza, and Ervin Dervisevic, Migration and Remittances Factbook 2016, Global Knowledge Partnership
on Migration and Development (KNOMAD), (Washington, DC: The World Bank, 2016), https://siteresources.worldbank.org/INTPROSPECTS/Resources/334934-1199807908806/4549025-1450455807487/Factbookpart1.pdf.
18 The distance to frontier (DTF) measure shows the distance of each economy to the “frontier,” which represents the best performance observed on each of the indicators across all economies in the Doing Business sample since 2005. An economy’s DTF is calculated on a scale from 0 to 100, where 0 represents the lowest performance and 100 represents the frontier. The Ease of Doing Business rankings range from 1 to 190.
19 “Philippines,” Doing Business (Washington, DC: The World Bank, 2018), http://www.doingbusiness.org/data/exploreeconomies/philippines.
20 The World Bank, “Does Doing Business Matter for Foreign Direct Investment?,” Doing Business 2013 (Washington, DC: The World Bank, 2013), 48–51, http://www.doingbusiness.org/~/media/WBG/DoingBusiness/Documents/Annual-Reports/English/DB13-Chapters/DB13-CS-Doing-Business-matter-for-FDI.pdf.

8 • THE LANDSCAPE FOR IMPACT INVESTING IN SOUTHEAST ASIA
INFLATION AND CURRENCY RISKS
The inflation rate in the Philippines has declined since the 2008 economic crisis. Since 2014, inflation has reduced dramatically, signaling economic stability and instilling investor confidence. The Philippine Peso (PHP) appreciated between 2009 and 2012, after which it depreciated through 2016 (Figure 4).
FIGURE 4: INFLATION AND EXCHANGE RATE
Source: World Development Indicators
47.7
FIGURE 4: INFLATION AND EXCHANGE RATE
1.8%1.4%
4.1%
3.0%
3.2%
4.6%3.8%4.2%
8.3%
2.9%
50
45
40
35
30
25
20
15
10
5
02007 2008 2009 2010 2011 2012 2013 2014 2015 2016
EXC
HAN
GE
RATE
(USD
/PH
P)IN
FLATION
(%)
0
3%
6%
9%
12%
15%43.3 42.2 42.4
46.1
44.3
45.1 44.4 45.5
47.3
Exchange rate Infl ation
Source: World Development Indicators
PHILIPPINES • 9
Social overview
HDI AND INCOME INEQUALITY
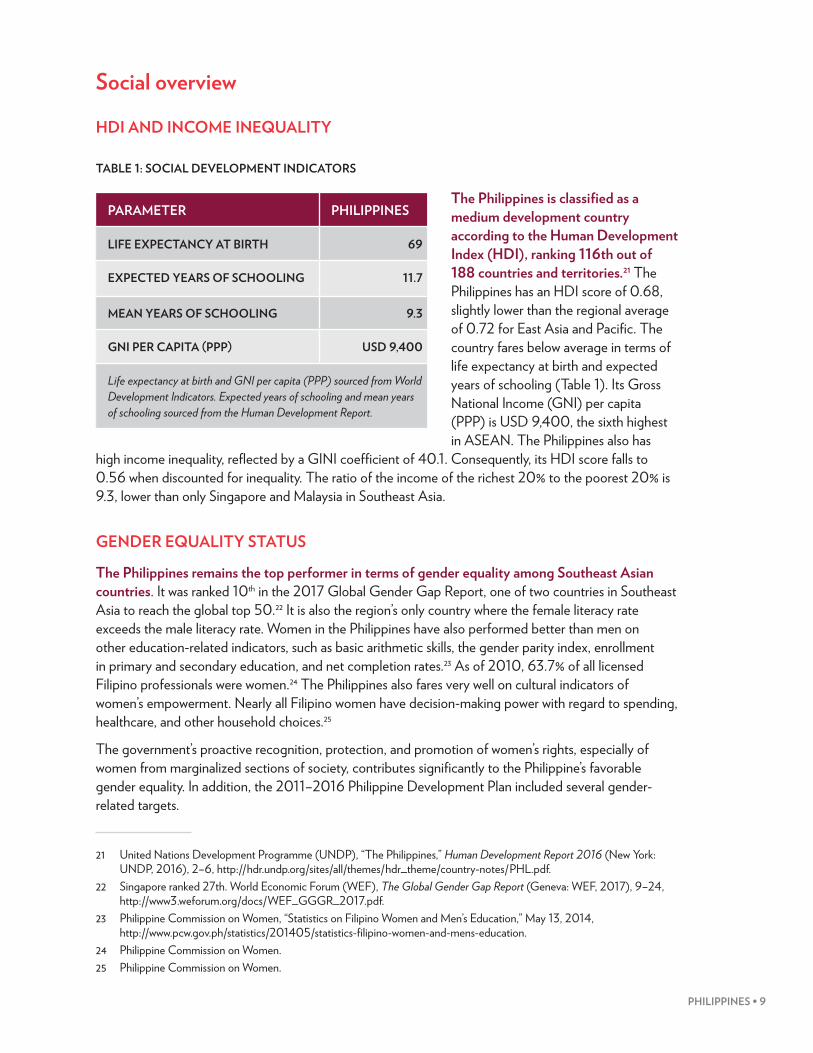
TABLE 1: SOCIAL DEVELOPMENT INDICATORSTABLE 1: SOCIAL DEVELOPMENT INDICATORS
PARAMETER PHILIPPINES
LIFE EXPECTANCY AT BIRTH 69
EXPECTED YEARS OF SCHOOLING 11.7
MEAN YEARS OF SCHOOLING 9.3
GNI PER CAPITA (PPP) USD 9,400
Life expectancy at birth and GNI per capita (PPP) sourced from World Development Indicators. Expected years of schooling and mean years of schooling sourced from the Human Development Report.
The Philippines is classified as a medium development country according to the Human Development Index (HDI), ranking 116th out of 188 countries and territories.21 The Philippines has an HDI score of 0.68, slightly lower than the regional average of 0.72 for East Asia and Pacific. The country fares below average in terms of life expectancy at birth and expected years of schooling (Table 1). Its Gross National Income (GNI) per capita (PPP) is USD 9,400, the sixth highest in ASEAN. The Philippines also has
high income inequality, reflected by a GINI coefficient of 40.1. Consequently, its HDI score falls to 0.56 when discounted for inequality. The ratio of the income of the richest 20% to the poorest 20% is 9.3, lower than only Singapore and Malaysia in Southeast Asia.
GENDER EQUALITY STATUS
The Philippines remains the top performer in terms of gender equality among Southeast Asian countries. It was ranked 10th in the 2017 Global Gender Gap Report, one of two countries in Southeast Asia to reach the global top 50.22 It is also the region’s only country where the female literacy rate exceeds the male literacy rate. Women in the Philippines have also performed better than men on other education-related indicators, such as basic arithmetic skills, the gender parity index, enrollment in primary and secondary education, and net completion rates.23 As of 2010, 63.7% of all licensed Filipino professionals were women.24 The Philippines also fares very well on cultural indicators of women’s empowerment. Nearly all Filipino women have decision-making power with regard to spending, healthcare, and other household choices.25
The government’s proactive recognition, protection, and promotion of women’s rights, especially of women from marginalized sections of society, contributes significantly to the Philippine’s favorable gender equality. In addition, the 2011–2016 Philippine Development Plan included several gender-related targets.
21 United Nations Development Programme (UNDP), “The Philippines,” Human Development Report 2016 (New York: UNDP, 2016), 2–6, http://hdr.undp.org/sites/all/themes/hdr_theme/country-notes/PHL.pdf.
22 Singapore ranked 27th. World Economic Forum (WEF), The Global Gender Gap Report (Geneva: WEF, 2017), 9–24, http://www3.weforum.org/docs/WEF_GGGR_2017.pdf.
23 Philippine Commission on Women, “Statistics on Filipino Women and Men’s Education,” May 13, 2014, http://www.pcw.gov.ph/statistics/201405/statistics-filipino-women-and-mens-education.
24 Philippine Commission on Women.25 Philippine Commission on Women.
10 • THE LANDSCAPE FOR IMPACT INVESTING IN SOUTHEAST ASIA
KEY DEVELOPMENT CHALLENGES AND PERFORMANCE ON THE SDGs
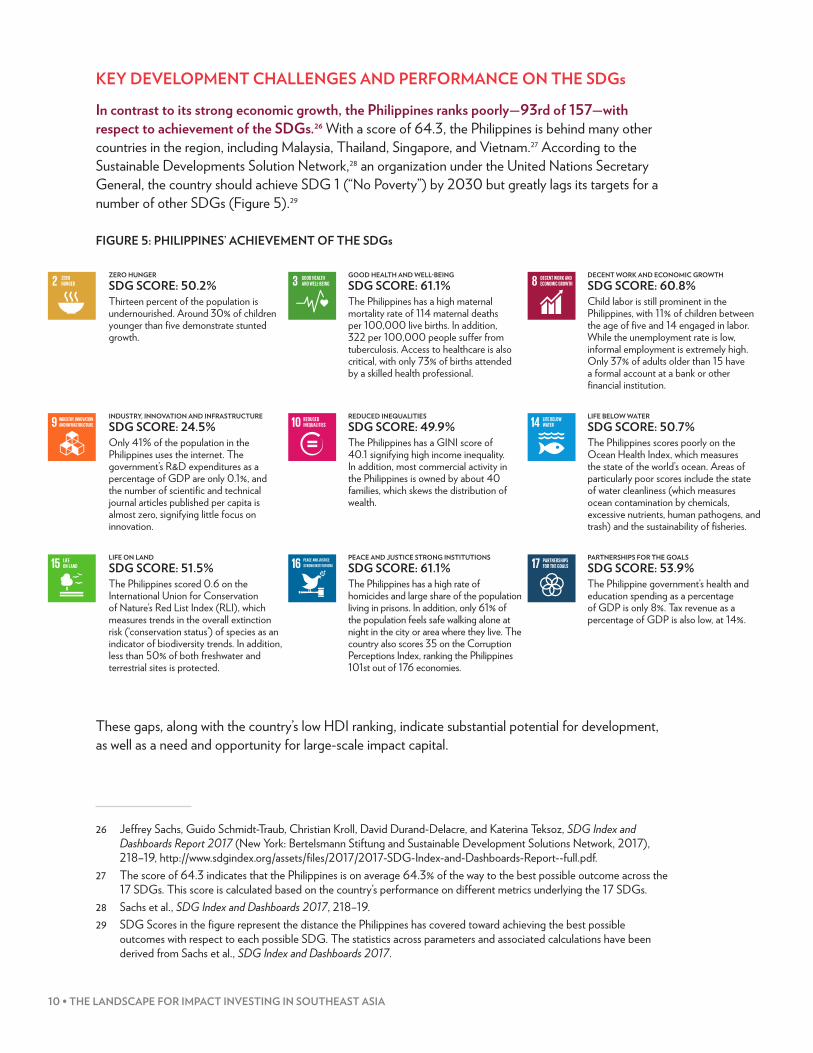
In contrast to its strong economic growth, the Philippines ranks poorly—93rd of 157—with respect to achievement of the SDGs.26 With a score of 64.3, the Philippines is behind many other countries in the region, including Malaysia, Thailand, Singapore, and Vietnam.27 According to the Sustainable Developments Solution Network,28 an organization under the United Nations Secretary General, the country should achieve SDG 1 (“No Poverty”) by 2030 but greatly lags its targets for a number of other SDGs (Figure 5).29
FIGURE 5: PHILIPPINES’ ACHIEVEMENT OF THE SDGs
These gaps, along with the country’s low HDI ranking, indicate substantial potential for development, as well as a need and opportunity for large-scale impact capital.
26 Jeffrey Sachs, Guido Schmidt-Traub, Christian Kroll, David Durand-Delacre, and Katerina Teksoz, SDG Index and Dashboards Report 2017 (New York: Bertelsmann Stiftung and Sustainable Development Solutions Network, 2017), 218–19, http://www.sdgindex.org/assets/files/2017/2017-SDG-Index-and-Dashboards-Report--full.pdf.
27 The score of 64.3 indicates that the Philippines is on average 64.3% of the way to the best possible outcome across the 17 SDGs. This score is calculated based on the country’s performance on different metrics underlying the 17 SDGs.
28 Sachs et al., SDG Index and Dashboards 2017, 218–19.29 SDG Scores in the figure represent the distance the Philippines has covered toward achieving the best possible
outcomes with respect to each possible SDG. The statistics across parameters and associated calculations have been derived from Sachs et al., SDG Index and Dashboards 2017.
ZERO HUNGER
SDG SCORE: 50.2%Thirteen percent of the population is undernourished. Around 30% of children younger than fi ve demonstrate stunted growth.
GOOD HEALTH AND WELL-BEING
SDG SCORE: 61.1%The Philippines has a high maternal mortality rate of 114 maternal deaths per 100,000 live births. In addition, 322 per 100,000 people suff er from tuberculosis. Access to healthcare is also critical, with only 73% of births attended by a skilled health professional.
DECENT WORK AND ECONOMIC GROWTH
SDG SCORE: 60.8%Child labor is still prominent in the Philippines, with 11% of children between the age of fi ve and 14 engaged in labor. While the unemployment rate is low, informal employment is extremely high. Only 37% of adults older than 15 have a formal account at a bank or other fi nancial institution.
INDUSTRY, INNOVATION AND INFRASTRUCTURE
SDG SCORE: 24.5%Only 41% of the population in the Philippines uses the internet. The government’s R&D expenditures as a percentage of GDP are only 0.1%, and the number of scientifi c and technical journal articles published per capita is almost zero, signifying little focus on innovation.
REDUCED INEQUALITIES
SDG SCORE: 49.9%The Philippines has a GINI score of 40.1 signifying high income inequality. In addition, most commercial activity in the Philippines is owned by about 40 families, which skews the distribution of wealth.
LIFE BELOW WATER
SDG SCORE: 50.7%The Philippines scores poorly on the Ocean Health Index, which measures the state of the world’s ocean. Areas of particularly poor scores include the state of water cleanliness (which measures ocean contamination by chemicals, excessive nutrients, human pathogens, and trash) and the sustainability of fi sheries.
LIFE ON LAND
SDG SCORE: 51.5%The Philippines scored 0.6 on the International Union for Conservation of Nature’s Red List Index (RLI), which measures trends in the overall extinction risk (‘conservation status’) of species as an indicator of biodiversity trends. In addition, less than 50% of both freshwater and terrestrial sites is protected.
PEACE AND JUSTICE STRONG INSTITUTIONS
SDG SCORE: 61.1%The Philippines has a high rate of homicides and large share of the population living in prisons. In addition, only 61% of the population feels safe walking alone at night in the city or area where they live. The country also scores 35 on the Corruption Perceptions Index, ranking the Philippines 101st out of 176 economies.
PARTNERSHIPS FOR THE GOALS
SDG SCORE: 53.9%The Philippine government’s health and education spending as a percentage of GDP is only 8%. Tax revenue as a percentage of GDP is also low, at 14%.
FIGURE 5: PHILIPPINES’ ACHIEVEMENT OF THE SDGS
PHILIPPINES • 11
THE SUPPLY OF IMPACT CAPITAL IN THE PHILIPPINES
OverviewSince 2007, the impact investing sector has grown substantially in the Philippines. Private Impact Investors (PIIs) have deployed USD 107.2 million in 54 deals in a wide range of sectors, including financial services, agriculture, workforce development, and energy. Equity has been the most widely used instrument among PIIs. Non-banking financial institutions also provide some capital, as well as business development sources. As of 2017, there were no disclosed records of exits.
Development Finance Institutions (DFIs) have cumulatively deployed around USD 2.3 billion in 43 deals. Most of these investments were directed towards large-scale microfinance, infrastructure, and energy projects with potential multiplier effects on development and economic growth in the country.
In total, USD 2.4 billion in impact capital has been deployed through 97 deals in the Philippines since 2007, making it the second-largest recipient of impact capital in the region. The following sections detail the landscape of both PIIs and DFI investors.
12 • THE LANDSCAPE FOR IMPACT INVESTING IN SOUTHEAST ASIA
Private impact investors
OVERVIEW
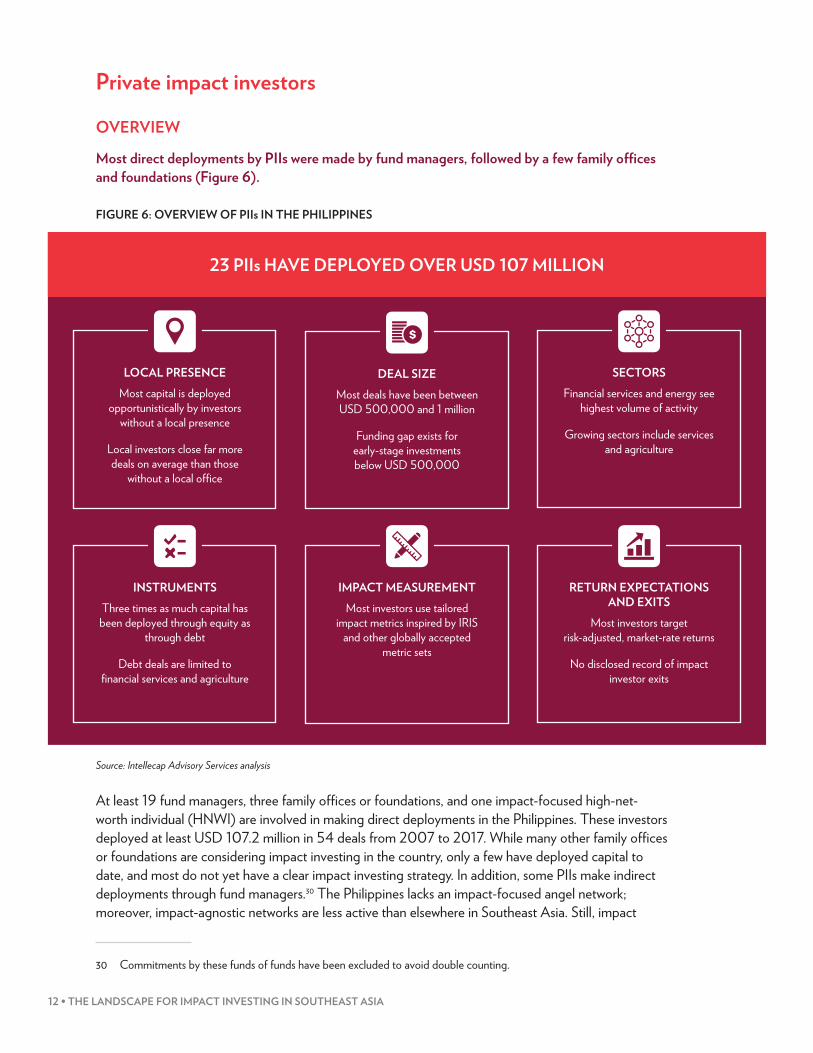
Most direct deployments by PIIs were made by fund managers, followed by a few family offices and foundations (Figure 6).
FIGURE 6: OVERVIEW OF PIIs IN THE PHILIPPINES
Source: Intellecap Advisory Services analysis
At least 19 fund managers, three family offices or foundations, and one impact-focused high-net-worth individual (HNWI) are involved in making direct deployments in the Philippines. These investors deployed at least USD 107.2 million in 54 deals from 2007 to 2017. While many other family offices or foundations are considering impact investing in the country, only a few have deployed capital to date, and most do not yet have a clear impact investing strategy. In addition, some PIIs make indirect deployments through fund managers.30 The Philippines lacks an impact-focused angel network; moreover, impact-agnostic networks are less active than elsewhere in Southeast Asia. Still, impact
30 Commitments by these funds of funds have been excluded to avoid double counting.
FIGURE 6: OVERVIEW OF PIIS IN THE PHILIPPINES
23 PIIs HAVE DEPLOYED OVER USD 107 MILLION
Source: Intellecap Advisory Services analysis
RETURN EXPECTATIONS AND EXITS
Most investors target risk-adjusted, market-rate returns
No disclosed record of impact investor exits
LOCAL PRESENCEMost capital is deployed
opportunistically by investors without a local presence
Local investors close far more deals on average than those
without a local offi ce
DEAL SIZEMost deals have been between USD 500,000 and 1 million
Funding gap exists for early-stage investments below USD 500,000
SECTORSFinancial services and energy see
highest volume of activity
Growing sectors include services and agriculture
IMPACT MEASUREMENTMost investors use tailored
impact metrics inspired by IRIS and other globally accepted
metric sets
INSTRUMENTSThree times as much capital has been deployed through equity as
through debt
Debt deals are limited to fi nancial services and agriculture
PHILIPPINES • 13
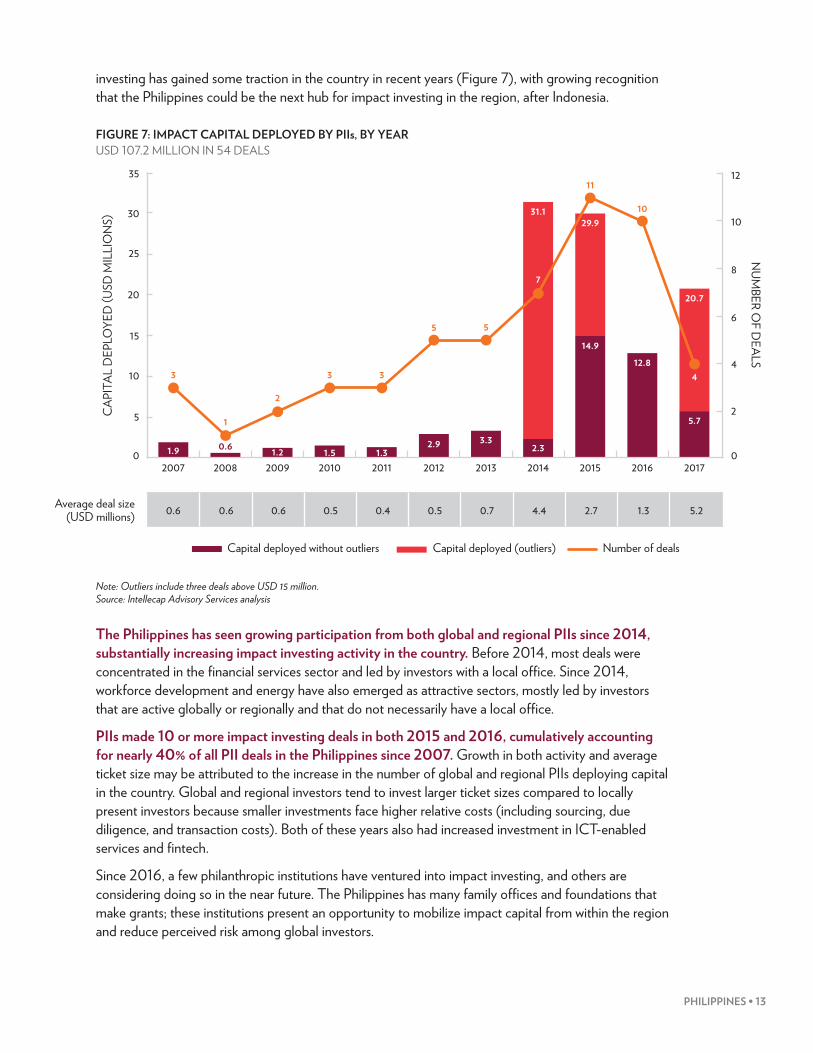
investing has gained some traction in the country in recent years (Figure 7), with growing recognition that the Philippines could be the next hub for impact investing in the region, after Indonesia.
FIGURE 7: IMPACT CAPITAL DEPLOYED BY PIIs, BY YEAR USD 107.2 MILLION IN 54 DEALS
Note: Outliers include three deals above USD 15 million. Source: Intellecap Advisory Services analysis
The Philippines has seen growing participation from both global and regional PIIs since 2014, substantially increasing impact investing activity in the country. Before 2014, most deals were concentrated in the financial services sector and led by investors with a local office. Since 2014, workforce development and energy have also emerged as attractive sectors, mostly led by investors that are active globally or regionally and that do not necessarily have a local office.
PIIs made 10 or more impact investing deals in both 2015 and 2016, cumulatively accounting for nearly 40% of all PII deals in the Philippines since 2007. Growth in both activity and average ticket size may be attributed to the increase in the number of global and regional PIIs deploying capital in the country. Global and regional investors tend to invest larger ticket sizes compared to locally present investors because smaller investments face higher relative costs (including sourcing, due diligence, and transaction costs). Both of these years also had increased investment in ICT-enabled services and fintech.
Since 2016, a few philanthropic institutions have ventured into impact investing, and others are considering doing so in the near future. The Philippines has many family offices and foundations that make grants; these institutions present an opportunity to mobilize impact capital from within the region and reduce perceived risk among global investors.
FIGURE 7: IMPACT CAPITAL DEPLOYED BY PIIS, BY YEARUSD 107.2 MILLION IN 54 DEALS
35
30
25
20
15
10
5
0 1.9
3
1
2
3 3
5 5
7
11
10
4
2007 2008 2009 2010 2011 2012 2013 2014 2015 2016 2017
0.6 1.2 1.5 1.32.9 3.3
2.3
14.912.8
5.7
0
2
4
6
8
10
12
CAP
ITAL
DEP
LOYE
D (U
SD M
ILLI
ON
S)
NUM
BER OF D
EALS
Average deal size (USD millions) 0.6 0.6 0.6 0.5 0.4 0.5 0.7 4.4 2.7 1.3 5.2
31.129.9
20.7
Source: Intellecap Advisory Services analysis
Capital deployed without outliers Number of dealsCapital deployed (outliers)
14 • THE LANDSCAPE FOR IMPACT INVESTING IN SOUTHEAST ASIA
LOCAL PRESENCE
FIGURE 8: PIIs WITH AND WITHOUT A LOCAL PRESENCE
Source: Intellecap Advisory Services analysis
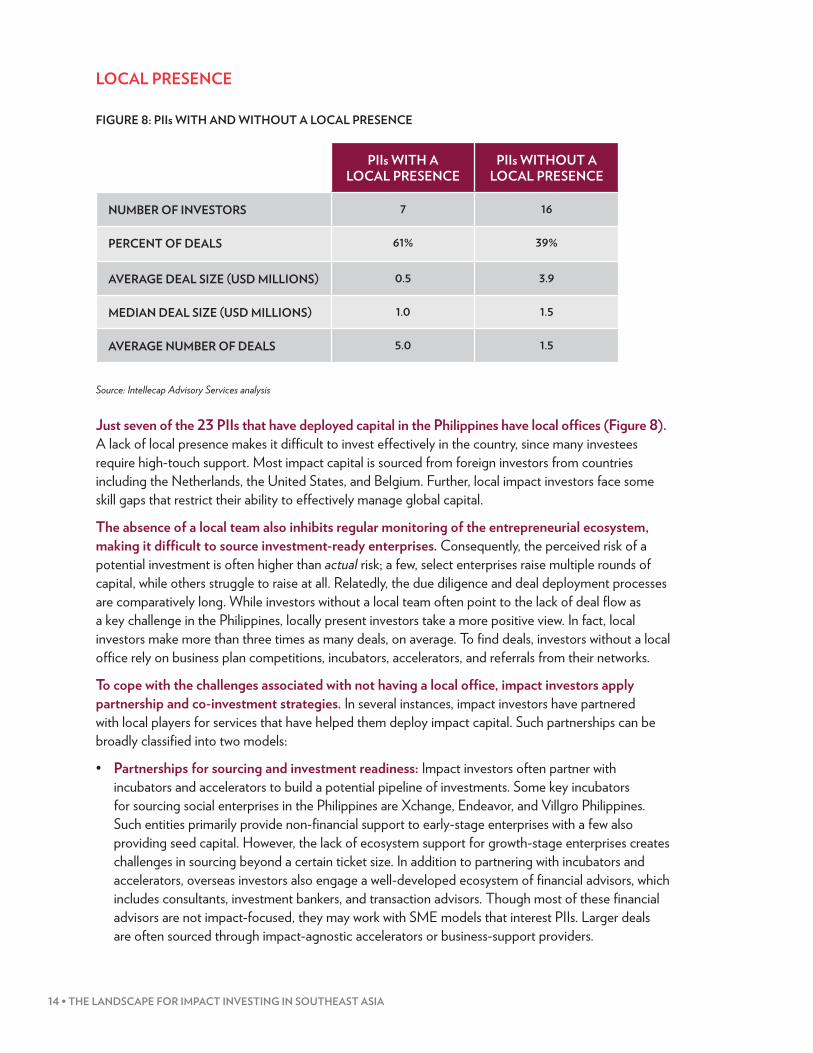
Just seven of the 23 PIIs that have deployed capital in the Philippines have local offices (Figure 8). A lack of local presence makes it difficult to invest effectively in the country, since many investees require high-touch support. Most impact capital is sourced from foreign investors from countries including the Netherlands, the United States, and Belgium. Further, local impact investors face some skill gaps that restrict their ability to effectively manage global capital.
The absence of a local team also inhibits regular monitoring of the entrepreneurial ecosystem, making it difficult to source investment-ready enterprises. Consequently, the perceived risk of a potential investment is often higher than actual risk; a few, select enterprises raise multiple rounds of capital, while others struggle to raise at all. Relatedly, the due diligence and deal deployment processes are comparatively long. While investors without a local team often point to the lack of deal flow as a key challenge in the Philippines, locally present investors take a more positive view. In fact, local investors make more than three times as many deals, on average. To find deals, investors without a local office rely on business plan competitions, incubators, accelerators, and referrals from their networks.
To cope with the challenges associated with not having a local office, impact investors apply partnership and co-investment strategies. In several instances, impact investors have partnered with local players for services that have helped them deploy impact capital. Such partnerships can be broadly classified into two models:
• Partnerships for sourcing and investment readiness: Impact investors often partner with incubators and accelerators to build a potential pipeline of investments. Some key incubators for sourcing social enterprises in the Philippines are Xchange, Endeavor, and Villgro Philippines. Such entities primarily provide non-financial support to early-stage enterprises with a few also providing seed capital. However, the lack of ecosystem support for growth-stage enterprises creates challenges in sourcing beyond a certain ticket size. In addition to partnering with incubators and accelerators, overseas investors also engage a well-developed ecosystem of financial advisors, which includes consultants, investment bankers, and transaction advisors. Though most of these financial advisors are not impact-focused, they may work with SME models that interest PIIs. Larger deals are often sourced through impact-agnostic accelerators or business-support providers.
FIGURE 8: PIIS WITH AND WITHOUT A LOCAL PRESENCE
PIIs WITH A LOCAL PRESENCE
PIIs WITHOUT A LOCAL PRESENCE
NUMBER OF INVESTORS 7 16
PERCENT OF DEALS 61% 39%
AVERAGE DEAL SIZE (USD MILLIONS) 0.5 3.9
MEDIAN DEAL SIZE (USD MILLIONS) 1.0 1.5
AVERAGE NUMBER OF DEALS 5.0 1.5
Source: Intellecap Advisory Services analysis
PHILIPPINES • 15
• Partnerships for co-investing: Quite a few deals in the Philippines have been co-investments between global impact investors and local investors who may or may not seek impact. Within this framework, investors can provide high-touch support for their investees through their local, co-investing partner. For instance, in 2016, Series A investors into Singapore-headquartered mClinica included Patamar Capital, MDI Ventures, and Global Innovation Fund. Endeavor Catalyst, a vehicle that supports entrepreneurs working with the Endeavor Group, also acted as a co-investment partner. Of these four investors, only Endeavor has a full-time local presence in the Philippines.31
DEAL SIZE
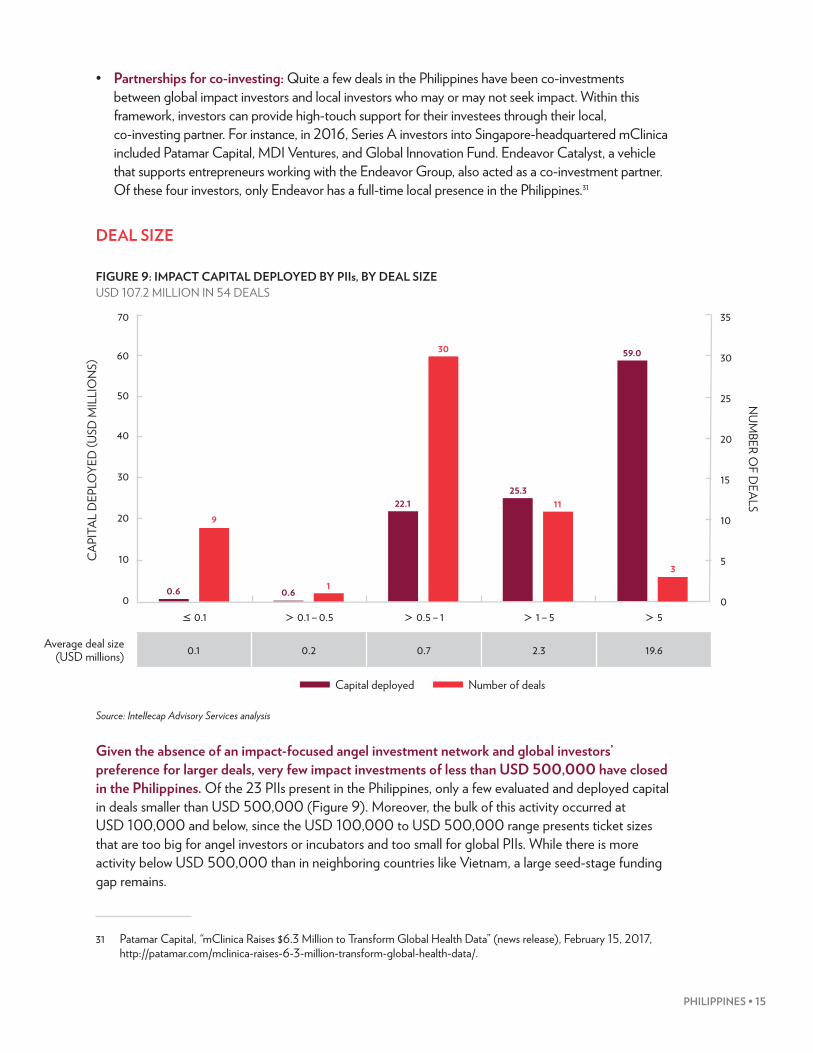
FIGURE 9: IMPACT CAPITAL DEPLOYED BY PIIs, BY DEAL SIZE USD 107.2 MILLION IN 54 DEALS
Source: Intellecap Advisory Services analysis
Given the absence of an impact-focused angel investment network and global investors’ preference for larger deals, very few impact investments of less than USD 500,000 have closed in the Philippines. Of the 23 PIIs present in the Philippines, only a few evaluated and deployed capital in deals smaller than USD 500,000 (Figure 9). Moreover, the bulk of this activity occurred at USD 100,000 and below, since the USD 100,000 to USD 500,000 range presents ticket sizes that are too big for angel investors or incubators and too small for global PIIs. While there is more activity below USD 500,000 than in neighboring countries like Vietnam, a large seed-stage funding gap remains.
31 Patamar Capital, “mClinica Raises $6.3 Million to Transform Global Health Data” (news release), February 15, 2017, http://patamar.com/mclinica-raises-6-3-million-transform-global-health-data/.
FIGURE 9: IMPACT CAPITAL DEPLOYED BY PIIS, BY DEAL SIZE USD 107.2 MILLION IN 54 DEALS
Source: Intellecap Advisory Services analysis
70
60
50
40
30
20
10
0≤ 0.1 > 0.1 – 0.5 > 0.5 – 1 > 1 – 5 > 5
CAP
ITAL
DEP
LOYE
D (U
SD M
ILLI
ON
S)
NUM
BER OF D
EALS
0.6 0.6
22.125.3
59.0
9
1
30
11
3
35
30
25
20
15
10
5
0
Average deal size (USD millions) 0.1 0.2 0.7 2.3 19.6
Capital deployed Number of deals
16 • THE LANDSCAPE FOR IMPACT INVESTING IN SOUTHEAST ASIA
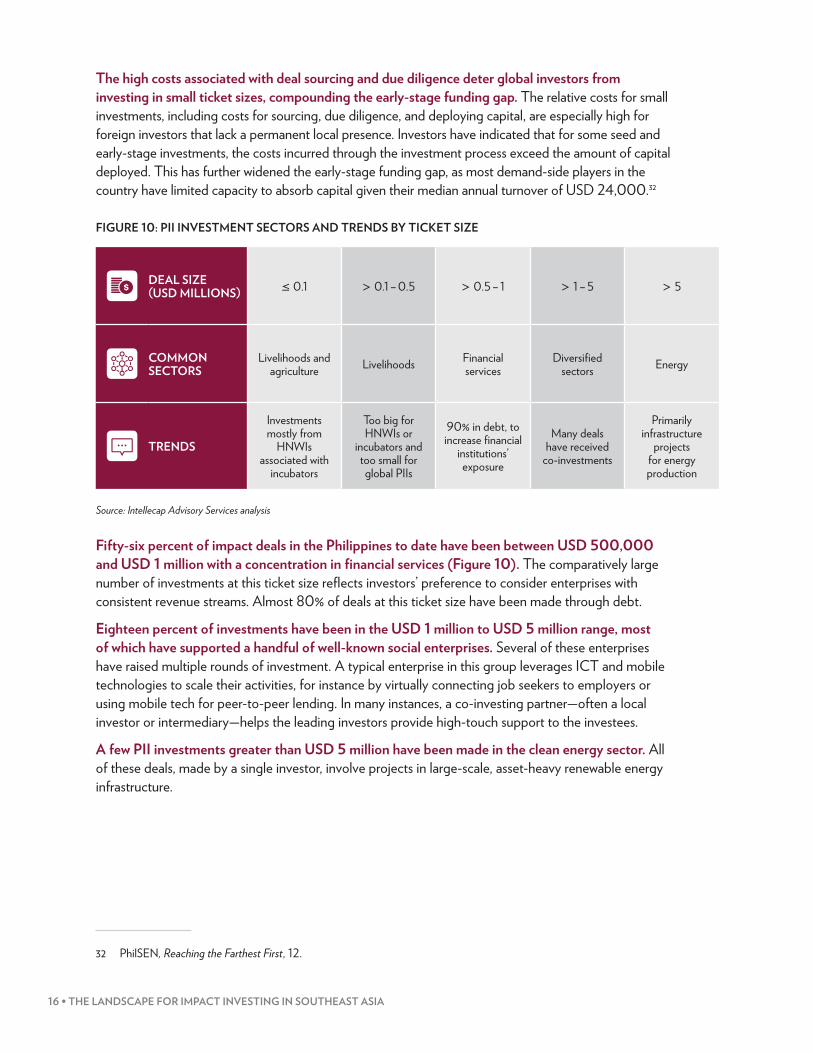
The high costs associated with deal sourcing and due diligence deter global investors from investing in small ticket sizes, compounding the early-stage funding gap. The relative costs for small investments, including costs for sourcing, due diligence, and deploying capital, are especially high for foreign investors that lack a permanent local presence. Investors have indicated that for some seed and early-stage investments, the costs incurred through the investment process exceed the amount of capital deployed. This has further widened the early-stage funding gap, as most demand-side players in the country have limited capacity to absorb capital given their median annual turnover of USD 24,000.32
FIGURE 10: PII INVESTMENT SECTORS AND TRENDS BY TICKET SIZE
Source: Intellecap Advisory Services analysis
Fifty-six percent of impact deals in the Philippines to date have been between USD 500,000 and USD 1 million with a concentration in financial services (Figure 10). The comparatively large number of investments at this ticket size reflects investors’ preference to consider enterprises with consistent revenue streams. Almost 80% of deals at this ticket size have been made through debt.
Eighteen percent of investments have been in the USD 1 million to USD 5 million range, most of which have supported a handful of well-known social enterprises. Several of these enterprises have raised multiple rounds of investment. A typical enterprise in this group leverages ICT and mobile technologies to scale their activities, for instance by virtually connecting job seekers to employers or using mobile tech for peer-to-peer lending. In many instances, a co-investing partner—often a local investor or intermediary—helps the leading investors provide high-touch support to the investees.
A few PII investments greater than USD 5 million have been made in the clean energy sector. All of these deals, made by a single investor, involve projects in large-scale, asset-heavy renewable energy infrastructure.
32 PhilSEN, Reaching the Farthest First, 12.
FIGURE 10: PII INVESTMENT SECTORS AND TRENDS, BY DEAL SIZE
DEAL SIZE (USD MILLIONS) ≤ 0.1 > 0.1 – 0.5 > 0.5 – 1 > 1 – 5 > 5
COMMON SECTORS
Livelihoods and agriculture Livelihoods Financial
servicesDiversifi ed
sectors Energy
TRENDS
Investments mostly from
HNWIs associated with
incubators
Too big for HNWIs or
incubators and too small for global PIIs
90% in debt, to increase fi nancial
institutions’ exposure
Many deals have received
co-investments
Primarily infrastructure
projects for energy production
PHILIPPINES • 17
SECTORS
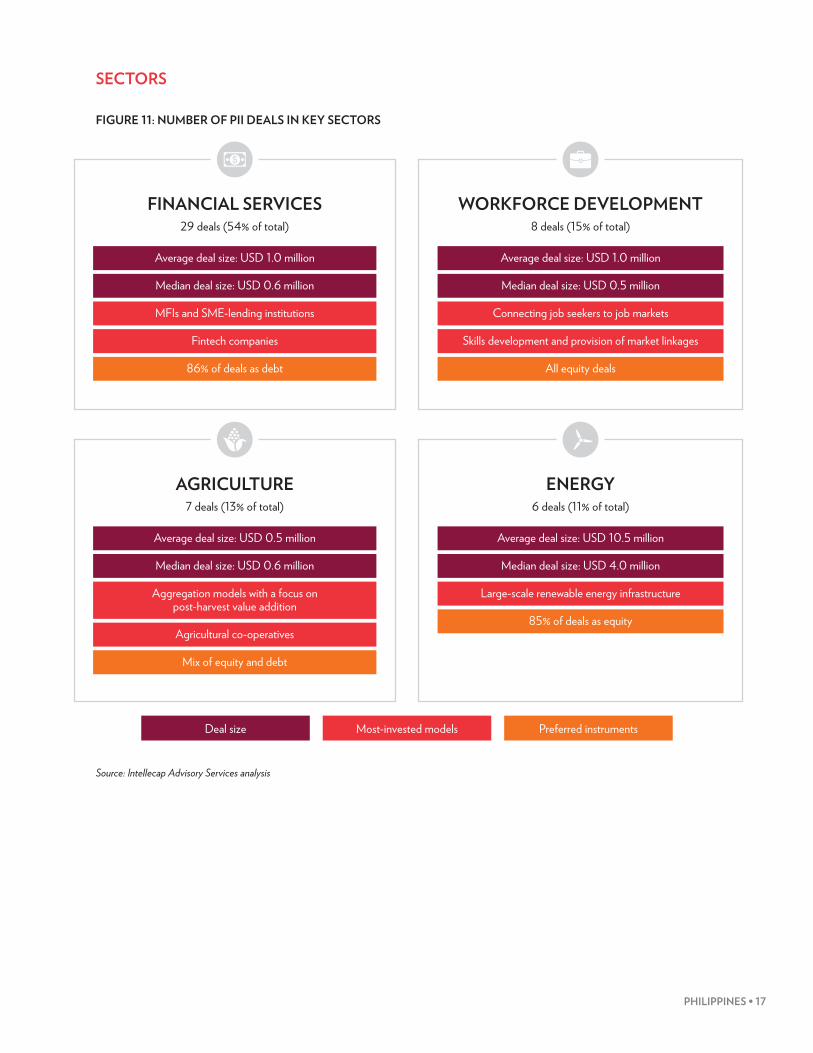
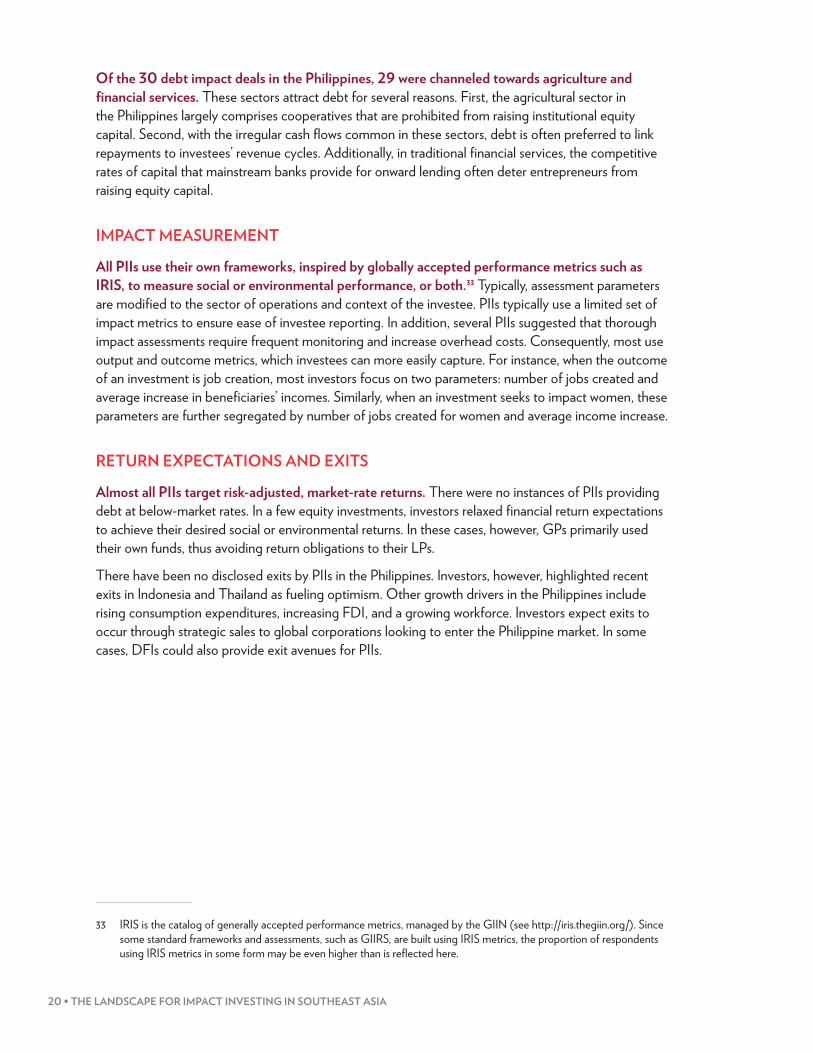
FIGURE 11: NUMBER OF PII DEALS IN KEY SECTORS
Source: Intellecap Advisory Services analysis
FIGURE 11: NUMBER OF PII DEALS IN KEY SECTORS
FINANCIAL SERVICES29 deals (54% of total)
Average deal size: USD 1.0 million
Median deal size: USD 0.6 million
MFIs and SME-lending institutions
Fintech companies
86% of deals as debt
WORKFORCE DEVELOPMENT8 deals (15% of total)
Average deal size: USD 1.0 million
Median deal size: USD 0.5 million
Connecting job seekers to job markets
Skills development and provision of market linkages
All equity deals
AGRICULTURE7 deals (13% of total)
Average deal size: USD 0.5 million
Median deal size: USD 0.6 million
Aggregation models with a focus on post-harvest value addition
Agricultural co-operatives
Mix of equity and debt
ENERGY6 deals (11% of total)
Average deal size: USD 10.5 million
Median deal size: USD 4.0 million
Large-scale renewable energy infrastructure
85% of deals as equity
Deal size Most-invested models Preferred instruments

18 • THE LANDSCAPE FOR IMPACT INVESTING IN SOUTHEAST ASIA
FIGURE 12: IMPACT CAPITAL DEPLOYED BY PIIs, BY SECTOR USD 107.2 MILLION IN 54 DEALS
Note: Others include fisheries, media, and big data. Source: Intellecap Advisory Services analysis
Most deals (29 of 54) have been in the financial services sector (Figures 11 and 12), typically to increase MFIs’ exposure or, in a few instances, to support fintech companies. Together, USD 29.3 million has been deployed in this sector. Though there have been fewer fintech deals (4 of the 29), the average deal size has been much higher, at around USD 2.4 million compared to around USD 800,000 for investments in MFIs or SME financing organizations. MFIs and SME financing organizations receive lower ticket sizes in part due to the competitive rates at which they can raise collateralized loans from mainstream commercial banks. Most investments into lending institutions were made as debt, but more scalable fintech models have also received equity infusions.
The workforce development sector has seen the second-highest number of deals, in part because business models that cater to the country’s young population are highly scalable. A total of USD 5.9 million has been deployed as equity into eight deals in this sector, with an average deal size of USD 740,000 and a median of USD 470,000. Most deals involved enterprises that connect job seekers to potential employers, organizations that are engaged in youth skills development, or organizations that promote micro-entrepreneurship by providing end-to-end support services to youth from marginalized communities.
The energy sector has the highest average ticket size, as most of its investment has sought to develop large-scale infrastructure. In total, USD 63 million of impact capital has been channeled to four large-scale deals in the energy sector to develop Philippine renewable energy capacity, specifically
Average deal size (USD millions) 10.5 1.0 0.7 0.6 1.5 1.0
FIGURE 12: IMPACT CAPITAL DEPLOYED BY PIIS, BY SECTORUSD 107.2 MILLION IN 54 DEALS
70
60
50
40
30
20
10
0
Energy Financial services Workforce development
Agriculture Healthcare
CAP
ITAL
DEP
LOYE
D (U
SD M
ILLI
ON
S)
NUM
BER OF D
EALS
35
30
25
20
15
10
5
0
Capital deployed Number of deals
Others*
6
29
87
1
29.3
63.2
5.9 4.21.5 3.1
3
Source: Intellecap Advisory Services analysis
PHILIPPINES • 19
geo-thermal and solar energy. Around USD 200,000 has been deployed through three deals into smaller, clean energy projects involving electronic vehicles or micro-grids.
Almost 20% of social enterprises in the Philippines operate in the agricultural sector, which has received just 3% of PII capital. Seven deals have channeled around USD 4.2 million in impact capital through both debt and equity instruments in an average deal size of USD 600,000. The debt deals have provided working capital, whereas most of the equity deals have supported business models that aggregate farmers and their produce, either as cooperatives or without a formalized legal structure, and provide end-to-end support for the value chain.
INSTRUMENTS
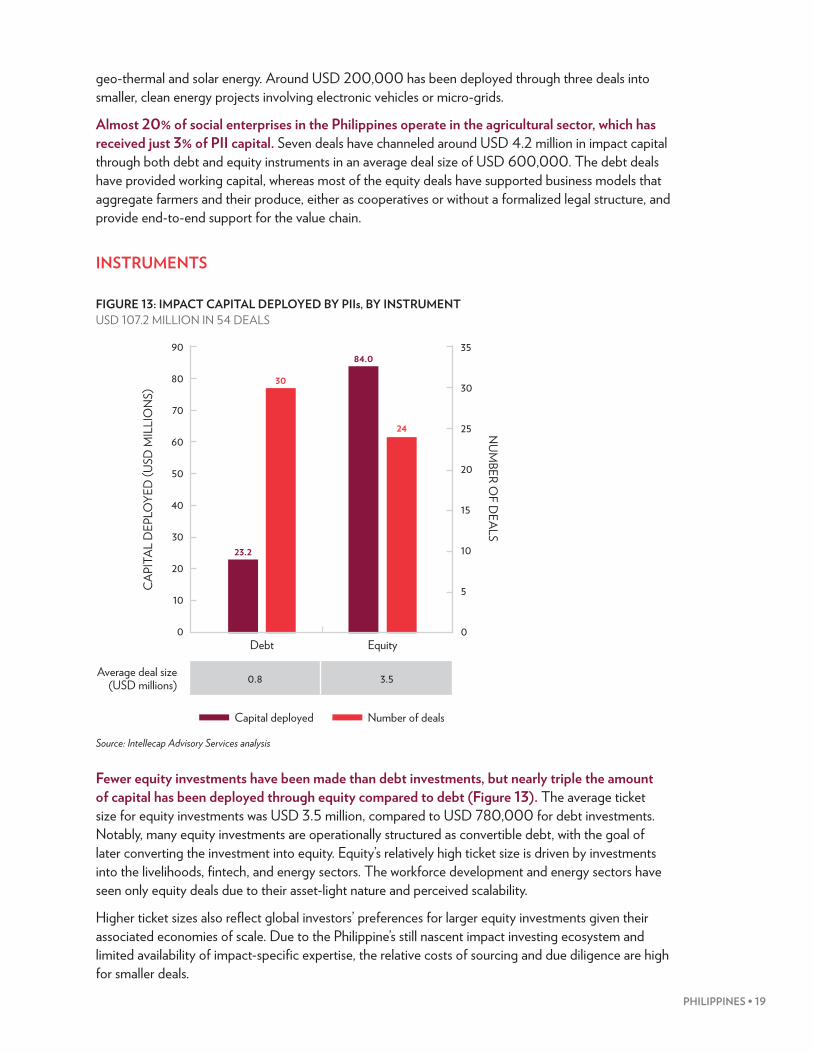
FIGURE 13: IMPACT CAPITAL DEPLOYED BY PIIs, BY INSTRUMENT USD 107.2 MILLION IN 54 DEALS
Source: Intellecap Advisory Services analysis
Fewer equity investments have been made than debt investments, but nearly triple the amount of capital has been deployed through equity compared to debt (Figure 13). The average ticket size for equity investments was USD 3.5 million, compared to USD 780,000 for debt investments. Notably, many equity investments are operationally structured as convertible debt, with the goal of later converting the investment into equity. Equity’s relatively high ticket size is driven by investments into the livelihoods, fintech, and energy sectors. The workforce development and energy sectors have seen only equity deals due to their asset-light nature and perceived scalability.
Higher ticket sizes also reflect global investors’ preferences for larger equity investments given their associated economies of scale. Due to the Philippine’s still nascent impact investing ecosystem and limited availability of impact-specific expertise, the relative costs of sourcing and due diligence are high for smaller deals.
FIGURE 13: IMPACT CAPITAL DEPLOYED BY PIIS, BY INSTRUMENT USD 107.2 MILLION IN 54 DEALS
90
80
70
60
50
40
30
20
10
0
35
30
25
20
15
10
5
0
CAP
ITAL
DEP
LOYE
D (U
SD M
ILLI
ON
S)
NUM
BER OF D
EALS
Debt Equity
23.2
30
84.0
24
Capital deployed Number of deals
Average deal size (USD millions) 0.8 3.5
Source: Intellecap Advisory Services analysis
20 • THE LANDSCAPE FOR IMPACT INVESTING IN SOUTHEAST ASIA
Of the 30 debt impact deals in the Philippines, 29 were channeled towards agriculture and financial services. These sectors attract debt for several reasons. First, the agricultural sector in the Philippines largely comprises cooperatives that are prohibited from raising institutional equity capital. Second, with the irregular cash flows common in these sectors, debt is often preferred to link repayments to investees’ revenue cycles. Additionally, in traditional financial services, the competitive rates of capital that mainstream banks provide for onward lending often deter entrepreneurs from raising equity capital.
IMPACT MEASUREMENT
All PIIs use their own frameworks, inspired by globally accepted performance metrics such as IRIS, to measure social or environmental performance, or both.33 Typically, assessment parameters are modified to the sector of operations and context of the investee. PIIs typically use a limited set of impact metrics to ensure ease of investee reporting. In addition, several PIIs suggested that thorough impact assessments require frequent monitoring and increase overhead costs. Consequently, most use output and outcome metrics, which investees can more easily capture. For instance, when the outcome of an investment is job creation, most investors focus on two parameters: number of jobs created and average increase in beneficiaries’ incomes. Similarly, when an investment seeks to impact women, these parameters are further segregated by number of jobs created for women and average income increase.
RETURN EXPECTATIONS AND EXITS
Almost all PIIs target risk-adjusted, market-rate returns. There were no instances of PIIs providing debt at below-market rates. In a few equity investments, investors relaxed financial return expectations to achieve their desired social or environmental returns. In these cases, however, GPs primarily used their own funds, thus avoiding return obligations to their LPs.
There have been no disclosed exits by PIIs in the Philippines. Investors, however, highlighted recent exits in Indonesia and Thailand as fueling optimism. Other growth drivers in the Philippines include rising consumption expenditures, increasing FDI, and a growing workforce. Investors expect exits to occur through strategic sales to global corporations looking to enter the Philippine market. In some cases, DFIs could also provide exit avenues for PIIs.
33 IRIS is the catalog of generally accepted performance metrics, managed by the GIIN (see http://iris.thegiin.org/). Since some standard frameworks and assessments, such as GIIRS, are built using IRIS metrics, the proportion of respondents using IRIS metrics in some form may be even higher than is reflected here.
PHILIPPINES • 21
Development finance institutions
OVERVIEW
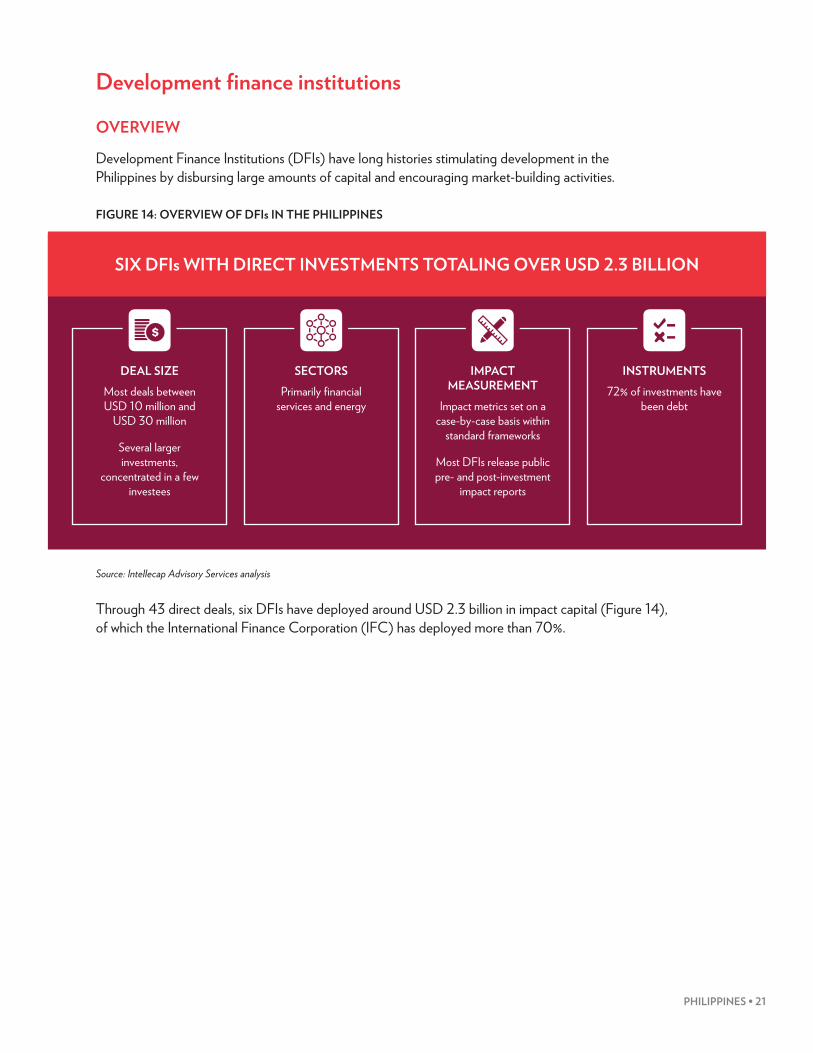
Development Finance Institutions (DFIs) have long histories stimulating development in the Philippines by disbursing large amounts of capital and encouraging market-building activities.
FIGURE 14: OVERVIEW OF DFIs IN THE PHILIPPINES
Source: Intellecap Advisory Services analysis
Through 43 direct deals, six DFIs have deployed around USD 2.3 billion in impact capital (Figure 14), of which the International Finance Corporation (IFC) has deployed more than 70%.
FIGURE 14: OVERVIEW OF DFIS IN THE PHILIPPINES
SIX DFIs WITH DIRECT INVESTMENTS TOTALING OVER USD 2.3 BILLION
IMPACT MEASUREMENT
Impact metrics set on a case-by-case basis within
standard frameworks
Most DFIs release public pre- and post-investment
impact reports
INSTRUMENTS72% of investments have
been debt
SECTORSPrimarily fi nancial
services and energy
DEAL SIZEMost deals between USD 10 million and
USD 30 million
Several larger investments,
concentrated in a few investees
Source: Intellecap Advisory Services analysis
22 • THE LANDSCAPE FOR IMPACT INVESTING IN SOUTHEAST ASIA
FIGURE 15: IMPACT CAPITAL DEPLOYED BY DFIs, BY YEAR USD 2.3 BILLION IN 43 DEALS
Note: Outliers two deals above USD 200 million. Source: Intellecap Advisory Services analysis
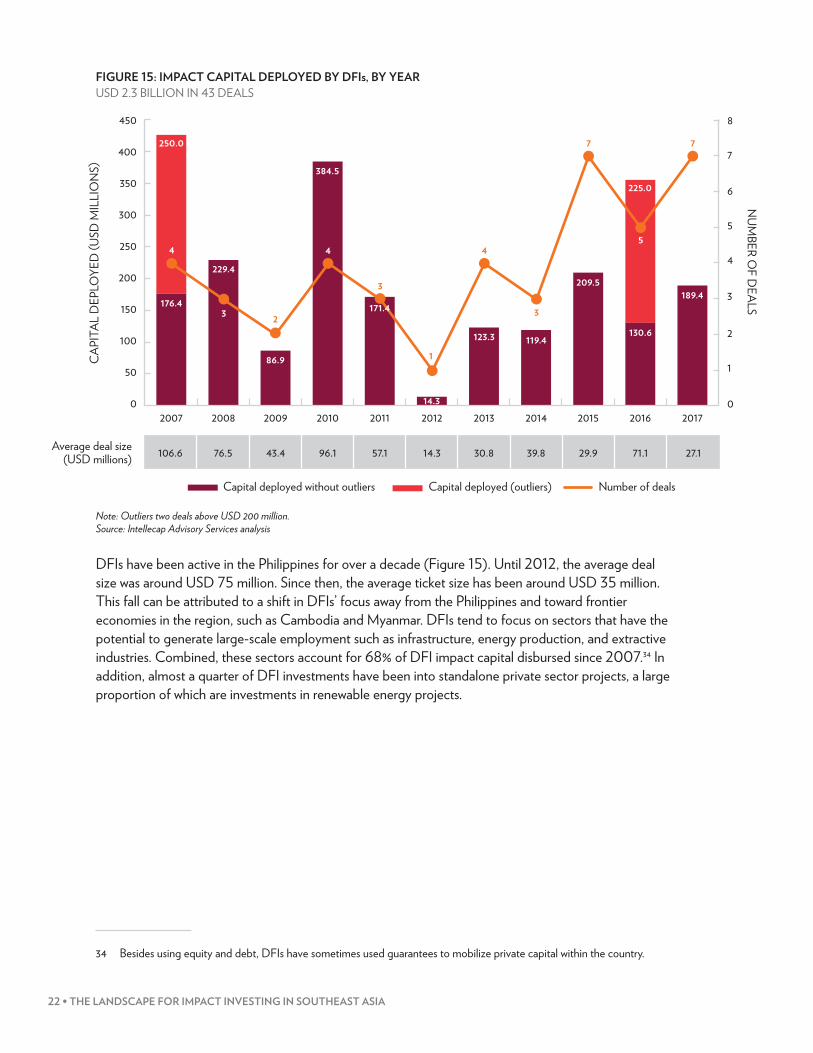
DFIs have been active in the Philippines for over a decade (Figure 15). Until 2012, the average deal size was around USD 75 million. Since then, the average ticket size has been around USD 35 million. This fall can be attributed to a shift in DFIs’ focus away from the Philippines and toward frontier economies in the region, such as Cambodia and Myanmar. DFIs tend to focus on sectors that have the potential to generate large-scale employment such as infrastructure, energy production, and extractive industries. Combined, these sectors account for 68% of DFI impact capital disbursed since 2007.34 In addition, almost a quarter of DFI investments have been into standalone private sector projects, a large proportion of which are investments in renewable energy projects.
34 Besides using equity and debt, DFIs have sometimes used guarantees to mobilize private capital within the country.
FIGURE 15: IMPACT CAPITAL DEPLOYED BY DFIS, BY YEARUSD 2.3 BILLION IN 43 DEALS
450
400
350
300
250
200
150
100
50
02007 2008 2009 2010 2011 2012 2013 2014 2015 2016 2017
CAP
ITAL
DEP
LOYE
D (U
SD M
ILLI
ON
S)
176.4
229.4
86.9
384.5
14.3
123.3 119.4
209.5
130.6
189.4
225.0
4
3 2
4
3
1
4
3
7
5
7
8
7
6
5
4
3
2
1
0
NUM
BER OF D
EALS
Average deal size (USD millions) 106.6 76.5 43.4 96.1 57.1 14.3 30.8 39.8 29.9 71.1 27.1
Source: Intellecap Advisory Services analysis
250.0
171.4
Capital deployed without outliers Number of dealsCapital deployed (outliers)

PHILIPPINES • 23
DEAL SIZE
FIGURE 16: IMPACT CAPITAL DEPLOYED BY DFIs, BY DEAL SIZE USD 2.3 BILLION IN 43 DEALS
Source: Intellecap Advisory Services analysis
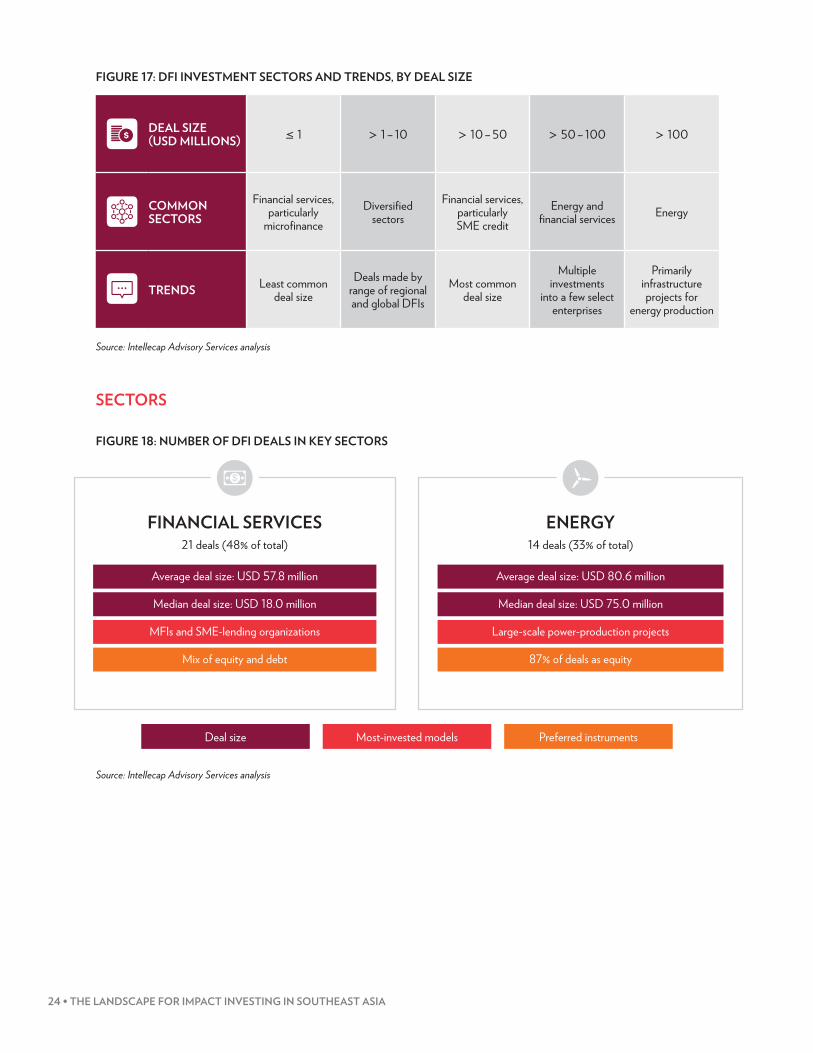
DFIs tend to invest in growth- and mature-stage investments through larger deals, many in excess of USD 100 million (Figure 16). Thirty-two percent of DFI deals have been between USD 10 million and USD 50 million, and 20% have been between USD 50 million and USD 100 million. More than half of these deals have been credit lines to MFIs and banks to expand their exposure to marginalized communities or offer SME financing. Other deals within these size ranges have occurred in healthcare, tourism, manufacturing, and education (Figure 17). A few DFI deals smaller than USD 3 million have primarily funded pilot innovations in sector-specific lending, particularly in microfinance. The average ticket size for DFI deals in the Philippines is USD 52 million.
FIGURE 16: IMPACT CAPITAL DEPLOYED BY DFIS, BY DEAL SIZE USD 2.3 BILLION IN 43 DEALS
1,400
1,200
1,000
800
600
400
200
0
CAP
ITAL
DEP
LOYE
D (U
SD M
ILLI
ON
S)
NUM
BER OF D
EALS
≤ 1 > 1 – 10 > 10 – 50 > 50 – 100 > 100
18
16
14
12
10
8
6
4
2
02.2
3
32.9
7
384.0
17
734.4 9
7
1,156.6
Capital deployed Number of deals
Average deal size (USD millions) 0.7 4.7 22.6 81.6 165.2
Source: Intellecap Advisory Services analysis
24 • THE LANDSCAPE FOR IMPACT INVESTING IN SOUTHEAST ASIA
FIGURE 17: DFI INVESTMENT SECTORS AND TRENDS, BY DEAL SIZE
Source: Intellecap Advisory Services analysis
SECTORS
FIGURE 18: NUMBER OF DFI DEALS IN KEY SECTORS
Source: Intellecap Advisory Services analysis
FIGURE 17: DFI INVESTMENT SECTORS AND TRENDS, BY DEAL SIZE
DEAL SIZE (USD MILLIONS) ≤ 1 > 1 – 10 > 10 – 50 > 50 – 100 > 100
COMMON SECTORS
Financial services, particularly
microfi nanceDiversifi ed
sectors Financial services,
particularly SME credit
Energy and fi nancial services Energy
TRENDS Least common deal size
Deals made by range of regional and global DFIs
Most common deal size
Multiple investments
into a few select enterprises
Primarily infrastructure projects for
energy production
Source: Intellecap Advisory Services analysis
FIGURE 18: NUMBER OF DFI DEALS IN KEY SECTORS
FINANCIAL SERVICES21 deals (48% of total)
Average deal size: USD 57.8 million
Median deal size: USD 18.0 million
MFIs and SME-lending organizations
Mix of equity and debt
ENERGY14 deals (33% of total)
Average deal size: USD 80.6 million
Median deal size: USD 75.0 million
Large-scale power-production projects
87% of deals as equity
Deal size Most-invested models Preferred instruments
Source: Intellecap Advisory Services analysis
PHILIPPINES • 25
FIGURE 19: IMPACT CAPITAL DEPLOYED BY DFIs, BY SECTOR USD 2.3 BILLION IN 43 DEALS
Source: Intellecap Advisory Services analysis
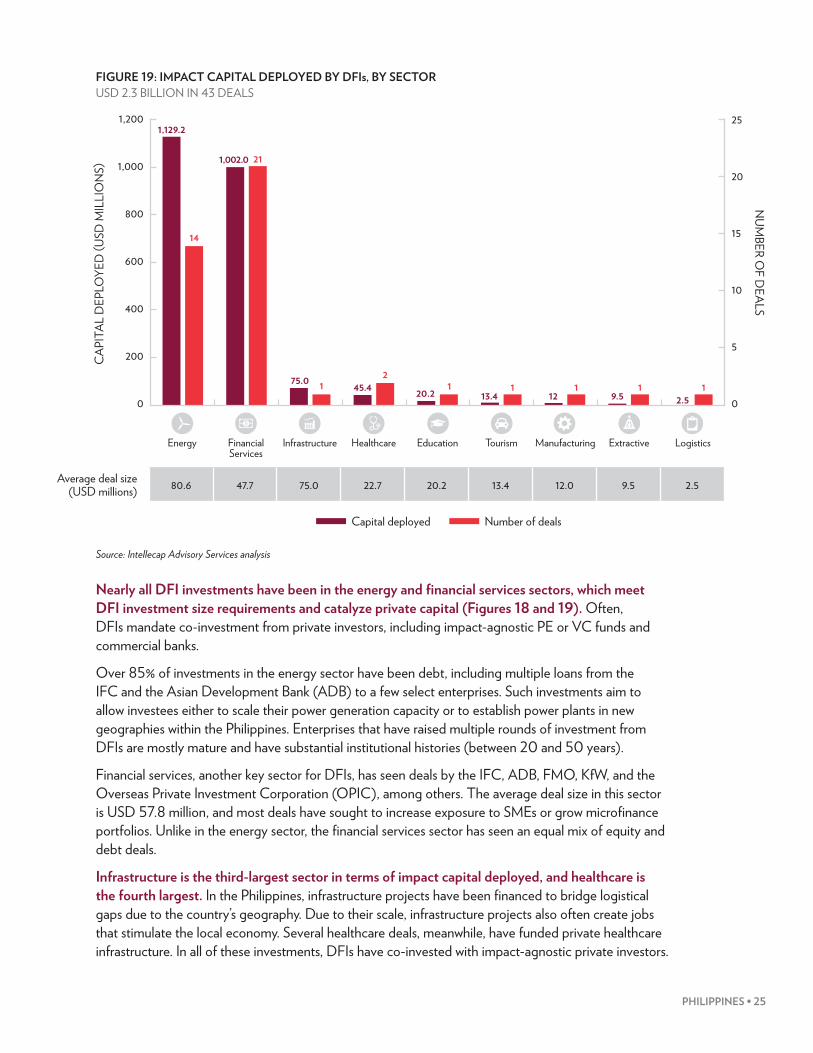
Nearly all DFI investments have been in the energy and financial services sectors, which meet DFI investment size requirements and catalyze private capital (Figures 18 and 19). Often, DFIs mandate co-investment from private investors, including impact-agnostic PE or VC funds and commercial banks.
Over 85% of investments in the energy sector have been debt, including multiple loans from the IFC and the Asian Development Bank (ADB) to a few select enterprises. Such investments aim to allow investees either to scale their power generation capacity or to establish power plants in new geographies within the Philippines. Enterprises that have raised multiple rounds of investment from DFIs are mostly mature and have substantial institutional histories (between 20 and 50 years).
Financial services, another key sector for DFIs, has seen deals by the IFC, ADB, FMO, KfW, and the Overseas Private Investment Corporation (OPIC), among others. The average deal size in this sector is USD 57.8 million, and most deals have sought to increase exposure to SMEs or grow microfinance portfolios. Unlike in the energy sector, the financial services sector has seen an equal mix of equity and debt deals.
Infrastructure is the third-largest sector in terms of impact capital deployed, and healthcare is the fourth largest. In the Philippines, infrastructure projects have been financed to bridge logistical gaps due to the country’s geography. Due to their scale, infrastructure projects also often create jobs that stimulate the local economy. Several healthcare deals, meanwhile, have funded private healthcare infrastructure. In all of these investments, DFIs have co-invested with impact-agnostic private investors.
FIGURE 19: IMPACT CAPITAL DEPLOYED BY DFIS, BY SECTOR USD 2.3 BILLION IN 43 DEALS
1,200
1,000
800
600
400
200
0
25
20
15
10
5
0
Energy Financial Services
Infrastructure Healthcare Education Tourism Manufacturing Extractive Logistics
CAP
ITAL
DEP
LOYE
D (U
SD M
ILLI
ON
S)
NUM
BER OF D
EALS
1,129.2
1,002.0
75.0 45.4 20.2
14
21
12
1 1 1 1 112 9.513.4 2.5
Average deal size (USD millions) 80.6 47.7 75.0 22.7 20.2 13.4 12.0 9.5 2.5
Capital deployed Number of deals
26 • THE LANDSCAPE FOR IMPACT INVESTING IN SOUTHEAST ASIA
The only deal that involved a DFI in the agricultural sector was led by a PII investor, and is thus considered in the PII analysis.
INSTRUMENTS
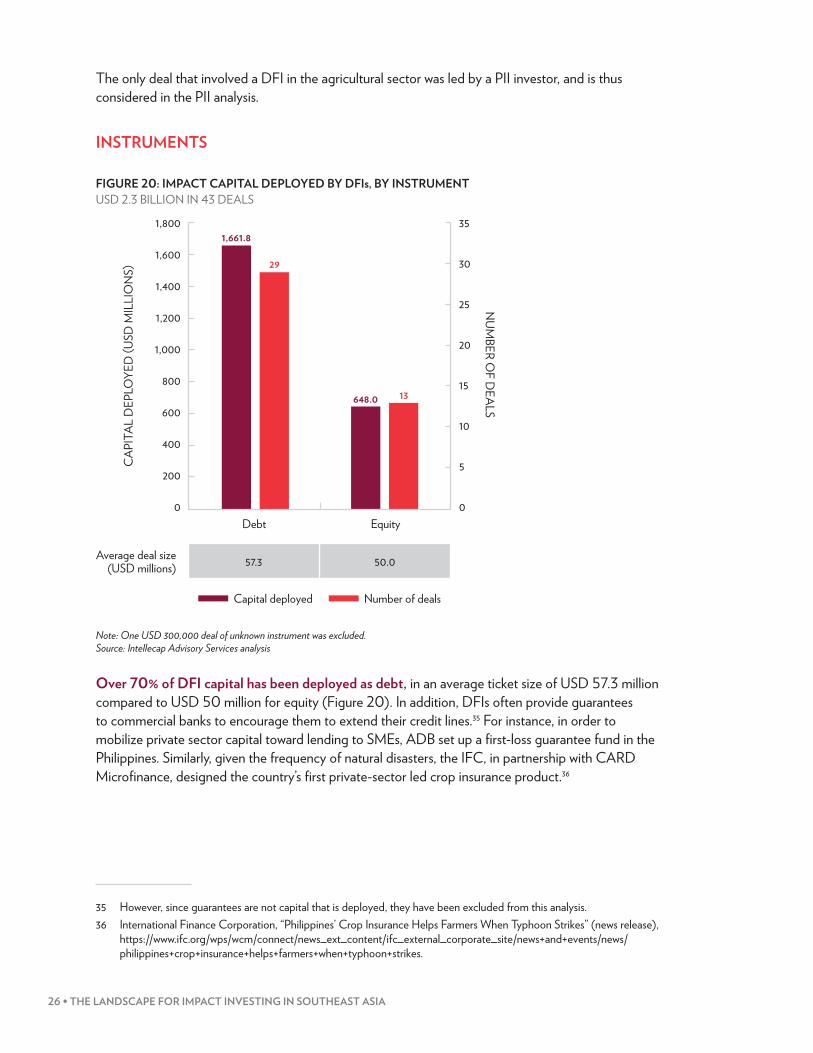
FIGURE 20: IMPACT CAPITAL DEPLOYED BY DFIs, BY INSTRUMENT USD 2.3 BILLION IN 43 DEALS
Note: One USD 300,000 deal of unknown instrument was excluded. Source: Intellecap Advisory Services analysis
Over 70% of DFI capital has been deployed as debt, in an average ticket size of USD 57.3 million compared to USD 50 million for equity (Figure 20). In addition, DFIs often provide guarantees to commercial banks to encourage them to extend their credit lines.35 For instance, in order to mobilize private sector capital toward lending to SMEs, ADB set up a first-loss guarantee fund in the Philippines. Similarly, given the frequency of natural disasters, the IFC, in partnership with CARD Microfinance, designed the country’s first private-sector led crop insurance product.36
35 However, since guarantees are not capital that is deployed, they have been excluded from this analysis.36 International Finance Corporation, “Philippines’ Crop Insurance Helps Farmers When Typhoon Strikes” (news release),
https://www.ifc.org/wps/wcm/connect/news_ext_content/ifc_external_corporate_site/news+and+events/news/philippines+crop+insurance+helps+farmers+when+typhoon+strikes.
FIGURE 20: IMPACT CAPITAL DEPLOYED BY DFIS, BY INSTRUMENT USD 2.3 BILLION IN 43 DEALS
1,800
1,600
1,400
1,200
1,000
800
600
400
200
0
35
30
25
20
15
10
5
0Debt Equity
CAP
ITAL
DEP
LOYE
D (U
SD M
ILLI
ON
S)
NUM
BER OF D
EALS
Average deal size (USD millions) 57.3 50.0
Capital deployed Number of deals
29
1,661.8
13648.0
Source: Intellecap Advisory Services analysis

PHILIPPINES • 27
IMPACT MEASUREMENT
DFIs operating in the Philippines use globally accepted performance metrics in their own frameworks for impact measurement. All DFIs that have made direct deployments in the Philippines use proprietary frameworks for impact measurement in an effort to align the impact of their investments to their development goals and to calibrate the assessment to their development objectives for a particular geography or sector.
Additionally, when DFIs make investments through specific programs or credit facilities, they may integrate additional sets of programmatic metrics with their original frameworks. Some DFIs report multiple aspects of their investments, including private capital mobilized, social impact, and ESG performance. Most DFIs report the forecasted impact of investments to their investment committees to gain buy-in. Post-investment, they typically release publicly available impact reports.
RETURN EXPECTATIONS AND EXITS
DFIs’ return expectations vary based on a thorough evaluation of the forecasted impact of an investment, its geography, and the role played by the private sector. For instance, contrary to the usual risk–return paradigm, some DFIs set low financial return expectations in high-risk investments, especially in a sector with limited private-sector activity. In addition, factors extrinsic to the investment often influence return expectations, such as negotiations with host governments and sources of funding for the DFIs themselves. Different programs under the same DFI can set different return expectations. In cases of equity investments, however, the lack of disclosed records in the Philippines restricts analysis of realized returns.
Gender lens investing
OVERVIEW
Gender Lens Investing (GLI), a concept gaining recognition and interest among PIIs in the Philippines, is the practice of assessing and managing investments that seek to create positive impact on women. As of 2017, only one PII had deployed capital in the Philippines using an explicit gender lens, amounting to USD 12.5 million into 20 deals. However, several more are scouting GLI opportunities and will likely deploy capital soon.

28 • THE LANDSCAPE FOR IMPACT INVESTING IN SOUTHEAST ASIA
GENDER LENS INVESTING COMPRISES TWO BROAD CATEGORIES
Investing with the intent to address gender issues or promote gender equity, including by:
• investing in women-owned or -led enterprises;• investing in enterprises that promote workplace equity (in staffing, management,
boardroom representation, and along their supply chains); or• investing in enterprises that offer products or services that substantially improve the lives of
women and girls.
And/or investing using:
• a process that focuses on gender, from pre-investment activities (e.g., sourcing and due diligence) to post-deal monitoring (e.g., strategic advisory and exiting); or
• a strategy that examines and manages an investee in line with the investor’s mandate and intentions with respect to:1. their vision or mission to address gender issues;
2. their organizational structure, culture, internal policies, and workplace environment;
3. their use of data and metrics for the gender-equitable management of performance and to incentivize behavioral change and accountability; and
4. how their financial and human resources signify overall commitment to gender equality.
ACTIVITIES OF GENDER LENS INVESTORS IN THE PHILIPPINES
One investor has made gender lens investments in the Philippines into financial services enterprises—particularly microfinance—that provide women access to critical services (Table 2). These enterprises seek to provide women access to finance and to support micro-entrepreneurship or other livelihood-enhancing activities. This gender lens investor reports outreach to women in its social performance assessments. The investor also evaluates whether potential investees have women in senior management. Though the investor is headquartered outside the Philippines, it has co-invested with partners that have a local presence, which has improved their ability to regularly source potential investees and to provide the high-touch support required post-investment.
PHILIPPINES • 29
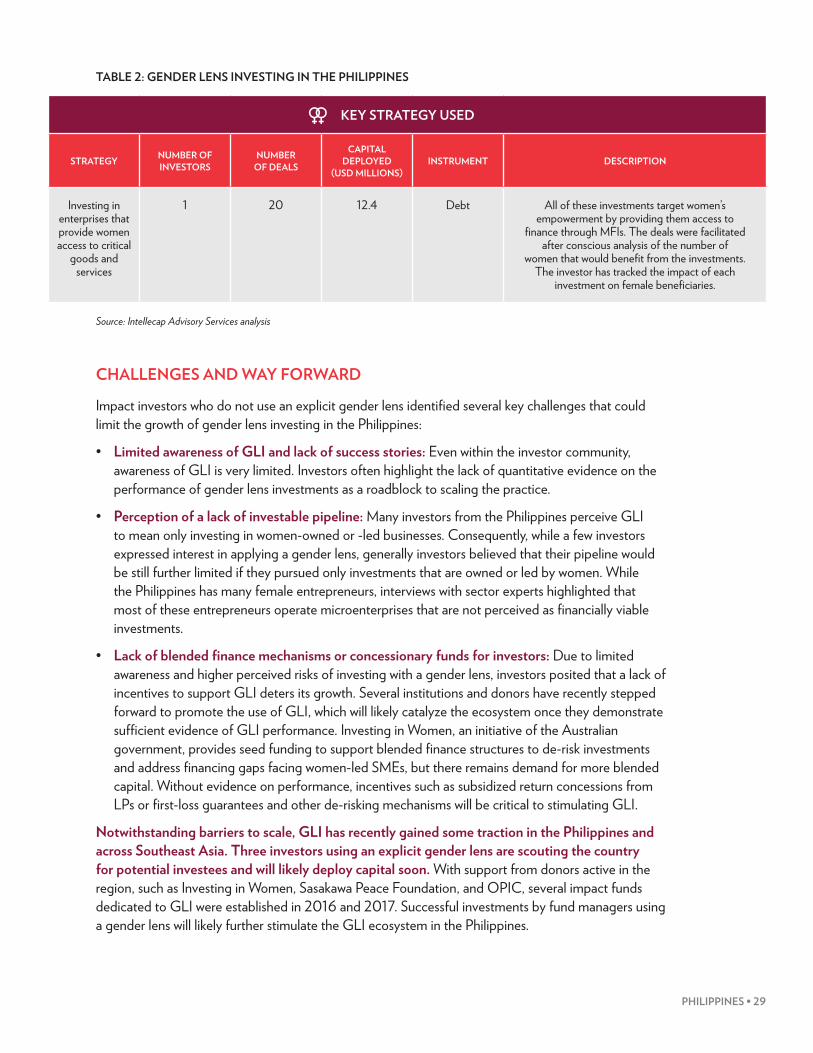
TABLE 2: GENDER LENS INVESTING IN THE PHILIPPINES
Source: Intellecap Advisory Services analysis
CHALLENGES AND WAY FORWARD
Impact investors who do not use an explicit gender lens identified several key challenges that could limit the growth of gender lens investing in the Philippines:
• Limited awareness of GLI and lack of success stories: Even within the investor community, awareness of GLI is very limited. Investors often highlight the lack of quantitative evidence on the performance of gender lens investments as a roadblock to scaling the practice.
• Perception of a lack of investable pipeline: Many investors from the Philippines perceive GLI to mean only investing in women-owned or -led businesses. Consequently, while a few investors expressed interest in applying a gender lens, generally investors believed that their pipeline would be still further limited if they pursued only investments that are owned or led by women. While the Philippines has many female entrepreneurs, interviews with sector experts highlighted that most of these entrepreneurs operate microenterprises that are not perceived as financially viable investments.
• Lack of blended finance mechanisms or concessionary funds for investors: Due to limited awareness and higher perceived risks of investing with a gender lens, investors posited that a lack of incentives to support GLI deters its growth. Several institutions and donors have recently stepped forward to promote the use of GLI, which will likely catalyze the ecosystem once they demonstrate sufficient evidence of GLI performance. Investing in Women, an initiative of the Australian government, provides seed funding to support blended finance structures to de-risk investments and address financing gaps facing women-led SMEs, but there remains demand for more blended capital. Without evidence on performance, incentives such as subsidized return concessions from LPs or first-loss guarantees and other de-risking mechanisms will be critical to stimulating GLI.
Notwithstanding barriers to scale, GLI has recently gained some traction in the Philippines and across Southeast Asia. Three investors using an explicit gender lens are scouting the country for potential investees and will likely deploy capital soon. With support from donors active in the region, such as Investing in Women, Sasakawa Peace Foundation, and OPIC, several impact funds dedicated to GLI were established in 2016 and 2017. Successful investments by fund managers using a gender lens will likely further stimulate the GLI ecosystem in the Philippines.
TABLE 2: GENDER LENS INVESTING IN THE PHILIPPINES
KEY STRATEGY USED
STRATEGY NUMBER OF INVESTORS
NUMBER OF DEALS
CAPITAL DEPLOYED
(USD MILLIONS)INSTRUMENT DESCRIPTION
Investing in enterprises that provide women access to critical
goods and services
1 20 12.4 Debt All of these investments target women’s empowerment by providing them access to
fi nance through MFIs. The deals were facilitated after conscious analysis of the number of
women that would benefi t from the investments. The investor has tracked the impact of each
investment on female benefi ciaries.
Source: Intellecap Advisory Services analysis
30 • THE LANDSCAPE FOR IMPACT INVESTING IN SOUTHEAST ASIA
UNINTENTIONAL GENDER IMPACT IN THE PHILIPPINES
Even though the amount of capital deployed with an explicit gender lens remains small, a number of other impact investments have likely benefited women and girls in various ways, highlighting the potential pipeline for gender lens investors. For instance, although DFIs don’t typically have an explicit gender-related impact mandate, a significant volume of DFI capital in the Philippines has been channeled toward investments that inherently benefit women and girls by providing them access to finance. In most cases, these investments are made based on perceived market opportunity, with specific impact on women being unintentional.
Similarly, many investments have been made in women-owned or -led businesses without the investor’s explicit, gender-based intent. Post-investment impact measurement has provided evidence for significant impact on women, and many investors who do not identify as GLIs still report such impact. For instance, while LGT Impact Ventures does not identify as a gender lens investor, it nevertheless reports how its investments are expected to impact women.37
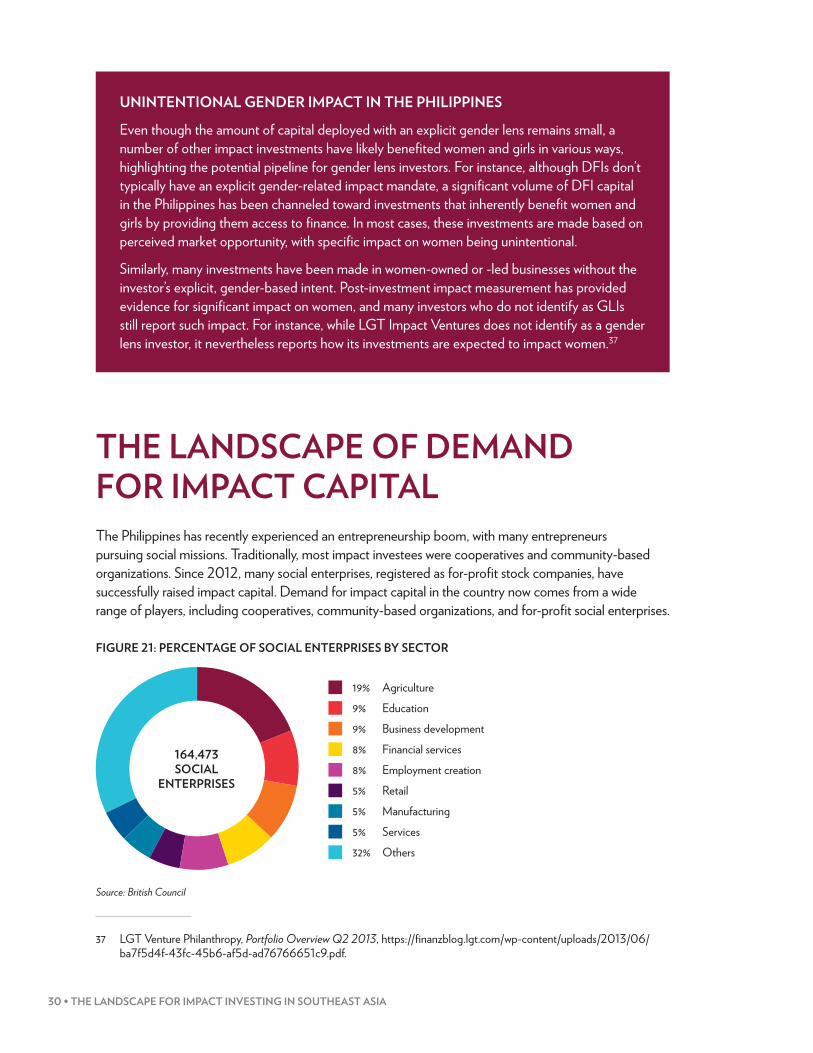
THE LANDSCAPE OF DEMAND FOR IMPACT CAPITALThe Philippines has recently experienced an entrepreneurship boom, with many entrepreneurs pursuing social missions. Traditionally, most impact investees were cooperatives and community-based organizations. Since 2012, many social enterprises, registered as for-profit stock companies, have successfully raised impact capital. Demand for impact capital in the country now comes from a wide range of players, including cooperatives, community-based organizations, and for-profit social enterprises.
FIGURE 21: PERCENTAGE OF SOCIAL ENTERPRISES BY SECTOR
Source: British Council
37 LGT Venture Philanthropy, Portfolio Overview Q2 2013, https://finanzblog.lgt.com/wp-content/uploads/2013/06/ba7f5d4f-43fc-45b6-af5d-ad76766651c9.pdf.
FIGURE 21: PERCENTAGE OF SOCIAL ENTERPRISES BY SECTOR
164,473SOCIAL
ENTERPRISES
19% Agriculture 9% Education 9% Business development 8% Financial services 8% Employment creation 5% Retail 5% Manufacturing 5% Services 32% Others
Source: British Council
PHILIPPINES • 31
OverviewThe concept of ‘social entrepreneurship’ first emerged in the Philippines in the 1990s. Since then, the landscape has gradually shifted from individual-based, social cooperative models to for-profit social enterprises. As of 2013, more than 23,000 cooperatives, with a member base of more than 4.5 million people, were registered in the Philippines. Since most of these cooperatives comprise and serve the poor, they offer huge potential for social impact and hence account for a large portion of the demand for impact capital in the country. However, as entrepreneurship has become more accepted in the Philippines, a segment of individual-run, institutional social enterprises have emerged. Unlike cooperatives, such enterprises can accept equity investment because of their legal structure.
The improving tech landscape in the Philippines has also facilitated the establishment of many incubators and accelerators that host and support early-stage social enterprises. As a few social enterprises have successfully demonstrated their capacity to drive positive change, the government has begun to recognize their potential to contribute to sustainable development. This recognition has also been supported by the advocacy efforts of institutions such as the Institute for Social Entrepreneurship in Asia and the British Council. The number of social enterprises in the Philippines has tripled since 2006.38 Social enterprises in the country have no unique legal designation; currently, 31% are registered as non-profit or non-stock companies, 21% are registered as cooperatives, and 17% are registered as stock, for-profit corporations. The remainder are unregistered enterprises, and operate as partnerships; or are government associations.39
According to a British Council estimate, there are more than 160,000 social enterprises in the Philippines. The most common sector for social enterprises is agriculture (19% of total; Figure 22), followed by education (9%).40 However, most impact investments have been made in financial services, energy, and workforce development.
The top four target beneficiary groups for social enterprises include local communities, other organizations, women, and employees of their own organizations. These enterprises employed more than 17,000 people full-time in 2016, and 75% of existing social enterprises expect their full-time staff to grow in the near future.41
Women are a critical part of the social enterprise ecosystem in the Philippines. Forty-four percent of social enterprises in the Philippines are led by women. The Philippines was also ranked fourth of 80 countries in terms of the proportion of female managers.42
38 PhilSEN, Reaching the Farthest First, 12.39 PhilSEN, Reaching the Farthest First, 43.40 PhilSEN, 47.41 PhilSEN, 52.42 International Labour Office, Women in Business and Management: Gaining Momentum (Geneva: International Labor
Organization, 2015), 14, http://www.ilo.org/wcmsp5/groups/public/---dgreports/---dcomm/---publ/documents/publication/wcms_316450.pdf.

32 • THE LANDSCAPE FOR IMPACT INVESTING IN SOUTHEAST ASIA
Access to capital Most seed-stage social enterprises rely on donations from family and friends or grants from foundations and corporations to fund their operations. Since most social enterprises have traditionally seen grants as a source of funding, they find it challenging to raise capital from both mainstream and impact investors. For most social enterprises, limited access to capital—including grants, debt, and equity—is the biggest self-reported barrier to growth. Only 17% of social enterprises have raised equity, while 12% have accessed debt at market rates. Several factors make it challenging to raise capital:
• Absence of funding at low ticket sizes: Social enterprises in the Philippines have median annual turnover of USD 24,000, limiting their capacity to absorb the preferred ticket sizes of most global and regional impact investors.
• Limited access to investors: According to entrepreneurs in the Philippines, few social enterprises are familiar with the concept of impact investing, and most remain unfamiliar with key impact investors active in the country. Hence, most entrepreneurs who have raised capital from impact investors are expats or foreign-educated Filipinos with access to a network of investors. Especially for Filipino entrepreneurs, the absence of networks proactively connecting entrepreneurs and impact investors limits capital raising.
• High return expectations: Stakeholders also highlighted that it is difficult for social enterprises to meet investors’ expectations of returns, both financial and social. Moreover, most institutional social enterprises are too young to have the track record needed to raise capital.
• Collateral expectations: Most mainstream commercial banks provide only secured debt. Access to such funding is hence restricted to a limited segment of entrepreneurs.
Challenges to growthIn addition to access to capital, other critical barriers to growth include the following:
• Access to skilled professionals: Social entrepreneurs in the Philippines often find it difficult to access talent and skilled professionals, especially those equipped to meet the needs of impact sectors. Specifically, social entrepreneurs have indicated challenges in employing and retaining technical, finance, and HR professionals based in rural or semi-urban locations.
• Perception of social enterprises: Investors often view social entrepreneurs in the Philippines as having little focus on financial sustainability, which distorts the perceived return expectations and risks associated with investing in social enterprises.
• Lack of support for growth-stage ventures: Though there are a number of incubators and accelerators for seed- and early-stage enterprises, growth-stage enterprises have limited support. Expanding operations within the same region or into new regions requires expertise that impact-focused business support providers currently cannot provide.
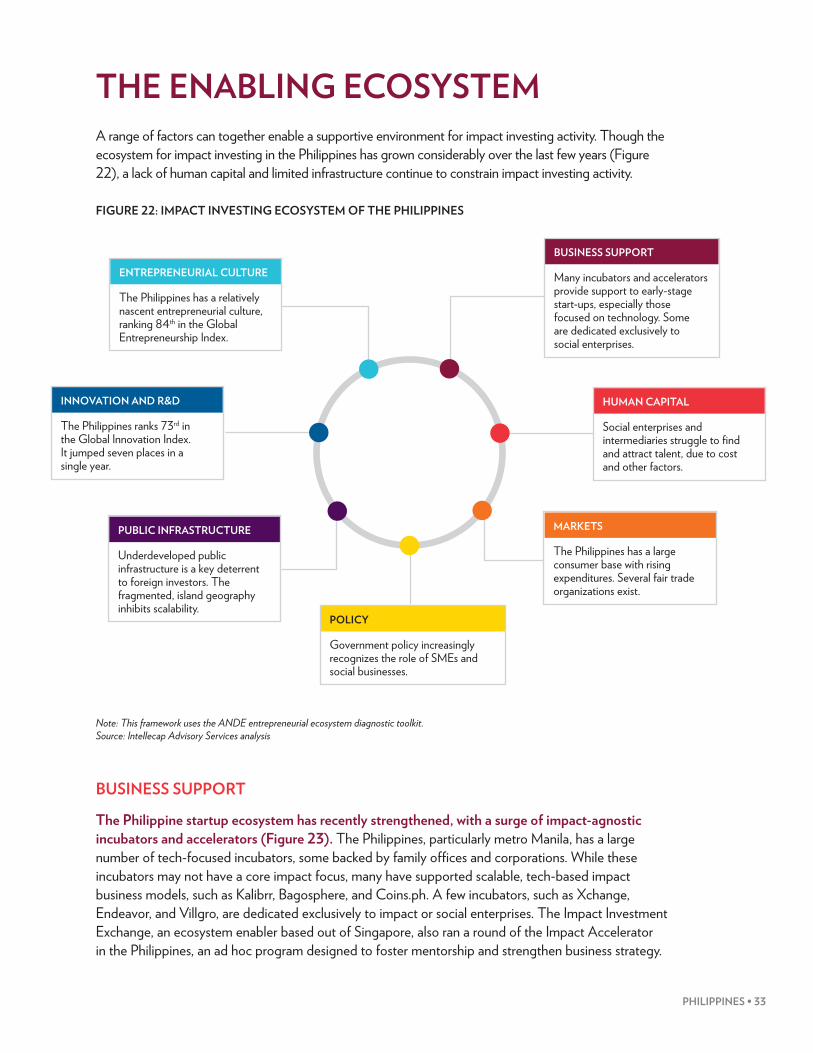
PHILIPPINES • 33
THE ENABLING ECOSYSTEMA range of factors can together enable a supportive environment for impact investing activity. Though the ecosystem for impact investing in the Philippines has grown considerably over the last few years (Figure 22), a lack of human capital and limited infrastructure continue to constrain impact investing activity.
FIGURE 22: IMPACT INVESTING ECOSYSTEM OF THE PHILIPPINES
Note: This framework uses the ANDE entrepreneurial ecosystem diagnostic toolkit. Source: Intellecap Advisory Services analysis
BUSINESS SUPPORT
The Philippine startup ecosystem has recently strengthened, with a surge of impact-agnostic incubators and accelerators (Figure 23). The Philippines, particularly metro Manila, has a large number of tech-focused incubators, some backed by family offices and corporations. While these incubators may not have a core impact focus, many have supported scalable, tech-based impact business models, such as Kalibrr, Bagosphere, and Coins.ph. A few incubators, such as Xchange, Endeavor, and Villgro, are dedicated exclusively to impact or social enterprises. The Impact Investment Exchange, an ecosystem enabler based out of Singapore, also ran a round of the Impact Accelerator in the Philippines, an ad hoc program designed to foster mentorship and strengthen business strategy.
PUBLIC INFRASTRUCTURE
Underdeveloped public infrastructure is a key deterrent to foreign investors. The fragmented, island geography inhibits scalability.
POLICY
Government policy increasingly recognizes the role of SMEs and social businesses.
INNOVATION AND R&D
The Philippines ranks 73rd in the Global Innovation Index. It jumped seven places in a single year.
ENTREPRENEURIAL CULTURE
The Philippines has a relatively nascent entrepreneurial culture, ranking 84th in the Global Entrepreneurship Index.
BUSINESS SUPPORT
Many incubators and accelerators provide support to early-stage start-ups, especially those focused on technology. Some are dedicated exclusively to social enterprises.
MARKETS
The Philippines has a large consumer base with rising expenditures. Several fair trade organizations exist.
HUMAN CAPITAL
Social enterprises and intermediaries struggle to fi nd and attract talent, due to cost and other factors.
FIGURE 22: IMPACT INVESTING ECOSYSTEM OF THE PHILIPPINES
Source: Intellecap Advisory Services analysis
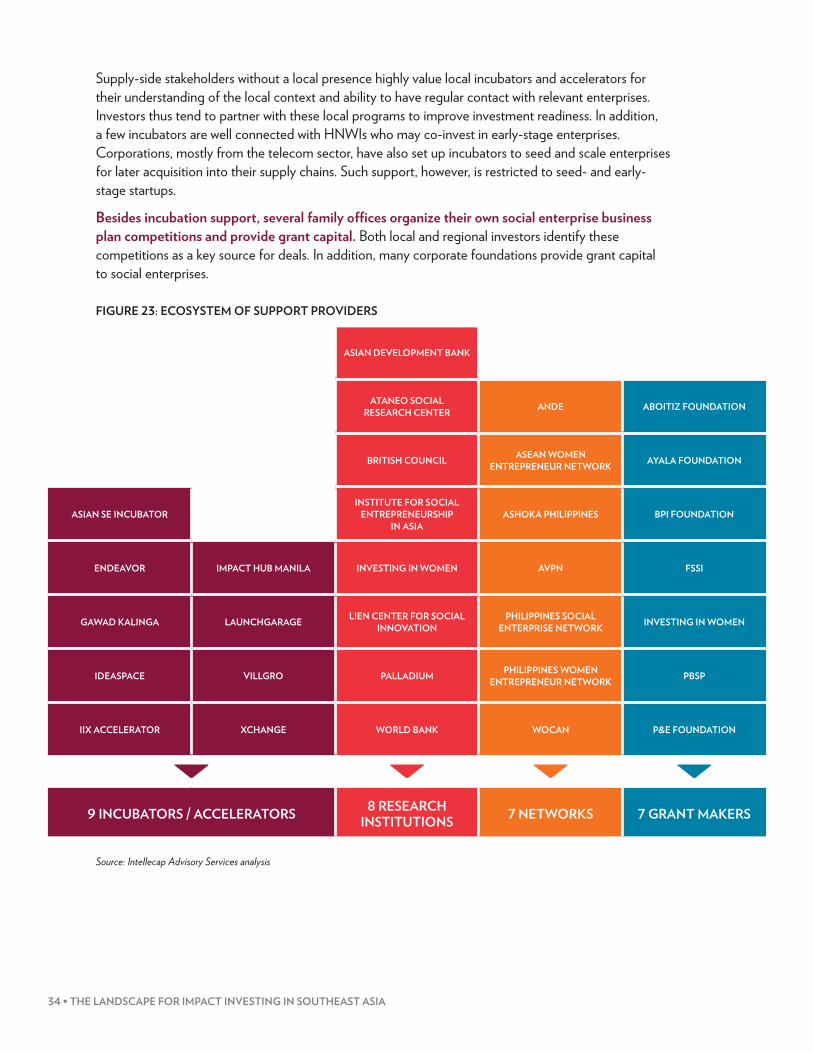
34 • THE LANDSCAPE FOR IMPACT INVESTING IN SOUTHEAST ASIA
Supply-side stakeholders without a local presence highly value local incubators and accelerators for their understanding of the local context and ability to have regular contact with relevant enterprises. Investors thus tend to partner with these local programs to improve investment readiness. In addition, a few incubators are well connected with HNWIs who may co-invest in early-stage enterprises. Corporations, mostly from the telecom sector, have also set up incubators to seed and scale enterprises for later acquisition into their supply chains. Such support, however, is restricted to seed- and early-stage startups.
Besides incubation support, several family offices organize their own social enterprise business plan competitions and provide grant capital. Both local and regional investors identify these competitions as a key source for deals. In addition, many corporate foundations provide grant capital to social enterprises.
FIGURE 23: ECOSYSTEM OF SUPPORT PROVIDERS
Source: Intellecap Advisory Services analysis
FIGURE 23: ECOSYSTEM OF SUPPORT PROVIDERS
ASIAN DEVELOPMENT BANK
ATANEO SOCIAL RESEARCH CENTER ANDE ABOITIZ FOUNDATION
BRITISH COUNCIL ASEAN WOMEN ENTREPRENEUR NETWORK AYALA FOUNDATION
ASIAN SE INCUBATORINSTITUTE FOR SOCIAL
ENTREPRENEURSHIP IN ASIA
ASHOKA PHILIPPINES BPI FOUNDATION
ENDEAVOR IMPACT HUB MANILA INVESTING IN WOMEN AVPN FSSI
GAWAD KALINGA LAUNCHGARAGE LIEN CENTER FOR SOCIAL INNOVATION
PHILIPPINES SOCIAL ENTERPRISE NETWORK INVESTING IN WOMEN
IDEASPACE VILLGRO PALLADIUM PHILIPPINES WOMEN ENTREPRENEUR NETWORK PBSP
IIX ACCELERATOR XCHANGE WORLD BANK WOCAN P&E FOUNDATION
9 INCUBATORS / ACCELERATORS 8 RESEARCH INSTITUTIONS 7 NETWORKS 7 GRANT MAKERS
Source: Intellecap Advisory Services analysis
PHILIPPINES • 35
The Philippines has a growing network of impact-agnostic financial advisors who help impact investors source larger deals. This network of financial advisors partially bridges the gap in later-stage support in the Philippines. Although they may lack an impact focus, these advisors still evaluate SMEs, often working with impact investors to help source larger-sized investment opportunities through a success-fee revenue model.
Though research on impact investing in the Philippines is limited, a few organizations have studied social enterprises and other inclusive businesses. The Asian Venture Philanthropy Network, Palladium, the Lien Center for Social innovation, and the ADB have studied the social finance landscape, which involves a broad spectrum of financing options, including impact investing, grants, crowdfunding, socially responsible investing, and CSR. The Institute for Social Entrepreneurship in Asia, the British Council’s CSO-SEED program, and the Philippine Social Enterprise Network lead research and advocacy efforts on social entrepreneurship and inclusive business. Key funders of such research include Investing in Women, the ADB, and the United Nations Economic and Social Commission for Asia and the Pacific (UNESCAP).
ACCESS TO HUMAN CAPITAL
Lack of access to human capital hinders the growth of both social enterprises and business support providers in the Philippines. More than 20% of social enterprises in the Philippines consider access to human capital a key barrier to growth.43 Business support providers often cite the high cost of social sector experts and limited availability of mentors as constraints on their financial sustainability.
MARKETS
Increasing domestic consumption in the Philippines drives the country’s GDP growth. In order to ensure their sustainability, social enterprises in the Philippines often target the lower-middle-income population and not the poorest of the poor. With increasing urban incomes and domestic consumption, around 90% of social enterprises are confident they can obtain adequate market demand for their goods and services.44 These enterprises work with marginalized or small producers to establish supplier partnerships and offer them fair prices for their produce (along with ancillary support services). The Philippines also has a large presence of Fair Trade Organizations, Trading Development Organizations, and non-governmental development organizations that engage in the production of goods, the trading or marketing of goods, or the provision of economic services.45
43 PhilSEN, Reaching the Farthest First, 52–54.44 PhilSEN, Reaching the Farthest First.45 Marie Lisa Dacanay, Social Enterprise in the Philippines: Social Enterprises with the Poor as Primary Stakeholders,
International Comparative Social Enterprise Models (ICSEM) Working Paper No. 49 (Belgium: ICSEM, 2017), https://www.iap-socent.be/sites/default/files/The%20Philippines%20-%20Dacanay.pdf.
36 • THE LANDSCAPE FOR IMPACT INVESTING IN SOUTHEAST ASIA
POLICY
A high rate of taxation disincentivizes investment in the Philippines. At 30%, the Philippine corporate tax rate exceeds the ASEAN average of 23%. In addition to a high corporate tax, the Philippines also has the highest VAT, at 12%—imposed on tangible and intangible goods, with certain exceptions—of all ASEAN countries.46 The country also applies a 30% withholding tax on dividend payments to non-residents.47
The government has, however, introduced several policy measures that can encourage impact investing and will likely introduce further measures in the future:
• Attractive fiscal incentives for investors: The Philippine government offers income tax holidays for a maximum of eight years, which is still lower than the 10-year income tax holidays provided by Indonesia and the PDR or the nine-year tax holiday provided by Cambodia. In addition to income tax holidays, the government has special tax reduction schemes for enterprises registered with the Philippine Economic Zone Authority and operating in specific economic zones.
• Relaxed restrictions on foreign ownership: The government recently relaxed foreign ownership restrictions, allowing 100% foreign ownership in many sectors. Foreign investors can establish businesses as sole proprietorships, partnerships, or corporations. Partnerships with more than USD 141,000 in capital must register with the Philippine Securities and Exchange Commission, and corporations must have minimum paid-up capital of USD 235,000.48 In 2015, the government amended the list of sectors prohibited from foreign investment to include only those that are defense-related or that may impact public health and morale.
• Favorable regulation for SMEs: The Go Negosyo Act, which took effect in 2015, intends to foster national development by promoting the establishment and operations of MSMEs. It includes provisions to foster access to business support services for MSMEs, establishes a business registry, launches a start-up fund for MSME financing, and strengthens the MSME Development Council.49 A second piece of legislation, the Barangay Micro Business Enterprise (BMBE) Law, grants SMEs certain benefits, including some income tax exemptions and reductions and priority to access a special credit window.50
• Increasingly formal recognition of social enterprises as agents of positive change: As of 2017, the Poverty Reduction through Social Entrepreneurship (PRESENT) Coalition is lobbying for the Philippine Congress to pass the PRESENT bill to spur the growth of social enterprises as a means for development in the country. If the bill passes, qualified social enterprises will receive a wide range of support services, including access to non-collateralized loans, insurance against climate change and natural calamities, access to market development programs, and sector-specific R&D support. Under the proposed bill, social enterprises primarily benefiting the poor will receive additional support in the form of tax exemptions, tax breaks, and preferential treatment in government procurement. Those employing people with disabilities will also be eligible for cash
46 The Philippine tax code offers various VAT exemptions. Tax and Accounting Center Philippines, “Value Added Tax Exemptions in the Philippines,” http://taxacctgcenter.org/value-added-tax-exemptions-in-the-philippines/.
47 Walter Abela Jr. and Seren Quizon, International Tax: Philippines Highlights (Deloitte, 2017), https://www2.deloitte.com/content/dam/Deloitte/cn/Documents/international-business-support/deloitte-cn-ibs-philippines-int-tax-en-2017.pdf.
48 R.G. Manabat & Co., Philippine Consumer Market Report: 2017 Investment Guide (Manila: KPMG, 2017), 58, https://home.kpmg.com/content/dam/kpmg/ph/pdf/InvestmentGuide/KPMGPHPhilippineConsumerMarketReport.pdf.
49 Government of the Philippines, “Go Negosyo Act,” https://www.dti.gov.ph/programs-projects/negosyo-center/go-negosyo-act.
50 “The Solopreneur’s Guide to Starting a Microbusiness in the Philippines,” Full Suite (blog), September 4, 2015, http://www.full-suite.com/blog/solopreneurs-guide-starting-microbusiness-philippines/.

PHILIPPINES • 37
incentives equivalent to at least 25% of the minimum wage.51 These incentives would stimulate the growth of social enterprises, increasing the potential pipeline of early-stage opportunities for impact investors operating in the region.
INFRASTRUCTURE
Although the Philippine government has undertaken several initiatives to develop the country’s infrastructure, the country still lacks the infrastructure required for global competitiveness.52 Among ASEAN countries considered,53 the Philippines overall ranks ahead of only Cambodia and Lao PDR.54 Though the Philippines performed relatively well with respect to its macroeconomic environment, ranking 22nd globally, and market size, ranking 27th globally, the country ranked poorly on other indicators in the index, including infrastructure (97th), goods market efficiency (103rd), and institutions (94th). Sub-components of these three low-performing indicators for the Philippines include poor intellectual property protections, irregular payments and bribes, favoritism in government decision-making, inefficiency of legal regulations for solving disputes, lack of protection of minority shareholders’ interests, weak investor protections, low quality of transport infrastructure, taxation disincentives to investment, and burdensome customs procedures. Stakeholders consulted for this report also revealed that corruption and bureaucracy hinder the investing process. The country’s performance on the Ease of Doing Business rankings, falling 14 places from 99th to 113th in the 2018 report, also signifies room for improvement.55
INNOVATION AND R&D
The Philippines ranked 73rd on the 2017 Global Innovation Index. Although it ranks behind a number of its neighbors, it gained seven places year-on-year. Innovation and R&D in the Philippines are mostly driven by businesses seeking to optimize their supply chains. The Philippines still fares poorly in terms of the number of patents filed and cumulative expenditure on R&D. However, the Intellectual Property Office is currently crafting a National Intellectual Property Strategy, which will harness local talent and creativity to accelerate innovation in the country.
ENTREPRENEURIAL CULTURE
The Philippines has a relatively nascent entrepreneurial culture, ranking 84th in the Global Entrepreneurship Development Index.56 Some of the challenges preventing the growth of entrepreneurship in the Philippines include the low availability of risk-tolerant capital and a historical lack of cultural support for entrepreneurial activity.
51 Dacanay, Social Enterprise in the Philippines.52 The Philippines ranks 56th of 137 economies in the Global Competitiveness Index. Klaus Schwab, ed., The Global
Competitiveness Report 2017–2018 (Geneva: World Economic Forum, 2017), http://www3.weforum.org/docs/GCR2017-2018/05FullReport/TheGlobalCompetitivenessReport2017–2018.pdf.
53 Myanmar and Timor Leste excluded.54 The index calculates the competitiveness of an economy to ensure economic prosperit y on the basis of 12 pillars:
institutions, infrastructure, macroeconomic environment, health and primary education, higher education and training, goods market efficiency, labor market efficiency, financial market development, technological readiness, market size, business sophistication, and innovation.
55 “Philippines,” Doing Business.56 Global Entrepreneurship Development Institute, 2018 Global Entrepreneurship Index,
http://thegedi.org/global-entrepreneurship-and-development-index/.
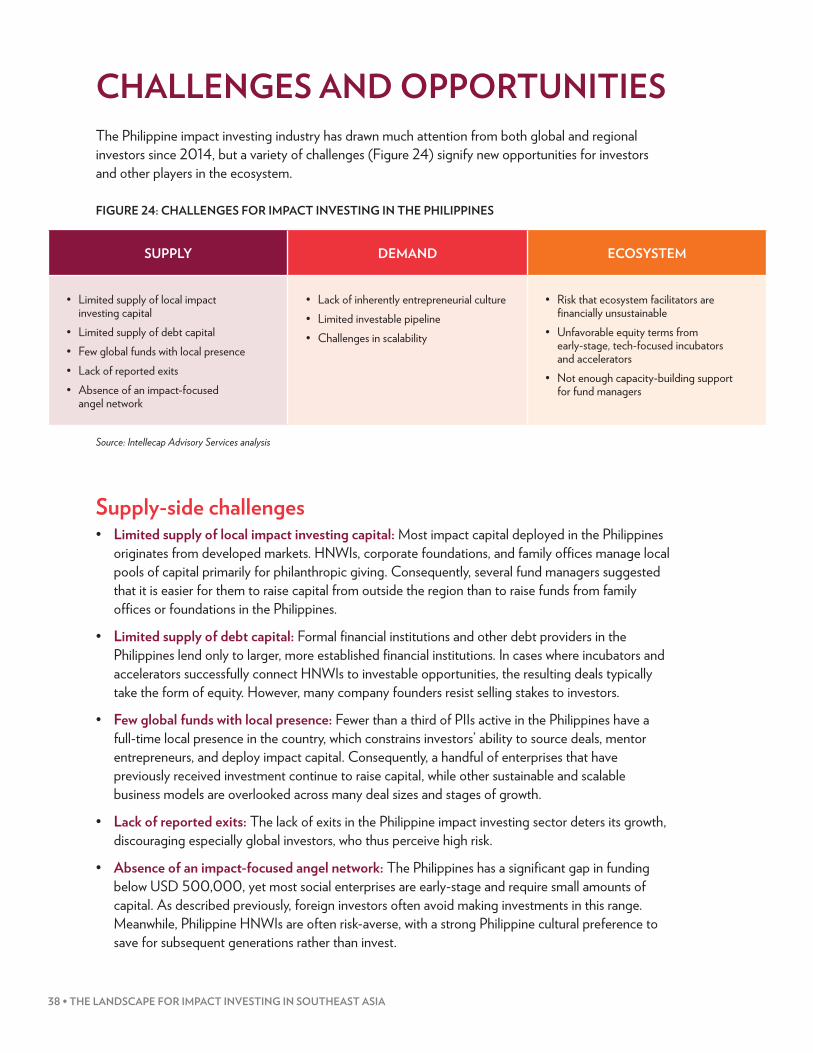
38 • THE LANDSCAPE FOR IMPACT INVESTING IN SOUTHEAST ASIA
CHALLENGES AND OPPORTUNITIES The Philippine impact investing industry has drawn much attention from both global and regional investors since 2014, but a variety of challenges (Figure 24) signify new opportunities for investors and other players in the ecosystem.
FIGURE 24: CHALLENGES FOR IMPACT INVESTING IN THE PHILIPPINES
Source: Intellecap Advisory Services analysis
Supply-side challenges• Limited supply of local impact investing capital: Most impact capital deployed in the Philippines
originates from developed markets. HNWIs, corporate foundations, and family offices manage local pools of capital primarily for philanthropic giving. Consequently, several fund managers suggested that it is easier for them to raise capital from outside the region than to raise funds from family offices or foundations in the Philippines.
• Limited supply of debt capital: Formal financial institutions and other debt providers in the Philippines lend only to larger, more established financial institutions. In cases where incubators and accelerators successfully connect HNWIs to investable opportunities, the resulting deals typically take the form of equity. However, many company founders resist selling stakes to investors.
• Few global funds with local presence: Fewer than a third of PIIs active in the Philippines have a full-time local presence in the country, which constrains investors’ ability to source deals, mentor entrepreneurs, and deploy impact capital. Consequently, a handful of enterprises that have previously received investment continue to raise capital, while other sustainable and scalable business models are overlooked across many deal sizes and stages of growth.
• Lack of reported exits: The lack of exits in the Philippine impact investing sector deters its growth, discouraging especially global investors, who thus perceive high risk.
• Absence of an impact-focused angel network: The Philippines has a significant gap in funding below USD 500,000, yet most social enterprises are early-stage and require small amounts of capital. As described previously, foreign investors often avoid making investments in this range. Meanwhile, Philippine HNWIs are often risk-averse, with a strong Philippine cultural preference to save for subsequent generations rather than invest.
FIGURE 24: CHALLENGES FOR IMPACT INVESTING IN THE PHILIPPINES
SUPPLY DEMAND ECOSYSTEM
• Limited supply of local impact investing capital
• Limited supply of debt capital• Few global funds with local presence• Lack of reported exits• Absence of an impact-focused
angel network
• Lack of inherently entrepreneurial culture• Limited investable pipeline• Challenges in scalability
• Risk that ecosystem facilitators are fi nancially unsustainable
• Unfavorable equity terms from early-stage, tech-focused incubators and accelerators
• Not enough capacity-building support for fund managers
Source: Intellecap Advisory Services analysis

PHILIPPINES • 39
Demand-side challenges• Lack of inherently entrepreneurial culture: As previously mentioned, the Philippines ranks 84th in
the Global Entrepreneurship Index.57 Country experts highlighted that the Philippine culture values work for corporations over risky startups. Besides limiting the number of risk-taking entrepreneurs in the economy, this preference limits the availability of human resources for startups, especially for social enterprises, which may enter riskier market segments.
• Limited investable pipeline: According to impact investors, the pipeline of investments fulfilling their financial, social, and environmental return expectations is limited. The social enterprise ecosystem is relatively nascent, and the absence of local impact investor offices often makes it more difficult for them to source quality, investable enterprises. In addition, social enterprises have the capacity to absorb only small investments, which are often unviable for regional and global impact investors.
• Challenges in scalability: Some ICT-based solutions in the country have scaled successfully. However, given the Philippines’s geography—with over 1,000 islands and limited infrastructure—asset-heavy business models often struggle to scale between islands.
Ecosystem challenges• Risk that ecosystem facilitators are financially unsustainable: Ecosystem facilitators that focus
solely on social businesses and the impact sector generate too little revenue to achieve financial sustainability. As a result, many such players, including co-working spaces and incubators, have drifted away from their social missions to target more mainstream businesses and investors. Moreover, since the concept of social enterprise is relatively new in the Philippines and there are very few sector experts, tailored mentorship remains very expensive, further threatening the financial sustainability of impact-focused intermediaries.
• Unfavorable equity terms from early-stage, tech-focused incubators and accelerators: Many social enterprises believe that incubators and accelerators in the Philippines can be predatory, especially when their support is traded for equity in such a way as to dilute founders’ ownership. Many entrepreneurs therefore prefer collateralized debt over equity.
• Insufficient capacity-building support for fund managers: Local funds face skills gaps in their ability to manage global capital. Stakeholders indicate that mentorship and technical assistance facilities are available for demand-side players, but infrastructure for local investment vehicles is very limited. Consequently, few local fund managers can effectively manage global capital.
Notwithstanding these challenges, the Philippine socio-economic environment presents a number of opportunities for impact investors (Figure 25).
57 Global Entrepreneurship Development Institute, 2018 Global Entrepreneurship Index.
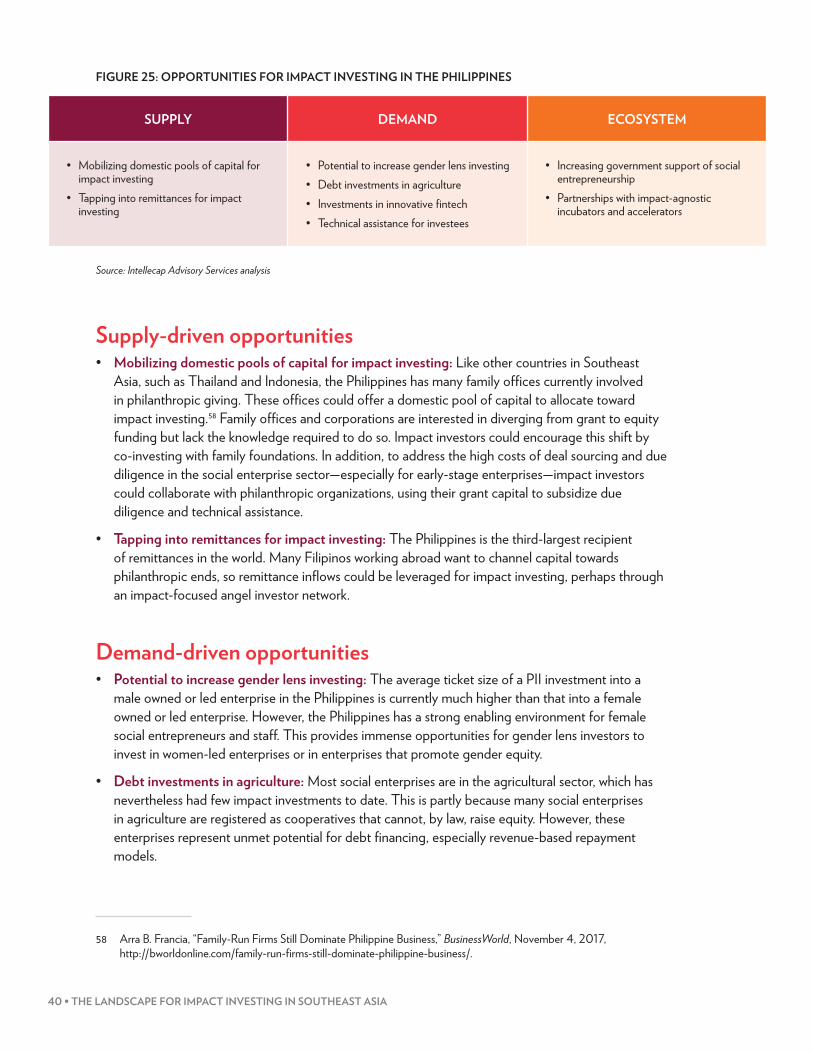
40 • THE LANDSCAPE FOR IMPACT INVESTING IN SOUTHEAST ASIA
FIGURE 25: OPPORTUNITIES FOR IMPACT INVESTING IN THE PHILIPPINES
Source: Intellecap Advisory Services analysis
Supply-driven opportunities• Mobilizing domestic pools of capital for impact investing: Like other countries in Southeast
Asia, such as Thailand and Indonesia, the Philippines has many family offices currently involved in philanthropic giving. These offices could offer a domestic pool of capital to allocate toward impact investing.58 Family offices and corporations are interested in diverging from grant to equity funding but lack the knowledge required to do so. Impact investors could encourage this shift by co-investing with family foundations. In addition, to address the high costs of deal sourcing and due diligence in the social enterprise sector—especially for early-stage enterprises—impact investors could collaborate with philanthropic organizations, using their grant capital to subsidize due diligence and technical assistance.
• Tapping into remittances for impact investing: The Philippines is the third-largest recipient of remittances in the world. Many Filipinos working abroad want to channel capital towards philanthropic ends, so remittance inflows could be leveraged for impact investing, perhaps through an impact-focused angel investor network.
Demand-driven opportunities• Potential to increase gender lens investing: The average ticket size of a PII investment into a
male owned or led enterprise in the Philippines is currently much higher than that into a female owned or led enterprise. However, the Philippines has a strong enabling environment for female social entrepreneurs and staff. This provides immense opportunities for gender lens investors to invest in women-led enterprises or in enterprises that promote gender equity.
• Debt investments in agriculture: Most social enterprises are in the agricultural sector, which has nevertheless had few impact investments to date. This is partly because many social enterprises in agriculture are registered as cooperatives that cannot, by law, raise equity. However, these enterprises represent unmet potential for debt financing, especially revenue-based repayment models.
58 Arra B. Francia, “Family-Run Firms Still Dominate Philippine Business,” BusinessWorld, November 4, 2017, http://bworldonline.com/family-run-firms-still-dominate-philippine-business/.
FIGURE 25: OPPORTUNITIES FOR IMPACT INVESTING IN THE PHILIPPINES
Source: Intellecap Advisory Services analysis
SUPPLY DEMAND ECOSYSTEM
• Mobilizing domestic pools of capital for impact investing
• Tapping into remittances for impact investing
• Potential to increase gender lens investing• Debt investments in agriculture• Investments in innovative fi ntech• Technical assistance for investees
• Increasing government support of social entrepreneurship
• Partnerships with impact-agnostic incubators and accelerators
PHILIPPINES • 41
• Investments in innovative fintech: Access to finance is still a critical challenge in the Philippines, presenting significant opportunities for private sector activity. Fintech service providers have grown rapidly in recent years. Payment and remittance solutions offer substantial market potential in the Philippines and could generate both social and financial returns.
• Technical assistance for investees: Social entrepreneurship is increasingly recognized as an instrument to drive development in the Philippines. However, demand-side players indicate that the lack of skilled professionals limits their growth. This gap presents an opportunity for DFIs and grant makers to set up technical assistance facilities in the country. However, given that most of the social enterprises, barring cooperatives and community-based organizations, are at a very nascent stage, they have limited capacity to pay for such services.
Ecosystem-driven opportunities • Increasing government support of social entrepreneurship: The Philippine government could
approve the PRESENT bill to grow the number of social enterprises in the country. This bill focuses mostly on social enterprises that engage with the poor as partners or supply-chain players, and it includes provisions for the public procurement of goods produced by social enterprises. If the government provides such stimulus, investors may find it easier to source deals with satisfactory financial, social, and environmental performance.
• Partnerships with impact-agnostic incubators and accelerators: Investors without a local presence often struggle to source deals and provide high-touch support. Global investors could thus partner with local incubators and accelerators that have good track records to source more deals and monitor and manage investees across growth stages.

NOTES

NOTES

44 • THE LANDSCAPE FOR IMPACT INVESTING IN SOUTHEAST ASIA
ABOUT THE GLOBAL IMPACT INVESTING NETWORK This report is a publication of the Global Impact Investing Network (GIIN), the leading nonprofit organization dedicated to increasing the scale and effectiveness of impact investing around the world. The GIIN builds critical market infrastructure and supports activities, education, and research that help accelerate the development of a coherent impact investing industry.
Roadmap for the Future of Impact Investing
Interested in helping to build the field of impact investing? The GIIN’s Roadmap for the Future of Impact Investing: Reshaping Financial Markets presents a vision for more inclusive and sustainable financial markets and articulates a plan for impact investing to lead progress toward this future. To download the Roadmap and find more information about opportunities to get involved, visit roadmap.thegiin.org.
Impact Measurement and Management (IMM)
The GIIN provides tools, guidance, trainings, and resources to help investors identify metrics and integrate impact considerations into investment management.
thegiin.org/imm
Research
The GIIN conducts research to provide data and insights on the impact investing market and to highlight examples of effective practice.
thegiin.org/research
Initiative for Institutional Impact Investment
The GIIN Initiative for Institutional Impact Investment supports institutional asset owners seeking to enter, or deepen their engagement with, the impact investing market, by providing educational resources, performance research, and a vibrant community of practice.
thegiin.org/giin-initiative-for-institutional-impact-investment
Membership
GIIN Membership provides access to a diverse global community of organizations interested in deepening their engagement with the impact investment industry.
thegiin.org/membership
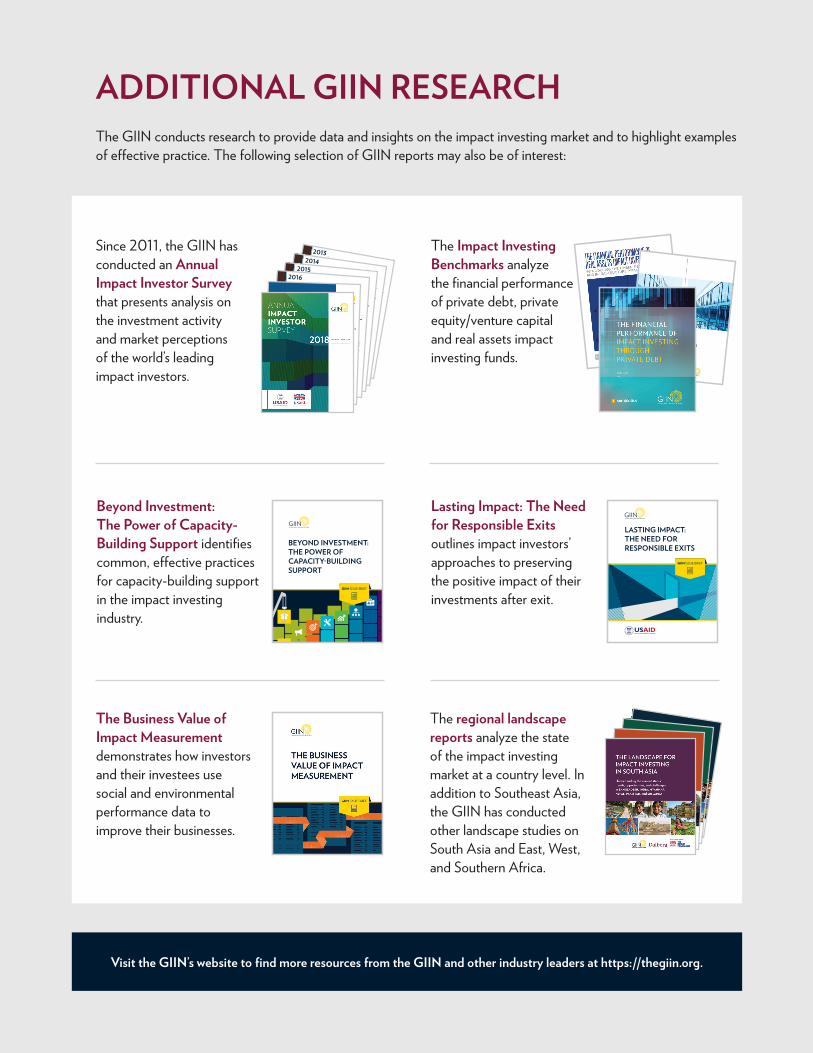
PHILIPPINES • 45
ADDITIONAL GIIN RESEARCHThe GIIN conducts research to provide data and insights on the impact investing market and to highlight examples of effective practice. The following selection of GIIN reports may also be of interest:
Since 2011, the GIIN has conducted an Annual Impact Investor Survey that presents analysis on the investment activity and market perceptions of the world’s leading impact investors.
The Impact Investing Benchmarks analyze the financial performance of private debt, private equity/venture capital and real assets impact investing funds.
The Business Value of Impact Measurement demonstrates how investors and their investees use social and environmental performance data to improve their businesses.
2017
Visit the GIIN’s website to find more resources from the GIIN and other industry leaders at https://thegiin.org.
The regional landscape reports analyze the state of the impact investing market at a country level. In addition to Southeast Asia, the GIIN has conducted other landscape studies on South Asia and East, West, and Southern Africa.
BEYOND INVESTMENT: THE POWER OF CAPACITY-BUILDING SUPPORT
Beyond Investment: The Power of Capacity-Building Support identifies common, effective practices for capacity-building support in the impact investing industry.
LASTING IMPACT: THE NEED FOR RESPONSIBLE EXITS
Lasting Impact: The Need for Responsible Exits outlines impact investors’ approaches to preserving the positive impact of their investments after exit.
2012
20142013
20152016
46 • THE LANDSCAPE FOR IMPACT INVESTING IN SOUTHEAST ASIA
ABOUT THE GLOBAL IMPACT INVESTING NETWORK
The Global Impact Investing Network (GIIN®) is a nonprofit organization dedicated to increasing the scale and effectiveness of impact investing. The GIIN builds critical infrastructure and supports activities, education, and research that help accelerate the development of a coherent impact investing industry. For more information, see www.thegiin.org.
[email protected] | www.thegiin.org | @theGIIN