the landscape for impact investing in … africa...abhilash mudaliar, ... 2 • the landscape for...
TRANSCRIPT

EXECUTIVE SUMMARY
THE LANDSCAPE FOR IMPACT INVESTING IN SOUTHERN AFRICA
WITH SUPPORT FROM

ACKNOWLEDGMENTSThis project was funded with UK aid from the UK Government though the Department for International Development’s Impact Programme. The Impact Programme (www.theimpactprogramme.org.uk) aims to catalyze the market for impact investment in sub-Saharan Africa and South Asia.
The Bertha Center at the University of Cape Town contributed to this report by providing access to their database of active impact investors operating across sub-Saharan Africa.
We would also like to thank Susan Balloch and Giselle Leung from the GIIN for their guidance throughout the research process and contributions to this report. We would further like to thank the tireless Open Capital Advisors (OCA) research team—Neal Desai, David Loew, Rodney Carew, Holden Bonwit, Katie Bach, Sarah Ndegwa, Elijah Ndarua, Joel Muli, Getrude Okoth, and Charles Njugunah—for their work interviewing impact investors, ecosystem players, and entrepreneurs, conducting rigorous data collection under tight timelines.
We would especially like to thank our interview participants. Without their key insights this report would not have been possible. We include a full list of interviewees in the Appendix.
For any questions or comments about this report, please email Rachel Bass at [email protected].
GIIN Advisory TeamAbhilash Mudaliar, Research ManagerKimberly Moynihan, Senior Associate, CommunicationsRachel Bass, Associate, Research
Open Capital AdvisorsAnnie Roberts, PartnerNicole DeMarsh, Principal
FEBRUARY 2016
WITH SUPPORT FROM

COMMON ACRONYMSAFD Agence Française de Développement (French
Development Agency)
AfDB African Development Bank
BIO Belgian Investment Company for Developing Countries
BoP Base of the Pyramid
CEPGL Communauté Économique des Pays des Grand Lacs (Economic Community of the Great Lakes Countries)
COMESA The Common Market for Eastern and Southern Africa
CSR Corporate Social Responsibility
DFI Development Finance Institution
DFID The Department for International Development (United Kingdom)
EIB European Investment Bank
ESG Environmental, Social, and Governance
FDI Foreign Direct Investment
FMCG Fast-Moving Consumer Goods
FMO Nederlandse Financierings-Maatschappij voor Ontwikkelingslanden N.V. (Netherlands Development Finance Company)
GDP Gross Domestic Product
GIIRS Global Impact Investing Ratings System
GIZ Gesellschaft für Internationale Zusammenarbeit (German Agency for International Cooperation)
HDI Human Development Index
ICT Information and Communication Technology
IFAD International Fund for Agricultural Development
IFC International Finance Corporation
IMF International Monetary Fund
LP Limited Partner
MDG Millennium Development Goal
MFI Microfinance Institution
MSME Micro, Small, and Medium-Sized Enterprises
NGO Non-Governmental Organization
OFID OPEC Fund for International Development
OPIC Overseas Private Investment Corporation (United States)
PE Private Equity
PPA Power Purchasing Agreement
PPP Purchasing Power Parity
PTA Preferential Trade Area Bank
RFP Request for Proposal
SACCO Savings and Credit Co-operative
SGB Small and Growing Business
SME Small and Medium-Sized Enterprises
SOE State-Owned Enterprises
TA Technical Assistance
UN DESA United Nations, Department of Economic and Social Affairs
UNCTAD United Nations’ Conference on Trade and Development
USAID The United States Agency for International Development
VAT Value-Added Tax
VC Venture Capital
WASH Water, Sanitation, and Hygiene
WHO World Health Organization
COMMON TERMSEarly-stage business Business that has begun operations but has most likely not begun commercial manufacture and sales
Focus countries Countries under study wherein non-DFI impact investors are most active, namely Madagascar, Malawi, Mozambique, South Africa, Zambia, and Zimbabwe
Growth-stage business Company has a functioning business model, and its current focus is developing new products / services or expanding into new markets
Mature business Profitable company with a developed and recognizable brand
Non-focus countries Countries covered by the study but that have limited non-DFI impact investor activity, namely Angola, Botswana, Lesotho, Mauritius, Namibia, and Swaziland
Venture-stage business Sales have begun but cannot sustain the company’s operations. The business model is still being aligned with the realities on the ground

IV • THE LANDSCAPE FOR IMPACT INVESTING IN SOUTHERN AFRICA
EXECUTIVE SUMMARYANCHORED BY SOUTH AFRICA, GROWING OPPORTUNITIES FOR IMPACT INVESTMENT THROUGHOUT THE REGION

EXECUTIVE SUMMARY • 1
TABLE OF CONTENTSAbout this Report . . . . . . . . . . . . . . . . . . . . . . . . . . . . . . . . . . . . . . . . . . . . . . . . . . . . . . . . . . . . . . . . . . . . . . 2
Introduction . . . . . . . . . . . . . . . . . . . . . . . . . . . . . . . . . . . . . . . . . . . . . . . . . . . . . . . . . . . . . . . . . . . . . . . . . . . . . 3
Regional Context . . . . . . . . . . . . . . . . . . . . . . . . . . . . . . . . . . . . . . . . . . . . . . . . . . . . . . . . . . . . . . . . . . . . . . 5
Gross Domestic Product . . . . . . . . . . . . . . . . . . . . . . . . . . . . . . . . . . . . . . . . . . . . . . . . . . . . . . . . . 5
Inflation and Exchange Rates . . . . . . . . . . . . . . . . . . . . . . . . . . . . . . . . . . . . . . . . . . . . . . . . . . . . 7
Ease of Doing Business . . . . . . . . . . . . . . . . . . . . . . . . . . . . . . . . . . . . . . . . . . . . . . . . . . . . . . . . . . . 9
Supply of Impact Capital . . . . . . . . . . . . . . . . . . . . . . . . . . . . . . . . . . . . . . . . . . . . . . . . . . . . . . . . . . . . . 10
Impact Capital Disbursed . . . . . . . . . . . . . . . . . . . . . . . . . . . . . . . . . . . . . . . . . . . . . . . . . . . . . . . . 10
Investments over Time . . . . . . . . . . . . . . . . . . . . . . . . . . . . . . . . . . . . . . . . . . . . . . . . . . . . . . . . . . . 12
Sector . . . . . . . . . . . . . . . . . . . . . . . . . . . . . . . . . . . . . . . . . . . . . . . . . . . . . . . . . . . . . . . . . . . . . . . . . . . . . . . 14
Deal Size . . . . . . . . . . . . . . . . . . . . . . . . . . . . . . . . . . . . . . . . . . . . . . . . . . . . . . . . . . . . . . . . . . . . . . . . . . . 15
Instrument . . . . . . . . . . . . . . . . . . . . . . . . . . . . . . . . . . . . . . . . . . . . . . . . . . . . . . . . . . . . . . . . . . . . . . . . . . 17
Impact Tracking Standards . . . . . . . . . . . . . . . . . . . . . . . . . . . . . . . . . . . . . . . . . . . . . . . . . . . . . . . 18
Demand and Need for Impact Investing Capital . . . . . . . . . . . . . . . . . . . . . . . . . . . . . . . . . . 19
Development Context . . . . . . . . . . . . . . . . . . . . . . . . . . . . . . . . . . . . . . . . . . . . . . . . . . . . . . . . . . . 19
Challenges and Opportunities for Impact Investors . . . . . . . . . . . . . . . . . . . . . . . . . . . . . . . 21
Sector Opportunities across Southern Africa . . . . . . . . . . . . . . . . . . . . . . . . . . . . . . . . . . . . . . 23
Recommendations for Future Study . . . . . . . . . . . . . . . . . . . . . . . . . . . . . . . . . . . . . . . . . . . . . . . . . 25
Appendix: Organizations Interviewed for this Report . . . . . . . . . . . . . . . . . . . . . . . . . . . . . 26

2 • THE LANDSCAPE FOR IMPACT INVESTING IN SOUTHERN AFRICA
ABOUT THIS REPORTMOTIVATION
The impact investing industry has grown in prominence over the last decade, and impact investors globally have developed substantial and particular interest in sub-Saharan Africa, given the region’s strong potential for investments to drive positive social and environmental impact. Despite strong interest, relatively little research has examined impact investing markets at the country level within the continent. This type of granular information is essential to investors currently operating in the region or considering investments there in the future.
This study provides detailed information on impact investing activity across 12 countries in Southern Africa. For each country, the report examines impact investing capital disbursed at the time of data collection in mid-2015 (by sector, size, and instrument), analyzes key trends in the industry, and describes the challenges and opportunities available for social enterprises and impact investors. Political and/or economic circumstances may have changed since initial data collection.
SCOPE
As defined by the GIIN, impact investments are “investments made into companies, organizations, and funds with the intention to generate social and environmental impact alongside a financial return.” A commitment to measuring social or environmental performance is considered a hallmark of impact investing. Investors who do not meet this definition have not been included in this report’s analysis.
Development finance institutions (DFIs) are important actors in the impact investing landscape, providing large amounts of capital both through direct impact investments and through indirect investments through other impact capital vehicles. Because of their large size and unique nature, this report analyzes DFI activity separately from the activity of other types of impact investors.
METHODOLOGY
This report relies heavily on primary research, including more than 60 interviews with local and international impact investors, social enterprises, ecosystem players, and government institutions. The research team also examined publicly available primary information, including analyzing investor documents and reviewing organizational websites and press releases to compile a comprehensive database of impact investing activity across all 12 countries in Southern Africa. Overall, this report includes data regarding the activities of 25 DFIs and 81 non-DFI impact investors, totaling over 8,600 transactions including substantial activity from DFIs based in South Africa.
More detailed information on methodology and scope is provided in the ‘Introduction & Methodology’ chapter. All chapters of this report can be found at www.thegiin.org.
2 • THE LANDSCAPE FOR IMPACT INVESTING IN SOUTHERN AFRICA

EXECUTIVE SUMMARY • 3
INTRODUCTIONThis report studies in detail impact investing activity across Southern Africa, examining the supply of global impact investment capital as well as the demand for investment resources from small and medium-sized enterprises (SMEs), social enterprises, and others who aim to drive development through the private sector. The report covers twelve countries: Angola, Botswana, Lesotho, Madagascar, Malawi, Mauritius, Mozambique, Namibia, South Africa, Swaziland, Zambia, and Zimbabwe.
Impact investors are defined as those who invest with the intention to generate positive social or environmental impact alongside financial returns. They include a wide range of investor types: development finance institutions (DFIs), foundations, banks, pension funds, and fund managers who raise capital from these various investor types and then channel it to enterprises.
Given DFIs’ long history and the size of their balance sheets, this report makes an effort to separate the activities of DFI impact investors (“DFIs”) from those of other impact investors (“non-DFI impact investors”). The included, separate chapter on DFIs provides more detail on the important role that this specific constituency plays in the region.
FIGURE 1. PERCENT IMPACT CAPITAL DISBURSED BY COUNTRY
RegionalSwazilandAngolaBotswanaMalawiZimbabweLesothoMadagascarMauritiusNamibiaMozambiqueZambia
100%
90%
80%
70%
60%
50%
40%
30%
20%
10%
0%
USD 830 MILLION
USD 7.0 BILLION
USD 4.9 BILLION USD 9.8 BILLIONSOUTH AFRICA
Non-DFIs DFIs
Note: Figure excludes domestic South African DFI activity. Also excludes South Africa, which comprises > 90% of total non-DFI impact capital and > 30% of total DFI capital, to avoid skewing the chart.Source: Open Capital Research

4 • THE LANDSCAPE FOR IMPACT INVESTING IN SOUTHERN AFRICA
Within the region, South Africa is the largest market for impact investing, with a particularly active set of domestic South African DFIs that fund South African enterprises. These South African DFIs have disbursed more than USD 14.4 billion across 6,800 transactions to South African companies (comprising 85 percent of domestic South African DFIs’ disbursements and 91 percent of domestic South African DFIs’ transactions), some of which operate across the region. Broad-based Black Economic Empowerment (BBBEE) initiatives are closely linked to domestic DFI activity within South Africa, and these create interesting market dynamics and opportunities. For more information on domestic DFI activity and BBBEE in South Africa, see the DFI and South Africa chapters in this report.
The majority of impact capital in the region has come from international DFIs and a range of non-DFI impact investors. In total, non-DFI investors have closed more than 500 deals and disbursed USD 5.7 billion throughout the region.1 It should be noted that the ten largest transactions in this group account for just over USD 3 billion of capital disbursed. International DFIs have closed more than 650 deals and disbursed USD 16.7 billion. Larger than either of these categories of actors alone, domestic South African DFIs have closed more than 7,500 deals and disbursed USD 17.1 billion throughout the region.
Even excluding this strong domestic activity, South Africa is the center of Southern African impact investing. Three-fifths of non-DFI impact deals in the region have been in South Africa, representing USD 4.9 billion of the total USD 5.6 billion non-DFI impact capital disbursed in the region. Notably, 47% of this USD 4.9 billion (USD 2.3 billion) was disbursed in just the three largest deals in South Africa. Over half of the USD 16.7 billion in DFI impact capital disbursed in Southern Africa has been in South Africa—more than triple the amount deployed in both Zambia and Mozambique, the two countries with the next highest amounts deployed (around 10 percent and eight percent, respectively; see Figure 1 for disbursements by country). Even excluding domestic DFI activity in South Africa, DFIs have provided the vast majority of impact capital to date, accounting for more than 75 percent of disbursements.2
1 Please see the Methodology section for additional detail; non-DFI numbers exclude activity from Business Partners International, which has completed more than 70 thousand debt transactions over the last 30 years in South Africa.
2 Open Capital research.

EXECUTIVE SUMMARY • 5
REGIONAL CONTEXTSouth Africa anchors Southern Africa and uses its regional weight to push for continental integration, acting as the founding member of such continent-spanning organizations as the African Union (AU), as well as of organizations that focus regionally on Southern Africa, including the South African Development Community (SADC),3 the Southern African Customs Union (SACU),4 and the Common Monetary Area (CMA).5
FIGURE 2. GDP (PPP) GROWTH IN SOUTHERN AFRICA, 2005-2014
Market worth USD 400 B today, not including South Africa at
USD 725 B and Angola at USD 185 BUSD BILLIONSTODAY
2005 2006 2007 2008 2009 2010 2011 2012 2013 2014 2015
70
60
50
40
30
20
10
0
Zambia 9%Madagascar 4%Botswana 6%Mozambique 8%Zimbabwe 4%Namibia 6%Mauritius 5% Malawi 8% Swaziland 4% Lesotho 6%
CAGR
Note: Excludes South Africa (4% CAGR) and Angola (10% CAGR) to avoid skewing the chart.Source: IMF World Economic Outlook, April 2015
Gross Domestic ProductSouthern Africa has seen moderate growth in recent years, averaging a combined five percent annual growth in gross domestic product (GDP) at purchasing power parity (PPP) between 2005 and 2014 (see Figure 2). Across the region, total GDP (PPP) currently stands at approximately USD 1.2 trillion, with South Africa accounting for 60 percent and Angola a further 15 percent.6 Over the past decade, Zambia and Mozambique were the two fastest-growing economies, at nine and eight percent compound annual growth rates (CAGR), respectively.
3 SADC member states are Angola, Botswana, the Democratic Republic of the Congo, Lesotho, Madagascar, Mauritius, Malawi, Mozambique, Namibia, the Seychelles, South Africa, Swaziland, Tanzania, Zambia, and Zimbabwe.
4 SACU member states are South Africa, Lesotho, Swaziland, Namibia, and Botswana.5 CMA member states are South Africa, Lesotho, and Swaziland.6 World Economic Outlook Database (Washington, DC: International Monetary Fund), accessed April
2015, https://www.imf.org/external/pubs/ft/weo/2015/01/weodata/index.aspx.

6 • THE LANDSCAPE FOR IMPACT INVESTING IN SOUTHERN AFRICA
FIGURE 3. PROJECTED GDP (PPP) GROWTH IN SOUTHERN AFRICA, 2015-2020
By 2020, South Africa GDP expected at USD 905 B and
Angola at USD 262 B
USD BILLIONS
TODAY
2015 2016 2017 2018 2019 2020
120
100
80
60
40
20
0
Zambia 7%Mozambique 9%Madagascar 6%Botswana 5%Zimbabwe 5%Namibia 6%Mauritius 5% Malawi 7% Swaziland 3% Lesotho 6%
CAGR
Note: Excludes South Africa (4% projected CAGR) and Angola (6% projected CAGR) to avoid skewing the chart.Source: IMF World Economic Outlook, April 2015
The International Monetary Fund (IMF) projects that the region will continue to experience roughly five percent annual growth through 2020, with the region’s total GDP (PPP) growing to over USD 1.5 trillion. South Africa is projected to continue to comprise nearly 60 percent of the region’s GDP (PPP) and Angola to grow to nearly 18 percent. Though not the largest economy, Mozambique is expected to experience the strongest growth, with year-on-year rates of over nine percent.
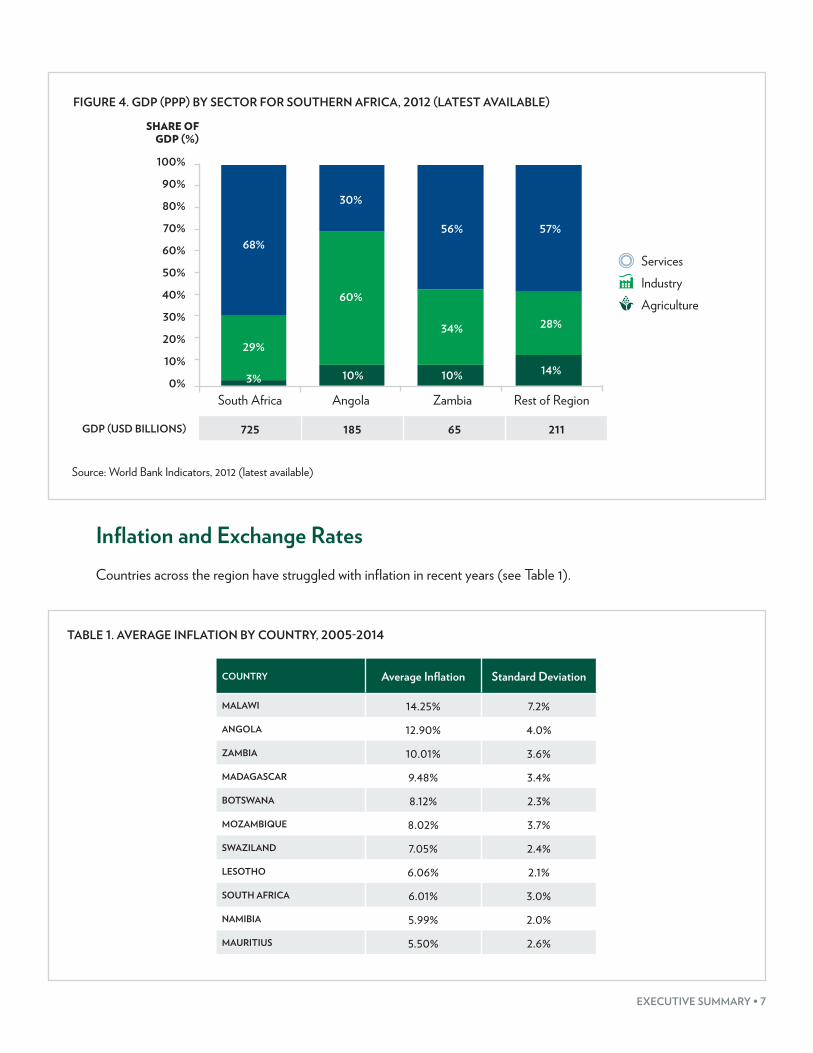
Unlike in the rest of sub-Saharan Africa, agriculture is a small contributor to GDP in Southern Africa, driven largely by well-developed services markets in South Africa and a strong extractives industry in Angola (see Figure 4). Zambia’s proximity to South Africa has led to a strong services sector there, as well. The rest of the region is split, with some countries having very small agricultural sectors (e.g., Mauritius and Namibia), while others, such as Madagascar and Mozambique, more closely match trends elsewhere on the continent, with more than 20 percent of their GDP attributable to agriculture.7
7 The World Bank: Data, “Indicators,” http://data.worldbank.org/indicator.
EXECUTIVE SUMMARY • 7
FIGURE 4. GDP (PPP) BY SECTOR FOR SOUTHERN AFRICA, 2012 (LATEST AVAILABLE)
ServicesIndustryAgriculture
100%
90%
80%
70%
60%
50%
40%
30%
20%
10%
0%
725 185 65 211GDP (USD BILLIONS)
South Africa Angola Zambia Rest of Region
SHARE OF GDP (%)
68%
30%
56%
34%
10% 14%
28%
57%
60%
10%
29%
3%
Source: World Bank Indicators, 2012 (latest available)
Inflation and Exchange RatesCountries across the region have struggled with inflation in recent years (see Table 1).
TABLE 1. AVERAGE INFLATION BY COUNTRY, 2005-2014
COUNTRY Average Inflation Standard Deviation
MALAWI 14.25% 7.2%ANGOLA 12.90% 4.0%ZAMBIA 10.01% 3.6%MADAGASCAR 9.48% 3.4%BOTSWANA 8.12% 2.3%MOZAMBIQUE 8.02% 3.7%SWAZILAND 7.05% 2.4%LESOTHO 6.06% 2.1%SOUTH AFRICA 6.01% 3.0%NAMIBIA 5.99% 2.0%MAURITIUS 5.50% 2.6%

8 • THE LANDSCAPE FOR IMPACT INVESTING IN SOUTHERN AFRICA
In the late 2000s, Zimbabwe experienced one of the worst periods of hyperinflation ever recorded globally, peaking at a rate of inflation of over 231 million percent annually (for more information, see the Zimbabwe chapter).8 Malawi has also experienced strong inflation since 2012, with average rates above 20 percent per year, which drives up its average in Table 1. Overall, every country in the region has experienced average inflation rates above five percent per year over the last decade, with significant fluctuations in all countries. In no year has any country had inflation below three percent.
Most countries also faced significant depreciation of their currencies against the US Dollar between 2005 and 2014 (see Figure 5). High inflation rates and significant monetary volatility pose substantial challenges to both impact investors and the enterprises they support, as input prices rise and relative incomes decrease. Concerns about foreign exchange rates complicate both impact investors’ ability to disburse local currency debt and enterprises’ ability to repay international currency obligations. Across the region, all countries have struggled to stabilize exchange rates. In showing cumulative depreciation, Figure 5 masks year-to-year and month-to-month variation, volatility that exposes investors to potentially sudden and significant foreign exchange losses while increasing the effective interest rate enterprises face for internationally denominated facilities and amplifying the likelihood of default for companies that collect revenues primarily in local currency.
FIGURE 5. CURRENCY DEPRECIATION BY COUNTRY, 2005-2014
Malawi
Botswana
Swazilan
d
Lesotho
Namibia
South Africa
Angola
Mozambique
Madagascar
Zambia
Mauritius
400%350%300%250%200%150%100%
50%0%
356%
112% 93% 93% 93% 93% 77% 77%42% 35%
12%
Note: Data not available for Zimbabwe due to hyperinflation.Source: Oanda Historical Currency Rates
8 Steve H. Hanke, “R.I.P Zimbabwe Dollar,” Cato Institute, February 5, 2009, http://www.cato.org/zimbabwe.

EXECUTIVE SUMMARY • 9
Ease of Doing BusinessAccording to the World Bank’s “Ease of Doing Business” rankings, the ease of operating a company in Southern Africa varies substantially by country (see Table 2). Mauritius ranks in the top 30 globally, alongside substantially more developed countries, as it has invested significant resources in order to become a global financial center. Similarly, South Africa ranks in the top 50, helping to drive a general understanding that business in South Africa operates much like it does in the United States and Europe. On the other hand, some countries in the region—such as Madagascar, Malawi, Zimbabwe, and Angola—are among the most difficult countries in the world in which to do business, as measured by this index.
TABLE 2. EASE OF DOING BUSINESS RANKINGS BY COUNTRY
COUNTRY Ranking
MAURITIUS 28
SOUTH AFRICA 43
BOTSWANA 74
NAMIBIA 88
SWAZILAND 110
ZAMBIA 111
MOZAMBIQUE 127
LESOTHO 128
MADAGASCAR 163
MALAWI 164
ZIMBABWE 171
ANGOLA 181
Source: World Bank

10 • THE LANDSCAPE FOR IMPACT INVESTING IN SOUTHERN AFRICA
SUPPLY OF IMPACT CAPITAL In total, 107 impact organizations are placing capital in Southern Africa. Of these, 23 are international DFIs, three are domestic South African DFIs, and 72 are non-DFI investors. The remaining nine include a mix of banks, pension funds, and foundations. Together, these impact organizations manage a combined 118 vehicles active in the region. More than 85 percent of non-DFI investors are impact fund managers, while the other 15 percent include a mix of foundations, pension funds, and banks (see Table 3).
TABLE 3. TYPICAL STRUCTURES, SECTORS, AND INVESTORS BY DEAL SIZE
Deal size range (USD) Typical financial products Typical sectors Example providers in
Southern Africa
Less than 500K Debt, small equity stakes ICT, Agriculture, Health, Energy
Small VC and debt-finance funds targeting early stage businesses, domestic DFIs
500K – 1M Equity, debt, quasi-equity, convertibles
Agriculture, Financial Services, Health, Energy
Private equity funds, VC funds, and foundations tar-
geting social businesses with some track record
1M – 5M Equity, debt, quasi-equity, convertibles
Agriculture, Financial Services, Health, Energy
Larger impact funds and foundations
5M – 10M Equity, debt, quasi-equity, guarantees Financial Services, Energy Smaller national DFIs and
large impact funds
10M – 50M Equity, debt, quasi-equity, guarantees
Financial Services, Infrastructure, Manufacturing Regional and national DFIs
Over 50M Debt, guarantees Financial Services, Infrastructure, Energy
Large regional and national DFIs
Source: Open Capital Research, interviews
Impact Capital DisbursedThe vast majority of impact capital in the region has been disbursed in South Africa, primarily on account of an active set of domestic South African DFIs. Combined, these domestic DFIs have disbursed close to USD 25 billion across 7,500 deals to South African companies regionally. International DFIs, for their part, have closed

EXECUTIVE SUMMARY • 11
more than 650 deals and disbursed USD 16.7 billion (see Figure 6).9 Last, but not least, non-DFI impact investors have closed more than 500 deals and disbursed USD 5.6 billion throughout the region (see Figure 7). As noted earlier, the 10 largest deals account for just over USD 3 billion of this amount.
FIGURE 6. TOTAL DFI DIRECT INVESTMENTS BY COUNTRY
CAPITAL DISBURSED (USD MILLIONS) NUMBER OF DEALS
South Africa 52.2Zambia 16.3
Mozambique 14.6Namibia 23.8
Mauritius 15.0Madagascar 20.2
Lesotho 31.4Zimbabwe 6.5
Malawi 7.0Botswana 12.2
Angola 6.7Swaziland 13.0Regional 17.3
Average deal size (USD millions)
0 50 100 1505001,0001,50010,000 0 200
9,7671,717
1,385834
600465
283267267207
10026
813
187105
953540
239
4138
1715
247
Notes: Average deal sizes may not equal displayed capital disbursed divided by deal sizes. Capital disbursed rounded to nearest million, except where less than 1 million (rounded to nearest 100,000). Average deal sizes rounded to nearest 100,000. Excludes domestic DFI activity.Source: Open Capital Research
Beyond its substantial domestic activity, South Africa was the destination for three-fifths of non-DFI deals and 30 percent of international DFI deals. Zambia and Mozambique come next, having each received approximately 15 percent of DFI investments and approximately 10 percent of non-DFI investments. However, with their significantly smaller average deal sizes, these countries have absorbed less than 10 percent of DFI capital and less than two percent of non-DFI capital. With its significantly larger average deal size, South Africa absorbs 85 percent of non-DFI capital disbursed, despite representing only 60 percent of deals transacted. Of the total USD 4.9 billion non-DFI capital disbursed in South Africa, 47 percent (USD 2.3 billion) was disbursed in just the three largest transactions.
9 Please see the Methodology section for additional detail; non-DFI numbers exclude activity from Business Partners International, which has completed more than 70 thousand debt transactions over the last 30 years in South Africa.

12 • THE LANDSCAPE FOR IMPACT INVESTING IN SOUTHERN AFRICA
FIGURE 7. TOTAL NON-DFI DIRECT INVESTMENTS BY COUNTRY
CAPITAL DISBURSED (USD MILLIONS) NUMBER OF DEALS
South Africa 15.8Angola 31.0Zambia 2.7
Mauritius 9.2Zimbabwe 9.8
Malawi 1.9Mozambique 1.2
Botswana 18.8Madagascar 1.7
Swaziland 15.0Lesotho 5.0Namibia 1.1Regional 10.2
Average deal size (USD millions)
0 20 40 60 80501001505,000 0 320
4,864186
158129
1075752
383530
151210
3076
5814
1130
422
23
111
21
South Africa is a significant outlier with almost USD 5 B in
over 300 deals.
Notes: Average deal sizes may not equal displayed capital disbursed divided by deal sizes. Capital disbursed rounded to nearest million, except where less than 1 million (rounded to nearest 100,000). Average deal sizes rounded to nearest 100,000.Source: Open Capital Research
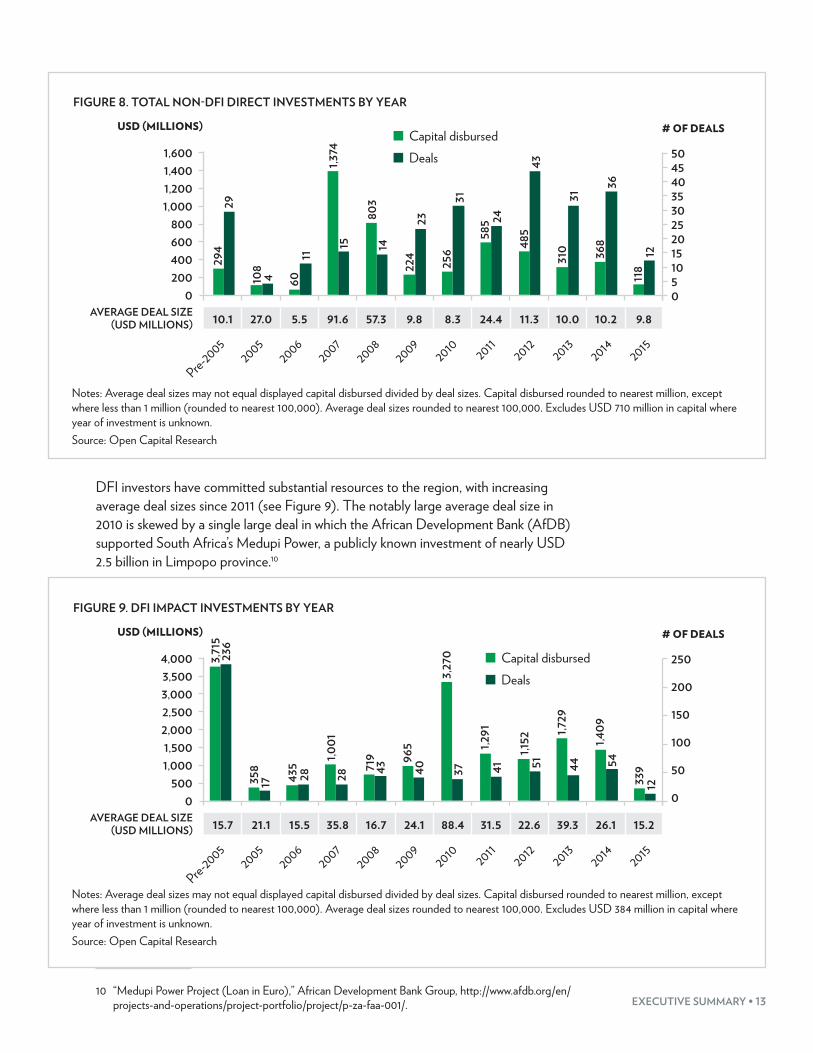
Investments over TimeThroughout the region, there have been substantial investments over time. Non-DFI investment activity in the region has notably increased since 2006, with more transactions occurring each year on average (see Figure 8). The large disbursement volumes in 2007 and 2008 include large leveraged buyouts by impact investors in South Africa. Data for 2015 were collected mid-year and should not be interpreted as a reduction in activity; please see the Methodology chapter for more detail.
EXECUTIVE SUMMARY • 13
FIGURE 8. TOTAL NON-DFI DIRECT INVESTMENTS BY YEAR
Capital disbursedDeals
2005
Pre-2005
20062007
20082009
2010 20112012 2013
2014 2015
1,6001,4001,2001,000
800600400200
0
50454035302520151050
10.1 27.0 5.5 91.6 57.3 9.8 8.3 24.4 11.3 10.0 10.2 9.8AVERAGE DEAL SIZE (USD MILLIONS)
294
29
108
4 6011
1,374
15
803
14
224
256
585
485
310 36
8
118
12
36
31
43
24
31
23
USD (MILLIONS) # OF DEALS
Notes: Average deal sizes may not equal displayed capital disbursed divided by deal sizes. Capital disbursed rounded to nearest million, except where less than 1 million (rounded to nearest 100,000). Average deal sizes rounded to nearest 100,000. Excludes USD 710 million in capital where year of investment is unknown.Source: Open Capital Research
DFI investors have committed substantial resources to the region, with increasing average deal sizes since 2011 (see Figure 9). The notably large average deal size in 2010 is skewed by a single large deal in which the African Development Bank (AfDB) supported South Africa’s Medupi Power, a publicly known investment of nearly USD 2.5 billion in Limpopo province.10
FIGURE 9. DFI IMPACT INVESTMENTS BY YEAR
Capital disbursedDeals
2005
Pre-2005
20062007
20082009
2010 20112012 2013
2014 2015
4,0003,5003,0002,5002,0001,5001,000
5000
250
200
150
100
50
0
15.7 21.1 15.5 35.8 16.7 24.1 88.4 31.5 22.6 39.3 26.1 15.2AVERAGE DEAL SIZE (USD MILLIONS)
3,71
523
6
358
17 435
28
1,001
28
719
43
965
3,27
0
1,291
1,152
1,729
1,409
339
12
544451413740
USD (MILLIONS) # OF DEALS
Notes: Average deal sizes may not equal displayed capital disbursed divided by deal sizes. Capital disbursed rounded to nearest million, except where less than 1 million (rounded to nearest 100,000). Average deal sizes rounded to nearest 100,000. Excludes USD 384 million in capital where year of investment is unknown.Source: Open Capital Research
10 “Medupi Power Project (Loan in Euro),” African Development Bank Group, http://www.afdb.org/en/projects-and-operations/project-portfolio/project/p-za-faa-001/.

14 • THE LANDSCAPE FOR IMPACT INVESTING IN SOUTHERN AFRICA
SectorThe distribution of investments by sector broadly reflects areas of investor interest (see Table 3). For non-DFI investors, agriculture and financial services have seen the largest number of deals (see Figure 10). A handful of large deals in financial services have driven the larger average deal size in that sector. Housing, energy, and information and communications technologies (ICT) are also popular sectors. For DFIs, financial services and manufacturing are the most popular sectors in terms of number of transactions (see Figure 11), though energy has seen the largest amount of capital disbursed, as transactions in this sector are very capital intensive. This figure includes the Medupi Power deal in South Africa described above.
FIGURE 10. NON-DFI DIRECT INVESTMENTS BY SECTOR
CAPITAL DISBURSED (USD MILLIONS) NUMBER OF DEALS
Financial Services 22.6Manufacturing 52.0
Housing 12.0Energy 14.3
Infrastructure 57.2Agriculture 3.8Extractives 22.4
ICT 1.8Health 5.7
Education 8.1WASH 11.2
Fund 3.2Other 22.3
Average deal size (USD millions)
01,500 1,0002,000 500 10060 8040200
8115
5539
797
532
96
25
33
1,830
558400
372112
5651492219
735
658780
Notes: Average deal sizes may not equal displayed capital disbursed divided by deal sizes. Capital disbursed rounded to nearest million, except where less than 1 million (rounded to nearest 100,000). Average deal sizes rounded to nearest 100,000. Excludes USD 54 million in capital where sector is unknown.Source: Open Capital Research

EXECUTIVE SUMMARY • 15
FIGURE 11. DFI DIRECT INVESTMENTS BY SECTOR
CAPITAL DISBURSED (USD MILLIONS) NUMBER OF DEALS
Energy 71.9Financial Services 19.2
WASH 40.6Agriculture 20.0
Manufacturing 16.3Infrastructure 79.6
Extractives 39.3ICT 9.5
Health 16.6Education 12.1
Tourism 3.2Housing 15.0
Other 7.9
Average deal size (USD millions)
04,000 2,0006,000 50 100 150 2000
76181
356368
1325
5,467
1,2621,111
1,035983
1,4203,468
237166121
3815
365
25101012
146
Notes: Average deal sizes may not equal displayed capital disbursed divided by deal sizes. Capital disbursed rounded to nearest million, except where less than 1 million (rounded to nearest 100,000). Average deal sizes rounded to nearest 100,000.Excludes USD 83 million in capital where sector is unknown. Excludes domestic South African DFIs due to limited data.Source: Open Capital Research
Deal SizeThe majority of transactions completed by non-DFIs have been small, with nearly half being less than USD one million (see Figure 12). Roughly a quarter of deals have been in the range of USD one-to-five million. Perhaps surprisingly, a significant number of non-DFI deals (approximately 20 percent) have been above USD 10 million; these comprise more than 90 percent of non-DFI capital disbursed. These large deals are primarily in infrastructure, energy, and financial services.

16 • THE LANDSCAPE FOR IMPACT INVESTING IN SOUTHERN AFRICA
FIGURE 12. NON-DFI IMPACT INVESTMENTS BY DEAL SIZE
CAPITAL DISBURSED (USD MILLIONS) NUMBER OF DEALS
< 250k 0.2250-500k 0.3500k-1m 0.7
1-5m 2.35-10m 6.5> 10m 48.2
157
Average deal size (USD millions)
0 100 150 2005001002005,200
5147
11234
107
1517
31254
2205,158
More than USD 5 billion, or > 90 percent of all capital disbursed, placed in deals > USD 10 million
Notes: Average deal sizes may not equal displayed capital disbursed divided by deal sizes. Capital disbursed rounded to nearest million, except where less than 1 million (rounded to nearest 100,000). Average deal sizes rounded to nearest 100,000.Source: Open Capital Research
Meanwhile, only about 50 percent of DFI transactions have been smaller than USD 10 million (see Figure 13). Roughly 40 percent of DFI transactions were in the USD 10–50 million range, and a further 10 percent have been above USD 50 million.
FIGURE 13. DFI IMPACT INVESTMENTS BY DEAL SIZE
CAPITAL DISBURSED (USD MILLIONS) NUMBER OF DEALS
< 1m 0.51-5m 2.4
5-10m 6.910-20m 13.820-50m 30.6
> 50m 131.0
79
Average deal size (USD millions)
0 100 150 2005004,0008,00012,000
153102
113130
77
37370
7041,554
3,98110,085
Notes: Average deal sizes may not equal displayed capital disbursed divided by deal sizes. Capital disbursed rounded to nearest million, except where less than 1 million (rounded to nearest 100,000). Average deal sizes rounded to nearest 100,000. Excludes domestic South African DFI activity due to limited data.Source: Open Capital Research

EXECUTIVE SUMMARY • 17
InstrumentWhile non-DFI impact investors seem equally comfortable investing via both debt and equity, the average deal sizes for equity investments are far higher than for debt investments, primarily due to three large equity investments in South Africa worth a combined USD 2.3 billion (see Figure 14). Excluding these three large deals, the average equity transaction is USD 7.1 million.
FIGURE 14. NON-DFI IMPACT INVESTMENTS BY INSTRUMENT TYPE
Capital disbursedDeals
5,0004,5004,0003,5003,0002,5002,0001,500
5000
180160140120100806040200
25.4 4.5 0.3 3.8AVERAGE DEAL SIZE (USD MILLIONS)
USD (MILLIONS) # OF DEALS
4,352
615
137
171
1 4 17 11
Equity Debt Debt and Equity
Quasi-equity
Notes: Average deal sizes may not equal displayed capital disbursed divided by deal sizes. Capital disbursed rounded to nearest million, except where less than 1 million (rounded to nearest 100,000). Average deal sizes rounded to nearest 100,000. Excludes USD 708 million in capital where instrument type is unknown.Source: Open Capital Research
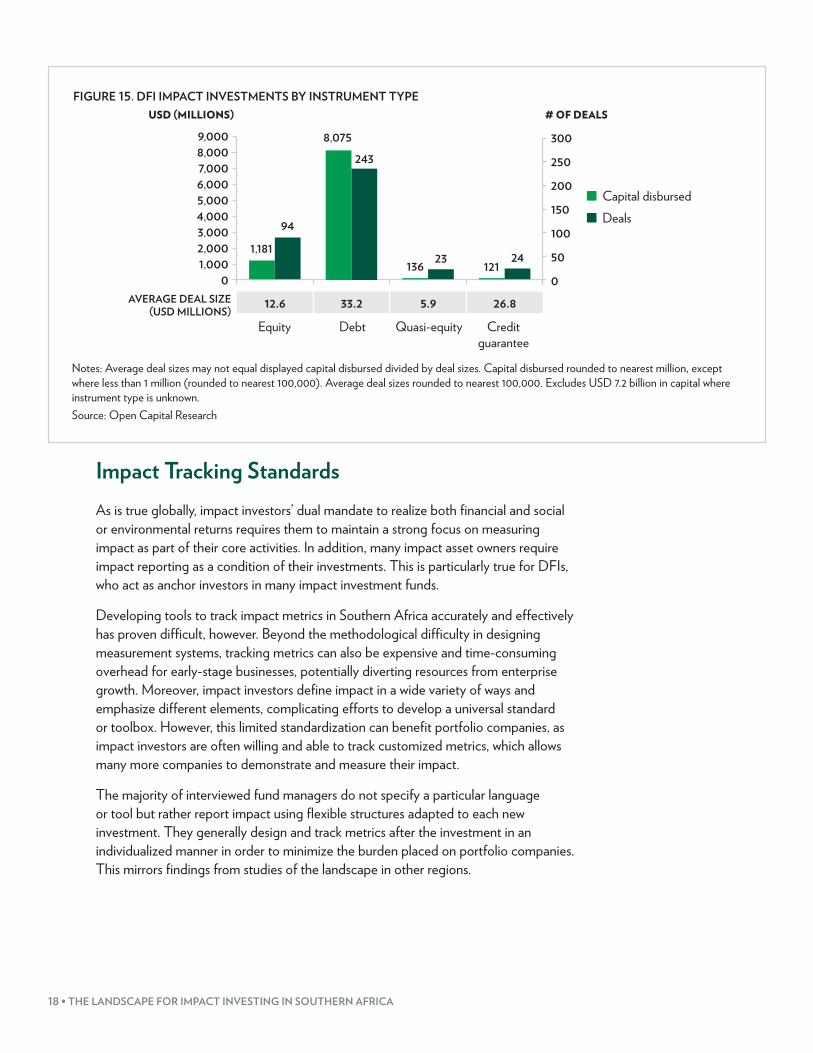
DFIs, however, strongly prefer debt deals to equity, having disbursed nearly seven times as much impact capital through traditional debt instruments as they have through equity (see Figure 15). Interestingly, DFI debt deals are also significantly larger than are DFI equity deals, opposite to the case of non-DFI impact investors. Occasionally, DFIs also use quasi-equity and credit guarantees.
18 • THE LANDSCAPE FOR IMPACT INVESTING IN SOUTHERN AFRICA
FIGURE 15. DFI IMPACT INVESTMENTS BY INSTRUMENT TYPE
Capital disbursedDeals
9,0008,0007,0006,0005,0004,0003,0002,0001,000
0
300
250
200
150
100
50
0
12.6 33.2 5.9 26.8AVERAGE DEAL SIZE (USD MILLIONS)
USD (MILLIONS) # OF DEALS
1,181
8,075
243
94
13623
12124
Equity Debt Quasi-equity Credit guarantee
Notes: Average deal sizes may not equal displayed capital disbursed divided by deal sizes. Capital disbursed rounded to nearest million, except where less than 1 million (rounded to nearest 100,000). Average deal sizes rounded to nearest 100,000. Excludes USD 7.2 billion in capital where instrument type is unknown.Source: Open Capital Research
Impact Tracking StandardsAs is true globally, impact investors’ dual mandate to realize both financial and social or environmental returns requires them to maintain a strong focus on measuring impact as part of their core activities. In addition, many impact asset owners require impact reporting as a condition of their investments. This is particularly true for DFIs, who act as anchor investors in many impact investment funds.
Developing tools to track impact metrics in Southern Africa accurately and effectively has proven difficult, however. Beyond the methodological difficulty in designing measurement systems, tracking metrics can also be expensive and time-consuming overhead for early-stage businesses, potentially diverting resources from enterprise growth. Moreover, impact investors define impact in a wide variety of ways and emphasize different elements, complicating efforts to develop a universal standard or toolbox. However, this limited standardization can benefit portfolio companies, as impact investors are often willing and able to track customized metrics, which allows many more companies to demonstrate and measure their impact.
The majority of interviewed fund managers do not specify a particular language or tool but rather report impact using flexible structures adapted to each new investment. They generally design and track metrics after the investment in an individualized manner in order to minimize the burden placed on portfolio companies. This mirrors findings from studies of the landscape in other regions.

EXECUTIVE SUMMARY • 19
Among those that do specify the use of a known language or tool, IRIS has emerged as the most prominent.11 Some fund managers select their own set of IRIS metrics; others use an existing tool, such as GIIRS,12 which is built on the IRIS taxonomy.
DEMAND AND NEED FOR IMPACT INVESTING CAPITALThere is strong demand for impact capital across Southern Africa. Despite progress on key development indicators and strong markets in the region’s anchor, South Africa, there remain significant gaps in the provision of key goods and services. This creates opportunities for entrepreneurs to build enterprises that meet the needs of disadvantaged populations while also realizing financial returns.
Development ContextWithin Southern Africa, countries vary substantially in their level of development, as illustrated by their scores on the United Nation’s Human Development Index (HDI). Mauritius exceeds the global average HDI score, while Botswana and South Africa are near the global average of 0.69. At the same time, Malawi and Mozambique have HDI scores that are barely above half the global average, driven by poor performance on a variety of indicators related to poverty, health, and education.
TABLE 4. UN HDI SCORE AND RANK BY COUNTRY, 2014
COUNTRY HDI Score HDI Rank
MAURITIUS 0.771 63SOUTH AFRICA 0.683 109BOTSWANA 0.658 118NAMIBIA 0.624 127SWAZILAND 0.561 141ZAMBIA 0.530 148MOZAMBIQUE 0.526 149LESOTHO 0.498 155MADAGASCAR 0.492 156MALAWI 0.486 162ANGOLA 0.414 174ZIMBABWE 0.393 178
11 Information about IRIS, which is managed by the GIIN, is available at https://iris.thegiin.org/.12 The Global Impact Investing Ratings System.
20 • THE LANDSCAPE FOR IMPACT INVESTING IN SOUTHERN AFRICA
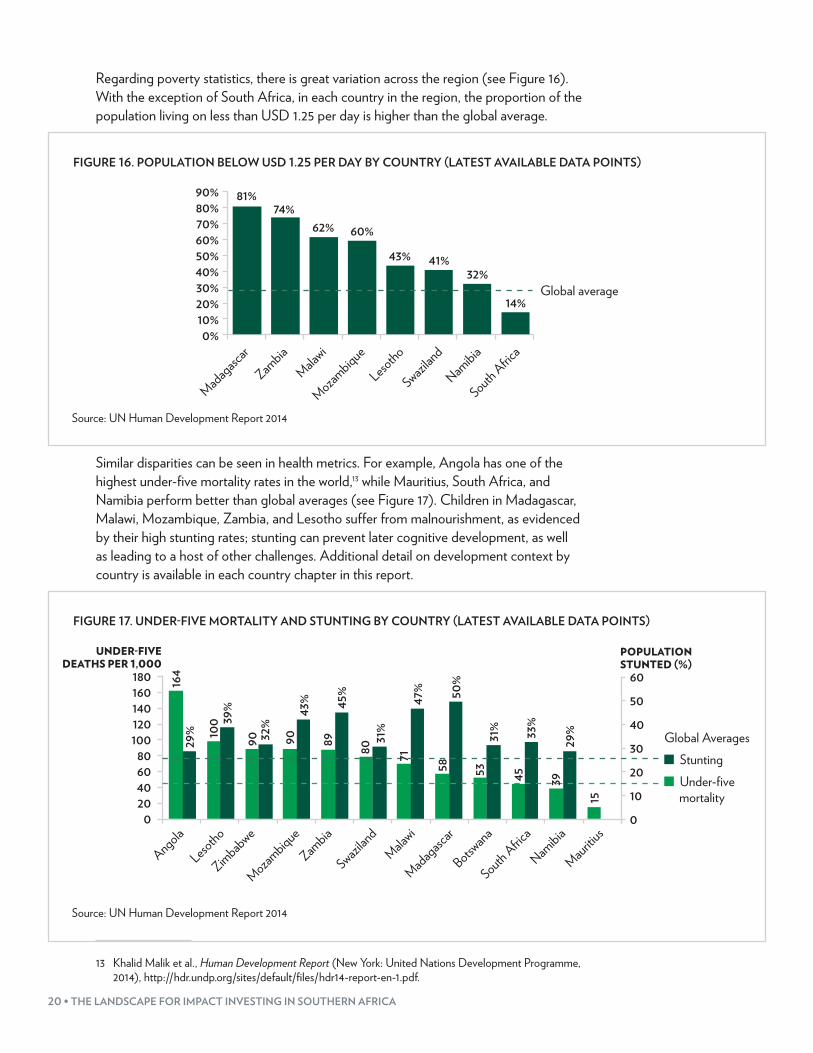
Regarding poverty statistics, there is great variation across the region (see Figure 16). With the exception of South Africa, in each country in the region, the proportion of the population living on less than USD 1.25 per day is higher than the global average.
FIGURE 16. POPULATION BELOW USD 1.25 PER DAY BY COUNTRY (LATEST AVAILABLE DATA POINTS)
Madagascar
Zambia
Malawi
Mozambique
Lesotho
Swazilan
d
Namibia
South Africa
90%80%70%60%50%40%30%20%10%
0%
81%74%
62% 60%
43% 41%32%
14%Global average
Source: UN Human Development Report 2014
Similar disparities can be seen in health metrics. For example, Angola has one of the highest under-five mortality rates in the world,13 while Mauritius, South Africa, and Namibia perform better than global averages (see Figure 17). Children in Madagascar, Malawi, Mozambique, Zambia, and Lesotho suffer from malnourishment, as evidenced by their high stunting rates; stunting can prevent later cognitive development, as well as leading to a host of other challenges. Additional detail on development context by country is available in each country chapter in this report.
FIGURE 17. UNDER-FIVE MORTALITY AND STUNTING BY COUNTRY (LATEST AVAILABLE DATA POINTS)
Global AveragesStuntingUnder-five
mortality
180160140120100
80604020
0
60
50
40
30
20
10
0
164
29% 10
0 39%
90 9032%
89
43%
80
58 53 45
45%
31%
47% 50
%
31% 33
%
UNDER-FIVE DEATHS PER 1,000
POPULATION STUNTED (%)
Malawi
Botswana
Swazilan
d
Lesotho
Namibia
South Africa
Angola
Mozambique
Madagascar
Zambia
Mauritius
Zimbabwe
39
15
29%
71
Source: UN Human Development Report 2014
13 Khalid Malik et al., Human Development Report (New York: United Nations Development Programme, 2014), http://hdr.undp.org/sites/default/files/hdr14-report-en-1.pdf.
EXECUTIVE SUMMARY • 21
CHALLENGES AND OPPORTUNITIES FOR IMPACT INVESTORSDespite the historical volume of deals in Southern Africa, especially South Africa, impact investors face a variety of challenges ranging from insufficient investee capacity to complex government regulations. Challenges include:
• Insufficient investment-ready opportunities: Despite robust activity to date, many impact investors struggle to place the capital they have raised. Though many businesses have exciting potential, investors encounter few companies that are truly investment-ready. Early-stage businesses typically face certain, common challenges that keep them from being fully prepared for growth, including unproven operations, an unclear strategy to scale, informal financial and corporate records, and a lack of realistic forward-looking projections. These challenges affect businesses across sub-Saharan Africa just as much as in Southern Africa.
• Insufficient human capital: Limited access to highly skilled talent is the key constraint for many Southern African businesses. Companies struggle to find the talented, reliable management they need to plan for and reach scale. Though all skilled positions are difficult to fill, this talent shortage is particularly acute for financial professionals with five to 15 years of experience who can serve as a company’s CFO. Even when a talented, experienced professional can be found, she or he often commands high wages that can be challenging for SMEs or social enterprises to support, especially in their early years.
• Limited financing in local currency: Many impact businesses engage with disadvantaged populations, often earning the majority of their revenues in local currencies. However, most impact investors track returns in international hard currencies and have little ability to invest in local currencies. This is especially challenging for investments using long-term debt instruments which require repayment in hard currencies, as these can appreciate five to 10 percent per year relative to local currency. Hedging options are often prohibitively expensive, though some impact investors with large funds report effectively using fund-level hedges to minimize currency risk.
• Limited electrical capacity: Power generation presents an opportunity across the region, as several countries in Southern Africa have historically traded electricity across international borders. Eskom South Africa’s electric utility, generates almost half of the power consumed in all of Africa,14 but still struggles to meet increasing demand, leading South Africa to import electricity from neighbors who have extremely low grid penetration. This in turn limits these neighboring countries’ own investment potential in energy-intensive sectors, such as manufacturing and extractives.
14 Alexandra Wexler, “Power Outages Mar South Africa’s Economic Expansion,” wvw, May 8, 2015, http://www.wsj.com/articles/power-outages-mar-south-africas-economic-expansion-1431077401.

22 • THE LANDSCAPE FOR IMPACT INVESTING IN SOUTHERN AFRICA
Each country in Southern Africa has unique dynamics for impact investing. As a result, impact investors must learn about each country individually; strategies and solutions that are effective in one country will not necessarily work in another. Nevertheless, some high-level recommendations do apply to the region and can improve the overall impact investing landscape:
• Leverage technical assistance (TA) facilities to build the pre-investment pipeline: More pre-investment support for businesses is needed to develop a strong pipeline of investable opportunities. Increasingly, TA funders (e.g., USAID and DFID) recognize the importance of pre-investment support to get companies to the point where they can successfully raise capital. Several impact investors have successfully developed TA facilities for their portfolio companies. South Africa in particular is home to a large ecosystem of intermediaries and service providers. Targeted, tailored support requires an upfront commitment of resources but has proven effective in preparing potential targets for investment and in building high-quality deal flow. This process can also dramatically reduce diligence timelines if the investor is able, before investment, to increase familiarity with and visibility into a business.
• Develop sector specialization: Beyond bringing capital to portfolio companies, impact investors can drive growth, returns, and impact by focusing on the specific sectors in which their portfolio companies operate. For some investors, this sector focus has allowed them to leverage their existing knowledge to identify exciting, less well-known opportunities earlier and to reduce their diligence timelines. Sectors such as agriculture, energy, and financial services present large opportunities where different companies often face similar challenges; learnings can be shared across portfolio companies.
• Expand investment instruments: With the variety of early-stage businesses in Southern Africa, structured investments, such as milestone-based conversion and profit-sharing debt, can help to creatively fill a significant need for financing that straight equity and debt deals cannot. Such creative structures can help entrepreneurs meet their ongoing cash-flow requirements while delivering long-term returns in line with investor expectations.
• Establish local presence: Given the lack of readily available, investment-ready businesses, locally-based impact investors across the region report having a significant advantage in their ability to source investment opportunities.15 Currently, only a handful of impact investors have staff in the region outside of South Africa, and limited impact capital is available there. Locally-based impact investors will be able to identify opportunities more easily and will incur fewer costs than investors operating with a fly-in, fly-out model that may require multiple trips in order to perform due diligence and manage the portfolio.
15 Open Capital interviews.

EXECUTIVE SUMMARY • 23
SECTOR OPPORTUNITIES ACROSS SOUTHERN AFRICAAll Southern African countries share a demand for impact capital, with sizable populations well below global averages for human development despite recent economic growth. As such, investors will find many opportunities to support entrepreneurs who will generate both financial and social/environmental returns. The following sectors present particularly notable opportunities in Southern Africa.
• Agro-processing: Throughout Southern Africa, agriculture employs most of the population. Investment in this sector is important to increase incomes and improve food security. Given the predominance of smallholder farming, there are opportunities to aggregate production and create consistent, high-quality supply appropriate for processing. In addition, there are opportunities across a range of crops and agricultural sub-sectors, such as horticulture, livestock, and dairy, to connect directly with export markets.
• Energy and electricity: All countries in Southern Africa are looking to expand their power generation capacity in the coming decades, backed by strong government support. This opens the door to large-scale projects and creates the potential for improved power-purchase agreements and cross-border trade. At the same time, large segments of the population lack reliable access to grid power, especially outside of South Africa, which presents opportunities for micro-grid and off-grid solutions.
• Supply chain integration: Southern Africa has a number of large industrial value chains primarily destined for export, particularly in the extractives sector. The multinational companies operating these sites create demand for infrastructure, goods, and ancillary support services, which in turn creates new offtake opportunities for local, small businesses across sectors. In particular, interviewees highlighted opportunities in certain key areas: workforce education, housing, healthcare, and transportation.
• Tourism: Given the variety of attractions available in Southern Africa, from beautiful coasts to vibrant safari parks, there is great potential for tourism outside traditional destinations in South Africa. Governments across the region have started to encourage foreign investors and the returning diaspora to invest in the tourism sector, with some promising results. There are particularly opportunities in sustainable or eco-tourism, sectors which often directly support underserved populations and benefit the environment in Southern Africa.
• Education: Across the region, the demand for private provision of education has increased. A number of private schools have emerged to serve the region that offer high-quality but expensive educations, especially in South Africa. Interviewees expect that the market for these high-end educational opportunities will remain open, but they also pointed out that there are opportunities to establish mid-level and low-income private educational alternatives, as well.

24 • THE LANDSCAPE FOR IMPACT INVESTING IN SOUTHERN AFRICA
• Consumer goods: The middle class is growing throughout the region, creating opportunities to produce consumer goods locally to target this growing market segment, which currently relies on imports from South Africa. Local production generates employment and broadens the range of products and services available to consumers, which may meet the impact theses of some impact investors.
• Aquaculture: Several coastal countries in the region have abundant access to reef and water resources, creating an opportunity to cultivate ornamental fish destined for export. Opportunities in this sector also include fishing for local and international consumption. In countries like Malawi, interviewees mentioned fishing as one of the most attractive targets for impact investment, though potential away from major bodies of water is limited.
FIGURE 18. SECTOR OPPORTUNITIES BY COUNTRY
Agro-processing
Energy
Supply chain integration
Tourism
Education
Consumer goods
Aquaculture
South Africa
Zambia
Mozambique
Malawi
Madagascar
Zimbabwe
Limited OpportunityMedium OpportunityStrong Opportunity
Source: Open Capital Research, interviews

EXECUTIVE SUMMARY • 25
RECOMMENDATIONS FOR FUTURE STUDYThis report presents the most comprehensive study to date of impact investments in Southern Africa, building from other work on the landscape completed in South Asia, East Africa, and West Africa. However, this series of reports raises several additional questions for future study, as follows.
What types of support effectively prepare businesses for investment? Several organizations in Southern Africa provide pre-investment and post-investment support. What types of support are most effective in developing investment-ready and scalable businesses? How does the effectiveness of these services vary by stage of company lifecycle? What role can mentorship, business acceleration, classroom lectures, tailored business support, market linkages, and other services play in helping businesses attract the capital they require to grow?
How can social enterprises and impact investors attract, build, and retain top talent? Talent is one of the most frequently cited challenges across Southern Africa. What can the social enterprise sector learn from top corporations about attracting, building, and retaining talent at all levels? What monetary and non-monetary compensation is expected by top talent who are considering a career path in Southern Africa? How can social enterprises and impact investors leverage non-monetary compensation to compete with top international firms and donor organizations for talent?
What viable exit mechanisms can impact investors consider in Southern Africa? How can impact investors identify exit strategies in the region, including methods to ensure that impact potential is not lost after an exit? How could a secondary market improve deal flow and incorporate learnings from prior attempts to create impact exchanges, establish dedicated secondary markets, and execute strategic acquisitions? How can social enterprises access the developed secondary markets in South Africa, in particular?

26 • THE LANDSCAPE FOR IMPACT INVESTING IN SOUTHERN AFRICA
APPENDIX: ORGANIZATIONS INTERVIEWED FOR THIS REPORTWe extend our sincerest thanks to the following organizations, who contributed their time and expertise for this report:
Adenia CapitalAga Khan Development NetworkAfrica AssetsAfrica Development BankAgDevCoAgribusiness Incubation TrustANDE (The Aspen Network of Development Entrepreneurs)Anonymous (5)AshokaAtlantic Asset ManagementAurik Investment HoldingsAwethu ProjectBanco Nacional de Investimento (BNI Mozambique)Barclays Bank ZambiaBattery World GroupBertha Centre for Social Innovation and EntrepreneurshipBongo HiveBushproofBusiness Consult AfricaBusiness Partners InternationalCactus AdvisorsCadizClifftop ColonyDelegation of the European Union in MalawiDelegation of the European Union to the Republic of Zambia and COMESAEconomic Development Board of Madagascar
Edge GrowthEngineers Without BordersEuropean Investment BankFintracGlobal Environment FundGrain Traders Association of ZimbabweGreater Good South AfricaGroFinIdea LabImpacto CapitalInternational Development Corporation (IDC)International Finance Corporation (IFC)International Monetary Fund (IMF)Imani DevelopmentInvestisseurs & Partenaires (I&P)Investment Promotion Centre (CPI Mozambique)Java FoodsKatundaKukula CapitalLafazaLeapfrog InvestmentsLynton Edwards StockbrokersMalawi Investment and Trade CentreMalawi MangoesmHub MalawiMsasa CapitalMusika
National Empowerment FundNorthern FarmsOne Thousand and One VoicesPangaea SecuritiesPrivate Enterprise Programme—ZambiaRemoggoScaling Up Nutrition Business NetworkSecuricoSimanyeSME Association of ZimbabweStrong EagleSurrey GroupTakura CapitalTechnoServeTechzimTukula FarmsUnited Nations Development Programme (UNDP)USAID Southern AfricaWorld BankYombwe InvestmentsZambia Association of ManufacturersZambia Chamber of Small and Medium Business AssociationsZambia Development AgencyZimbabwe Investment AuthorityZimbabwe National Chamber of Commerce

EXECUTIVE SUMMARY • 27

28 • THE LANDSCAPE FOR IMPACT INVESTING IN SOUTHERN AFRICA
ABOUT THE GLOBAL IMPACT INVESTING NETWORK
The Global Impact Investing Network (GIIN®) is a nonprofit organization dedicated to increasing the scale and effectiveness of impact investing. The GIIN builds critical infrastructure and supports activities, education, and research that help accelerate the development of a coherent impact investing industry. For more information, see www.thegiin.org.
30 Broad Street, 38th Floor, New York, NY 10004 USA +1.646.837.7430 | [email protected] | www.thegiin.org