the journal of financial perspectives · the ey global financial services institute brings together...
TRANSCRIPT
The Journal of
FinancialPerspectivesEY Global Financial Services Institute July 2014 | Volume 2 – Issue 2
Article: Japanese patent index and stock performance
The EY Global Financial Services Institute brings together world-renowned thought leaders and practitioners from top-tier academic institutions, global financial services firms, public policy organizations and regulators to develop solutions to the most pertinentissues facing the financial services industry.
The Journal of Financial Perspectives aims to become the medium of choice for senior financial services executives from banking and capital markets, wealth and asset management and insurance, as well as academics and policymakers who wish to keep abreast of the latest ideas from some of the world’s foremost thought leadersin financial services. To achieve this objective, a board comprising leading academic scholars and respected financial executives has been established to solicit articlesthat not only make genuine contributions to the most important topics, but are also practical in their focus. The Journal will be published three times a year.
gfsi.ey.com
The articles, information and reports (the articles) contained within The Journal are generic and represent the views and opinions of their authors. The articles produced by authors external to EY do not necessarily represent the views or opinions of EYGM Limited nor any other member of the global EY organization. The articles produced by EY contain general commentary and do not contain tailored specific advice and should not be regarded as comprehensive or sufficient for making decisions, nor should be used in place of professional advice. Accordingly, neither EYGM Limited nor any other member of the global EY organization accepts responsibility for loss arising from any action taken or not taken by those receiving The Journal.

EditorialEditor
Shahin ShojaiEY LLP
Advisory Editors
Dai BedfordEY LLP
Ratan EngineerEY LLP
Shaun CrawfordEY LLP
David GittlesonEY LLP
Carmine DiSibioEY LLP
Bill SchlichEY LLP
Special Advisory Editors
Ben GolubBlackrock
Antony M. SantomeroThe Wharton School
Anthony NeohBank of China
Nick SilitchPrudential Financial
Steve PerryVisa Europe
Editorial Board
Viral V. AcharyaNew York University
Deborah J. LucasMassachusetts Institute of Technology
John ArmourUniversity of Oxford
Massimo MassaINSEAD
Tom BakerUniversity of Pennsylvania Law School
Patricia A. McCoyUniversity of Connecticut School of Law
Philip BoothCass Business School and IEA
Tim MorrisUniversity of Oxford
José Manuel CampaIESE Business School
John M. MulveyPrinceton University
Kalok ChanHong Kong University of Science and Technology
Richard D. PhillipsGeorgia State University
J. David CumminsTemple University
Patrice PoncetESSEC Business School
Allen FerrellHarvard Law School
Michael R. PowersTsinghua University
Thierry FoucaultHEC Paris
Andreas RichterLudwig-Maximilians-Universitaet
Roland FüssUniversity of St. Gallen
Philip RawlingsQueen Mary, University of London
Giampaolo GabbiSDA Bocconi
Roberta RomanoYale Law School
Boris GroysbergHarvard Business School
Hato SchmeiserUniversity of St. Gallen
Scott E. HarringtonThe Wharton School
Peter SwanUniversity of New South Wales
Paul M. HealyHarvard Business School
Paola Musile TanziSDA Bocconi
Jun-Koo KangNanyang Business School
Marno VerbeekErasmus University
Takao KobayashiAoyama Gakuin University
Ingo WalterNew York University
Howard KunreutherThe Wharton School
Bernard YeungNational University of Singapore

Read full article
Executive summary
Japanese patent index and stock performanceby Takao Kobayashi, Professor of Finance, Aoyama Gakuin University, Yasuhiro Iwanaga,Aoyama Gakuin University & Sumitomo-Mitsui Trust Bank, Limited and Hideaki Kudoh,Nomura Asset Management Co., Ltd.
In the global economy, high technology serves as a source of competitive advantagefor Japanese companies. In Japan, there is a patent value indicator which is uniqueamong other patent value indicators developed in the U.S. The uniqueness lies in itsfocus on measuring the exclusivity and technological competitiveness of each patentusing data based on the number of actions taken by third parties against the patent.The construction of such a patent value metric became possible thanks to the JapaneseGovernment’s active disclosure of information on patent attacks. This paper is ourfirst attempt to study the relationship between technological competence and firmperformance using this technology indicator.
AbstractIn the global economy, high technology serves as a source of competitive advantagefor Japanese companies. In Japan, there is a patent value indicator which is uniqueamong other patent value indicators developed in the U.S. The uniqueness lies in itsfocus on measuring the exclusivity and technological competitiveness of each patentusing data based on the number of actions taken by third parties against the patent.The construction of such a patent value metric became possible thanks to the Japanese Government’s active disclosure of information on patent attacks. This paper is our first attempt to study the relationship between technological competence and firm performance using this technology indicator. In particular, we demonstrate how thistechnology indicator may be used to forecast company stock performance. We constructlong/short strategies based on (1) the patent indicator, (2) R&D expenditure and (3)a combination of the two. The third strategy was the best performer. Combining R&Dexpenditure, which is readily available in financial statements, with the patent indicatorenhanced portfolio expected return and reduced risk considerably. The best-performingstrategy generated an annual mean return of 11.50%, standard deviation of 9.25%, anda Sharpe ratio of 1.23. The return is not attributable to the Fama–French three factors.Technology indicators should not work in some industry groups, hence, the result is evenmore striking given that the portfolio was constructed with a universe of stocks coveringall industry groups except financials.
Japanese patent index and stock performanceTakao KobayashiProfessor of Finance, Aoyama Gakuin UniversityYasuhiro IwanagaAoyama Gakuin University & Sumitomo-Mitsui Trust Bank, LimitedHideaki KudohNomura Asset Management Co., Ltd.
1. IntroductionAs the industrial economy has been supplanted by the knowledge economy, intellectual property (IP) assets, such as patents, trademarks and copyrights, are gaining growing importance in corporate value creation. In the global economy, high technology serves as a source of competitiveness for Japanese companies. In particular, Japanese companies account for at least 20% of all international patent applications in the world and produce innovative products using patented technology as leverage. In the 2012–2013 edition of the Global Competitiveness Report of the World Economic Forum, Japan is ranked second (next to Switzerland) in the “innovation and sophistication” factor of global competitiveness.1
Our basic interest is to find out whether the accumulation of these IP assets is sufficiently incorporated in the stock market’s pricing of firms. If they are, information about companies’ R&D activities and/or the level of patent accumulation would not provide arbitrage opportunities. If, on the contrary, the information predicts future stock returns and serves as a useful signal for screening companies, the investment community needsan easily accessible source of information on the value of each firm’s IP assets. Not only does it satisfy the investors’ appetite for higher returns, but also promotes the efficiency of the stock market. The latter means that a firm with highly valuable IP assets would be able to raise equity capital at a lower cost. In Japan there is a patent value indicator, which is unique among other patent value indicators developed in the U.S. In this paper, our focus is mainly on this patent value index.
Thomas (2001) used a quantitative measure of patent assets based on the citation frequency. The index is available via an online service called TechLine and provided by Chi Research Inc. He showed that there is a strong relationship between this indexand stock market valuation. He further showed that by fitting a model to this relationship, underpriced stocks relative to the model price tend to perform excellently and overpriced stock perform poorly in the subsequent period. Cardoza et al. (2008) used another measure called PatentRatings, which is provided by Ocean Tomo. This index includes a number of qualitative measures for a patent, which they call the patent’s “economic value.”
1 The other factors are “basic requirements” and “efficiency enhancers.”
Japanese patent index and stock performance
They constructed a portfolio of 300 stocks selected based on this patent index and used it as a benchmark performance index of the technology sector of the U.S. economy. They showed that this portfolio outperforms the S&P500 Index.
R&D expenditure carries information on R&D intensity. This information is readily available in financial statements. Consequently, researches on the relationship between intangible IP assets and stock market performance started with a focus on R&D expenditure. The empirical results in this area are mixed. Titman et al. (2004) found that intensiveness in physical investment has a negative relationship with stock returns. The literature calls it the “investment paradox.” These authors measure investment intensity by physical investment relative to the amount of tangible assets. Li and Liu (2010) showed that the relationship between R&D intensity and stock return is similar. Namely, when R&D intensity is measured by R&D investment-to-intangible asset ratio, R&D intensity has a negative relationship with stock returns. In contrast, Chan et al. (2001) showed that R&D-intensive firms earn higher returns. Their measure of R&D intensity used market capitalization as the scale. Lev and Sougiannis (1996, 1999) and Chambers et al. (2002) obtained similar results. In addition, Jung (2005) reported that R&D-intensive companies generate exceptionally high positive returns in Japan.
We will examine the relationship between the value of patents (YK) and R&D expenditure to future stock performance. In so doing, our objective is to distinguish between R&D efficiency (or, R&D productivity) and R&D intensity, with the conjecture that they carry disparate sets of information about IP assets. We measure “R&D efficiency” by the ratio of YK value to R&D expenditure. We measure “R&D intensity” by the ratio of R&D expenditure to market capitalization. We will show that both measures have independent predictability for future stock returns. We further show that combining these two measures significantly enhances investment performance.
The rest of the paper is organized as follows: section 2 illustrates how the YK value is constructed. We also report some descriptive statistics of the YK value. In section 3, we investigate the relationship between IP signals and stock returns in a portfolio context. We construct portfolios of stocks using a different set of IP signals and compare the performance of portfolios. In 3.1, we describe the data sources. In 3.2, we use the YK
Japanese patent index and stock performance
value scaled by market capitalization as the screening variable. In 3.3, we use YK value scaled by R&D expenditure (i.e., R&D efficiency), and independently, R&D expenditure scaled by market capitalization (i.e., R&D intensity). In 3.4, we combine YK value and R&D expenditure to make two-dimensional sorts of stocks. In 3.5, we compare results of our portfolio strategies, and in 3.6, we report the industry groups in which our strategy works well and the industry groups in which it works poorly. Section 4 summarizes the paper.
2. The YK valueIn recent years, there have been many attempts to measure the value of patents. Chi Research Inc.’s TechLine [see Thomas (2001)] and Ocean Tomo’s Patent Ratings [see Cardoza et al. (2008)] represent two of them.
TechLine’s measure is based on the following patent indicators:1. Number of patents held by a company2. Growth in the number of patents held by a company3. Current impact index: the number of citations a company’s patents receive within other
parties’ patents issued in the most recent year4. Scientific linkage: the number of references to scientific papers that a company’s
patents makes5. Technology cycle time: the median age of patents that a company lists on the front
page of the company’s patent report
These are all quantitative measures that count the number of patents, number of citations, the age (obsolescence) of patents and so on. In addition to these indicators, Ocean Tomo’sPatentRatings includes a qualitative measure, which they call the IPQ Score. Patent owners must pay periodic fees to maintain their patents in force. By analyzing patent maintenance data, Ocean Tomo constructs a score that predicts the probability that a patent will be maintained or abandoned. They regard this score as a measure of the economic value of each patent.
Japanese patent index and stock performance
The YK value that we use in this paper is derived from the model developed by Kudo & Associates,2 a leading intellectual property (IP) law firm in Japan. It is based on a qualitative value score that is assigned to each patent. The YK value of a company is the sum of the YK values of all patents that a company has in force.
The uniqueness of the YK value lies in its focus on measuring the exclusivity and technological competitiveness of each patent using data based on actions taken against the patent in the Japan Patent Office (JPO). If another party takes legal action againsta patent, it is viewed as proof that the patent is perceived as a threat by the firm’s competitors. The greater the severity of the legal action, the greater the score given to the value of the patent.
When an invention is submitted for patent registration, the JPO releases a “Publication of unexamined application” to the general public. At this stage, some companies that seek to prevent the approval of the patent can submit an “Offer of information” to provide evidential documents to the JPO. When the application is under JPO’s examination, a party that believes its own patent, or that of a third party’s, is being infringed can submit “Request for inspection” in the earlier stages, or “Objection” in the latter stages, of examination. After the JPO has made a “Decision of grant,” a request of “Invalidation trial” can be made. These actions are given scores. Actions taken in the latter stages are allocated higher scores. The score also takes accounts of the number of parties taking action.
The YK value of the individual patent n at time t is defined by (formula 1), where i denotes an individual action, Pi is the score given to action i, Ni is the number of parties who took action i, and ci is a decay factor reflecting the speed with which its patents are expected to lose value or be replaced by superseding technologies. About 80% of patent abolishment is due to unpaid patent maintenance fees and the rest is due to the legal termination of the patent right (20 years). Very few patents are abandoned during the first 4 years, and on average they are abandoned 13 to 19 years after the date they were granted. The decay factor is computed by fitting a probabilistic model of technology obsolescence to the data on patent abandonment and termination.
Japanese patent index and stock performance
2 The other factors are “basic requirements” and “efficiency enhancers.”
The YK value of a company at time t is the sum of . The data has been created by Kudo & Associates on a monthly basis since January 1988, and it covers all listed firms in Japan. Information about third-party actions is available from a publication by the National Center for Industrial Property Information and Training. The public release of detailed information about third-party actions against patents is peculiar to Japan. Hence, the availability of the YK value adds uniqueness to the current research.
3. Returns to IP-driven strategiesIf all the information about companies’ IP competitiveness is fully reflected in stock prices, YK value would not provide any profitable opportunities for equity investors. The purpose of our analysis is to examine whether this is true. We demonstrate that the YK valueprovides quite a useful signaling mechanism for screening stocks when constructing highly performing equity portfolios.
3.1 Data sourcesWe include in our study all firms listed in the first section of the Tokyo Stock Exchange (TSE) except banks, securities companies, insurance companies, and other financials. Stock prices and returns are from QUICK-Astra and accounting data are from theNikkei Economic Electronic Databank System (NEEDS).3 The YK value was provided by Kudo & Associates.4 We computed the Fama–French three factors for all the stocks in our study using the method proposed by Kubota and Takehara (2007). The sampleperiod is between September 2002 and December 2012.
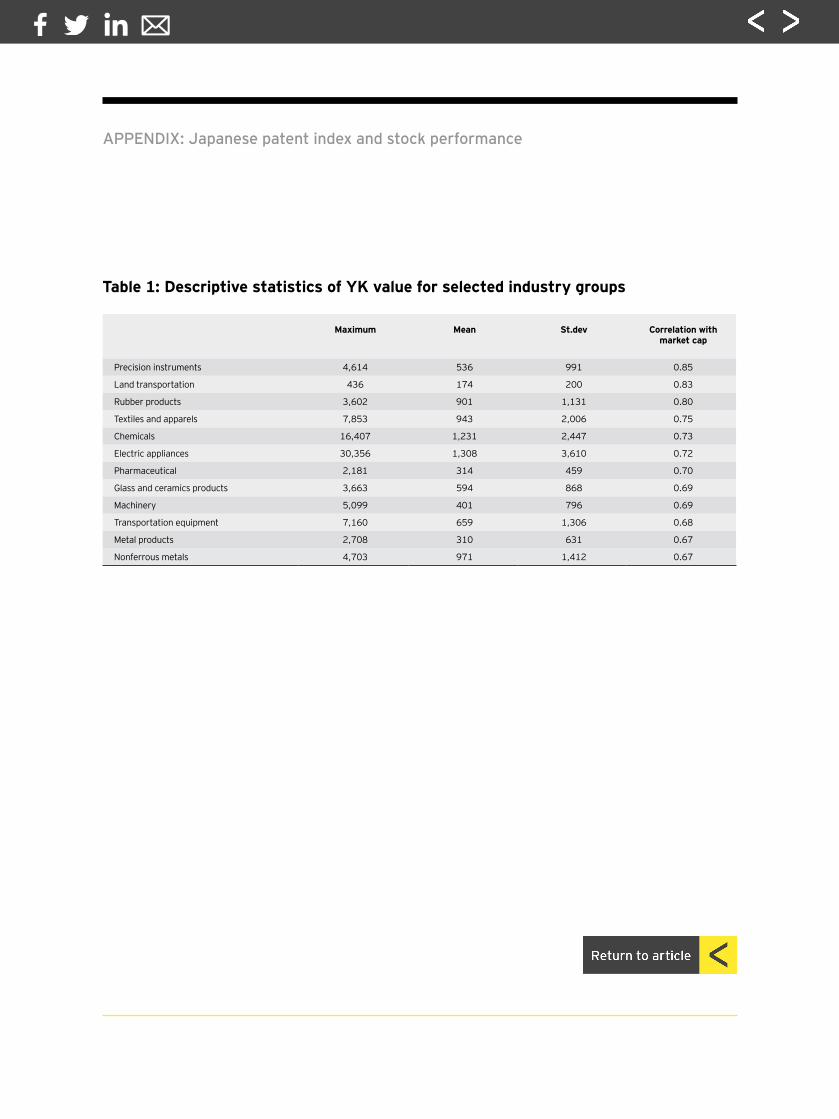
3.2 The default portfolios selected by YK/MEFigure 1 shows the relationship between the YK value and market capitalization (later denoted by ME, shorthand for market equity) for firms in the electric appliances industry. The x and y axes are both in logarithmic scale. The correlation coefficient is 0.72.Table 1 shows the correlation coefficient between these two variables for industries within the 33 TSE industry classifications where the correlation coefficient is larger than 0.6.
3 We thank Quick Corp. for providing data on monthly stock returns for this research.4 We thank Mr. Ichiro Kudo of Kudo & Associates for enabling us to access the YK value database for this
research.
Japanese patent index and stock performance
In Table 1, we also report the mean, the maximum value, and the crosssectional standard deviation of the YK value in these industries. 5 As evident, the correlation is very high: larger firms tend to have larger YK values. This suggests that YK values should not be usedas a stand-alone measure for selecting stocks. We chose to scale the YK value by market capitalization (YK/ME)6. Since it makes little sense to compare the patent competitiveness of a chemical company with that of an auto manufacturer, stocks’ YK/MEcomparisons were undertaken within each industry.
At the end of each month, stocks are separated into quintiles based on YK/ME and equal-weight portfolios are formed in each quintile. We select stocks from each of the 33 TSE industry classifications. Portfolio 1 is the portfolio of stocks from the highest YK/MEquintile of each industry and portfolio 5 is the portfolio of stocks from the lowest YK/ME quintile of each industry.
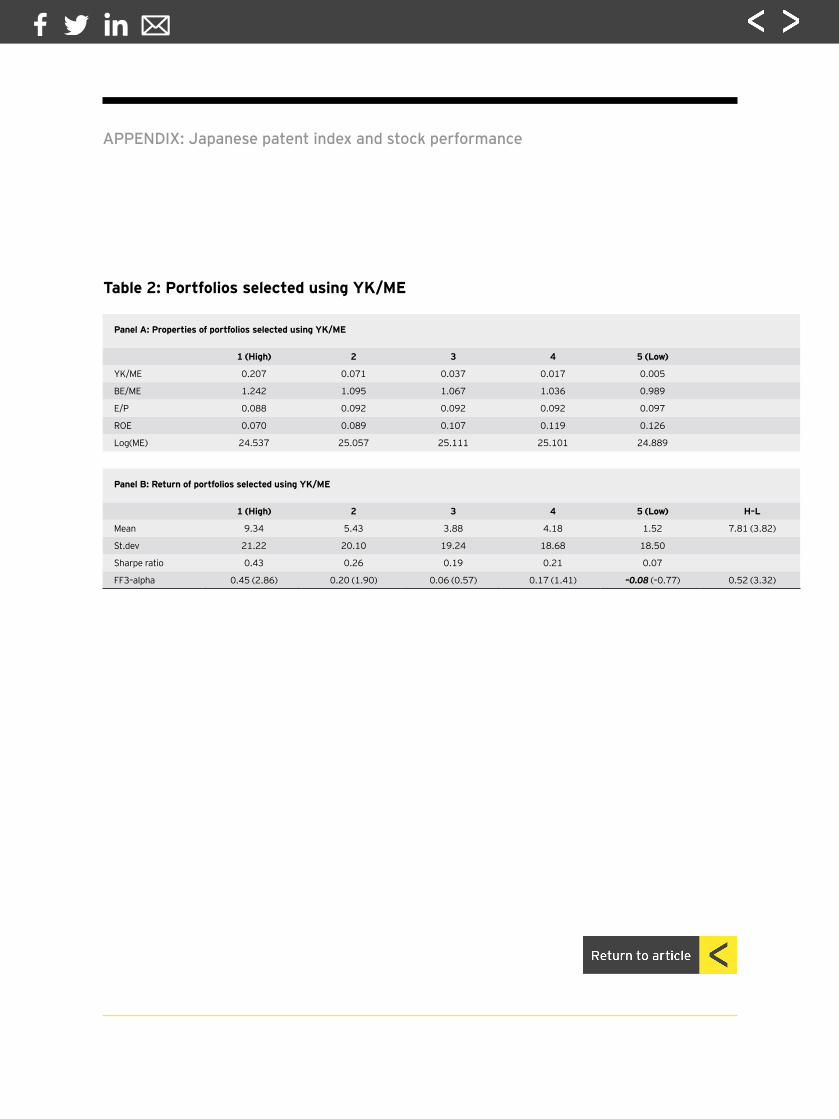
Panel A of Table 2 presents the properties of the quintile portfolios. BE/ME is book-to-market (the ratio of book value of equity to market value of equity), E/P is the earnings yield (the ratio of earnings per share to stock price), ROE is return on equity (the ratio of net income to book value of equity), and log(ME) is the log of market value of equity measuring the size of the firm with ME denominated in yen.
One can see some “value-tilt” for higher YK/ME portfolios. Bookto- market is higher and ROE is lower for higher YK/ME portfolios, and these relationships are monotone. This should be a little surprising as growth firms, rather than value firms, tend to spendmore on R&D activities. We will scrutinize this observation later by segregating the effects of YK/ME into R&D efficiency and R&D intensity.
Panel B reports the portfolio performance. Mean return is the time-series average of the annualized portfolio returns in percent. St.dev is the annualized standard deviation of the returns. Sharpe ratio is the mean excess return (over the risk-free rate) per unit
5 The minimum value is zero for most industries. 6 We tested other measures of size, such as book value of assets, book value of equity, and sales as the
scaling variable. Market capitalization was best among these variables.
Japanese patent index and stock performance
risk (measured by the standard deviation), which is a standard risk-adjusted measure of performance. We use the one-month T-bill rate for the risk-free rate. The column “H-L” refers to the return of a hedge portfolio, which is long in portfolio 1 and short in portfolio 5.
The highest YK/ME portfolio generates a mean return of 9.34% annually, while the lowest YK/ME portfolio generates 1.52%. Consequently, the mean return on the H-L portfolio is 7.81% annually. It has a t-statistic of 3.82, which shows that the mean return of the H-L portfolio is significantly positive. The standard deviation of return is higher for higher YK/ME quintiles. The monotonicity of the Sharpe ratio indicates that higher YK/ME quintile portfolios yield higher risk-adjusted returns.
For each quintile portfolio and the H-L portfolio, we run a timeseries regression of monthly excess return to the Fama–French three factors: R r MKT SMB HMLi,t f,t i i,MKT t i,SMB t i,HML t i,t- = + + + +a b b b fR r MKT SMB HMLi,t f,t i i,MKT t i,SMB t i,HML t i,t- = + + + +a b b b f
(formula 3), where, for each month t, Ri,t is the return of portfolio i, rf,t is the risk-free rate, MKTt is the excess return of the market portfolio, SMBt is the Fama–French size factor (the return to being long in small ME stocks and short in big ME stocks), and HMLt is the Fama–French value factor (the return to being long in high BE/ME stocks and short in low BE/ME stocks). We created the Fama–French three factors for the Japanese stock market following the procedure proposed by Kubota and Takehara (2007).7 The row labeled “FF3-alpha” reports the estimate of the intercept term ai and its t-statistics (in parentheses). If any portfolio has a significantly positive ai, it means that the portfolio has additional risk-adjusted performance relative to its risk exposure to the Fama–French three factors.
7 The MKT factor was computed using (1) the cum-dividend monthly return series of TOPIX for the market return and (2) the one-month T-bill rate for the risk-free rate. The risk-free rate is 0.2 percent during our period of study, reflecting the fact that most of the years were under the “zero interest rate policy regime” by Bank of Japan. TOPIX is the market index for the first section of the TSE. Accordingly, we computed the SMB and HML factors on the same universe of stocks. The selection of stocks for each portfolio was done annually, at the end of August. Small, big, high and low portfolios were value-weighted portfolios in which weighting was based on the number of “free-float” shares (shares available for trading).
Japanese patent index and stock performance
The FF3-alphas of the highest YK/ME portfolio and the H-L portfolio have t-statistics of 2.86 and 3.32, respectively. Hence, we can conclude that these two portfolios generate additional risk-adjusted returns. This result confirms that YK/ME serves as a useful signal for equity investment.
3.3 Portfolios selected using R&D efficiency and R&D intensityChan et al. (2001) showed that R&D expenditure, which is readily available in financial statements, has some predictive powers for future stock returns. Specifically, highly R&D-intensive firms earn higher returns when R&D intensity is measured relative to the market value of equity, R&D/ME. Since YK value and R&D expenditure are obtained from very different sources, combining them may strengthen our results.
A variable that complements R&D intensity is the productivity of R&D activities, which we call R&D efficiency. Noting that YK/ME can be decomposed to become: YK/ME = (YK/R&D) × (R&D/ME) (formula 4), we will regard the first term, YK/R&D, as a measureof R&D efficiency.
Using these variables, we now investigate how the R&D efficiency measure, YK/R&D, and the R&D intensity measure, R&D/ME, workindependently in selecting stocks for portfolios. As in the previous case, selection is undertaken for each industry.
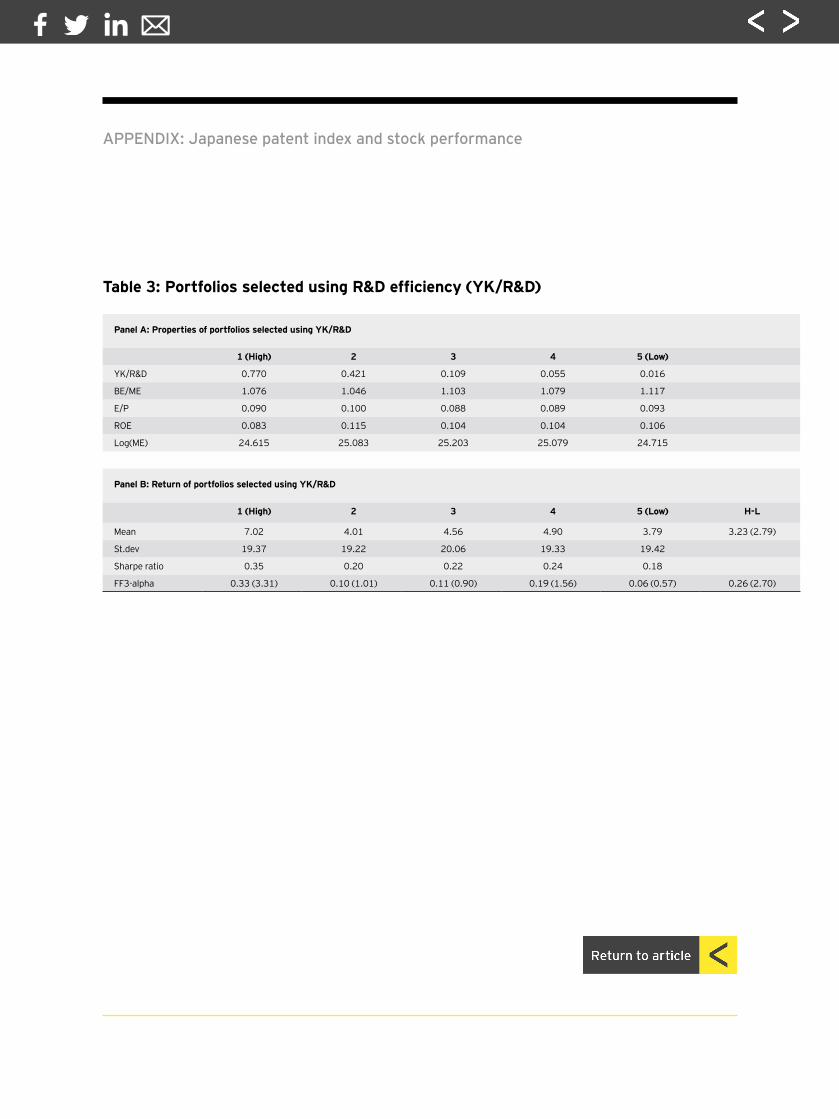
We start with YK/R&D. We repeat the same process as in Table 2 except that the R&D efficiency, YK/R&D, is used for the screening signal. The results are reported in Table 3. As can be seen from Panel A, there is no discernable difference across the YK/R&Dselected quintile portfolios in terms of book-to-market, earnings yield, ROE, and size. Panel B reports the portfolio performance. The highest YK/R&D portfolio generates a mean return of 7.02% annually, while the lowest generates 3.79%. Consequently, the mean return on the H-L portfolio is 3.23% annually. It has a t-statistic of 2.79, which shows that the mean return is significantly positive. The standard deviation of returns is almost identical across the quintile portfolios. The Sharpe ratio shows that higher YK/ME quintile portfolios yield higher risk-adjusted returns, but the relationship is not monotone.
Japanese patent index and stock performance
The FF3-alphas of the highest YK/R&D portfolio and the H-L portfolio have t-statistics of 3.31 and 2.70, respectively. Hence, we can conclude that these two portfolios generate additional risk-adjusted returns. This results confirm that R&D efficiency provides a useful signal for equity investment.
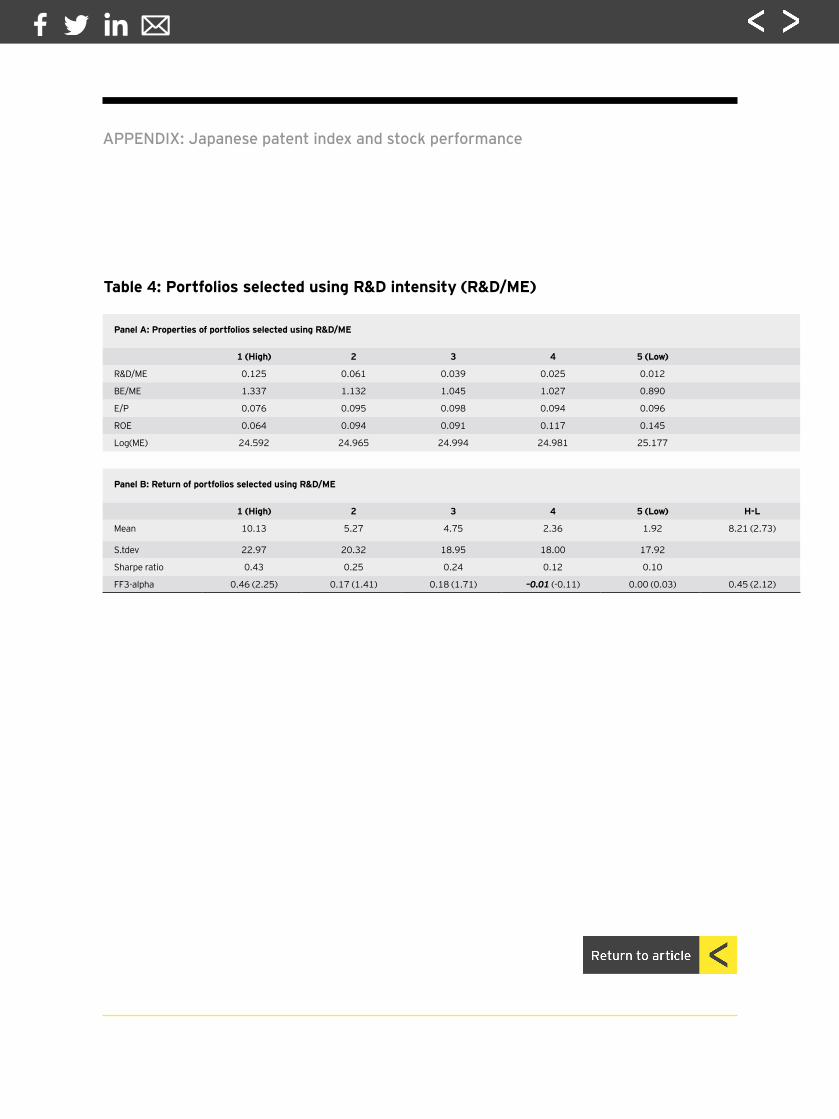
We repeat the same process except that the R&D intensity, R&D/ ME, is used for the screening signal. The results are reported in Table 4. Panel A shows a certain degree of “value-tilt” for higher R&D/ME portfolios. Book-to-market is higher and ROE is lower for higher R&D/ME portfolios; and these relationships are mostly monotone. We observed this value-tilt for portfolios selected by YK/ME in Table 2. The bottom row shows that log(ME) is smallest for the highest R&D/ME portfolio. In Japan, most of the value firms are smaller in size. Since we measure R&D intensity in terms of R&D expenditure per market capitalization, the highest R&D/ME portfolio may have a majority of value firms.
Panel B reports the portfolio performance. The highest R&D/ME portfolio generates a mean return of 10.13% annually, while the lowest generates 1.92%. Consequently, the mean return on the H-L portfolio is 8.21% annually. It has a t-statistic of 2.73, whichshows that the mean return of the H-L portfolio is significantly positive. Unlike Panel B of Table 3, the mean return increases monotonically for higher R&D/ME quintiles. On the other hand, the standard deviation of returns is also higher for higher R&D/ ME quintiles. The Sharpe ratio shows that higher R&D/ME quintile portfolios yield higher risk-adjusted return. FF3-alphas of the highest R&D/ME portfolio and the H-L portfolio have t-statisticsof 2.25 and 2.12, respectively. We can, therefore, conclude that these two portfolios generate returns in excess of what can be expected by their exposures to the three risk factors of Fama and French. This result confirms that R&D intensity also provides auseful signal for equity investment.
3.4 Two-dimensional selectionWe now scrutinize the result of Table 3 that the mean returns and alphas are higher for stocks with high R&D efficiency. We first sort stocks into quintiles based on their R&D intensity. We then sort stocks into quintiles based on their R&D efficiency and average across the R&D-intensity quintiles. This way we make sure that in each of the five
Japanese patent index and stock performance
YK/R&D-selected portfolios stocks are spread evenly over R&D intensity. We call these five portfolios “YK/R&Dselected portfolios controlling for R&D intensity.”
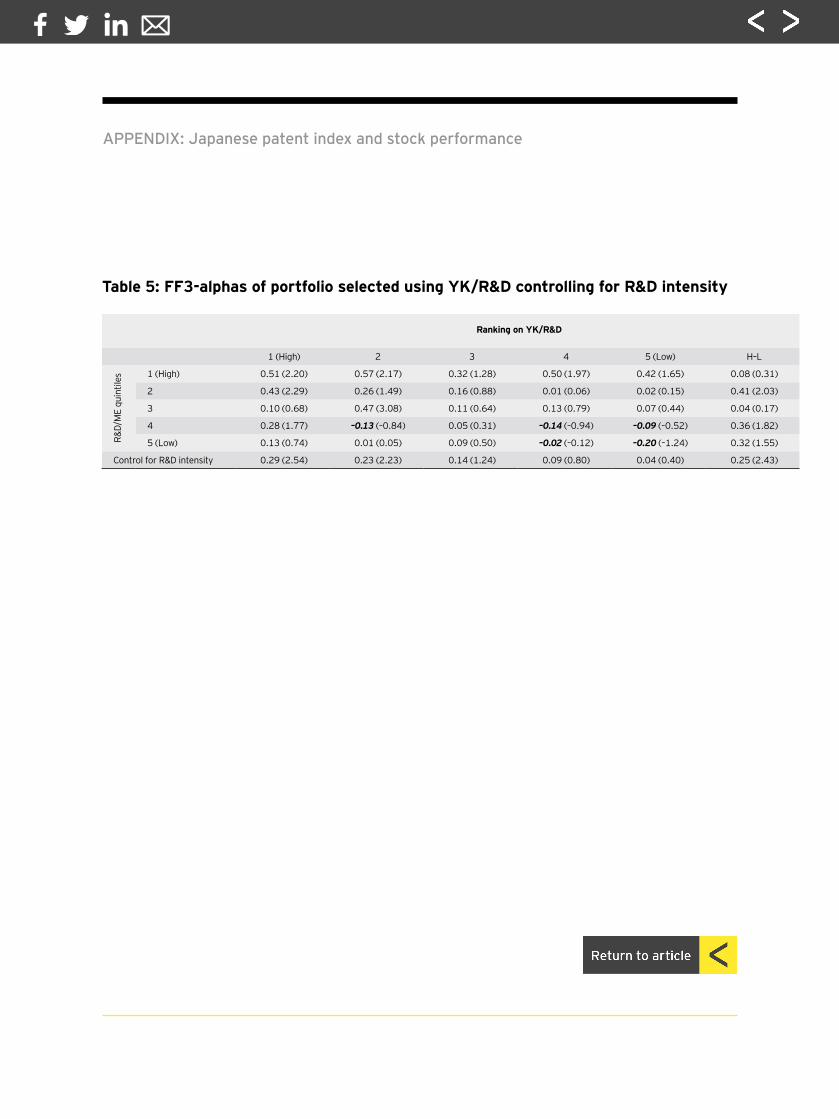
At the end of each month, stocks are allocated into quintiles based on R&D/ME. Then, within each R&D/ME quintile, we separate stocks into five subgroups based on YK/R&D. This way we create 25 groups of stocks each month and in each group we form an equal-weight portfolio. As before, we do the grouping of stocks within each of the 33 TSE industry classifications. The results are reported in Table 5. Column “H-L” refers to the return of a hedge portfolio that is long portfolio 1 and short portfolio 5 for each R&D/ME quintile.
For each of the 30 monthly time series of portfolio excess returns (for the 5×5 portfolios and the 5 H-L por tfolios), we run a regression to the three Fama–French factors. The tablereports the estimate of the intercept term ai and its t-statistics (in parentheses).
In each R&D/ME quartile, the alpha is higher for higher YK/ R&D portfolios, although there are some exceptions. As we conjectured, among firms with similar R&D intensity, firms with higher R&D efficiency generate higher alphas. The rightmost column shows that the FF3-alpha of all H-L portfolios are positive, although some of the t-statistics are not large enough to endorse statistical significance. The FF3-alpha is highest with 0.51 (t-statistic of 2.20) for the highest YK/R&D portfolio belonging to the highest R&D/ME quintile (i.e., cell (1,1)). At the other end of the FF3-alpha spectrum is the lowest YK/R&D portfolio belonging to the lowest R&D/ME quintile (i.e., cell (5,5)). Its FF3-alpha is –0.20 and its t-statistic is –1.24.
In the bottom row are the FF3-alphas and the t-statistics for the YK/R&D-selected portfolios controlling for R&D intensity. Again, the results indicate a monotone relationship between R&D efficiency and risk-adjusted portfolio performance. In the H-L column, we see that after controlling for R&D intensity, the FF3-alpha of the H-L portfolio remains significant with 0.25% per month with t-statistic of 2.43. This shows that the long/short portfolio produces additional risk-adjusted performance relative to its risk exposure to the Fama–French three factors.
Japanese patent index and stock performance
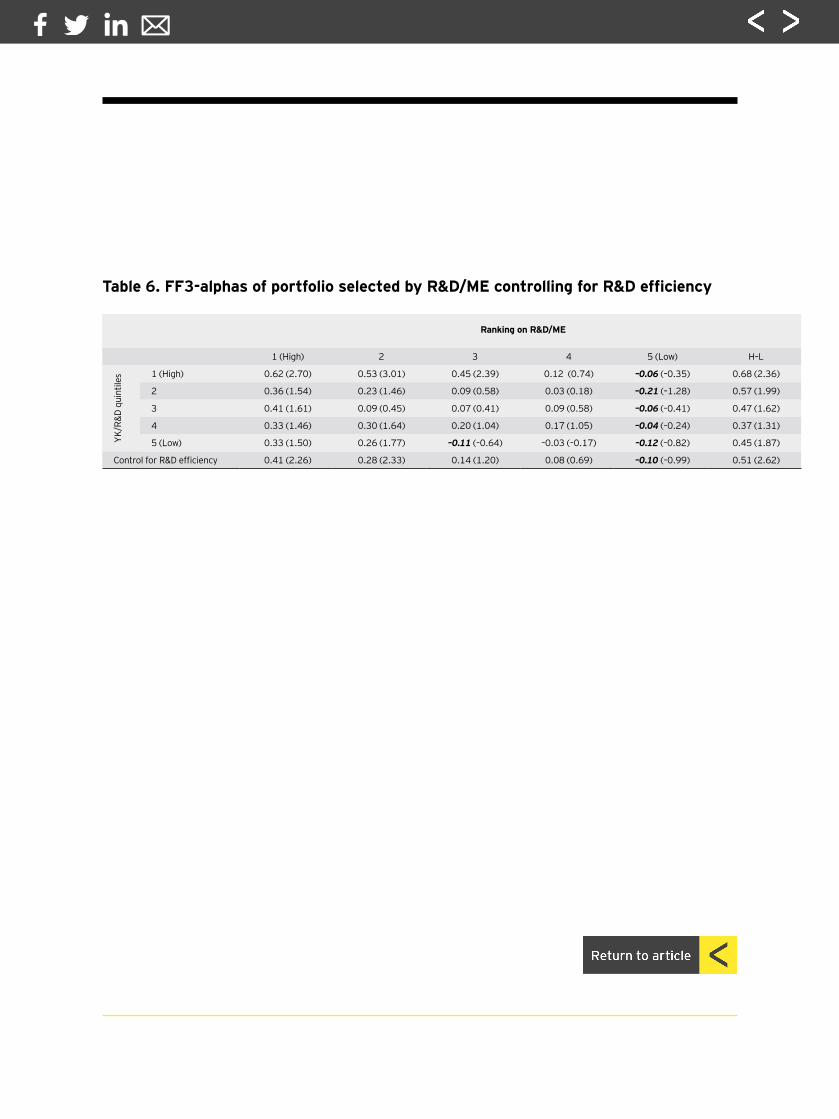
In the same spirit we reexamine the results of Table 4, in which we saw that portfolios with higher R&D intensity generate higher mean returns and alphas. At the end of each month, stocks are seperated into quintiles based on YK/R&D. Then, within each YK/R&D quintile, we separate stocks into five subgroups based on R&D/ME. This way we create 25 groups of stocks each month and in each group we form an equal-weight portfolio. As before, we do the grouping of stocks within each of the 33 TSE industry classifications. This way we make sure that in each of the five R&D/ME-selected portfolios stocks are spread evenly over R&D efficiency. We call these five portfolios “R&D/ME-selected portfolios controlling for R&D efficiency.” The results are reported in Table 6.
In each YK/R&D quintile, the alpha is higher for higher R&D/ME portfolios. This time the monotonicity is violated only by one cell (cell (3,4)). Among firms with similar R &D efficiency, more R&D intensive firms generate higher alphas. The rightmost column shows that the FF3-alpha of all H-L portfolios are positive, The FF3-alpha is highest with 0.62 (t-statistic of 2.70) for the portfolio of most R&D-intensive firms in the highe st YK/R&D quintile (cell (1,1)). At the other end of the FF3-alpha spectrum is the portfolio of the least R&D-intensive firms in the lo west YK/R&D quintile (cell (5,5)). Its FF3-alpha is –0.12 and its t-statistic is –0.82.
The bottom row reports the FF3-alphas and their t-statistics for the R&D/ME-selected portfolios controlling for R&D efficiency. The results again indicate a monotone relationship between R&D intensity and risk-adjusted portfolio performance. In the bottom H-L column we see that after controlling for R&D efficiency, the FF3-alpha of the H-L portfolio remains significant with 0.51% per month with t-statistic of 2.62. This shows that this long/short portfolio produces additional risk-adjusted performance relative to its risk exposure to the Fama–French three factors.
In conclusion, the results of Tables 5 and 6 suggest that the effects of R&D efficiency and R&D intensity are mutually independent. In addition, we can obtain returns more efficientlyby two-dimensional selections based on these two aspects of R&D activity.
Japanese patent index and stock performance
3.5 Comparison of long/short strategiesWe proposed that the best use of the YK value as a signal for stock selection might be in combination with the data on firms’ R&D expenditure, which is readily available in financialstatements. It enables us to measure firms’ IP competitiveness in two dimensions: the R&D efficiency (YK/R&D) and the R&D intensity (R&D/ME). We found in the control experiments of Tables 5 and 6 that these two factors carry independent information.
Thus, our best candidate for a portfolio strategy is to take a long position in the cell (1,1) portfolio and a short position in the cell (5,5) portfolio in either of the two-dimensional selections of Tables 5 or 6.
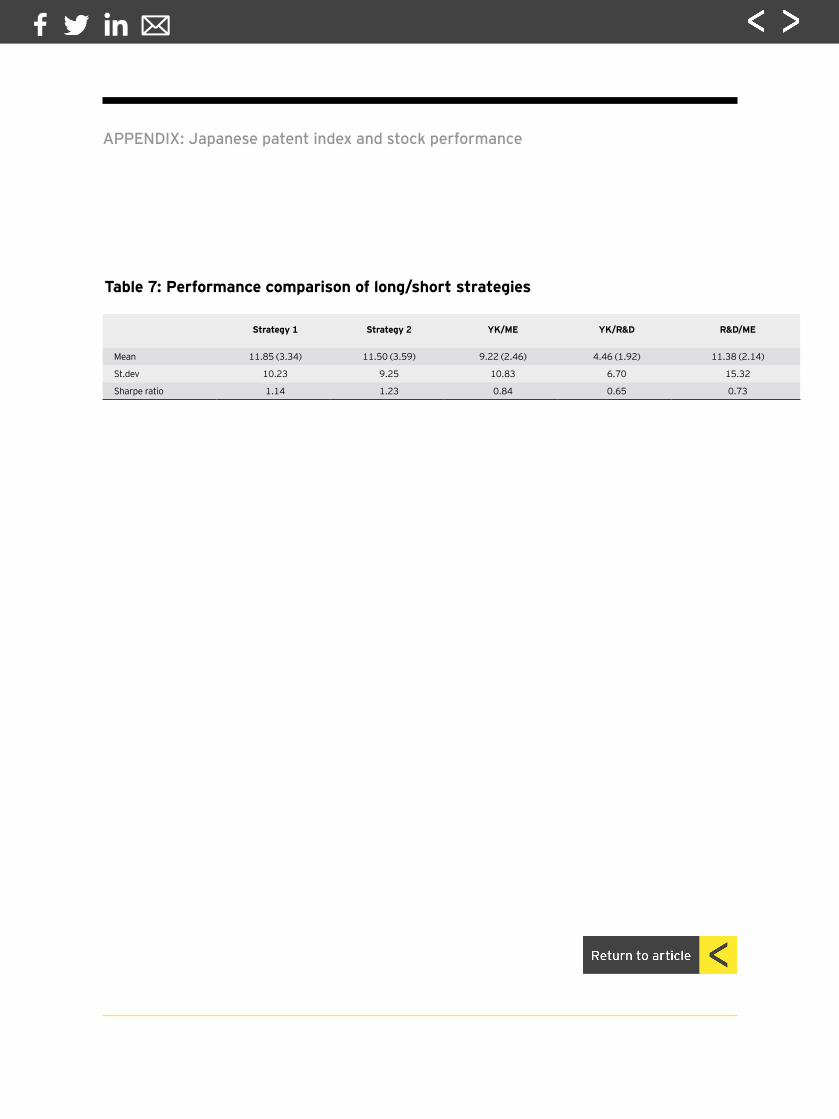
Table 7 reports the mean return and standard deviation of these long/short strategies in the first and the second column. Strategy 1 is the long/short strategy based on the two-dimensional selection of Table 5, and strategy 2 is the long/short strategy based on the two-dimensional selection of Table 6. The t-statistics are shown in parentheses for testing whether the mean return is significantly positive. We also report the Sharpe ratio.
Strategy 1 generates a mean return of 11.85% annually with a standard deviation of 10.23%. Strategy 2 generates a mean return of 11.50% annually with a standard deviation of 9.25%. Thus, strategy 1 has slightly higher mean return and higher risk than strategy 2. The Sharpe ratios are 1.14 and 1.23, respectively.
To compare the performance of these strategies with our “default strategy” of selecting stocks based on YK/ME, we separated stocks into 25 groups based on YK/ME andconstructed an equal-weight portfolio in each group. The procedure is identical to the one used for Table 2 except that we now sort stocks into 25 groups rather than 5. We thentake a long position in the highest YK/ME portfolio and a short position in the lowest YK/ME portfolio. This long/short portfolio has a mean return of 9.22% and standard deviation of 10.83%, yielding a Sharpe ratio of 0.84. The mean return is lower than strategy 1 and strategy 2. The standard deviation is higher than strategy 1 and strategy 2. Thus, we confirm a considerable performance improvement (increasing mean return andreducing risk) by decomposing IP competitiveness into two dimensions.
Japanese patent index and stock performance
We also report the results for long/short portfolios based solely on R&D efficiency (YK/R&D) or R&D intensity (R&D/ME). The procedure is again identical to the one we used for Tables 3 and 4, respectively, except that we separated stocks into 25 groups.
The column YK/R&D is for stocks selected based on YK/R&D. The mean return is 4.46% annually and standard deviation is 6.70%. The mean return is 11.38% annually and standard deviation is 15.32%. The Sharpe ratios are 0.65 and 0.73, respectively. It is surprising that merely using R&D expenditure to construct a long/ short portfolio yields an annual mean return of 11.38%, which is comparable to our strategies 1 and 2. On the other hand, its risk is considerably higher so that the Sharpe ratio is much lower than the two outperforming strategies.
3.6 The industry factorThe importance of R&D activities varies across industries. There should be industries in which our investment strategy based on IP signals work very well and industries in which our strategy is not effective.
To answer this question, we examine how selections based on YK/ ME are useful for each of the 33 TSE industry classifications. At the end of each month stocks are separated into quintiles based on YK/ME and equal-weight portfolios are formed in each quintile.Portfolio construction is done for each industry. The results are reported in Table 8. Portfolio 1 is the portfolio of stocks in the highest YK/ME quintile and portfolio 5 is in the lowest YK/ME quintile. Mean return is the time-series average of the annualizedportfolio returns in percent. The rightmost column “H-L” refers to the return of a long/short portfolio which is long in portfolio 1 and shorts portfolio 5. The t-statistics for the mean return of the H-L portfolio is shown in parentheses.
8 For pharmaceuticals, the mean return of H-L portfolio was 2.37% with a t-statistic of 0.49.
Japanese patent index and stock performance
Panel A lists industry groups with t-statistics greater than 2.0. chemicals, glass and ceramics products, machinery, electric appliances, transportation equipment, and land transportation are the industry groups in which significant mean return can begenerated by the long/short strategy based on YK/ME.8 Panel B lists industries with negative mean return on the H-L portfolio. fishery, agriculture and forestry, pulp and paper, and oil and coal products are the industries in which the YK/ME signal does notseem to work, which is not surprising. In the foregoing analysis, the universe of stocks covered all industries except financials. One can easily imagine our strategies working much more strikingly if one is allowed to be selective in industries.
4. ConclusionThe analysis in this paper suggests that the accumulation of the IP assets of Japanese firms is not sufficiently incorporated in the stock market’s pricing of firms. The YK value provides useful signals to predict future stock returns. We constructed long/ short strategies based on (1) the YK value, (2) R&D expenditure, and (3) a combination of the two. The third strategy enhanced portfolio expected return and reduces risk considerably. The bestperforming strategy generated an annual mean return of 11.50%, standard deviation of 9.25%, and a Sharpe ratio of 1.23.
Thus, making the YK value available to the investment community will satisfy the investors’ aspirations for higher returns. But more importantly, it will promote the efficiency of the Japanese stock market. The latter means that a firm with highly valuable IP assets will become able to raise equity capital at a lower cost. Constructing a technology-driven index such as Ocean Tomo 300 for use as a benchmark index will serve the investment community and simultaneously contribute to enhancing the IP competitiveness of the economy.
Japanese patent index and stock performance
ReferencesCardoza, K., C. Gray, and J. Barney, 2008, “Patents: a valuable indicator of stock performance, ” The Journal of Investing 17, 68-74Chambers, D., R. Jennings and R. Thompson, 2002, “Excess returns to R&Dintensivefirms,” Review of Accounting Studies 7, 133-158 Chan, L., J. Lakonishok, and T. Sougiannis, 2001, “The stock market valuation of research and development expenditures,” Journal of Finance 56, 2431-2456Fama, E. F. and K. R. French, 1993, “Common risk factors in the returns on stocks and bonds,” Journal of Financial Economics 33, 3-56Jung, E., 2005, “Stock performance of firms effecting intensive R&D ―excess returns and R&D factor ―,” Securities Analysts Journal 43, 98-108 (in Japanese)Kubota, K. and Takehara, H., 2007, “Re-examination of effectiveness of Fama- French factor model,” Modern Finance 22, 3-23 (in Japanese)Lev, B., and T. Sougiannis, 1996, “The capitalization, amortization and valuerelevance of R&D,” Journal of Accounting & Economics 21, 107-138Lev, B., and T. Sougiannis, 1999, “Penetrating the book-to-market black box: the R&D effect,” Journal of Business Finance and Accounting 26, 419-449Liy, E. X. N., and L. X.L. Liuz, 2010, “Intangible assets and cross-sectional stock returns: evidence from structural estimation,” working paperThomas, P., 2001, “A relationship between technology indicators and stock market performance,” Scientometrics, 51, 319—333Titman, S., J. K. Wei, and F. Xie, 2004, “Capital investments and stock returns,”Journal of Financial and Quantitative Analysis 39, 677-700
Japanese patent index and stock performance

AppendixJapanese patent index and stock performance

1 10 100 1,000 10,0001
10
100
1,000
YK
val
ue
10,000
100,000
Market cap (¥ billion)
APPENDIX: Japanese patent index and stock performance
Figure 1: The YK value and market capitalization (electric appliances)
APPENDIX: Japanese patent index and stock performance
Maximum Mean St.dev Correlation with market cap
Precision instruments 4,614 536 991 0.85
Land transportation 436 174 200 0.83
Rubber products 3,602 901 1,131 0.80
Textiles and apparels 7,853 943 2,006 0.75
Chemicals 16,407 1,231 2,447 0.73
Electric appliances 30,356 1,308 3,610 0.72
Pharmaceutical 2,181 314 459 0.70
Glass and ceramics products 3,663 594 868 0.69
Machinery 5,099 401 796 0.69
Transportation equipment 7,160 659 1,306 0.68
Metal products 2,708 310 631 0.67
Nonferrous metals 4,703 971 1,412 0.67
Table 1: Descriptive statistics of YK value for selected industry groups
Panel A: Properties of portfolios selected using YK/ME
1 (High) 2 3 4 5 (Low)
YK/ME 0.207 0.071 0.037 0.017 0.005
BE/ME 1.242 1.095 1.067 1.036 0.989
E/P 0.088 0.092 0.092 0.092 0.097
ROE 0.070 0.089 0.107 0.119 0.126
Log(ME) 24.537 25.057 25.111 25.101 24.889
Panel B: Return of portfolios selected using YK/ME
1 (High) 2 3 4 5 (Low) H–L
Mean 9.34 5.43 3.88 4.18 1.52 7.81 (3.82)
St.dev 21.22 20.10 19.24 18.68 18.50
Sharpe ratio 0.43 0.26 0.19 0.21 0.07
FF3–alpha 0.45 (2.86) 0.20 (1.90) 0.06 (0.57) 0.17 (1.41) –0.08 (–0.77) 0.52 (3.32)
APPENDIX: Japanese patent index and stock performance
Table 2: Portfolios selected using YK/ME
Panel A: Properties of portfolios selected using YK/R&D
1 (High) 2 3 4 5 (Low)
YK/R&D 0.770 0.421 0.109 0.055 0.016
BE/ME 1.076 1.046 1.103 1.079 1.117
E/P 0.090 0.100 0.088 0.089 0.093
ROE 0.083 0.115 0.104 0.104 0.106
Log(ME) 24.615 25.083 25.203 25.079 24.715
Panel B: Return of portfolios selected using YK/R&D
1 (High) 2 3 4 5 (Low) H-L
Mean 7.02 4.01 4.56 4.90 3.79 3.23 (2.79)
St.dev 19.37 19.22 20.06 19.33 19.42
Sharpe ratio 0.35 0.20 0.22 0.24 0.18
FF3-alpha 0.33 (3.31) 0.10 (1.01) 0.11 (0.90) 0.19 (1.56) 0.06 (0.57) 0.26 (2.70)
Table 3: Portfolios selected using R&D efficiency (YK/R&D)
APPENDIX: Japanese patent index and stock performance
Panel A: Properties of portfolios selected using R&D/ME
1 (High) 2 3 4 5 (Low)
R&D/ME 0.125 0.061 0.039 0.025 0.012
BE/ME 1.337 1.132 1.045 1.027 0.890
E/P 0.076 0.095 0.098 0.094 0.096
ROE 0.064 0.094 0.091 0.117 0.145
Log(ME) 24.592 24.965 24.994 24.981 25.177
Panel B: Return of portfolios selected using R&D/ME
1 (High) 2 3 4 5 (Low) H-L
Mean 10.13 5.27 4.75 2.36 1.92 8.21 (2.73)
S.tdev 22.97 20.32 18.95 18.00 17.92
Sharpe ratio 0.43 0.25 0.24 0.12 0.10
FF3-alpha 0.46 (2.25) 0.17 (1.41) 0.18 (1.71) –0.01 (-0.11) 0.00 (0.03) 0.45 (2.12)
APPENDIX: Japanese patent index and stock performance
Table 4: Portfolios selected using R&D intensity (R&D/ME)
Ranking on YK/R&D
1 (High) 2 3 4 5 (Low) H–L
R&D/
ME
quin
tiles 1 (High) 0.51 (2.20) 0.57 (2.17) 0.32 (1.28) 0.50 (1.97) 0.42 (1.65) 0.08 (0.31)
2 0.43 (2.29) 0.26 (1.49) 0.16 (0.88) 0.01 (0.06) 0.02 (0.15) 0.41 (2.03)
3 0.10 (0.68) 0.47 (3.08) 0.11 (0.64) 0.13 (0.79) 0.07 (0.44) 0.04 (0.17)
4 0.28 (1.77) –0.13 (–0.84) 0.05 (0.31) –0.14 (–0.94) –0.09 (–0.52) 0.36 (1.82)
5 (Low) 0.13 (0.74) 0.01 (0.05) 0.09 (0.50) –0.02 (–0.12) –0.20 (–1.24) 0.32 (1.55)
Control for R&D intensity 0.29 (2.54) 0.23 (2.23) 0.14 (1.24) 0.09 (0.80) 0.04 (0.40) 0.25 (2.43)
Table 5: FF3-alphas of portfolio selected using YK/R&D controlling for R&D intensity
APPENDIX: Japanese patent index and stock performance
Ranking on R&D/ME
1 (High) 2 3 4 5 (Low) H–L
YK/R
&D q
uint
iles 1 (High) 0.62 (2.70) 0.53 (3.01) 0.45 (2.39) 0.12 (0.74) –0.06 (–0.35) 0.68 (2.36)
2 0.36 (1.54) 0.23 (1.46) 0.09 (0.58) 0.03 (0.18) –0.21 (–1.28) 0.57 (1.99)
3 0.41 (1.61) 0.09 (0.45) 0.07 (0.41) 0.09 (0.58) –0.06 (–0.41) 0.47 (1.62)
4 0.33 (1.46) 0.30 (1.64) 0.20 (1.04) 0.17 (1.05) –0.04 (–0.24) 0.37 (1.31)
5 (Low) 0.33 (1.50) 0.26 (1.77) –0.11 (–0.64) –0.03 (–0.17) –0.12 (–0.82) 0.45 (1.87)
Control for R&D efficiency 0.41 (2.26) 0.28 (2.33) 0.14 (1.20) 0.08 (0.69) –0.10 (–0.99) 0.51 (2.62)
Table 6. FF3-alphas of portfolio selected by R&D/ME controlling for R&D efficiency
Strategy 1 Strategy 2 YK/ME YK/R&D R&D/ME
Mean 11.85 (3.34) 11.50 (3.59) 9.22 (2.46) 4.46 (1.92) 11.38 (2.14)
St.dev 10.23 9.25 10.83 6.70 15.32
Sharpe ratio 1.14 1.23 0.84 0.65 0.73
Table 7: Performance comparison of long/short strategies
APPENDIX: Japanese patent index and stock performance

Panel A: Industries in which YK/ME is significantly useful
1 (High) 2 3 4 5 (Low) H-L
Chemicals 11.52% 8.06% 5.79% 5.05% 2.92% 8.61% (3.20)
Glass and ceramics products 16.11% 3.26% 16.62% 2.55% 0.38% 15.73% (2.11)
Machinery 12.52% 10.10% 6.19% 4.74% 1.55% 10.97% (3.25)
Electric appliances 13.80% 5.44% 6.32% 4.55% 0.81% 13.00% (3.25)
Transportation equipment 15.72% 8.86% 11.58% 9.73% 7.13% 8.59% (2.04)
Land transportation 18.93% 5.82% 2.88% 3.53% 0.17% 18.63% (2.02)
Panel B: Industries in which YK/ME is not useful
1 (High) 2 3 4 5 (Low) H-L
Fishery, agriculture and forestry –0.89% 6.54% 8.12% –5.68% 6.64% –3.47%
Pulp and paper 2.13% 0.35% –0.27% 7.72% 7.52% –5.39%
Oil and coal products –5.60% 14.01% 0.67% 1.27% 5.88% –1.70%
Table 8: Comparison of industry groups
APPENDIX: Japanese patent index and stock performance
About EYEY is a global leader in assurance, tax, transaction and advisory services. The insights and quality services we deliver help build trust and confidence in the capital markets and in economies the world over. We develop outstanding leaders who team to deliver on our promises to all of our stakeholders. In so doing, we play a critical role in building a better working world for our people, for our clients and for our communities.
EY refers to the global organization, and may refer to one or more, of the member firms of Ernst & Young Global Limited, each of which is a separate legal entity. Ernst & Young Global Limited, a UK company limited by guarantee, does not provide services to clients. For more information about our organization, please visit ey.com.
© 2014 EYGM Limited. All Rights Reserved.EYG No. CQ0146
ey.com
The articles, information and reports (the articles) contained within The Journal are generic and represent the views and opinions of their authors. The articles produced by authors external to EY do not necessarily represent the views or opinions of EYGM Limited nor any other member of the global EY organization. The articles produced by EY contain general commentary and do not contain tailored specific advice and should not be regarded as comprehensive or sufficient for making decisions, nor should be used in place of professional advice. Accordingly, neither EYGM Limited nor any other member of the global EY organization accepts responsibility for loss arising from any action taken or not taken by those receiving The Journal.The views of third parties set out in this publication are not necessarily the views of the global EY organization or its member firms. Moreover, they should be seen in the context of the time they were made.
Accredited by the American Economic AssociationISSN 2049-8640