the italian insurance market - ice tokyo
TRANSCRIPT

The Italian Insurance Market2015 figures + 3M16 overview
September 2016
PwC
Italian insurance market snapshots
The Italian Insurance Market • 2015 figures + 3M16 overview
1
PwC
Section 1 – Italian insurance market snapshots
2
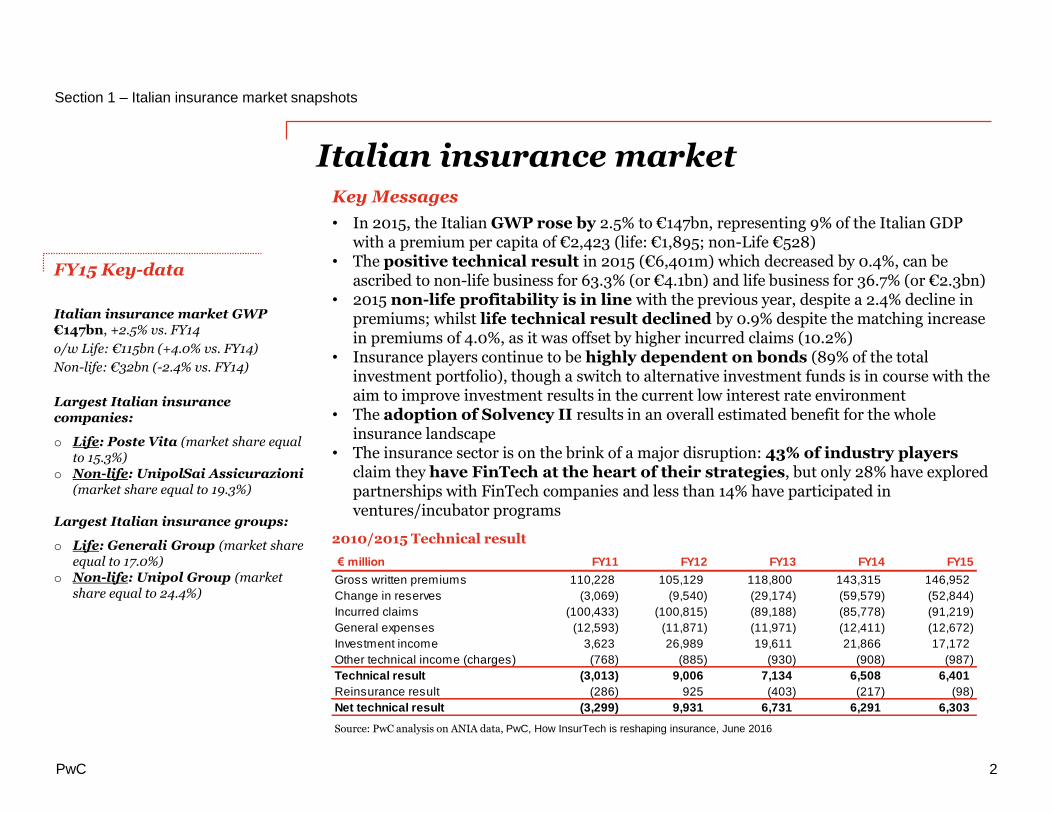
Italian insurance market
FY15 Key-data
Italian insurance market GWP €147bn, +2.5% vs. FY14
o/w Life: €115bn (+4.0% vs. FY14)
Non-life: €32bn (-2.4% vs. FY14)
Largest Italian insurance companies:
o Life: Poste Vita (market share equal to 15.3%)
o Non-life: UnipolSai Assicurazioni (market share equal to 19.3%)
Largest Italian insurance groups:
o Life: Generali Group (market share equal to 17.0%)
o Non-life: Unipol Group (market share equal to 24.4%)
Source: PwC analysis on ANIA data, PwC, How InsurTech is reshaping insurance, June 2016
Key Messages
• In 2015, the Italian GWP rose by 2.5% to €147bn, representing 9% of the Italian GDP with a premium per capita of €2,423 (life: €1,895; non-Life €528)
• The positive technical result in 2015 (€6,401m) which decreased by 0.4%, can be ascribed to non-life business for 63.3% (or €4.1bn) and life business for 36.7% (or €2.3bn)
• 2015 non-life profitability is in line with the previous year, despite a 2.4% decline in premiums; whilst life technical result declined by 0.9% despite the matching increase in premiums of 4.0%, as it was offset by higher incurred claims (10.2%)
• Insurance players continue to be highly dependent on bonds (89% of the total investment portfolio), though a switch to alternative investment funds is in course with the aim to improve investment results in the current low interest rate environment
• The adoption of Solvency II results in an overall estimated benefit for the whole insurance landscape
• The insurance sector is on the brink of a major disruption: 43% of industry players claim they have FinTech at the heart of their strategies, but only 28% have explored partnerships with FinTech companies and less than 14% have participated in ventures/incubator programs
2010/2015 Technical result
€ million FY11 FY12 FY13 FY14 FY15
Gross written premiums 110,228 105,129 118,800 143,315 146,952
Change in reserves (3,069) (9,540) (29,174) (59,579) (52,844)
Incurred claims (100,433) (100,815) (89,188) (85,778) (91,219)
General expenses (12,593) (11,871) (11,971) (12,411) (12,672)
Investment income 3,623 26,989 19,611 21,866 17,172
Other technical income (charges) (768) (885) (930) (908) (987)
Technical result (3,013) 9,006 7,134 6,508 6,401
Reinsurance result (286) 925 (403) (217) (98)
Net technical result (3,299) 9,931 6,731 6,291 6,303
PwC
Italian insurance market trend
Section 1 – Italian insurance market snapshots
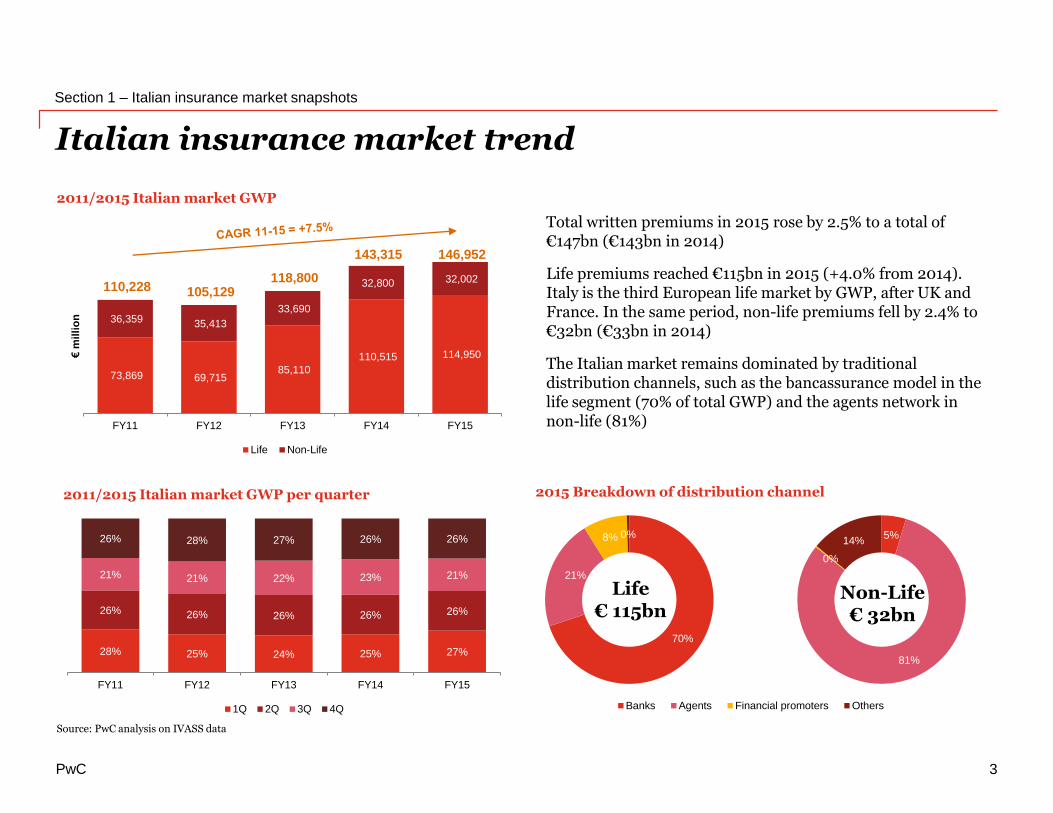
2011/2015 Italian market GWP
2015 Breakdown of distribution channel2011/2015 Italian market GWP per quarter
Non-life
Source: PwC analysis on IVASS data
Total written premiums in 2015 rose by 2.5% to a total of €147bn (€143bn in 2014)
Life premiums reached €115bn in 2015 (+4.0% from 2014). Italy is the third European life market by GWP, after UK and France. In the same period, non-life premiums fell by 2.4% to €32bn (€33bn in 2014)
The Italian market remains dominated by traditional distribution channels, such as the bancassurance model in the life segment (70% of total GWP) and the agents network in non-life (81%)
73,869 69,715 85,110
110,515 114,950
36,359 35,413
33,690
32,800 32,002 110,228 105,129
118,800
143,315 146,952
FY11 FY12 FY13 FY14 FY15
€m
illi
on
Life Non-Life
28% 25% 24% 25% 27%
26% 26% 26% 26% 26%
21% 21% 22% 23% 21%
26% 28% 27% 26% 26%
FY11 FY12 FY13 FY14 FY15
1Q 2Q 3Q 4Q
Life€ 115bn
Non-Life€ 32bn
70%
21%
8% 0% 5%
81%
0%
14%
5%
81%
0%
14%
Non-Life market - Breakdown per distribution channel FY14
Banks Agents Financial promoters Others
3
PwC
7,084
5,286
4,001
1,426 1,414
7,814
6,073
4,754
2,030 1,943
22.1%
16.5%
12.5%
4.5% 4.4%
24.4%
19.0%
14.9%
6.3% 6.1%
0%
5%
10%
15%
20%
25%
30%
35%
-
3,000
6,000
9,000
12,000
15,000
Mark
et
sh
are
GW
P (€
mil
lio
n)
18,145
15,087
7,709 7,1766,599
19,49418,145
15,087
8,4957,728
15.8%
13.1%
6.7%6.2% 5.7%
17.0%15.8%
13.1%
7.4%6.7%
0%
2%
4%
6%
8%
10%
12%
14%
16%
18%
-
5,000
10,000
15,000
20,000
Mark
et
sh
are
GW
P (€
mil
lio
n)
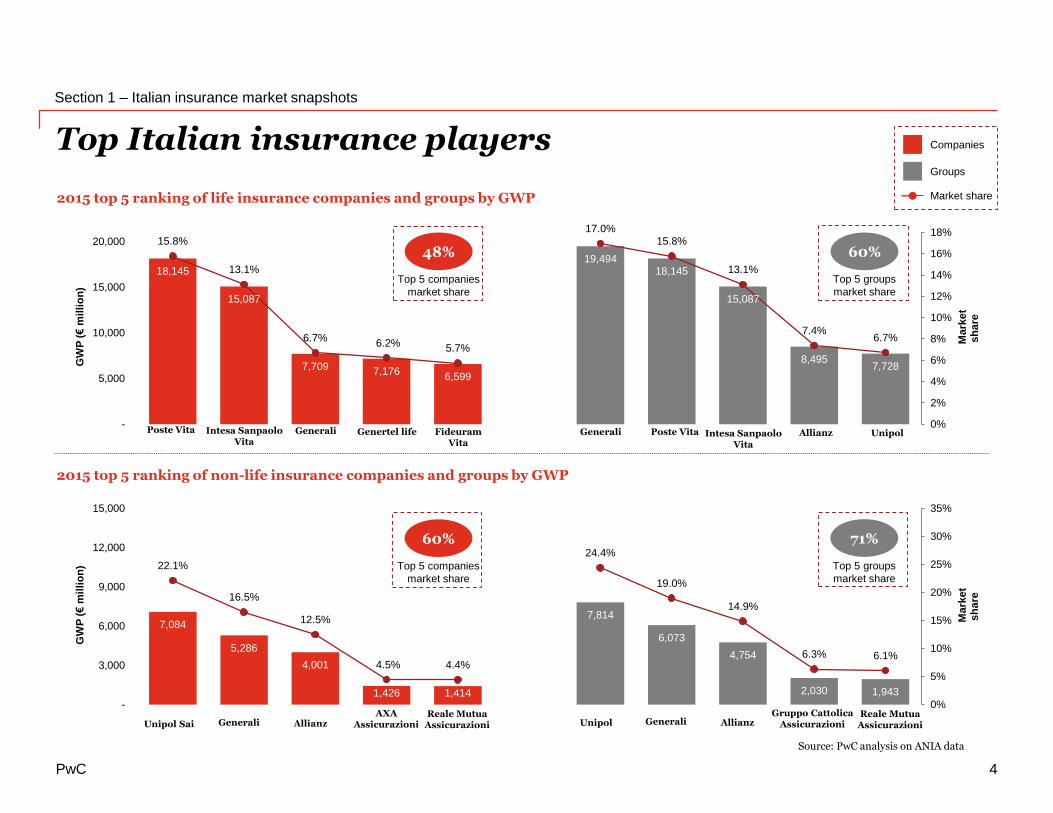
2015 top 5 ranking of life insurance companies and groups by GWP
Top Italian insurance players
Section 1 – Italian insurance market snapshots
4
2015 top 5 ranking of non-life insurance companies and groups by GWP
48%
Top 5 companies
market share
Source: PwC analysis on ANIA data
Poste Vita Genertel lifeIntesa Sanpaolo Vita
Generali FideuramVita
Generali Poste Vita Intesa Sanpaolo Vita
Allianz Unipol
Unipol Sai Generali AllianzAXA
Assicurazioni Unipol Generali AllianzGruppo Cattolica
AssicurazioniReale Mutua
AssicurazioniReale Mutua
Assicurazioni
60%
Top 5 groups
market share
60%
Top 5 companies
market share
71%
Top 5 groups
market share
Companies
Groups
Market share
PwC
191 182229 258
34713 68
4978
3
83
8894
119132
11
10 9
9 9
21
24 27
38 52
319 371
408
502
544
FY11 FY12 FY13 FY14 FY15
€b
illi
on
Investments
Section 1 – Italian insurance market snapshots
5
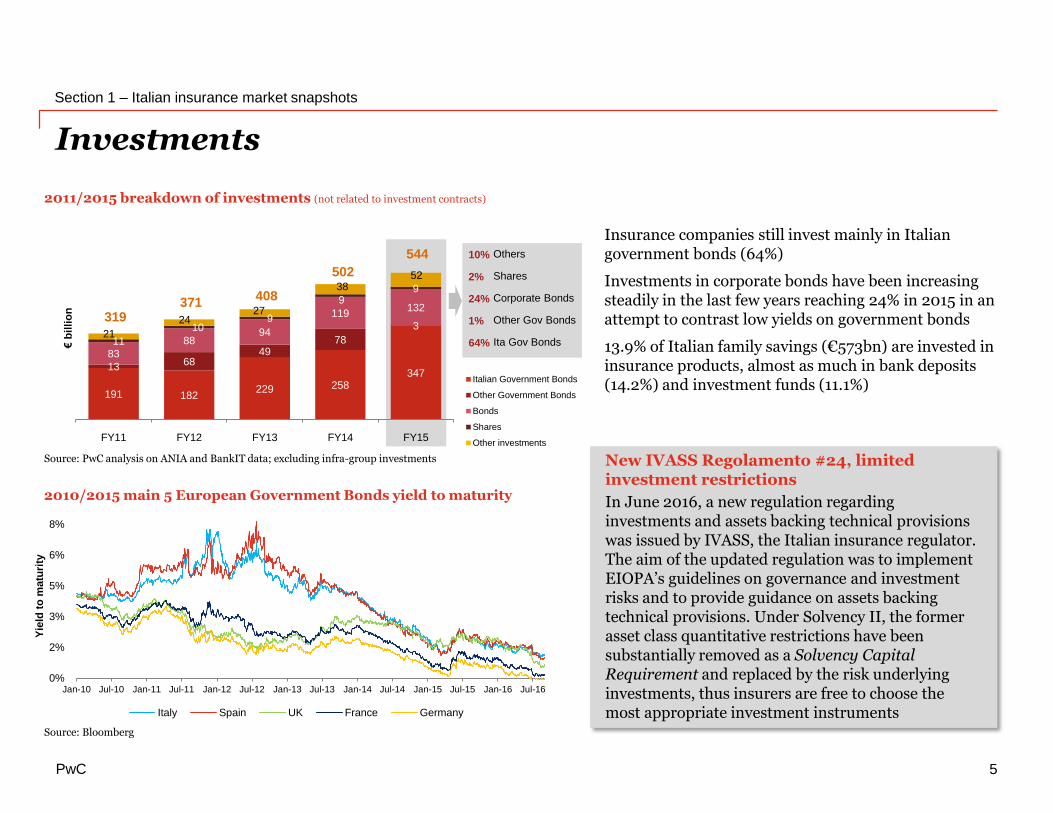
2011/2015 breakdown of investments (not related to investment contracts)
2010/2015 main 5 European Government Bonds yield to maturity
Source: Bloomberg
Source: PwC analysis on ANIA and BankIT data; excluding infra-group investments
64%
1%
24%
2%
10%
51%
15%
24%
2%
8%
Italian Government Bonds
Other Government Bonds
Bonds
Shares
Other investments
Insurance companies still invest mainly in Italian government bonds (64%)
Investments in corporate bonds have been increasing steadily in the last few years reaching 24% in 2015 in an attempt to contrast low yields on government bonds
13.9% of Italian family savings (€573bn) are invested in insurance products, almost as much in bank deposits (14.2%) and investment funds (11.1%)
New IVASS Regolamento #24, limited investment restrictions
In June 2016, a new regulation regarding investments and assets backing technical provisions was issued by IVASS, the Italian insurance regulator. The aim of the updated regulation was to implement EIOPA’s guidelines on governance and investment risks and to provide guidance on assets backing technical provisions. Under Solvency II, the former asset class quantitative restrictions have been substantially removed as a Solvency Capital Requirement and replaced by the risk underlying investments, thus insurers are free to choose the most appropriate investment instruments
Ita Gov Bonds
Other Gov Bonds
Corporate Bonds
Shares
Others
0%
2%
3%
5%
6%
8%
Jan-10 Jul-10 Jan-11 Jul-11 Jan-12 Jul-12 Jan-13 Jul-13 Jan-14 Jul-14 Jan-15 Jul-15 Jan-16 Jul-16
Yie
ld t
o m
atu
rity
Italy Spain UK France Germany
PwC
(2%)
0%
2%
4%
6%
8%
Jan-05 Jan-06 Jan-07 Jan-08 Jan-09 Jan-10 Jan-11 Jan-12 Jan-13 Jan-14 Jan-15
Yie
ld t
o m
atu
rity
BTP 10Y yield
Inflation rate
Avg segregated funds yield
Section 1 – Italian insurance market snapshots
6
Low interest rates are the main issue life insurers must face onwards
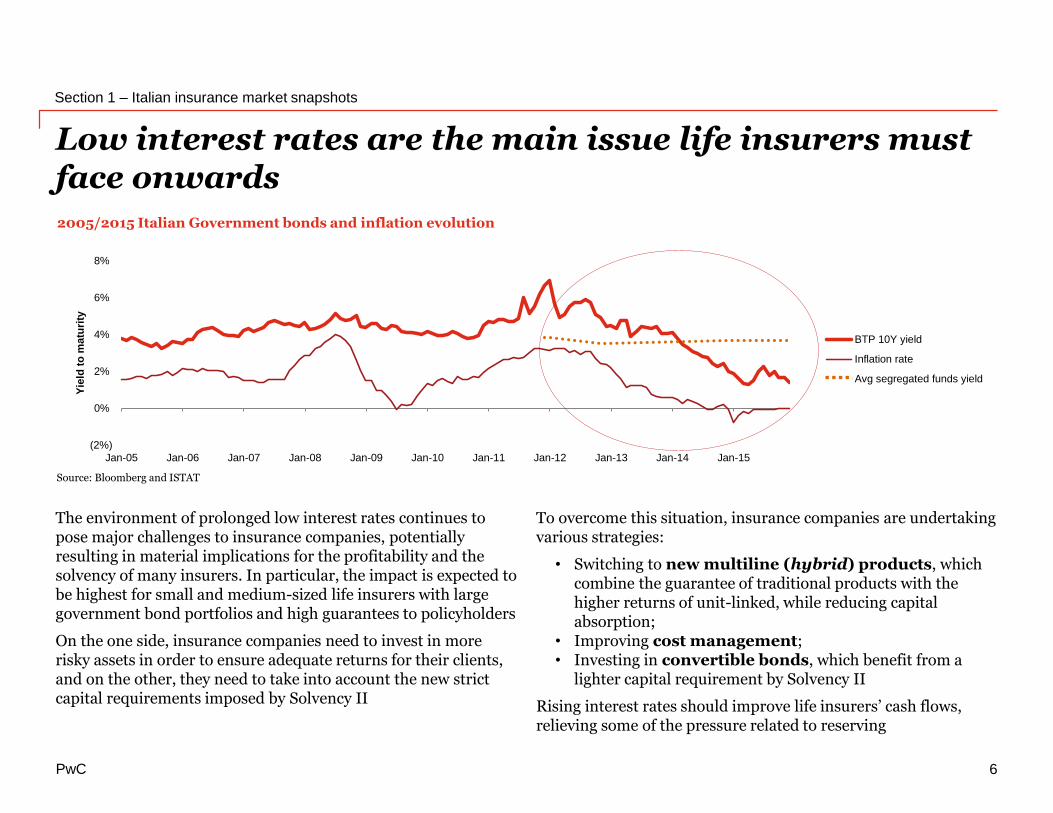
2005/2015 Italian Government bonds and inflation evolution
Source: Bloomberg and ISTAT
The environment of prolonged low interest rates continues to pose major challenges to insurance companies, potentially resulting in material implications for the profitability and the solvency of many insurers. In particular, the impact is expected to be highest for small and medium-sized life insurers with large government bond portfolios and high guarantees to policyholders
On the one side, insurance companies need to invest in more risky assets in order to ensure adequate returns for their clients, and on the other, they need to take into account the new strict capital requirements imposed by Solvency II
To overcome this situation, insurance companies are undertaking various strategies:
• Switching to new multiline (hybrid) products, which combine the guarantee of traditional products with the higher returns of unit-linked, while reducing capital absorption;
• Improving cost management;• Investing in convertible bonds, which benefit from a
lighter capital requirement by Solvency II
Rising interest rates should improve life insurers’ cash flows, relieving some of the pressure related to reserving
PwC
Section 1 – Italian insurance market snapshots
7
The negative trend of motor premiums has been impacting the whole non-life sector
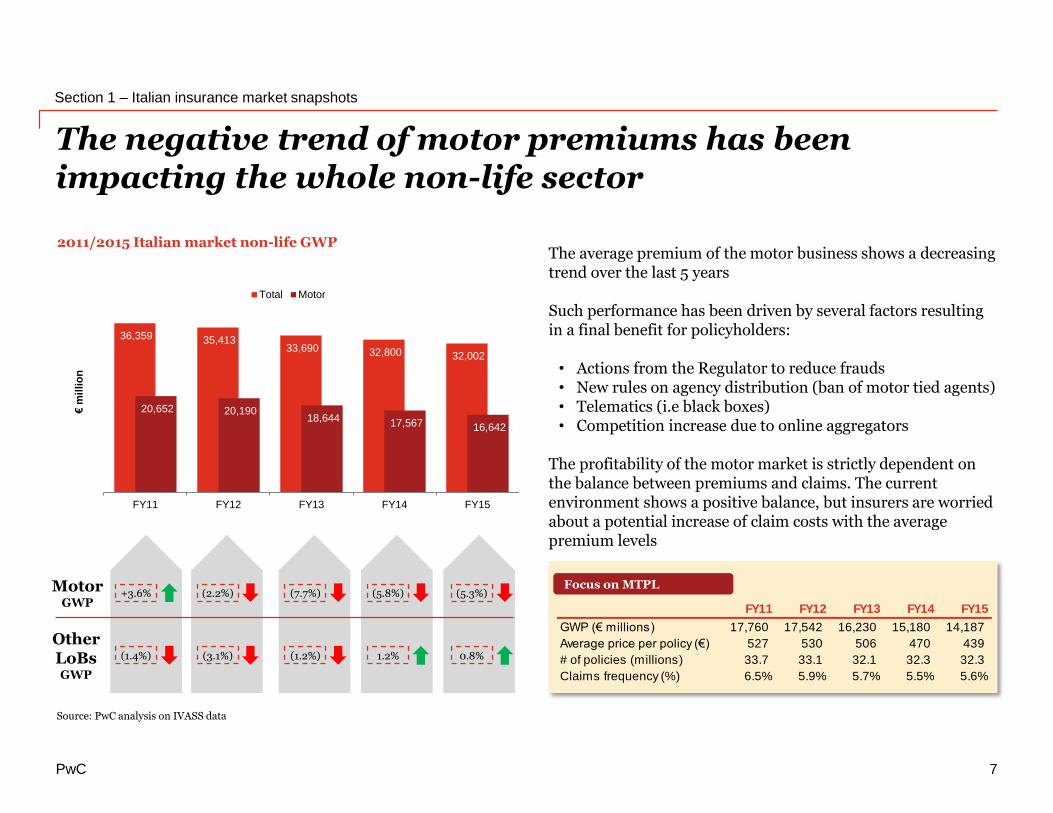
2011/2015 Italian market non-life GWP
Source: PwC analysis on IVASS data
MotorGWP
OtherLoBsGWP
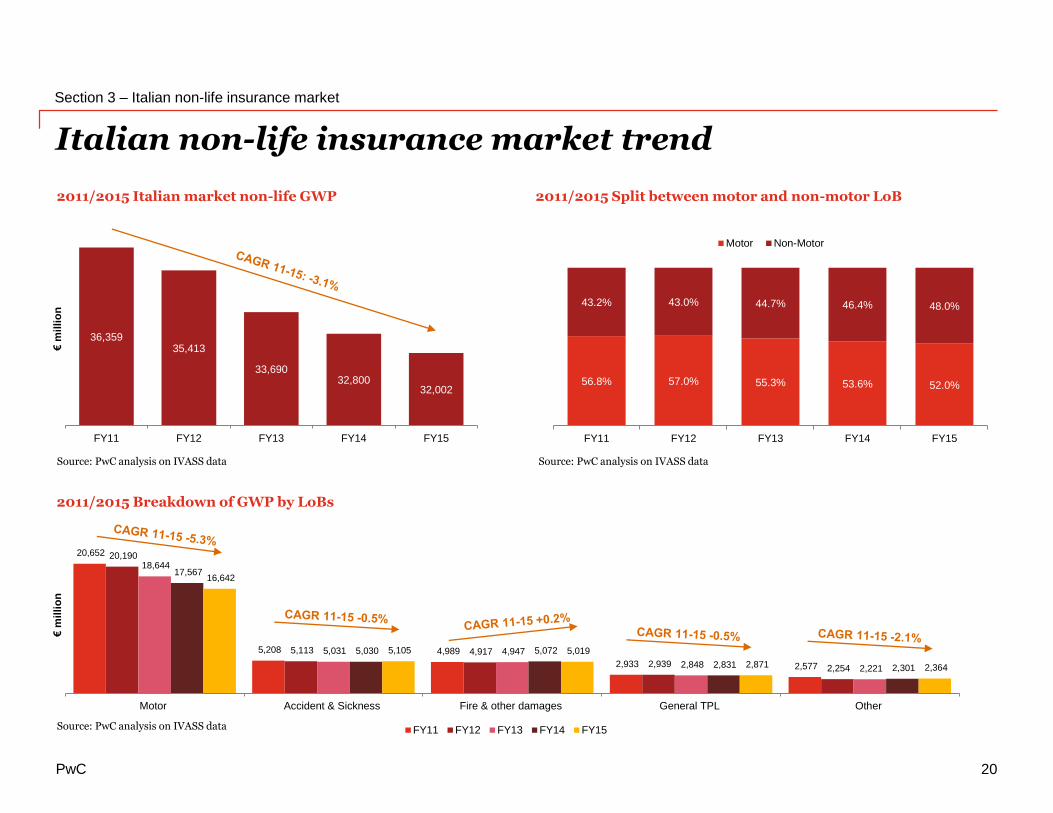
36,359 35,413 33,690 32,800 32,002
20,652 20,190 18,644 17,567 16,642
FY11 FY12 FY13 FY14 FY15
€m
illi
on
Total Motor
+3.6%
(1.4%)
(2.2%)
(3.1%)
(7.7%)
(1.2%)
(5.8%)
1.2%
(5.3%)
0.8%
The average premium of the motor business shows a decreasing trend over the last 5 years
Such performance has been driven by several factors resulting in a final benefit for policyholders:
• Actions from the Regulator to reduce frauds• New rules on agency distribution (ban of motor tied agents)• Telematics (i.e black boxes)• Competition increase due to online aggregators
The profitability of the motor market is strictly dependent on the balance between premiums and claims. The current environment shows a positive balance, but insurers are worried about a potential increase of claim costs with the average premium levels
FY11 FY12 FY13 FY14 FY15
GWP (€ millions) 17,760 17,542 16,230 15,180 14,187
Average price per policy (€) 527 530 506 470 439
# of policies (millions) 33.7 33.1 32.1 32.3 32.3
Claims frequency (%) 6.5% 5.9% 5.7% 5.5% 5.6%
Focus on MTPL
PwC
Italian life insurance market
The Italian Insurance Market • 2015 figures + 3M16 overview
8
PwC
Section 2 – Italian life insurance market
9
Italian life insurance market
2015 # of companies by GWP
GWP > €5bn €5bn-€1bn
€1bn-€0,1bn
€100m-€50m
< €50m
26
4
16
19
6
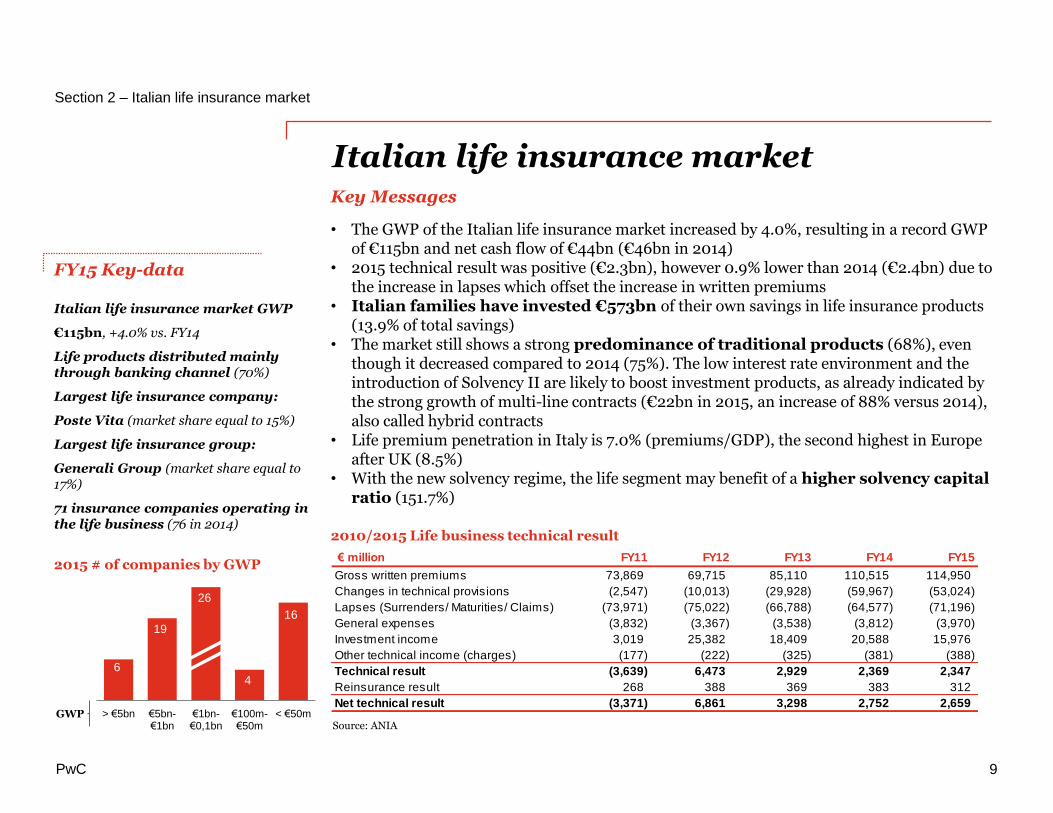
FY15 Key-data
Italian life insurance market GWP
€115bn, +4.0% vs. FY14
Life products distributed mainly through banking channel (70%)
Largest life insurance company:
Poste Vita (market share equal to 15%)
Largest life insurance group:
Generali Group (market share equal to 17%)
71 insurance companies operating in the life business (76 in 2014)
2010/2015 Life business technical result
Source: ANIA
Key Messages
• The GWP of the Italian life insurance market increased by 4.0%, resulting in a record GWP of €115bn and net cash flow of €44bn (€46bn in 2014)
• 2015 technical result was positive (€2.3bn), however 0.9% lower than 2014 (€2.4bn) due to the increase in lapses which offset the increase in written premiums
• Italian families have invested €573bn of their own savings in life insurance products (13.9% of total savings)
• The market still shows a strong predominance of traditional products (68%), even though it decreased compared to 2014 (75%). The low interest rate environment and the introduction of Solvency II are likely to boost investment products, as already indicated by the strong growth of multi-line contracts (€22bn in 2015, an increase of 88% versus 2014), also called hybrid contracts
• Life premium penetration in Italy is 7.0% (premiums/GDP), the second highest in Europe after UK (8.5%)
• With the new solvency regime, the life segment may benefit of a higher solvency capital ratio (151.7%)
€ million FY11 FY12 FY13 FY14 FY15
Gross written premiums 73,869 69,715 85,110 110,515 114,950
Changes in technical provisions (2,547) (10,013) (29,928) (59,967) (53,024)
Lapses (Surrenders/ Maturities/ Claims) (73,971) (75,022) (66,788) (64,577) (71,196)
General expenses (3,832) (3,367) (3,538) (3,812) (3,970)
Investment income 3,019 25,382 18,409 20,588 15,976
Other technical income (charges) (177) (222) (325) (381) (388)
Technical result (3,639) 6,473 2,929 2,369 2,347
Reinsurance result 268 388 369 383 312
Net technical result (3,371) 6,861 3,298 2,752 2,659
PwC
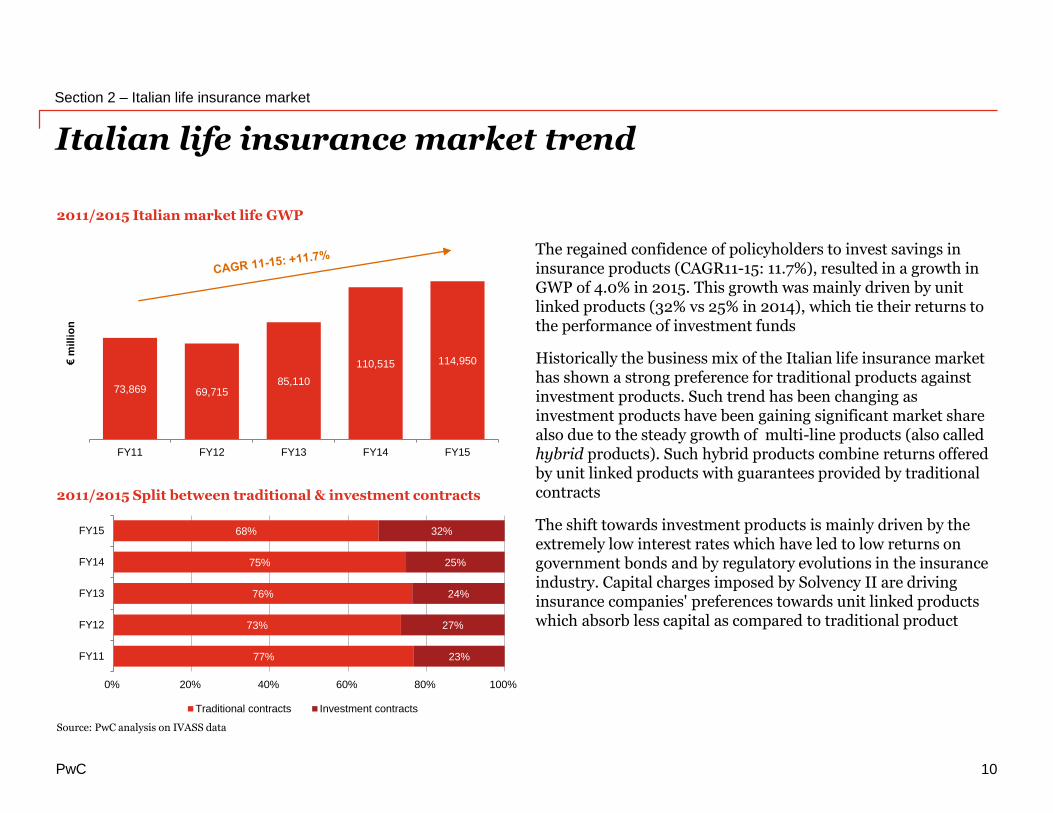
73,869 69,71585,110
110,515 114,950
FY11 FY12 FY13 FY14 FY15
€m
illi
on
2011/2015 Italian market life GWP
Italian life insurance market trend
Section 2 – Italian life insurance market
10
2011/2015 Split between traditional & investment contracts
Source: PwC analysis on IVASS data
77%
73%
76%
75%
68%
23%
27%
24%
25%
32%
0% 20% 40% 60% 80% 100%
FY11
FY12
FY13
FY14
FY15
Traditional contracts Investment contracts
The regained confidence of policyholders to invest savings in insurance products (CAGR11-15: 11.7%), resulted in a growth in GWP of 4.0% in 2015. This growth was mainly driven by unit linked products (32% vs 25% in 2014), which tie their returns to the performance of investment funds
Historically the business mix of the Italian life insurance market has shown a strong preference for traditional products against investment products. Such trend has been changing as investment products have been gaining significant market share also due to the steady growth of multi-line products (also called hybrid products). Such hybrid products combine returns offered by unit linked products with guarantees provided by traditional contracts
The shift towards investment products is mainly driven by the extremely low interest rates which have led to low returns on government bonds and by regulatory evolutions in the insurance industry. Capital charges imposed by Solvency II are driving insurance companies' preferences towards unit linked products which absorb less capital as compared to traditional product
PwC
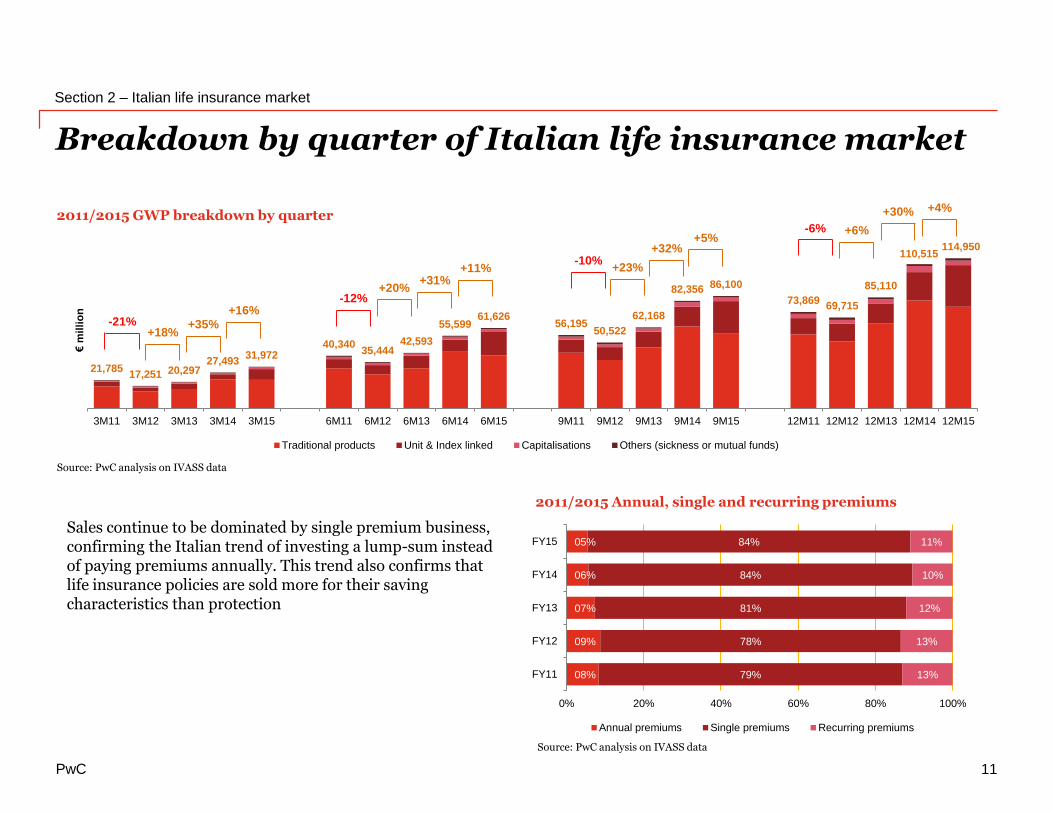
21,78517,251 20,297
27,49331,972
40,34035,444
42,593
55,59961,626
56,19550,522
62,168
82,356 86,100
73,86969,715
85,110
110,515114,950
3M11 3M12 3M13 3M14 3M15 6M11 6M12 6M13 6M14 6M15 9M11 9M12 9M13 9M14 9M15 12M11 12M12 12M13 12M14 12M15
€m
illi
on
Traditional products Unit & Index linked Capitalisations Others (sickness or mutual funds)
Breakdown by quarter of Italian life insurance market
Section 2 – Italian life insurance market
11
2011/2015 GWP breakdown by quarter
2011/2015 Annual, single and recurring premiums
-21%+18%
+35%
-12%+20%
+31%
-10%+23%
+32%
-6% +6%
+30%
Source: PwC analysis on IVASS data
Source: PwC analysis on IVASS data
+16%
+11%
+5%
+4%
08%
09%
07%
06%
05%
79%
78%
81%
84%
84%
13%
13%
12%
10%
11%
0% 20% 40% 60% 80% 100%
FY11
FY12
FY13
FY14
FY15
Annual premiums Single premiums Recurring premiums
Sales continue to be dominated by single premium business, confirming the Italian trend of investing a lump-sum instead of paying premiums annually. This trend also confirms that life insurance policies are sold more for their saving characteristics than protection
PwC
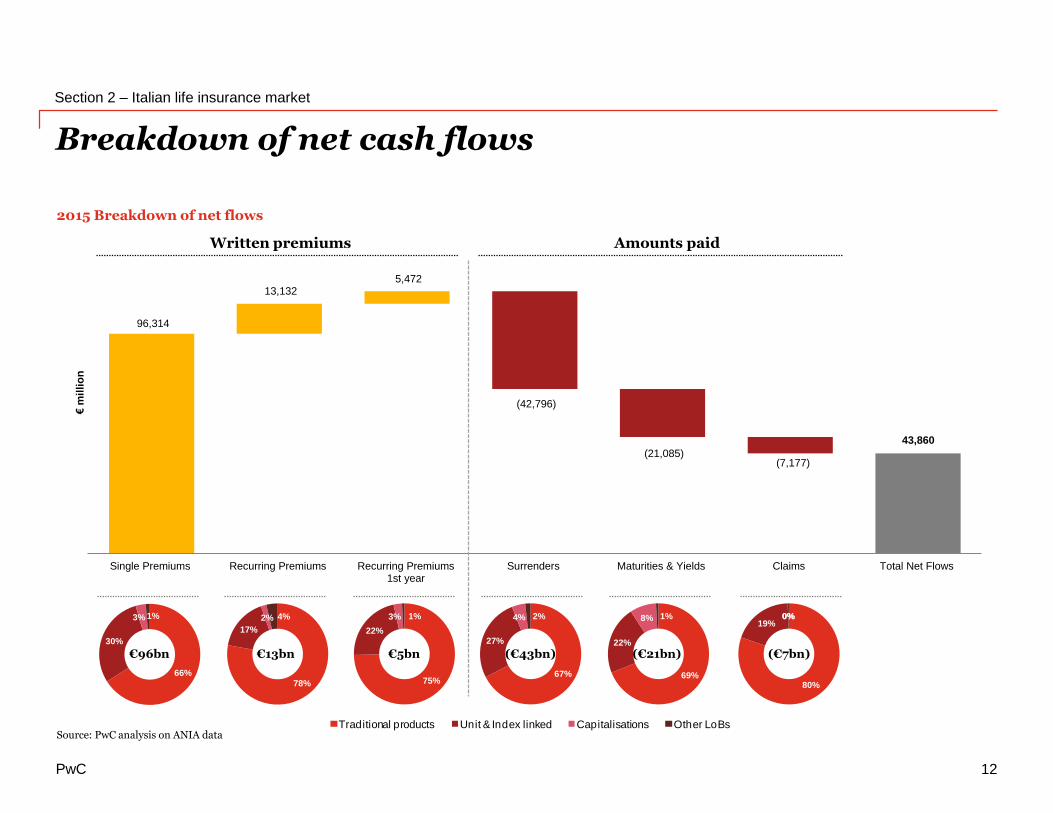
96,314
43,860
(7,177)
(42,796)
(21,085)
13,132 5,472
Single Premiums Recurring Premiums Recurring Premiums1st year
Surrenders Maturities & Yields Claims Total Net Flows
€m
illi
on
Breakdown of net cash flows
80%
19% 0% 0%
67%
27%
4% 2%
75%
22%
3% 1%
78%
17%
2% 4%
66%
30%
3% 1%
41%
46%
9%4%
Traditional products Unit & Index linked Capitalisations Other LoBs
Section 2 – Italian life insurance market
12
2015 Breakdown of net flows
Written premiums Amounts paid
Source: PwC analysis on ANIA data
€96bn €13bn €5bn (€43bn) (€21bn) (€7bn)
69%
22%
8% 1%

PwC
28,724
14,464
(137)
809 43,860
Traditional products Unit & Index linked Capitalisations Other LoBs Total Net Flow
€m
illi
on
Breakdown of net cash flows by LoB
Section 2 – Italian life insurance market
13
2015 Breakdown of net flows by LoB
Source: PwC analysis on ANIA data
GWP
Redemptions
Maturities
Claims
Net flows €28,724m Net flows €14,464m Net flows (€137m)
Traditional Unit & Index linked Capitalisation
77,870
(28,847)
(14,536)
(5,763)
31,838
(11,376)
(4,611)
(1,387)
3,483
(1,842)
(1,774)
(4)
€ million € million € million
Traditional productsUnit & Index linkedCapitalisationsOther Lobs
65%33%0%2%
LoBs contribution to Net Flow
PwC
5.14 3.32
7.83
4.76
12.3%
16.5%
13.3% 13.0%
0%
2%
4%
6%
8%
10%
12%
14%
16%
18%
-
1
2
3
4
5
6
7
8
9
10
11
12
Traditional products Unit & Index linked Capitalisations Life LoBsTotal
Average duration (years) Lapse index (%)
Portfolio lapse index and average duration
Section 2 – Italian life insurance market
14
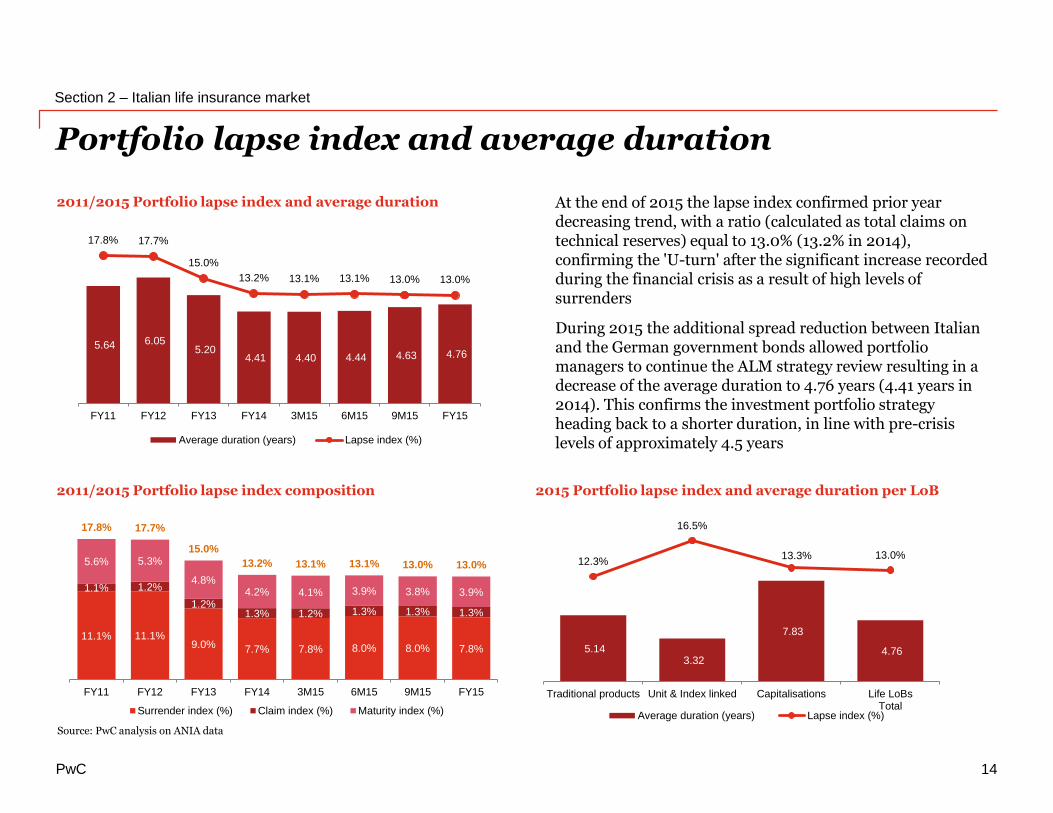
At the end of 2015 the lapse index confirmed prior year decreasing trend, with a ratio (calculated as total claims on technical reserves) equal to 13.0% (13.2% in 2014), confirming the 'U-turn' after the significant increase recorded during the financial crisis as a result of high levels of surrenders
During 2015 the additional spread reduction between Italian and the German government bonds allowed portfolio managers to continue the ALM strategy review resulting in a decrease of the average duration to 4.76 years (4.41 years in 2014). This confirms the investment portfolio strategy heading back to a shorter duration, in line with pre-crisis levels of approximately 4.5 years
2015 Portfolio lapse index and average duration per LoB
2011/2015 Portfolio lapse index and average duration
2011/2015 Portfolio lapse index composition
Source: PwC analysis on ANIA data
5.64 6.05 5.20
4.41 4.40 4.44 4.63 4.76
17.8% 17.7%
15.0%
13.2% 13.1% 13.1% 13.0% 13.0%
0%
5%
10%
15%
20%
-
1
2
3
4
5
6
7
8
FY11 FY12 FY13 FY14 3M15 6M15 9M15 FY15
Average duration (years) Lapse index (%)
11.1% 11.1%9.0% 7.7% 7.8% 8.0% 8.0% 7.8%
1.1% 1.2%
1.2%1.3% 1.2% 1.3% 1.3% 1.3%
5.6% 5.3%
4.8%4.2% 4.1% 3.9% 3.8% 3.9%
17.8% 17.7%
15.0%
13.2% 13.1% 13.1% 13.0% 13.0%
FY11 FY12 FY13 FY14 3M15 6M15 9M15 FY15
Surrender index (%) Claim index (%) Maturity index (%)
PwC
Distribution channel and investments overview
Section 2 – Italian life insurance market
15
2011/2015 GWP by distribution channel
2015 Asset allocation of life products
Source: PwC analysis on IVASS data
Source: PwC analysis on ANIA data
25.6% 26.6% 23.0% 20.2% 21.2%
1.4% 1.5%1.2% 1.0% 0.5%
54.8% 48.6% 59.1% 62.0%69.9%
18.3% 23.3%16.7% 16.8%
8.5%
FY11 FY12 FY13 FY14 FY15
Agents Others Banks Financial promoters
56.9%66.1%
22.2% 20.7%
29.4%26.4%
39.4% 39.5%
9.9% 3.3%
33.5% 34.6%
2.0% 1.2% 4.9% 5.2%1.8% 3.0%
Totallife market
Totalprofit sharing
Totalunit-linked & pension
funds
Totalunit-linked
Government bonds Corporate bonds Shares Liquidity Fixed assets and others
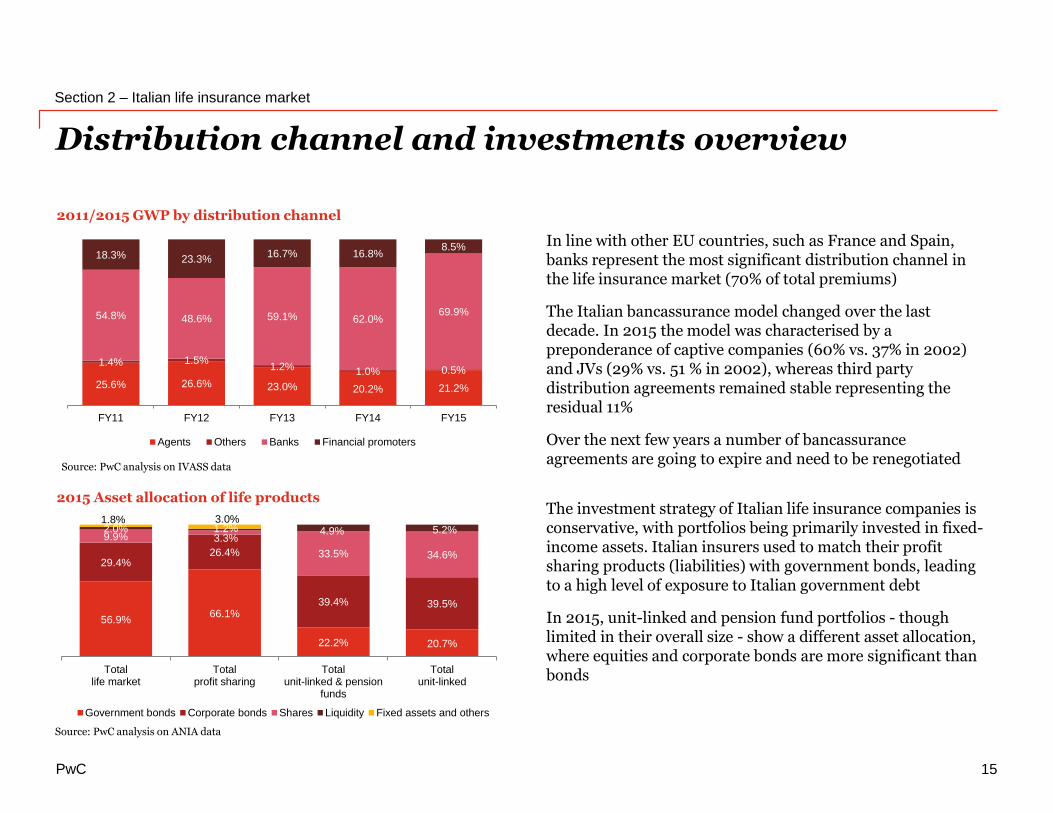
In line with other EU countries, such as France and Spain, banks represent the most significant distribution channel in the life insurance market (70% of total premiums)
The Italian bancassurance model changed over the last decade. In 2015 the model was characterised by a preponderance of captive companies (60% vs. 37% in 2002) and JVs (29% vs. 51 % in 2002), whereas third party distribution agreements remained stable representing the residual 11%
Over the next few years a number of bancassuranceagreements are going to expire and need to be renegotiated
The investment strategy of Italian life insurance companies is conservative, with portfolios being primarily invested in fixed-income assets. Italian insurers used to match their profit sharing products (liabilities) with government bonds, leading to a high level of exposure to Italian government debt
In 2015, unit-linked and pension fund portfolios - though limited in their overall size - show a different asset allocation, where equities and corporate bonds are more significant than bonds
PwC
Life insurance solvency margin
Section 2 – Italian life insurance market
16
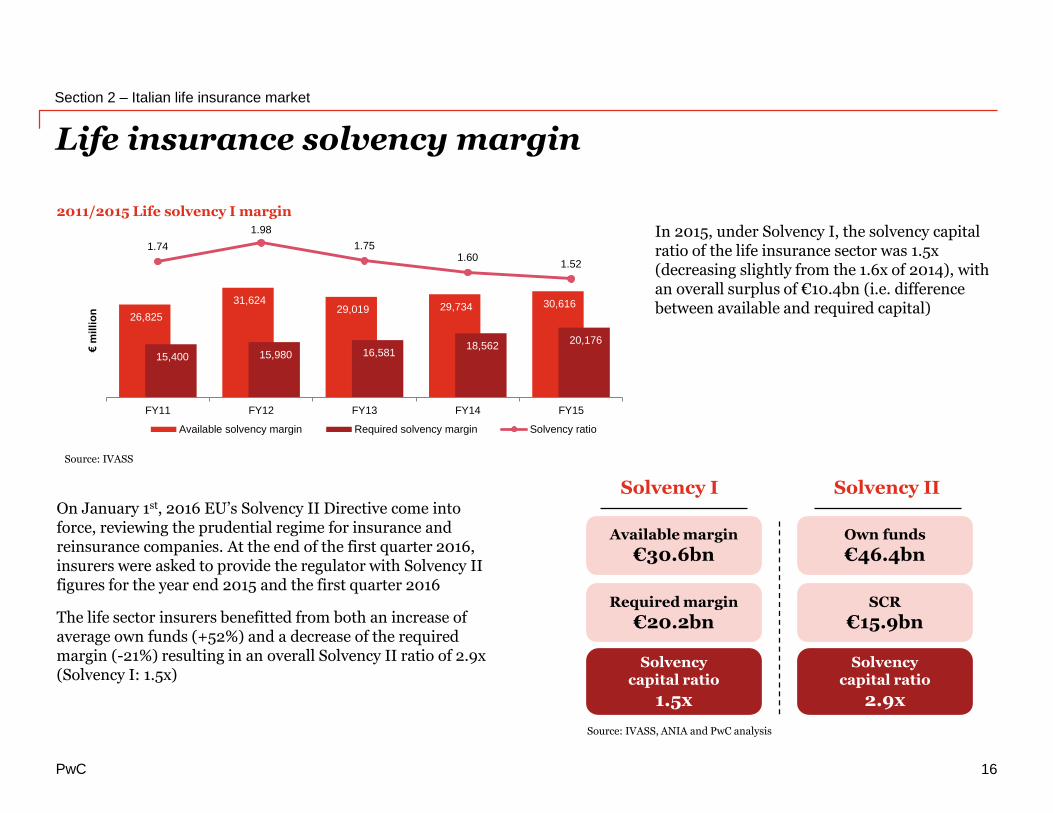
On January 1st, 2016 EU’s Solvency II Directive come into force, reviewing the prudential regime for insurance and reinsurance companies. At the end of the first quarter 2016, insurers were asked to provide the regulator with Solvency II figures for the year end 2015 and the first quarter 2016
The life sector insurers benefitted from both an increase of average own funds (+52%) and a decrease of the required margin (-21%) resulting in an overall Solvency II ratio of 2.9x (Solvency I: 1.5x)
Available margin
€30.6bn
Required margin
€20.2bn
Own funds
€46.4bn
SCR
€15.9bn
Solvencycapital ratio
1.5x
Solvencycapital ratio
2.9x
In 2015, under Solvency I, the solvency capital ratio of the life insurance sector was 1.5x (decreasing slightly from the 1.6x of 2014), with an overall surplus of €10.4bn (i.e. difference between available and required capital)
26,825
31,624 29,019 29,734 30,616
15,400 15,980 16,581 18,562
20,176
1.74
1.98
1.751.60
1.52
0.0
0.2
0.4
0.6
0.8
1.0
1.2
1.4
1.6
1.8
2.0
-
5,000
10,000
15,000
20,000
25,000
30,000
35,000
40,000
45,000
FY11 FY12 FY13 FY14 FY15
€m
illi
on
Available solvency margin Required solvency margin Solvency ratio
Source: IVASS
2011/2015 Life solvency I margin
Source: IVASS, ANIA and PwC analysis
Solvency I Solvency II
PwC
60%
40%
Traditional Unit & Index Linked
11% 72% 17%
Others Banks Financial promoters
Focus: Multiline productsPremiums and channel breakdown
Section 2 – Italian life insurance market
2015 Multiline breakdown by channel
2015 Premiums by Lob in multiline products
Source: ANIA
17
€22bn
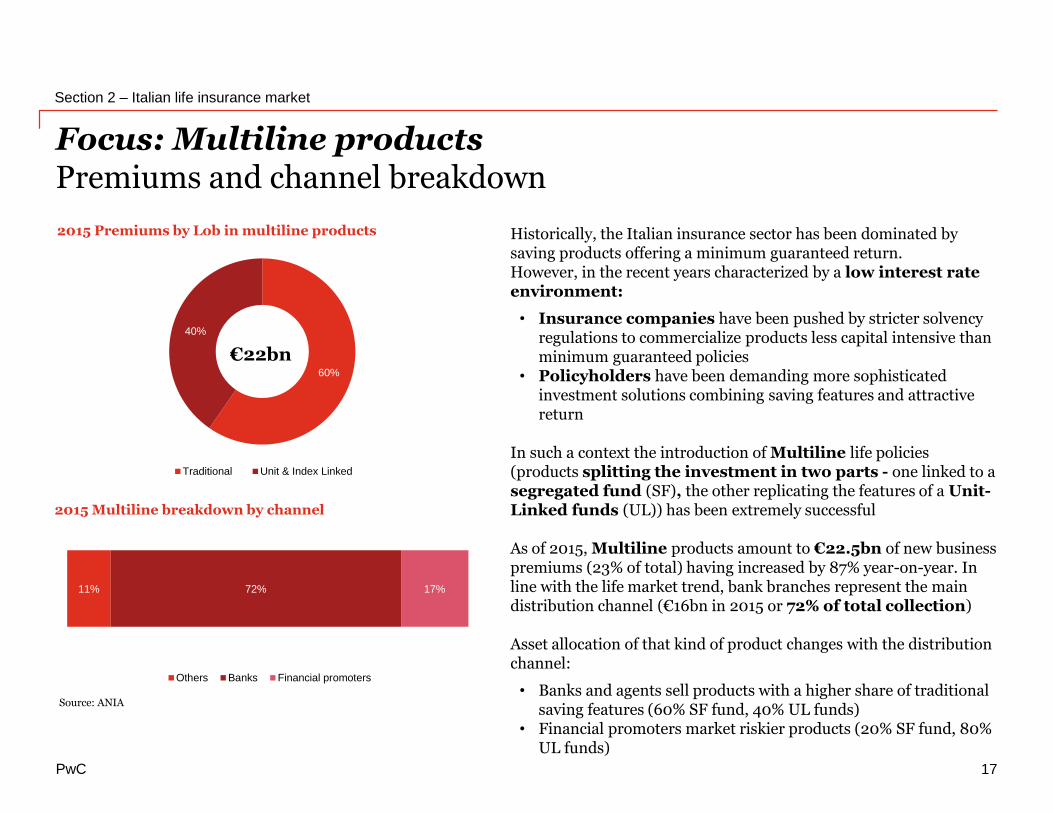
Historically, the Italian insurance sector has been dominated by saving products offering a minimum guaranteed return.However, in the recent years characterized by a low interest rate environment:
• Insurance companies have been pushed by stricter solvency regulations to commercialize products less capital intensive than minimum guaranteed policies
• Policyholders have been demanding more sophisticated investment solutions combining saving features and attractive return
In such a context the introduction of Multiline life policies(products splitting the investment in two parts - one linked to asegregated fund (SF), the other replicating the features of a Unit-Linked funds (UL)) has been extremely successful
As of 2015, Multiline products amount to €22.5bn of new business premiums (23% of total) having increased by 87% year-on-year. In line with the life market trend, bank branches represent the main distribution channel (€16bn in 2015 or 72% of total collection)
Asset allocation of that kind of product changes with the distribution channel:
• Banks and agents sell products with a higher share of traditional saving features (60% SF fund, 40% UL funds)
• Financial promoters market riskier products (20% SF fund, 80% UL funds)

PwC
Italian non-life insurance market
The Italian Insurance Market • 2015 figures + 3M16 overview
18
PwC
> €1bn €1bn-€0.3bn
€0.3bn-€0.1bn
€100m-€50m
< €50m
Section 3 – Italian non-life insurance market
19
Italian non-life insurance market
FY15 Key-data
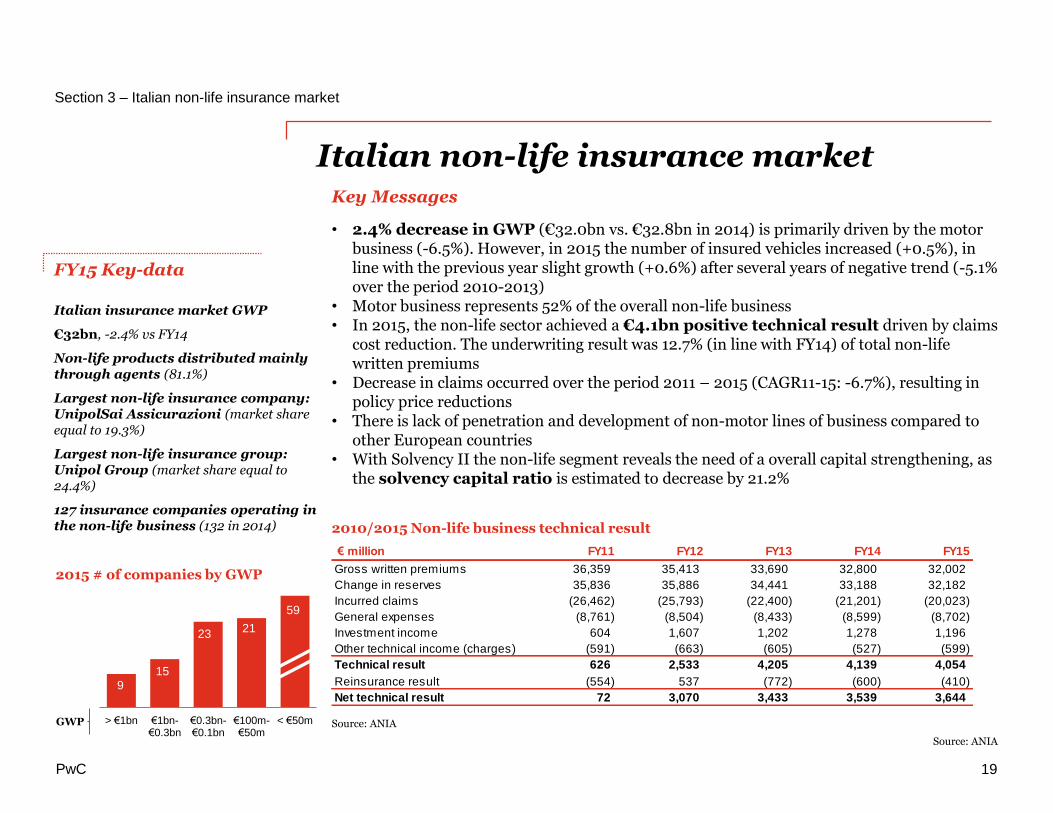
Italian insurance market GWP
€32bn, -2.4% vs FY14
Non-life products distributed mainly through agents (81.1%)
Largest non-life insurance company: UnipolSai Assicurazioni (market share equal to 19.3%)
Largest non-life insurance group: Unipol Group (market share equal to 24.4%)
127 insurance companies operating in the non-life business (132 in 2014)
2015 # of companies by GWP
GWP
2010/2015 Non-life business technical result
Source: ANIA
23 21
59
159
Source: ANIA
Key Messages
• 2.4% decrease in GWP (€32.0bn vs. €32.8bn in 2014) is primarily driven by the motor business (-6.5%). However, in 2015 the number of insured vehicles increased (+0.5%), in line with the previous year slight growth (+0.6%) after several years of negative trend (-5.1% over the period 2010-2013)
• Motor business represents 52% of the overall non-life business• In 2015, the non-life sector achieved a €4.1bn positive technical result driven by claims
cost reduction. The underwriting result was 12.7% (in line with FY14) of total non-life written premiums
• Decrease in claims occurred over the period 2011 – 2015 (CAGR11-15: -6.7%), resulting in policy price reductions
• There is lack of penetration and development of non-motor lines of business compared to other European countries
• With Solvency II the non-life segment reveals the need of a overall capital strengthening, as the solvency capital ratio is estimated to decrease by 21.2%
€ million FY11 FY12 FY13 FY14 FY15
Gross written premiums 36,359 35,413 33,690 32,800 32,002
Change in reserves 35,836 35,886 34,441 33,188 32,182
Incurred claims (26,462) (25,793) (22,400) (21,201) (20,023)
General expenses (8,761) (8,504) (8,433) (8,599) (8,702)
Investment income 604 1,607 1,202 1,278 1,196
Other technical income (charges) (591) (663) (605) (527) (599)
Technical result 626 2,533 4,205 4,139 4,054
Reinsurance result (554) 537 (772) (600) (410)
Net technical result 72 3,070 3,433 3,539 3,644
PwC
20,652
5,208 4,989
2,933 2,577
20,190
5,113 4,917
2,939 2,254
18,644
5,031 4,947
2,848 2,221
17,567
5,030 5,072
2,831 2,301
16,642
5,105 5,019
2,871 2,364
Motor Accident & Sickness Fire & other damages General TPL Other
€m
illi
on
FY11 FY12 FY13 FY14 FY15
36,35935,413
33,69032,800
32,002
FY11 FY12 FY13 FY14 FY15
€m
illi
on
2011/2015 Italian market non-life GWP
Italian non-life insurance market trend
Section 3 – Italian non-life insurance market
20
2011/2015 Breakdown of GWP by LoBs
2011/2015 Split between motor and non-motor LoB
Source: PwC analysis on IVASS data
Source: PwC analysis on IVASS data
Source: PwC analysis on IVASS data
56.8% 57.0% 55.3% 53.6% 52.0%
43.2% 43.0% 44.7% 46.4% 48.0%
FY11 FY12 FY13 FY14 FY15
Motor Non-Motor
PwC
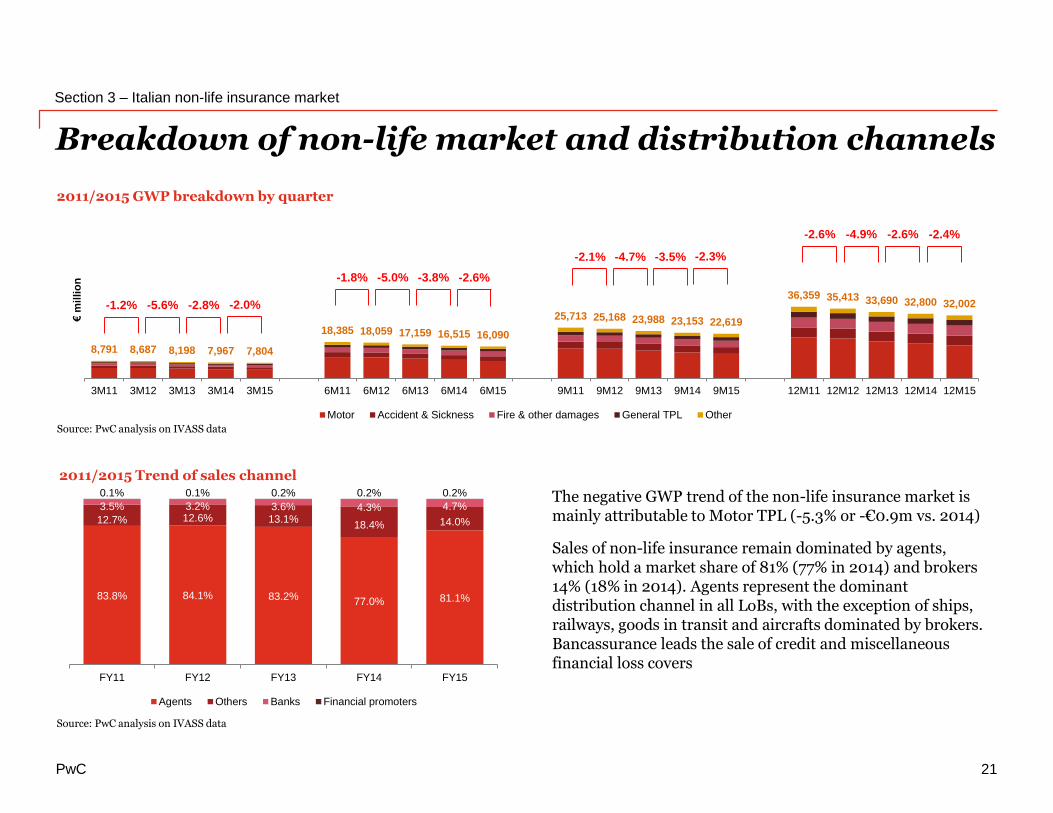
8,791 8,687 8,198 7,967 7,804
18,385 18,059 17,159 16,515 16,090
25,713 25,168 23,988 23,153 22,619
36,359 35,413 33,690 32,800 32,002
3M11 3M12 3M13 3M14 3M15 6M11 6M12 6M13 6M14 6M15 9M11 9M12 9M13 9M14 9M15 12M11 12M12 12M13 12M14 12M15
€m
illi
on
Motor Accident & Sickness Fire & other damages General TPL Other
-2.6%
-2.1%
-1.8%
Breakdown of non-life market and distribution channels
Section 3 – Italian non-life insurance market
21
2011/2015 Trend of sales channel
2011/2015 GWP breakdown by quarter
-1.2% -5.6% -2.8%
-3.8%-5.0%
-3.5%-4.7%
-2.6%-4.9%
Source: PwC analysis on IVASS data
Source: PwC analysis on IVASS data
-2.0%
-2.6%
-2.3%
-2.4%
83.8% 84.1% 83.2%77.0% 81.1%
12.7% 12.6% 13.1%18.4% 14.0%
3.5% 3.2% 3.6% 4.3% 4.7%
0.1% 0.1% 0.2% 0.2% 0.2%
FY11 FY12 FY13 FY14 FY15
Agents Others Banks Financial promoters
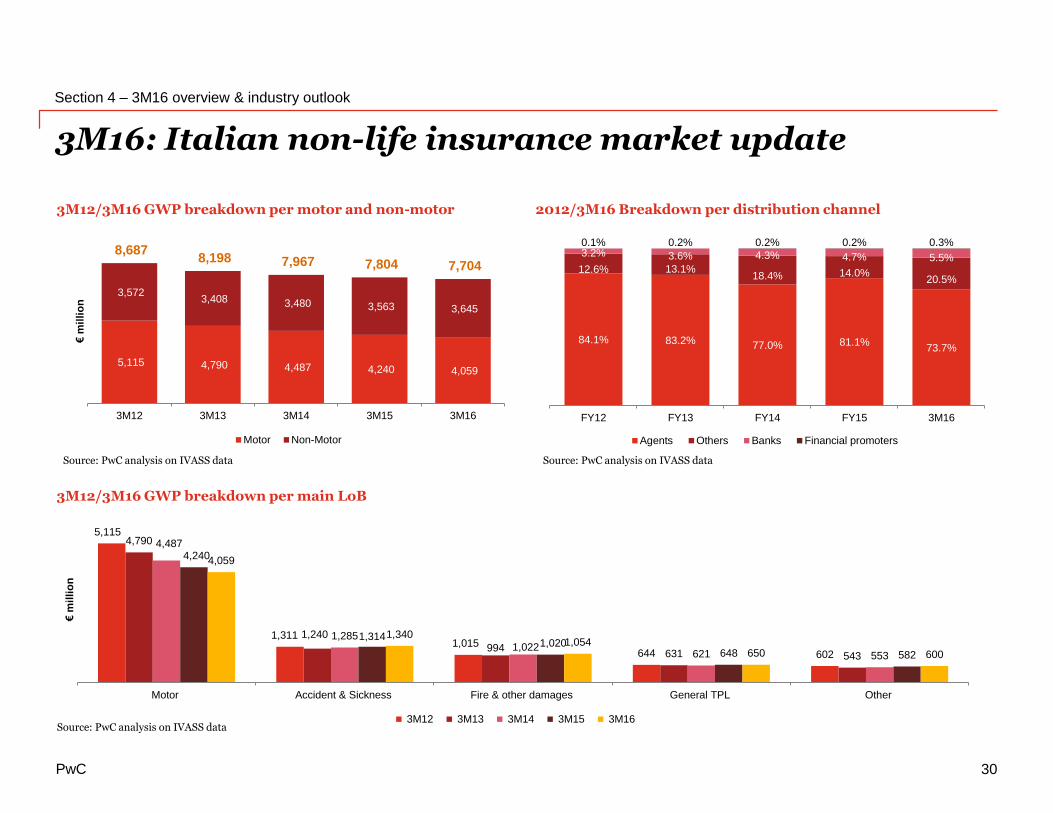
The negative GWP trend of the non-life insurance market is mainly attributable to Motor TPL (-5.3% or -€0.9m vs. 2014)
Sales of non-life insurance remain dominated by agents, which hold a market share of 81% (77% in 2014) and brokers 14% (18% in 2014). Agents represent the dominant distribution channel in all LoBs, with the exception of ships, railways, goods in transit and aircrafts dominated by brokers. Bancassurance leads the sale of credit and miscellaneous financial loss covers
PwC
Direct sales keep on growing
Section 3 – Italian non-life insurance market
22
€ million Genialloyd Direct Line Genertel LinearZurich
ConnectQuixa Dialogo
Totalby LoB
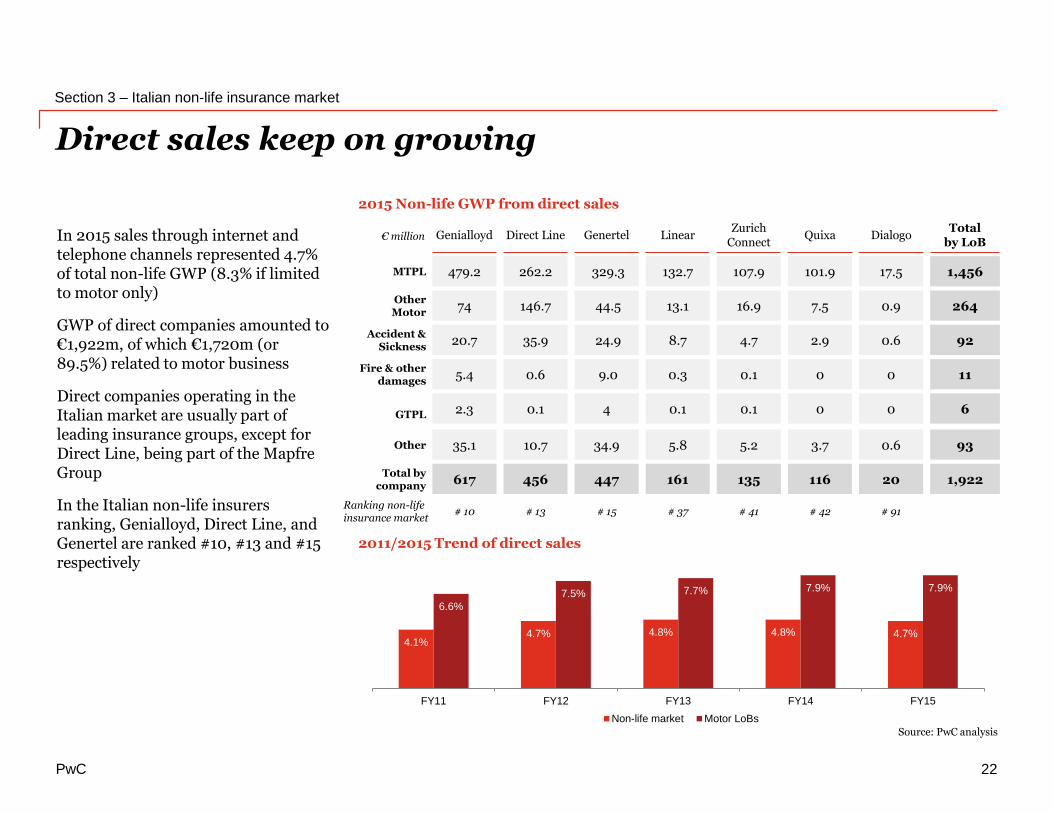
479.2 262.2 107.9132.7329.3 101.9 17.5 1,456MTPL
74 146.7 16.913.144.5 7.5 0.9 264Other Motor
20.7 35.9 4.78.724.9 2.9 0.6 92Accident &
Sickness
5.4 0.6 0.10.39.0 0 0 11Fire & other
damages
2.3 0.1 0.10.14 0 0 6GTPL
35.1 10.7 5.25.834.9 3.7 0.6 93Other
617 456 135161447 116 20 1,922Total by
company
Ranking non-life insurance market
# 10 # 13 # 15 # 37 # 41 # 42 # 91
2015 Non-life GWP from direct sales
2011/2015 Trend of direct sales
Source: PwC analysis
4.1%4.7% 4.8% 4.8% 4.7%
6.6%
7.5% 7.7% 7.9% 7.9%
FY11 FY12 FY13 FY14 FY15
Non-life market Motor LoBs
In 2015 sales through internet and telephone channels represented 4.7% of total non-life GWP (8.3% if limited to motor only)
GWP of direct companies amounted to €1,922m, of which €1,720m (or 89.5%) related to motor business
Direct companies operating in the Italian market are usually part of leading insurance groups, except for Direct Line, being part of the Mapfre Group
In the Italian non-life insurers ranking, Genialloyd, Direct Line, and Genertel are ranked #10, #13 and #15 respectively
PwC
Expense, loss and combined ratios
Section 3 – Italian non-life insurance market
23
2011/2015 Combined ratio
2015 Expense, loss and combined ratios by LoB
Source: ANIA
Source: ANIA
35.0% 25.8% 29.9% 23.1% 19.3% 18.4% 29.2% 32.6% 31.7% 21.5% 15.7% 31.8% 29.3% 34.3% 44.1% 36.8% 32.6%
41.4% 65.5% 58.1% 20.1% 35.4%
83.8% 41.9%
56.2% 60.4% 72.1%
(88.4%)
54.7% 84.4% 76.7%
34.0% 26.7% 32.0%
76.3% 91.2% 87.9%
43.1% 54.7%
102.2%
71.0% 88.7% 92.1% 93.6%
(72.7%)
86.5%
113.7% 111.0%
78.1% 63.5% 64.6%
Accident Sickness Landvehicles
Railwayrollingstocks
Aircraft Ships Goods intransit
Fire andnaturalforces
Otherdamage toproperty
Motorvehicle +
Shipsliability
Aircraftliability
General TPL Credit Suretyship Financialloss
Legalexpenses
Assistance
Loss ratio Expense ratio
24.1% 24.0% 25.0% 26.2% 27.2%
73.8% 71.9% 65.0% 63.9% 62.2%
97.9% 95.9% 90.1% 90.1% 89.4%
FY11 FY12 FY13 FY14 FY15
Expense ratio Loss ratio
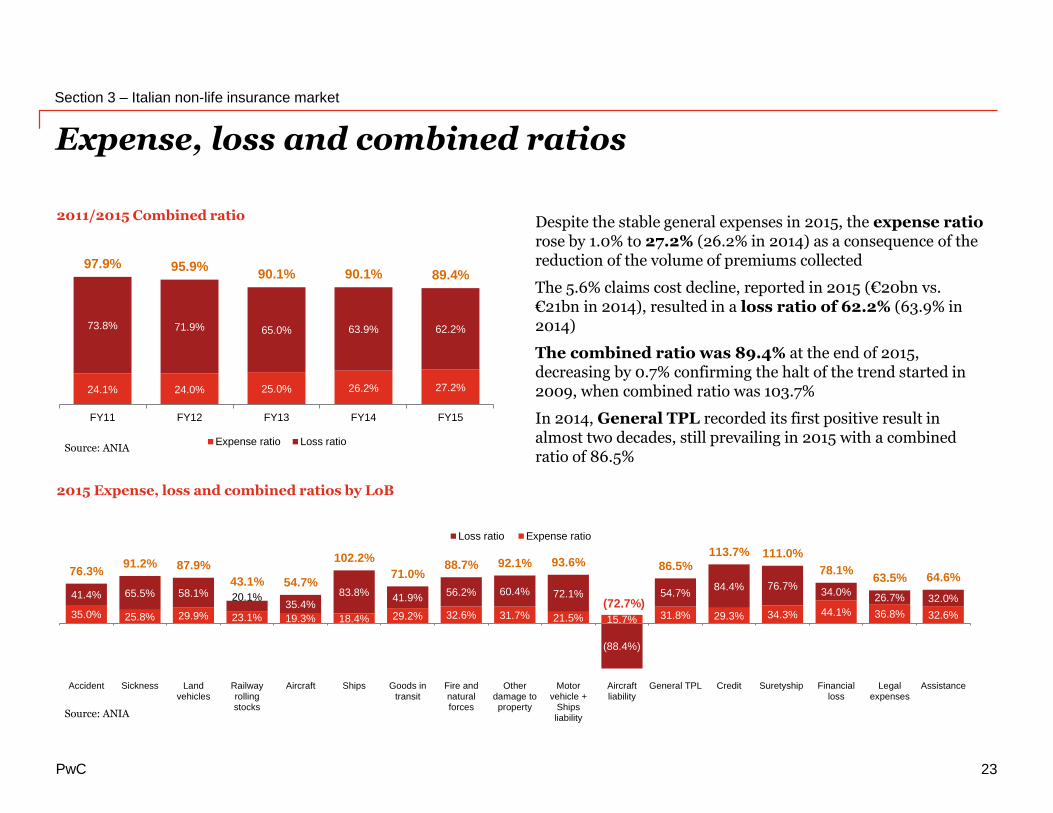
Despite the stable general expenses in 2015, the expense ratio rose by 1.0% to 27.2% (26.2% in 2014) as a consequence of the reduction of the volume of premiums collected
The 5.6% claims cost decline, reported in 2015 (€20bn vs. €21bn in 2014), resulted in a loss ratio of 62.2% (63.9% in 2014)
The combined ratio was 89.4% at the end of 2015, decreasing by 0.7% confirming the halt of the trend started in 2009, when combined ratio was 103.7%
In 2014, General TPL recorded its first positive result in almost two decades, still prevailing in 2015 with a combined ratio of 86.5%
PwC
Non-life insurance solvency margin
Section 3 – Italian non-life insurance market
24
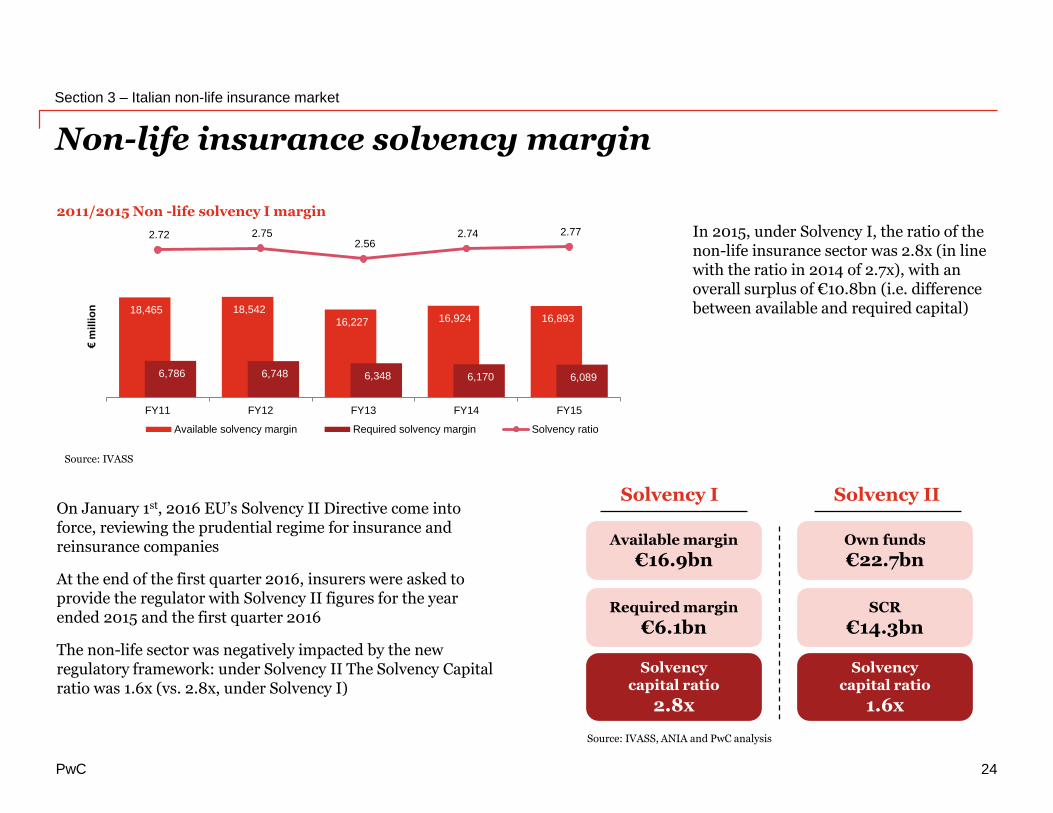
In 2015, under Solvency I, the ratio of the non-life insurance sector was 2.8x (in line with the ratio in 2014 of 2.7x), with an overall surplus of €10.8bn (i.e. difference between available and required capital)
On January 1st, 2016 EU’s Solvency II Directive come into force, reviewing the prudential regime for insurance and reinsurance companies
At the end of the first quarter 2016, insurers were asked to provide the regulator with Solvency II figures for the year ended 2015 and the first quarter 2016
The non-life sector was negatively impacted by the new regulatory framework: under Solvency II The Solvency Capital ratio was 1.6x (vs. 2.8x, under Solvency I)
Available margin
€16.9bn
Required margin
€6.1bn
Own funds
€22.7bn
SCR
€14.3bn
Solvencycapital ratio
2.8x
Solvencycapital ratio
1.6x
18,465 18,542
16,227 16,924 16,893
6,786 6,748 6,348 6,170 6,089
2.72 2.75 2.56
2.74 2.77
0.0
0.5
1.0
1.5
2.0
2.5
3.0
-
5,000
10,000
15,000
20,000
25,000
30,000
FY11 FY12 FY13 FY14 FY15
€m
illi
on
Available solvency margin Required solvency margin Solvency ratio
2011/2015 Non -life solvency I margin
Source: IVASS
Source: IVASS, ANIA and PwC analysis
Solvency I Solvency II
PwC
Section 3 – Italian non-life insurance market
25
Focus: Motor GWP shows a declining trend (1/2)GWP is decreasing due to the drop in average MTPL tariffs
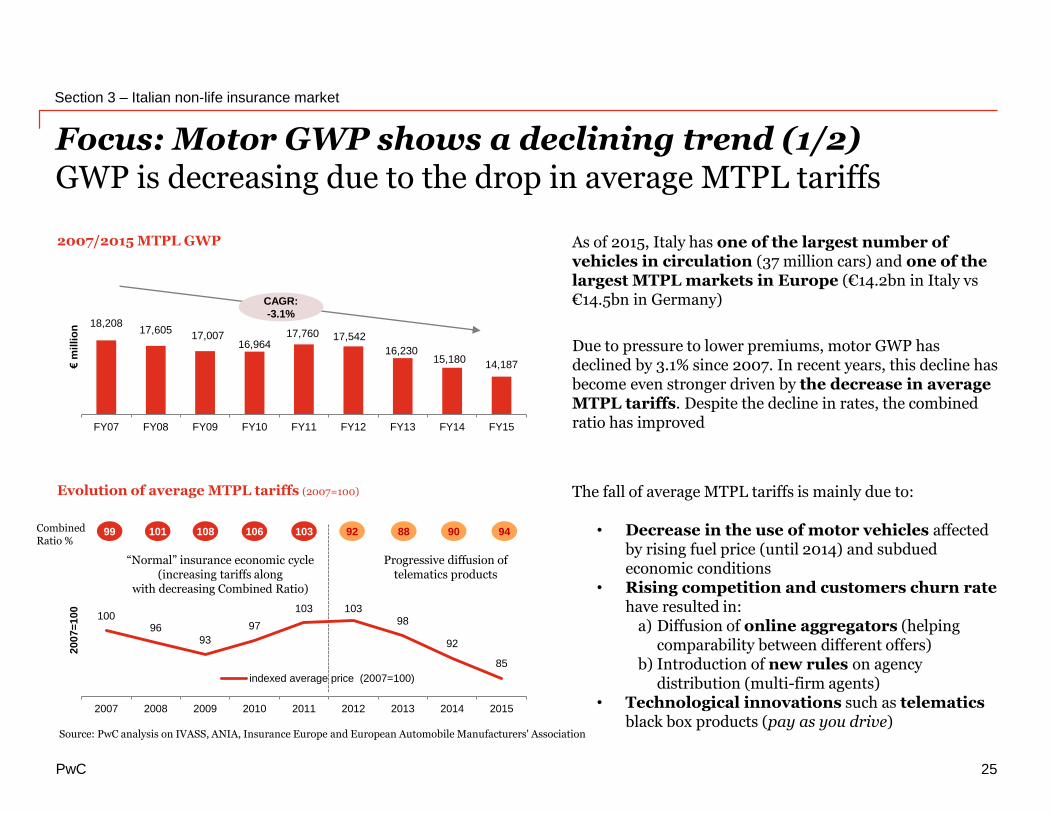
As of 2015, Italy has one of the largest number of vehicles in circulation (37 million cars) and one of the largest MTPL markets in Europe (€14.2bn in Italy vs €14.5bn in Germany)
Due to pressure to lower premiums, motor GWP has declined by 3.1% since 2007. In recent years, this decline has become even stronger driven by the decrease in average MTPL tariffs. Despite the decline in rates, the combined ratio has improved
2007/2015 MTPL GWP
Evolution of average MTPL tariffs (2007=100)
18,20817,605
17,00716,964
17,760 17,542
16,23015,180
14,187
FY07 FY08 FY09 FY10 FY11 FY12 FY13 FY14 FY15
€m
illi
on
The fall of average MTPL tariffs is mainly due to:
• Decrease in the use of motor vehicles affected by rising fuel price (until 2014) and subdued economic conditions
• Rising competition and customers churn ratehave resulted in:
a) Diffusion of online aggregators (helping comparability between different offers)
b) Introduction of new rules on agency distribution (multi-firm agents)
• Technological innovations such as telematics black box products (pay as you drive)
Source: PwC analysis on IVASS, ANIA, Insurance Europe and European Automobile Manufacturers' Association
99 101 108 106 103 92 88 90
CAGR:
-3.1%
Combined Ratio %
Progressive diffusion of telematics products
“Normal” insurance economic cycle (increasing tariffs along
with decreasing Combined Ratio)
10096
93
97
103 10398
92
85
2007 2008 2009 2010 2011 2012 2013 2014 2015
2007=
100
indexed average price (2007=100)
94
PwC
Focus: Motor GWP shows a declining trend (2/2) The progressive diffusion of “Black Box” is one of the key drivers
Section 3 – Italian non-life insurance market
26
Source: IVASS
Average MTPL tariffs by Region (2015)
Campania€586
Medium average premium
Lowest average premium
Black box agreement rate between 10% and 15%
Black box agreement rate <10%
Black box agreement rate >15%
Highest average premium
Black box contracts diffusion by Region (2015)
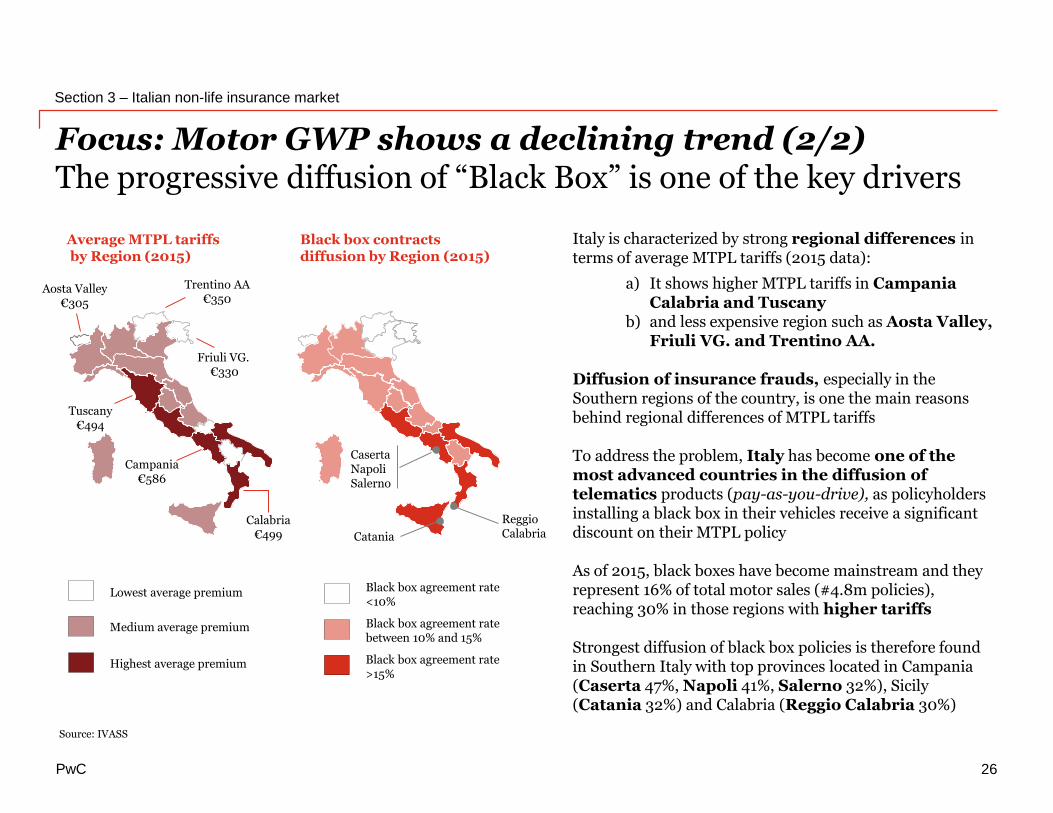
Italy is characterized by strong regional differences in terms of average MTPL tariffs (2015 data):
a) It shows higher MTPL tariffs in Campania Calabria and Tuscany
b) and less expensive region such as Aosta Valley, Friuli VG. and Trentino AA.
Diffusion of insurance frauds, especially in the Southern regions of the country, is one the main reasons behind regional differences of MTPL tariffs
To address the problem, Italy has become one of the most advanced countries in the diffusion of telematics products (pay-as-you-drive), as policyholders installing a black box in their vehicles receive a significant discount on their MTPL policy
As of 2015, black boxes have become mainstream and they represent 16% of total motor sales (#4.8m policies), reaching 30% in those regions with higher tariffs
Strongest diffusion of black box policies is therefore found in Southern Italy with top provinces located in Campania (Caserta 47%, Napoli 41%, Salerno 32%), Sicily (Catania 32%) and Calabria (Reggio Calabria 30%)
Friuli VG.€330
Calabria€499
Aosta Valley€305
Tuscany€494
CasertaNapoliSalerno
Reggio CalabriaCatania
Trentino AA€350
PwC
3M16 overview & industry outlook
The Italian Insurance Market • 2015 figures + 3M16 overview
27
PwC
17,251 20,29727,493
31,972 30,331
8,6878,198
7,967
7,8047,704
25,93728,495
35,46039,776 38,035
3M12 3M13 3M14 3M15 3M16
€m
illi
on
Life Non-Life
47% 53%
3M16: Insurance market trend update
Section 4 – 3M16 overview & industry outlook
28
3M16 Italian Life & non-Life GWP breakdown per LoB
3M12/3M16 Italian market GWP
Life€30.3bn
Non-life€7.7bn
74%
21%
4% 2%
Traditional productsUnit & Index linkedCapitalizationsOthers (Mutual funds & Sickness)
58%
42%
Non-life market - Breakdown per motor and non-motor 3M13
Motor
Non-Motor
Source: PwC analysis on IVASS data
Source: PwC analysis on IVASS data
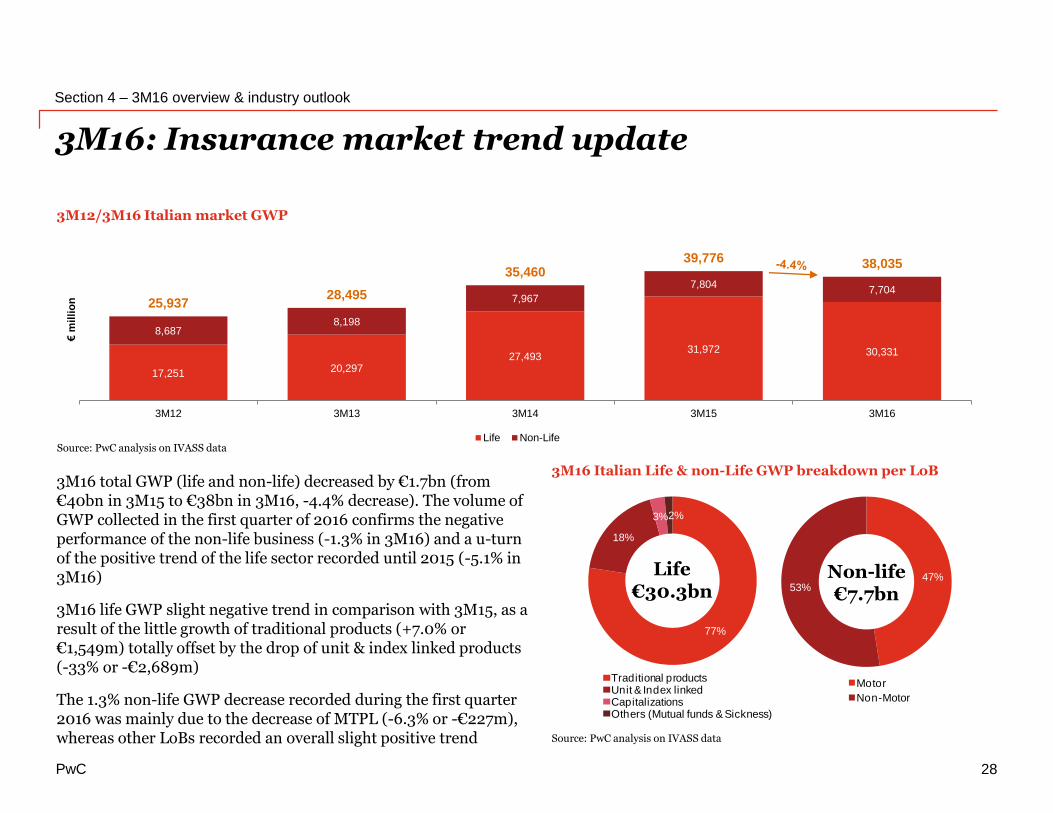
3M16 total GWP (life and non-life) decreased by €1.7bn (from €40bn in 3M15 to €38bn in 3M16, -4.4% decrease). The volume of GWP collected in the first quarter of 2016 confirms the negative performance of the non-life business (-1.3% in 3M16) and a u-turnof the positive trend of the life sector recorded until 2015 (-5.1% in 3M16)
3M16 life GWP slight negative trend in comparison with 3M15, as a result of the little growth of traditional products (+7.0% or €1,549m) totally offset by the drop of unit & index linked products(-33% or -€2,689m)
The 1.3% non-life GWP decrease recorded during the first quarter 2016 was mainly due to the decrease of MTPL (-6.3% or -€227m), whereas other LoBs recorded an overall slight positive trend
77%
18%
3% 2%

PwC
73%
76%
75%
68%
78%
27%
24%
25%
32%
22%
0% 20% 40% 60% 80% 100%
FY12
FY13
FY14
FY15
3M16
Traditional contracts Investment contracts
3M16: Italian life insurance market update
Section 4 – 3M16 overview & industry outlook
29
2012/3M16 Breakdown per channel2012/3M16 Breakdown per type of policies
Source: PwC analysis on IVASS data
Source: PwC analysis on IVASS data
26.6% 23.0% 20.2% 21.2% 18.3%
1.5% 1.2% 1.0% 0.5% 1.7%
48.6% 59.1% 62.0% 69.9%
64.8%
23.3% 16.7% 16.8%
8.5% 15.2%
FY12 FY13 FY14 FY15 3M16
Agents Others Banks Financial promoters
3M12/3M16 Life GWP quarter breakdown per LoB
13,043
3,074
691 443
14,981
4,183
769 364
22,345
3,856
940 354
21,945
8,208
1,403418
23,494
5,519
856 461
Traditional products Unit & Index linked Capitalisations Others (Mutual funds & Sickness)
€m
illi
on
3M12 3M13 3M14 3M15 3M16
PwC
5,115 4,790 4,487 4,240 4,059
3,572 3,408 3,480 3,563 3,645
8,687 8,198 7,967 7,804 7,704
3M12 3M13 3M14 3M15 3M16
€m
illi
on
Motor Non-Motor
5,115
1,3111,015
644 602
4,790
1,240
994631 543
4,487
1,2851,022
621 553
4,240
1,3141,020
648 582
4,059
1,3401,054
650 600
Motor Accident & Sickness Fire & other damages General TPL Other
€m
illi
on
3M12 3M13 3M14 3M15 3M16
3M16: Italian non-life insurance market update
Section 4 – 3M16 overview & industry outlook
30
2012/3M16 Breakdown per distribution channel
3M12/3M16 GWP breakdown per main LoB
3M12/3M16 GWP breakdown per motor and non-motor
Source: PwC analysis on IVASS data
Source: PwC analysis on IVASS data
Source: PwC analysis on IVASS data
84.1% 83.2% 77.0% 81.1%73.7%
12.6% 13.1%18.4% 14.0%
20.5%
3.2% 3.6% 4.3% 4.7% 5.5%
0.1% 0.2% 0.2% 0.2% 0.3%
FY12 FY13 FY14 FY15 3M16
Agents Others Banks Financial promoters
PwC
Industry outlook
Section 4 – 3M16 overview & industry outlook
31
2016 Non-life GWP outlook
2016 Life GWP outlook
Source: PwC analysis on ANIA data
Source: PwC analysis on ANIA data
114,950
104,653
Actual
2015
30,331
Forecast
2016
Actual
3M16
-5.1%
vs. 3M15
€m
illio
n
Actual
2015
Forecast
2016
Actual
3M16
32,00231,846
7,704
-1.3%
vs. 3M15
29% of 2016 forecast
24% of 2016 forecast
€m
illio
n
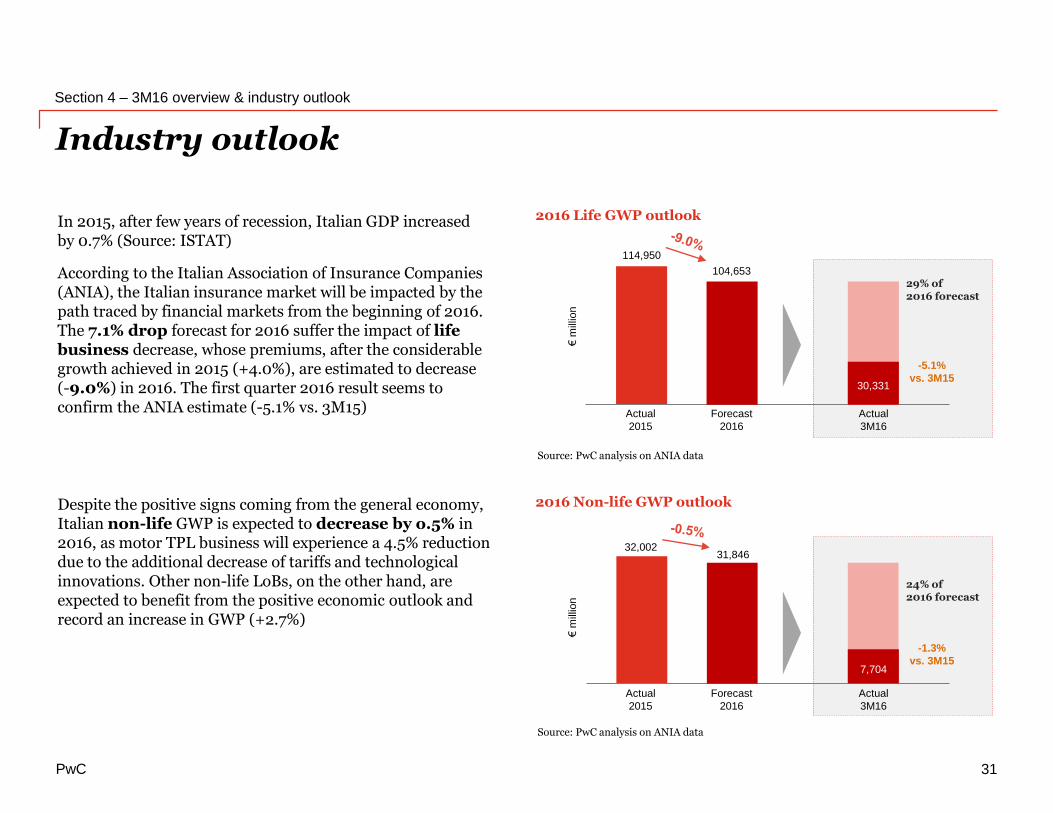
In 2015, after few years of recession, Italian GDP increased by 0.7% (Source: ISTAT)
According to the Italian Association of Insurance Companies (ANIA), the Italian insurance market will be impacted by the path traced by financial markets from the beginning of 2016. The 7.1% drop forecast for 2016 suffer the impact of life business decrease, whose premiums, after the considerable growth achieved in 2015 (+4.0%), are estimated to decrease (-9.0%) in 2016. The first quarter 2016 result seems to confirm the ANIA estimate (-5.1% vs. 3M15)
Despite the positive signs coming from the general economy, Italian non-life GWP is expected to decrease by o.5% in 2016, as motor TPL business will experience a 4.5% reduction due to the additional decrease of tariffs and technological innovations. Other non-life LoBs, on the other hand, are expected to benefit from the positive economic outlook and record an increase in GWP (+2.7%)

PwC
M&A activity
The Italian Insurance Market • 2015 figures + 3M16 overview
32
PwC
M&A Transactions
Section 5 – M&A activity
33
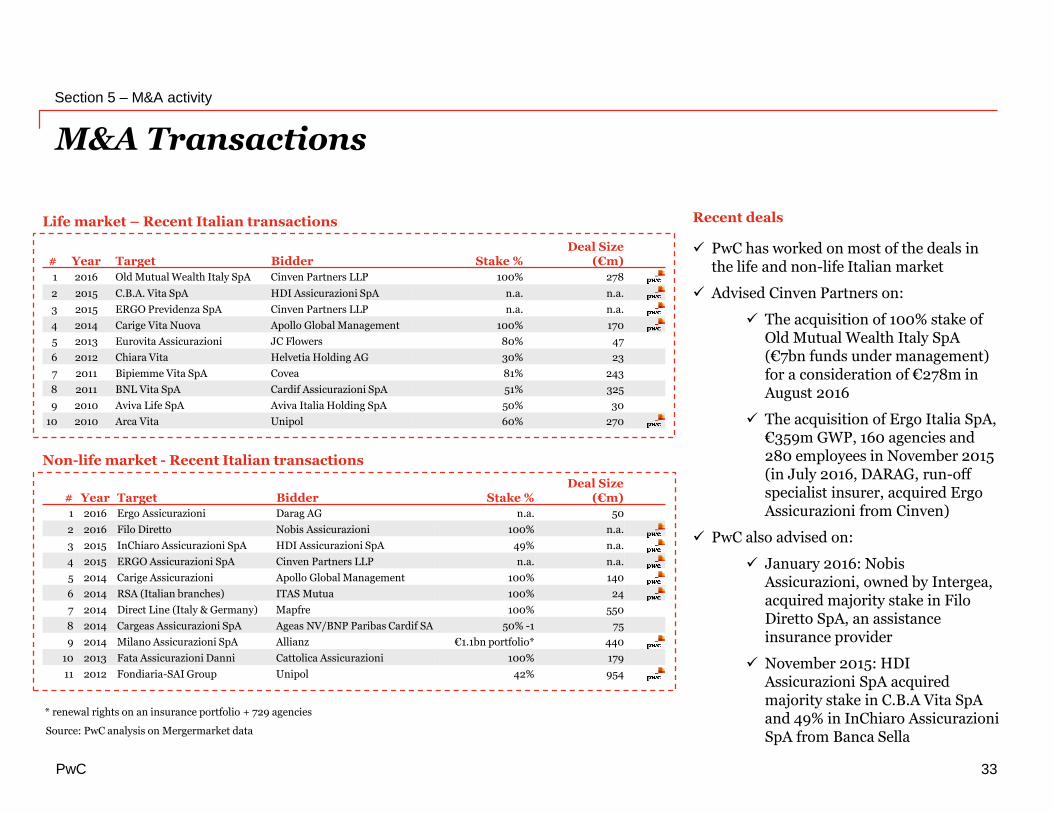
# Year Target Bidder Stake %Deal Size
(€m)
1 2016 Old Mutual Wealth Italy SpA Cinven Partners LLP 100% 278
2 2015 C.B.A. Vita SpA HDI Assicurazioni SpA n.a. n.a.
3 2015 ERGO Previdenza SpA Cinven Partners LLP n.a. n.a.
4 2014 Carige Vita Nuova Apollo Global Management 100% 170
5 2013 Eurovita Assicurazioni JC Flowers 80% 47
6 2012 Chiara Vita Helvetia Holding AG 30% 23
7 2011 Bipiemme Vita SpA Covea 81% 243
8 2011 BNL Vita SpA Cardif Assicurazioni SpA 51% 325
9 2010 Aviva Life SpA Aviva Italia Holding SpA 50% 30
10 2010 Arca Vita Unipol 60% 270
Life market – Recent Italian transactions
Non-life market - Recent Italian transactions
Source: PwC analysis on Mergermarket data
# Year Target Bidder Stake %Deal Size
(€m)
1 2016 Ergo Assicurazioni Darag AG n.a. 50
2 2016 Filo Diretto Nobis Assicurazioni 100% n.a.
3 2015 InChiaro Assicurazioni SpA HDI Assicurazioni SpA 49% n.a.
4 2015 ERGO Assicurazioni SpA Cinven Partners LLP n.a. n.a.
5 2014 Carige Assicurazioni Apollo Global Management 100% 140
6 2014 RSA (Italian branches) ITAS Mutua 100% 24
7 2014 Direct Line (Italy & Germany) Mapfre 100% 550
8 2014 Cargeas Assicurazioni SpA Ageas NV/BNP Paribas Cardif SA 50% -1 75
9 2014 Milano Assicurazioni SpA Allianz €1.1bn portfolio* 440
10 2013 Fata Assicurazioni Danni Cattolica Assicurazioni 100% 179
11 2012 Fondiaria-SAI Group Unipol 42% 954
* renewal rights on an insurance portfolio + 729 agencies
Recent deals
PwC has worked on most of the deals in the life and non-life Italian market
Advised Cinven Partners on:
The acquisition of 100% stake of Old Mutual Wealth Italy SpA (€7bn funds under management) for a consideration of €278m in August 2016
The acquisition of Ergo Italia SpA, €359m GWP, 160 agencies and 280 employees in November 2015 (in July 2016, DARAG, run-off specialist insurer, acquired Ergo Assicurazioni from Cinven)
PwC also advised on:
January 2016: Nobis Assicurazioni, owned by Intergea, acquired majority stake in Filo Diretto SpA, an assistance insurance provider
November 2015: HDI Assicurazioni SpA acquired majority stake in C.B.A Vita SpA and 49% in InChiaro Assicurazioni SpA from Banca Sella
PwC
The Italian insurance market in the European context
The Italian Insurance Market • 2015 figures + 3M16 overview
34
PwC
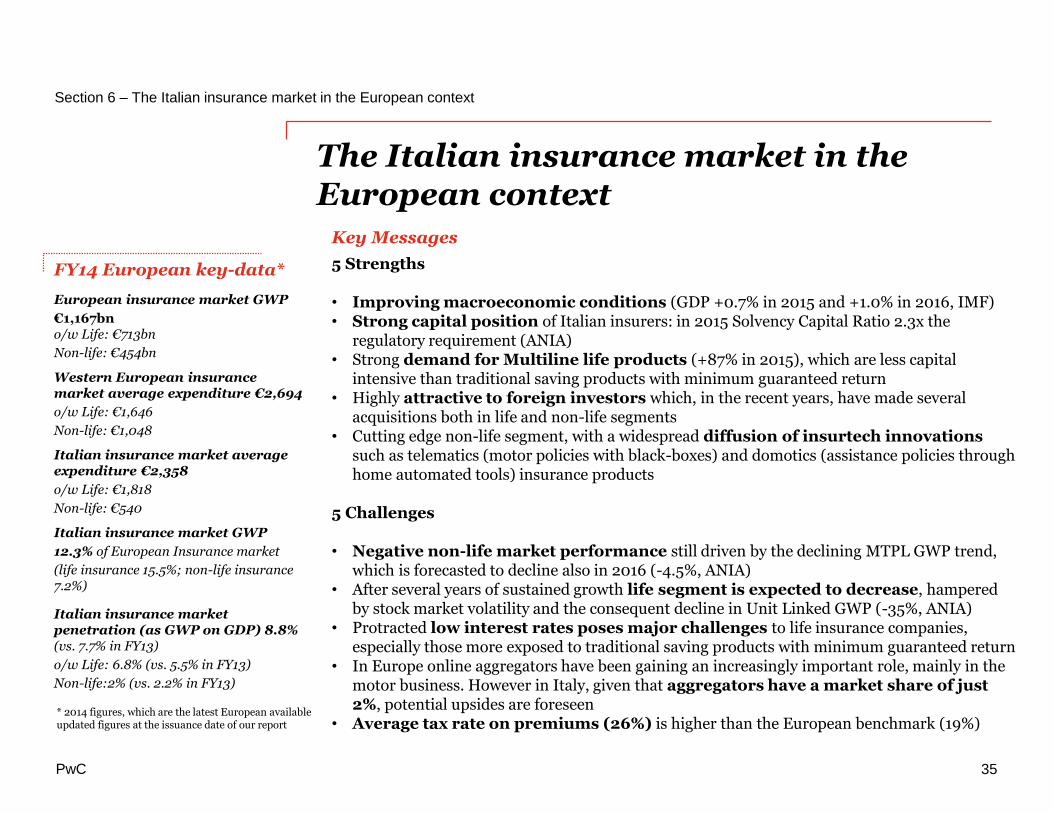
FY14 European key-data*
European insurance market GWP
€1,167bno/w Life: €713bn
Non-life: €454bn
Western European insurance market average expenditure €2,694
o/w Life: €1,646
Non-life: €1,048
Italian insurance market average expenditure €2,358
o/w Life: €1,818
Non-life: €540
Italian insurance market GWP
12.3% of European Insurance market
(life insurance 15.5%; non-life insurance 7.2%)
Italian insurance market penetration (as GWP on GDP) 8.8% (vs. 7.7% in FY13)
o/w Life: 6.8% (vs. 5.5% in FY13)
Non-life:2% (vs. 2.2% in FY13)
Section 6 – The Italian insurance market in the European context
35
The Italian insurance market in the European context
Key Messages
5 Strengths
• Improving macroeconomic conditions (GDP +0.7% in 2015 and +1.0% in 2016, IMF)• Strong capital position of Italian insurers: in 2015 Solvency Capital Ratio 2.3x the
regulatory requirement (ANIA)• Strong demand for Multiline life products (+87% in 2015), which are less capital
intensive than traditional saving products with minimum guaranteed return• Highly attractive to foreign investors which, in the recent years, have made several
acquisitions both in life and non-life segments• Cutting edge non-life segment, with a widespread diffusion of insurtech innovations
such as telematics (motor policies with black-boxes) and domotics (assistance policies through home automated tools) insurance products
5 Challenges
• Negative non-life market performance still driven by the declining MTPL GWP trend, which is forecasted to decline also in 2016 (-4.5%, ANIA)
• After several years of sustained growth life segment is expected to decrease, hampered by stock market volatility and the consequent decline in Unit Linked GWP (-35%, ANIA)
• Protracted low interest rates poses major challenges to life insurance companies, especially those more exposed to traditional saving products with minimum guaranteed return
• In Europe online aggregators have been gaining an increasingly important role, mainly in the motor business. However in Italy, given that aggregators have a market share of just 2%, potential upsides are foreseen
• Average tax rate on premiums (26%) is higher than the European benchmark (19%)* 2014 figures, which are the latest European available updated figures at the issuance date of our report
PwC
90 74 70 85111
0
143 124 113 119 129
0
90 87 87 91 94
022 22 19 18 17 0
27 30 27 26 250
159 167 173 184 17636
36 3534
33
0
6264 66 67
68
0
88 91 94 97 99
0
56 57 56 57 56
0
29 30 30 29 29
0
67 67 6969
66
126110 105
119143
205188 179 186 197
179 178 182 187 193
78 79 75 75 7456 60 57 55 54
227 234 242 253241
FY10 FY11 FY12 FY13 FY14 FY10 FY11 FY12 FY13 FY14 FY10 FY11 FY12 FY13 FY14 FY10 FY11 FY12 FY13 FY14 FY10 FY11 FY12 FY13 FY14 FY10 FY11 FY12 FY13 FY14
€b
illi
on
Life market Non-life market
France Germany Netherlands Spain United KingdomItaly
European insurance market
Section 6 – The Italian insurance market in the European context
36
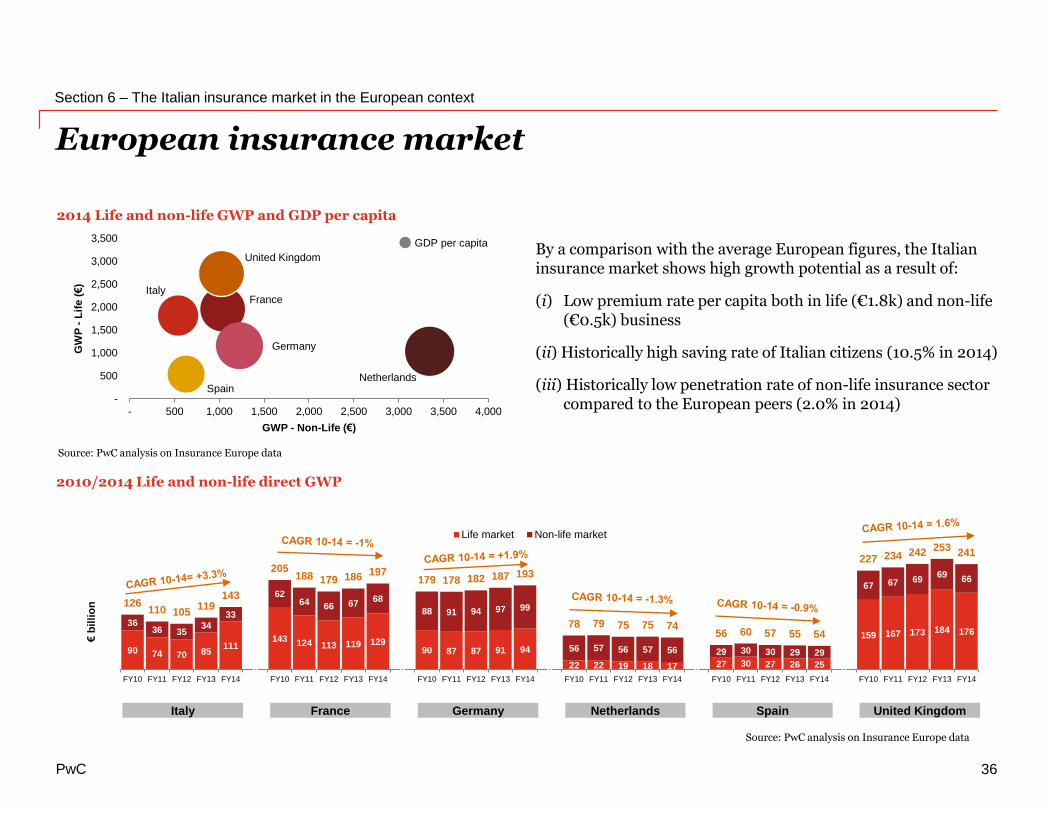
By a comparison with the average European figures, the Italian insurance market shows high growth potential as a result of:
(i) Low premium rate per capita both in life (€1.8k) and non-life (€0.5k) business
(ii) Historically high saving rate of Italian citizens (10.5% in 2014)
(iii) Historically low penetration rate of non-life insurance sector compared to the European peers (2.0% in 2014)
2010/2014 Life and non-life direct GWP
2014 Life and non-life GWP and GDP per capita
Source: PwC analysis on Insurance Europe data
Source: PwC analysis on Insurance Europe data
GDP per capita
ItalyFrance
Germany
NetherlandsSpain
United Kingdom
-
500
1,000
1,500
2,000
2,500
3,000
3,500
- 500 1,000 1,500 2,000 2,500 3,000 3,500 4,000
GW
P -
Lif
e (
€)
GWP - Non-Life (€)
PwC
4.4%
5.6%
3.3% 3.2%2.6%
9.0%
5.5% 5.8%
3.3%2.9%
2.5%
8.5%
6.8%
6.0%
3.2%
2.4% 2.3%
n.a.
Italy France Germany Netherlands Spain UnitedKingdom
FY12 FY13 FY14
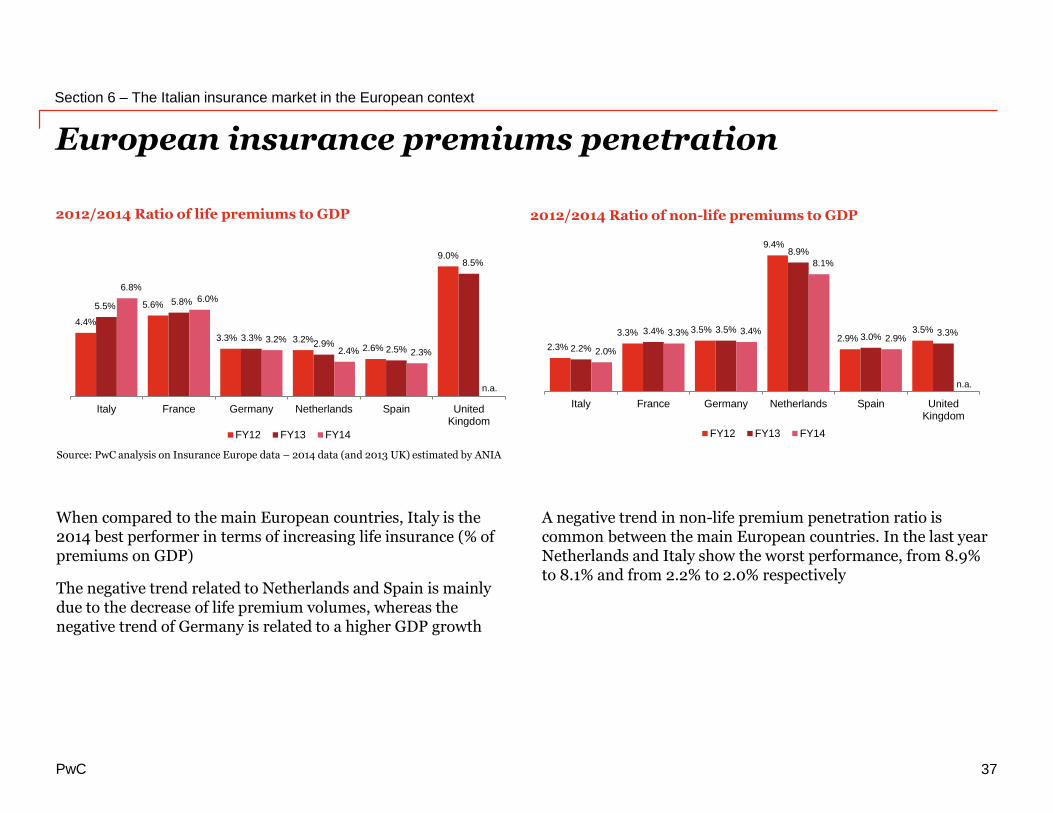
2012/2014 Ratio of non-life premiums to GDP
2.3%
3.3% 3.5%
9.4%
2.9%3.5%
2.2%
3.4% 3.5%
8.9%
3.0% 3.3%
2.0%
3.3% 3.4%
8.1%
2.9%
n.a.
Italy France Germany Netherlands Spain UnitedKingdom
FY12 FY13 FY14
European insurance premiums penetration
Section 6 – The Italian insurance market in the European context
37
2012/2014 Ratio of life premiums to GDP
When compared to the main European countries, Italy is the 2014 best performer in terms of increasing life insurance (% of premiums on GDP)
The negative trend related to Netherlands and Spain is mainly due to the decrease of life premium volumes, whereas the negative trend of Germany is related to a higher GDP growth
Source: PwC analysis on Insurance Europe data – 2014 data (and 2013 UK) estimated by ANIA
A negative trend in non-life premium penetration ratio is common between the main European countries. In the last year Netherlands and Italy show the worst performance, from 8.9% to 8.1% and from 2.2% to 2.0% respectively
PwC
Distribution channels
Section 6 – The Italian insurance market in the European context
38
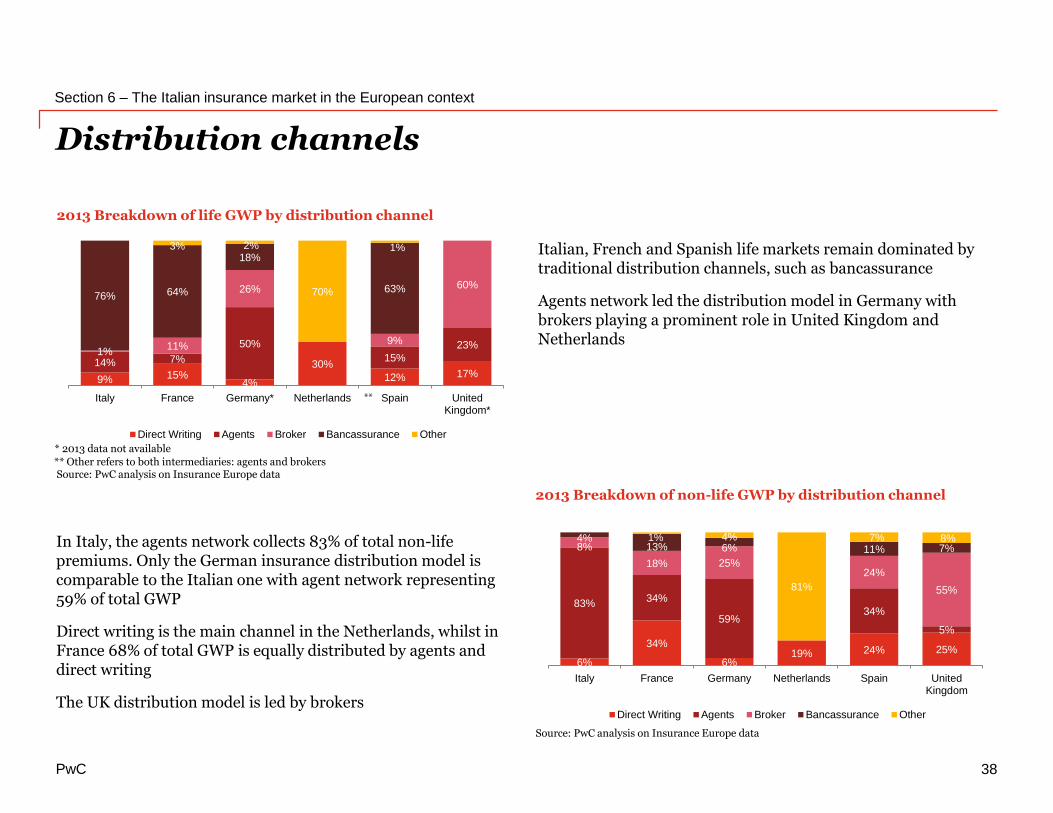
Italian, French and Spanish life markets remain dominated by traditional distribution channels, such as bancassurance
Agents network led the distribution model in Germany with brokers playing a prominent role in United Kingdom and Netherlands
In Italy, the agents network collects 83% of total non-life premiums. Only the German insurance distribution model iscomparable to the Italian one with agent network representing 59% of total GWP
Direct writing is the main channel in the Netherlands, whilst in France 68% of total GWP is equally distributed by agents and direct writing
The UK distribution model is led by brokers
2013 Breakdown of life GWP by distribution channel
2013 Breakdown of non-life GWP by distribution channel
Source: PwC analysis on Insurance Europe data
7%
6%
34%
6%19% 24% 25%
83%34%
59%34%
5%
8%
18% 25%24%
55%
4%13% 6% 11% 7%1% 4%
81%
7% 8%
Italy France Germany Netherlands Spain UnitedKingdom
Direct Writing Agents Broker Bancassurance Other
Source: PwC analysis on Insurance Europe data
* 2013 data not available
** Other refers to both intermediaries: agents and brokers
9% 15%4%
30%
12% 17%14% 7%
50%
15%
23%1%
11%
26%
9%
60%76% 64%
18%
63%
3% 2%
70%
1%
Italy France Germany* Netherlands Spain UnitedKingdom*
Direct Writing Agents Broker Bancassurance Other
**
PwC
Average GWP per insurance company
Section 6 – The Italian insurance market in the European context
39
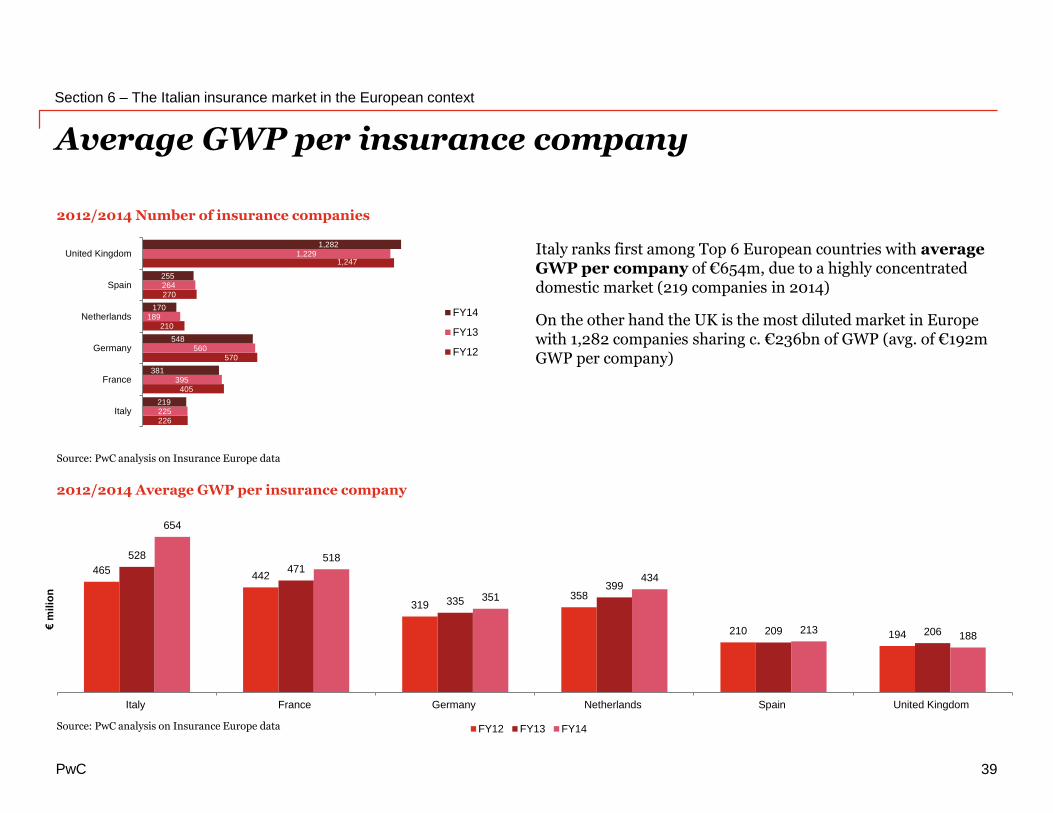
2012/2014 Number of insurance companies
2012/2014 Average GWP per insurance company
Italy ranks first among Top 6 European countries with average GWP per company of €654m, due to a highly concentrated domestic market (219 companies in 2014)
On the other hand the UK is the most diluted market in Europe with 1,282 companies sharing c. €236bn of GWP (avg. of €192m GWP per company)
Source: PwC analysis on Insurance Europe data
Source: PwC analysis on Insurance Europe data
226
405
570
210
270
1,247
225
395
560
189
264
1,229
219
381
548
170
255
1,282
Italy
France
Germany
Netherlands
Spain
United Kingdom
FY14
FY13
FY12
465442
319358
210 194
528
471
335
399
209 206
654
518
351
434
213188
Italy France Germany Netherlands Spain United Kingdom
€m
ilio
n
FY12 FY13 FY14
PwC
13.5% 13.7% 14.9% 14.3% 14.0% 14.2%
3.8% 3.3% 3.3% 3.1% 3.1% 3.1%
40.7% 40.5% 40.8% 42.1% 42.3% 42.7%
12.4% 12.0% 10.6% 11.0% 10.6% 9.9%
22.7% 24.0% 24.3% 23.4% 23.1% 23.4%
6.9% 6.6% 6.1% 6.1% 6.8% 6.6%
FY08 FY09 FY10 FY11 FY12 FY13
Equities and Participations Real Estate Bonds Loans Investment Funds Other
0.4 0.4 0.5 0.5 0.5
1.5 1.51.7 1.7
1.9
0.8 0.8 0.9 0.9 1.1
0.3 0.3 0.4 0.3 0.40.2 0.2 0.2 0.2 0.2
1.6 1.6 1.7 1.8 1.9
0.1 0.1 0.1 0.1 0.1
0.2 0.2
0.20.2
0.2
0.6 0.60.7 0.7
0.8
0.0 0.0 0.0 0.1 0.1
0.0 0.0 0.0 0.0 0.0
0.1 0.1 0.10.1
0.1
0.5 0.5 0.5 0.6 0.6
1.7 1.71.9
1.9
2.1
1.4 1.51.6 1.6
1.8
0.4 0.40.4 0.4 0.5
0.2 0.2 0.2 0.2 0.2
1.7 1.7 1.81.9 2.0
FY10 FY11 FY12 FY13 FY14 FY10 FY11 FY12 FY13 FY14 FY10 FY11 FY12 FY13 FY14 FY10 FY11 FY12 FY13 FY14 FY10 FY11 FY12 FY13 FY14 FY10 FY11 FY12 FY13 FY14
€tr
illi
on
Life market Non-life market
France Germany Netherlands Spain United KingdomItaly
Investments portfolio
Section 6 – The Italian insurance market in the European context
40
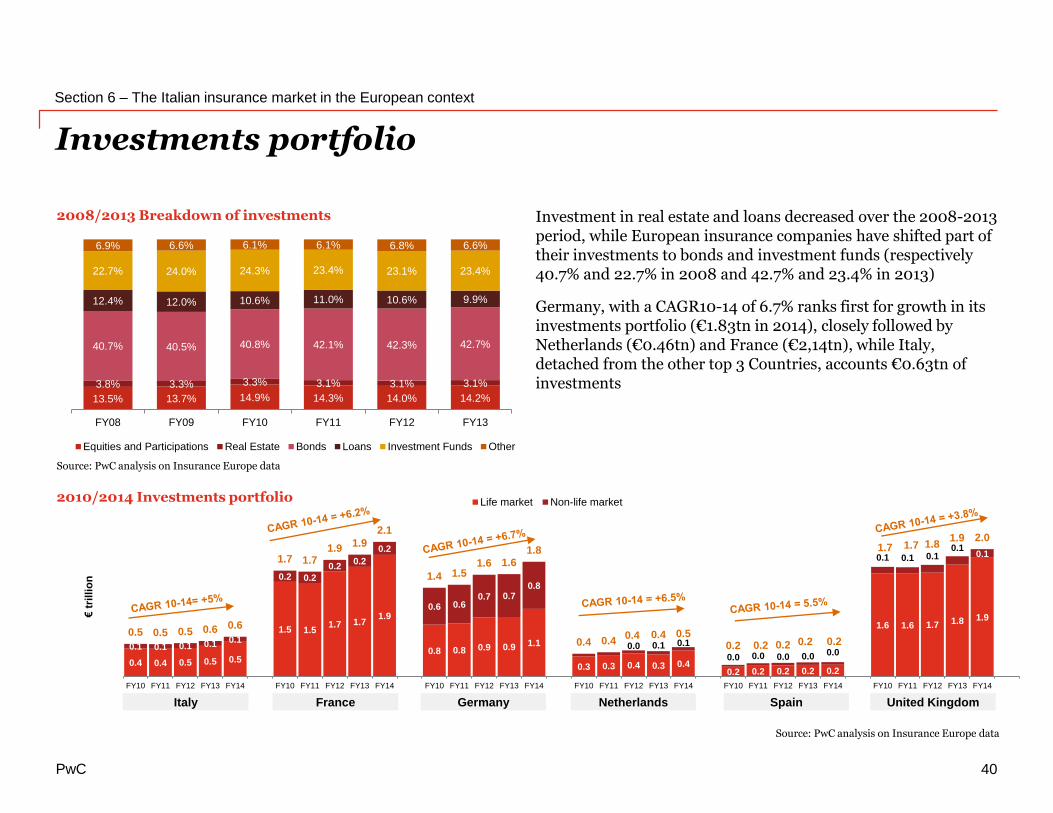
2008/2013 Breakdown of investments
2010/2014 Investments portfolio
Investment in real estate and loans decreased over the 2008-2013 period, while European insurance companies have shifted part of their investments to bonds and investment funds (respectively40.7% and 22.7% in 2008 and 42.7% and 23.4% in 2013)
Germany, with a CAGR10-14 of 6.7% ranks first for growth in its investments portfolio (€1.83tn in 2014), closely followed by Netherlands (€0.46tn) and France (€2,14tn), while Italy,detached from the other top 3 Countries, accounts €0.63tn of investments
Source: PwC analysis on Insurance Europe data
Source: PwC analysis on Insurance Europe data
Our contacts
© 2016 PricewaterhouseCoopers Advisory SpA. All rights reserved. In this document, “PwC” refers
to PricewaterhouseCoopers Advisory SpA which is a member firm of PricewaterhouseCoopers
International Limited, each member firm of which is a separate legal entity.
Emanuele GrassoPartner | Financial Services
+39 02 7785 372+39 348 [email protected]
Liana VojkollariSenior Manager | Financial Services
+39 02 7785 008+39 346 [email protected]
Gabriele PicutiSenior Associate | Financial Services
+39 345 [email protected]
Marco FalcheroDirector | Financial Services
+39 02 7785 951+39 335 [email protected]