the italian innovation system
DESCRIPTION
Italian system to develop high technology industryTRANSCRIPT

The Italian Innovation System
Paper Prepared for Project IFISE
By: Vittorio Modena, Patrizia Gattoni, Margherita Balconi, Paola Vita-Finzi
The University of Pavia
Pavia, June 2001

Modena V., P. Gattoni, M. Balconi, P. Vita-Finzi
1
TABLE OF CONTENTS TABLE OF CONTENTS 1
LIST OF FIGURES 2
LIST OF TABLES 2
1. INTRODUCTION 3 2. THE ITALIAN INNOVATION SYSTEM IN THE EUROPEAN CONTEXT 5 2.1 High-tech industry indicators 5 2.2 Industrial innovativeness indicators 11 2.3 Conclusion 15 3. FEATURES OF THE ITALIAN INNOVATION SYSTEM 16 3.1 General Features of the Italian innovation system 16 3.2 The R&D system 17 3.2.1 The University system 18 3.2.2 The government and public research institutions 19 3.3 The Italian industrial structure and the high-tech sectors 19 3.3.1 The Italian industrial structure 20 3.3.2 High-tech specialisation indicators 21 3.3.3 The electronics and telecommunication industry 24 3.3.4 The mechanical and industrial automation industry 24 3.3.5 The pharmaceutical industry 25 3.4 Summary 26 4. SKILLED MANPOWER AND POTENTIAL ENTREPRENEURS’ CONCENTRATIONS 27 4.1 Introduction 27 4.2 General industrial and R&D indicators per region 27 4.3 Skilled manpower and human resources distribution for high-tech sectors 29 4.4 Potential entrepreneurs’ concentrations 32 4.5 Summary 41
5. REFERENCES 45
Modena V., P. Gattoni, M. Balconi, P. Vita-Finzi
2
LIST OF FIGURES Figure 1.1: High-tech agglomeration process 3 Figure 2.1: Percentage of S&T graduates on total working age population 5 Figure 2.2: Total R&D personnel per thousand labour force 6 Figure 2.3: Government R&D expenditure as a percentage of GDP 7 Figure 2.4: Business R&D expenditure as a percentage of GDP 8 Figure 2.5: High-tech sectors’ value added at current prices as a percentage of value added for the total economy and for total manufacturing 9 Figure 2.6: Patent applications in high-tech classes per million population 10 Figure 2.7: Percentage change in the change of OECD production in high-tech sectors from 1992 to 1996 11 Figure 2.8: Percentage of manufacturing SMEs that innovate in-house 12 Figure 2.9: Sales share for ‘new to market’ products by all manufacturing firms 13 Figure 2.10: Total innovation expenditures as a percentage of all turnover in manufacturing 14 Figure 3.1: Intra-muros R&D expenditures per institutional sector 17 Figure 3.2: Inra-muros R&D expenditures performed by enterprises per sector 21 Figure 3.3: R&D personnel (full time units) in enterprises 22 Figure 4.1: Inventors in all high-tech sectors per Local Labour System 33 Figure 4.2: Percentage of inventors per high-tech class 36 Figures 4.3 to 4.6: Pharmaceutical sector 42-43 LIST OF TABLES Table 3.1: Value added at cost of factors per macrosector (1997) 20 Table 3.2: Value added at cost of factors per the different sectors of industrial transformation (1997) 20 Table 3.3: Number and percentage of patents per high-tech sector and high-tech specialisation index (1995-2000) 23 Table 4.1: General economic indicators per region 28 Table 4.2: Percentage of students enrolled in scientific faculties and R&D personnel in enterprises and public institutions per region. 30 Table 4.3: Students enrolled in scientific faculties and R&D personnel per 1,000 population per Region. 31 Table 4.4: Ranking of the first 20 Local Labour System with the highest number of inventors (1995-2000) 34 Table 4.5: Ranking of the first 20 Local Labour System with the highest number of inventors per 10,000 working age population (with at least 20 inventors) 35 Table 4.6: Selected indicators for major Italian high-tech sectors 37

Modena V., P. Gattoni, M. Balconi, P. Vita-Finzi
3
1. INTRODUCTION
This paper is aimed at giving a general description of the Italian Innovation System and at identifying opportunities for the development of the high-tech industries in Italy. Theories and empirical studies regarding national innovation systems have blossomed in recent years and approach the issue of innovation from different perspectives (Edquist, 1997; Lundvall, 1988, 1992; Nelson 1993; Patel and Pavitt, 1994). Other studies have remarked the tendency of the high-tech industry to agglomerate especially in the wake of major phenomena such as the Silicon Valley (Saxenian, 1983) and the Route 128 (Todtling, 1994) in the U.S.A. and the greater Cambridge area in Great Britain (Segal and Quince, 1985). Interestingly, Oakey and Cooper (1989) have tried to explain the general dynamics of a high-tech agglomeration by the scheme represented in fig. 1.1. According to them new high-technology start-ups emerge in the proximity of sources of skilled manpower (potential entrepreneurs) such as universities, research centres and firms operating in the same sectors contributing to the enlargement of the same agglomeration. The positive feedback effect shown in fig.1.1 can be triggered by seed and venture capital sources, the planning of which is the aim of this project.
Figure 1.1: High-tech agglomeration process
Drawing upon the above interpretative framework the IFISE project focuses on potential entrepreneurs as basic requirement in the creation of new enterprises. If these are found in great concentration, venture capitalists can find good choice of new ideas and eventually
Firms locate in a concentration of skilled personnel
Process of selection – survival of successful firms
High-tech firms seek skilled personnel concentration
Skilled workers drop out and set up new companies in the same sector and in proximity of the original firm
Accelerated growth of successful companies and attraction of skilled manpower.

Modena V., P. Gattoni, M. Balconi, P. Vita-Finzi
4
succeed in developing new fast growing enterprises. The need for geographical concentration is also a result of the fact that both venture capitalist funds and incubators have a limited radius of operation. This paper brings several insights that will be used for the planning of public programmes for the creation of seed and venture capital. It is structured as follows. In chapter 2 a comparison is carried out of the main scientific and technology indicators in Italy as opposed to Europe; chapter 3 gives some further insights on the Italian Innovation system including sectoral specialisation and the structure of the Italian industry and finally chapter 4 deals with the concentration of potential entrepreneurs in different regions of the country according to high-tech sectors. The availability of venture and seed capital will not be treated as it is extensively reported in the report by AIFI.
Modena V., P. Gattoni, M. Balconi, P. Vita-Finzi
5
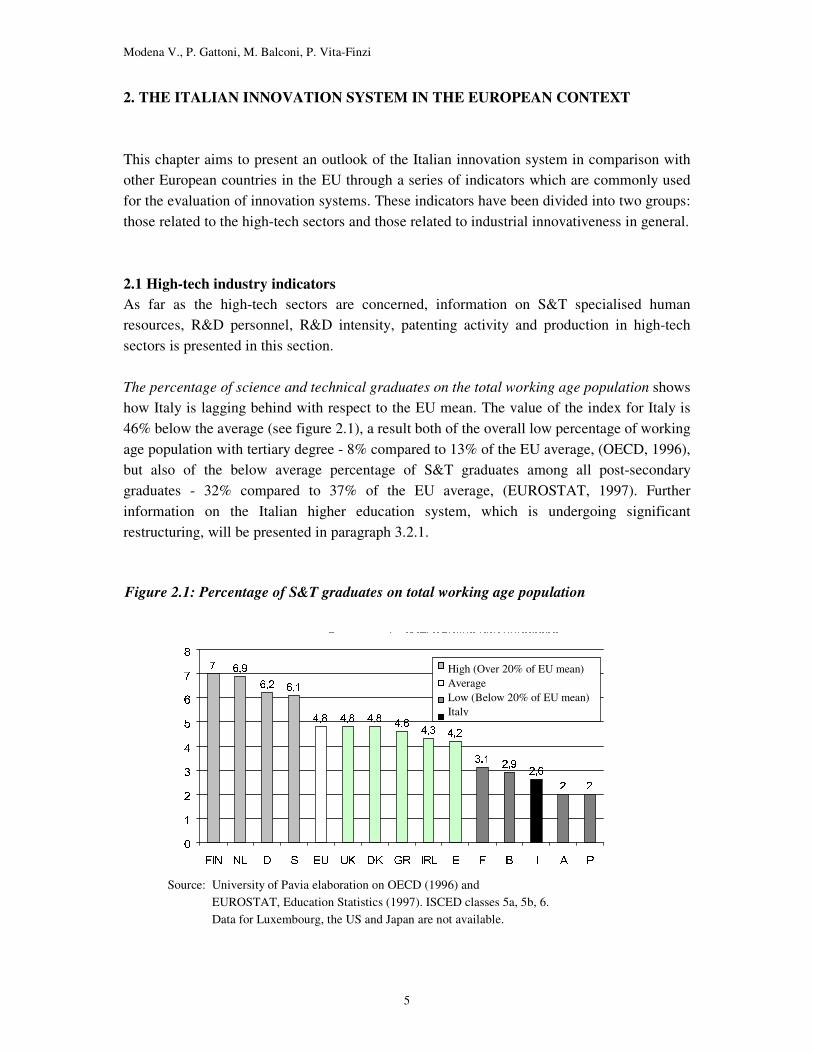
2. THE ITALIAN INNOVATION SYSTEM IN THE EUROPEAN CONTEXT This chapter aims to present an outlook of the Italian innovation system in comparison with other European countries in the EU through a series of indicators which are commonly used for the evaluation of innovation systems. These indicators have been divided into two groups: those related to the high-tech sectors and those related to industrial innovativeness in general. 2.1 High-tech industry indicators As far as the high-tech sectors are concerned, information on S&T specialised human resources, R&D personnel, R&D intensity, patenting activity and production in high-tech sectors is presented in this section. The percentage of science and technical graduates on the total working age population shows how Italy is lagging behind with respect to the EU mean. The value of the index for Italy is 46% below the average (see figure 2.1), a result both of the overall low percentage of working age population with tertiary degree - 8% compared to 13% of the EU average, (OECD, 1996), but also of the below average percentage of S&T graduates among all post-secondary graduates - 32% compared to 37% of the EU average, (EUROSTAT, 1997). Further information on the Italian higher education system, which is undergoing significant restructuring, will be presented in paragraph 3.2.1.
Source: University of Pavia elaboration on OECD (1996) and
EUROSTAT, Education Statistics (1997). ISCED classes 5a, 5b, 6. Data for Luxembourg, the US and Japan are not available.
����������������������� ��������������������������������� ���������������������� "!#�!#���%$�&�'$�& ����������(��*))��)(���)(�( � �����& & � ��
+ ,�- ./�0 1 2�354
67 8 697 8 697 8 697 : ;< = ;
< >=�<5? >9< @ >9< A
> >
BCDEFGHIJ
K�L M NPO Q R SPT U�V W�V XZY [ Y]\ ^ _ ` a b c
High (Over 20% of EU mean) Average Low (Below 20% of EU mean) Italy
Figure 2.1: Percentage of S&T graduates on total working age population

Modena V., P. Gattoni, M. Balconi, P. Vita-Finzi
6
dfe�g h
ifjkml�n o pqpsr t uqu
v w uqux v y x z�{ |
} {�~ � { � ��{ z � { }
���� ��
��� ��s�
�s��� ��s�
�q��� ����
��� � � � ��� � �]� �]� � � �¡ � ¢ £¥¤ ¦
High (Over 20% of EU mean) Average Low (Below 20% of EU mean) Italy
Another indication of the weak position of Italy as far as human resources are concerned, is given by the low proportion of R&D personnel in the labour force. The position of Italy is 35% below the EU average, only 6.1 workers every thousand labour force being engaged in R&D (see figure 2.2).
Source: OECD (1998). Data of 1998 for D, FIN, NL, and of 1997 for all other countries
Figure 2.2: Total R&D personnel per thousand labour force
Modena V., P. Gattoni, M. Balconi, P. Vita-Finzi
7
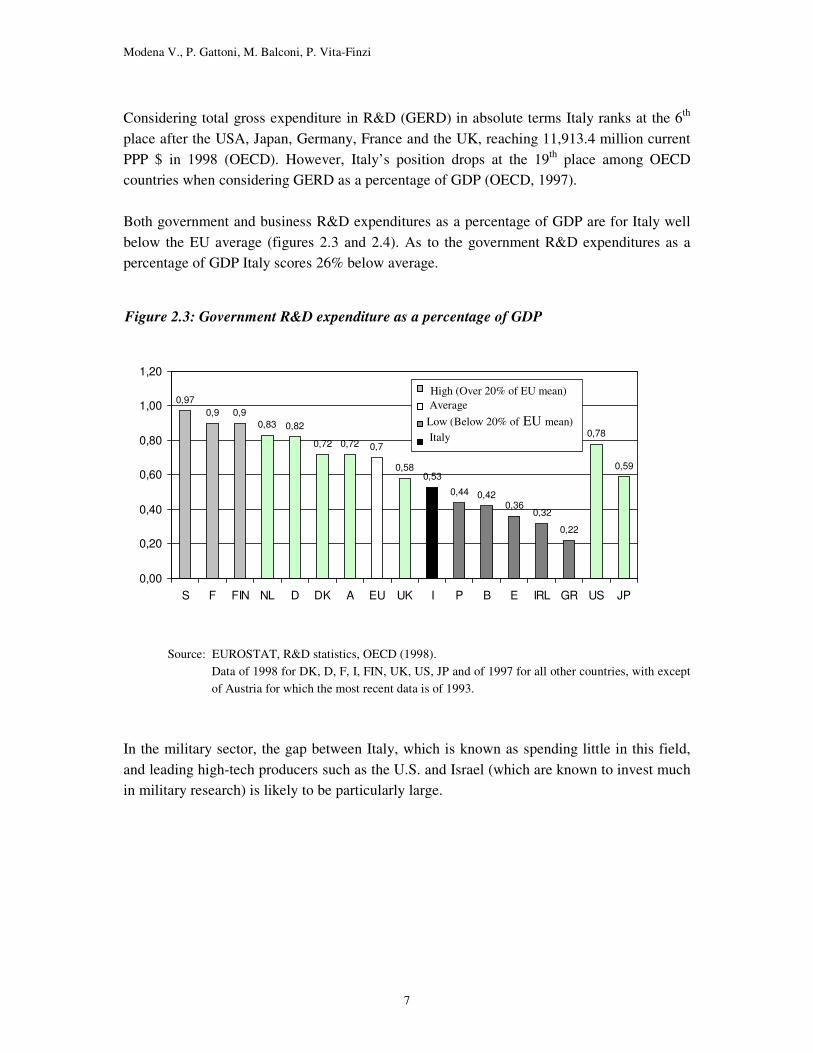
Considering total gross expenditure in R&D (GERD) in absolute terms Italy ranks at the 6th place after the USA, Japan, Germany, France and the UK, reaching 11,913.4 million current PPP $ in 1998 (OECD). However, Italy’s position drops at the 19th place among OECD countries when considering GERD as a percentage of GDP (OECD, 1997). Both government and business R&D expenditures as a percentage of GDP are for Italy well below the EU average (figures 2.3 and 2.4). As to the government R&D expenditures as a percentage of GDP Italy scores 26% below average.
Source: EUROSTAT, R&D statistics, OECD (1998).
Data of 1998 for DK, D, F, I, FIN, UK, US, JP and of 1997 for all other countries, with except of Austria for which the most recent data is of 1993.
In the military sector, the gap between Italy, which is known as spending little in this field, and leading high-tech producers such as the U.S. and Israel (which are known to invest much in military research) is likely to be particularly large.
Government R&D expenditure as a percentage of GDP
0,970,9 0,9
0,83 0,82
0,72 0,72 0,7
0,580,53
0,44 0,420,36
0,32
0,22
0,78
0,59
0,00
0,20
0,40
0,60
0,80
1,00
1,20
S F FIN NL D DK A EU UK I P B E IRL GR US JP
High (Over 20% of EU mean) Average Low (Below 20% of EU mean) Italy
Figure 2.3: Government R&D expenditure as a percentage of GDP

Modena V., P. Gattoni, M. Balconi, P. Vita-Finzi
8
With respect to the business R&D expenditure as a percentage of GDP the Italian position is even worse, with a value 54% lower than the average. Intramural R&D is particularly important in the science-based sectors (pharmaceuticals, chemicals and some areas of electronics) where most new knowledge is created in R&D laboratories. The low business R&D expenditure thus reflects both the de-specialisation of Italy in these sectors and the predominant role of small firms in manufacturing in general.
Source: EUROSTAT, R&D statistics, OECD (1998).
No data available for Luxembourg. Data of 1998 for DK, D, F, I, FIN, UK, US, JA and of 1997 for all other countries, with except of Austria for which the most recent data is of 1993.
Business R&D expenditure as a percentage of GDP
2,77
2,06
1,531,38 1,31 1,26 1,21 1,2 1,11 1,03
0,83
0,55 0,49
0,14 0,13
2,042,18
0,00
0,50
1,00
1,50
2,00
2,50
3,00
S FIN D F B DK UK EU NL IRL A I E P EL USA JP
High (Over 20% of EU mean) Average Low (Below 20% of EU mean) Italy
Figure 2.4: Business R&D expenditure as a percentage of GDP

Modena V., P. Gattoni, M. Balconi, P. Vita-Finzi
9
The weight of high-tech sectors1 in terms of value added positions Italy among the least high-tech specialised countries (figure 2.5). Since these sectors usually account for a large part of a country’s expenditure in private R&D, their scarce incidence in the Italian economy is likely to explain the low overall R&D business expenditure. However, it must be noted that, industrial automation, a sector which may be recognised either as mid or as high-tech and which is very significant in Italy, is not included in the definition of high-tech sectors used by OECD.
Source: OECD (1996).
No data available for Austria, Belgium, Ireland and Luxembourg.
1 In the OECD main industrial indicators high-tech sectors include: drugs & medicines, office & computing equipment, radio, TV & communication equipment, and aircraft.
2,59 2,31 2,31 2,12 2,011,41 1,24 1,23 1,11 0,69
2,813,52
13,99
12,1113,14
9,4510,41
6,946,12
7,23
4,4
6,01
15,88
14,48
0
4
8
12
16
UK F NLD FIN S E I DK P GR USA JP
% of total economy
% of total manufacturing Italy
Figure 2.5: High-tech sectors’ value added at current prices as a percentage of value added for the total economy and for total manufacturing
Modena V., P. Gattoni, M. Balconi, P. Vita-Finzi
10
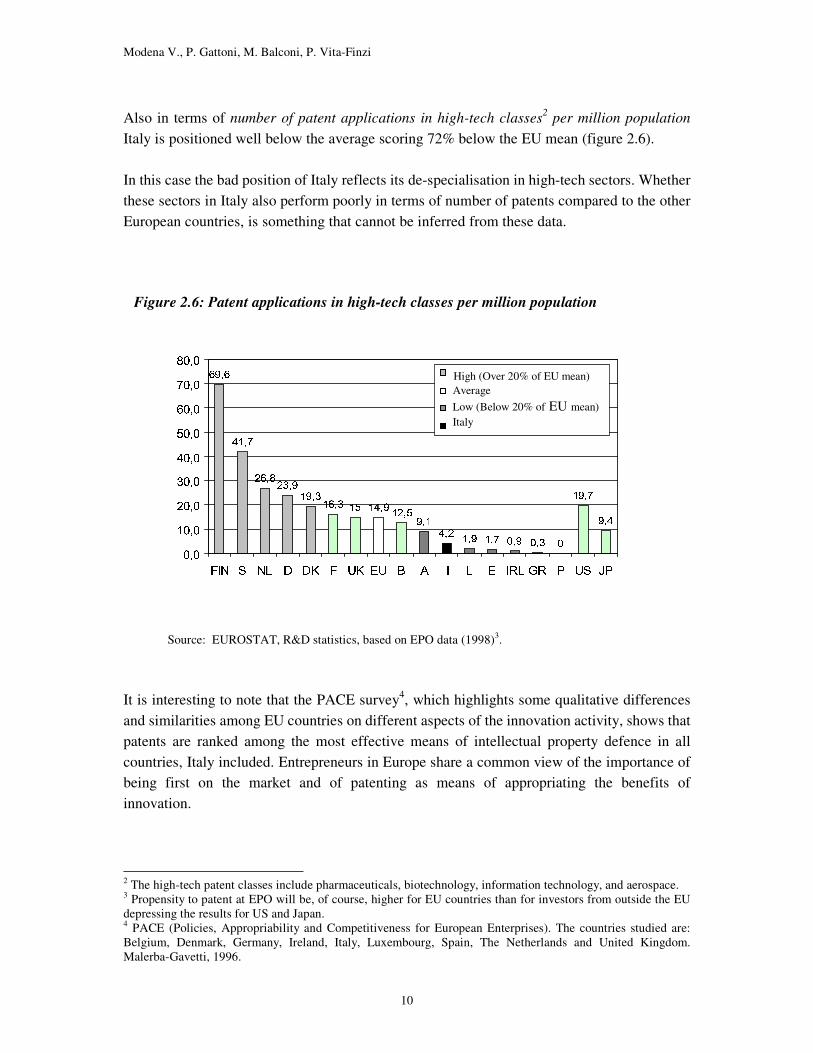
Also in terms of number of patent applications in high-tech classes2 per million population Italy is positioned well below the average scoring 72% below the EU mean (figure 2.6). In this case the bad position of Italy reflects its de-specialisation in high-tech sectors. Whether these sectors in Italy also perform poorly in terms of number of patents compared to the other European countries, is something that cannot be inferred from these data.
Source: EUROSTAT, R&D statistics, based on EPO data (1998)3.
It is interesting to note that the PACE survey4, which highlights some qualitative differences and similarities among EU countries on different aspects of the innovation activity, shows that patents are ranked among the most effective means of intellectual property defence in all countries, Italy included. Entrepreneurs in Europe share a common view of the importance of being first on the market and of patenting as means of appropriating the benefits of innovation.
2 The high-tech patent classes include pharmaceuticals, biotechnology, information technology, and aerospace. 3 Propensity to patent at EPO will be, of course, higher for EU countries than for investors from outside the EU depressing the results for US and Japan. 4 PACE (Policies, Appropriability and Competitiveness for European Enterprises). The countries studied are: Belgium, Denmark, Germany, Ireland, Italy, Luxembourg, Spain, The Netherlands and United Kingdom. Malerba-Gavetti, 1996.
§�¨§©¨(ªª'« «]¬¬�ªª¨¨]®¯®®¯®�°�±°�± ² ²�¨¨(ªªf±± ³�¬³´¬µµ¶±±�¬¸·¬¸·¯±± ¹�·¹�·ºªª'««�²²]··º²²»°° ¨ ¨�µµ�µµ�««�µµ¶®®P««]¼¼»½½¾±¿°�°�±±�°�°�± ³´¬¶®P³�®¯À³�¬¶®P³�®�À¯°° ¨ ¨(ªf±ªf± ³�¬³�¬
ÁÃÂ9Ä Á
Å�ÆÃÇ È
ÉËÊ�Ì Í ÎËÏÐ Ñ Ò Ñ�Ð
Ï ÒfÓ ÐÏ ÔfÕ Ô×Ö
Ø Ù ÔmÚ ØÕÙ�ØÔ Ö
ØÚ Ô
Ø ÙÔØ Û Ü�Ý Þ Ü�Ý ß Ü
à Þ�Ý áÞ�Ý â
ã(ä ãåËæ�ç æè�é�ê éëì�í ìî�ï�ð ïñ�ò�ó òô�õ�ö õ÷ø�ù øú�û�ü û
ýþ ÿ � ��� � ��� � � �� � � � � � � ��� ��� � ��� ���
High (Over 20% of EU mean) Average Low (Below 20% of EU mean) Italy
Figure 2.6: Patent applications in high-tech classes per million population
Modena V., P. Gattoni, M. Balconi, P. Vita-Finzi
11
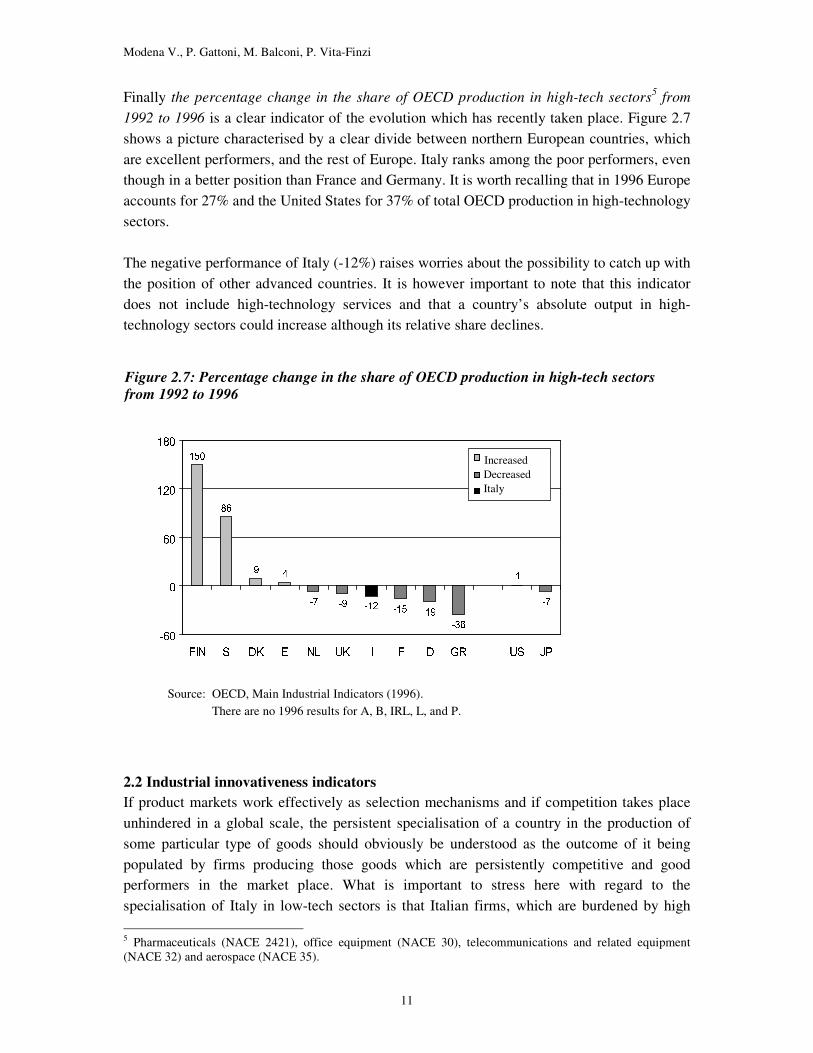
Finally the percentage change in the share of OECD production in high-tech sectors5 from 1992 to 1996 is a clear indicator of the evolution which has recently taken place. Figure 2.7 shows a picture characterised by a clear divide between northern European countries, which are excellent performers, and the rest of Europe. Italy ranks among the poor performers, even though in a better position than France and Germany. It is worth recalling that in 1996 Europe accounts for 27% and the United States for 37% of total OECD production in high-technology sectors. The negative performance of Italy (-12%) raises worries about the possibility to catch up with the position of other advanced countries. It is however important to note that this indicator does not include high-technology services and that a country’s absolute output in high-technology sectors could increase although its relative share declines.
Source: OECD, Main Industrial Indicators (1996). There are no 1996 results for A, B, IRL, L, and P.
2.2 Industrial innovativeness indicators If product markets work effectively as selection mechanisms and if competition takes place unhindered in a global scale, the persistent specialisation of a country in the production of some particular type of goods should obviously be understood as the outcome of it being populated by firms producing those goods which are persistently competitive and good performers in the market place. What is important to stress here with regard to the specialisation of Italy in low-tech sectors is that Italian firms, which are burdened by high 5 Pharmaceuticals (NACE 2421), office equipment (NACE 30), telecommunications and related equipment (NACE 32) and aerospace (NACE 35).
"! �!$#&%#&%'!!'((*))$%*+%*+*,,*((.--.!!0// ( (1))2++*!!43$+3*+*,,*##&!!655*77988;::�<<>==@?A#25?A#&5.BDCBDC9%E)2/%F)2/ 5 5�((G// (H+(H+"// - -�++I IKJJ'LL'M"NMAN.OO"PP O OAQ9R0SQ9R0S'JJ'LLEIITO�U&SO"U&S�VV2U&OU&O"WWYX[Z'ZX\Z]Z]^^�IIKOO_X[ZX\Z]ZZ]``
a
b c dfe gTh&i jTkml jTkmno prq
smtvu
wrx
y z
{f|
}K~\�
�
~[�
�r�\�
�v�[�
�'� � � ��� � �9� �.� � � � ��� �$� �[�
Increased Decreased Italy
Figure 2.7: Percentage change in the share of OECD production in high-tech sectors from 1992 to 1996
Modena V., P. Gattoni, M. Balconi, P. Vita-Finzi
12
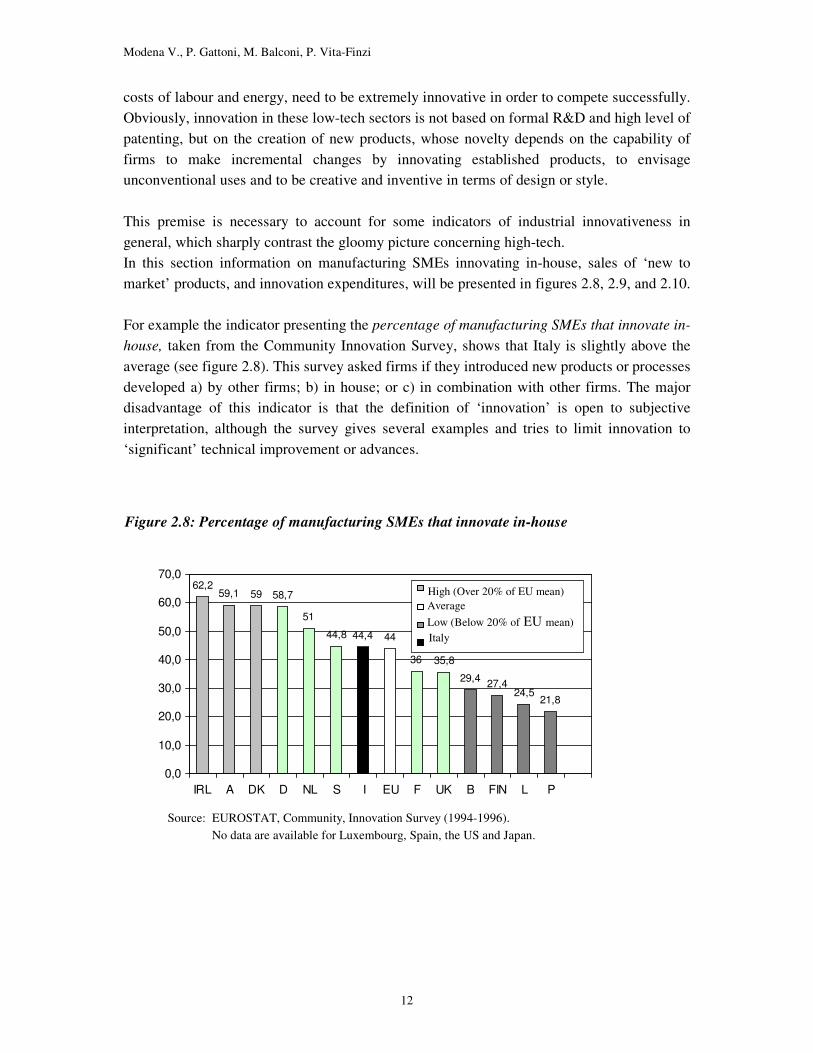
costs of labour and energy, need to be extremely innovative in order to compete successfully. Obviously, innovation in these low-tech sectors is not based on formal R&D and high level of patenting, but on the creation of new products, whose novelty depends on the capability of firms to make incremental changes by innovating established products, to envisage unconventional uses and to be creative and inventive in terms of design or style. This premise is necessary to account for some indicators of industrial innovativeness in general, which sharply contrast the gloomy picture concerning high-tech. In this section information on manufacturing SMEs innovating in-house, sales of ‘new to market’ products, and innovation expenditures, will be presented in figures 2.8, 2.9, and 2.10. For example the indicator presenting the percentage of manufacturing SMEs that innovate in-house, taken from the Community Innovation Survey, shows that Italy is slightly above the average (see figure 2.8). This survey asked firms if they introduced new products or processes developed a) by other firms; b) in house; or c) in combination with other firms. The major disadvantage of this indicator is that the definition of ‘innovation’ is open to subjective interpretation, although the survey gives several examples and tries to limit innovation to ‘significant’ technical improvement or advances.
Source: EUROSTAT, Community, Innovation Survey (1994-1996). No data are available for Luxembourg, Spain, the US and Japan.
Percent of manufacturing SMEs that innovate in-house
62,259,1 59 58,7
51
44,8 44,4 44
36 35,8
29,4 27,424,5
21,8
0,0
10,0
20,0
30,0
40,0
50,0
60,0
70,0
IRL A DK D NL S I EU F UK B FIN L P
High (Over 20% of EU mean) Average Low (Below 20% of EU mean) Italy
Figure 2.8: Percentage of manufacturing SMEs that innovate in-house
Modena V., P. Gattoni, M. Balconi, P. Vita-Finzi
13
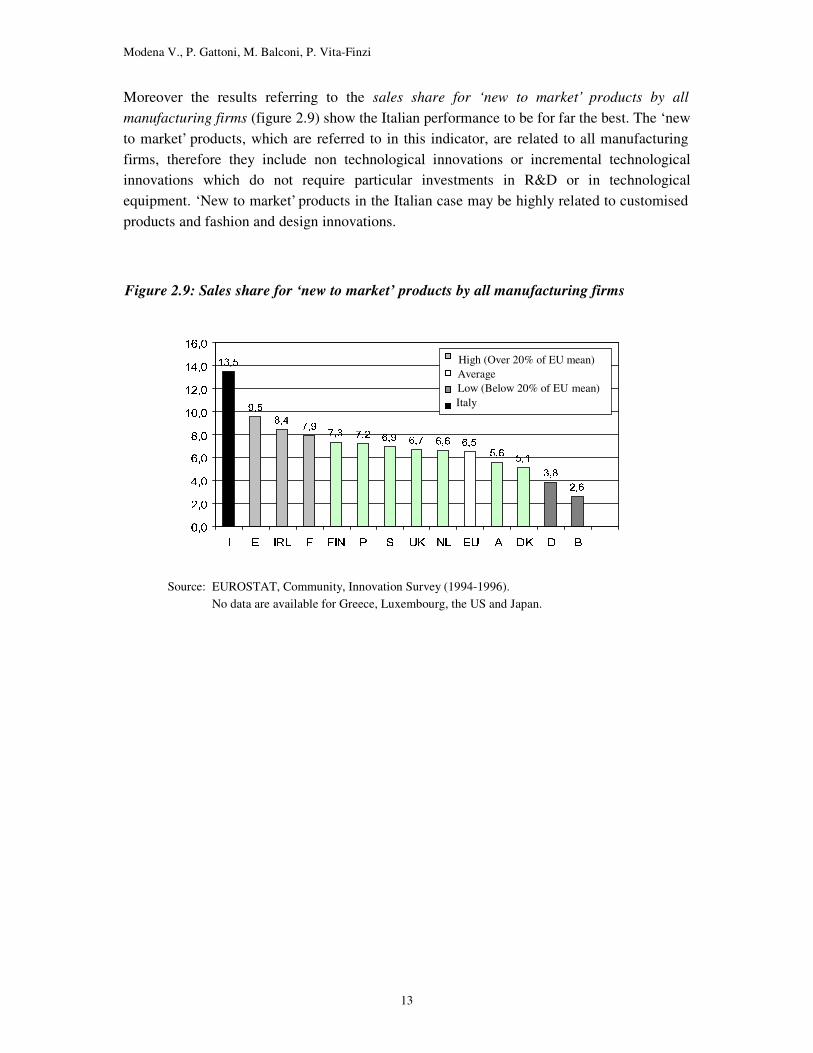
Moreover the results referring to the sales share for ‘new to market’ products by all manufacturing firms (figure 2.9) show the Italian performance to be for far the best. The ‘new to market’ products, which are referred to in this indicator, are related to all manufacturing firms, therefore they include non technological innovations or incremental technological innovations which do not require particular investments in R&D or in technological equipment. ‘New to market’ products in the Italian case may be highly related to customised products and fashion and design innovations.
Source: EUROSTAT, Community, Innovation Survey (1994-1996). No data are available for Greece, Luxembourg, the US and Japan.
� ������� 9¡G¡D¢¡H¡�¢A���££& 0¤¤m¥¥�££A¦¦T§§A $¨¨ª©©2¥ ¥_««¬���££®' $©©2¦¦*¯¯�££&¥�°�±A²¥�°�±A²$©©&¡¡¬³³A´´µ��D��f��¶««·���§�±§�±*¤¤¸��.²²$©©¹±±�££®ººf§§�»»¤ ¤¼ººf££¹««¬¡¡
½¿¾¶À Á
¶à ÄÅ¶Æ Ç È
É Ê ÈÉ Ë Ì¶Í Î Ï¶Ð Ñ Ï¶Ð Ò Ï¶Ð Ï Ï¶Ð Ó
Ó¶Ð Ï Ó�ÐÕÔÖ Ð ×
Ø Ð Ï
Ù*Ú ÙÛ*Ü ÝÞ.ß àá*â ãä*å æçéè*ê èçéë*ê èçvì.ê èçéí*ê è
î ï ð ñ�ò ó ô.õ ö ÷ ø ù�ú û�ü ý�ù þ ÿ�� ÿ �
High (Over 20% of EU mean) Average Low (Below 20% of EU mean) Italy
Figure 2.9: Sales share for ‘new to market’ products by all manufacturing firms

Modena V., P. Gattoni, M. Balconi, P. Vita-Finzi
14
The indicator of total innovation expenditures as a percentage of turnover in manufacturing6 shows Italy again well below the EU mean, as we can observe in figure 2.10 (almost 30% below the average). Innovation expenditures include R&D together with machinery and equipment linked to product and process innovation, expenses to acquire patents and licenses, industrial design, training, and the marketing of innovations. The overall results show a clustering of the various countries near the average, which might be interpreted as the tendency of firms that spend little on R&D to spend proportionately more on new equipment and machinery. This shows how some countries that are weak R&D performers can shift towards the mean by investing proportionately more in innovative equipment and machinery. The position of Italy is certainly affected by the low R&D intensity but in fact other innovation expenses do not compensate for the lack of formal research expenses. In conclusion the inventiveness of Italian firms does not seem to be supported by an adequate financial and organisational effort.
Source: EUROSTAT, Community, Innovation Survey (1994-1996). No data are available for Greece, Luxembourg, the US and Japan.
6 All manufacturing firms with more than 19 employees. Total innovation expenditure by all firms in each country is divided by total turnover, including firms which do not innovate.
� �������� ������� � �� � ��������������� �� �� ������������� �� ����� � ���������� ��!��"��#��$��������%%&��� "���� ''���(���))���*+,�,�������� �� ��*�����*�����+ - -/..�0�10�1 223.. 44 55�11�6�76�780�90�9
:
;�< =>�? @ A BDC EGF H EGF I EGF J K L M K L K N
O P QSR TQSRVU UWR X UWR Y
Z�[ Z\�] ^_ ` ab�c de"f gh i jk l mn�o pq r s
t u�v w"x y z w {�| }�~ � � ��� ��� � � � �
High (Over 20% of EU mean) Average Low (Below 20% of EU mean) Italy
Figure 2.10: Total innovation expenditures as a percentage of all turnover in manufacturing

Modena V., P. Gattoni, M. Balconi, P. Vita-Finzi
15
2.3 Conclusion The position of Italy emerging from all the indicators presented above is clearly weak, with respect to the development of high-tech sectors, to the commitment to research and to human capital creation. This is certainly related to the specific structural features of the country, which will be examined in the next chapter. However, the performance of the Italian innovation system appears much improved when general indicators of innovativeness are considered. The general picture of Italy as a poor performer in the high-tech sectors, but a strong innovator in the other sectors is in line with the diffused opinion that gives credit to Italian entrepreneurs’ creativity and inventiveness. Finally it must be noted that if, notwithstanding the poor performance in high-tech sectors which emerges from general indicators, the overall dimension of the country in terms of population (57.6 millions in 2000) is taken into account, it cannot be excluded that some areas are characterised by a significant concentration of high-tech activities in some particular field of specialisation and warrant attention for their potential of further development. The next chapters are precisely voted to the attempt of identifying these types of high-tech concentration areas.
Modena V., P. Gattoni, M. Balconi, P. Vita-Finzi
16
3. FEATURES OF THE ITALIAN INNOVATION SYSTEM This chapter aims at giving a general description of the Italian Innovation System. This is done first by presenting a survey of the available literature, then by describing the public system of innovation and the Italian specialisation in the high-tech sectors. It must be mentioned that data on these subjects are not always recent and that academic studies are not many. The description of private seed and venture capital sources for the high-tech industry is not presented, as it is extensively treated in another IFISE report. 3.1 General features of the Italian innovation system
In Chapter 2 it was shown how Italian innovation indicators are well below EU average when relating to the strictly high-tech activity, whereas they are around the average or above, if dealing with innovativeness in all manufacturing sectors. These findings are consistent with other sources which discuss more in detail the characteristics of the Italian innovation system. Malerba (1993), for example, makes a clear distinction between the “Core R&D system” which encompasses the main actors dealing with R&D, i.e. universities, large publicly owned research centres (ENEA, CNR, etc) and large public and private firms on the one side and the small firms system on the other side. While the “Core R&D system” strongly affects the high-tech sectors, the small firms system is composed of a large population of small and medium size firms operating in traditional industries (such as textile and clothing, shoes, furniture), in mechanics, and in equipment supplier industries. These firms are specialised in the supply of custom made products and characterised by good capabilities of absorbing, adapting and improving new technologies to specific market needs. Innovation in small firms is mainly incremental and does not originate from formal R&D, but from informal learning by doing, by using, and by interacting. Ferrari (1999) also shows that most patents are registered by firms with more than 1,000 employees in most high-tech sectors, especially those related to the electronics industry. On the same line, Archibugi (1996) shows how innovative large firms (with more than 1,000 employees) spend twice as much as small firms (with less than 100 employees) in R&D per employee, whereas the latter spend 50% more than the former if general innovation expenditures are considered. His findings are based on data gathered by the first Community Innovation Survey (CIS, 1992). Based on the same survey, Archibugi (1996) also notes that both innovative and non-innovative firms consider financial factors as the most relevant barriers for their innovation activities. On this matter, it should be noted that venture and seed capital funds were almost inexistent at the time the survey was carried out. Whether they give answer to the innovation needs of firms today is a question that will be coped with in chapter (…).
Modena V., P. Gattoni, M. Balconi, P. Vita-Finzi
17
The second Community Innovation Survey, CIS 2, (1994-1996) has generally confirmed the findings of the first and has detected an increase in the percentage of innovative firms testifying an important development of the innovation strategy of manufacturing firms. Information and telecommunication technologies have played a determinant role (at the level of product, process, management, logistic)7 in this improvement. The ranking of the most innovating industries, according to CIS 2 confirms office machines (67.6%); precision and optical instruments (63%); machinery (62.7%); and chemicals (61.8%) as the most innovative ones. Radio, TV and telecommunication apparatus maintain the same level of innovativeness, but lose positions in the ranking (59.2%). 3.2 The R&D system In order to describe the Italian R&D system, we shall resort to the classification used by Malerba (1993). In his view, the system consists of three major pillars: • The University system; • The large publicly owned research agencies, such the CNR (National Research Council),
ENEA, INFN, INFM, ASI (Italian Space Agency), and INS (National Institute of Health) which report to various ministries of the national government;
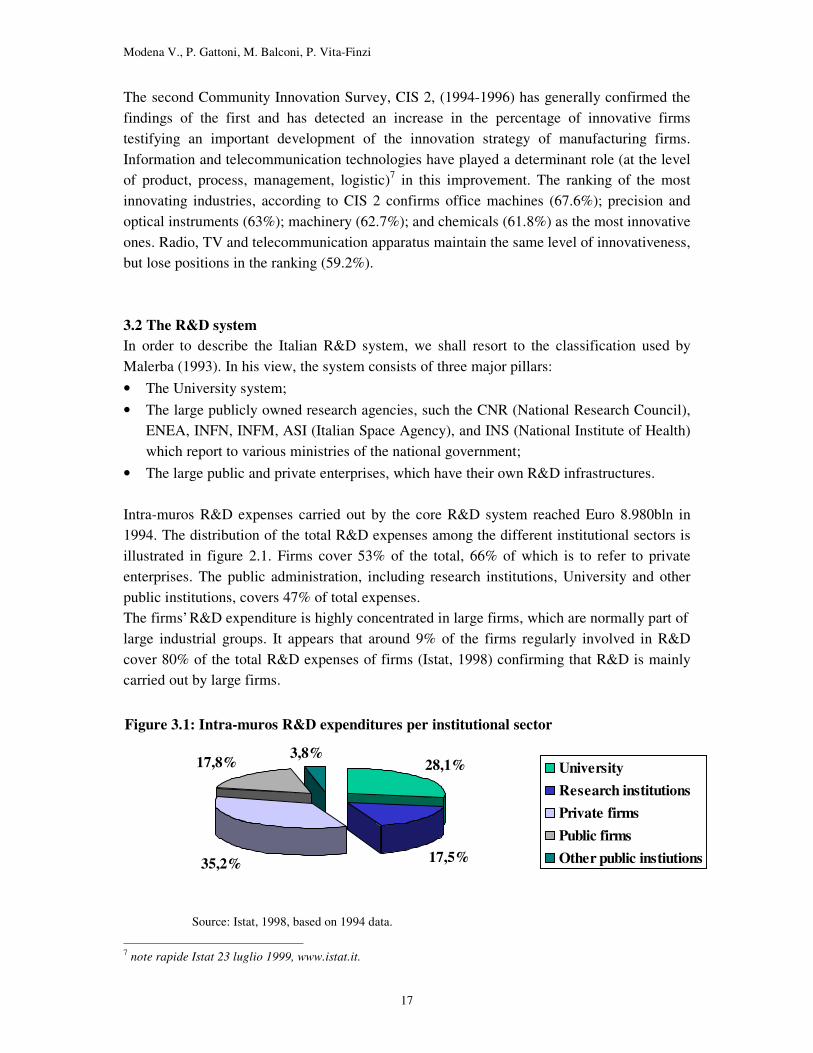
• The large public and private enterprises, which have their own R&D infrastructures. Intra-muros R&D expenses carried out by the core R&D system reached Euro 8.980bln in 1994. The distribution of the total R&D expenses among the different institutional sectors is illustrated in figure 2.1. Firms cover 53% of the total, 66% of which is to refer to private enterprises. The public administration, including research institutions, University and other public institutions, covers 47% of total expenses. The firms’ R&D expenditure is highly concentrated in large firms, which are normally part of large industrial groups. It appears that around 9% of the firms regularly involved in R&D cover 80% of the total R&D expenses of firms (Istat, 1998) confirming that R&D is mainly carried out by large firms.
7 note rapide Istat 23 luglio 1999, www.istat.it.
28,1%3,8%17,8%
35,2% 17,5%
UniversityResearch institutionsPrivate firmsPublic firmsOther public instiutions
Source: Istat, 1998, based on 1994 data.
Figure 3.1: Intra-muros R&D expenditures per institutional sector

Modena V., P. Gattoni, M. Balconi, P. Vita-Finzi
18
As to the source of funding of the intra-muros R&D expenses, 50.2% is provided by public administration, 43.7% by firms and 6.1% comes from abroad. 88.2% of the public administration R&D expenses has been used directly by public institutions (such as CNR and ENEA), the rest (only 11.8%) went to firms through transfers and procurement (Istat, 1998). Public procurement as a means of change has been impaired by norms regarding public contracts, difficulties and delays in financial payments by the public sector, cumbersome bureaucratic procedures, and political or social goals. Moreover public procurement has rarely been used as a conscious stimulus for innovation (Pontarollo, 1986, quoted in Malerba, 1993). In general, the public administration purchases existing products from existing producers: in several cases it has, de facto, maintained unchanged historical quotas directed to domestic firms (Malerba, 1993). 3.2.1 The University system Over the last decade the University system in Italy has undergone many different changes which are related to the structure of both the teaching system and the research activity. As far as teaching is concerned, reforms were aimed at solving two problems: (1). The marked difference between the education systems in Italy and elsewhere in Europe (the Italian “laurea” is one year longer than a European B.A. or B.Sc.). (2). The exaggerated lengths of undergraduate studies, de facto on average exceeding by about 60% the official length, causing young people to join the workforce a few years later than in the other European countries. In 1999, for instance, only 7% of the graduates were 23 years old or less whereas more than 50%were 28 years old or older. In order to overcome these problems a “first level” degree was introduced which is likely to completely substitute the old “laurea” within year 2001. This degree will be followed by a “second level specialisation” degree after two more years of courses. As far as research is concerned, universities were recently granted complete autonomy. This has enabled them to decide autonomously their regulations regarding the links with industry, the participation to university spin-offs, the intellectual property right of researchers and their possibility to take part to industrial activities. While the new regulations are still being discussed in most institutions, there is a clear trend to enhance university-enterprise research cooperation and to encourage innovative spin-offs. In the last few years, many institutions, especially in the north of Italy, have set up technology incubators and university-enterprise liaison offices. It is widely held that university-industry relationships are a weak point of the Italian innovation system.
Modena V., P. Gattoni, M. Balconi, P. Vita-Finzi
19
3.2.3 The government and public research institutions The central institutional point of reference for Italy’s science and technology system lies in two ministries. The first is the Ministry of Education and Scientific Research which has, among its missions: (1). Determining R&D and higher education policy. (2). Determining development plans for universities and scientific institutions, as well as the promotion of S&T research. (3). Forging international ties especially in consultation with representative bodies of other EU member states. The second key political organisation is the Ministry of Industry, which promotes strategic industrial research, and oversees the research carried out by specialised agencies, specifically ENEA (National Agency for New Technology, Energy and Environment), the INFN (National Institute for Nuclear Physics), and INFM (National Institute for Physics and Materials).8 The bulk of government-sponsored scientific and technical research in Italy is delivered through two agencies of the Italian government: CNR and ENEA. ENEA directly engages in a wide range of research projects, with special emphasis on alternative energy, the environment and biotechnology. ENEA’s prim ary mandate is to conduct applied research, which can then be transferred to Italian industry. It also conducts contract research in some areas (such as material testing) for Italian and foreign organisations. ENEA’s budget is devoted almost exclusively to wards the salary of its technical and scientific personnel, and towards administration costs. ENEA also promotes and participates in research consortia at both the national and international levels and it owns shares in a number of high-technology companies. The major focus of research activity in these consortia and companies is on agri-biotech, renewable energy and environmental protection. ENEA also provides training and technical support to SMEs and start-up companies. The CNR has a total of 334 research institutes and centres (most of which are strictly connected to University) all over Italy. Most of the CNR’s budget is devoted to financing infrastructure costs and underwriting the cost of research projects. Its fields of research include also economics and social sciences. 3.3 The Italian industrial structure and the high-tech sectors This section is aimed at giving an overview of the high-tech sectors in the Italian industrial context. First a general description of the industrial structure as measured by added value is given, then high-tech sectors are identified and finally a selection of these is shortly described.
8 The ASI (Italian Space Agency) reports to the Ministry of Education and Scientific Research, and the INS (National Institute of Health) reports to the ministry of health.

Modena V., P. Gattoni, M. Balconi, P. Vita-Finzi
20
3.3.1 The Italian industrial structure Table 3.1 and 3.2 present the structure of the Italian industry according to added value by sectors. It must be noted in the first place, that, as in most developed economies, services account for more than two-thirds of the national added value. As regards solely industrial transformation sectors, traditional industries and the mechanical sector play a dominant role. In fact traditional household consumption products9 account for as much as 29,9%, and metal products and machinery for another 20,4%, while the high-tech sectors10 (only roughly estimated, since the whole chemical sector is included but electrical materials are excluded) reach only the 10,8% of the total industrial transformation sector Table 3.1: Value added at cost of factors per macrosector (1997) MACROSECTOR ADDED VALUE %
Agriculture, forestry and fishery 31.25 3.3
Power products 25.70 2.7 Industrial transformation 195.41 20.8 Building 48.66 5.2 Services 638.15 68.0
Total Value Added at cost of factors 939.17 100 Table 3.2: Value added at cost of factors per the different sectors of industrial transformation (1997) SECTOR ADDED VALUE
(bln Euro) %
- Industrial transformation -- minerals 24.01 12.3 -- chemicals and pharmaceuticals 17.74 9.1 -- metal products 20.37 10.4 -- industrial and agricultural machinery 19.52 10.0 -- office machines, precision instruments, optical 3.31 1.7 -- electrical materials 13.72 7.0 -- means of transport 13.10 7.2 -- foodstuff and tobacco 17.69 9.0 -- textiles and clothing 24.85 12.7 -- leather products and shoes 6.29 3.2 -- wood and furniture 9.74 5.0 -- paper, press and publishing 13.16 6.7 -- rubber products and plastic materials 8.84 4.5 -- other industrial products 2.18 1.1 Total 195.41 100
9 Traditional household consumption products include: foodstuff and tobacco, textiles and clothing, leather products and shoes, wood and furniture. 10 High-tech sectors include: chemicals and pharmaceuticals, and office machines, precision instruments and optical.
Modena V., P. Gattoni, M. Balconi, P. Vita-Finzi
21
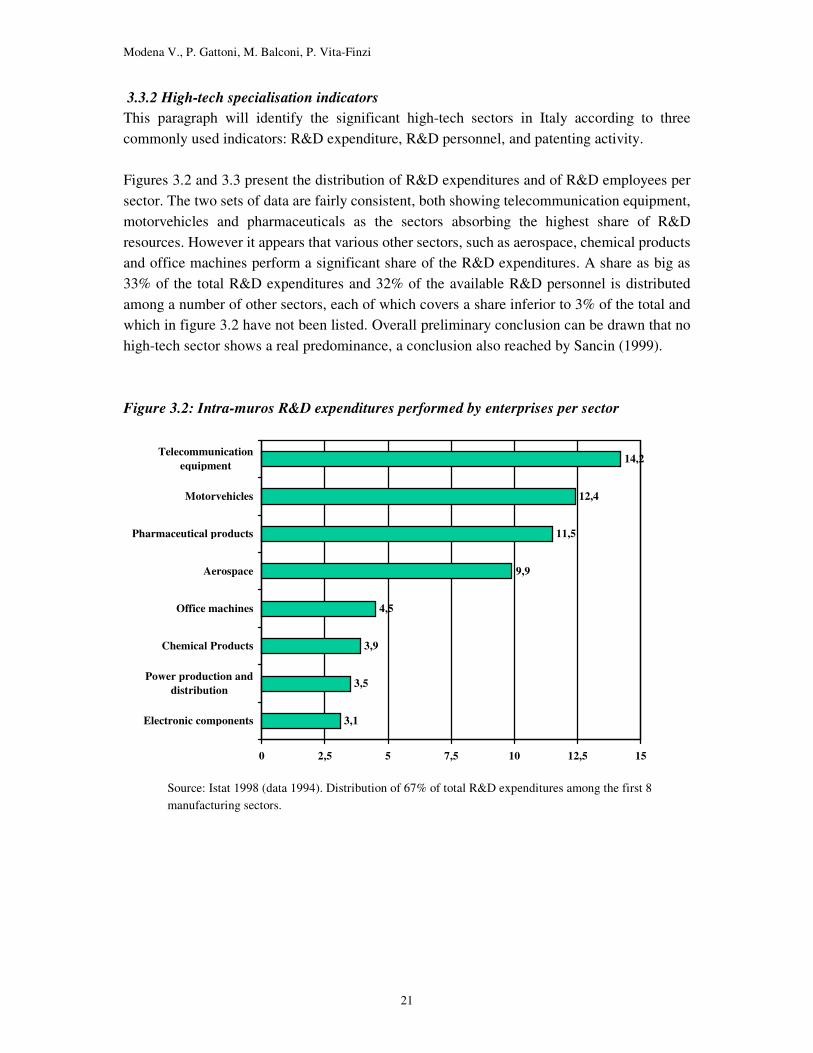
3.3.2 High-tech specialisation indicators This paragraph will identify the significant high-tech sectors in Italy according to three commonly used indicators: R&D expenditure, R&D personnel, and patenting activity. Figures 3.2 and 3.3 present the distribution of R&D expenditures and of R&D employees per sector. The two sets of data are fairly consistent, both showing telecommunication equipment, motorvehicles and pharmaceuticals as the sectors absorbing the highest share of R&D resources. However it appears that various other sectors, such as aerospace, chemical products and office machines perform a significant share of the R&D expenditures. A share as big as 33% of the total R&D expenditures and 32% of the available R&D personnel is distributed among a number of other sectors, each of which covers a share inferior to 3% of the total and which in figure 3.2 have not been listed. Overall preliminary conclusion can be drawn that no high-tech sector shows a real predominance, a conclusion also reached by Sancin (1999). Figure 3.2: Intra-muros R&D expenditures performed by enterprises per sector
Source: Istat 1998 (data 1994). Distribution of 67% of total R&D expenditures among the first 8 manufacturing sectors.
3,1
3,5
3,9
4,5
9,9
11,5
12,4
14,2
0 2,5 5 7,5 10 12,5 15
Electronic components
Power production anddistribution
Chemical Products
Office machines
Aerospace
Pharmaceutical products
Motorvehicles
Telecommunicationequipment
Modena V., P. Gattoni, M. Balconi, P. Vita-Finzi
22
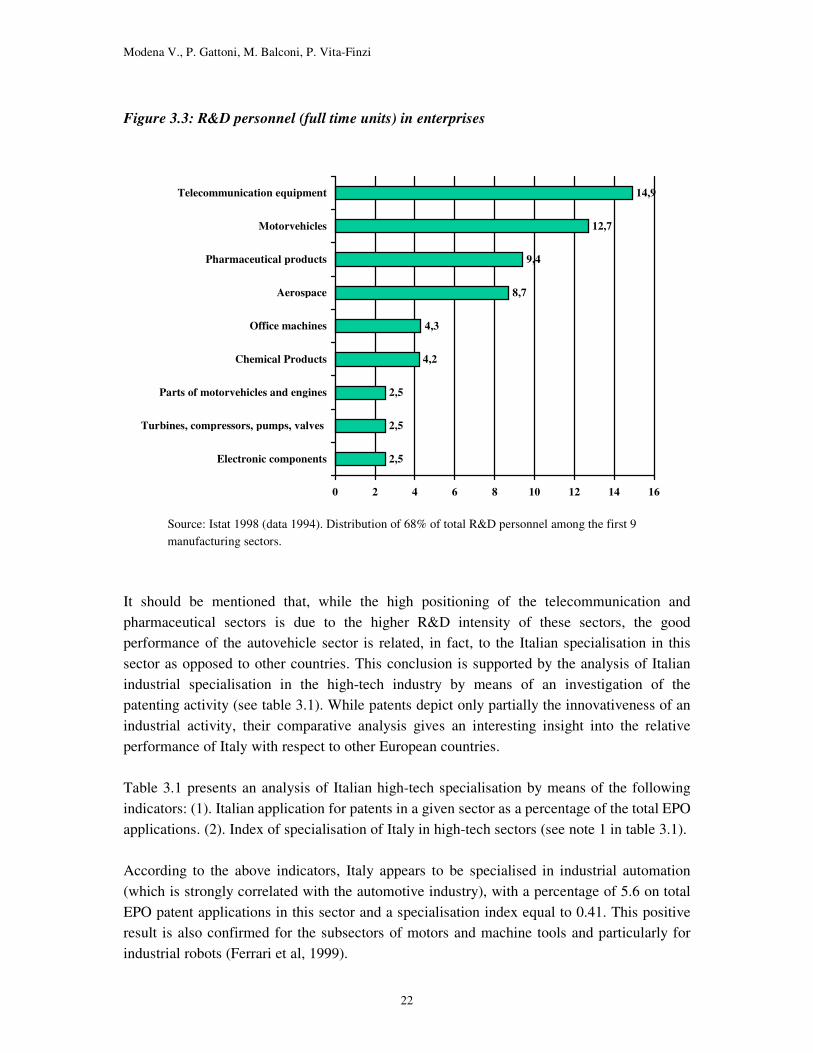
Figure 3.3: R&D personnel (full time units) in enterprises
Source: Istat 1998 (data 1994). Distribution of 68% of total R&D personnel among the first 9 manufacturing sectors.
It should be mentioned that, while the high positioning of the telecommunication and pharmaceutical sectors is due to the higher R&D intensity of these sectors, the good performance of the autovehicle sector is related, in fact, to the Italian specialisation in this sector as opposed to other countries. This conclusion is supported by the analysis of Italian industrial specialisation in the high-tech industry by means of an investigation of the patenting activity (see table 3.1). While patents depict only partially the innovativeness of an industrial activity, their comparative analysis gives an interesting insight into the relative performance of Italy with respect to other European countries. Table 3.1 presents an analysis of Italian high-tech specialisation by means of the following indicators: (1). Italian application for patents in a given sector as a percentage of the total EPO applications. (2). Index of specialisation of Italy in high-tech sectors (see note 1 in table 3.1). According to the above indicators, Italy appears to be specialised in industrial automation (which is strongly correlated with the automotive industry), with a percentage of 5.6 on total EPO patent applications in this sector and a specialisation index equal to 0.41. This positive result is also confirmed for the subsectors of motors and machine tools and particularly for industrial robots (Ferrari et al, 1999).
2,5
2,5
2,5
4,2
4,3
8,7
9,4
12,7
14,9
0 2 4 6 8 10 12 14 16
Electronic components
Turbines, compressors, pumps, valves
Parts of motorvehicles and engines
Chemical Products
Office machines
Aerospace
Pharmaceutical products
Motorvehicles
Telecommunication equipment

Modena V., P. Gattoni, M. Balconi, P. Vita-Finzi
23
Table 3.3: Number and percentage of patents per high-tech sector and high-tech specialisation index (1995-2000)
SECTORS Italian patents total EPO patents % Italian patents /total EPO Patents
specialisation index (1)
Computer Hardware, Semiconductor Devices and Electronic Components
671 23,9% 28.637 23,9% 2,3% 0
Consumption Electronics and Telecommunication (Hardware), excluding Optical Communication
399 14,2% 29.544 24,6% 1,4% -0.26
Pharmaceuticals 384 13,7% 13.814 11,5% 2,8% 0.09
Precision Instruments, Measurement and Control Apparatus
372 13,2% 14.523 12,1% 2,6% 0.04
Fine Chemicals 223 7,9% 10.361 8,6% 2,2% -0.04
Industrial Automation 222 7,9% 3.989 3,3% 5,6% 0.41
Plastics 203 7,2% 5.653 4,7% 3,6% 0.21
Optical Instruments and Materials, including Optical Communication Items
136 4,8% 5.144 4,3% 2,6% 0.06
Electro-Medical Instruments and Devices
134 4,8% 5.938 4,9% 2,3% -0.02
New Materials 48 1,7% 1.607 1,3% 3,0% 0.12
Aerospace 17 0,6% 808 0,7% 2,1% -0.05
TOTAL 2.809 100,0% 120.018 100,0% 2,3%
Source: University of Pavia, elaboration on EPO data.
(1) specialisation index: number of patent applications at EPO from Italy in one sector over the total applications in the same sector divided by total applications from Italy in high-tech sectors over total applications at EPO in high-tech sectors for the period 1995-2000. Since the values obtained are normalised (value–1)/(value+1), the index ranges between –1 and +1: a positive number indicates a higher than average specialisation, whereas a negative one indicates lower than average specialisation as compared with other European countries.
The other sectors showing some relative advantage according to the patenting activity are: plastics, new materials, pharmaceuticals, optical and precision instruments. Looking at the development of this indicator from the period 1993-1995 (Ferrari et. Al. 1999) and the period 1995-2000, a slight improvement of the Italian performance in the European context can be noted.

Modena V., P. Gattoni, M. Balconi, P. Vita-Finzi
24
3.3.3 The Electronics and Telecommunication Industry As in most of the western countries, the electronic and telecommunication sectors absorb a large share of the total intra-muros expenses (18.7%11) and of skilled manpower (19.2% of total R&D personnel12). The dominant firms in this field are Telecom Italia, Telecom Italia Mobile, Blu which is owned by Enel (the energy giant which has recently entered the telecommunication sector), and Tiscali, a new entry which has rapidly grown becoming also a pan-European Internet Service Provider through a wide number of acquisitions. In the field of semiconductors the most important company is ST Microelectronics, which holds around 80% of the patents in the subsector of electronic components. The Internet sector which has boomed in the last two years is particularly difficult to assess, especially because of the lack of data on companies in this field in Italy and the great uncertainty regarding the real high-tech activity of firms in this sector. 3.3.4 The mechanical and industrial automation industry In the motorvehicles sector it is worth mentioning at least two important firms (although now part of the same group): FIAT-Auto, the major automotive group in the country and one of the biggest in Europe, and Ferrari, the famous high-speed cars producer. High-tech activities and innovation involving this industry ranges from new production methods to machines for metal working, from robotics to electronics and control systems. A variety of innovative and internationally competitive small firms producing equipment are present in the north of Italy, many of which serving the autovehicles industry. Malerba (1993) notes a high dynamics of entry and exits; moreover, many new entrepreneurs come either from established equipment firms or from large users such as FIAT itself. The competitive advantage of these firms lies in their capability of solving effectively the idiosyncratic problems of the large users through a continuous process of interaction with them. Ferrari (1999) points out that, while concentration of the patenting activity in the mechanical industry is still relatively high, it has significantly diminished from the period 1983-1985 to 1993-1995. In his opinion this might be explained by the emergence of new districts such as the glass-frames one located in the Veneto area.
11 Percentage of telecommunication equipment and office machines on total intra-muros R&D expenditures, (data 1994), see figure 3.2. 12 Percentage of telecommunication equipment and office machines on total R&D personnel, (data 1994), see figure 3.3.

Modena V., P. Gattoni, M. Balconi, P. Vita-Finzi
25
3.3.5 The pharmaceutical industry The Italian pharmaceutical industry ranks fifth in the world for sales of finished products ($11.2 bn in 1999, after the U.S.A – $128.8 bn, Japan - $47.7bn, Germany-18.3bn and France-17.8bn), sixth for number of employees and seventh for exports. Unfortunately the relatively good performance in the production and distribution activity is not matched with a consistent research activity. Italy has spent only around $0.8 bn in year 1999 compared with $15.4 bn in the USA, 4.6 in Japan, 3.2 in the U.K., 2.7 in Germany, 2.5 in France and 1 in Switzerland (Farmindustria, 2000). Table 3.4 shows research expenditures as a percentage of total revenues in the sector, testifying how scarce the research activity is in Italy as opposed to the dimension of the market. Region Italy European Union U.S.A Japan R&D/Turnover Ratio 6.02 11.75 15.91 20.04 The employment of R&D personnel is relatively low, both in absolute value and as a percentage of the total personnel employed. Country Italy France Germany U.K R&D personnel 5.024 15.200 15.000 20.900 % of R&D Personnel on total personnel
7.18% 16.87% 12.99% 28.24%
The pharmaceutical sector is characterized by a high level of concentration. The first 25 companies account for 58.51% of the total turnover. These can be roughly divided into branches of international “ Big Pharmas” such as Glaxo, Merck, Novartis Bayer and Ciba -Geigy and Italian medium size firms such as Menarini and Bracco. As in most countries, research and patenting in Italy are mostly performed by large firms. Moreover, the pharmaceutical sector is very stable having very low firm birth and death rates (Ferrari, 1999). Researchers in the industry often complain that the lack of investment in pharmaceutical research in Italy, especially by the international “Big Pharmas”, is due to the inefficiency of the Italian health authority both in validating clinical tests and in accepting new products for public subsidy. As a result the activity of these firms is mostly concerned with the production of the existing products and the distribution of new products created abroad.

Modena V., P. Gattoni, M. Balconi, P. Vita-Finzi
26
3.4 Summary The following main features characterise the Italian Innovation System:
1. The subdivision between an R&D core, made of public research institution and few big private and public enterprises on one hand, and a system of highly innovative small firms in traditional sectors carrying out little research on the other hand.
2. The only high-tech industry that appears to have a technological relative advantage as
compared to the other European countries (according to patents) is the industrial automation sector. Also, while a significant share of Italian R&D resources is absorbed by the Telecommunication and Pharmaceuticals sectors, the level of research carried out by the these two sectors is considerably lower than the EU average.
3. The Italian university system is undergoing significant restructuring. University-
Enterprise relationships which have been regarded as a weakness of the Italian Innovation system are being reshaped.
4. Public procurement is scarcely innovative.
Modena V., P. Gattoni, M. Balconi, P. Vita-Finzi
27
4. SKILLED MANPOWER AND POTENTIAL ENTREPRENEURS’ CONCENTRATIONS 4.1 Introduction This chapter aims at identifying geographical concentrations of human resources and R&D activity in the different high-tech sectors that are present in the Italian Industry. First a general picture of the industrial and innovative activity according to regions is presented, then the distribution of skilled manpower and human resources is shown. Finally a measure of potential entrepreneurs concentration in specific fields is given according to local systems. 4.2 General industrial and R&D indicators per region The low participation of the south to the Italian economy is shown also by the data relating to industry and innovativeness, in spite of continuous efforts to create economic development in those regions. Indeed population was 36% of the total in 1992, but that area produced only 25% of total GDP and 16% of the industry value added (see Table 4.1). The north-west is the most industrialised area with 41.6% of total value added in the industrial sector and with a population of only 26.4% of the total. Considering R&D expenditure, the gap between north and south is even more striking: only 15.3% of total R&D expenditure is absorbed by the south, whereas Lombardia, Piemonte and Liguria together (the north-west) reach almost half the total expenditure (42.5%). Moreover, the north-west is by far the most important concentration area of large high-tech firms and it absorbs 61% of total R&D personnel in private and public enterprises (see table 4.1 below).

Modena V., P. Gattoni, M. Balconi, P. Vita-Finzi
28
Table 4.1: General economic indicators per region
REGIONS Population Population %
GDP % of TOT
Industry value added % of TOT
R&D Expenditure % of TOT
(1994) PIEMONTE/VALLE D'AOSTA 4,418,503 7.8 8.9 11.3 15.4
LOMBARDIA 8,856,074 15.6 19.6 27.3 23.6
TRENTINO ALTO ADIGE 890,360 1.6 1.9 1.4 0.8
VENETO 4,380,797 7.7 8.8 11.1 4.7
FRIULI VENEZIA GIULIA 1,197,666 2.1 2.4 2.2 2.5
LIGURIA 1,676,282 3.0 3.4 3.0 3.5
EMILIA ROMAGNA 3,909,512 6.9 8.4 9.7 7.4
TOSCANA 3,529,946 6.2 6.6 7.3 5.9
UMBRIA 811,831 1.4 1.3 1.4 0.9
MARCHE 1,429,205 2.5 2.6 2.7 1.0
LAZIO 5,140,371 9.1 10.5 6.6 19.0
ABRUZZO/MOLISE 1,579,954 2.8 2.4 2.1 1.8
CAMPANIA 5,630,280 9.9 6.9 4.1 5.4
PUGLIA 4,031,885 7.1 5.1 3.4 2.2
CALABRIA/BASILICATA 2,680,731 4.7 2.8 1.3 1.1
SICILIA 4,966,386 8.7 6.1 3.5 3.5
SARDEGNA 1,648,248 2.9 2.3 1.6 1.3
TOTAL 56,778,031 100.0 100.0 100.0 100.0
NORTH-WEST 14,950,859 26.4 31.9 41.6 42.5
NORTH-EAST 10,378,355 18.3 21.5 24.4 15.4
CENTRE 10,911,353 19.2 21 18 26.8
SOUTH AND ISLANDS 20,537,484 36.1 25.6 16 15.3
Source: Istat 1998 While the north-west regions show consistently a high industrial development together with a large R&D expenditure, correlation between the two indicators is not a rule for every region. Lazio, for example, absorbs 19% of the national R&D while its population is only 9.1%, but its share of industrial value added is only 6.6%. At the other extreme Veneto, which is contributing 11.1% of the industry value added, absorbs only 4.7% of the R&D expenditure.
Modena V., P. Gattoni, M. Balconi, P. Vita-Finzi
29
4.3 Skilled manpower and human resources distribution for high-tech sectors The most important indicators for the identification of potential entrepreneurs’ concentrations are those referring to human resources. While potential entrepreneurs are very peculiar individuals the number of whom is very difficult to measure, a number of common indicators regarding skilled manpower will be used here to compare the potentialities of different regions. Three indicators are used in this section for human resources distribution according to regions, while two additional indicators will be presented in the next section dealing with local systems: (1). The R&D personnel employed in public institutions and universities. (2). The R&D personnel employed in private and public enterprises. (3). The share of students enrolled in scientific faculties. The first and the second indexes are considered indicators of existing potential entrepreneurs, while the third gives an indication of the size of the population from where future high-tech entrepreneurs will emerge. Tables 4.2 and 4.3 show the distribution of students and R&D personnel per Region as a percentage of totals and per 1,000 population respectively. Data are consistent with those related to the general industrial activity shown above. Considering the total R&D personnel, the north-west reaches 37.9% of the total and the centre 28.4%. In particular the percentages of R&D personnel in enterprises are higher in Lombardia (33.2%) and Piemonte (24.5%), while percentages of R&D personnel in public institutions show the highest value for Lazio (27.4%) the region where Roma is located. It is important to note that Lombardia and Piemonte, that have the highest share of private industry and R&D have a lower than average share of R&D personnel in public institutions. Besides, the relative size of their academic institutions, as measured by the rate of students enrolled in science and technology, is not higher than the national average.

Modena V., P. Gattoni, M. Balconi, P. Vita-Finzi
30
Table 4.2: Percentage of students enrolled in scientific faculties and R&D personnel in enterprises and public institutions per Region.
REGIONS (A) Students enrolled
in scientific faculties
% of TOT
(B) R&D personnel in private and
public enterprises % of TOT
(C) R&D personnel in public institutions
(research inst., university, others)
% of TOT
(D=B+C) Total R&D personnel % of TOT
PIEMONTE/VALLE D'AOSTA 6.6 24.5 4.4 13.2
LOMBARDIA 15.0 33.2 11.9 21.2
TRENTINO ALTO ADIGE 0.7 0.5 0.9 0.7
VENETO 5.9 4.6 4.6 4.6
FRIULI VENEZIA GIULIA 2.1 2.2 2.1 2.2
LIGURIA 2.8 3.3 3.7 3.5
EMILIA ROMAGNA 10.4 7.6 8.1 7.9
TOSCANA 8.0 3.9 8.2 6.3
UMBRIA 2.1 0.4 1.8 1.2
MARCHE 2.7 0.6 1.6 1.2
LAZIO 11.9 9.9 27.4 19.7
ABRUZZO/MOLISE 2.4 2.0 2.0 2.0
CAMPANIA 10.0 4.1 8.8 6.7
PUGLIA 5.6 1.5 3.5 2.6
CALABRIA/BASILICATA 2.7 0.4 1.8 1.2
SICILIA 7.8 1.0 6.5 4.1
SARDEGNA 3.3 0.3 2.7 1.7
TOTAL 100.0 100.0 100.0 100.0
NORTH-WEST 24.4 61.0 20.0 37.9
NORTH-EAST 19.1 14.9 15.7 15.4
CENTRE 24.7 14.8 39.0 28.4
SOUTH AND ISLANDS 31.8 9.3 25.3 18.3
Source: Istat 1999, students 1998/99; Istat 1998, R&D 1994 data full time equivalent, absolute values: total number of students enrolled in scientific faculties 497,258; total R&D personnel 143,823; R&D personnel in private and public enterprises 63,105; R&D personnel in public institutions 80,718.
Modena V., P. Gattoni, M. Balconi, P. Vita-Finzi
31
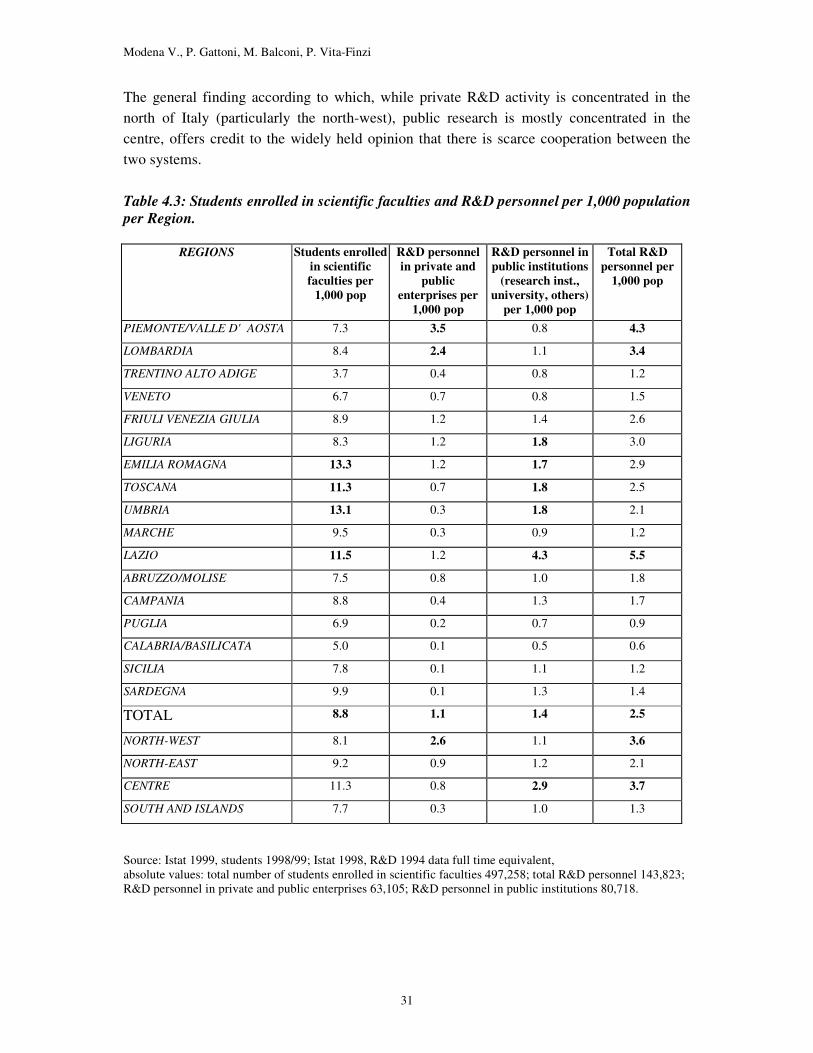
The general finding according to which, while private R&D activity is concentrated in the north of Italy (particularly the north-west), public research is mostly concentrated in the centre, offers credit to the widely held opinion that there is scarce cooperation between the two systems. Table 4.3: Students enrolled in scientific faculties and R&D personnel per 1,000 population per Region.
REGIONS Students enrolled in scientific faculties per
1,000 pop
R&D personnel in private and
public enterprises per
1,000 pop
R&D personnel in public institutions
(research inst., university, others)
per 1,000 pop
Total R&D personnel per
1,000 pop
PIEMONTE/VALLE D'AOSTA 7.3 3.5 0.8 4.3
LOMBARDIA 8.4 2.4 1.1 3.4
TRENTINO ALTO ADIGE 3.7 0.4 0.8 1.2
VENETO 6.7 0.7 0.8 1.5
FRIULI VENEZIA GIULIA 8.9 1.2 1.4 2.6
LIGURIA 8.3 1.2 1.8 3.0
EMILIA ROMAGNA 13.3 1.2 1.7 2.9
TOSCANA 11.3 0.7 1.8 2.5
UMBRIA 13.1 0.3 1.8 2.1
MARCHE 9.5 0.3 0.9 1.2
LAZIO 11.5 1.2 4.3 5.5
ABRUZZO/MOLISE 7.5 0.8 1.0 1.8
CAMPANIA 8.8 0.4 1.3 1.7
PUGLIA 6.9 0.2 0.7 0.9
CALABRIA/BASILICATA 5.0 0.1 0.5 0.6
SICILIA 7.8 0.1 1.1 1.2
SARDEGNA 9.9 0.1 1.3 1.4
TOTAL 8.8 1.1 1.4 2.5
NORTH-WEST 8.1 2.6 1.1 3.6
NORTH-EAST 9.2 0.9 1.2 2.1
CENTRE 11.3 0.8 2.9 3.7
SOUTH AND ISLANDS 7.7 0.3 1.0 1.3
Source: Istat 1999, students 1998/99; Istat 1998, R&D 1994 data full time equivalent, absolute values: total number of students enrolled in scientific faculties 497,258; total R&D personnel 143,823; R&D personnel in private and public enterprises 63,105; R&D personnel in public institutions 80,718.

Modena V., P. Gattoni, M. Balconi, P. Vita-Finzi
32
Public research institutions and universities show a concentration in the centre of the country mainly in relation to the capital city location. Roma indeed has a great attraction on students from different regions, and it is site of various important research institutions. Looking at the students and R&D personnel in public institutions per 1,000 population (table 4.3), it can be confirmed that the centre plays a dominant role with an average of 11.3 students and 2.9 R&D personnel in public institutions per 1,000 population. On the other hand, it must be noticed that Emilia-Romagna, located in the north-east is the region with the highest number of students in scientific faculties per 1,000 population: the indicator reaches a value of 13.3. 4.4 Potential entrepreneurs’ concentrations The problem of measuring the number of potential entrepreneurs is connected with finding a definition and a good measurable proxy for this concept. A potential entrepreneur in high-tech is somebody who has a high probability of creating a company based on a new technology. After looking at R&D personnel as a first general indicator, we find it useful to use as an approximated measure of this wide concept the number of individuals who have registered a patent relating to a high-tech sector. The rationale of such a choice lies in the fact that individuals that have filed a patent have at least once developed a new product or process. In other words, their level of professional creativity is likely to be higher than the average. However, in order to check for consistency, another commonly used indicator for the high-tech industry, distribution of employees, is presented. Moreover, the number of production units for local system are also presented (in Table 4.6) so as to distinguish between few-firms-systems and many-firms-systems. The basic geographical units chosen are the so-called local labour systems (LLS). A LLS is defined as a grouping of municipalities characterised by a high degree of self-contained flows of commuting workers (ISTAT, 1997). The rationale associated with this choice is that technology incubators, which are at the centre of this project, usually require new enterprises to be located in their premises, therefore the incubator’s radius of strongest influence is within commuting distance. In Italy there are 784 local systems covering all of 8,100 municipalities. A general picture of the patenting activity in Italy is given in Figure 4.1 which shows the distribution of inventors who have filed patents classified in the high-tech sectors. The total number of inventors, covering the period 1995-2000 adds up to 3,777. The general picture is consistent with the above discussion on high-tech activity according to regions, which sees the north-west and the Lazio region as leaders. However, focusing the attention on smaller geographical units permits some insights that would be lost at the level of regional analysis. Rome, for instance, stands alone in its surroundings whereas Milano shares its position with its hinterland. Catania emerges as the only centre in the south with a noteworthy patenting

Modena V., P. Gattoni, M. Balconi, P. Vita-Finzi
33
activity, but its position would not be remarkable in a regional perspective. The area of Bologna (Emilia-Romagna) also shows a significant activity.
Figure 4.1: Inventors in all high-tech sectors per Local Labour System
Source: Univeristy of Pavia elaboration on EPO data.
Σλλ91. σηπ
Σλλ91. σηπ1 − 67 − 2122 − 4445 − 8485 − 229230 − 826
1 - 67 - 2122 - 4445 - 8485 - 229230 - 826
Number of Inventors
Milano
Torino Bologna
Roma
Modena V., P. Gattoni, M. Balconi, P. Vita-Finzi
34
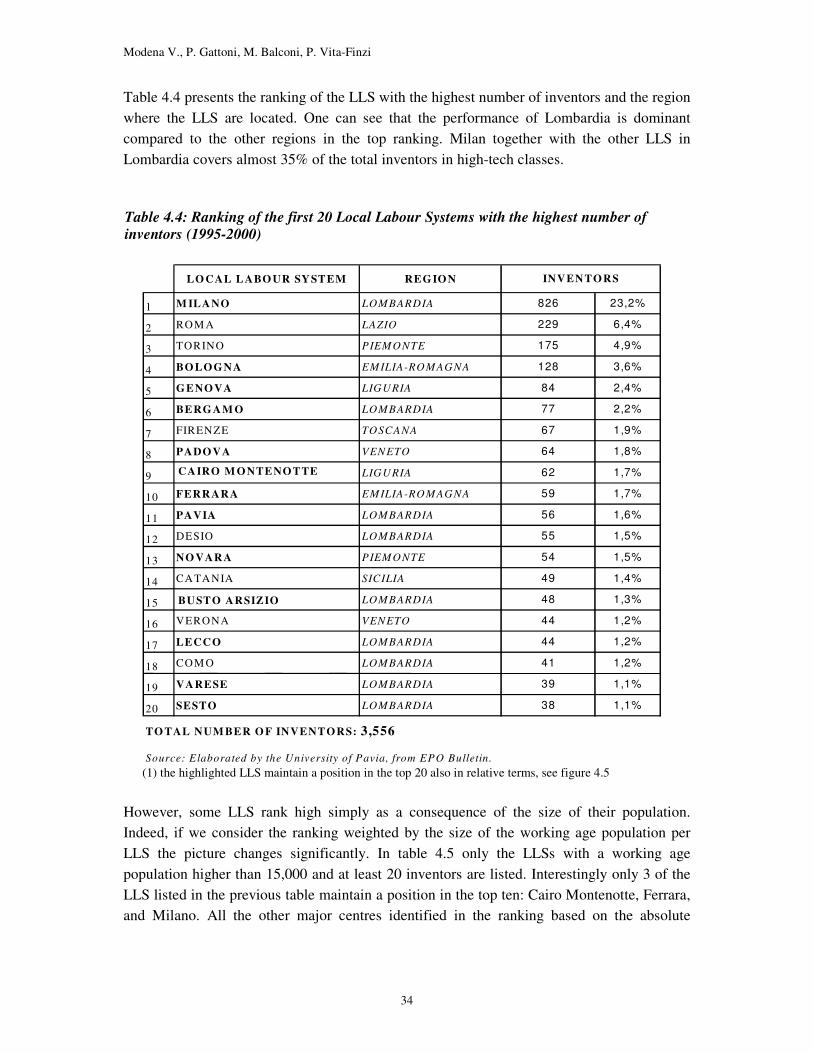
Table 4.4 presents the ranking of the LLS with the highest number of inventors and the region where the LLS are located. One can see that the performance of Lombardia is dominant compared to the other regions in the top ranking. Milan together with the other LLS in Lombardia covers almost 35% of the total inventors in high-tech classes.
(1) the highlighted LLS maintain a position in the top 20 also in relative terms, see figure 4.5
However, some LLS rank high simply as a consequence of the size of their population. Indeed, if we consider the ranking weighted by the size of the working age population per LLS the picture changes significantly. In table 4.5 only the LLSs with a working age population higher than 15,000 and at least 20 inventors are listed. Interestingly only 3 of the LLS listed in the previous table maintain a position in the top ten: Cairo Montenotte, Ferrara, and Milano. All the other major centres identified in the ranking based on the absolute
LO CAL LABO UR SYSTEM REGION
1 M ILANO LOMBARDIA 826 23,2%
2 ROM A LAZIO 229 6,4%
3 TORINO PIEMONTE 175 4,9%
4 BO LOGNA EMILIA-ROMAGNA 128 3,6%
5 GENOVA LIGURIA 84 2,4%
6 BERGAM O LOMBARDIA 77 2,2%
7 FIRENZE TOSCANA 67 1,9%
8 PADOVA VENETO 64 1,8%
9 CAIRO M ONTENOTTE LIGURIA 62 1,7%
10 FERRARA EMILIA-ROMAGNA 59 1,7%
11 PAVIA LOMBARDIA 56 1,6%
12 DESIO LOMBARDIA 55 1,5%
13 NO VARA PIEMONTE 54 1,5%
14 CATANIA SICILIA 49 1,4%
15 BUSTO ARSIZIO LOMBARDIA 48 1,3%
16 VERONA VENETO 44 1,2%
17 LECCO LOMBARDIA 44 1,2%
18 COM O LOMBARDIA 41 1,2%
19 VARESE LOMBARDIA 39 1,1%
20 SESTOCALENDE
LOMBARDIA 38 1,1%
INVENTORS
TO TAL NUM BER O F INVENTORS: 3,556
Source: Elaborated by the University of Pavia, from EPO Bulletin.
Table 4.4: Ranking of the first 20 Local Labour Systems with the highest number of inventors (1995-2000)
Modena V., P. Gattoni, M. Balconi, P. Vita-Finzi
35
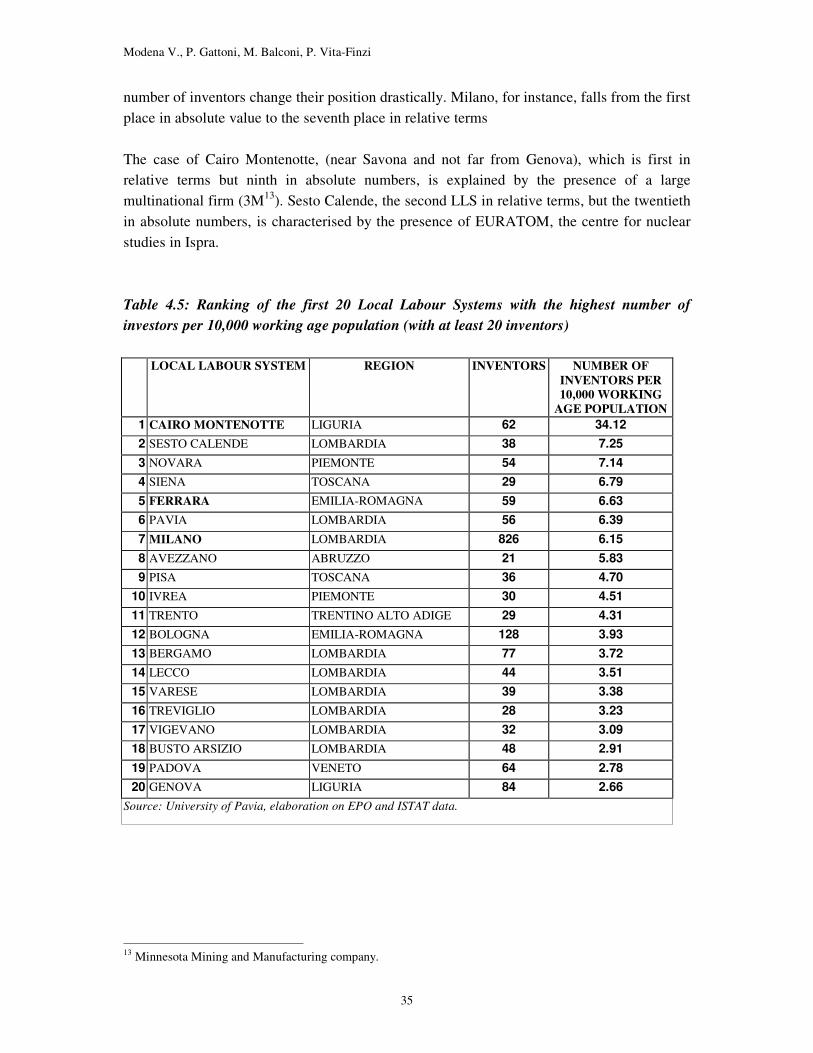
number of inventors change their position drastically. Milano, for instance, falls from the first place in absolute value to the seventh place in relative terms The case of Cairo Montenotte, (near Savona and not far from Genova), which is first in relative terms but ninth in absolute numbers, is explained by the presence of a large multinational firm (3M13). Sesto Calende, the second LLS in relative terms, but the twentieth in absolute numbers, is characterised by the presence of EURATOM, the centre for nuclear studies in Ispra. Table 4.5: Ranking of the first 20 Local Labour Systems with the highest number of investors per 10,000 working age population (with at least 20 inventors)
LOCAL LABOUR SYSTEM REGION INVENTORS NUMBER OF INVENTORS PER 10,000 WORKING
AGE POPULATION 1 CAIRO MONTENOTTE LIGURIA 62 34.12 2 SESTO CALENDE LOMBARDIA 38 7.25 3 NOVARA PIEMONTE 54 7.14 4 SIENA TOSCANA 29 6.79 5 FERRARA EMILIA-ROMAGNA 59 6.63 6 PAVIA LOMBARDIA 56 6.39 7 MILANO LOMBARDIA 826 6.15 8 AVEZZANO ABRUZZO 21 5.83 9 PISA TOSCANA 36 4.70
10 IVREA PIEMONTE 30 4.51 11 TRENTO TRENTINO ALTO ADIGE 29 4.31 12 BOLOGNA EMILIA-ROMAGNA 128 3.93 13 BERGAMO LOMBARDIA 77 3.72 14 LECCO LOMBARDIA 44 3.51 15 VARESE LOMBARDIA 39 3.38 16 TREVIGLIO LOMBARDIA 28 3.23 17 VIGEVANO LOMBARDIA 32 3.09 18 BUSTO ARSIZIO LOMBARDIA 48 2.91 19 PADOVA VENETO 64 2.78 20 GENOVA LIGURIA 84 2.66
Source: University of Pavia, elaboration on EPO and ISTAT data.
13 Minnesota Mining and Manufacturing company.
Modena V., P. Gattoni, M. Balconi, P. Vita-Finzi
36
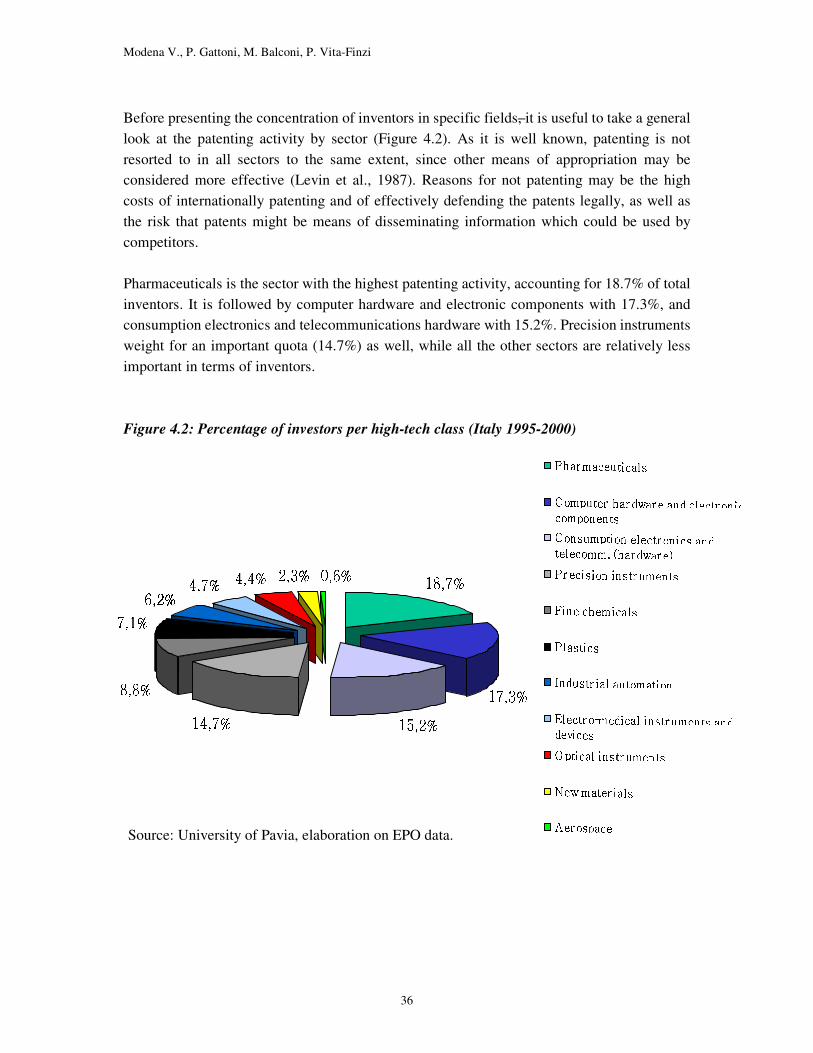
Before presenting the concentration of inventors in specific fields, it is useful to take a general look at the patenting activity by sector (Figure 4.2). As it is well known, patenting is not resorted to in all sectors to the same extent, since other means of appropriation may be considered more effective (Levin et al., 1987). Reasons for not patenting may be the high costs of internationally patenting and of effectively defending the patents legally, as well as the risk that patents might be means of disseminating information which could be used by competitors. Pharmaceuticals is the sector with the highest patenting activity, accounting for 18.7% of total inventors. It is followed by computer hardware and electronic components with 17.3%, and consumption electronics and telecommunications hardware with 15.2%. Precision instruments weight for an important quota (14.7%) as well, while all the other sectors are relatively less important in terms of inventors. Figure 4.2: Percentage of investors per high-tech class (Italy 1995-2000)
� ����*��������
� ����*�����"��� ��� ����������
� �������"��
� ����3������ ������ �
¡ ¡ � �V¢¢� ¡ ¡ � � ¡ ¡ £ £�¤¤V¥¥�¦¦ § §�¨¨�©©"ªª
« «�¬¬ ¨ ¨��ªª
®�¯®�¯�°°²±±,³³´°¶µ°¶µ,··¶¸¸º¹¹�»»¼µ,°µ¶°²½½¼¾¾
¿ ¿ÁÀÀ²ÂÂÄÃÃÆÅÅ�ÇǼÈÈ²É ÉÁÊÊ�Ë˲ÉÉÆÌÌÎÍ Í�Ë˲ÉÉÆÈÈÁËË,ÏϺÌ�ÈÌÁȲÐÐ�ÈȶѲÇѲÇ�É É¶ÀÀ,ÏÏ�ÒÒ¼ÑÑÑ Ñ,À ÀÎÂÂÓöÀöÀ,ÏϺÈȲÏϺÇǼÔÔ¿ ¿ÁÀÀ,ÏÏ�ÔÔ,Å�ÂÅ�´ÃÃ,ÇÇ�ÒÒ¼ÀÀ,ÏÏ´ÈȲÐÐ�ÈȶÑÑ,Ç ÇDÉ É¶ÀÀ,ÏÏ�ÒÒ¼ÑÑ,ÔÔ�Ë˲ÏÏ�ÌÌÕ Õ¼ÖÖ,××�ÖÖ,ØضÙÙÎÚ´ÚÚÄÚÜÛÛÎÝÝDÞÞ�ßß,àà¶áá²ââ*ßß²à à¶ÖÖ,ããä ä à à¶Ö Ö,ØØ,åå¼ææ²å å¼ÙÙ²ç´åDçç´å�çºææ,ÕÕ�ààÆè�Úè�ÚéÖÖ²çç�ÕÕ¼æ æ
ê ê�ëë�ìì�ííÁîî,ïïºííÎððÓëë�î,ñî,ñ,òò¼óó
ô�òô�ò¼ññ,ó ó²õõ�ëë�îî¶óó
ö ö�÷÷�øø,ù ù�úú,ûû�üü¶ýý�þþ,ÿ ÿºþþ¶ùù�ûû����� �´þ²ûþ²û�ý ý���²÷÷
� ���������� ������������������������������ ������ ��������������� ����������� ! !�""$##�% %!!�&&
' ')((**,++�-�.-�.�/�+/�+ 00�11�* * 22�3�43�4655�00�**�11
7 7988�::<;;6=�>=>�88�??�@@�==AA BB
C CEDDFF�G GHHII�J�KJ�KDD
PERCENTAGE OF INVENTORS PER HIGH-TECH CLASS
Source: University of Pavia, elaboration on EPO data.
Modena V., P. Gattoni, M. Balconi, P. Vita-Finzi
37
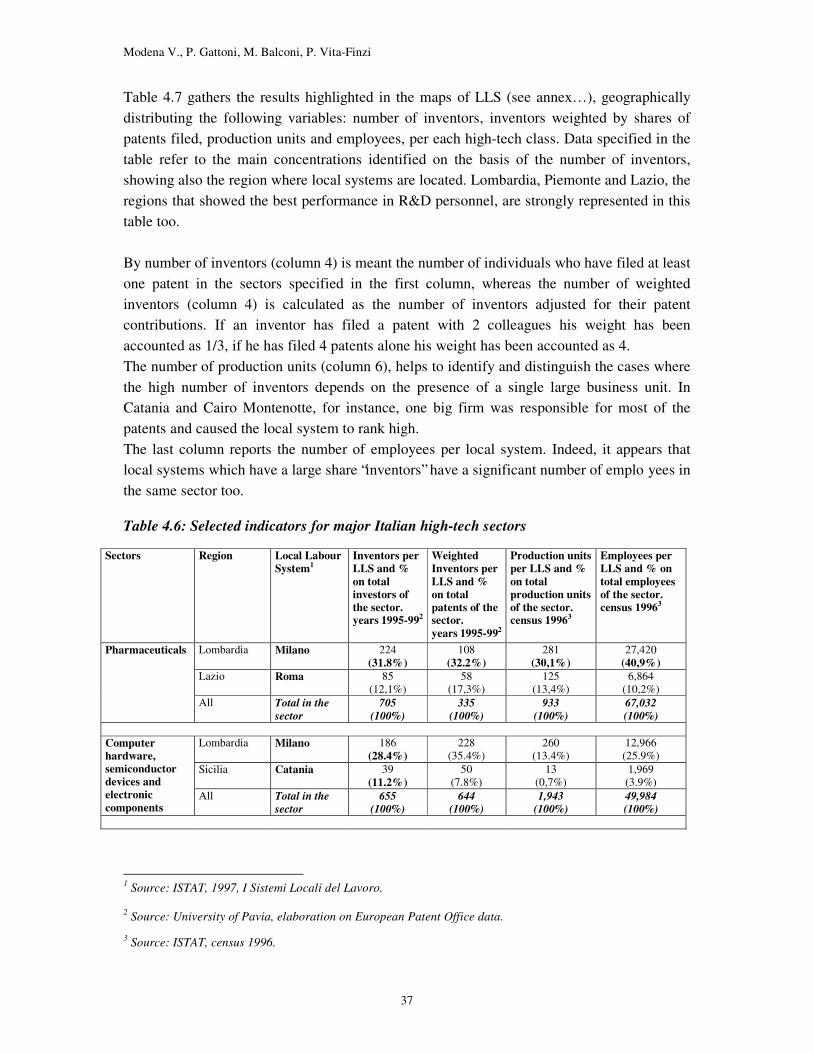
Table 4.7 gathers the results highlighted in the maps of LLS (see annex…), geographically distributing the following variables: number of inventors, inventors weighted by shares of patents filed, production units and employees, per each high-tech class. Data specified in the table refer to the main concentrations identified on the basis of the number of inventors, showing also the region where local systems are located. Lombardia, Piemonte and Lazio, the regions that showed the best performance in R&D personnel, are strongly represented in this table too. By number of inventors (column 4) is meant the number of individuals who have filed at least one patent in the sectors specified in the first column, whereas the number of weighted inventors (column 4) is calculated as the number of inventors adjusted for their patent contributions. If an inventor has filed a patent with 2 colleagues his weight has been accounted as 1/3, if he has filed 4 patents alone his weight has been accounted as 4. The number of production units (column 6), helps to identify and distinguish the cases where the high number of inventors depends on the presence of a single large business unit. In Catania and Cairo Montenotte, for instance, one big firm was responsible for most of the patents and caused the local system to rank high. The last column reports the number of employees per local system. Indeed, it appears that local systems which have a large share “inventors” have a significant number of emplo yees in the same sector too. Table 4.6: Selected indicators for major Italian high-tech sectors
Sectors Region Local Labour System1
Inventors per LLS and % on total investors of the sector. years 1995-992
Weighted Inventors per LLS and % on total patents of the sector. years 1995-992
Production units per LLS and % on total production units of the sector. census 19963
Employees per LLS and % on total employees of the sector. census 19963
Pharmaceuticals Lombardia Milano 224 (31.8%)
108 (32.2%)
281 (30,1%)
27,420 (40,9%)
Lazio Roma 85 (12,1%)
58 (17,3%)
125 (13,4%)
6,864 (10,2%)
All Total in the sector
705 (100%)
335 (100%)
933 (100%)
67,032 (100%)
Lombardia Milano 186
(28.4%) 228
(35.4%) 260
(13.4%) 12,966
(25.9%) Sicilia Catania 39
(11.2%) 50
(7.8%) 13
(0,7%) 1,969
(3.9%)
Computer hardware, semiconductor devices and electronic components
All Total in the sector
655 (100%)
644 (100%)
1,943 (100%)
49,984 (100%)
1 Source: ISTAT, 1997, I Sistemi Locali del Lavoro. 2 Source: University of Pavia, elaboration on European Patent Office data. 3 Source: ISTAT, census 1996.
Modena V., P. Gattoni, M. Balconi, P. Vita-Finzi
38
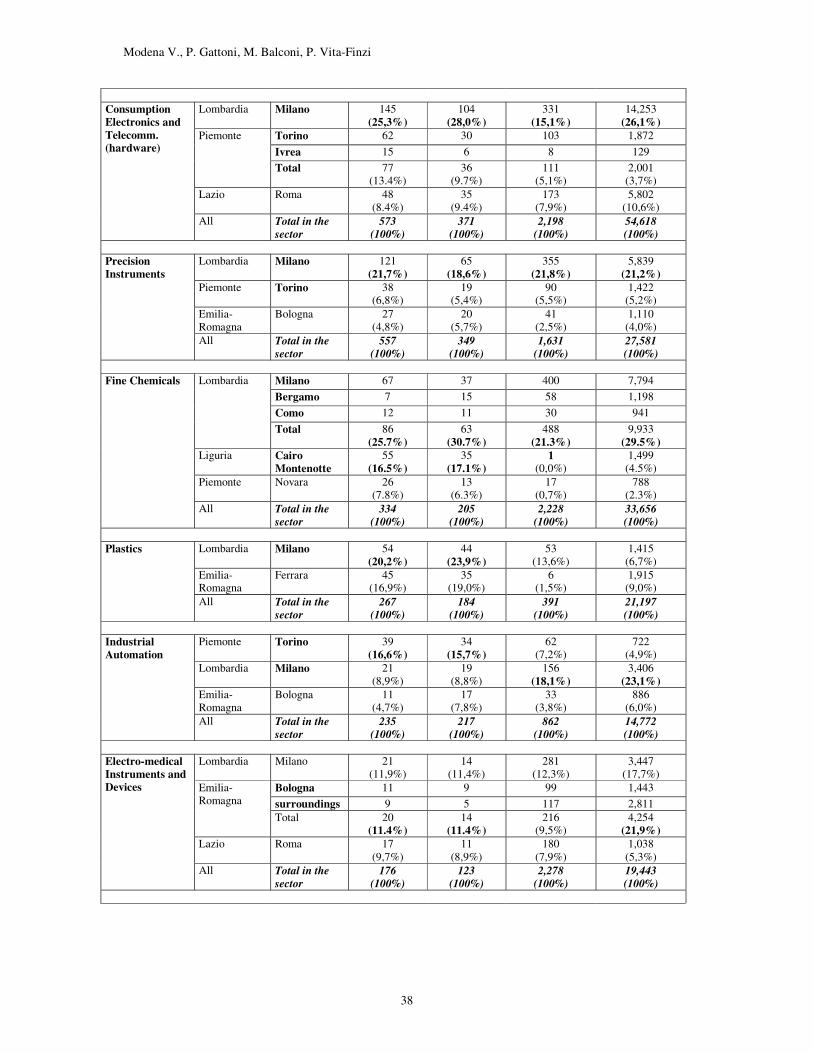
Lombardia Milano 145
(25,3%) 104
(28,0%) 331
(15,1%) 14,253
(26,1%) Piemonte Torino 62 30 103 1,872
Consumption Electronics and Telecomm. (hardware) Ivrea 15 6 8 129 Total 77
(13.4%) 36
(9.7%) 111
(5,1%) 2,001
(3,7%) Lazio Roma 48
(8.4%) 35
(9.4%) 173
(7,9%) 5,802
(10,6%) All Total in the
sector 573
(100%) 371
(100%) 2,198
(100%) 54,618 (100%)
Precision Instruments
Lombardia Milano 121 (21,7%)
65 (18,6%)
355 (21,8%)
5,839 (21,2%)
Piemonte Torino 38 (6,8%)
19 (5,4%)
90 (5,5%)
1,422 (5,2%)
Emilia- Romagna
Bologna 27 (4,8%)
20 (5,7%)
41 (2,5%)
1,110 (4,0%)
All Total in the sector
557 (100%)
349 (100%)
1,631 (100%)
27,581 (100%)
Fine Chemicals Lombardia Milano 67 37 400 7,794 Bergamo 7 15 58 1,198 Como 12 11 30 941 Total 86
(25.7%) 63
(30.7%) 488
(21.3%) 9,933
(29.5%) Liguria Cairo
Montenotte 55
(16.5%) 35
(17.1%) 1
(0,0%) 1,499
(4.5%) Piemonte Novara 26
(7.8%) 13
(6.3%) 17
(0,7%) 788
(2.3%)
All Total in the sector
334 (100%)
205 (100%)
2,228 (100%)
33,656 (100%)
Plastics Lombardia Milano 54
(20,2%) 44
(23,9%) 53
(13,6%) 1,415
(6,7%) Emilia-
Romagna Ferrara 45
(16,9%) 35
(19,0%) 6
(1,5%) 1,915
(9,0%) All Total in the
sector 267
(100%) 184
(100%) 391
(100%) 21,197 (100%)
Industrial Automation
Piemonte Torino 39 (16,6%)
34 (15,7%)
62 (7,2%)
722 (4,9%)
Lombardia Milano 21 (8,9%)
19 (8,8%)
156 (18,1%)
3,406 (23,1%)
Emilia-Romagna
Bologna 11 (4,7%)
17 (7,8%)
33 (3,8%)
886 (6,0%)
All Total in the sector
235 (100%)
217 (100%)
862 (100%)
14,772 (100%)
Lombardia Milano 21
(11,9%) 14
(11,4%) 281
(12,3%) 3,447
(17,7%) Electro-medical Instruments and Devices Bologna 11 9 99 1,443 surroundings 9 5 117 2,811
Emilia- Romagna
Total 20 (11.4%)
14 (11.4%)
216 (9,5%)
4,254 (21,9%)
Lazio Roma 17 (9,7%)
11 (8,9%)
180 (7,9%)
1,038 (5,3%)
All Total in the sector
176 (100%)
123 (100%)
2,278 (100%)
19,443 (100%)
Modena V., P. Gattoni, M. Balconi, P. Vita-Finzi
39
Optical Instruments and
Lombardia Milano 27 (16,4%)
14 (10,6%)
64 (4,0%)
692 (9,3%)
Materials Piemonte Torino 14 (8,5%)
9 (6,8%)
46 (2,9%)
103 (1,4%)
Toscana Firenze 11 (6,7%)
15 (11,4%)
43 (2,7%)
281 (3,8%)
All Total in the sector
165 (100%)
132 (100%)
1,609 (100%)
7,440 (100%)
New Materials Lazio Roma 13
(14,8%) 4
(8,9%) n.a. n.a.
Lombardia Bergamo 11 5 n.a. n.a. Milano 7 6 n.a. n.a. Total 18
(20,5%) 11
(24,4%) n.a. n.a.
All Total in the sector
88 (100%)
45 (100%)
n.a. n.a.
Aerospace Lombardia Lecco 3 1 1 1 Gallarate 2 3 6 2,978 Total 5
(22,7%) 4
(23,5%) 7
(5,4%) 2,979
(9,5%) Lazio Roma 3
(13,6%) 4
(23,5%) 18
(14,0%) 2,527
(8,0%) All Total in the
sector 22
(100%) 17
(100%) 129
(100%) 31,491 (100%)
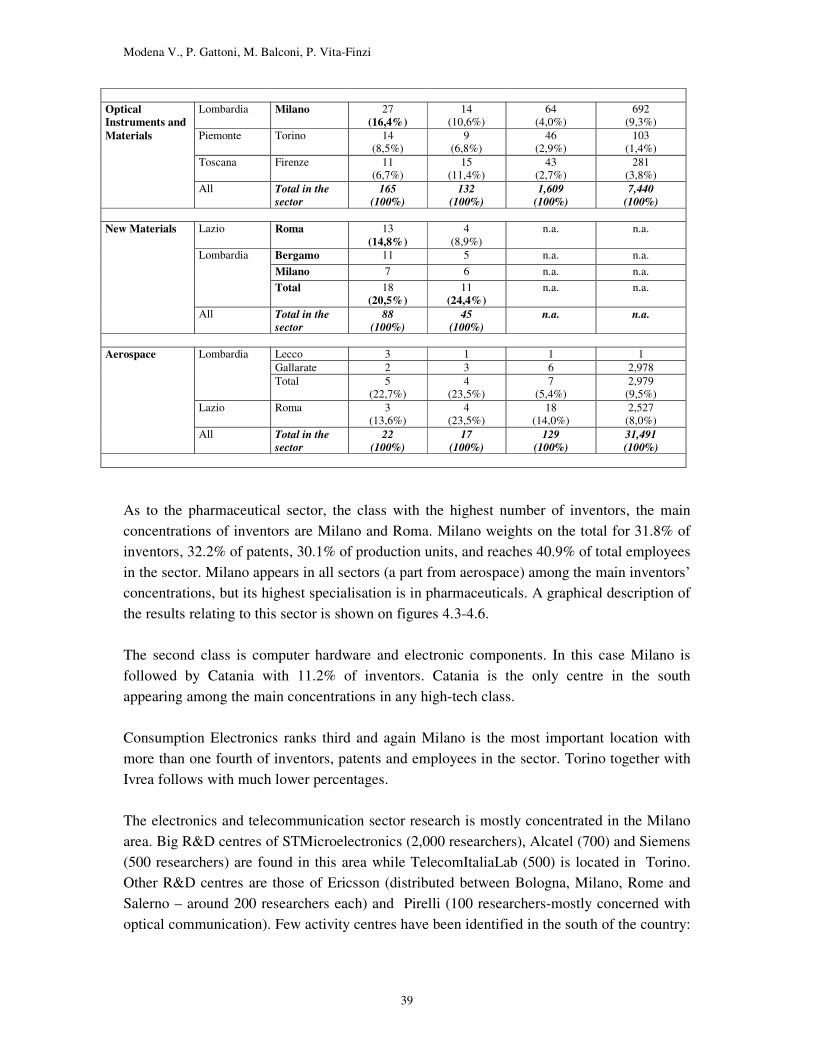
As to the pharmaceutical sector, the class with the highest number of inventors, the main concentrations of inventors are Milano and Roma. Milano weights on the total for 31.8% of inventors, 32.2% of patents, 30.1% of production units, and reaches 40.9% of total employees in the sector. Milano appears in all sectors (a part from aerospace) among the main inventors’ concentrations, but its highest specialisation is in pharmaceuticals. A graphical description of the results relating to this sector is shown on figures 4.3-4.6. The second class is computer hardware and electronic components. In this case Milano is followed by Catania with 11.2% of inventors. Catania is the only centre in the south appearing among the main concentrations in any high-tech class. Consumption Electronics ranks third and again Milano is the most important location with more than one fourth of inventors, patents and employees in the sector. Torino together with Ivrea follows with much lower percentages. The electronics and telecommunication sector research is mostly concentrated in the Milano area. Big R&D centres of STMicroelectronics (2,000 researchers), Alcatel (700) and Siemens (500 researchers) are found in this area while TelecomItaliaLab (500) is located in Torino. Other R&D centres are those of Ericsson (distributed between Bologna, Milano, Rome and Salerno – around 200 researchers each) and Pirelli (100 researchers-mostly concerned with optical communication). Few activity centres have been identified in the south of the country:
Modena V., P. Gattoni, M. Balconi, P. Vita-Finzi
40
Catania (ST-microelectronics – around 1,000 researchers), Salerno (Ericsson - 100-200 researchers) and Avellino (Bull – around 200 researchers)14. Industrial automation is mostly found around the big car factories of Torino and Milano. However the share of inventors of these two local systems is not so high as in other sectors. The only important locations in the ‘third Italy’ are Ferrara for plastics and Bologna for precision instruments, industrial automation, and electro-medical instruments and devices. Firenze is significant in the fields of optical instruments and materials. All the other concentrations, a part from Roma and Catania, are located in the north of the country. From the above data, it is quite clear that the area of Milano is the most innovative in Italy; however, its human resources are distributed in different sectors, and in none of them is the area particularly strong at the international level. It must be mentioned that not all areas that are known for their high-tech activities are represented in by the patenting activity. The greater Pisa area in Toscana, for example, is known for the excellency of its schools (Scuola Normale di Pisa, Scuola St. Anna) particularly in the field of computers science and physics, two cases of sectors in which patenting is not common.
14 These data have been gathered by the University of Pavia by surveying the 10 biggest companies in this sector.

Modena V., P. Gattoni, M. Balconi, P. Vita-Finzi
41
4.5 Summary
1. The south confirms its delay against other regions, both in terms of industrial and R&D activity, the only noteworthy exception being the area of Catania.
2. Industrial development and R&D activities are correlated in the north-west of Italy,
However Rome has a strong R&D activity but a low industrial development and Veneto has a strong industrial development with a low level of R&D activity.
3. The areas of Torino (Piemonte), Milano (Lombardia) Bologna (Emilia-Romagna) and
Roma (Lazio) appear to be the most active in terms of R&D.
4. While Milano and Torino are mostly strong in the private sector, Rome is only competitive with respect to public research.
5. While Milan shares its innovation activity with the towns around it, Rome is a stand-
alone in the centre of the country.
6. Catania (Sicilia) and Cairo Montenotte (Liguria) are two interesting concentrations of potential entrepreneurs in the fields of chemistry and semiconductors respectively stemming from only one large firm.

Modena V., P. Gattoni, M. Balconi, P. Vita-Finzi
42
#
ROMA
#
MILANO
Sll91.shp
Sll91.shp1 - 34 - 78 - 1516 - 2728 - 8586 - 224
Number of inventors
Total inventors in pharmaceuticals (years 1995-2000): 705
Inventors in pharmaceuticals per Local Labour System
k
MILANO
k
ROMA
Sll91.shp
Sll91.shp0.14 - 1.241.24 - 3.593.59 - 7.57.5 - 18.318.3 - 58.1358.13 - 107.67
Number of patents
Total patents in pharmaceuticals (years 1995-2000): 335
Patent applications in pharmaceuticals per Local Labour System
Figures 4.3 to 4.6: Pharmaceutical sector

Modena V., P. Gattoni, M. Balconi, P. Vita-Finzi
43
k
MILANO
k
ROMA
Sll91.shp
Sll91.shp1 - 23 - 78 - 1516 - 3637 - 125126 - 281
Number of production units
Total production units of pharmaceuticals (year 1996): 933
Production units of pharmaceuticals’ firms per Local Labour System
k
MILANO
k
ROMA
Sll91.shp
Sll91.shp1 - 200201 - 739740 - 18501851 - 34853486 - 68646865 - 27420
Number of employees
Total employees in pharmaceuticals (year 1996): 67,032
Employees of pharmaceuticals’ firms per Local Labour System

Modena V., P. Gattoni, M. Balconi, P. Vita-Finzi
44

Modena V., P. Gattoni, M. Balconi, P. Vita-Finzi
45
REFERENCES ARCHIBUGI D., EVANGELISTA R., PERANI G., RAPITI F., 1996, L’innovazione nelle imprese italiane: un’analisi dai risultati dell’indagine ISTAT, Economia e Politica Industriale, n. 89, pp. 147-185; EDQUIST C. (ed.), 1997, Systems of Innovation: Technologies, Institutions and Organisations, Pinter, London and Washington; EUROSTAT, 1996, R&D statistics; EUROSTAT, 1994-1996, Community Innovation Survey; FARMINDUSTRIA, 2000, Fatti e cifre, www.servizi.farmindustria.it/fatcifre/fatcifre.htm ; FERRARI S., GUERRIERI P., MALERBA F., MARIOTTI S., PALMA D. (a cura di), 1999, L’Italia nella competizione tecnologica internazionale, secondo rapporto, ENEA-Università di Roma “La Sapienza” -CESPRI-Politecnico di Milano, Franco Angeli, Milano; ISTAT, 1997, I sistemi locali del lavoro 1991, Argomenti, n. 10; ISTAT, 1998, Statistiche sulla ricerca scientifica e l’innovazione tecnologica, Collana informazioni, n. 59; LEVIN R.C., LEVORICK A.K., NELSON R., WINTER S., 1987, Appropriating the return from industrial research and development, Brookings Papers on Economic Activity, no. 3; LUNDVALL B.A., 1998, Innovation as an interactive process: from user-producer interaction to the national system of innovation, in Dosi G., Freeman C., Nelson R., Silverberg G., soete L. (eds.), Technical change and Economic Theory, Pinter, London; LUNDVALL B.A. (ed.), 1992, National Systems of Innovation. Towards a Theory of Innovation and Interactive Learning, Pinter, London and New York; MALERBA F., 1993, The national system of innovation: Italy, in National Innovation Systems. A comparative analysis, Nelson R.R. (ed.); MALERBA F., GAVETTI G., 1996, Il sistema innovativo italiano e l’Europa, Economia e politica industriale, n. 89; MURST, 1999, Il sistema universitario italiano. La popolazione studentesca. Il personale a.a. 1998/1999, Sistema Statistico Nazionale;
Modena V., P. Gattoni, M. Balconi, P. Vita-Finzi
46
NELSON R.R., 1993, National Innovation Systems. A Comparative Analysis, Oxford University Press, New York; OAKEY R.P. COOPER S.Y., 1989, High Technology Industry, Agglomeration and the Potential for Peripherally Sited Small Firms, Regional Studies, Vol. 23.4, pp. 347-360; OECD, 1994, The measurement of scientific and technological activities. Using patent data as science and technology indicators. Patent manual, Paris; OECD, 1996, Main industrial Indicators; OECD, 1998, Main Scientific and Technology Indicators; PATEL P., PAVITT, 1994, National Innovation Systems: Why they are important, and how they might be measured and compared, Economic Innovation and New Technology, Vol. 3, pp. 77-95 SANCIN P., 1999, R&S, innovazione tecnologica e sviluppo del territorio: il ruolo dei Parchi scientifici, Area Science Park, Trieste, n. 9; SAXENIAN A., 1983, The genesis of Silicon Valley, Built environment, Vol.9, No.1, pp.7-17; SEGAL, QUINCE, 1985, The Cambridge phenomenon, The Thetford Press, Norfolk; TODTLING F., 1994, Regional networks of high-technology firms. The case of the greater Boston region, Technovation, Vol.14, No.5, pp.323-343; www.istat.it, Note rapide, istat. http://cens.istat.it

Modena V., P. Gattoni, M. Balconi, P. Vita-Finzi
47