the infrastructure sector in india 2012 - idfc increased from 75 per cent in october 2011 to 77 per...
TRANSCRIPT

The Indian infrastructure sector continues its sluggish journey in 2012, marked by poor macroeconomic
forces, policy gridlock and political instability. Delays in land acquisition and environmental clearances continue to be key areas of concern, while the poor enforcement of contracts, ineff ective monitoring and high input costs are also factors that are hindering growth. Nonetheless, some areas have wit-nessed progress. The telecom sector saw the emergence of the National Telecom Policy, a cohesive document covering a broad range of communication services. In both civil aviation and power sectors, the Government of India has approved foreign investment of 49 per cent, bringing relief to the heav-ily leveraged public and private companies. However, several events in the infrastructure sector have been disappointing this year — the telecom sector dealt with the fallout of the 2G scam, the power sector witnessed the coal scam and the grid collapse, the roads and urban sectors saw the poor private participation, and the civil aviation sector witnessed the poor fi nancial health of the airport and airline operators. The end of the 11th Five-Year Plan saw India missing targets in infrastructure development in sectors such as railways,
ports, electricity, and airports, while investing beyond the budgeted investment in others — the roads and telecom sectors (Table 1). Overall, `19.45 trillion was invested in Indian infrastructure between fi scal years 2007–08 and 2011–12, 95 per cent of the projected `20.56 trillion. The 12th Five-Year Plan projects the total investment in infrastructure during the period to be `51.46 trillion, with 47 per cent contributed by private participation and 53 per cent by the central and state governments. Table 2 shows the breakup of these investments across various infrastructure sectors. This chapter addresses the achievements, policy develop-ments and problems faced by various sectors during the cal-endar year 2012. Physical and fi nancial progress are tracked in these crucial sectors, along with the introduction of new policies and participation of the private sector.
TELECOMMUNICATIONS
By October 2012, the wireless subscriber base in India had increased to 938 million, consisting of 596 million urban
The Infrastructure Sector in India 2012
Megha Maniar
TABLE 1 11th Five-Year Plan Investment in Infrastructure (at 2006–07 prices)
Sector Projected Investment Actual Investment Actual Investment as Proportion of (` in trillion) (` in trillion) Projected Investment (in per cent)
Electricity 6.66 6.35 95
Roads 3.14 3.62 115
Telecommunications 2.58 3.36 130
Railways 2.62 1.95 75
Ports 0.88 0.35 40
Airports 0.31 0.29 95
Others* 4.37 3.53 81
Total 20.56 19.45 95
Source: High Level Committee on Financing Infrastructure (2012).
Note: *Others include irrigation, water supply and sanitation, storage, and oil and gas pipelines.
250 India Infrastructure Report 2012
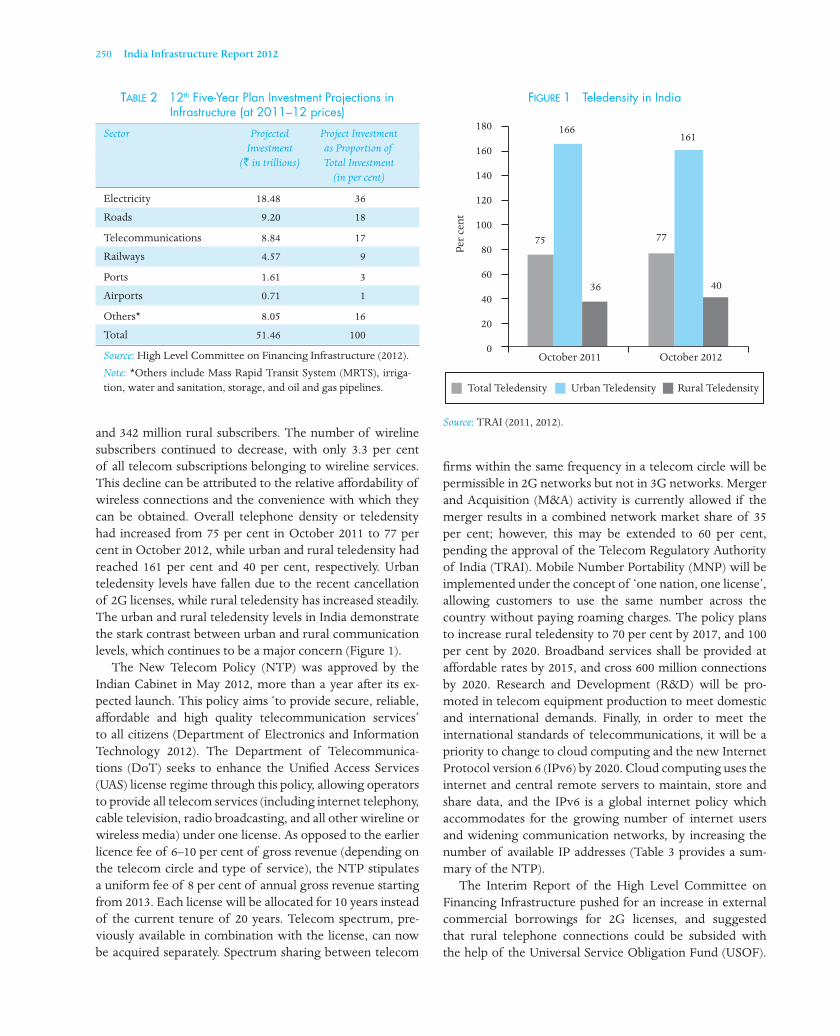
and 342 million rural subscribers. The number of wireline subscribers continued to decrease, with only 3.3 per cent of all telecom subscriptions belonging to wireline services. This decline can be attributed to the relative aff ordability of wireless connections and the convenience with which they can be obtained. Overall telephone density or teledensity had increased from 75 per cent in October 2011 to 77 per cent in October 2012, while urban and rural teledensity had reached 161 per cent and 40 per cent, respectively. Urban teledensity levels have fallen due to the recent cancellation of 2G licenses, while rural teledensity has increased steadily. The urban and rural teledensity levels in India demonstrate the stark contrast between urban and rural communication levels, which continues to be a major concern (Figure 1). The New Telecom Policy (NTP) was approved by the Indian Cabinet in May 2012, more than a year after its ex-pected launch. This policy aims ‘to provide secure, reliable, aff ordable and high quality telecommunication services’ to all citizens (Department of Electronics and Information Technology 2012). The Department of Telecommunica-tions (DoT) seeks to enhance the Unifi ed Access Services (UAS) license regime through this policy, allowing operators to provide all telecom services (including internet telephony, cable television, radio broadcasting, and all other wireline or wireless media) under one license. As opposed to the earlier licence fee of 6–10 per cent of gross revenue (depending on the telecom circle and type of service), the NTP stipulates a uniform fee of 8 per cent of annual gross revenue starting from 2013. Each license will be allocated for 10 years instead of the current tenure of 20 years. Telecom spectrum, pre-viously available in combination with the license, can now be acquired separately. Spectrum sharing between telecom
fi rms within the same frequency in a telecom circle will be permissible in 2G networks but not in 3G networks. Merger and Acquisition (M&A) activity is currently allowed if the merger results in a combined network market share of 35 per cent; however, this may be extended to 60 per cent, pending the approval of the Telecom Regulatory Authority of India (TRAI). Mobile Number Portability (MNP) will be implemented under the concept of ‘one nation, one license’, allowing customers to use the same number across the country without paying roaming charges. The policy plans to increase rural teledensity to 70 per cent by 2017, and 100 per cent by 2020. Broadband services shall be provided at aff ordable rates by 2015, and cross 600 million connections by 2020. Research and Development (R&D) will be pro-moted in telecom equipment production to meet domestic and international demands. Finally, in order to meet the international standards of telecommunications, it will be a priority to change to cloud computing and the new Internet Protocol version 6 (IPv6) by 2020. Cloud computing uses the internet and central remote servers to maintain, store and share data, and the IPv6 is a global internet policy which accommodates for the growing number of internet users and widening communication networks, by increasing the number of available IP addresses (Table 3 provides a sum-mary of the NTP). The Interim Report of the High Level Committee on Financing Infrastructure pushed for an increase in external commercial borrowings for 2G licenses, and suggested that rural telephone connections could be subsided with the help of the Universal Service Obligation Fund (USOF).
TABLE 2 12th Five-Year Plan Investment Projections in Infrastructure (at 2011–12 prices)
Sector Projected Project Investment Investment as Proportion of (` in trillions) Total Investment (in per cent)
Electricity 18.48 36
Roads 9.20 18
Telecommunications 8.84 17
Railways 4.57 9
Ports 1.61 3
Airports 0.71 1
Others* 8.05 16
Total 51.46 100
Source: High Level Committee on Financing Infrastructure (2012).Note: *Others include Mass Rapid Transit System (MRTS), irriga-tion, water and sanitation, storage, and oil and gas pipelines.
FIGURE 1 Teledensity in India
Source: TRAI (2011, 2012).
180
160
140
120
100
80
60
40
20
0
Per c
ent
75 77
4036
166161
Total Teledensity Urban Teledensity Rural Teledensity
October 2011 October 2012

The Infrastructure Sector in India 2012 251
The Committee also stipulated that if the Foreign Direct Investment (FDI) limit in the sector was increased, safeguards should be implemented to protect domestic interests. Growth in broadband services has slowed down recently. Despite the target of reaching 20 million subscribers by 2010, as envisaged in the Broadband Policy of 2004, the number of broadband subscribers had only reached 15.08 million in October 2012. TRAI issued guidelines for a National Broadband Policy in 2010 and proposed the establishment of a nation-wide broadband network which would connect all areas with populations of 500 people or more. This plan aims to increase the number of subscribers to 75 million in 2012 and 154 million by 2014. Based on this, the DoT has been working on a National Broadband Plan but no con-crete steps have been taken. The National Optical Fibre Network (NOFN) project, approved and launched in November 2011, will continue to expand broadband services to about 250,000 gram panchayats by 2014. By providing connectivity to these public institutions, the network will facilitate governance, education, health, and commerce at the grassroots level. Requiring an investment of `200 bil-lion over two years, NOFN will be funded by the USOF and executed by a special purpose vehicle — Bharat Broadband Network Ltd (BBNL). BBNL should be operational by November 2013. The Rural Wireline Broadband Policy was launched in 2009 under Bharat Nirman, funded and managed by USOF. Facilitated by Bharat Sanchar Nigam Limited (BSNL), 900,000 broadband connections need to be provided to
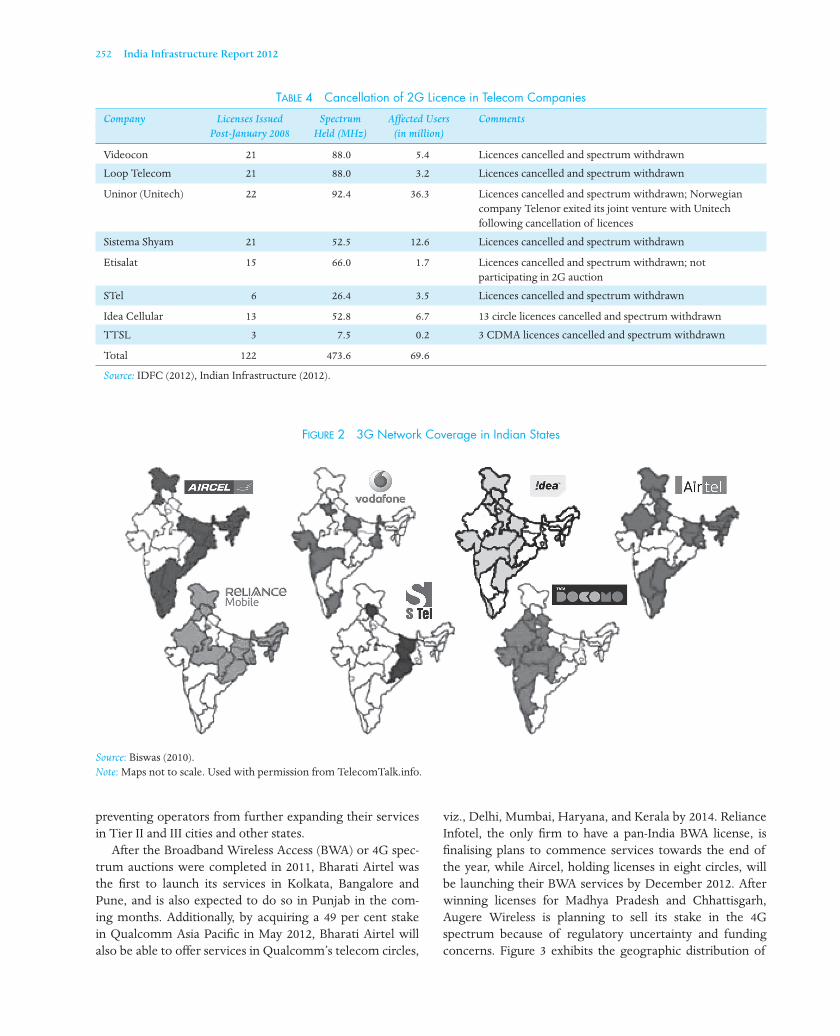
individuals and government institutions in rural areas by 2014. By March 2012, about 350,000 connections had been provided. In 2009, the scheme had budgeted ̀ 15 billion to be disbursed over the following fi ve years. It seems that while fi nancing may not be a major concern (currently, USOF has a balance of `220 billion available for disbursement), the ineffi ciencies in planning and execution may force extending the scheme. The investigation into the 2G scam continued in 2012. The Central Bureau of Investigation (CBI) has levied charges against several private telecom companies and various asso-ciated government offi cials. In February 2012, the Supreme Court cancelled 122 UAS licenses which had been allotted at 2001-market prices in 2008. Several telecom corporations were subjected to the cancellation of all UAS licenses and their spectrum allocation withdrawn (see Table 4). With inputs from the deliberations of the Empowered Group of Ministers (EGoM) appointed to determine the 2G spectrum pricing, the DoT has set the spectrum price at `140 billion for the 5 MHz pan-India license for Global System for Mobile (GSM) Communications operators while the spectrum for Code Division Multiple Access (CDMA) operators has been priced at `182 billion. Following this, the Supreme Court ordered that the new 2G auctions should be completed by 11 January 2013. If the Ministry does not conform to this order, the court will initiate contempt pro-ceedings against it. It is vital for this auction to be conducted in an effi cient and precise manner in order to rebuild confi -dence in the telecom market. The MNP was launched in February 2012 and is seen to be a major gain for customers, but can result in major losses for telecom providers. At the beginning of 2012, 32.8 million subscribers had subscribed to the MNP facility, but by October 2012 the number had increased to 69.78 million. Considering that many of these customers are long-term users, telecom operators may suff er from lower profi ts due to the loss of future gains expected from such users. To off set this, operators may increase subscription charges in the long term, causing harm to subscribers. While the 3G spectrum auction was successfully con-ducted in 2011, the roll out of the network will require one–three years. The Ministry of Communications and Information Technology states that the roll out will ensure that 3G services can be accessed in remote areas where broadband networks have not yet arrived due to high in-frastructure investment. Currently, more than 5,000 cities have 3G services available with the establishment of 80,000 Base Transceiver Stations (BTSs) to facilitate the 3G services between the network and the user. Figure 2 exhibits the 3G coverage of various telecom companies across Indian states. However, 3G services have not been well-received by consumers and the slow returns on their investments are
TABLE 3 Summary of National Telecom Policy 2012
Item Target
License Fee 8 per cent of annual gross revenue
License Tenure To be extended to 10 years
Spectrum Spectrum to be paid for separately Spectrum sharing now permitted on 2G but not on 3G
M&A Allowed up to 35 per cent of resultant revenue market share, while awaiting TRAI recommendation before extending up to 60 per cent
MNP No roaming charges across the country
Rural Teledensity By 2017, should reach 70 per cent, and 100 per cent by 2020
Broadband 600 million b oadband connections Connectivity should exist by 2020
Future Eff ectively use cloud computing Implementations and IPv6 by 2020
Source: Department of Electronics and Information Technology (2012).
r
252 India Infrastructure Report 2012
preventing operators from further expanding their services in Tier II and III cities and other states. After the Broadband Wireless Access (BWA) or 4G spec-trum auctions were completed in 2011, Bharati Airtel was the fi rst to launch its services in Kolkata, Bangalore and Pune, and is also expected to do so in Punjab in the com-ing months. Additionally, by acquiring a 49 per cent stake in Qualcomm Asia Pacifi c in May 2012, Bharati Airtel will also be able to off er services in Qualcomm’s telecom circles,
viz., Delhi, Mumbai, Haryana, and Kerala by 2014. Reliance Infotel, the only fi rm to have a pan-India BWA license, is fi nalising plans to commence services towards the end of the year, while Aircel, holding licenses in eight circles, will be launching their BWA services by December 2012. After winning licenses for Madhya Pradesh and Chhattisgarh, Augere Wireless is planning to sell its stake in the 4G spectrum because of regulatory uncertainty and funding concerns. Figure 3 exhibits the geographic distribution of
TABLE 4 Cancellation of 2G Licence in Telecom Companies
Company Licenses Issued Spectrum Aff ected Users Comments Post-January 2008 Held (MHz) (in million)
Videocon 21 88.0 5.4 Licences cancelled and spectrum withdrawn
Loop Telecom 21 88.0 3.2 Licences cancelled and spectrum withdrawn
Uninor (Unitech) 22 92.4 36.3 Licences cancelled and spectrum withdrawn; Norwegian company Telenor exited its joint venture with Unitech following cancellation of licences
Sistema Shyam 21 52.5 12.6 Licences cancelled and spectrum withdrawn
Etisalat 15 66.0 1.7 Licences cancelled and spectrum withdrawn; not participating in 2G auction
STel 6 26.4 3.5 Licences cancelled and spectrum withdrawn
Idea Cellular 13 52.8 6.7 13 circle licences cancelled and spectrum withdrawn
TTSL 3 7.5 0.2 3 CDMA licences cancelled and spectrum withdrawn
Total 122 473.6 69.6
Source: IDFC (2012), Indian Infrastructure (2012).
FIGURE 2 3G Network Coverage in Indian States
Source: Biswas (2010).Note: Maps not to scale. Used with permission from TelecomTalk.info.

The Infrastructure Sector in India 2012 253
4G operators excluding Reliance Infotel. Since the BWA net-work does not require much physical infrastructure, these services should greatly increase internet accessibility across the nation if regulations remain liberal in order to incentiv-ise private investment. The DoT has asked 4G operators to expedite the roll out of their services.
TRANSPORT
Civil Aviation
The civil aviation sector has seen turmoil throughout the year, and it appears that recovery will be slow. Almost all private carriers are currently reporting losses, while some are facing insolvency. In relative terms, low-cost carriers have performed better than full-service ones. Most of the problems are being attributed to the overextension of loans taken for purchase of aircraft, working capital loans, and increasing aviation fuel costs which make up to 35–40 per cent of operating costs. The Airport Authority of India
(AAI) has approved 14 greenfi eld projects at a combined investment of `300 billion, and has received proposals for seven similar projects. However, land acquisition and environmental clearances are major hindrances for these ventures. Projects in Tier II and III are on the fence since they may not guarantee suffi cient revenue to off set costs, even in the long term. The Task Force set up by the Committee on Infrastructure recommends the upgradation of 35 non-metro airports and the expansion of air terminals in 27 non-metro airports. The merger of Air India and Indian Airlines in 2007 resulted in massive unsolved human resource issues. Air India prepared a Comprehensive Turnaround Plan (CAP) which was approved in April 2012. This systematically charts the fi nancial restructuring and operational turnaround process. The Crew Management System (CRS) will ensure operational safety, optimally utilise crew and meet regulato-ry requirements by replacing the ineff ective manual system. The Financial Restructuring Plan (FRP) aims to alleviate Air India’s debt obligation while the airline’s operations can
FIGURE 3 4G Network Coverage in Indian States
Source: Biswas (2012).Note: Map not to scale. Used with permission from TelecomTalk.info.

254 India Infrastructure Report 2012
be improved. After the plan was approved by the Govern-ment of India, `29 billion was injected into the entity for the payment of salaries, fuel and taxes between April and August 2012; `105 billion will be converted to long-term debt with tenure of 10–15 years, while `74 billion will be repaid through non-convertible debentures with govern-ment guarantees. Recent developments have indicated that Air India will be selling or leasing some of its domestic and international properties for additional fund raising. The Dharmadhikari Committee was set up to form recommen-dations on the human resource issues which will arise from the Air India merger and its report was submitted on 31 Jan 2012. A committee made up of Air India offi cials was set up in June 2012 to implement the Dharmadhikari Committee report (Table 5).
TABLE 5 Dharmadhikari Committee Report
Recommendations
1. Instilling inter se seniority among employees of Indian Airlines and Air India (except for pilots and engineers who will be given line seniority based on type of aircraft assigned, and cabin crew will be provided uniform seniority).
2. Promotions should be based on seniority and merit, but for the next two years the Rota-Quota system should be implemented. This system draws on maintaining a fi xed quota for a particular position, and the rotational component states that the next eligible candidate be considered.
3. The Postal Life Insurance (PLI) system is a violation of the Department of Public Enterprises’ guidelines and should be replaced by another incentive system.
4. Pay should be a product of the profi t earned by the company and target achievement. A committee comprising airline offi cials was formed to implement these stipulations.
5. Transfer the Maintenance, Repair and Overhaul business into a separ te entity. Subjected to the new regulations and global standards, it will be supported fi nancially by Air India and is projected to be a profi t-making body by 2017.
Source: Dharmadhikari Committee (2012).
A number of fundamental changes have occurred within this year. The FDI limit has been increased to 49 per cent, to the comfort of some struggling airlines who view the move as a relief to their debt-laden fi nances, while others fear the possibility of foreign oligopoly and takeovers. However, FDI improvements will not be successful without infrastructure and regulatory reforms. The creation of an independent regulatory body — the Civil Aviation Authority — has been proposed. Its objectives are to facilitate a safety monitoring system, economic regulation, consumer protection and environment regulation. The entity is being formed to circumvent the problems the Directorate General of Civil Aviation (DGCA) faces in human resource management, and to respond to these problems. Concurrently, the
Ministry has decided to remove the Airport Development Fee (ADF) in Delhi and Mumbai airports, eff ective from January 2013. While removing the ADF lessens the fi nancial burden on passengers, it will also reduce the airports’ corpuses by ̀ 42 billion in Mumbai and ̀ 11.8 billion in Delhi. To bridge this funding loss, the Ministry suggests that the majority stakeholders in both airports should raise further capital while AAI should infuse equity in the projects (IDFC Securities 2012). The National Transport Policy Development Committee (NTPDC) working group reports for each of the sector includes policy recommendations on transportation sectors for the 12th Five-Year Plan. In civil aviation, it recommends that airports in metro cities should be expanded, and in the cases of Mumbai and New Delhi, a second airport should be created. The Committee also emphasises the creation of low-cost airports with development of regional airlines. While prices are to be regulated, it is necessary to ensure that predatory pricing does not occur, while competition is not discouraged. Finally, the group suggests setting up an Air Navigation Services Corporation for the management of air traffi c. The Interim Report of the High Level Committee on Financing Infrastructure (2012) recommends expediting the award of the airport projects in Navi Mumbai, Goa, Kannur, and Chandigarh as Public–Private Partnerships (PPPs). The group also recommends using the PPP framework to manage Chennai and Kolkata airports, and for the development and operation of air- and city-side facilities at 15 non-metro airports. The aviation carbon footprint report, released by the Directorate General of Civil Aviation (DGCA) in July 2012, determined that Indian airlines emitted 12.7 million tonnes of CO2 in 2012, an increase by 6 per cent from 2011. Indian Airlines emitted 1 per cent of the total carbon emission in the country, much lower than the 2 per cent emitted on average by airlines across the globe. The DGCA pledged to sustainably expand aviation in the country and implement proactive measures to reduce the national carbon footprint (2012).
Ports
The maritime sector has experienced tepid growth in India primarily because of project delays and adverse global economic conditions. The performance of major ports has dragged and most of the traffi c growth in the sector has been driven by the minor ports; while traffi c at major ports decreased from 570 million tonnes (MT) to 560 MT, minor ports saw traffi c increase from 315 MT to 370 MT during the fi scal year 2012. By April 2012, port capacity had crossed 1,200 MT, having increased by 100 MT from the previous year. While the optimal capacity utilisation of ports should stand at 70 per cent, major ports face 90 per cent capacity
a
The Infrastructure Sector in India 2012 255
utilisation implying traffi c congestion and high berth occu-pancy. The Draft 12th Five-Year Plan envisages an increase in India’s share of world trade from 0.8 per cent to 1.5 per cent, requiring an increase in the current port capacity. In the present fi scal year, the Ministry of Shipping (MoS) has facilitated the creation of 245 MT of capacity in major ports through PPPs, and allowed the investment of `145 billion across 42 projects. In April 2012, three major PPP capacity-expansion projects had been awarded in Navi Mumbai, Kandla and Visakhapatnam, with a total investment of `80 billion to create a capacity of 79 MT per annum; incidentally, all three ports handled most of the traffi c in the country between April and August 2012. The approvals for these projects had been completed within three months, which is seen as some of the fastest approvals in the port sector and the government hopes to continue this trend. Nonetheless, private interest for port projects seems to be waning. In Navi Mumbai’s Jawaharlal Nehru Port Trust ( JNPT), only one company bid for the construction of a container terminal, whereas in Visakhapatnam private fi rms are unwilling to bid due to liquidity concerns. At the same time, multiple projects in Maharashtra, Tamil Nadu and Kerala have been terminated after the cancellation of Memorandums of Understanding (MoUs) and unrealistic bids off ered by private fi rms. Currently, the sector faces crippling issues in PPP proj-ects. These include delays in obtaining clearances, heavy liti-gation during the tendering process, the lack of supporting infrastructure at terminals such as container freight stations, and diffi culties with land acquisition. Some policy measures have been instilled to simplify this process. In September 2012, the Cabinet Committee of Infrastructure allowed the MoS to approve PPP projects valued at less than `500 million without the consent of the Cabinet; previously, the limit was ̀ 300 million. This was done to hasten the approval process and prevent cost overruns. Additionally, in August, land transfer norms were relaxed for government land, whereby land may be freely transferred without Cabinet approval for state-run entities. Recently, private terminal operators at major ports have criticised the Tariff Authority for Major Ports (TAMP) for setting tariff s that are forcing them to scale down opera-tions. According to the 2008 guidelines, tariff s are fi xed at the maximum capacity, thereby capping profi ts and inad-vertently, dis-incentivising effi ciency. Through current leg-islation, tariff setting occurs for 30 years and no corrective mechanism is in place since future conditions are diffi cult to anticipate. This is under review by the Mumbai High Court. At the same time, the Ports Regulatory Authority Bill of 2011, hoping to establish regulatory bodies for setting tariff s for both central and state ports, is also pending approval.
If passed, TAMP would be replaced by a new entity which would regulate both major and non-major ports. The NTDPC interim report recommends that the 12th Five-Year Plan should incorporate measures to reverse the shortfall in investments in major ports and improv-ing productivity (2012). The Committee argues that port trusts should be transformed into statutory landlord port authorities, while terminal operations are transferred to public sector corporations. One comprehensive law should be introduced for major and minor ports to enable the previously mentioned transformation and provide them with autonomy. Competition should be encouraged in this sector as well; tariff s should be set through market forces, and as competition grows the TAMP should be restructured to better manage the ports. Coastal shipping should be encouraged by setting up coastal terminals, providing road and rail connectivity to the terminals, and fi scal incentives to transporters of cargo from road or rail to ships. Finally, ties should be forged between bordering countries for inland water transport and to encourage investment in these inter-country linkages. The interim report of the High Level Committee on Financing Infrastructure outlines broad changes in most areas of the sector (2012). The Committee suggests that the MoS should expedite the awarding process under the PPP framework, encourage the creation of private ports in co-ordination with state governments, deregulate port tariff s, implement a plan to reduce the dwell time by modernising processes and technologies, and hasten capital dredging activities with the help of private participation.
Railways
The Indian Railways earned `586.5 billion between April and September 2012, increasing its revenues by about 20 per cent from `489.64 billion earned during the same period in 2011. The 12th Five-Year Plan maintains a focus on capacity-building, modernisation and safety in railways, and estimates a budget of `7,197 billion for the sector, of which `800 billion is expected to be invested by the private sector. PPP investment in the 12th Five-Year Plan is likely to be in the high speed corridor between Mumbai and Ahmedabad, the elevated rail corridor in Mumbai, redevelopment of stations, logistics parks, freight terminals and corridors, port connectivity projects, manufacturing units, and energy projects. The increased demand and sub-par quality of railways has led to plans to modernise 19,000 km of railway lines over the next fi ve years. In the report of the High Level Safety Review Committee, released in February 2012, the Committee argues to keep safety as the topmost concern of the railways, despite the fall in number of train accidents. The Committee advises the Ministry of Railways (MoR) to implement an advanced

256 India Infrastructure Report 2012
signalling system on the 19,000-km trunk route through a special purpose vehicle (SPV) costing `200 billion and to eliminate all level crossings across the country costing `500 billion, over the next fi ve years. All new coaches should be built with the Linke Hofmann Bush (LHB) design, replacing the Integral Coach Factory (ICF) design in order to ensure safety. Also, the maintenance of safety-related infrastructure should be fi rmly implemented, which would cost `200 billion, and is to be funded through various mechanisms including a safety tax on passengers, a road tax, deferred dividend, and a matching grant by the central government (2012). The Expert Group on Modernisation of Indian Rail-ways also released their report in February 2012 and made various recommendations on the modernisation of Indian railways. These include modernising existing rail tracks, strengthening 11,250 km of bridges, modernising 100 major stations, developing stations and terminals in PPP mode, manufacturing of coaches and high speed railway lines, and construction of freight corridors covering 6,200 km, over the next 10 years. The total investment of `5.6 trillion can be raised through the monetisation of assets, private participa-tion, and funds generated by the railways. The NTDPC interim report (2012) points out that MoR does not have a cogent long-term policy on capacity expan-sion and must focus on creating such guidelines. In order to act as a commercial body, the Railway Board should be reorganised, including its accounting policies which should conform to standard business practices. Also, the 12th Five-Year Plan should look into setting up a tariff regulatory body, which is present in other transportation sectors. The interim report of the High Level Committee on Financing Infrastructure (2012) encourages the MoR to make a number of changes in order to generate funds for projects and encourage private investment. They recom-mend the rationalisation of fares to gather funds for the upgradation and modernisation of railways. To encourage private investment, they believe the Ministry should use the PPP framework in major development projects. Also, they recommend that the Commercial Railways Board be restructured to stimulate growth and investment. The MoR made two major policy decisions this year. In June 2012, the private freight terminal policy was altered by separating the revenue sharing clause from the wholesale price index. Through this modifi cation new terminals will share the revenue after fi ve years, and existing terminals will do so after two years. In January 2012, a draft Policy for Private Participation in Rail Connectivity and Capacity Augmentation Projects was released with an objective of replacing the Railways’ Infrastructure for Industry Initiative Policy and Rail Connectivity to Coal and Iron Ore Mines Policy (MoR 2012). This policy contains six models for
private participation based on the type of project and out-lines an active role for state governments in the development and implementation of these projects. After the cabinet approved the leasing of railway land, the Rail Land Development Authority (RLDA) invited bids for the commercial use of land. Sixty new multi-functional complexes and eight standalone sites have been made avail-able, and parties can bid either on a one-time lease premium or annual lease rent. This came after a performance audit was conducted on land management in the Indian Railways by the Comptroller and Auditor General (CAG), which advised RLDA to strengthen the organisation of land management, maintain records, prevent land encroachment, expedite land acquisition, and augment income with the leasing of railway land for commercial development.
Roads
By September 2012, the total length of the road network was 3.31 million km. The National Highway Development Program (NHDP) being implemented by the National Highways Authority of India (NHAI) had achieved 17,372 km of four-lane national highways (by October 2012) out of the total 48,254 km covered under the NHDP (NHAI 2012). Under the Pradhan Mantri Gram Sadak Yojana (PMGSY) about 55 per cent of all rural settlements had been connect-ed by 214,758 km of new roads and 142,528 km of improved roads by June 2012. During the fi scal year 2011–12, NHAI constructed roads at the rate of 6.16 km per day, while the State Public Work Departments and Border Roads Organ-isation completed 4.23 km per day. The average road length constructed, however, falls well short of the targeted 20 km per day. Given that the road freight volumes have grown by 9.08 per cent and vehicles have grown by 10.76 per cent, it is important to achieve the 20 km per day target. The digitalisation of Regional Transport Offi ces (RTOs) and national and state databases have been a major accom-plishment towards achieving total connectivity between RTOs and the computerisation of records. The National Per-mit Scheme, launched in 2010 to facilitate the movement of cargo between states, has largely been successful and popu-lar among transport companies. The Cabinet Committee on Infrastructure recently approved the Engineering, Procure-ment and Construction model for two-lane highways. This model specifi es design and performance standards while allowing construction companies to innovate and quicken road construction. Additionally, a concession model has been approved for the operation, maintenance and transfer (OMT) of projects, making the contractor responsible for the OMT of projects for four to nine years. The Indian government entered into two major bilateral agreements for the exchange of knowledge in the road sector. A Memorandum of Cooperation (MoC) was signed

The Infrastructure Sector in India 2012 257
between Japan and India, allowing for cross-exchange of information on capacity-building and technology in road construction. India and Canada signed an MoU for the transfer of knowledge on infrastructure development, and road operations and maintenance. Ministry of Road Transport and Highways (MoRTH) is planning to use natural rubber modifi ed bitumen in road construction and maintenance, in order to improve the durability of roads. The Ministry will also implement an electronic toll collection system based on radio frequency identifi cation to improve the effi ciency of toll collection. Each vehicle will be fi tted with a radio frequency identifi ca-tion tag, automatically crediting the tag account while trans-ferring the toll from the bank. Pilot programmes have been initiated on the Delhi–Chandigarh highway. The MoRTH hopes to expand this programme to the entire national high-way network by 2014. The NTDPC interim report (2012) recommends that MoRTH should mandate all state highways to be two-lane by the end of the 12th Five-Year Plan. Tolls can only be justi-fi ed if some ‘enhanced service’ is provided, thus, any high-way with less than four lanes should not be taxed. A data centre should be established to collect data on traffi c fl ows, road conditions and accidents. Emphasis should be placed on design standards for road, capacity-building of central, state and local agencies, and skill-building relevant to the road sector in educational institutions (Table 6). The interim report of the High Level Committee on Financing Infrastructure (2012) proposes streamlining
the awarding process by specifying and measuring against monthly/quarterly targets, updating the award progress on the public domain, reducing time and cost overruns by using the Engineering, Procurement and Construction (EPC) model in low-traffi c density projects, and restructur-ing the NHAI to reduce implementation and management delays. The road sector has seen some unfortunate setbacks this year. By March 2012, 95 projects handled by NHAI, and 126 projects through the state public work departments had been delayed. These have occurred because of tedious land acquisition and environment clearance procedures, poor contractor performances, and law and order. PPPs, a touted step in infrastructure development in India, are seen to be a disappointment this year in the road sector. While investments in PPP projects were valued at `1,800 billion in June 2012, an increase from `1,300 billion in June 2011, private participation may be winding down. Between April and September 2012, NHAI only awarded six projects, resulting in the construction of 560 km at a total cost of `49 billion. A recent IIT-Chennai study on time and cost overruns in road construction projects in India demonstrates that while PPP road projects take less time to complete, they have signifi cantly higher costs than non-PPP projects (Thillai and Govind 2012). Furthermore, several construction companies are facing fi nancial constraints in their road projects because of the aggressive auctions that hiked up bids, and high interest rates on loans coupled with stringent collateral mandates.
TABLE 6 Policy Recommendations for Road Sector from NTDPC’s Interim Report
Target Area Policy Sugg estions
NHDP • Clarify fi nancial tools for funding. • Change policy to target heavy road construction according to traffi c fl ows. • Impose tolls only when ‘enhanced services’ are provided.
State Highways • Mandate each state to create state highway development plan; prioritise plans on the basis of traffi c fl ows and demand and ensure each highway has two lanes.
Expressways • Create more elevated entry points to expressways for increased rural accessibility.
Rural Roads • Increase fuel cess in proportion to fuel price hikes. • Existing PMGSY projects to be completed and upgradation of network to occur in the next 10–15 years.
Design Standards • Generate new design standards while studying road capacity and traffi c fl ows.
Capacity-building • Invest in capacity-building in engineering and designing of roads, and skill-building of workers and contractors.and R&D • Create professional institution to set design standards and conduct research in road sector.
Road Safety • Using recommendations made in the Sundar Committee on Road Safety and Traffi c Management (2007) Report, invest in building road safety capacity.
Road Transport • Incorporate recommendations made by Sundar Committee on amending the Motor Vehicles Act 1988.
Data Centre • Set up a road data centre to enhance data collection on cargo and passenger fl ows, historical fl ows on roads and road performance.
Source: National Transport Development Policy Committee (2012).

258 India Infrastructure Report 2012
POWER
Despite the jarring disappointments brought to the power sector this year in the form of the coal scam, the only notable step taken by the government is towards the fi nancial restructuring of power distribution companies. By Septem-ber 2012, total generation capacity stood at about 208,000 MW, having increased by 15,000 MW since the beginning of the calendar year (Central Electricity Authority 2012). A ma-jority of the capacity enhancement occurred in coal-based thermal plants, followed by marginal increases in gas-based thermal and renewable energy generation (Table 7).
TABLE 7 Installed Capacity of Power in India
Type of Energy MW
Thermal 138,806 Coal 118,703 Gas 18,903 Diesel 1,199
Nuclear 4,780
Renewable 64,289 Hydro 39,291 Other 24,998
Total 207,875
Source: Central Electricity Authority (2012).
By September 2012, 558,240 villages had been provided electricity, i.e., 87 per cent of all Indian villages. Under the Rajiv Gandhi Grameen Vidyutikaran Yojana (RGGVY) or the Scheme for Rural Electricity Infrastructure and Household Electrifi cation, 105,000 (of the targeted 110,000) villages had been provided with electricity, while free elec-tricity connections had been given to 19.5 million Below Poverty Line (BPL) households (by April 2012). According to the 18th Electric Power Survey Report (2011), by the end of the 12th Five-Year Plan, the estimated peak demand will be 196,398 MW while the country’s energy requirement will stand at 1,348,515 billion unit (BU). To facilitate meet-ing these requirements, the working group for the 12th Five-Year Plan proposes increasing the installed power capacity by about 76,000 MW, through public and private entities (Table 8), at an investment of 13.73 million in generation, transmission and distribution. To encourage private participation in the creation of elec-tricity infrastructure, tariff -based competitive bidding would be implemented for the provision of transmission services, as against the cost plus method, from January 2013 onwards. However, it may be noted that this process has already been used for the generation of electricity, where developers are going back on the tariff s quoted in the bidding process for mega projects, citing higher coal costs. Thermal power
plant developers are scrapping their development plans or delaying work on their projects. More recently, the Cabinet Committee on Economic Aff airs approved the foreign in-vestment limit of 49 per cent on investment in generation, transmission and distribution companies, which caps FDI at 26 per cent and Foreign Institutional Investor (FII) at 23 per cent. The Electricity Act stipulates that all consumers with loads greater than 1 MW should be considered open access consumers, relieving state regulators of their juris-diction on them. Despite mandating state governments and distribution companies to implement this policy, it has not been enacted; the central government is deliberating on how to resolve this situation. The interim report of the High Level Committee on Financing Infrastructure (2012) recommends establishing PPPs in the distribution sector and adding incentives such as viability gap funding. The Com-mittee also suggests that coal should be imported in the short term but PPPs should be allowed in coal production for the long term; State Electricity Regulatory Commissions (SERCs) should establish the wheeling charge and open ac-cess surcharge but not regulate tariff s; and 25 per cent of the central discretionary allocation should be made available for direct sale to open access customers, in order to facilitate competition. Fundamental problems in the sector include concerns which extend to all infrastructure sectors — land acquisi-tion and environmental clearances. Obtaining land for power plants is increasingly diffi cult due to lengthy and complicated clearance systems. Environmental clearances
TABLE 8 12th Five-Year Plan Working Group Projections for Capacity Addition
Developers Hydro Thermal Nuclear Capacity Addition (MW)
Central 5,632 11,426 2,800 19,858
State 1,456 12,340 0 13,796
Private 2,116 40,015 0 42,131
Total 9,204 63,781 2,800 75,785
Source: Press Information Bureau (2012).
TABLE 9 Proposed Budget for Power Sector in 12th Five-Year Plan
Energy Sub-Sectors Proposed Budget (` in billion)
Generation 6,386
Transmission 1,800
Distribution 3,062
Others 2,477
Total 13,726
Source: Press Information Bureau (2012).

The Infrastructure Sector in India 2012 259
take one–two years, when the allowed timeframe is seven–ten months. Between April 2009 and September 2012, 854 projects in mining, thermal and hydropower plants had fi led for environmental clearances, of which only 76 have been processed and approved. The domestic coal supply in India has reached abysmal levels, with 35 thermal power plants having less than seven days of coal reserves. Due to the overdependence on thermal power, the low quality and supply of domestic coal and Coal India Limited’s (CIL) inability to meet supply agreements, India has increased its coal imports over the years. However, uncertainty lingers due to price hikes in Indonesia and Australia, the largest coal exporting countries to India. In attempts to lessen the burden on private and public developers, steam coal has been exempted from import duties. Additionally, CIL’s board has agreed to the modifi ed fuel supply agreements (FSAs), with 80 per cent supply commitment through which CIL will supply 65 per cent of domestic coal and 15 per cent imported coal on a cost plus basis. The original FSAs were modifi ed in terms of the penalty, moratorium on penalty and force majeure clauses. Due to these input concerns, it has become even more important to improve the effi ciency of the power plants. Between April and September 2012, the Plant Load Factor (PLF) of all coal-based thermal power plants in India was 68.51 per cent, implying low capacity utilisation on average. It is necessary to improve the capacity utilisation by renovating or modernising equipment, especially because of the high average and peak shortages and the lack of short-term alternative power sources. The thermal power sector has been tainted with the coal scam, which has implicated large private companies, bureaucrats and politicians. The inter-ministerial group on coal recommended de-allocating 10 coal blocks and forfeiting the bank guarantees of several accused companies, after unearthing the controversy surrounding the allocation of 57 coal blocks in September 2012. The CAG reported losses of `10.52 billion to the government due to the low bids received for the coal block allocations, resulting in `1.86 trillion in benefi ts to participants. The CAG report added that the government had delayed the bidding and instead allotted the blocks between 2004 and 2009 (CAG of India 2012). The CBI has launched its investigation into fi ve companies for misrepresenting net worth and experience when they obtained the coal blocks. Gas-based thermal power plants have been performing quite poorly, given the limited supply in liquefi ed natural gas (LNG). The required gas for stations is 85.89 million metric standard cubic metre per day (mmscmd), while the actual availability is 48.44 mmscmd. The domestic gas production has fallen steeply and widened the demand and supply gap. The depreciation of the Rupee and the international market
competitive demand, have added on the costs of gas imports. Nonetheless, the stagnant domestic supply prompts India to import a large amount of LNG despite the higher costs. While 25 mmscmd of gas can be sourced from Indian fi elds, about a 100 mmscmd will be required to fulfi l the demand in 2014–15. In light of the Fukushima disaster in Japan, protests against nuclear power have gained momentum in India. In fact, appeals have been fi led in the Supreme Court to stay the commissioning of new nuclear projects, in states such as Tamil Nadu. Meanwhile, the liability clause in the Civil Liability for Nuclear Damage Rule, 2011, has been altered, with expectations of extending the fi ve-year time limit for nuclear operators seeking damages from foreign suppliers, if a nuclear accident occurred. Stagnant policy-making may prevent progress and expan-sion in the renewable sector. It appears that total renewable energy capacity addition may not even reach 1,500 MW this year, let alone meeting the target of having 15 per cent of renewable power on the grid by 2020, unless signifi cant policy moves are made. After April 2012, renewable energy power plants have not been eligible for accelerated deprecia-tion benefi ts and generation-based incentives. However, the Ministry of New and Renewable Energy (MNRE) may bring them back in the 12th Five-Year Plan, since it has caused a drop in capacity addition. In February 2012, the CERC launched the Terms and Conditions for Tariff Determina-tion from Renewable Energy Sources Regulations, eff ective from April 2012 (CERC 2012). The tariff s fi xed for all renew-able energy sectors were lower than those in previous years. A major problem with this policy has been that the Renew-able Power Obligations (RPOs) have not been enforced by the SERCs, causing poor energy generation. A few SERCs are even allowing the carryover of RPOs from the previous fi nancial year, further aggravating the problem. Also the de-lays in the approval process for transmission companies have caused higher transaction costs for developers. Renewable Energy Certifi cates (RECs), which are traded on the Indian Energy Exchange, have a year-long annual compliance pe-riod, resulting in low trading volumes. Unless this period is shortened, the renewable energy sector will continue to suff er through the weakness of the REC instrument. The installed generation capacity of solar power has crossed 1 GW, with a majority of these power plants being grid-connected. The Jawaharlal Nehru National Solar Mission ( JNNSM), by which solar projects are set up by developers on build, own and operate basis, have added 201 MW of power. The bidding for fi rst phase, second round, of the scheme had resulted in low tariff s due to falling prices of solar modules. Currently, Gujarat is the largest solar power producer with 680 MW of installed capacity and plans for 600 MW across 10 districts (KPMG 2012).

260 India Infrastructure Report 2012
Since the beginning of the year, India has added only 750 MW in wind capacity, in comparison to 3,500 MW during the same period last year. Some states have asked wind power plants to close operations because of cheaper alternative power options, even though the central govern-ment mandates the sale of renewable energy. This comes at the cost of consumers, who are cut off from power supply because states are unwilling to pay for the wind energy. To add to this, state utility companies have asked for a portion of the REC revenue and increased transmis-sion charges on wind power plants to encourage the former practice. By the end of August 2012, the transmission network in India was made up of 275,530 circuit km of 220 kV of high voltage, and 425,866 of transformer capacity for 220 kV levels. The world’s highest voltage test line station of 1,200 kV has been commissioned in Madhya Pradesh. Recent developments in this area included awarding two ultra mega transmission projects to Powergrid, while RInfra has set up plans for 220 km of 440 kV double circuit transmission line in Maharashtra. Following the grid collapse in July 2012, which aff ected 20 states and 600 million consumers, the Ministry of Power (MoP) has proposed various alternatives including an island-ing scheme for Delhi to prevent the reoccurrence of such situations. The poor fi nancial state of the distribution com-panies prompted the MoP to once again develop a fi nancial restructuring plan. It may be noted that the previous eff ort of cleaning up the balance sheets of the State Electricity Boards, in 2001, was not very successful. According to the present plan, state governments will take over 50 per cent of the short-term liabilities and convert them to bonds, and the remainder will be restructured by banks, by extending the moratorium on the principal and giving better terms for repayment. This assistance will be granted on the condition that the distribution companies carry out operational and fi nancial reforms including rationalising tariff s, balancing high tension and low tension loads, extending metering to all consumers, and curtailing unauthorised electricity consumption. New guidelines for the short-term procurement of elec-tricity have been formulated to promote competition and reduce power purchase costs. This will reduce short-term charges for distribution companies, which are the largest component of the costs for distribution companies and are completely transferred to the customers. Through this plan, bidding companies will quote prices for a year as opposed to previous statute of 25 years. A new Perform, Achieve and Trade (PAT) scheme has also been brought out to incentivise energy effi ciency by providing the option for energy-intensive industries to trade additional energy-saving certifi cates on energy exchanges. Furthermore, the MoP is
implementing the Re-structured Accelerated Power Devel-opment & Reforms Programme (R-APDRP) across states, which is expected to reduce aggregate technical and com-mercial (AT&C) losses to the extent of 15 per cent. The Case I and Case II standard bidding documents (SBDs) for power procurement were released in February 2012. Since then, revisions have included changes related to the volatility of fuel prices and a provision for pass through to consumers. Draft SBDs have also been designed for Ultra Mega Power Projects (UMPPs) to enable a stringent bidding process, higher performance guarantees and tougher eligi-bility norms.
URBAN INFRASTRUCTURE
India’s urban population increased from 286 million in 2001 to 377 million in 2011, and accounts for 37 per cent of the total population. The total number of towns has also increased over the decade to 7,935, a 54 per cent increase from 2001. The low capacity of Urban Local Bodies (ULBs), limited fi nancial resources and multiple clearance channels, have led to a mismatch in the demand and supply of urban services and development. While PPPs have been popular in solid waste management and sewage treatment plants, they have been scarce in urban transport due to high construc-tion costs, capital requirements and long project tenures. The fi rst phase of the Jawaharlal Nehru National Urban Renewal Mission ( JNNURM) was launched in December 2005, with the intention of promoting urban sector reforms, and enhancing urban infrastructure and facilities. Collating funds from the central and state governments, and ULBs, this programme works through the Ministry of Urban Development (MUD) and the Ministry of Housing and Poverty Alleviation (MHUPA). Under MUD, `480 billion were allocated to two sub-programmes, i.e., the Urban Infrastructure and Governance, and Urban Infrastructure Development Scheme for Small and Medium Towns (UIDSSMT), while MHUPA directed `22 billion to two programmes, i.e., Basic Services to the Urban Poor and Integrated Housing and Slum Development Programme, over the entire fi ve-year period. The tenure of JNNURM fi rst phase was extended up to March 2014, to ensure the completion of urban sector reforms and ongoing projects. The second phase of JNNURM, with an increased central allocation of 0.35 per cent of the Gross Domestic Product (GDP) as opposed to 0.1 per cent of the GDP in the fi rst phase, will focus on small cities and towns. It will enhance the capacities of nagar palikas and nagar panchayats, while improving revenue generation of ULBs, implement reforms eff ectively, employ alternate fi nancing methods, and enhance land management. As the fi rst policy programme

The Infrastructure Sector in India 2012 261
to solely focus on urban India, JNNURM has made some improvements in urban development. However, urban sector reforms have not been implemented by the states and ULBs, though these developments were supposed to have been contingent on them. The UIDSSMT has relaxed its stipulations of basing the release of funds on urban reforms. Compared to its previ-ous preconditions of the completion of urban reforms prior to the release of funds, the second instalments of funds are subjected to the completion of four of six mandatory reforms. If even these relaxed norms are not met, states may provide funds which can be reimbursed if reforms are com-pleted later. However, these conditions are exempted for the north-eastern states and Jammu and Kashmir. Various ministries have come up with important legisla-tions to tackle other urban issues. The National Water Policy draft was released in January 2012, outlining the need for a strong institutional framework on water usage, by concen-trating on levying eff ective water tariff s, promoting private participation in water service provision, launching periodic water supply audits, and promoting sustainable water usage (Ministry of Water Resources 2012). The draft was revised later in the year, to emphasise decentralised and water
conservation-focused sanitation systems. The E-wastes (Management and Handling) Rules were implemented in May 2012 and formalised the role of electronic waste recyclers. These rules will prompt electronics producers to channel their e-waste to formal recyclers, as well as increase the number of recycling units by motivating informal recyclers to enter the formal market. For eff ective imple-mentation of the policy, monitoring and regulation must be enforced.
CONCLUSION
India’s infrastructure needs the government’s renewed atten-tion to restart an almost stagnant economy. It is imperative to strengthen the regulatory and governance processes to ensure smooth transition to a sustainable higher economic growth trajectory. It is not only important to fi nd solutions to infrastructure project impediments, but also critical to fi nd the right balance between growth and environmental concerns. Finally, de-politicisation and ensuring operations on effi cient and commercial principles is critical for realising the targets of the 12th Five-Year Plan.
REFERENCES
18th Electric Power Survey Committee. 2011. ‘Agenda for 3rd Meeting of 18th Electric Power Survey Committee’. Ministry of Power, Government of India. http://www.cea.nic.in/reports/planning/dmlf/venue_agenda_3rd_meeting.pdf (accessed 21 November 2012).
Biswas, Rudradeep. 2010. ‘Is Your Favourite Operator Off ering 3G/BWA in Your Circle? Check It Out’. Telecomtalk.info, 27 October. http://telecomtalk.info/is-your-favourite-operator-off ering-3g-bwa-in-your-circle/45748/ (accessed 19 November 2012).
—————. 2012. ‘Way to 4G: Reliance Infotel is Busy to Finalize Vendors’. Telecomtalk.info. http://telecomtalk.info/4g-reliance-infotel-busy-fi nalize-vendors/100144/ (accessed 21 November 2012).
Central Electricity Regulatory Commission (CERC). 2012. ‘Terms and Conditions for Tariff Determination from Renewable Energy Sources’. Central Electricity Regulatory Commission, Government of India. http://www.cercind.gov.in/regulation/RE_Amend.html (accessed 19 November 2012).
Central Electricity Authority. 2012. ‘Monthly Review of Power Sector Reports: September 2012’. Ministry of Power, Government of India. http://www.cea.nic.in/executive_summary.html (accessed 21 November 2012).
Committee on Road Safety and Traffi c Management. 2007. ‘Report of the Committee on Road Safety and Traffi c Management’. Ministry of Road Transport, Government of India, February. http://morth.nic.in/writereaddata/linkimages/SL_Road_Safety_sundar_report4006852610.pdf (accessed 21 November 2012).
Comptroller and Auditor General (CAG) of India. 2012. ‘Report No. - 7 of 2012-13 for the period ended March 2012 - Performance Audit of Allocation of Coal Blocks and Augmentation of Coal Production (Ministry of Coal)’. http://saiindia.gov.in/english/home/Our_Products/Audit_Report/Government_Wise/union_audit/recent_reports/union_performance/2012_2013/Commercial/Report_No_7/Report_No_7.html (accessed 19 November 2012).
Dharmadhikari Committee. 2012. ‘Report of Expert Committee on HR Issues of Merged Air India’. Ministry of Civil Aviation, Government of India, 31 January. http://www.civilaviation.gov.in/MocaEx/content/conn/MyTutorialContent/path/Contribution%20Folders/REPORTS/Dharmadhikari%20Committee%20Report.pdf (accessed 19 November 2012).
Department of Electronics and Information Technology. 2012. ‘National Telecom Policy – 2012’. Ministry of Communications and Information Technology, Government of India. http://deity.gov.in/sites/upload_files/dit/files/National%20Telecom%20Policy%20(2012)%20(480%20KB).pdf (accessed 19 November 2012).
Directorate General of Civil Aviation (DGCA). 2012. ‘The Carbon Footprint of Indian Aviation 2011’. Government of India, 10 July. http://dgca.nic.in/env/Carbon%20Footprint%20Report%202011.pdf (accessed 19 November 2012).
Expert Group for Modernisation of Indian Railways. 2012. ‘Report of the Expert Group for Modernisation of Indian Railways’. Ministry of Railways, Government of India, February. http://www.indianrailways.gov.in/railwayboard/uploads/

262 India Infrastructure Report 2012
directorate/infra/downloads/Main_Report_Vol_I.pdf (accessed 19 November 2012).
High Level Committee on Financing Infrastructure. 2012. ‘Interim Report’. Secretariat for Infrastructure, Planning Commission, August. http://infrastructure.gov.in/pdf/Interim_Report.pdf (accessed 19 November 2012).
High Level Safety Review Committee. 2012. ‘Report of High Level Safety Review Committee’. Ministry of Railways, Government of India, February. http://irsme.nic.in/fi les/FINAL-BOOK-HLSRC_latest-17-02-2012.pdf (accessed 19 November 2012).
Infrastructure Development Finance Company (IDFC) Limited. 2012. ‘Growing Steadily: Annual Report 2011–12’. IDFC. http://www.idfc.com/pdf/IDFC_15AR_Shareholder_2011_12.pdf (accessed 19 November 2012).
Infrastructure Development Finance Company (IDFC) Securities. 2012. ‘Govt. Plans to Abolish ADF at Delhi and Mumbai Air-ports’, Event Update, 16 October. Mumbai: IDFC Limited.
Indian Infrastructure. 2012. Indian Infrastructure, 15(1). New Delhi: India Infrastructure Publishing Private Ltd.
KPMG. 2012. ‘The Rising Sun: A Point of View on the Solar Energy Sector in India’. KPMG, September. http://www.indiaenvironmentportal.org.in/files/file/Rising-Sun-2-kpmg-sep-12.pdf (accessed 19 November 2012).
Ministry of Water Resources. 2012. ‘Draft National Water Policy 2012’. Ministry of Water Resources, Government of India. http://mowr.gov.in/writereaddata/linkimages/DraftNWP2012_English9353289094.pdf (accessed 19 November 2012).
National Highways Authority of India (NHAI). 2012. ‘150th MIS report for period ending August 30th, 2012’. Ministry of Road Transport and Highways. http://www.nhai.org/rmenujune2012.asp (accessed 19 November 2012).
Ministry of Railways (MoR). 2012. ‘Draft Policy for Private Participation in Rail Connectivity and Capacity Augmentation Projects’. Ministry of Railways, Government of India. http://www.indianrailways.gov.in/railwayboard/uploads/directorate/infra/downloads/draft%20policy%20letter.pdf (accessed 21 November 2012).
National Transport Development Policy Committee (NTDPC). 2012. ‘Interim Report’. Planning Commission, Government of India, April. http://transportpolicy.gov.in/NTDPCWEB/Home/InterimReport_NTDPC_2012.pdf ?MOD=AJPERES&CACHEID=1eec7c804538e11a8a5cdf9490b39db2 (accessed 19 November 2012).
Press Information Bureau. 2012. ‘Press Releases’. Press Information Bureau, Government of India. http://www.pib.nic.in/newsite/pmreleases.aspx?mincode=3 (accessed 19 November 2012).
Telecom Regulatory Authority of India (TRAI). 2011. ‘Press Release: Highlights on Telecom Subscription Data as on 31st August, 2011’. Telecom Regulatory Authority of India, Government of India, 20 October. http://www.trai.gov.in/WriteReadData/PressRealease/Document/Press_Release_Aug-11_2.pdf (ac-cessed 19 November 2012).
—————. 2012. ‘Press Release: Highlights on Telecom Subscription Data as on 31st August 2012’. Telecom Regulatory Authority of India, Government of India, 9 October. http://www.trai.gov.in/WriteReadData/PressRealease/Document/PR-TSD-Aug12.pdf (accessed 19 November 2012).
Thillai, Rajan A. and Gopinath Govind. 2012. ‘PPPs for Roads, a Costly Aff air’. The Hindu Business Line, 27 June. http://www.thehindubusinessline.com/opinion/article3577157.ece (accessed 19 November 2012).