the infrastructure needs of a 21st century city- a u.s ... · the infrastructure needs of a 21st...
TRANSCRIPT

September 16, 2009
Washington DC
The Infrastructure Needs of a 21st Century City-A U.S. Perspective
The Institute of Brazilian Issues, the George Washington University
Emilia Istrate, Senior Research Analyst

SPENDINVEST
and
REFORM

A New Infrastructure VisionPrimacy of MetrosThe Federal Role in Metropolitan Infrastructure
1 2 31 2 3

Primacy of Metros
1 2 31 2 3

Source: Brookings Analysis
Land Area Population Knowledge Economy
Jobs
Most Recent Immigrants
84%
65%
12%
Highest Educated Citizens
74% 77%74%
GDP Residential Real Estate
Values
75%
Our Country’s Top 100 Metros – Engines of Growth

Source: Brookings Analysis
Interstate Miles
Traveled
92%
Amtrak Passengers
93%
Seaport Tonnage
72%78%
Air Passengers
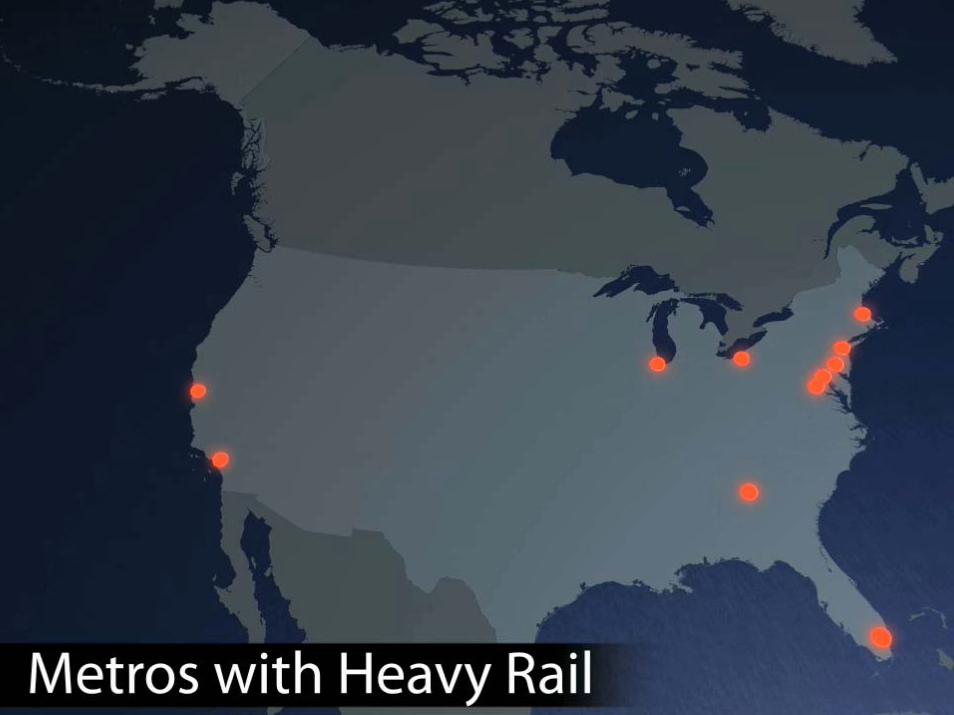
Subway, Commuter, and
Light Rail Passengers
100%
Our Country’s Top 100 Metros – Concentrate Most of Our Transportation Functions
Land Area Population
65%
12%

Transportation within Metros
80 percent of all travel occurs within metro areas
Source: Federal Highway Administration

Transportation within Metros
Half of all commute trips are suburb-to-suburb
metro area city center
Two-thirds of freight tonnage travels less than 100 miles

Intrametro Challenges
The number of hours spent in traffic
1982 20072007
14 Hours
36 Hours
51 Hours
National Average Large Metropolitan Areas
Source: Texas Transportation Institute, 2009Urban Mobility Study

September 16, 2009
Washington DC
The Infrastructure Needs of a 21st Century City-A U.S. Perspective
The Institute of Brazilian Issues, the George Washington University
Emilia Istrate, Senior Research Analyst
Intrametro Challenges
The number of hours spent in traffic

September 16, 2009
Washington DC
The Infrastructure Needs of a 21st Century City-A U.S. Perspective
The Institute of Brazilian Issues, the George Washington University
Emilia Istrate, Senior Research Analyst

Lower income workers spend more of their
income to reach jobs
Working Poor Working Poor Commuting with a
Car
6.1%
8.4%
Other Workers
3.8%
Source: Elizabeth Roberto, “Commuting to Opportunity: The Working Poor and Commuting in the United States”
Intrametro Challenges

Transportation has become the second largest household expense
Source: Bureau of Labor Statistics, Consumer Expenditures in 2007
Housing
Transportation
Food
Healthcare
Intrametro Challenges

Source: Texas Transportation Institute, 2009Urban Mobility Study
X 28 Gallons of Fuel
2.5 Billion Gallons of Wasted Fuel Per Year
Intrametro Challenges
American Metro Drivers

Federal Role in Metropolitan Infrastructure
1 2 31 2 3

Three Problems: The Federal Government Is Absent
For example, unlike competitor nations, we have no national freight and passenger rail policy
Picture Credit: European Commission, Trans-European Networks
European TEN-T Network
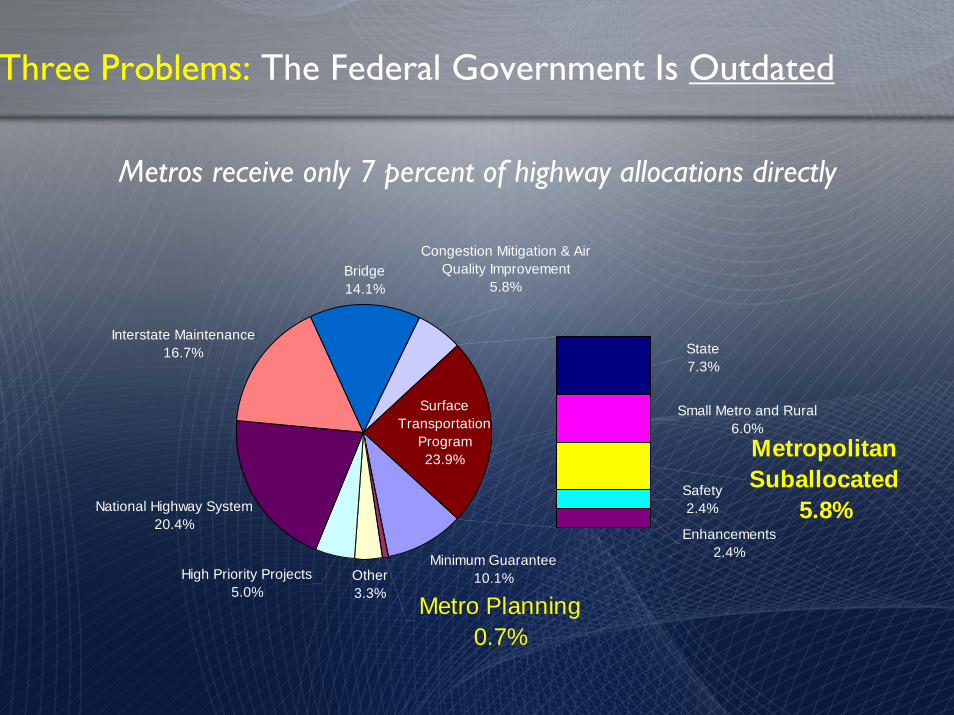
Minimum Guarantee10.1%
National Highway System20.4%
Interstate Maintenance16.7%
Bridge14.1%
Safety2.4%
Enhancements2.4%
Metropolitan Suballocated
5.8%
Metro Planning0.7%
High Priority Projects5.0%
Congestion Mitigation & Air Quality Improvement
5.8%
State7.3%
Other3.3%
SurfaceTransportation
Program23.9%
Small Metro and Rural6.0%
Three Problems: The Federal Government Is Outdated
Metros receive only 7 percent of highway allocations directly

Federal Highway Share: 80% - 90%
Federal Transit Share: 47%
Three Problems: The Federal Government Is Outdated

The federal government also fails to link infrastructure to other associated sectors, such as housing and education
Three Problems: The Federal Government Is Underperforming

The federal transportation program has almost no focus on outcomes, performance, or accountability
Three Problems: The Federal Government Is Underperforming

A New Infrastructure Vision
1 2 31 2 3

Smart Urban Investments in Infrastructure SHOULD Be
Metropolitan 1
Integrated2
Competitive3
Optimized4
Transparent5

Cities Need a Strong Federal Partner
The Stimulus Package (ARRA)•
Sustainable Communities- Coordination Across Federal Agencies
•
The Transportation Reauthorization Bill•
• National Infrastructure Bank
Livable Communities Act•
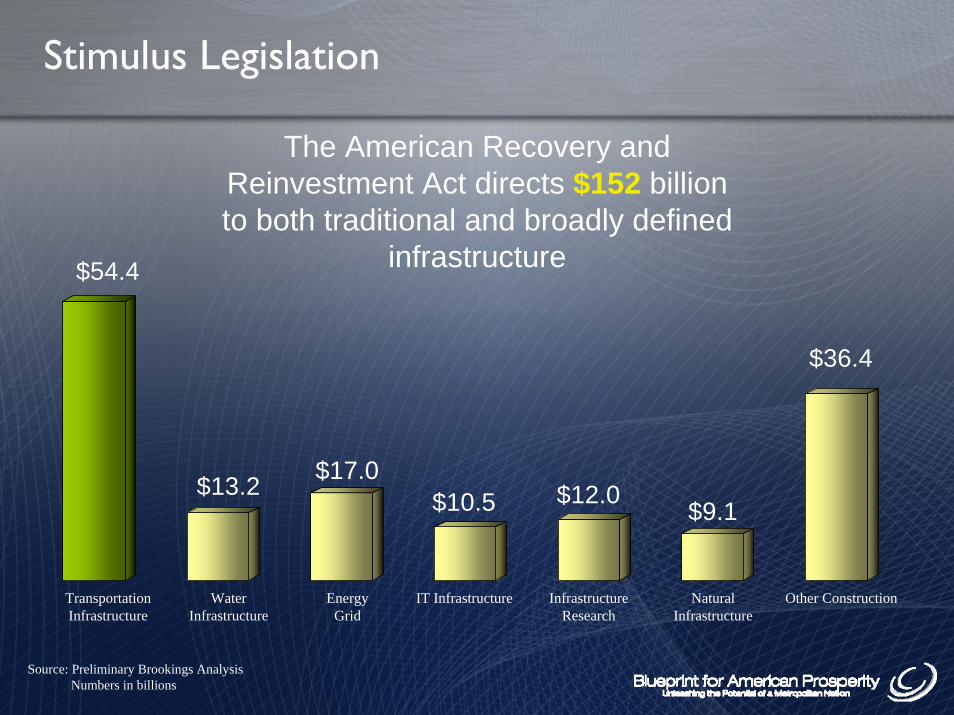
Stimulus Legislation
The American Recovery and Reinvestment Act directs $152 billion to both traditional and broadly defined
infrastructure
Transportation Infrastructure
$54.4
Water Infrastructure
$13.2
EnergyGrid
$17.0
IT Infrastructure
$10.5
Infrastructure Research
$12.0
Natural Infrastructure
$9.1
Other Construction
$36.4
Source: Preliminary Brookings AnalysisNumbers in billions

Stimulus Legislation- More focus on the metros
Double direct suballocation of surface transportationfunding to metros•
$8.4 billion in funds for transit capital improvements•
$8 billion to be spent on high speed rail inter-metropolitan projects.
•
•
$13 billion for cities to provide clean drinking water, dispose of wastewater, and control flooding
•
$3.2 billion for the Energy Efficiency and Conservation Block Grants

Stimulus Legislation – TIGER Grants
Transportation Investment Generating Economic Recovery Grants
Application deadline- September 15, 2009
• competitive grants that will be awarded to surface transportation projects of national, regional or metropolitan significance
• $1.5 billion• five long-term outcomes: State of Good Repair,
Economic Competitiveness, Livability, Sustainability, and Safety
• Cost benefit analysis

Stimulus Legislation – Transparency

Surface Transportation Authorization Act of 2009
• Metropolitan mobility and access program
• Office of Livability
• Office of Public Benefit
• Invests in high speed rail
• Equalizes the federal matching rate for transit and highways
• Emphasis on intermodalism, sustainability, and connectivity
Congressmen Oberstar and DeFazio

National Infrastructure Bank
An independent national infrastructure bank would establish the projects of substantial regional and national significance

Department of Housing and Urban Development
Environmental
Protection
Agency
Sustainable Communities – Federal Agencies’ Partnership
Department of TransportSustainable Communities

Department of Housing and Urban Development
Environmental
Protection
Agency
The Livable Communities Act
Department of Transport
•Interagency Council on Sustainable Communities
•The Comprehensive Planning Grant Program
•The Challenge Grant Program
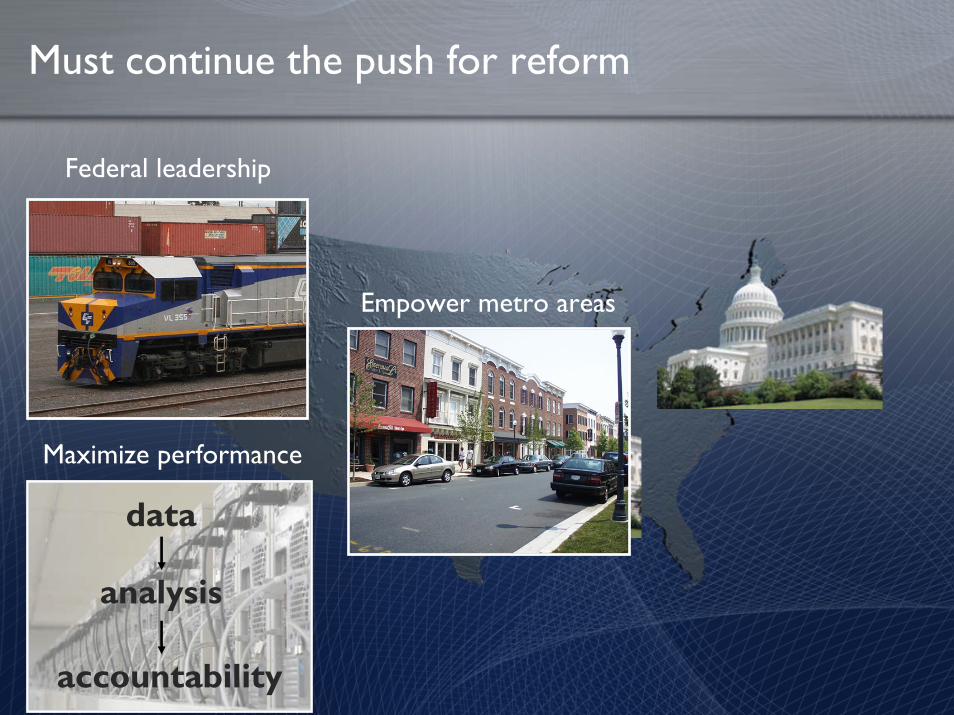
Empower metro areas
Federal leadership
Must continue the push for reform
Maximize performance
data
analysis
accountability

September 16, 2009
Washington DC
The Infrastructure Needs of a 21st Century City-A U.S. Perspective
The Institute of Brazilian Issues, the George Washington University
Emilia Istrate, Senior Research Analyst