the influenza virologic surveillance landscape of state and local
TRANSCRIPT

__________________________2 Association of Public Health Laboratories
As part of the Right Size Influenza Virologic Surveillance Project, this report was supported by Cooperative Agreement Number # U60HM000803 from CDC. Its contents are solely the respon-sibility of the authors and do not necessarily represent the official views of CDC.
© Copyright 2012, Association of Public Health Laboratories. All Rights Reserved.
The Association of Public Health Laboratories (APHL) is a national non-profit organization dedicated to working with members to strengthen governmental laboratories that perform testing of public health significance. By promoting effective programs and public policy, APHL strives to provide member laboratories with the resources and infrastructure needed to protect the health of US residents and to prevent and control disease globally.

_________________________________________ Data Summary of the Influenza Virologic Surveillance Landscape 3
TABLE OF CONTENTS
EXECUTIVE SUMMARY.....................................................................................................................4
INTRODUCTION..................................................................................................................................5
METHODOLOGY..................................................................................................................................5
PART I: STATE PUBLIC HEALTH LABORATORIES (SPHLS).................................................................6
SECTION I: SPHL PARTICIPATION IN NATIONAL SURVEILLANCE PROGRAMS............................6
SECTION II: STATE INFLUENZA SURVEILLANCE PROGRAMS.....................................................7
Organizational Structure and Coordination.................................................................7
State Public Health Laboratory Influenza Surveillance Responsibilities.......................7
Influenza Specimen Submission.................................................................................9
Influenza Program Outreach Activities......................................................................12
State Influenza Surveillance Data Dissemination and Test Result Reporting.............14
Staffing and Funding................................................................................................16
SECTION III: INFLUENZA TEST METHODS AND PRACTICES AT SPHLS....................................17
Influenza PCR..........................................................................................................17
Influenza Virus Culture/Isolation...............................................................................19
Use of WHO Influenza Reagent Kit for Identification of Influenza Isolates..................22
Influenza Antiviral Susceptibility/Resistance Testing.................................................22
PART II: LOCAL PUBLIC HEALTH LABORATORIES (LPHLS).............................................................24
SECTION I: LPHL PARTICIPATION IN NATIONAL SURVEILLANCE PROGRAMS..........................24
SECTION II: LOCAL INFLUENZA SURVEILLANCE PROGRAMS..................................................24
Organizational Structure and Coordination...............................................................24
Local Public Health Laboratory Influenza Surveillance Responsibilities.....................25
Influenza Specimen Submissions.............................................................................25
LPHLs and Local Influenza Program Outreach Activities.......................................... 28
LPHL Specimen Submission to National Influenza Surveillance System...................28
Data Dissemination and Test Result Reporting.........................................................28
Staffing and Funding Landscape of LPHLs...............................................................29
SECTION III: INFLUENZA TEST METHODS AND PRACTICES AT LPHLS....................................30
Influenza PCR..........................................................................................................30
Influenza Virus Culture/Isolation...............................................................................30
Use of WHO Influenza Reagent Kit for Identification of Influenza Isolates..................32
PART III: DISCUSSION......................................................................................................................34

__________________________4 Association of Public Health Laboratories
EXECUTIVE SUMMARY
In 2011, the Association of Public Health Laboratories (APHL) conducted the Right Size Influenza Virologic Surveillance Survey to collect data to characterize the current landscape of influenza vi-rologic surveillance and testing practices and policies in state and local public health laboratories (PHLs). The survey was distributed to 52 state and territorial public health laboratories (SPHLs), including the District of Columbia, and 34 local public health laboratories (LPHLs) that are known to perform influenza testing. Forty-six SPHLs (92%) and 23 LPHLs (68%) completed the survey. The data from the survey highlight the extensive role that PHLs, both state and local, play in influ-enza virologic testing and national influenza surveillance.
The survey data confirmed that all SPHLs participate in the World Health Organization (WHO) influenza surveillance program, and 76% of responding SPHLs (38 SPHLs) perform surveillance for non-influenza respiratory viruses. The survey data also provided insight into the important role of PHLs in diagnostic testing, in addition to their surveillance activities; typically half of influenza specimens are submitted to SPHLs for diagnostic purposes.
The survey data also document the additional responsibilities PHLs fulfill beyond performing tests. For example, more than 89% of responding SPHLs (40 SPHLs) consider that their laborato-ry’s responsibilities include: submitting data/information to specimen submitters, state epidemi-ologists, and CDC; providing virologic data for influenza surveillance reports; and reporting results to CDC. The vast majority of PHLs also provide technical guidance or act as technical resources in their jurisdictions (84%; 38 SPHLs).
The data highlight the collaboration that occurs between PHLs and epidemiologists/influenza co-ordinators, with the majority of state respondents co-formulating the policy for specimen submis-sion in their jurisdictions, both for routine (80%; 37 SPHLs) and emergency situations (93%; 42 SPHLs). Communication between the PHL and epidemiologists and/or the influenza coordinator occurs at least weekly for nearly one-third of responding states, and occurs as needed in more than half.
The survey data confirmed that the CDC influenza rRT-PCR assay has become the most com-monly used routine influenza test method at PHLs. All but one responding SPHL performed the assay at least once per week during the 2010-2011 influenza season, while 78% of SPHLs (36 SPHLs) performed influenza virus culture at least once per week during that period. Of those labs that do not perform virus culture routinely, 90% (9 SPHLs) cited a policy decision to use rRT-PCR for routine influenza testing as the reason for limiting viral culture. Also of note, the majority of responding SPHLs use monoclonal antibodies from commercial sources (64%; 23 SPHLs) com-pared to only 36% (13 SPHLs) that use the CDC WHO Influenza Reagent Kit for Identification of Influenza Isolates to characterize influenza viral isolates. According to the survey data, 24% of SPHL respondents (11 SPHLs) perform pyrosequencing using the CDC protocols for antiviral resistance testing; no LPHLs perform antiviral resistance/susceptibility testing.
Finally, the survey data clearly demonstrate concerns about funding; however, despite fiscal challenges, PHLs have been able to maintain an extensive menu of influenza testing and surveil-lance-related activities. Overall, the survey data highlight the urgent need for the Right Size Influ-enza Virologic Surveillance Project to address the future landscape of influenza testing at PHLs to ensure a sustainable, efficient, and data-driven surveillance system.

_________________________________________ Data Summary of the Influenza Virologic Surveillance Landscape 5
INTRODUCTION
The Association of Public Health Laboratories (APHL) and the Influenza Division of the Centers for Disease Control and Prevention (CDC) launched a three-year project in 2010 to define the core capabilities and optimal “right size” for influenza virologic surveillance. The outcomes of the proj-ect will provide key state, national and global surveillance requirements to inform policy decisions and disease prevention efforts. The major outcome of the “Right Size Influenza Virologic Surveil-lance Project” will be the development of new guidelines for PHL virologic surveillance. Imple-mentation of the right-size virologic surveillance guidelines will help CDC, public health laborato-ries (PHLs), and surveillance programs use available resources efficiently, redirect resources as necessary, and build new capacity as needed for optimal surveillance.
APHL developed and distributed the Right Size Influenza Virologic Surveillance Survey during 2011 as one of the project’s activities, since no definitive data-based descriptions of public health laboratory activities related to influenza testing and surveillance were available. The pur-pose of the survey was to collect data to characterize the current landscape of influenza virologic surveillance and testing practices and policies in state and local PHLs. Understanding existing laboratory capabilities and practices will inform efforts to develop new guidelines and define the core capabilities and the optimal “right-size” for influenza virologic surveillance. The survey captured how influenza testing priorities are established and funded, as well as challenges to the sustainability of public health laboratory influenza testing.
METHODOLOGY
The survey was launched on July 20, 2011, and closed September 26, 2011. This 59-question survey was administered electronically through MRInterview, a web-based survey instrument. The survey was distributed to 52 state and territorial public health laboratories (SPHLs), including the District of Columbia, and 34 local public health laboratories (LPHLs) that are known to per-form influenza testing. Forty-six SPHLs completed the survey, resulting in a response rate of 92%. The response rate for LPHLs was 68%, representing 23 LPHLs.
Respondents were asked to base their responses on the period of October 1, 2010 through April 30, 2011 (the 2010-2011 influenza season) unless otherwise directed. They were also instructed to consult with epidemiologists and/or influenza coordinators as needed and to request a review by their laboratory director.
This summary report offers detailed analysis of the data collected by the survey. Due to varia-tions in the practices between SPHLs and LPHLs, this report presents the SPHL data (including DC) and the LPHL data separately. Both parts of the report present the data analysis in three sec-tions: 1) participation in national surveillance programs; 2) influenza surveillance programs; and 3) influenza test methods and practices. Although the survey was distributed to both state and local public health laboratories, many of the survey questions were more applicable to SPHLs, and analysis of some of the responses focused only on the state responses.
__________________________6 Association of Public Health Laboratories
PART I: SPHLS
PART I: STATE PUBLIC HEALTH LABORATORIES (SPHLs)
SECTION I: STATE PUBLIC HEALTH LABORATORY PARTICIPATION IN NATIONAL SURVEILLANCE PROGRAMS
An understanding of the current landscape of influenza virologic surveillance is critical to shaping the future practices and the “right size” of influenza virologic surveillance. The current US influ-enza surveillance system is a collaborative effort between CDC and many partners. Surveillance elements include morbidity (tracking influenza-related illness), mortality (measuring the impact of influenza on deaths), and virologic surveillance (determining which influenza viruses are circulat-ing and detecting changes in influenza viruses). CDC also coordinates the National Respiratory and Enteric Virus Surveillance System (NREVSS), which collects data on the laboratory detection of respiratory viruses (including influenza) and select enteric viruses. This survey collected infor-mation about PHL participation in both the US influenza surveillance system and NREVSS.
Public health laboratories are the backbone of state and national virologic surveillance programs for influenza. The SPHL role involves dual responsibilities of reporting testing data and submitting appropriate samples to CDC for surveillance and virus characterization. Both data and samples must be provided in a timely manner.
All of the responding SPHLs participate in the US influenza virologic surveillance system as US World Health Organization (WHO) Collaborating Laboratories; however, only 21 of 46 (46%) responding SPHLs participate in NREVSS (based on both survey data and CDC records). Two additional SPHLs did not know if their laboratory participated in NREVSS. The primary reasons for non-participation were evenly distributed among: a) not having adequate resources for all of the requested data submissions; b) belief that it is not worthwhile for the small volume of testing performed in their laboratory; and c) a lack of awareness of NREVSS.
Thirty-eight (84%) responding SPHLs stated that their laboratory performs surveillance testing for other (non-influenza) respiratory viruses. Of these SPHLs, 24% (11 SPHLs) do so for surveil-lance purposes only, while 53% (24 SPHLs) perform the testing for diagnostic and surveillance purposes.

_________________________________________ Data Summary of the Influenza Virologic Surveillance Landscape 7
PART I: SPHLS
SECTION II: STATE INFLUENZA SURVEILLANCE PROGRAMS
Organizational Structure and Coordination
This survey examined the roles of PHLs and epidemiologists/influenza coordinators related to formulating and implementing influenza program policies and guidelines. Understanding these roles and relationships is important to understanding how decisions are made in influenza viro-logic surveillance.
The data highlight the collaboration that occurs between SPHLs and epidemiologists/influenza coordinators, with the majority of state respondents co-formulating the policy for specimen sub-mission, both for routine (80%; 37 SPHLs) and emergency situations (93%; 42 SPHLs). Commu-nication between the PHL and epidemiologists and/or the influenza coordinator occurs at least weekly for nearly one-third of responding states (29%; 13 SPHLs), and occurs as needed in more than half (56%; 25 SPHLs).
State Public Health Laboratory Influenza Surveillance Responsibilities
All responding SPHLs perform testing for influenza as one of the laboratory responsibilities in their state’s influenza surveillance program. The survey data also document the additional responsibilities PHLs fulfill beyond performing tests. The overwhelming majority submit data/information to specimen submitters, state epidemiologists/influenza coordinators and CDC (98%; 44 SPHLs) and provide virologic data for influenza surveillance reports (93%; 42 SPHLs). Eighty-nine percent of SPHLs (40 SPHLs) report to CDC; however, CDC receives reports from all states, indicating that either a) someone else reports to CDC in five responding states; b) the respondent was unaware of the reporting that occurs; or c) the respondent misunderstood the question. Other laboratory responsibilities identified by more than half of the responding SPHLs included educating/contacting submitters and reviewing and analyzing data (see Figure 1).
A larger percentage of laboratories request samples for influenza surveillance in those states where the laboratory and state influenza coordinator/epidemi-ologists work together to enroll sites or the laboratory enrolls additional sites when compared to those states where only the epidemiologists/state influenza coordinators enroll and communicate with surveillance sites (62% vs. 19%).

__________________________8 Association of Public Health Laboratories
PART I: SPHLS
*“Other” includes submitting specimens to CDC contract laboratories, providing test kits to submitters, and surveying sentinel laboratories for rapid influenza diagnostic test (RIDT) results.
OTHER*
REQUEST SAMPLES
REVIEW AND ANALYZE DATA
EDUCATE/CONTACT SUBMITTERS
REPORT TO CDC
PROVIDE VIROLOGIC DATA FOR INFLUENZA SURVEILLANCE REPORT
SUBMIT DATA/INFORMATION TO SUBMITTERS, STATE
EPIDEMIOLOGISTS, AND CDC
TEST SAMPLES
Percent of Respondents
3
15
28
31
40
42
44
45
0 10 20 30 40 50 60 70 80 90 100
Figure 1. SPHL Influenza Surveillance Responsibilities. n=45

_________________________________________ Data Summary of the Influenza Virologic Surveillance Landscape 9
PART I: SPHLS
Influenza Specimen Submission
Specimen Submission GuidelinesAs part of the survey, SPHLs were asked to describe the specimen submission guidelines pro-vided to ILINet providers (outpatient influenza-like illness surveillance network of healthcare providers) for influenza surveillance. The responses varied among states, but demonstrated common elements. Among those respondents that provided details, the submission criteria most commonly include influenza-like illness (ILI), which is characterized as fever >100°F or 37.8°C with cough and/or sore throat, in the absence of another known cause. Other criteria specified included: hospitalization, vaccine failure, unusual or severe illness, recent travel, pediatric death, unexplained death, death following ILI, pregnancy, risk factors, outbreaks, and positive test re-sults, including rapid influenza diagnostic test (RIDT) results.
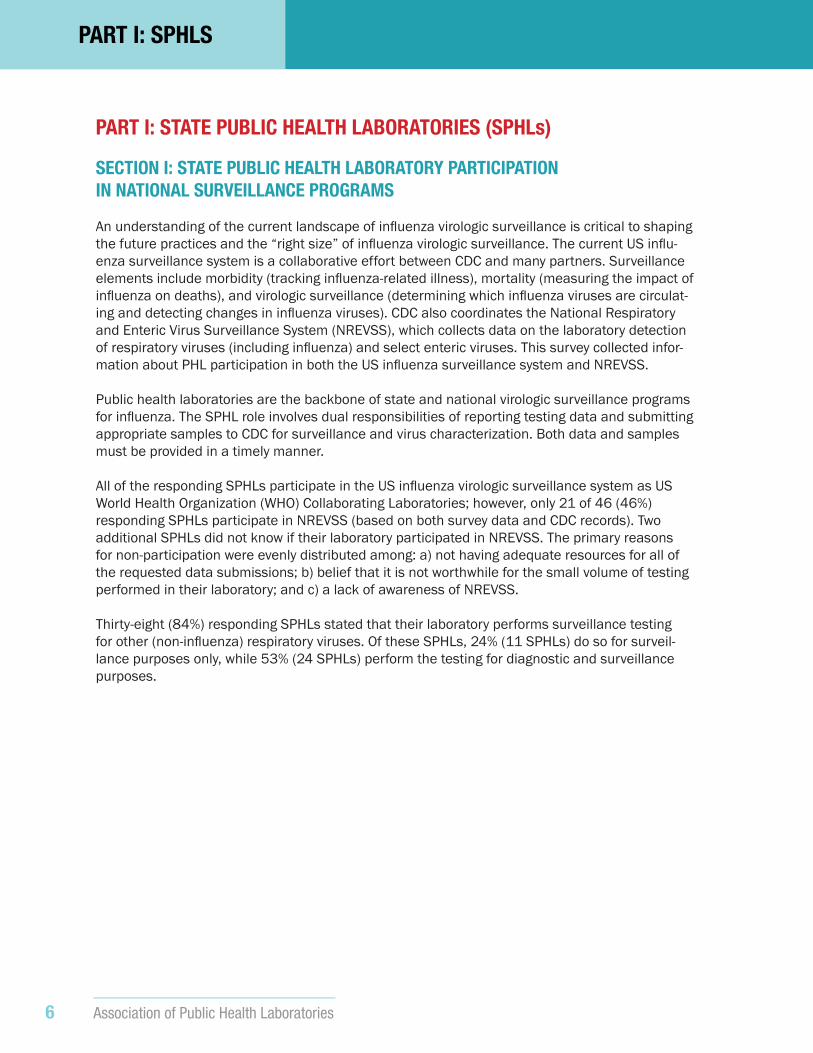
Influenza Specimen Submitters/ProvidersSentinel providers enrolled by the state influenza coordinator were the most frequently (93%; 43 SPHLs) enrolled specimen submitters in responding states’ influenza programs dur-ing the 2010-2011 influenza season. The second most frequently identified enrolled group was clinical laboratories, reported by 85% of SPHL respondents. SPHL respondents also identified university student health centers (50%; 23 SPHLs), public health departments or clinics (48%; 22 SPHLs), and medical examiners (41%; 19 SPHLs) as enrolled submitters. Sentinel providers enrolled by the laboratory, rapid testing sites, long-term care facilities, and LPHLs were each iden-tified as enrolled submitters by fewer than 25% of respondents. Commercial interstate laborato-ries, academic research centers, airport clinics, and hospital emergency departments were each identified by fewer than 7% of respondents (see Figure 2). By comparison, the most frequently identified providers from which responding SPHLs received specimens for influenza testing during the 2010-2011 influenza season were clinical laboratories (100%; 46 SPHLs), followed closely by sentinel providers enrolled by the state influenza coordi-nator (98%; 45 SPHLs). University student health centers (85%; 39 SPHLs), medical examiners (78%; 36 SPHLs), long-term care facilities (78%; 36 SPHLs), and public health departments or clinics (65%; 30 SPHLs) were also identified as specimen submitters by SPHL respondents (see Figure 2). Seventy percent of SPHLs (32 SPHLs) responded that they believed their laboratory received a sufficient number of samples for influenza surveillance during the 2010-2011 influenza season (based on state and/or CDC expectations). When asked to identify what they believed to be the reasons that their laboratory did not receive a sufficient number of samples for influenza surveil-lance throughout the 2010-2011 season, the remaining 30% of responding SPHLs (14 SPHLs) provided at least one perceived cause for the lack of sufficient specimens. Of those SPHLs, 59% cited a lack of funding to cover costs and incentives for sample submission and a lack of visibility with submitters. Additionally, SPHLs listed provider noncompliance, poor sentinel participation, or the extra work and burden required by the sentinel sites as other reasons for receiving an insufficient number of samples. Two additional laboratories stated that they actively limit submis-sions to contain costs.
Influenza Specimen Submission RecommendationsAll respondents provided recommendations for specimen submission to providers, with at least 87% (40 SPHLs) recommending specimen submission categories such as: epidemiologist re-quest, sentinel provider selected by epidemiologist, pediatric death with ILI, and institutional or community outbreak (see Figure 3).
__________________________10 Association of Public Health Laboratories
PART I: SPHLS
ACADEMIC RESEARCH LABORATORIES
OTHER*
COMMERCIAL INTERSTATE LABORATORIES
CITY/COUNTY PUBLIC HEALTH LABORATORIES
RIDT SITES
SENTINEL PROVIDERS ENROLLED BY LABORATORY
LONG TERM CARE FACILITIES
MEDICAL EXAMINERS
PUBLIC HEALTH DEPARTMENTS/PUBLIC HEALTH CLINICS
UNIVERSITY STUDENT HEALTH CENTERS
CLINICAL LABORATORIES
SENTINEL PROVIDERS ENROLLED BY STATE INFLUENZA COORDINATOR
Percent of Respondents
0 10 20 30 40 50 60 70 80 90 100
2
6
9
16
14
9
36
36
30
39
46
45
2
2
3
8
10
10
11
19
22
23
39
43
0 10 20 30 40 50 60 70 80 90 100
ENROLLED SPECIMEN SUBMITTERSACTUAL SPECIMEN SUBMITTERS
Figure 2. Enrolled and Actual Specimen Submitters as Identified by SPHLs. n=46
*“Other” for actual submitters includes airport, clinical and hospital emergency rooms for enrolled submitters and congregate living facilities, school outbreaks, etc.

_________________________________________ Data Summary of the Influenza Virologic Surveillance Landscape 11
PART I: SPHLS
OTHER*
ALL SPECIMENS UNTIL CAPACITYREACHED
SENTINEL PROVIDER SELECTED BY PUBLIC HEALTH LABORATORY
CLINICIAN/LABORATORY REQUEST
PREGNANT PATIENT WITH ILI
VACCINE FAILURES
ALL EARLY SEASON OR OUT OF SEASON POSITIVES
ADULT DEATH WITH ILI
HOSPITALIZED PATIENT WITH ILI
INSTITUTIONAL OR COMMUNITY OUTBREAK
PEDIATRIC DEATH WITH ILI
SENTINEL PROVIDER SELECTED BY EPIDEMIOLOGISTS
EPIDEMIOLOGIST REQUEST
Percent of Respondents
6
7
17
20
26
28
30
34
36
40
42
43
44
0 10 20 30 40 50 60 70 80 90 100
Figure 3. Specimen Submission Categories Recommended for Routine Influenza Surveillance as Identified by SPHLs. n=46
*“Other” includes airport surveillance, animal to human transmission, patients not responding to antiviral treatment, all suspect 2009 H1N1, and more.
__________________________12 Association of Public Health Laboratories
PART I: SPHLS
Influenza Program Outreach Activities
SPHLs and state influenza programs are engaged in a variety of outreach activities to specimen providers and their clinical communities. These activities include offering financial support, sup-plies, and expertise. Generally, outreach activities in support of influenza testing by other labora-tories and testing sites were more prevalent in laboratories where the responsibilities included educating and contacting submitters, requesting samples, submitting data/information to others, providing virologic data, reviewing and analyzing data, and reporting to CDC.
All responding states provide some type of support or incentives to influenza surveillance speci-men submitters, with 85% or more of responding states (more than 40 SPHLs) providing free testing, free transport kits, and free shipping. Some of the less commonly reported incentives were medical reference materials, admission to a state conference, clinical consultations, chil-dren’s books, viral care kits, and framed artwork (see Figure 4).
In terms of financial support, all but one state defrayed the costs of specimen collection, and all but two states defrayed the costs of specimen transport for sample submitters who were enrolled in the laboratory influenza surveillance program during the 2010-2011 influenza season. Eighty percent (37 SPHLs) provided collection supplies, and 48% (22 SPHLs) pay specimen transport costs. No states provided reimbursement or payment for specimen collection or transport costs, although 3 states do provide payment for participation or per specimen.
For the purposes of this report, jurisdictional awareness and collection of influenza testing data from clinical and commercial laboratories was considered to be a component of outreach activi-ties. Thirty-three (73%) responding SPHLs stated that they know the number of clinical/com-mercial laboratories within their jurisdiction that perform influenza testing by real-time reverse transcriptase polymerase chain reaction (rRT-PCR), culture and/or sequencing, although 17 (38%) qualified that knowledge as being “only the laboratories that communicate with the influ-enza surveillance program or public health laboratory.”
More than 80% of responding SPHLs (34 SPHLs) serve as a resource and/or provide guidance for technical information related to influenza testing, and 64% (29 SPHLs) perform initial sub-typing of influenza positives and additional reference/specialized testing. Nearly half of state respondents (47%; 21 SPHLs) communicate laboratory-based surveillance data to specimen submitters, and more than half (58%; 26 SPHLs) collect testing data from other laboratories and testing sites.

_________________________________________ Data Summary of the Influenza Virologic Surveillance Landscape 13
PART I: SPHLS
PAYMENT FOR PARTICIPATION ORPER SPECIMEN
HAND SANITIZERS
OTHER*
RIDTS
CERTIFICATE OF PARTICIPATION
EDUCATION/ACCESS TO PUBLIC HEALTH EXPERTISE
FREE SHIPPING/COURIER SERVICES
FREE TRANSPORT KITS
FREE TESTING
Percent of Respondents
3
3
7
13
17
22
40
41
45
0 10 20 30 40 50 60 70 80 90 100
Figure 4. Incentives Provided to Influenza Surveillance Providers/Submitters by SPHLs. n=46
*“Other” incentives provided are described in the text.

__________________________14 Association of Public Health Laboratories
PART I: SPHLS
State Influenza Surveillance Data Dissemination and Test Result Reporting
The dissemination of influenza surveillance data is critical to national surveillance and also plays an important role in state and local surveillance. These data are shared among multiple individu-als, organizations, and institutions by both SPHLs and LPHLs. In addition to informing recipients, the dissemination of data provides visibility to public health and surveillance activities and im-pacts patient management.
When reporting influenza test results to submitters, the vast majority of responding SPHLs (91%; 41 SPHLs) use their laboratory information management system (LIMS) to generate reports. However, a variety of methods are then used to distribute these result reports to the sub-mitters. US Postal Service mail is the most commonly used distribution method (38%; 17 SPHLs), followed by fax (22%; 10 SPHLs) and email (4%; 2 SPHLs). Only 27% of responding SPHLs (12 SPHLs) use electronic reporting directly to submitters via their LIMS for result reporting.
By contrast, 67% of SPHL respondents (30 SPHLs) use electronic reporting via LIMS as the primary method of reporting influenza test results to state influenza coordinators and/or state or local epidemiologists. All SPHLs reported to their state influenza coordinator and/or state/local epidemiologists at least weekly during the 2010-2011 influenza season, with 51% (23 SPHLs) reporting in “real time” as results were generated.
According to CDC and the survey data, all SPHLs reported electronically to CDC during the 2010-2011 influenza season, with the majority (58%; 26 SPHLs) of reports sent via PHLIP (Public Health Laboratory Interoperability Project), followed by web-based Laboratory Internet Reporting System (22%; 10 SPHLs) and Public Health Laboratory Information System 2 (PHLIS2) (13%; 6 SPHLs) (see Figure 5). Ninety-five percent of SPHLs (43 SPHLs) reported to CDC at least weekly during the 2010-2011 influenza season. Forty-nine percent of SPHL respondents (22 SPHLs) are either capable of receiving result reports from CDC via electronic messaging using the Health Level Seven (HL7) standards or are developing the capability.

_________________________________________ Data Summary of the Influenza Virologic Surveillance Landscape 15
PART I: SPHLS
NREVSS
OTHER*
PHLIS2
WEB−BASED(LABORATORY INTERNET
REPORTING SYSTEM)
PHLIP
Percent of Respondents
1
2
6
10
26
0 10 20 30 40 50 60 70 80 90 100
Figure 5. Method of Reporting Influenza Laboratory Surveillance Data to CDC. n=45
*“Other” includes PHINMS.

__________________________16 Association of Public Health Laboratories
PART I: SPHLS
Staffing and Funding1
The number of full-time equivalent (FTE) laboratory positions that support influenza virologic surveillance varied among responding SPHLs. Three responding SPHLs reported having less than one FTE position to support influenza testing, while 11 SPHLs (24%) reported that five or more FTEs supported influenza testing.
SPHL estimates of annual costs related to influenza testing varied widely. Eleven SPHLs (24%) stated that they were unable to provide an accurate estimate of the costs; five additional SPHLs stated that they could only provide rough estimates or were unable to provide costs for some of the listed categories. Among the 34 SPHLs submitting cost data, the estimated costs for the 2010-2011 influenza season ranged from $39,500 to $902,600 (median $229,375). Because of the incomplete data or rough estimates, these data should be interpreted with caution.
Based on the 34 respondents that provided costing estimates, personnel costs (including ben-efits) for staff supporting influenza testing accounted for the largest proportion of costs. Us-ing the average of the costs provided, the second largest portion belonged to testing supplies and reagents that were not provided by CDC; this category may increase if testing supplies and reagents are no longer provided by CDC. The costs for LIMS and reporting was the third largest category. Instrument maintenance and repair and specimen collection and transport costs were the two categories with the smallest costs. It must be noted, however, that these costs may be subject to change, as service contracts expire that are currently funded by APHL or CDC.
SPHLs and state influenza surveillance programs are funded through a variety of sources. One of the most common funding sources is the Epidemiology and Laboratory Capacity (ELC) funding program administered by the CDC. ELC cooperative agreement funds are provided to states to strengthen collaboration between the public health laboratory and epidemiologists, with a focus on naturally occurring infectious diseases, drug-resistant infections, and electronic reporting of surveillance data. Other sources of funding are the Public Health Emergency Preparedness (PHEP) and Public Health Emergency Response (PHER) cooperative agreement funding (admin-istered by the CDC) and specific project funding from the CSTE (Council of State and Territorial Epidemiologists).
Survey data were analyzed to define the proportion of the costs funded by fee-for-service test-ing, state funding, and grant or cooperative agreement funding sources. The total ELC funding2 received by states during 2010 designated for influenza laboratory surveillance and/or testing ranged from $0 (reported by 5 states) to $325,700, with a reported average of $88,728. Table 1 summarizes the percentage of funding expended by the SPHL from each of the afore-mentioned funding sources during the 2010-2011 influenza season. Despite the concerns expressed by SPHLs, only 8 of 45 states (18%) reported that the amount of funding available during the 2010-2011 influenza season inhibited their laboratory surveillance and testing activi-ties related to influenza, including meeting requirements for soliciting specimens from sentinel providers and making routine submissions to the CDC.
_________________1 Funding and influenza testing costs are being examined in more detail and will be reported as a separate deliverable to the Right Size Influenza Virologic Surveillance Project.2 It should be noted that the funding levels of ELC cooperative agreement funds have decreased since this survey was administered.

_________________________________________ Data Summary of the Influenza Virologic Surveillance Landscape 17
PART I: SPHLS
SECTION III: INFLUENZA TEST METHODS AND PRACTICES AT SPHLS An extensive menu of influenza testing methods is available to PHLs, including molecular diagnostics, virus culture, and antiviral resistance testing. The survey asked PHLs to report which methods are used and testing characteristics, such as turnaround time. While all but one responding SPHL perform rRT-PCR on a routine basis (i.e., at least once per week during the influ-enza season), use of the other testing methods varies (see Figure 6).
Influenza PCR
Since rRT-PCR data is considered a critical component of national influenza surveillance, this survey sought to identify the impact of the assay on testing and referral practices. When unsub-typeable influenza A specimens were detected, 77% of responding SPHLs (35 PHLs) submitted the unsubtypeable specimen(s) to CDC for further testing and characterization within two days of initial testing. All laboratories submitted unsubtypeable specimens within one week of initial testing. Eighty-nine percent of responding SPHLs (40 SPHLs) provided PCR results to submitters within three days of specimen receipt, and all PCR results were reported to submitters within an average of one week.
PHLs were also asked to rate a variety of factors, other than funding, that limit influenza PCR test-ing capacity during routine and pandemic/surge conditions. Under routine testing conditions, the most significant factor limiting influenza PCR capacity identified by SPHLs was having insufficient staff to redirect to other tests/tasks. Lack of trained personnel and electronic data management capability were the next most commonly cited limiting factors (see Figure 7).
During a pandemic or surge response, SPHLs cited lack of trained personnel and, again, insuffi-cient staff to allow for reassignment as the most significant inhibiting factors. SPHLs also indi-cated that data management capability and specimen receipt/accessioning were the next most significant limiting factors during a pandemic or surge response (see Figure 7).
Table 1. Percentage of Total Dollars Expended by SPHLs for Influenza Testing During the 2010-2011 Influenza Season According to Funding Source. n=45
Note: The minimum % for all categories was 0%.*“Other” primarily includes PHER funding, but also includes other federal grants, immunization grants, and Affordable Care Act ELC grants. CSTE is the Council of State and Territorial Epidemiologists.

__________________________18 Association of Public Health Laboratories
PART I: SPHLS
SEQUENCING FOR GENOTYPING
RIDTs
DIRECT SPECIMEN IMMUNOFLUORESCENCE
OTHER MOLECULAR ASSAY
ANTIVIRAL RESISTANCE/SUSCEPTIBILITY
VIRAL CULTURE/ISOLATION
rRT−PCR (CDC ID/SUBTYPING ASSAY)
Percent of Respondents
1
2
3
6
11
36
45
0 10 20 30 40 50 60 70 80 90 100
Figure 6. Influenza Test Methods Routinely Performed by SPHLs. n=46

_________________________________________ Data Summary of the Influenza Virologic Surveillance Landscape 19
PART I: SPHLS
Influenza Virus Culture/Isolation
Although molecular diagnostics have become the more commonly used assays in many laborato-ries, virus culture/isolation continues to play a significant role in influenza surveillance, as antigen-ic characterization of viral isolates is important to inform vaccine virus selection. In recent years, there has been an observed decline in the number of PHLs performing virus isolation, due to the availability of molecular assays and resource limitations in the PHLs. Therefore, this survey cap-tured information about the factors that have led to the discontinuation or limitation of influenza virus culture testing, in addition to information about laboratories that continue to perform virus culture. According to the data, only 1 SPHL performs virus culture regularly for influenza testing, but does not perform rRT-PCR routinely.
Of the 36 responding SPHLs that perform virus culture, the overwhelming majority (92%; 33 SPHLs) reported the reasons for performing virus culture are to provide isolates for submission to CDC and detecting other respiratory viruses (see Figure 8).
Of the responding SPHLs that self-identified as performing little or no virus culture, 18 (40%) indicated that the reason that they do not perform viral culture is a policy decision to use rRT-PCR for routine influenza testing; 7 SPHLs cited the cost to maintain cell culture capability. The policy decision factor is corroborated by the fact that, of the 10 SPHLs that perform no virus culture, 100% perform rRT-PCR and 90% cited a policy decision to use rRT-PCR as the reason for limiting viral culture.
As with PCR testing, all responding SPHLs were asked to rank factors that limit routine influenza culture testing capacity. All of the most frequently identified factors were related to staffing issues, with the most frequently identified factor being the availability of trained personnel. The next most significant factors were availability of expertise and, as with PCR, insufficient staff to allow for staff reassignment to other tests/tasks (see Figure 7).

__________________________20 Association of Public Health Laboratories
PART I: SPHLS
AVAILABILITY OF CELL CULTURE**
AVAILABILITY OF EXPERTISE**
PCR INSTRUMENTS*
REAGENTS/SUPPLIES ON SITE
INSTRUMENTATION
ADEQUATE LABORATORY SPACE
SPECIMEN RECEIPT/ACCESSIONING
RESULT REPORTING
ELECTRONIC DATA MANAGEMENT CAPABILITY
TRAINED PERSONNEL
INSUFFICIENT STAFF TO ALLOW FOR REASSSIGNMENT TO OTHER
TESTS/TASKS
MEAN RESPONSE
ROUTINE INFLUENZA PCRPANDEMIC/SURGE INFLUENZA PCRROUTINE INFLUENZA CULTURE
0 0.5 1 1.5 2 2.5 3 3.5 4 4.5 5
VERY SIGNIFICANTNOT SIGNIFICANT
Figure 7. Significance of Factors, other than Funding, that Limit SPHL Influenza Testing Capacity. n=45
*Factors only listed for routine and pandemic/surge influenza PCR. **Factors only listed for routine influenza culture.

_________________________________________ Data Summary of the Influenza Virologic Surveillance Landscape 21
PART I: SPHLS
RESEARCH
TEST VALIDATION/VERIFICATION
ILI SURVEILLANCE
VIRUS DETECTIONFOR CLINICAL DIAGNOSIS
SUPPORT FOR rRT−PCR OR OTHERTESTING
ISOLATE SUBMISSION TO CDC
DETECTION OF OTHER RESPIRATORY VIRUSES
Percent of Respondents
2
7
19
20
22
33
33
0 10 20 30 40 50 60 70 80 90 100
Figure 8. Purpose for Performing Viral Culture at SPHLs. n=36

__________________________22 Association of Public Health Laboratories
PART I: SPHLS
Use of WHO Influenza Reagent Kit for Identification of Influenza Isolates
The 36 SPHLs that perform virus culture were asked which methods they use to identify and characterize cultured influenza viruses. The majority of SPHLs use the CDC rRT-PCR assay (86%; 31 SPHLs) and/or immunofluorescence using commercially available monoclonal antibodies (64%; 23 SPHLs) to type and subtype cultured influenza viruses. Only 13 SPHL respondents (36%) identify isolates using the monoclonal antibodies in the WHO Influenza Reagent Kit for Identification of Influenza Isolates kits (WHO kits), provided by CDC (see Figure 9).
SPHLs were also asked if and how they use the WHO kit reagents provided by CDC. Twenty-four responding SPHLs (53%) do not use the kit reagents; 11 (24%) of those laboratories keep the reagents for emergency or problem virus situations. Twenty-one responding SPHLs (47%) indi-cated that they use the WHO kit reagents for at least one purpose; the purpose cited was evenly distributed among using the monoclonal antibodies for immunofluorescence tests, using the hemagglutination inhibition (HI) reagents for typing and subtyping, and using the HI reagents for influenza B lineage typing.
Influenza Antiviral Susceptibility/Resistance Testing
As previously mentioned, 11 responding SPHLs (24%) performed antiviral susceptibility/resis-tance testing during the 2010-2011 influenza season. All 11 SPHLs performed pyrosequencing using CDC protocols. In addition, two laboratories performed neuraminidase inhibition, and 1 laboratory performed pyrosequencing using other reference protocols. Two laboratories also reported using whole gene dideoxy sequencing.

_________________________________________ Data Summary of the Influenza Virologic Surveillance Landscape 23
PART I: SPHLS
OTHER
rRT−PCR (NON−CDC ASSAY)
IMMUNOFLUORESCENCE(CDC-PROVIDED WHO KIT
MONOCLONAL ANTIBODIES)
HEMAGGLUTINATION INHIBITION(CDC-PROVIDED WHO KIT REAGENTS)
CYTOPATHOGENIC EFFECTWITH OR WITHOUT HEMADSORPTION
IMMUNOFLUORESCENCE(COMMERCIAL MONOCLONAL
ANTIBODIES)
rRT−PCR (CDC ASSAY)
Percent of Respondents
1
3
13
14
17
23
31
0 10 20 30 40 50 60 70 80 90 100
Figure 9. Methods used for Identifying Cultured Influenza Viruses. n=36

__________________________24 Association of Public Health Laboratories
PART II: LPHLS
PART II: LOCAL PUBLIC HEALTH LABORATORIES (LPHLs)
SECTION I: LOCAL PUBLIC HEALTH LABORATORY PARTICIPATION IN NATIONAL SURVEILLANCE PROGRAMS
The responsibilities and practices of LPHLs vary greatly. Some LPHLs operate relatively indepen-dently, while others maintain closely coordinated relationships with their SPHL. The 2011 APHL Right Size Influenza Virologic Surveillance Survey questions were primarily targeted towards SPHLs, but the survey was also distributed to LPHLs, and 23 (68%) responded. Although some of the survey questions were not applicable to LPHLs, the LPHL survey data provide some previ-ously undocumented insight into the practices and organization of LPHLs related to influenza virologic surveillance and testing. More importantly, the LPHL survey data provide a broad picture of the national influenza surveillance system by examining the system at all levels and clarifying the relationships between jurisdictional levels. The LPHL survey data that follow in Part II of this report do not correlate exactly with the topics and organization of the data presented for SPHL re-sponses in Part I. This report sought to capture and summarize only the data that were pertinent and clearly interpretable from the LPHL perspective.
While 100% of responding SPHLs participate in the WHO influenza surveillance program coor-dinated by CDC, only 8 (35%) LPHLs definitively know that they participate in the WHO influenza surveillance network. Even fewer participate in the NREVSS network (22%; 5 LPHLs). Of the 14 LPHLs that do not participate in NREVSS, 43% (6 LPHLs) attributed their non-participation to lack of awareness about the network. Some LPHLs commented that SPHLs participate for the entire state, including the LPHLs. Sixty-eight percent of responding LPHLs (15 LPHLs) perform testing for non-influenza respiratory viruses for diagnostic and/or surveillance purposes.
SECTION II: LOCAL INFLUENZA SURVEILLANCE PROGRAMS
Organizational Structure and Coordination
As with the SPHLs, the majority of LPHLs (65%; 12 LPHLs) indicated that the laboratory and epidemiologists co-formulated the policy for specimen submission recommendations during the 2010-2011 influenza season. Twenty-one percent of responding LPHLs (5 LPHLs) noted that developing the policy is not a local function, and they follow the state’s policy. The true percent-age of LPHLs that follow state policy may actually be greater, because this was not an available response choice, but was written in by these five laboratories.
Forty-five percent of responding LPHLs (10 LPHLs) review their specimen submission policy for possible changes annually or as needed. When asked to describe who decides what the speci-men submission policy is for emergency situations, 55% of LPHL respondents (12 LPHLs) follow the most recent CDC policies, 11 LPHLs (50%) indicated that this decision is made at the state level, and 45% (10 LPHLs) formulate the policy in coordination with epidemiologists.

_________________________________________ Data Summary of the Influenza Virologic Surveillance Landscape 25
PART II: LPHLS
Local Public Health Laboratory Influenza Surveillance Responsibilities
All but 1 LPHL (95%; 21 LPHLs) reported that testing samples is one of their laboratory’s influ-enza surveillance responsibilities. Since this survey was only sent to LPHLs known to perform influenza testing, this discrepancy is likely a misinterpretation of the “Test Samples” answer choice or a response error. LPHLs also listed submitting data/information to submitters, state epidemiologists and CDC (82%; 18 LPHLs), educating and contacting specimen submitters (77%; 17 LPHLs), and providing virologic data for influenza surveillance reports (73%; 16 LPHLs) among their responsibilities (see Figure 10).
Influenza Specimen Submissions
Specimen Submission GuidelinesThe specimen submission guidelines provided to ILINet providers varied among LPHL respon-dents, but were generally similar to the SPHL submission criteria. The majority of LPHLs reported pediatric death with influenza-like illness (ILI) (87%; 20 LPHLs), institutional or community out-break (78%; 18 SPHLs), and hospitalized patient with ILI (78%; 18 SPHLs).
Influenza Specimen Submitters/ProvidersThis survey captured information about submitters that were enrolled to provide specimens and submitters that actually provided specimens for influenza surveillance. The majority of respond-ing LPHLs (68%; 15 LPHLs) identified clinical laboratories as enrolled submitters, and even more (90%; 20 LPHLs) indicated that they actually received specimens from clinical laboratories. Sen-tinel providers enrolled by the state influenza coordinator and public health departments/clin-ics were cited by 36% of responding LPHLs (8 LPHLs) as enrolled submitters. However, sentinel providers enrolled by the state influenza coordinator were only cited by 18% of LPHLs as actually submitting specimens (see Figure 11).
Influenza Specimen Submission RecommendationsSimilar to SPHLs, 65% of responding LPHLs (15 LPHLs) accept specimens from clinical provid-ers for primary diagnostic purposes. These diagnostic specimens accounted for 29% to 100% of influenza specimens submitted to LPHLs.
Eighty-nine percent of responding LPHLs (17 LPHLs) reported that they collect samples from RIDT sites for influenza surveillance, while 58% (11 LPHLs) cited surveillance for all respiratory illness-es, including influenza, circulating in their community as the reason for collecting samples from RIDT sites. In addition, LPHLs use these specimens to confirm early-season positives from RIDTs (58%; 11 LPHLs), confirm out-of season RIDT positives (47%; 9 LPHLs), and confirm late-season RIDT positives (42%; 8 LPHLs).

__________________________26 Association of Public Health Laboratories
PART II: LPHLS
OTHER*
REPORT TO CDC
REQUEST SAMPLES
REVIEW AND ANALYZE DATA
PROVIDE VIROLOGIC DATA FOR INFLUENZA SURVEILLANCE REPORT
EDUCATE/CONTACT SUBMITTERS
SUBMIT DATA/INFORMATION TO SUBMITTERS, STATE EPIDEMIOLOGISTS,
AND CDC
TEST SAMPLES
Percent of Respondents
0 10 20 30 40 50 60 70 80 90 100
4
7
8
9
16
17
18
21
Figure 10. LPHL Influenza Surveillance Responsibilities. n=22
*“Other” includes submitting specimens to a state/central laboratory.

_________________________________________ Data Summary of the Influenza Virologic Surveillance Landscape 27
PART II: LPHLS
ACADEMIC RESEARCH LABORATORIES
COMMERCIAL INTERSTATE LABORATORIES
UNIVERSITY STUDENT HEALTH CENTERS
CITY/COUNTY PUBLIC HEALTH LABORATORIES
RIDT SITES
SENTINEL PROVIDERS ENROLLED BY STATE INFLUENZA COORDINATOR
OTHER*
SENTINEL PROVIDERS ENROLLED BY LABORATORY
LONG TERM CARE FACILITIES
PUBLIC HEALTH DEPARTMENTS/PUBLIC HEALTH CLINICS
MEDICAL EXAMINERS
CLINICAL LABORATORIES
Percent of Respondents
0 10 20 30 40 50 60 70 80 90 100
0
0
1
2
4
4
5
6
6
8
10
20
Figure 11. Actual Specimen Submitters as Identified by LPHLs. n=22
*“Other” includes physician offices, congregate living facilities, and providers enrolled by local epidemiologists and/or laboratories.
__________________________28 Association of Public Health Laboratories
PART II: LPHLS
LPHLs and Local Influenza Program Outreach Activities
This survey captured information on the incentives and fiscal support offered to influenza surveil-lance providers and/or submitters. The majority of LPHLs offer some type of incentive, with most responding LPHLs offering free testing (77%; 17 LPHLs) and free transport kits (64%; 14 LPHLs), and half (11 LPHLs) offering free shipping/courier services.
Twelve (54%) responding LPHLs provide collection supplies to defray the specimen collection costs to the sample providers, and four (18%) LPHLs provided collection supplies in coordination with their influenza programs. Sixteen (73%) responding LPHLs offered some type of fiscal sup-port to defray transport costs. The most commonly cited service provided to offset these costs was a courier system operated by the LPHL (32%; 7 LPHLs). No responding LPHLs offered a pay-ment or reimbursement to their providers.
Seventy-seven percent of responding LPHLs (17 LPHLs) considered educating and contacting submitters to be part of their laboratory’s responsibilities. All responding LPHLs provided some type of training to enrolled providers/submitters for influenza surveillance, and all but 1 laborato-ry (95%; 21 LPHLs) provided written instructions. Additionally, 40% of LPHLs provided training on sample collection and/or submission via telephone, and 27% emailed instructions to providers. About half of responding LPHLs serve as a resource and/or provide technical guidance related to influenza testing (55%; 12 LPHLs) and perform additional reference/specialized testing (29%; 13 LPHLs) as part of their outreach activities. Performing initial subtyping of influenza positives (45%; 10 LPHLs) was another frequently cited outreach practice.
LPHL Specimen Submission to National Influenza Surveillance System
Submitting specimens to the national influenza surveillance system is not a responsibility of most LPHLs. Several LPHLs clarified that they submit specimens to their state/central labora-tory. These local specimens, or at least a subset, may be incorporated into national surveillance. Forty-five percent of responding LPHLs (10 LPHLs) submitted specimens with unusual findings to CDC.
Data Dissemination and Test Result Reporting
When reporting influenza test results to specimen submitters, 54% of LPHL respondents (12 LPHLs) use reports generated from their LIMS systems. More than half of LPHLs (55%) report influenza test results to influenza coordinators and/or epidemiologists using manually generated reports, with 83% of those LPHLs (10 LPHLs) generating the reports from a LIMS system. During the 2010-2011 influenza season, 68% of responding LPHLs (15 LPHLs) reported to an influenza coordinator and/or epidemiologists on a weekly basis. In contrast to SPHLs, only 22% of LPHLs (5 LPHLs) reported in real-time via their LIMS system. Reiterating the different roles of SPHLs and LPHLs in reporting to national surveillance, at least half of responding LPHLs submit surveillance data to their state rather than CDC, and only 1 LPHL respondent reported via PHLIP to CDC.
_________________________________________ Data Summary of the Influenza Virologic Surveillance Landscape 29
PART II: LPHLS
Staffing3 and Funding Landscape of LPHLs
Several survey questions focused on the staffing and funding landscape at PHLs. LPHLs reported a range of 0.1 to 9 full-time positions to support influenza testing. In contrast to SPHLs, no responding LPHLs reported receiving ELC funds. CDC PHEP and “other” funding sources, such as PHER and city/county funds, accounted for the majority of LPHLs’ total dollars expended for influenza testing during the 2010-2011 influenza season. While the funding structure is different and remains somewhat unclear at the local level, only five (23%) LPHLs reported that the amount of available funding inhibited their influenza laboratory surveillance and testing activities.
_________________3 Funding and influenza testing costs are being examined in more detail and will be reported as a separate deliverable to the Right Size Influenza Virologic Surveillance Project.

__________________________30 Association of Public Health Laboratories
PART II: LPHLS
SECTION III: INFLUENZA TEST METHODS AND PRACTICES AT LPHLS
The most commonly used influenza testing methods performed by LPHLs are the CDC rRT-PCR assay and virus culture. During the 2010-2011 season, 19 of 22 responding LPHLs (86%) performed the CDC influenza rRT-PCR assay, and 9 (41%) performed viral culture/isolation for influenza at least once per week. Other influenza testing regularly performed at LPHLs is limited to other molecular assays (23%; 5 LPHLs), RIDTs (9%; 2 LPHLs), and direct specimen immunoflu-orescence (5%; 1 LPHL). In contrast to SPHLs, sequencing and antiviral resistance/susceptibility testing are not performed at the local level (see Figure 12), according to survey results.
Influenza PCR
When asked to rate a variety of factors, other than funding, that limit influenza PCR testing capac-ity in both routine and pandemic/surge situations, LPHLs overwhelmingly indicated that having insufficient staff to reassign to other tests/tasks was the most significant factor limiting routine influenza PCR capacity. During a pandemic or surge response, LPHLs, like SPHLs, cited a lack of trained personnel and insufficient staff to allow for staff reassignment as the most significant inhibiting factors (see Figure 13).
Influenza Virus Culture/Isolation
Since fewer than half of responding LPHLs perform viral culture/isolation, this section will de-scribe the practices of those nine LPHLs that do perform virus culture and the factors that inhibit the use of this testing method.
All of the 9 responding LPHLs that perform virus culture routinely do so for the purpose of detecting other respiratory viruses. Additionally, they cited virus detection/clinical diagnosis (67%; 6 LPHLs), support for rRT-PCR or other testing (56%; 5 LPHLs), isolate submission to CDC (56%; 5 LPHLs), and ILI surveillance (33%; 3 LPHLs) as reasons for performing virus isolation. During the 2010-2011 season, these 9 LPHLs cultured a median of 50 total specimens for influ-enza viruses with a range from 20 to 460 specimens.
LPHLs that self-identified as performing little or no virus culture indicated that the cost to main-tain cell culture capability (41%; 9 LPHLs) and a policy decision to use rRT-PCR for routine influenza testing (32%; 7 LPHLs) were the reasons. It is important to note that several LPHLs indicated that the overarching reason that they do not perform virus culture is that virus culture testing is a function of their SPHL rather than a local function. As with PCR testing, all responding LPHLs were asked to rank factors that limit routine influenza culture testing capacity. Most LPHLs cited insufficient staff to allow for staff reassignment to other tests/tasks as the most significant factor limiting their influenza virus culture capacity (see Figure 13).

_________________________________________ Data Summary of the Influenza Virologic Surveillance Landscape 31
PART II: LPHLS
SEQUENCING FOR GENOTYPING
ANTIVIRAL RESISTANCE/SUSCEPTIBILITY
DIRECT SPECIMEN IMMUNOFLUORESCENCE
RIDTS
OTHER MOLECULAR ASSAY
VIRAL CULTURE/nISOLATION
rRT−PCR (CDC ID/SUBTYPING ASSAY)
Percent of Respondents
0 10 20 30 40 50 60 70 80 90 100
0
0
1
2
5
9
19
Figure 12. Influenza Test Methods Routinely Performed by LPHLs. n=22
__________________________32 Association of Public Health Laboratories
PART II: LPHLS
Use of WHO Influenza Reagent Kit for Identification of Influenza Isolates
The nine responding LPHLs that perform virus culture were also asked which methods they use to identify and characterize cultured influenza viruses. The most commonly used methods were the CDC rRT-PCR assay (78%; 7 LPHLs) and immunofluorescence using commercially available monoclonal antibodies (MAbs) (67%; 6 LPHLs). Only 2 (22%) of these LPHLs indicated that they perform immunofluorescence using MAbs in WHO kits provided by CDC for identifying cultured viruses.
Furthermore, only 4 of 22 responding LPHLs (18%) indicated that they use the WHO kit reagents for any purpose, and 18 (82%) either do not use the WHO kit for any purpose or no longer receive these kits. Only one responding LPHL uses the WHO kit HI reagents for typing/subtyping and influenza B lineage typing.

_________________________________________ Data Summary of the Influenza Virologic Surveillance Landscape 33
PART II: LPHLS
AVAILABILITY OF CELL CULTURE**
AVAILABILITY OF EXPERTISE**
PCR INSTRUMENTS*
REAGENTS/SUPPLIES ON SITE
INSTRUMENTATION
RESULT REPORTING
SPECIMEN RECEIPT/ACCESSIONING
ADEQUATE LABORATORY SPACE
ELECTRONIC DATA MANAGEMENT CAPABILITY
TRAINED PERSONNEL
INSUFFICIENT STAFF TO ALLOW FOR REASSSIGNMENT TO OTHER
TESTS/TASKS
MEAN RESPONSE
ROUTINE INFLUENZA PCRPANDEMIC/SURGE INFLUENZA PCRROUTINE INFLUENZA CULTURE
0 0.5 1 1.5 2 2.5 3 3.5 4 4.5 5
VERY SIGNIFICANTNOT SIGNIFICANT
Figure 13. Significance of Factors, other than Funding, that Limit LPHL Influenza Testing Capacity. n=22
* Factors only listed for routine and pandemic/surge influenza PCR. **Factors only listed for routine influenza culture.

__________________________34 Association of Public Health Laboratories
DISCUSSION
PART III: DISCUSSION
The data from the survey highlight the extensive role that PHLs, both state and local, play in influenza virologic testing and national influenza surveillance. Although this survey and the Right Size Influenza Virologic Surveillance Project are focused on surveillance and testing for influenza viruses, the survey data remind us that many public health laboratories also play an important role in diagnostic testing, as demonstrated by the number of SPHLs that accept specimens for diagnostic purposes. This is further supported by the percentage of SPHLs that perform testing for other (non-influenza) respiratory viruses for diagnostic and surveillance purposes compared to the much smaller percentage of SPHLs that only perform testing for surveillance purposes.
The survey data also document additional roles that PHLs fulfill beyond test performance. For example, the survey results provide insight into the role PHLs play in providing data and reports based on their testing, as well as enrolling, communicating, and educating specimen submitters and providers. Additionally, the vast majority of both SPHLs and LPHLs also provide technical guidance or act as technical resources in their jurisdictions. The survey data document these outreach activities and the relationships between PHLs and their jurisdictions. The relation-ship between PHLs and clinical and commercial laboratories and healthcare providers is likely to become increasingly important as influenza virologic surveillance evolves. The survey data docu-ment outreach activities and relationships developed by some PHLs and may inform the develop-ment of guidance in best practices for PHLs that do not have well-established relationships with partners.
Based on the variety of incentives provided to submitters by PHLs, states may want to consider sharing their ideas for submitter incentives and/or developing a best practices guide to assist other laboratories.
It is encouraging to document that collaboration occurs between PHLs and epidemiologists/influenza coordinators, with the vast majority co-formulating the policy for specimen submission, both for routine and emergency situations. It is similarly encouraging to note that communication between the PHL and epidemiologists and/or the influenza coordinator occurs at least weekly for nearly one-third of states, and occurs “as needed” in more than half.
The survey data also demonstrate that specimen submission policies are not static documents that are created and shelved; rather, these policies are living documents with 80% of SPHLs stating they review their specimen submission policies at least annually or as needed.
As was expected, the survey data confirm that rRT-PCR has become the most commonly used routine influenza testing method. The percentage of SPHLs that perform virus culture may de-cline further in response to the fiscal challenges currently facing PHLs. The minimal use of the WHO kit reagents reported in the survey coincides with the declining use of virus culture and the increased use of PCR testing methods for influenza surveillance. Although one of the rea-sons that SPHLs retain the WHO kit reagents is for potential use for “problem virus situations”, it seems unlikely that SPHL use of these reagents would provide a more appropriate response than accessing CDC’s expertise and capabilities. The survey data, combined with an understanding of the changes in influenza virologic surveillance, bring into question whether there remains a need to provide the WHO reagent kits to US PHLs.

_________________________________________ Data Summary of the Influenza Virologic Surveillance Landscape 35
DISCUSSION
Finally, the survey data clearly demonstrate concerns about funding. This may be the time to de-fine who bears the responsibility for funding influenza surveillance programs, whether it be state, federal, other funding, or a combination of the three. The survey data indicated that accurately capturing funding and expenditure information can be difficult; however, the capability to identify all the costs and needs of a program is a possibility and may become even more important in light of the current fiscal challenges.
Despite fiscal challenges, PHLs have been able to maintain an extensive menu of influenza test and surveillance-related activities. However, the survey data highlights the urgency and need for the Right Size Virologic Surveillance Project to address the future landscape of influenza virus isolation and testing at PHLs in order to have a sustainable, efficient, and data-driven surveil-lance system.

__________________________36 Association of Public Health Laboratories
8515 Georgia Avenue, Suite 700Silver Spring, MD 20910Phone: 240.485.2745Fax: 240.485.2700Web: www.aphl.org