influenza virologic surveillance right size … virologic surveillance right size roadmap. right...
TRANSCRIPT
Influenza Virologic SurveillanceRight Size Roadmap
1ST EDITION
JULY 2013

The Association of Public Health Laboratories (APHL) is a national non-profit organization dedicated to working with members to strengthen governmental laboratories that perform testing of public health significance. By promoting effective programs and public policy, APHL strives to provide member laboratories with the resources and infrastructure needed to protect the health of US residents and to prevent and control disease globally.
© Copyright 2012, Association of Public Health Laboratories. All Rights Reserved.
This report was fully funded by Cooperative Agreement # U60HM000803 from CDC and/or Assistant Secretary for
Preparedness and Response. Its contents are solely the responsibility of the authors and do not necessarily represent the
official views of CDC and/or Assistant Secretary for Preparedness and Response or APHL.
V2
INFLUENZA VIROLOGIC SURVEILLANCE RIGHT SIZE ROADMAP
Right Size Influenza Virologic Surveillance Roadmap i
FORWARD
Surveillance for influenza viruses was formally established through the World Health Organization (WHO) in the 1940s. At that time, only a few laboratories were capable of characterizing the virus, and relatively few viruses were available to inform vaccine virologic selection and influenza surveillance. Since that time, in the United States, the influenza virologic surveillance network has continued to grow, now comprised of approximately 85 public health laboratories performing assays from the Centers for Disease Control and Prevention (CDC) for influenza subtyping, and an additional 60 laboratories submitting data on influenza testing performed at participating hospitals. Influenza virologic surveillance is essential for the prevention and control of influenza illness. Comprehensive and timely information on influenza virus characteristics is critical for determining when the season starts and which viruses are circulating, for identifying and preparing viruses for use in influenza vaccines, and for detecting novel influenza viruses with potential for pandemic spread.
The importance of a robust system for virologic surveillance was clearly evident in the US following the recognition of the first two cases of the novel influenza A 2009 H1N1 virus infections in California. State and local public health laboratories (PHLs) were able to immediately identify cases of the novel infection as “unsubtypable” influenza A viruses. Within two weeks of the first cases, PHLs were provided 2009 H1N1-specific reagents to allow them to confirm the growing number of infections. The virologic surveillance system was critical for monitoring when and where the pandemic was emerging, and for monitoring the virus for any changes it might have in virulence or antiviral drug resistance. The first selected influenza vaccine virus, A/California/7/2009, was collected early in the pandemic through surveillance, and will continue to be used in vaccines for the 2013-14 season.
Many of these virologic surveillance capabilities were made possible through new supplemental funds provided since 2006 to CDC for pandemic preparedness and response. These resources allowed for expanded collection of specimens, introduction of new testing and reporting technologies, and considerable improvements in surveillance coverage and timeliness. Many of these surveillance enhancements were put in place in the year prior to the recognition of 2009 H1N1.
Around the same time that the US response to the 2009 H1N1 was demonstrating the benefit of the new investments, the reality of the global economic downturn began having significant impact on state and local governments. Since that time, state and federal resources for public health have been declining, leading to programmatic cuts in services and staff, and requiring prioritization and improved efficiency of activities.
We are in a challenging time. We have available to us new tools for accurate and rapid molecular diagnosis of influenza, new opportunities for electronic communication of laboratory results, and expectations to maintain or enhance existing virologic surveillance in the US to detect first cases of emerging novel influenza infection, such as variant H3N2, H5N1, or the new avian influenza H7N9 that emerged in China in April 2013. At the same time, the resources to implement new, or maintain existing, surveillance activities at the local, state, and federal levels are uncertain. Within this context, many are asking questions such as, “How much virologic surveillance is needed?” or, “What is the most efficient way to achieve needed surveillance objectives?”
FOR
WA
RD
ii Association of Public Health Laboratories
FORWARD
Recognizing this challenge, CDC and the Association of Public Health Laboratories (APHL) in 2010 began an activity, later referred to as “Rightsizing Influenza Virologic Surveillance,” to better understand the complex and varying components of the national virologic surveillance system, to identify priority activities and different approaches for improving efficiency, and to consolidate and document the findings for health departments and CDC to use.
The project began small, but soon grew in scope following early efforts which illuminated the complexities of the current system, differences in jurisdictional approaches, and challenges to data integration. To better characterize the existing landscape and to test assumptions and potential recommendations, various stakeholders were engaged, including: epidemiologists, laboratorians, and influenza coordinators at local and state public health departments and at CDC; members and staff from the Council of State and Territorial Epidemiologists (CSTE) and APHL; clinician and commercial laboratory associations; academic statisticians; and consultants in efficiency improvement. Further testing and refinement were achieved through a table-top exercise with 29 stakeholders, and through four public health departments conducting pilot activities.
As a part of this process, the first edition of the “Right Size Roadmap” is here released. The document provides a set of functional requirements that can be used to design and build an optimal virologic surveillance system, improve existing systems approaches, focus resources and efficiencies, inform policymakers, and justify state and local funding requests. It attempts to use statistical tools to determine the desired or acceptable level of surveillance and recommends efficiency approaches which may be more common to business than traditional public health surveillance.
This is the first release; however, it is, by no means, a completed work. Influenza viruses are constantly changing, and efforts to monitor and characterize the virus similarly need to be flexible and adaptive to changes in health care, laboratory technology, and financial and staff resources. Equally, this first release also is intended to change, and as such, continued input and feedback are invited to improve these recommendations for achieving a right size for influenza virologic surveillance.
Nancy J. Cox, PhD Director, Influenza Division Centers for Disease Control and Prevention
FOR
WA
RD
INFLUENZA VIROLOGIC SURVEILLANCE RIGHT SIZE ROADMAP
Right Size Influenza Virologic Surveillance Roadmap iii
STA
KE
HO
LDE
RS
AN
D
AC
KN
OW
LED
GM
EN
TS
STAKEHOLDERS AND ACKNOWLEDGMENTS
Right Size Work GroupThe following work group led the development of the project charter, the Influenza Virologic Surveillance Right Size Roadmap, the stakeholder meetings and other project deliverables as well as provided subject matter expertise.
•Daniel Jernigan, MD, Deputy Director, Influenza Division, NCIRD, CDC
•Rosemary Humes, MS, MT (ASCP) SM, Diagnostics Science Advisor, Biomedical Advanced Research and Development Authority, HHS (formerly Senior Advisor, Scientific Affairs, APHL)
•Peter Shult, PhD, Director, Communicable Disease Division and Emergency Laboratory Response, Wisconsin State Laboratory of Hygiene and APHL Influenza Subcommittee Chair
•Lynnette Brammer, MPH, Epidemiologist, Epidemiology Branch, Influenza Division, NCIRD, CDC
•Tricia Aden, MT (ASCP), Manager, Influenza Program, APHL
•Stephanie Chester, MS, Senior Specialist, Influenza Program, APHL
•Joseph Miller, PhD, Laboratory Preparedness Officer, Influenza Division, NCIRD, CDC
•Julie Villanueva, PhD, Acting Branch Chief, Virus Surveillance and Diagnosis Branch, Influenza Division, NCIRD, CDC
Advisory Group The following stakeholders provided expert guidance, participated in stakeholder meetings and dedicated efforts to developing and reviewing this comprehensive document.
•Nancy Cox, PhD, Influenza Division Director, NCIRD, CDC
•Joseph Bresee, MD, Epidemiology Branch Chief, Influenza Division, NCIRD, CDC
•Matthew Cartter, MD, MPH, State Epidemiologist, Connecticut Department of Public Health and CSTE Influenza Subcommittee Co-Chair
•Linda Cohen, MPH, Manager, Informatics Program, APHL
•Lyn Finelli, DrPH, Epidemiologist, Influenza Division, NCIRD, CDC
•Paul Garguillo, PhD, Epidemiologist (Statistician), Epidemiology Branch, Influenza Division, NCIRD, CDC
•Jane Getchell, DrPH, Senior Director, Public Health Programs, APHL
•Larisa Gubareva, MD, Molecular Epidemiology Team Lead, Virus Surveillance and Diagnosis Branch, Influenza Division, NCIRD, CDC
•Tom Haupt, MS, Influenza Surveillance Coordinator/Research Scientist, Wisconsin State Department of Health (CSTE Representative)
•Carol Kirk, Consultant, APHL (formerly at the Wisconsin State Laboratory of Hygiene)
iv Association of Public Health Laboratories
•Alexander “Sasha” Klimov, PhD, ScD, Branch Chief, Virus Surveillance and Diagnosis Branch, Influenza Division, NCIRD, CDC
•Brandon Troy Leader, PhD, Scientific Program Officer, Diagnostics Group, PATH (formerly Microbiology Supervisor, Washington Public Health Laboratories) (APHL Representative)
•Stephen Lindstrom, PhD, Diagnostic Development Team Lead, Virus Surveillance and Diagnosis Branch, Influenza Division, NCIRD, CDC
•Carol Loring, MS, Virology/STD Laboratory Supervisor, New Hampshire Public Health Laboratory (APHL Representative)
•Alison Mawle, PhD, Associate Director, Office of Laboratory Science, NCIRD, CDC
•Lisa McHugh, MPH, Influenza Surveillance Coordinator, New Jersey Department of Health – Communicable Disease Service Infectious & Zoonotic Disease Service (CSTE Representative)
•Sarah Muir-Paulik, MPH, Senior Specialist, Influenza Program, APHL
•Desiree Mustaquim, MPH, Surveillance Epidemiologist, Influenza Division, NCIRD, CDC (Contractor)
•Elizabeth Neuhaus, PhD, Associate Director for Informatics, Influenza Division, NCIRD, CDC
•Michael Pentella, PhD, Director, William A. Hinton State Laboratory Institute, Massachusetts Department of Public Health (APHL Representative)
•Michael Shaw, PhD, Associate Director for Laboratory Science, Influenza Division, NCIRD, CDC
•Sandra Smole, PhD, Director, Division of Molecular Diagnostics and Virology, William A. Hinton State Laboratory Institute, Massachusetts Department of Public Health (APHL Representative)
•Kirsten St. George, PhD, MAppSc, Chief, Laboratory of Viral Diseases, Wadsworth Center, New York State Department of Health (APHL Representative)
•Kelly Wroblewski, MPH, MT (ASCP), Director, Infectious Disease Programs, APHL
•Xiyan Xu, MD, Virus Reference Team Lead, Virus Surveillance and Diagnosis Branch, Influenza Division, NCIRD, CDC
CDC and APHL would like to thank all of the Right Size Tabletop Exercise and Pilot Project participants. The feedback garnered from these activities was instrumental in developing the Roadmap and providing best practices for the implementation guidance. Additionally, we thank the APHL Infectious Diseases Committee and our CSTE partners at national headquarters. We appreciate the support and expertise provided to develop the calculators by University of Texas at Austin.
STAKEHOLDERS AND
ACKNOWLEDGMENTS
STA
KE
HO
LDE
RS
AN
D
AC
KN
OW
LED
GM
EN
TS
INFLUENZA VIROLOGIC SURVEILLANCE RIGHT SIZE ROADMAP
Right Size Influenza Virologic Surveillance Roadmap 5
Table of Contents
Forward . . . . . . . . . . . . . . . . . . . . . . . . . . . . . . . . . . . . . . . . . . . . . . . . . . . . . . . . . . . . . . .i
Stakeholders and Acknowledgments . . . . . . . . . . . . . . . . . . . . . . . . . . . . . . . . . . . . . . iii
Introduction . . . . . . . . . . . . . . . . . . . . . . . . . . . . . . . . . . . . . . . . . . . . . . . . . . . . . . . . . . 6
Virologic Surveillance Requirements . . . . . . . . . . . . . . . . . . . . . . . . . . . . . . . . .10
How to Use the Roadmap . . . . . . . . . . . . . . . . . . . . . . . . . . . . . . . . . . . . . . . . . . .14
Objectives: Thresholds and Representativeness . . . . . . . . . . . . . . . . . . . . . . . . . . . . 17
Requirements Intent . . . . . . . . . . . . . . . . . . . . . . . . . . . . . . . . . . . . . . . . . . . . . . . . . .22
Sampling . . . . . . . . . . . . . . . . . . . . . . . . . . . . . . . . . . . . . . . . . . . . . . . . . . . . . . . .22
Laboratory Testing . . . . . . . . . . . . . . . . . . . . . . . . . . . . . . . . . . . . . . . . . . . . . . . .27
Data Management . . . . . . . . . . . . . . . . . . . . . . . . . . . . . . . . . . . . . . . . . . . . . . . .30
Partnerships & Communication . . . . . . . . . . . . . . . . . . . . . . . . . . . . . . . . . . . . . .34
Quality Management Systems . . . . . . . . . . . . . . . . . . . . . . . . . . . . . . . . . . . . . . .37
Surge Capacity . . . . . . . . . . . . . . . . . . . . . . . . . . . . . . . . . . . . . . . . . . . . . . . . . . .38
Financial Resources . . . . . . . . . . . . . . . . . . . . . . . . . . . . . . . . . . . . . . . . . . . . . . . 41
Implementation Guidance . . . . . . . . . . . . . . . . . . . . . . . . . . . . . . . . . . . . . . . . . . . . . .45
Sampling . . . . . . . . . . . . . . . . . . . . . . . . . . . . . . . . . . . . . . . . . . . . . . . . . . . . . . . .46
Laboratory Testing . . . . . . . . . . . . . . . . . . . . . . . . . . . . . . . . . . . . . . . . . . . . . . . .67
Data Management . . . . . . . . . . . . . . . . . . . . . . . . . . . . . . . . . . . . . . . . . . . . . . . .77
Partnerships & Communication . . . . . . . . . . . . . . . . . . . . . . . . . . . . . . . . . . . . . .81
Quality Management Systems . . . . . . . . . . . . . . . . . . . . . . . . . . . . . . . . . . . . . . .86
Surge Capacity . . . . . . . . . . . . . . . . . . . . . . . . . . . . . . . . . . . . . . . . . . . . . . . . . . .89
Financial Resources . . . . . . . . . . . . . . . . . . . . . . . . . . . . . . . . . . . . . . . . . . . . . . .92
Appendices . . . . . . . . . . . . . . . . . . . . . . . . . . . . . . . . . . . . . . . . . . . . . . . . . . . . . . . . . .97
Appendix A: Surveillance Sampling Process Map . . . . . . . . . . . . . . . . . . . . . . . .98
Appendix B: Pre-Calculated Sample Size Tables . . . . . . . . . . . . . . . . . . . . . . . .100
Appendix C: Laboratory Methods . . . . . . . . . . . . . . . . . . . . . . . . . . . . . . . . . . . .104
Appendix D: Funding Fact Sheet Template . . . . . . . . . . . . . . . . . . . . . . . . . . . .106
Appendix E: Glossary of Terms and Acronyms . . . . . . . . . . . . . . . . . . . . . . . . .110
Appendix F: Additional Resources . . . . . . . . . . . . . . . . . . . . . . . . . . . . . . . . . . .113
References . . . . . . . . . . . . . . . . . . . . . . . . . . . . . . . . . . . . . . . . . . . . . . . . . . . . . . . . .115
TAB
LE O
F CO
NTE
NT
S
INFLUENZA VIROLOGIC SURVEILLANCE RIGHT SIZE ROADMAP
6 Association of Public Health Laboratories
INTRODUCTION
How much influenza surveillance is really needed? Do we need more or less laboratory testing? How do we know the surveillance data we have provides an accurate picture of what is really happening? These are frequent questions of public health decision makers in times of fiscal constraints, which escalate when the threat of novel viruses with pandemic potential seems imminent. The 2009 H1N1 events heightened awareness of these issues, demonstrating the need for a more strategic and evidence-based approach to virologic surveillance. The Department of Health and Human Services 2009 H1N1 Influenza Improvement Plan identified updated systems to ensure cost-effective virologic surveillance and implementation of standard reference methods for public health laboratory testing as key priorities.1
Public health laboratories (PHLs) and the Centers for Disease Control and Prevention (CDC) serve as the backbone of state and national virologic surveillance programs. The amount of virologic surveillance testing performed both at CDC and in PHLs has largely been determined by the capacity of the laboratory.
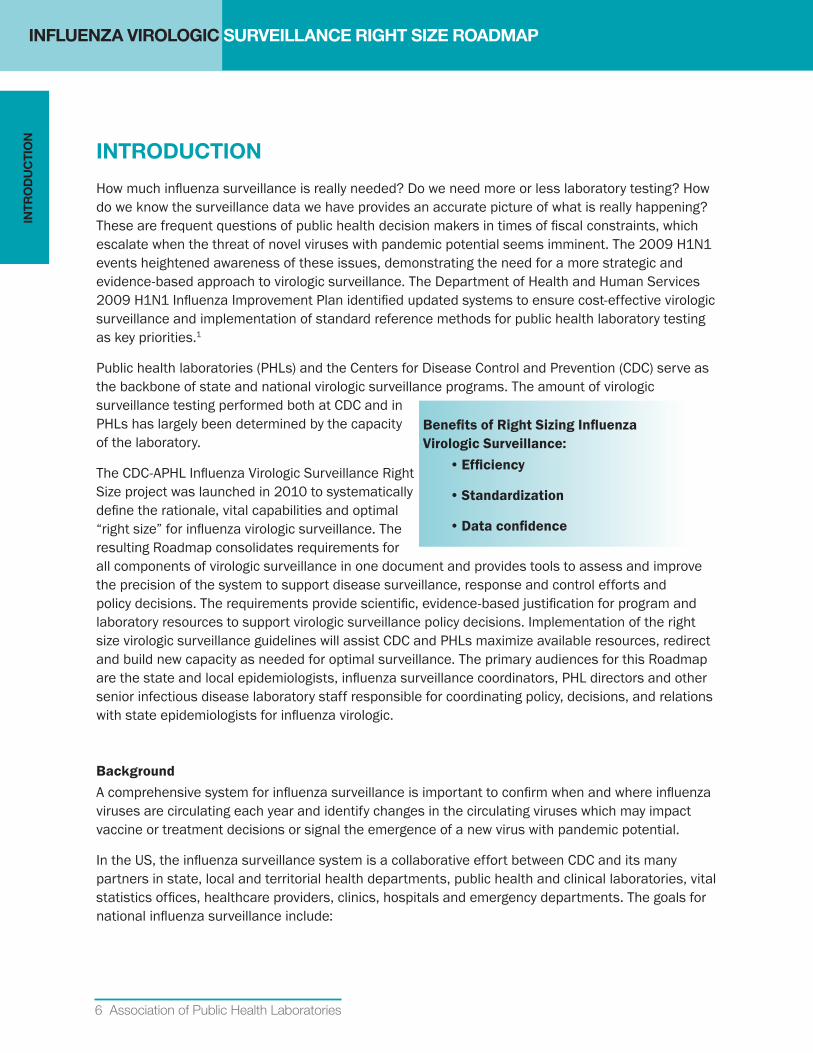
The CDC-APHL Influenza Virologic Surveillance Right Size project was launched in 2010 to systematically define the rationale, vital capabilities and optimal “right size” for influenza virologic surveillance. The resulting Roadmap consolidates requirements for all components of virologic surveillance in one document and provides tools to assess and improve the precision of the system to support disease surveillance, response and control efforts and policy decisions. The requirements provide scientific, evidence-based justification for program and laboratory resources to support virologic surveillance policy decisions. Implementation of the right size virologic surveillance guidelines will assist CDC and PHLs maximize available resources, redirect and build new capacity as needed for optimal surveillance. The primary audiences for this Roadmap are the state and local epidemiologists, influenza surveillance coordinators, PHL directors and other senior infectious disease laboratory staff responsible for coordinating policy, decisions, and relations with state epidemiologists for influenza virologic.
BackgroundA comprehensive system for influenza surveillance is important to confirm when and where influenza viruses are circulating each year and identify changes in the circulating viruses which may impact vaccine or treatment decisions or signal the emergence of a new virus with pandemic potential.
In the US, the influenza surveillance system is a collaborative effort between CDC and its many partners in state, local and territorial health departments, public health and clinical laboratories, vital statistics offices, healthcare providers, clinics, hospitals and emergency departments. The goals for national influenza surveillance include:
BenefitsofRightSizingInfluenza Virologic Surveillance:
• Efficiency
• Standardization
• Dataconfidence
INTR
OD
UC
TIO
N
Right Size Influenza Virologic Surveillance Roadmap 7
• Detect the onset, duration and spread of influenza activity in a geographic area.
• Measure and describe the severity of influenza during a season.
• Determine the populations affected and identify special risk groups.
• Monitor the prevalence of circulating virus types and subtypes and match to annual vaccine strains.
• Monitor genetic and phenotypic changes to circulating influenza viruses and evaluate their potential risk to public health and the need for changes to the annual vaccine composition.
• Identify and monitor novel subtypes that might signal a pandemic.
• Provide data to guide interventions in clinical and public health control measures.
• Provide information to key partners including: clinical decision makers, policy makers, emergency response officials, the media and the public.
Virologic surveillance is a key and complex component of the influenza surveillance system, informed by a variety of independent but related elements. Specific objectives of virologic surveillance include: seasonal influenza situational awareness and determination of virus strain prevalence, early detection of novel viruses or novel events, annual vaccine strain selection and antiviral resistance monitoring. The 2011 Right Size Influenza Virologic Surveillance Landscape survey provides the most recent and comprehensive summary of influenza testing and surveillance practices employed at both state and local public health entities.2
“This is a lot of information that comes from a lot of different people — physicians, people at state health departments and state labs and in hospitals and vital statistics offices,” Brammer said. “Sometimes you step back and look at it and think it’s pretty amazing that this system keeps running week after week, and it always does.”--Lynnette Brammer Epidemiologist, Influenza Division, CDC
Source: The Washington Post, March 11, 201330
All state, and many local PHLs are participants in the US World Health Organization (WHO)InfluenzaCollaboratingLaboratoriesNetwork.InfluenzavirologicsurveillanceisanessentialfunctionofallstatehealthdepartmentsandrequiresapartnershipbetweenthePHL,epidemiologistsincludingtheinfluenzasurveillancecoordinators,andthehealthcarecommunity.
INTRODUCTIONIN
TRO
DU
CTIO
N
InfluenzaSurveillance
8 Association of Public Health Laboratories
At a minimum, virologic surveillance includes the ability to:
• Access a representative sample of clinical specimens from outpatient Influenza-like Illness Surveillance Network (ILINet) providers, other clinical primary care sources and clinical laboratories.
• Detect, type and subtype influenza viruses from clinical specimens in a timely manner using standard laboratory methods.
• Report results to providers, epidemiologists and CDC using standard electronic data systems.
• Rapidly refer unsubtypablei influenza viruses to CDC to identify or rule out novel viruses.
• Routinely refer a subset of specimens and viruses to CDC or a CDC-designated laboratory for genetic and antigenic characterization and antiviral testing.
• Maintain the expertise, warm base (a minimum level of readiness or capacity) and surge capabilities necessary for pandemic response.3
This document is a “road map” to achieving an effective virologic surveillance system; it describes the system requirements and provides options and tools, including sample size calculators, for decision-making processes and system implementation.
Inthiscontext,arequirementisanessentialcomponentofvirologicsurveillancethatis needed toproducereliableresultstoachievestateandnationalsurveillancegoals.Thesearefunctionalrequirements that can be used to design and build an optimal virologic surveillance system, measureandimproveexistingsystemsapproaches,focusresourcesandefficiencies,informpolicymakers,andjustifynational,stateandlocalfundingneeds. These requirements should be interpreted as desired practices and not as criteria for receipt of federal funds. Each state will need to determine how to achieve these goals to meet both national and state needs, including considering options for shared services.
i Any influenza positive specimen that cannot be definitively typed and subtyped as a circulating seasonal influenza virus, influenza positive specimens producing non-standard or inconclusive results as defined in the CDC Human Influenza Virus Real-Time RT-PCR Diagnostic Panel Instructions for Use package insert.
INTRODUCTIONIN
TRO
DU
CTI
ON
Right Size Influenza Virologic Surveillance Roadmap 9
The Roadmap recommendations were developed over three years based on extensive stakeholder input obtained through meetings, teleconferences, webinars and a table-top exercise held in December 2012. Stakeholders and exercise participants have identified numerous benefits to implementing the requirements. The right size approach:
• Standardizes virologic surveillance practices;
• Aids in the development and definition of public health surveillance priorities;
• Provides requirements, resources and statistical calculators to aid in planning and justifying budget and resource requests;
• Increases understanding and support of political leaders and the public;
• Allows epidemiologists and laboratorians to more systematically establish virologic sample sizes for different surveillance objectives and scenarios based on minimum thresholds of detection and acceptable confidence levels;
• Establishes common language between the laboratorians and epidemiologists resulting in improved communication between the two groups and better understanding of each other’s needs;
• Provides information to assist decision makers in analyzing the impacts of budget cutbacks on national surveillance objectives (e.g., decreased confidence levels, reduced pandemic preparedness capacity, inability to perform testing such as virus culture).
“Moves virologic surveillance from art to science”
—Michael Pentella, PhD Director, Bureau of Laboratory Sciences Hinton State Laboratory Institute, Massachusetts
INTRODUCTIONIN
TRO
DU
CTIO
N
INFLUENZA VIROLOGIC SURVEILLANCE RIGHT SIZE ROADMAP
10 Association of Public Health Laboratories
Virologic Surveillance Requirements
The requirements listed here are the essential components needed for effective, efficient and economical influenza virologic surveillance.
A requirement is an essential component of virologic surveillance that is needed to produce reliable results to achieve state and national surveillance goals. These functional requirements can be used to design and build an optimal virologic surveillance system, improve existing systems approaches, focus resources and efficiencies, inform policymakers, and justify national, state and local funding needs.
Sampling: Provide year-round access to clinical specimens from ILINet providers and/or other primary care providers and clinical laboratories.
1. Establish a system that ensures efficient collection and timely flow of high quality specimens from the patient management tier of influenza surveillance to the CDC tier throughout the year.
2. Establish a representative network of specimen submitters using ILINet providers and/or other clinical primary care sources. Also, collect specimens from hospital/clinical laboratories to ensure that a subset of specimens represents hospitalized patients. Capture unsubtypableii influenza positives from clinical and commercial laboratories performing PCR methods that subtype currently circulating viruses.
3. Utilize a statistical, systematic approach to collect an appropriate, adequate number of specimens for testing that will provide reliable data with acceptable confidence limits to meet surveillance objectives and recommended thresholds of detection, including timely detection of rare/novel influenza events. The sampling methodology should limit sampling bias where possible.
4. Utilize sampling approaches that ensure specimens submitted throughout the entire surveillance specimen submission and testing process are representative of:
• Virus types and subtypes,
• The entire year,
• Geographic diversity of the population,
• Age of influenza-like-ilness (ILI) patients,
• Disease severity,
• Targeted populations when necessary for specific investigations.
ii Any influenza positive specimen that cannot be definitively typed and subtyped as a circulating seasonal influenza virus, influenza positive specimens producing non-standard or inconclusive results as defined in the CDC Human Influenza Virus Real-Time RT-PCR Diagnostic Panel Instructions for Use package insert.
VIR
OLO
GIC
SU
RV
EIL
LA
NC
E
RE
QU
IRE
ME
NT
S
Right Size Influenza Virologic Surveillance Roadmap 11
5. Send representative clinical specimens and/or virus isolates to CDC or a CDC-designated laboratory for national surveillance purposes, including annual vaccine virus selection, based on annual CDC criteria and guidance.
Laboratory Testing: Ensure capability to detect type, subtype and characterize influenza viruses from clinical specimens in a timely manner using reliable laboratory methods.
1. Utilize molecular detection, typing and subtyping methods (e.g., rRT-PCR) for influenza virologic surveillance.
2. Maintain instrumentation, personnel, expertise and adequate capacity to test the volume of specimens needed to achieve surveillance objectives.
3. Ensure that staff members are knowledgeable in general principles of virology, molecular biology and surveillance, as well as appropriate specimen collection, handling and transport methods.
4. Notify CDC immediately and ship unsubtypable influenza A viruses to CDC within 24 hours of detection to rule-out novel viruses.
5. Routinely refer a representative subset of specimens (and viruses) to CDC or a CDC-designated laboratory for genetic and antigenic characterization.
6. Maintain capability to rapidly adopt new molecular test methods or test modifications if a new influenza virus with pandemic potential emerges or when new technology provides improvements to virologic surveillance.
7. Maintain additional influenza testing capabilities (as defined in this document) as appropriate for the jurisdiction or utilize shared testing services models to ensure access to testing.
8. CDC: Identify, characterize, and rapidly conduct risk assessments of emerging novel influenza viruses; develop, deploy and evaluate CDC assays to assure optimum performance; utilize sequencing methods; and evaluate new technologies; and develop technical standards and guidance for virologic surveillance.
Data Management: Report results to providers, epidemiologists and CDC.
1. Use electronic data systems that provide data in real time and utilize national standards (HL7, SNOMED, LOINC).
2. All data submitted should provide:
• Specimen identifier and unique patient identifier,
• The state where specimen was collected,
• Date of birth of patient and/or age with unit (years, weeks, months, days),
• Specimen collection date,
VIR
OLO
GIC
SU
RV
EILL
AN
CE
R
EQ
UIR
EM
EN
TS
INTRODUCTION
12 Association of Public Health Laboratories
• Specimen received date,
• Test method performed,
• Test result.
3. Laboratories that have established Public Health Laboratory Interoperability Project (PHLIP) capability should also provide the following data elements, if available:
• Submitter information,
• Provider identifier for the CDC Program (i.e., ILINet provider, Emerging Infections Program (EIP), other),
• Current influenza vaccination status,
• Antiviral treatment,
• Travel information,
• Patient death information,
• Additional geographic information (e.g., county, city, zip),
• Patient location at time of testing (inpatient, outpatient, long-term care facility),
• Whether specimen was related to an outbreak,
• Whether specimen was sent to CDC and if so, include specimen identifier,
• Date of illness onset.
4. States should consider incorporating data from rapid test sites and/or clinical laboratories to supplement influenza surveillance data.
Partnerships and Communication
Establish and maintain partnerships and networks enabling communications that support routine surveillance and emergency preparedness and response, data sharing and specimen sharing. Several interrelated partnerships are needed among the public health and healthcare communities for routine surveillance including:
• CDC,
• State epidemiologist/surveillance coordinator,
• PHL,
• Clinical and commercial laboratories,
• Clinicians,
• Rapid Influenza Diagnostic Testing (RIDT) sites.
Quality Systems
Establish performance metrics, monitor performance and make improvements as needed to ensure national surveillance requirements are being met in an effective and efficient manner.
VIR
OLO
GIC
SU
RV
EIL
LA
NC
E
RE
QU
IRE
ME
NT
S
INTRODUCTION
Right Size Influenza Virologic Surveillance Roadmap 13
Surge
1. Maintain a year-round virologic surveillance system that is flexible and scalable for rapid, effective response to support diagnostic needs and case counts in rare/novel influenza event investigations, enhance surveillance for outbreak and pandemic scenarios and has criteria to determine when to scale up and ramp down.
2. Incorporate the role and resource needs of the PHL in the state pandemic plan. PHL representatives should be part of state pandemic planning processes.
3. Develop and maintain a laboratory pandemic surge plan that addresses criteria for specimen triage, algorithm changes to improve throughput, and resource needs (e.g., staff, equipment, space, reagents and supplies).
Financial Resources
1. State influenza surveillance programs and PHLs should have adequate funding to support virologic surveillance requirements.
2. State influenza surveillance programs and PHLs should coordinate planning and allocation of available funds (Epidemiology and Laboratory Capacity [ELC], Public Health Emergency Preparedness [PHEP], EIP, state) to program and laboratory elements (staff, information technology, all supplies, reagents and equipment maintenance).
3. National, state and local programs and PHLs should have effective cost accounting practices to justify resource needs and efficiently allocate available funds.
4. CDC should have adequate funding to support CDC’s national virologic surveillance activities as well as state/local surveillance activities that rely on federal funds.
5. Programs within CDC such as ELC and PHEP that provide funding to support other state and local programs should collaborate to ensure that changes in one program do not unintentionally impact other individual programs.
VIR
OLO
GIC
SU
RV
EILL
AN
CE
R
EQ
UIR
EM
EN
TS
INTRODUCTION
INFLUENZA VIROLOGIC SURVEILLANCE RIGHT SIZE ROADMAP
14 Association of Public Health Laboratories
How to Use the Roadmap
The success of the influenza virologic surveillance system in any jurisdiction requires a strong partnership and collaboration between epidemiology and the PHL, as well as active support of leadership and policy makers. The infrastructure, capabilities and surveillance system of each state differ, requiring each state to independently evaluate its current surveillance system and determine how to incorporate the right size surveillance recommendations. The Roadmap is designed to help identify "where you are, where you want to get to and how to get there" to achieve more effective and efficient virologic surveillance.
The primary audiences for this Roadmap are the state and local epidemiologists, influenza surveillance coordinators, PHL directors and other senior infectious disease laboratory staff responsible for coordinating policy, decisions, and relations with state epidemiologists for influenza virologic. The list of requirements and the descriptions of these essential elements in the Requirements Intent Section will also be useful to policymakers and leadership making resource and funding decisions. Guidance and information in this document will assist each state in identifying strengths and weaknesses in the existing virologic surveillance system, determining the optimal amount of surveillance required and identifying priority implementation activities. The Roadmap will also be a useful tool to assist in crisis management, whether the crisis is the result of detection of a novel virus, a large outbreak or a crisis of resources due to fiscal constraints. This is not intended to be an SOP (standard operating procedure) manual, but rather a guide, or “roadmap," to assist states in achieving an effective influenza virologic surveillance system.
The most important partnership for effective virologic surveillance is the relationship between the PHL and the epidemiologists/influenza surveillance coordinators. Collaboration to implement these guidelines will be more successful if there is broad understanding of each partner’s role.
HO
W T
O U
SE
TH
E R
OA
DM
AP
Right Size Influenza Virologic Surveillance Roadmap 15
HO
W TO
US
E TH
E R
OA
DM
AP
In addition to the previous Introduction and list of Requirements, this document includes three major sections:
1. Virologic Surveillance Objectives: Thresholds and Representativeness which defines the key surveillance objectives, describes specific considerations to ensure that specimens are broadly representative of the population as a whole and establishes national thresholds for detection. In this context, a threshold is defined as the level (proportion) which triggers some action.
2. Requirements Intent, which describes the essential elements for an effective national influenza virologic surveillance system and the rationale for applying these requirements at the state local and national level is explained.
3. Implementation Guidelines, which provides suggestions to assist states operationalize the requirements. The calculator tools that can be used to estimate the appropriate sample size for key surveillance objectives are described and guidelines for using the on-line calculator tools are provided. The model practices provided in this section are based on experience with the surveillance system since its inception in the late 1990s, a series of stakeholder meetings, a table-top exercise conducted in December 2012 testing the utility of the roadmap recommendations and data gathered through pilot projects conducted in four states during the 2012-2013 influenza season.
INTRODUCTION
A major outcome of the pilot studies was having epidemiology and laboratory staff come together in-person to discuss the influenza program in detail, using the roadmap document to facilitate the discussion.
16 Association of Public Health Laboratories
HO
W T
O U
SE
TH
E R
OA
DM
AP
Checklist:RecommendedStepsforUtilizingtheRoadmap
Each state will need to determine how best to implement the Roadmap recommendations. Although the requirements have been presented in categorical format, all these elements are inextricably linked. This checklist provides a series of steps that can be used collaboratively by epidemiologists/influenza coordinator and PHL leadership to assist in using the Roadmap and implementing the recommendations. Many of the recommended practices may already be in place in state or local influenza virologic surveillance systems.
□ Review the document in its entirety to become familiar with the content. Although some sections may seem more relevant to program or laboratory functions, collaboration to implement these guidelines will be more successful if there is broad understanding of each partner’s role.
• Individual sections may stand alone only when considered in context with the Introduction and the list of all Requirements. The on-line version of the Roadmap provides options to download specific sections pertinent to specific audiences (e.g., epidemiologists, PHLs, and policy makers).
□ Identify key partners who should be included in discussions on specific sections or overarching surveillance decisions.
□ Convene a meeting (preferably in-person) between program and laboratory staff to address all components of the roadmap document, including use of sample size calculators. Include external partners as needed to address relevant requirements.
□ Refer to the list of Requirements and identify existing practices that meet the roadmap requirements as well as gaps in the virologic surveillance system. Utilize the Questions for Consideration provided in relevant sections.
□ Use the sample size calculators (or the pre-calculated sample size tables in Appendix B) to assess the reliability of data (confidence levels and error rates) obtained through current sampling practices and testing volumes.
□ Determine which elements or practices will provide the most significant improvement to the existing surveillance system (i.e., the most “bang for your buck”). Draft a plan for implementing recommendations. Identify the changes that can be most easily executed. Consider a staged implementation, rather than an immediate redesign the entire system.
□ Identify available funding and resources from all sources. Prioritize capabilities; ensure flexibility and capacity to respond to seasonal variations and emergence of a novel virus.
□ Engage public health leaders and policymakers to garner support for implementation.
INTRODUCTION
INFLUENZA VIROLOGIC SURVEILLANCE RIGHT SIZE ROADMAP
Right Size Influenza Virologic Surveillance Roadmap 17
OBJECTIVES: THRESHOLDS AND REPRESENTATIVENESS
In order to promote a more statistical, systematic approach to virologic surveillance, thresholds for the following key surveillance objectives have been established. In this context, a threshold is defined as the level which triggers some action. The action may be as simple as defining a point in the influenza season or initiating an investigation following detection of a novel virus such as those defined in the CDC’s Interim Guidance on Use of Intervals, Triggers and Actions for Novel Influenza A (H1N1) Response.4 The thresholds are necessary to "right size" the virologic system – this number is used in the roadmap sample size model calculators to estimate the desired number of specimens that should be tested to ensure adequate confidence in surveillance data as well as detection of novel viruses at a point where intervention can be effective. Alternately, these calculators can be used to demonstrate the level of confidence in the data obtained with the systems that a jurisdiction is capable of implementing.
Routine surveillance includes situational awareness, rare/novel influenza event detection and antiviral resistance monitoring, and provides specimens and viruses to CDC for annual vaccine virus selection. At a minimum, the system should be sized to achieve national novel event and antiviral resistance detection thresholds and state level situational awareness needs. Efficiency can be achieved using a sampling strategy that provides sufficient specimens to address multiple surveillance objectives when possible (e.g., the same surveillance specimens can be used to address both seasonal situational awareness and rare/novel influenzaevent detection objectives). The surveillance program should also have the capability to establish targeted surveillance of specific populations if needed.
A threshold is defined as the level which triggers some action.
1. Situational Awareness for Seasonal Influenza: Virologic surveillance provides confirmation of when and where influenza viruses are circulating to inform clinical decision making and public health interventions.
a. Surveillance Objective: determine the beginning and end of the influenza season and monitor the prevalence and spread of influenza viruses throughout the year.
b. Threshold: 10% prevalence of influenza positive specimens among total ILI specimens submitted to a PHL or the total national system over a two week consecutive time period. While there is no specific threshold for action, the CDC has traditionally established the start of influenza season at a threshold of 10% positivity, calculated based on positivity of specimens submitted to the PHLs for testing by ILINet and other specimen providers and the number of screened positive influenza specimens received at PHLs. This value roughly corresponds to the CDC ILINet national seasonal baseline where the percentage of outpatient visits for ILI reaches 2.2%.
OB
JEC
TIVE
S: TH
RE
SH
OLD
S
AN
D R
EP
RE
SE
NTA
TIVE
NE
SS
18 Association of Public Health Laboratories
OBJECTIVES: THRESHOLDS AND REPRESENTATIVENESS
The 10% positivity threshold has been selected for use in the right size situational awareness sample size calculation based on this historical precedent. Calculation of the sample size is made using assumptions regarding medically attended ILI (MA-ILI) based on historical data. State and local surveillance programs may use alternate criteria for declaring the start or end of the influenza season. Additionally, jurisdictions may choose to alter the percent positive used in the sample size calculator to more accurately determine the amount of testing needed throughout the season or to assess the confidence level of the data provided. In the past, ILI specimens tested in state PHLs were largely unscreened ( i.e., not tested by the provider). Today a significant portion of specimens submitted to PHLs may be screened positive for influenza by the submitter (i.e., tested positive using a commercially available influenza test) which can greatly alter the PHL positivity rate. The increased reliance on screened positive specimens and the higher sensitivity of PCR methods used more commonly in many clinical laboratories and in all state PHLs may bias the influenza prevalence calculations, impacting the assessment of the scope or severity of the influenza season. Ideally, the percent positivity should be determined using specimens that have not been screened to the greatest extent possible. If data from clinical laboratory testing are being used for situational awareness, at a minimum ensure that the data are coming from sites that are performing high quality testing, and using sensitive methods such as rRT-PCR. Future revisions to this threshold may be needed in the context of changing testing and specimen submission practices.
c. Representativeness: specimens submitted for routine virologic surveillance to inform community, state and national situational awareness should be broadly representative of the population as a whole (age, geography, risk groups, disease severity).
2. Rare/novel influenza Event Detection: Virologic surveillance detects the emergence of reassortant, animal origin or completely novel virus subtypes in humans. The initial detection of a novel virus is always laboratory dependent and may occur anywhere in the US The sensitivity of the system to detect a novel virus at the national level relies on all states contributing specimens and data at a reasonable level proportionate with their population.
a. Surveillance Objective: Detect a novel influenza virus among influenza positive surveillance specimens tested in all states at a low enough threshold for effective intervention and control measures. This objective relates to the initial detection of a novel virus which generally occurs as part of routine surveillance. Investigation of a rare/novel influenza event after initial detection (the “deep-dive”) is a separate objective and is discussed in more detail in the Sampling Requirements Intent and Implementation Guidance sections.
b. National Threshold: Different thresholds have been established for the high season (flu positivity > 20%), and low season ( influenza positivity < 20%). These thresholds represent achievable levels of detection based on review of virologic surveillance data from several recent influenza seasons.
OB
JEC
TIV
ES
: TH
RE
SH
OLD
S
AN
D R
EP
RE
SE
NTA
TIV
EN
ES
S
Right Size Influenza Virologic Surveillance Roadmap 19
High Season: 0.14% (1/700); one novel virus among 700 influenza virus positive specimens aggregated at the national surveillance level over a defined period. A minimum threshold of 0.2% (1/500) may be used for determining the sample size in states with limited testing capacity. Application of a less sensitive threshold for detection (e.g., below 1/500) would mean that more novel viruses are circulating prior to detection and would impair disease prevention and control efforts.
Low season: 0.5% (1/200); one novel virus among 200 influenza virus positive specimens aggregated at the national surveillance level over a defined period. This approximates the prevalence at which the H1N1pdm2009 influenza virus was detected in April 2009. A minimum threshold of 0.6% (1/143) may be used for determining the sample size in states with limited testing capacity.
c. State or Local Threshold: Using the same detection thresholds for identification of novel viruses at a state level (i.e., 1/700 or 1/200 among influenza positive specimens tested in the state) would require a significantly larger sample size to achieve an adequate data confidence level. The resources and capacity are generally not adequate to test the number of specimens needed to generate statistically powerful rare/novel influenza event detection data at the state/local or even regional level.
d. Representativeness:
i. Routine Surveillance: Rare/novel influenza event detection is a component of routine virologic surveillance, specimens should be broadly representative of the population as a whole (age, geography, risk groups, disease severity).
ii. Enhanced/Targeted Surveillance: Detection of a novel virus may be enhanced with more targeted surveillance in specific populations or risk groups, based on the most current information of risk for novel virus emergence (e.g., returning travelers from high risk areas with ILI, swine or poultry exposure). Thresholds and sample sizes may vary from those proposed for routine surveillance depending on risk scenario.
3. Vaccine Virus Selection: Virologic surveillance at the state/local level provides specimens to CDC for antigenic and genetic characterization to determine whether the circulating strains match the seasonal vaccine strains in “real time” and to inform annual vaccine virus selection. Submission of specimens should remain consistent throughout the season.
a. Surveillance Objective: Monitor antigenic and genetic changes in currently circulating influenza viruses to inform vaccine virus selection.
b. Thresholds for the degree of difference between circulating viruses and vaccine strains are not defined here as these criteria are more appropriately established seasonally by the WHO vaccine virus selection experts. Due to seasonal variability in subtype prevalence and the specifc data and virus needs for annual vaccine virus selection and vaccine candidate development, CDC will provide guidance on specimen submission requirements at the beginning of the season and may adjust submission requirements
OBJECTIVES: THRESHOLDS AND REPRESENTATIVENESS
OB
JEC
TIVE
S: TH
RE
SH
OLD
S
AN
D R
EP
RE
SE
NTA
TIVE
NE
SS
20 Association of Public Health Laboratories
OB
JEC
TIV
ES
: TH
RE
SH
OLD
S
AN
D R
EP
RE
SE
NTA
TIV
EN
ES
S
throughout the season as needed. Every PHL participating in virologic surveillance are expected to submit specimens to CDC or a CDC-designated laboratory in accordance with annual guidelines.
c. Representativeness: Surveillance sampling strategies to ensure appropriate representativeness for vaccine virus selection should prioritize:
i. Timeliness – the most recent viruses.
ii. Type and subtype – viruses representing all circulating types and subtypes. Oversampling of less prevalent subtypes may be necessary to ensure an adequate number of viruses are available for antigenic and molecular characterization and vaccine candidate development.
iii. Geographic – CDC should test viruses with sufficient diversity to be representative of the US at a regional level; PHLs should ensure that specimens submitted to CDC are representative of the entire state.
iv. Disease severity –viruses representative of a range of disease severities (from outpatients to fatal cases).
v. Age – age representativeness is not an important factor for vaccine virus selection.
4. Antiviral Resistance: Virologic surveillance testing to detect antiviral resistance is performed using molecular methods for detection of resistance markers AND phenotypic resistance testing which requires viable virus. If surge antiviral resistance testing capacity is needed, genotypic testing (i.e., pyrosequencing) would be used to meet testing demand.
a. Surveillance Objective: Detect antiviral resistant virus(es) among influenza positive surveillance specimens tested across all states at a low enough threshold for effective intervention and control measures. Currently the majority of antiviral resistance surveillance testing at CDC is performed using the same viruses that are submitted for vaccine virus selection. Some PHLs perform pyrosequencing for molecular markers of antiviral resistance, states are expected to report these results to CDC for inclusion in national surveillance FluView reports. National “percent resistance” is determined using all sources of data.
b. Thresholds:
National threshold: Detect oseltamivir resistance at or below 5% (1/20) prevalence among each influenza A subtype or influenza B positive specimens tested at the national level. Calculators may also be used to assess the sample size needed at other prevalence levels.
These recommendations or thresholds may change over time depending on resistance trends or if new viruses with resistance markers emerge. A sustained increase or an unexplained jump in number of resistant viruses in the US or globally may trigger an investigation and expanded testing. Confirmed, substantial increases in resistance
OBJECTIVES: THRESHOLDS AND REPRESENTATIVENESS
Right Size Influenza Virologic Surveillance Roadmap 21
OB
JEC
TIVE
S: TH
RE
SH
OLD
S
AN
D R
EP
RE
SE
NTA
TIVE
NE
SS
may result in changes to clinical treatment guidance depending on the overall influenza prevalence, resistant virus prevalence,and geographic/temporal spread.
If there is an increase in influenza antiviral resistance outside of the US, the right size virologic surveillance thresholds may be lowered, targeted surveillance may be implemented or additional samples may be tested to increase the confidence and decrease the error in detecting a 5% prevalence of resistant viruses.
State or local thresholds: Using the same antiviral resistance detection threshold at a regional or state/local level would require a significantly larger sample size to achieve an adequate data confidence level. Although some jurisdictions may wish to report antiviral resistance surveillance data at the local/state level to help inform local provider’s clinical management decisions, the resources and capacity are generally not adequate to test the number of specimens needed to generate statistically powerful antiviral resistance testing data at the state/local or even regional level. State and local laboratories choosing to perform antiviral resistance testing are encouraged to utilize sample size models to assess statistical confidence of prevalence rates generated from PHL testing. It is strongly recommended that all PHLs performing pyrosequencing routinely report testing results to CDC in a timely manner to be incorporated into national surveillance data.
c. Representativeness:
All surveillance samples submitted to CDC or a CDC-designated laboratory for antigenic characterization are tested for antiviral resistance. Surveillance sampling strategies to ensure appropriate representativeness for monitoring antiviral resistance should prioritize:
i. Timeliness – recent specimens provide the most valuable data. Testing early and peak season specimens is especially important to monitor changes in antiviral resistance profiles. (Note: Surveillance testing is generally not sufficiently timely for individual patient treatment decisions. Individual results are not reported. CDC does provide diagnostic testing on a case-specific basis. Contact CDC, [email protected] for more information).
ii. Subtype – viruses representing all circulating subtypes should be tested. Oversampling of certain subtypes may be recommended based on seasonal criteria or emergence of resistant viruses.
iii. Geographic – viruses from all states contribute to ensure sufficient diversity to be representative of the US.
iv. Disease Severity – viruses representative of a range of disease severities (from outpatients to fatal cases).
v. Outbreaks/clusters – will be investigated to evaluate geographic spread and drug exposure.
vi. Age – age representativeness is not considered to be an important factor for this surveillance objective.
OBJECTIVES: THRESHOLDS AND REPRESENTATIVENESS
INFLUENZA VIROLOGIC SURVEILLANCE RIGHT SIZE ROADMAP
22 Association of Public Health Laboratories
REQUIREMENTS INTENT
This section describes each of the essential elements for an effective national influenza virologic surveillance system and explains the rationale for applying these requirements at the state, local and national level.
Sampling
Sampling Requirements: Provide year-round access to clinical specimens from ILINet providers and/or other primary care providers and clinical laboratories.
1. Establish a system that ensures efficient collection and timely flow of high quality specimens from the patient management tier of influenza surveillance to the CDC tier throughout the year.
2. Establish a representative network of specimen submitters using ILINet providers and/or other clinical primary care sources. Also collect specimens from hospital/clinical laboratories to ensure that a subset of specimens represents hospitalized patients. Capture unsubtypable influenza positives from clinical and commercial laboratories performing PCR methods that subtype currently circulating viruses.
3. Utilize a statistical, systematic approach to collect an appropriate, adequate number of specimens for testing that will provide reliable data with acceptable confidence limits to meet surveillance objectives and recommended thresholds of detection, including timely detection of rare/novel influenza events. The sampling methodology should limit sampling bias where possible.
4. Utilize sampling approaches that ensure specimens submitted throughout the entire surveillance specimen submission and testing process are representative of:
• Virus types and subtypes,
• The entire year,
• Geographic diversity of the population,
• Age of ILI patients,
• Disease severity,
• Targeted populations when necessary for specific investigations.
5. Send representative clinical specimens and/or virus isolates to CDC or a CDC-designated laboratory for national surveillance purposes, including annual vaccine virus selection, based on annual CDC criteria and guidance.
SA
MP
LIN
G
Right Size Influenza Virologic Surveillance Roadmap 23
REQUIREMENTS INTENT
RequirementIntentThe primary goals of influenza surveillance are to detect rare/novel influenza events, provide viruses for vaccine strain selection and gain a broad understanding of domestic influenza activity. An adequate number of specimens should be tested to provide reliable data to meet the surveillance objectives at the recommended thresholds of detection previously described. Specimen sampling should be designed to enhance detection of rare/novel influenza events, while at the same time collecting a representative sample of routine influenza cases for overall seasonal situational awareness. Where possible, measures to limit sampling bias should be utilized.
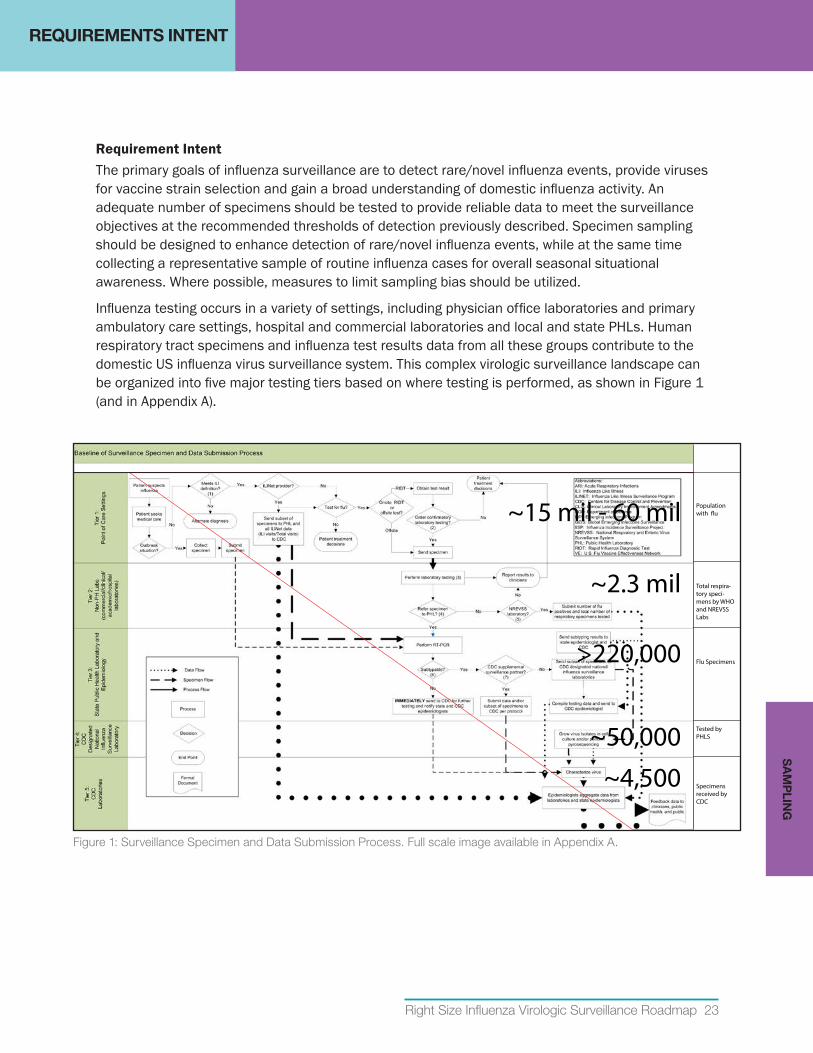
Influenza testing occurs in a variety of settings, including physician office laboratories and primary ambulatory care settings, hospital and commercial laboratories and local and state PHLs. Human respiratory tract specimens and influenza test results data from all these groups contribute to the domestic US influenza virus surveillance system. This complex virologic surveillance landscape can be organized into five major testing tiers based on where testing is performed, as shown in Figure 1 (and in Appendix A).
~15 mil - 60 mil Population with �u
~2.3 mil Total respira-tory speci-mens by WHO and NREVSS Labs
>220,000 Flu Specimens
~50,000 Tested by PHLS
~4,500 Specimens received by CDC
Figure 1: Surveillance Specimen and Data Submission Process. Full scale image available in Appendix A.
REQUIREMENTS INTENTS
AM
PLIN
G
24 Association of Public Health Laboratories
REQUIREMENTS INTENT
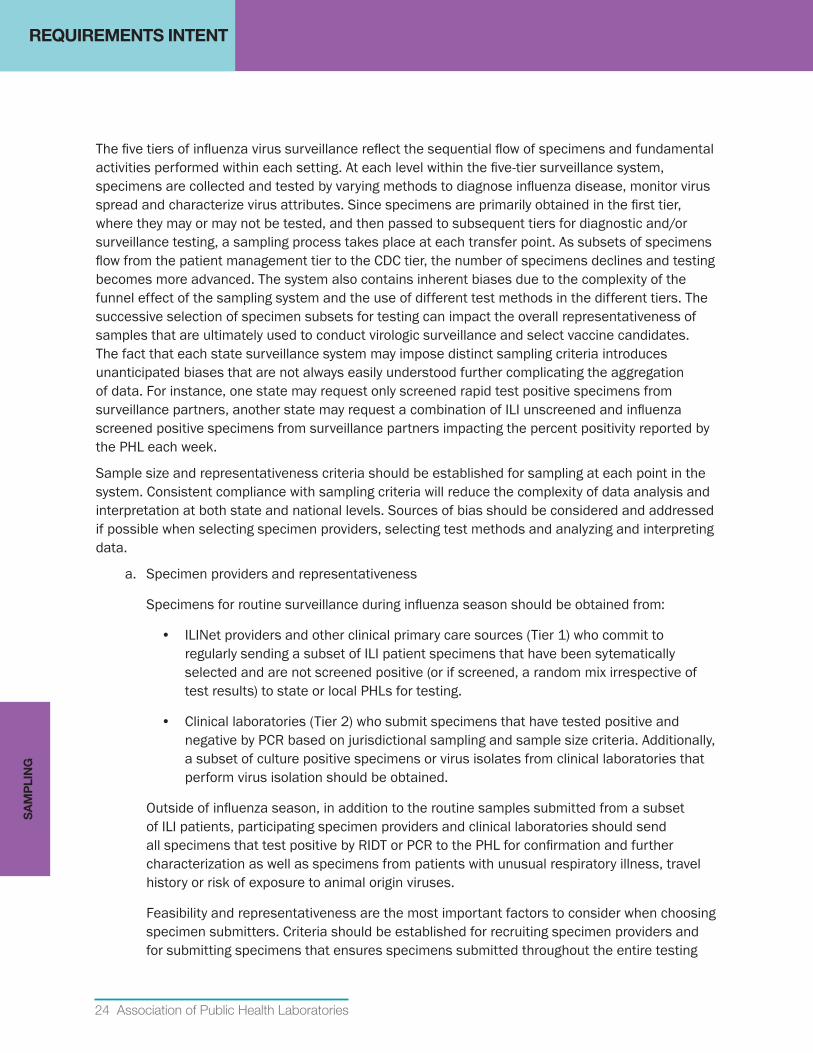
The five tiers of influenza virus surveillance reflect the sequential flow of specimens and fundamental activities performed within each setting. At each level within the five-tier surveillance system, specimens are collected and tested by varying methods to diagnose influenza disease, monitor virus spread and characterize virus attributes. Since specimens are primarily obtained in the first tier, where they may or may not be tested, and then passed to subsequent tiers for diagnostic and/or surveillance testing, a sampling process takes place at each transfer point. As subsets of specimens flow from the patient management tier to the CDC tier, the number of specimens declines and testing becomes more advanced. The system also contains inherent biases due to the complexity of the funnel effect of the sampling system and the use of different test methods in the different tiers. The successive selection of specimen subsets for testing can impact the overall representativeness of samples that are ultimately used to conduct virologic surveillance and select vaccine candidates. The fact that each state surveillance system may impose distinct sampling criteria introduces unanticipated biases that are not always easily understood further complicating the aggregation of data. For instance, one state may request only screened rapid test positive specimens from surveillance partners, another state may request a combination of ILI unscreened and influenza screened positive specimens from surveillance partners impacting the percent positivity reported by the PHL each week.
Sample size and representativeness criteria should be established for sampling at each point in the system. Consistent compliance with sampling criteria will reduce the complexity of data analysis and interpretation at both state and national levels. Sources of bias should be considered and addressed if possible when selecting specimen providers, selecting test methods and analyzing and interpreting data.
a. Specimen providers and representativeness
Specimens for routine surveillance during influenza season should be obtained from:
• ILINet providers and other clinical primary care sources (Tier 1) who commit to regularly sending a subset of ILI patient specimens that have been sytematically selected and are not screened positive (or if screened, a random mix irrespective of test results) to state or local PHLs for testing.
• Clinical laboratories (Tier 2) who submit specimens that have tested positive and negative by PCR based on jurisdictional sampling and sample size criteria. Additionally, a subset of culture positive specimens or virus isolates from clinical laboratories that perform virus isolation should be obtained.
Outside of influenza season, in addition to the routine samples submitted from a subset of ILI patients, participating specimen providers and clinical laboratories should send all specimens that test positive by RIDT or PCR to the PHL for confirmation and further characterization as well as specimens from patients with unusual respiratory illness, travel history or risk of exposure to animal origin viruses.
Feasibility and representativeness are the most important factors to consider when choosing specimen submitters. Criteria should be established for recruiting specimen providers and for submitting specimens that ensures specimens submitted throughout the entire testing
SA
MP
LIN
G
Right Size Influenza Virologic Surveillance Roadmap 25
REQUIREMENTS INTENT
process (“funnel”) for virologic surveillance are representative of the population as a whole or of specific targeted populations as needed to meet surveillance objectives. More details on representativeness are provided in the Objectives: Thresholds and Representativeness section. The surveillance program should have the capability to establish targeted surveillance of specific populations if needed. Targeted surveillance (i.e., outbreaks, animal exposure, travelers outside the US) may be useful to answer specific questions, especially if a rare/novel influenza event or new virus is detected.
Every PHL (Tier 3) participating in virologic surveillance is responsible for submitting representative clinical specimens and/or virus isolates to CDC or CDC-designated laboratories for national surveillance purposes, including annual vaccine virus selection. Laboratories should submit specimens in a timely manner based on annual CDC criteria and guidance. Unsubtypable specimensiii require immediate action as they may reflect a novel virus with pandemic potential. These specimens are sent immediately to CDC for more comprehensive testing.
b. Sample Size
The number of specimens tested each week by state and local PHLs has typically been a function of the number of surveillance partners that participate in collection each week and the testing capacity of the PHL, in contrast to the number of specimens needed to meet the surveillance objectives at the recommended thresholds. In order to establish a more evidence-based approach, three statistical sample collection calculators have been created to estimate the desired number of specimens that should be tested to provide data with a defined confidence level for seasonal situational awareness, novel event and antiviral detection, and novel event investigation. These calculators can also be used to determine the confidence level of data derived from a particular sampling of ILI patient specimens, this option may be useful to estimate the level of confidence in the data obtained from the current (pre- right size) system, or when a jurisdiction is unable to achieve the desired sample size. The Sampling Implementation Guidance section and Appendix B provide more information on using the sample size calculators.
The sample size calculations are based on population size, desired level of confidence, margin of error and estimated or known prevalence or threshold for detection. More details on thresholds are provided in the Objectives: Thresholds and Representativeness section.
iii Any influenza positive specimen that cannot be definitively typed and subtyped as a circulating seasonal influenza virus, influenza positive specimens producing non-standard or inconclusive results as defined in the CDC Human Influenza Virus Real-Time RT-PCR Diagnostic Panel Instructions for Use package insert.
The calculators are one of the best tools to come out of the right size process. They are complex but helpful to answer the question: “Are we testing enough?" —Lisa McHugh, Influenza Surveillance Coordinator, New Jersey Department of Health
SA
MP
LING
”
”
26 Association of Public Health Laboratories
REQUIREMENTS INTENT
State and local PHLs are encouraged to use sample size calculators or pre-calculated sample size tables to achieve a more scientific, statistically based sample size that supports surveillance objectives. Sampling approaches should be established to enhance detection ofrare/novelinfluenzaeventsbasedonnationalthresholds,whileatthesametimecollectingarepresentativesampleofroutineinfluenzacasesforoverallsituationalawareness at the state level. For many states, the number of samples to be tested for each of these objectives is very similar. For small population states, however, the number of samples necessary to achieve high confidence in situational awareness data at the state level will be much higher than the number of samples needed to contribute to national rare/novel influenza event detection thresholds.
Outside of influenza season, achieving statistical confidence may not be possible; therefore surveillance should shift to obtaining all specimens from participating clinical sites that have tested positive for influenza or from patients with unusual respiratory illness or travel history or risk of exposure to animal origin viruses, along with a subset MA-ILI specimens from routine surveillance providers.
c. Sample quality
Influenza surveillance programs and/or submitting laboratories should ensure proper collection, storage and transport of specimens. Proper specimen collection, handling and transport are critical to assuring the quality of results from any laboratory diagnostic test including diagnostic testing in support of virologic surveillance. Respiratory specimens should be of high quality and properly collected; specimen providers need to be trained in proper collection technique. Timely and efficient transport of specimens is often quite costly and must be adequately funded by the public health system for effective surveillance.
d. Bias
The influenza virologic surveillance system contains inherent biases due to the complexity of the sampling and submission selection processes (the funnel effect) of the sampling system and the use of different test methods in the different tiers. Sources of bias should be considered and addressed if possible when selecting specimen providers, selecting test methods and analyzing and interpreting data.
SA
MP
LIN
G
INFLUENZA VIROLOGIC SURVEILLANCE RIGHT SIZE ROADMAP
Right Size Influenza Virologic Surveillance Roadmap 27
Laboratory Testing
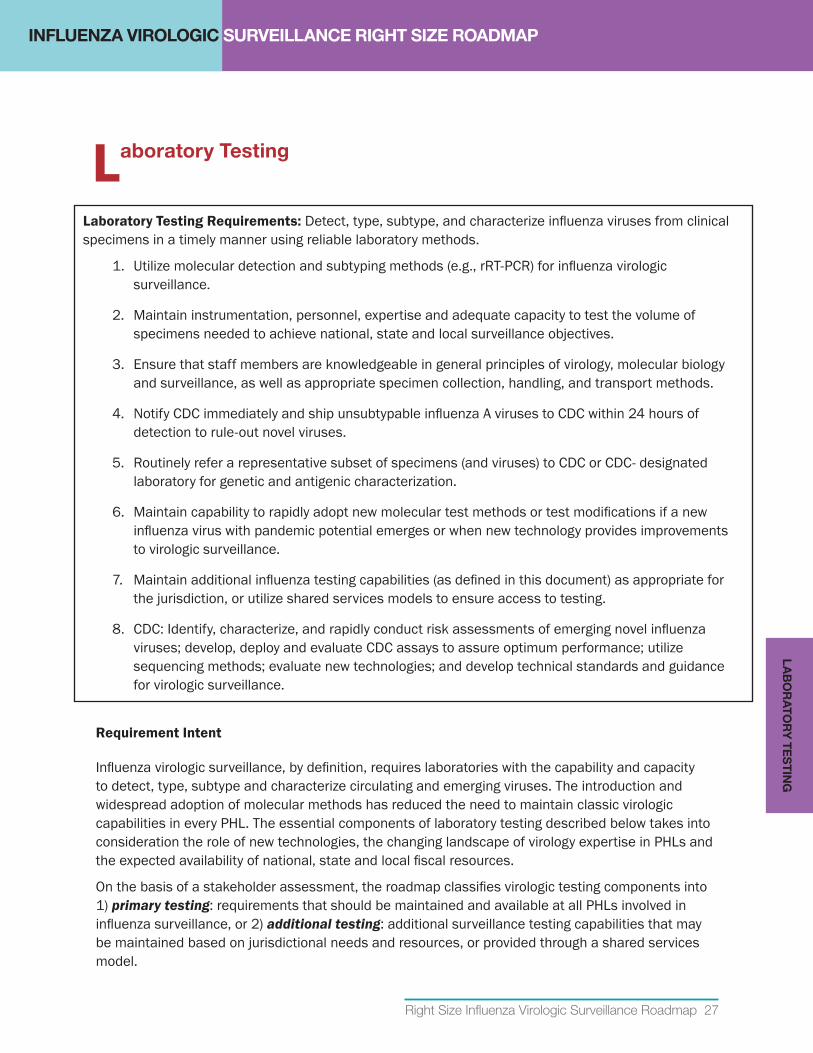
RequirementIntent
Influenza virologic surveillance, by definition, requires laboratories with the capability and capacity to detect, type, subtype and characterize circulating and emerging viruses. The introduction and widespread adoption of molecular methods has reduced the need to maintain classic virologic capabilities in every PHL. The essential components of laboratory testing described below takes into consideration the role of new technologies, the changing landscape of virology expertise in PHLs and the expected availability of national, state and local fiscal resources.
On the basis of a stakeholder assessment, the roadmap classifies virologic testing components into 1) primary testing: requirements that should be maintained and available at all PHLs involved in influenza surveillance, or 2) additional testing: additional surveillance testing capabilities that may be maintained based on jurisdictional needs and resources, or provided through a shared services model.
Laboratory Testing Requirements: Detect, type, subtype, and characterize influenza viruses from clinical specimens in a timely manner using reliable laboratory methods.
1. Utilize molecular detection and subtyping methods (e.g., rRT-PCR) for influenza virologic surveillance.
2. Maintain instrumentation, personnel, expertise and adequate capacity to test the volume of specimens needed to achieve national, state and local surveillance objectives.
3. Ensure that staff members are knowledgeable in general principles of virology, molecular biology and surveillance, as well as appropriate specimen collection, handling, and transport methods.
4. Notify CDC immediately and ship unsubtypable influenza A viruses to CDC within 24 hours of detection to rule-out novel viruses.
5. Routinely refer a representative subset of specimens (and viruses) to CDC or CDC- designated laboratory for genetic and antigenic characterization.
6. Maintain capability to rapidly adopt new molecular test methods or test modifications if a new influenza virus with pandemic potential emerges or when new technology provides improvements to virologic surveillance.
7. Maintain additional influenza testing capabilities (as defined in this document) as appropriate for the jurisdiction, or utilize shared services models to ensure access to testing.
8. CDC: Identify, characterize, and rapidly conduct risk assessments of emerging novel influenza viruses; develop, deploy and evaluate CDC assays to assure optimum performance; utilize sequencing methods; evaluate new technologies; and develop technical standards and guidance for virologic surveillance.
LA
BO
RA
TOR
Y TE
STIN
G
28 Association of Public Health Laboratories
REQUIREMENTS INTENT
Primary Testing MethodPHLs performing virologic surveillance are expected to utilize molecular methods, such as rRT-PCR, as the primary method for influenza detection and subtyping. This is an ELC benchmark. Influenza rRT-PCR testing provides rapid, sensitive and accurate detection and identification of influenza viruses for routine influenza surveillance, outbreak detection and pandemic response. The CDC Human Influenza Virus Real-Time RT-PCR Diagnostic Panel (CDC Flu rRT-PCR Dx Panel) is an FDA-cleared in vitro diagnostic assay that is manufactured and distributed by CDC to all qualified state and local PHLs engaged in influenza virologic surveillance testing. Although PHLs have the option to use commercial rRT-PCR assays, there are specific benefits to utilizing the CDC assay and CDC supplied reagents. This is a nationally recognized reference method and allows for standardization of influenza testing across all PHLs. The assay detects current influenza strains, is continually assessed and updated as needed to detect strain variations, and should detect novel viruses. The assay also allows for higher throughput testing algorithms to support outbreak and pandemic response. This method is consistent with the laboratory workforce’s increasing proficiency in molecular testing methods. However, all PHLs engaged in influenza surveillance should also have staff knowledgeable in general principles of virology and surveillance, and appropriate specimen collection, handling, and transport methods.
Additional Testing MethodsThere are additional testing methods that may be used to support influenza virologic surveillance. These include influenza virus culture, antiviral resistance testing of influenza viruses, influenza hemagglutination inhibition (HAI), immunofluorescence identification of influenza viruses and serology testing. Each of these methods has distinct purposes, advantages and disadvantages for both national and state surveillance. The determination to use any of these methods in PHLs should be made based on state and jurisdictional needs, detailed cost analysis, and identification of sustainable funding source (see Financial Resources Requirements Intent and Implementation Guidance sections).
Virus isolation has the advantage of producing quantities of virus sufficient for full antigenic characterization for determining vaccine match and conducting antiviral resistance testing.5 However, influenza virus culture is less sensitive and specific than rRT-PCR, and there are vast variations in the sensitivity of different cell culture lines, the growth characteristics of influenza virus strains and PHL practices and expertise. In addition, influenza virus culture is less rapid than influenza rRT-PCR and less adaptable to sudden surges in specimen numbers. Influenza virus culture must be maintained at CDC and a subset of PHLs.
Antiviral resistance testing is necessary to monitor the presence and level of antiviral resistance in circulating influenza viruses. These data inform patient management and treatment recommendations as well as national antiviral stockpile policies. Definitive antiviral resistance testing requires both phenotypic resistance testing, using a neuraminidase inhibition (NAI) assay (requires cultured viruses), and detection of genetic changes (drug resistance markers) by pyrosequencing and/or sequencing. Both of these test methods are available at CDC and a subset of PHLs. Performing pyrosequencing at a subset of PHLs provides a cost-effective and efficient approach to expanded surveillance screening. Supporting a limited number of testing sites allows for efficient updates to methods for viral mutations and training to develop the extensive expertise required to perform and interpret the test results and limits costs.
Influenza hemagglutination inhibition (HAI) testing remains a cornerstone of antigenic characterization for influenza vaccine strain selection. CDC maintains HAI expertise for antigenic characterization of
LA
BO
RA
TOR
Y T
ES
TIN
G
Right Size Influenza Virologic Surveillance Roadmap 29
REQUIREMENTS INTENT
influenza virus culture isolates using specialized antisera. HAI tests using the WHO kit reagents that are provided to PHLs can be used to determine influenza type and influenza A subtype, but are not a reliable indicator of influenza strain or strain changes. Results of influenza HAI tests using WHO kit reagents may be over-interpreted as indicators of vaccine effectiveness and circulating strains. In addition, influenza HAI testing requires frequent practice to maintain expertise and proficiency in test performance and result interpretation.
Immunofluorescent antibody identification of influenza viruses is used in some PHLs for confirmation and identification of influenza viruses that have grown in cell cultures. Immunofluorescence (IF) testing is not as specific as rRT-PCR testing and requires a fluorescent microscope and staff with specialized expertise. However, influenza IF testing has the potential to identify novel strains of influenza grown in culture that evade detection by rRT-PCR.
Serologic testing is neither a routine surveillance nor diagnostic tool; it is currently used primarily by CDC or academic institutions for research purposes or retrospective seroprevalence studies. Testing requires staff with a high level of expertise and specialized reagents, there are currently no FDA cleared influenza serology tests.
Rapid influenza diagnostic tests (RIDTs) for the detection and identification of influenza viruses are used by many sentinel surveillance providers, other primary care sites, emergency departments as well as physician office and clinical laboratories. However, these tests are significantly less sensitive and specific than molecular assays.6,7 RIDTs may also be less reliable when new virus strains emerge. If PHLs choose to use RIDTs to serve diagnostic needs for selected patient populations, they should be aware of the limitations of these tests (e.g., the considerable variability of the positive and negative predictive values depending upon the prevalence of influenza in the community) and should follow guidelines provided by CDC (currently at www.cdc.gov/flu/professionals/diagnosis/rapidlab.htm). If an important clinical decision will be affected by either a positive or negative rapid test result, the rapid test result should be confirmed by another test, such as rRT-PCR. Even if the PHL does not perform RIDTs, virology staff should maintain awareness of the performance characteristics of currently available RIDTs that may be used within their jurisdiction in order to provide seasonal guidance to clinicians, clinical laboratories and surveillance coordinators. PHLs or surveillance coordinators may also collect data from clinical sites using RIDTs to provide additional seasonal situational awareness data.
Direct specimen immunofluorescence using a direct fluorescent antibody method (DFA) involves testing clinical material taken directly from the patient and using fluorescent-labeled antibodies to detect influenza antigens that may be present. DFA can be performed quickly but is not as accurate as rRT-PCR testing and requires significant expertise and expensive fluorescent microscopes. In addition, results can be very subjective and are dependent on the individual reader’s expertise.
Expanded testing for other respiratory viruses using molecular respiratory virus panels (RVPs) has become common in many clinical laboratories and is increasingly used in PHLs to provide jurisdictional and national information about circulating viruses that are associated with acute respiratory illness. While detection and identification of non-influenza respiratory viruses is not a component of national influenza virologic surveillance, data from these assays can aid in identifying the cause of non-influenza community illnesses or outbreaks. If surveillance for other respiratory viruses is performed to meet jurisdictional needs and resources are available, it is recommended that PHLs consider adopting molecular RVPs to replace less sensitive viral culture.
LA
BO
RA
TOR
Y TE
STIN
G
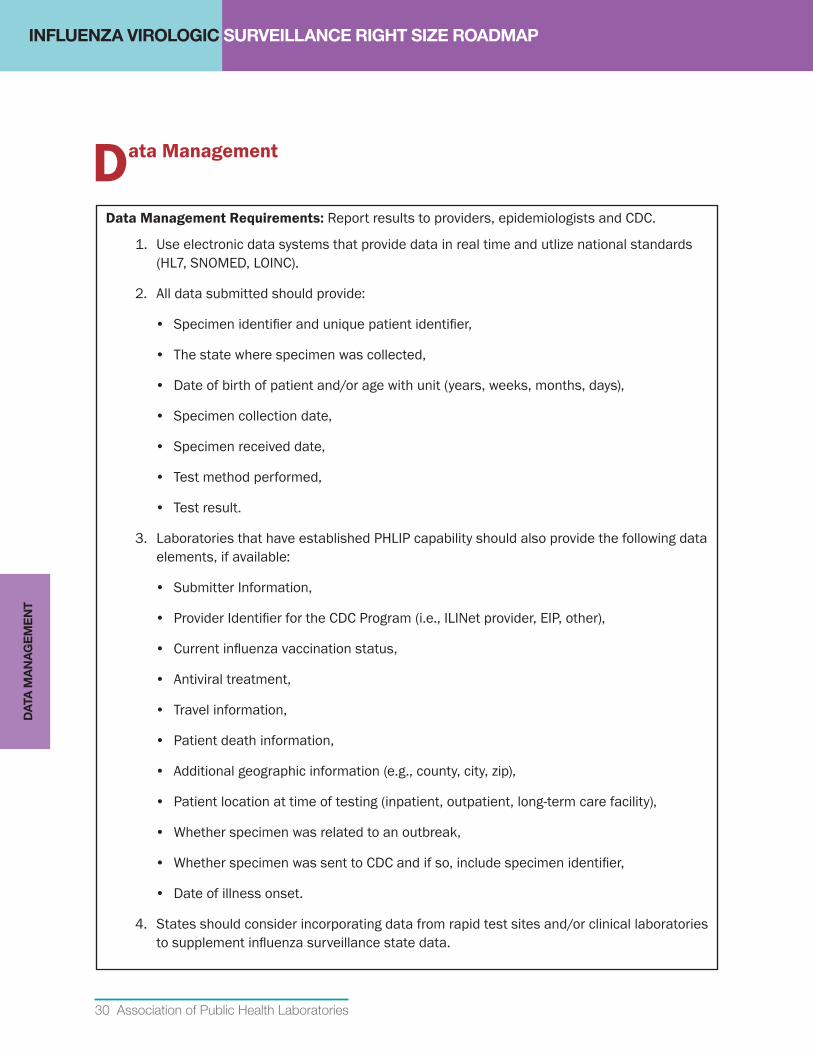
INFLUENZA VIROLOGIC SURVEILLANCE RIGHT SIZE ROADMAP
30 Association of Public Health Laboratories
Data Management
Data Management Requirements: Report results to providers, epidemiologists and CDC.
1. Use electronic data systems that provide data in real time and utlize national standards (HL7, SNOMED, LOINC).
2. All data submitted should provide:
• Specimen identifier and unique patient identifier,
• The state where specimen was collected,
• Date of birth of patient and/or age with unit (years, weeks, months, days),
• Specimen collection date,
• Specimen received date,
• Test method performed,
• Test result.
3. Laboratories that have established PHLIP capability should also provide the following data elements, if available:
• Submitter Information,
• Provider Identifier for the CDC Program (i.e., ILINet provider, EIP, other),
• Current influenza vaccination status,
• Antiviral treatment,
• Travel information,
• Patient death information,
• Additional geographic information (e.g., county, city, zip),
• Patient location at time of testing (inpatient, outpatient, long-term care facility),
• Whether specimen was related to an outbreak,
• Whether specimen was sent to CDC and if so, include specimen identifier,
• Date of illness onset.
4. States should consider incorporating data from rapid test sites and/or clinical laboratories to supplement influenza surveillance state data.
DA
TA M
AN
AG
EM
EN
T
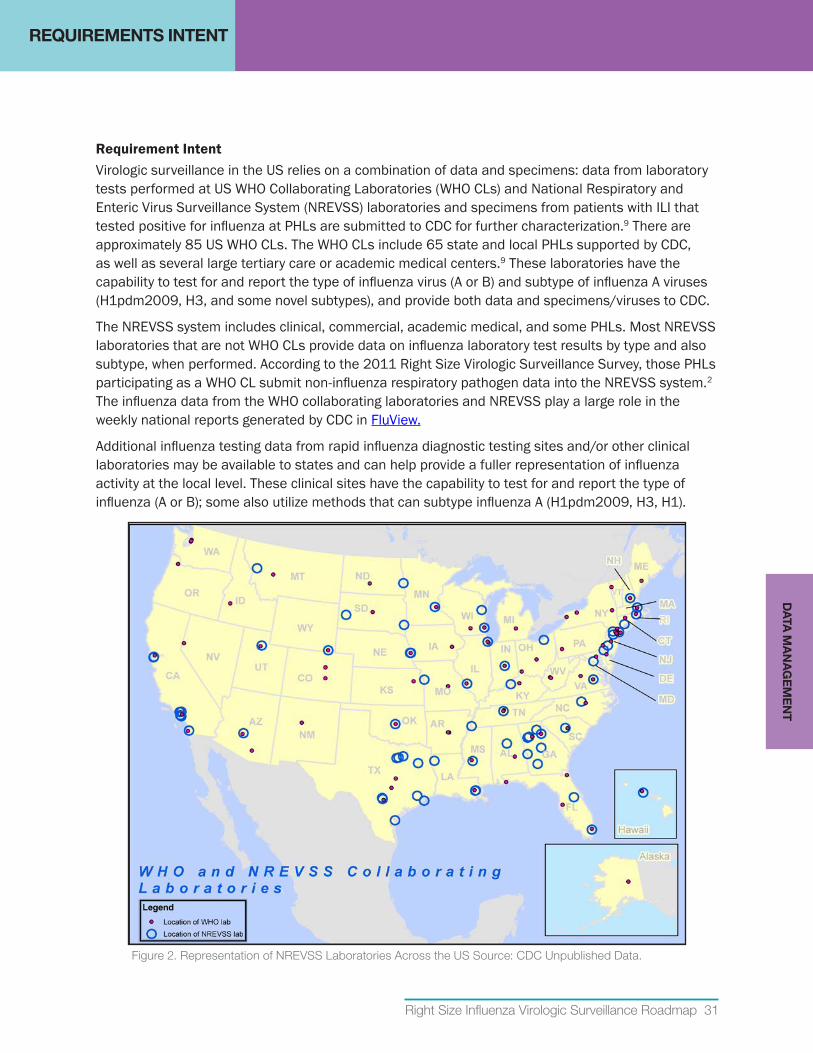
Right Size Influenza Virologic Surveillance Roadmap 31
REQUIREMENTS INTENT
RequirementIntentVirologic surveillance in the US relies on a combination of data and specimens: data from laboratory tests performed at US WHO Collaborating Laboratories (WHO CLs) and National Respiratory and Enteric Virus Surveillance System (NREVSS) laboratories and specimens from patients with ILI that tested positive for influenza at PHLs are submitted to CDC for further characterization.9 There are approximately 85 US WHO CLs. The WHO CLs include 65 state and local PHLs supported by CDC, as well as several large tertiary care or academic medical centers.9 These laboratories have the capability to test for and report the type of influenza virus (A or B) and subtype of influenza A viruses (H1pdm2009, H3, and some novel subtypes), and provide both data and specimens/viruses to CDC.
The NREVSS system includes clinical, commercial, academic medical, and some PHLs. Most NREVSS laboratories that are not WHO CLs provide data on influenza laboratory test results by type and also subtype, when performed. According to the 2011 Right Size Virologic Surveillance Survey, those PHLs participating as a WHO CL submit non-influenza respiratory pathogen data into the NREVSS system.2 The influenza data from the WHO collaborating laboratories and NREVSS play a large role in the weekly national reports generated by CDC in FluView.
Additional influenza testing data from rapid influenza diagnostic testing sites and/or other clinical laboratories may be available to states and can help provide a fuller representation of influenza activity at the local level. These clinical sites have the capability to test for and report the type of influenza (A or B); some also utilize methods that can subtype influenza A (H1pdm2009, H3, H1).
Figure 2. Representation of NREVSS Laboratories Across the US Source: CDC Unpublished Data.
DA
TA M
AN
AG
EM
EN
T
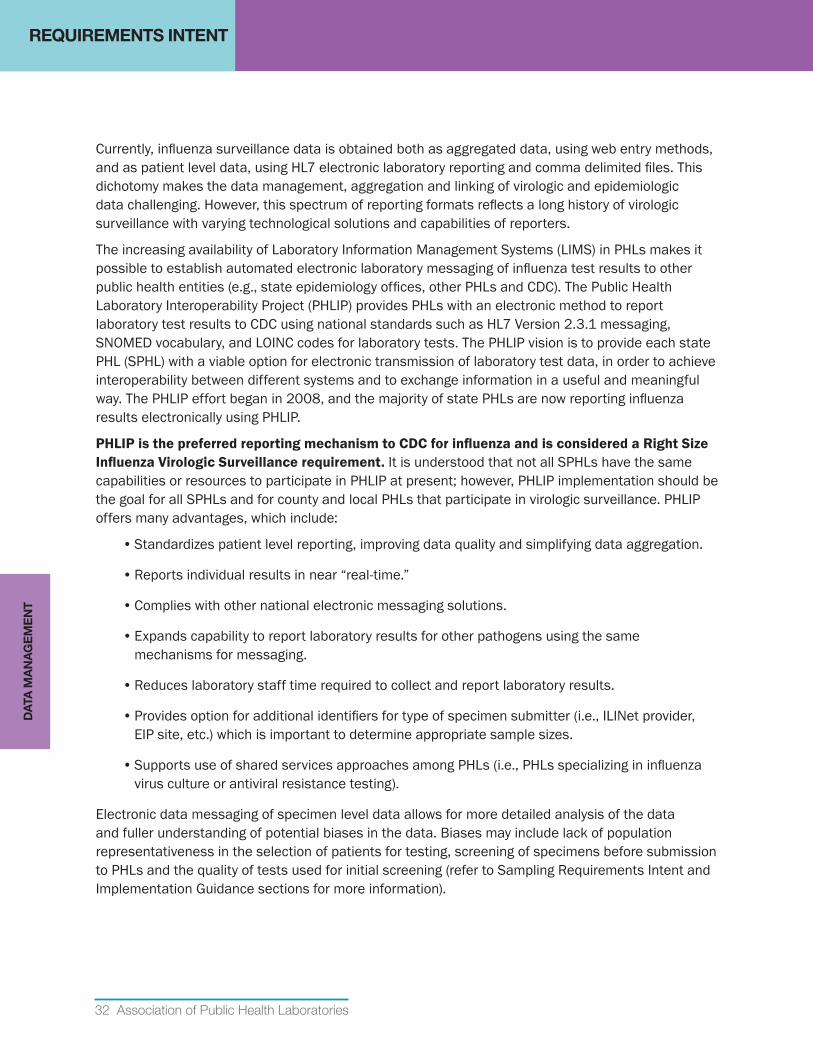
32 Association of Public Health Laboratories
REQUIREMENTS INTENT
Currently, influenza surveillance data is obtained both as aggregated data, using web entry methods, and as patient level data, using HL7 electronic laboratory reporting and comma delimited files. This dichotomy makes the data management, aggregation and linking of virologic and epidemiologic data challenging. However, this spectrum of reporting formats reflects a long history of virologic surveillance with varying technological solutions and capabilities of reporters.
The increasing availability of Laboratory Information Management Systems (LIMS) in PHLs makes it possible to establish automated electronic laboratory messaging of influenza test results to other public health entities (e.g., state epidemiology offices, other PHLs and CDC). The Public Health Laboratory Interoperability Project (PHLIP) provides PHLs with an electronic method to report laboratory test results to CDC using national standards such as HL7 Version 2.3.1 messaging, SNOMED vocabulary, and LOINC codes for laboratory tests. The PHLIP vision is to provide each state PHL (SPHL) with a viable option for electronic transmission of laboratory test data, in order to achieve interoperability between different systems and to exchange information in a useful and meaningful way. The PHLIP effort began in 2008, and the majority of state PHLs are now reporting influenza results electronically using PHLIP.
PHLIPisthepreferredreportingmechanismtoCDCforinfluenzaandisconsideredaRightSizeInfluenzaVirologicSurveillancerequirement. It is understood that not all SPHLs have the same capabilities or resources to participate in PHLIP at present; however, PHLIP implementation should be the goal for all SPHLs and for county and local PHLs that participate in virologic surveillance. PHLIP offers many advantages, which include:
• Standardizes patient level reporting, improving data quality and simplifying data aggregation.
• Reports individual results in near “real-time.”
• Complies with other national electronic messaging solutions.
• Expands capability to report laboratory results for other pathogens using the same mechanisms for messaging.
• Reduces laboratory staff time required to collect and report laboratory results.
• Provides option for additional identifiers for type of specimen submitter (i.e., ILINet provider, EIP site, etc.) which is important to determine appropriate sample sizes.
• Supports use of shared services approaches among PHLs (i.e., PHLs specializing in influenza virus culture or antiviral resistance testing).
Electronic data messaging of specimen level data allows for more detailed analysis of the data and fuller understanding of potential biases in the data. Biases may include lack of population representativeness in the selection of patients for testing, screening of specimens before submission to PHLs and the quality of tests used for initial screening (refer to Sampling Requirements Intent and Implementation Guidance sections for more information).
DA
TA M
AN
AG
EM
EN
T
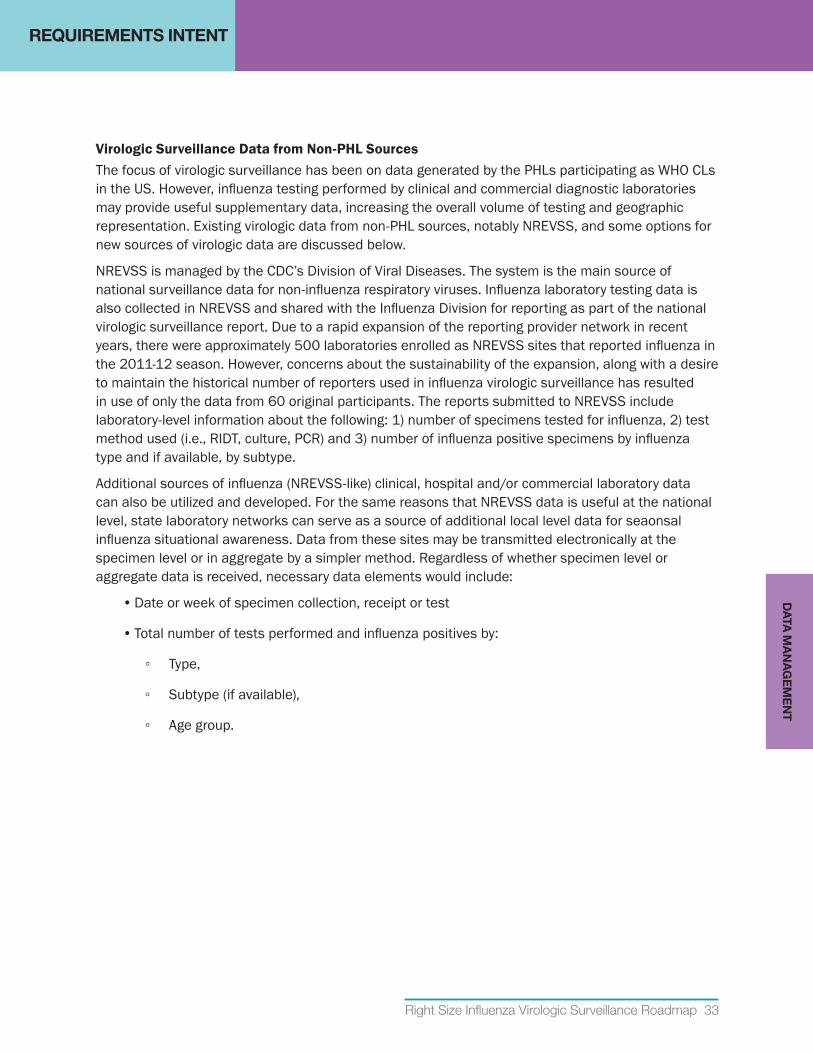
Right Size Influenza Virologic Surveillance Roadmap 33
REQUIREMENTS INTENT
VirologicSurveillanceDatafromNon-PHLSourcesThe focus of virologic surveillance has been on data generated by the PHLs participating as WHO CLs in the US. However, influenza testing performed by clinical and commercial diagnostic laboratories may provide useful supplementary data, increasing the overall volume of testing and geographic representation. Existing virologic data from non-PHL sources, notably NREVSS, and some options for new sources of virologic data are discussed below.
NREVSS is managed by the CDC’s Division of Viral Diseases. The system is the main source of national surveillance data for non-influenza respiratory viruses. Influenza laboratory testing data is also collected in NREVSS and shared with the Influenza Division for reporting as part of the national virologic surveillance report. Due to a rapid expansion of the reporting provider network in recent years, there were approximately 500 laboratories enrolled as NREVSS sites that reported influenza in the 2011-12 season. However, concerns about the sustainability of the expansion, along with a desire to maintain the historical number of reporters used in influenza virologic surveillance has resulted in use of only the data from 60 original participants. The reports submitted to NREVSS include laboratory-level information about the following: 1) number of specimens tested for influenza, 2) test method used (i.e., RIDT, culture, PCR) and 3) number of influenza positive specimens by influenza type and if available, by subtype.
Additional sources of influenza (NREVSS-like) clinical, hospital and/or commercial laboratory data can also be utilized and developed. For the same reasons that NREVSS data is useful at the national level, state laboratory networks can serve as a source of additional local level data for seaonsal influenza situational awareness. Data from these sites may be transmitted electronically at the specimen level or in aggregate by a simpler method. Regardless of whether specimen level or aggregate data is received, necessary data elements would include:
• Date or week of specimen collection, receipt or test
• Total number of tests performed and influenza positives by:
◦ Type,
◦ Subtype (if available),
◦ Age group.
DA
TA M
AN
AG
EM
EN
T
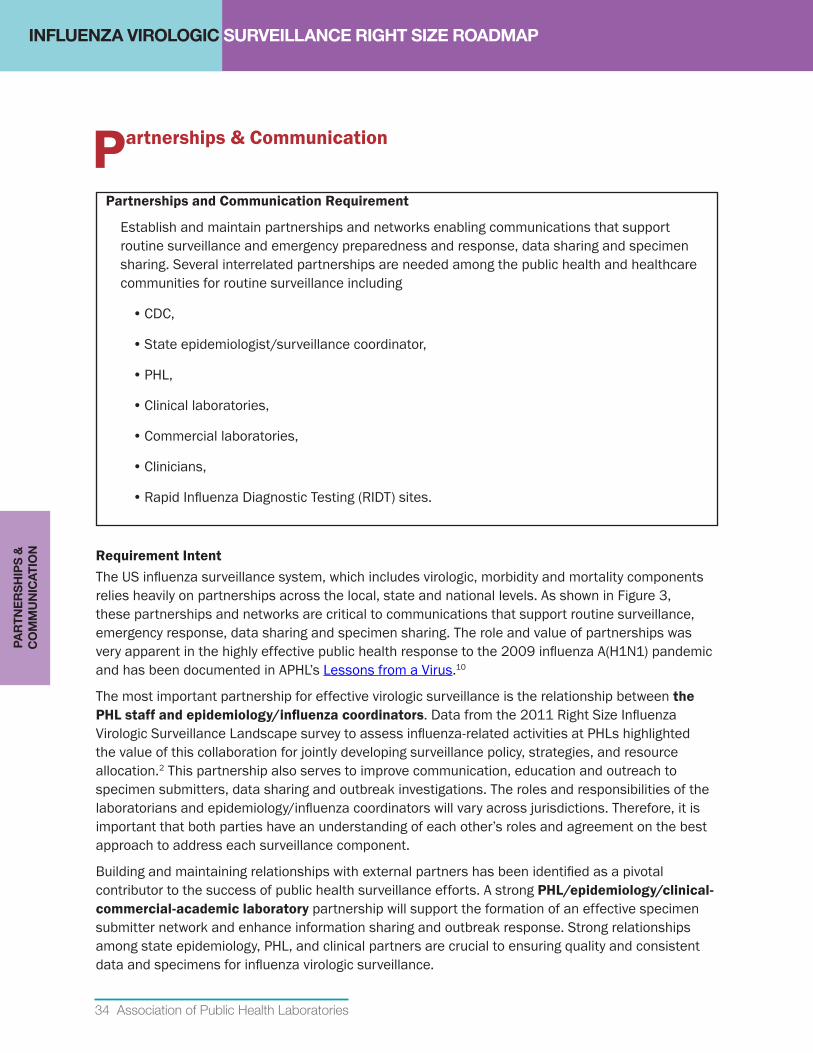
INFLUENZA VIROLOGIC SURVEILLANCE RIGHT SIZE ROADMAP
34 Association of Public Health Laboratories
Partnerships & Communication
RequirementIntentThe US influenza surveillance system, which includes virologic, morbidity and mortality components relies heavily on partnerships across the local, state and national levels. As shown in Figure 3, these partnerships and networks are critical to communications that support routine surveillance, emergency response, data sharing and specimen sharing. The role and value of partnerships was very apparent in the highly effective public health response to the 2009 influenza A(H1N1) pandemic and has been documented in APHL’s Lessons from a Virus.10
The most important partnership for effective virologic surveillance is the relationship between the PHLstaffandepidemiology/influenzacoordinators. Data from the 2011 Right Size Influenza Virologic Surveillance Landscape survey to assess influenza-related activities at PHLs highlighted the value of this collaboration for jointly developing surveillance policy, strategies, and resource allocation.2 This partnership also serves to improve communication, education and outreach to specimen submitters, data sharing and outbreak investigations. The roles and responsibilities of the laboratorians and epidemiology/influenza coordinators will vary across jurisdictions. Therefore, it is important that both parties have an understanding of each other’s roles and agreement on the best approach to address each surveillance component.
Building and maintaining relationships with external partners has been identified as a pivotal contributor to the success of public health surveillance efforts. A strong PHL/epidemiology/clinical-commercial-academic laboratory partnership will support the formation of an effective specimen submitter network and enhance information sharing and outbreak response. Strong relationships among state epidemiology, PHL, and clinical partners are crucial to ensuring quality and consistent data and specimens for influenza virologic surveillance.
Partnerships and Communication Requirement
Establish and maintain partnerships and networks enabling communications that support routine surveillance and emergency preparedness and response, data sharing and specimen sharing. Several interrelated partnerships are needed among the public health and healthcare communities for routine surveillance including
• CDC,
• State epidemiologist/surveillance coordinator,
• PHL,
• Clinical laboratories,
• Commercial laboratories,
• Clinicians,
• Rapid Influenza Diagnostic Testing (RIDT) sites.
PA
RTN
ER
SH
IPS
&
CO
MM
UN
ICA
TIO
N
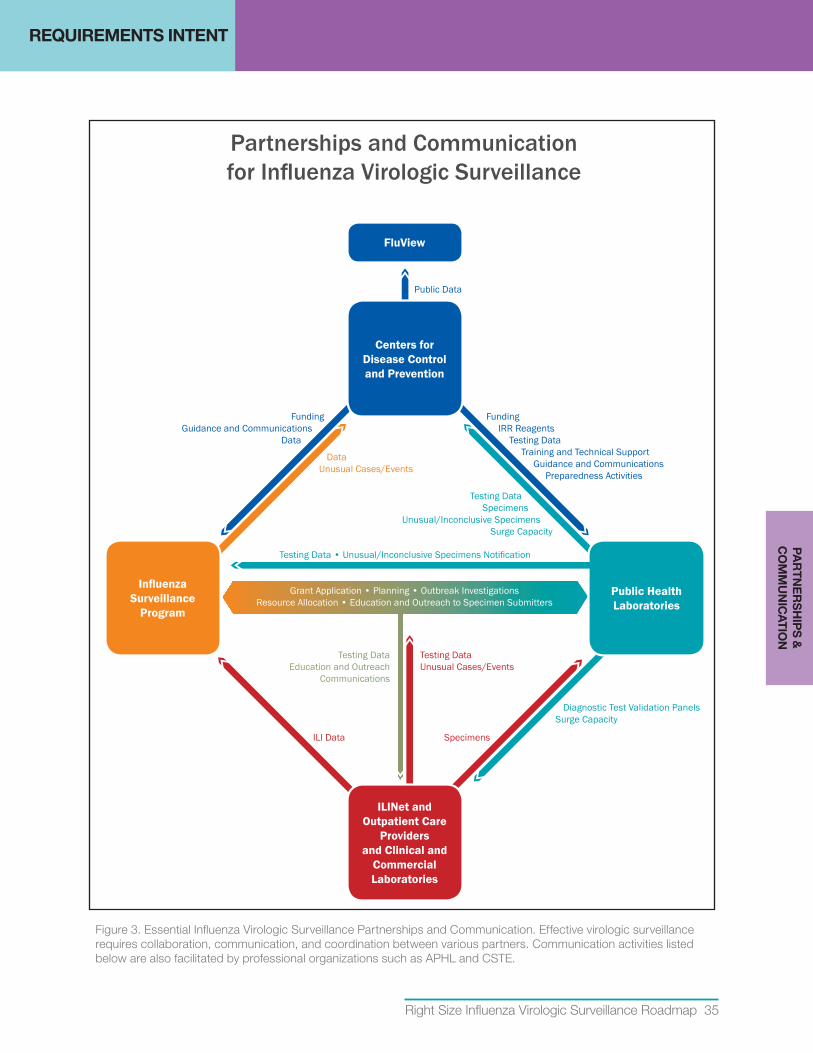
Right Size Influenza Virologic Surveillance Roadmap 35
REQUIREMENTS INTENT
Figure 3. Essential Influenza Virologic Surveillance Partnerships and Communication. Effective virologic surveillance requires collaboration, communication, and coordination between various partners. Communication activities listed below are also facilitated by professional organizations such as APHL and CSTE.
Centers for Disease Control and Prevention
FluView
Public Health Laboratories
Influenza Surveillance
Program
ILINet and Outpatient Care
Providers and Clinical and
Commercial Laboratories
FundingGuidance and Communications
Data
Specimens
Diagnostic Test Validation PanelsSurge Capacity
DataUnusual Cases/Events
ILI Data
Grant Application • Planning • Outbreak InvestigationsResource Allocation • Education and Outreach to Specimen Submitters
Testing DataEducation and Outreach
Communications
Testing DataUnusual Cases/Events
Testing Data • Unusual/Inconclusive Specimens Notification
FundingIRR Reagents
Testing DataTraining and Technical Support
Guidance and CommunicationsPreparedness Activities
Testing DataSpecimens
Unusual/Inconclusive Specimens Surge Capacity
Partnerships and Communication for Influenza Virologic Surveillance
Public Data
PA
RTN
ER
SH
IPS
&
CO
MM
UN
ICA
TION
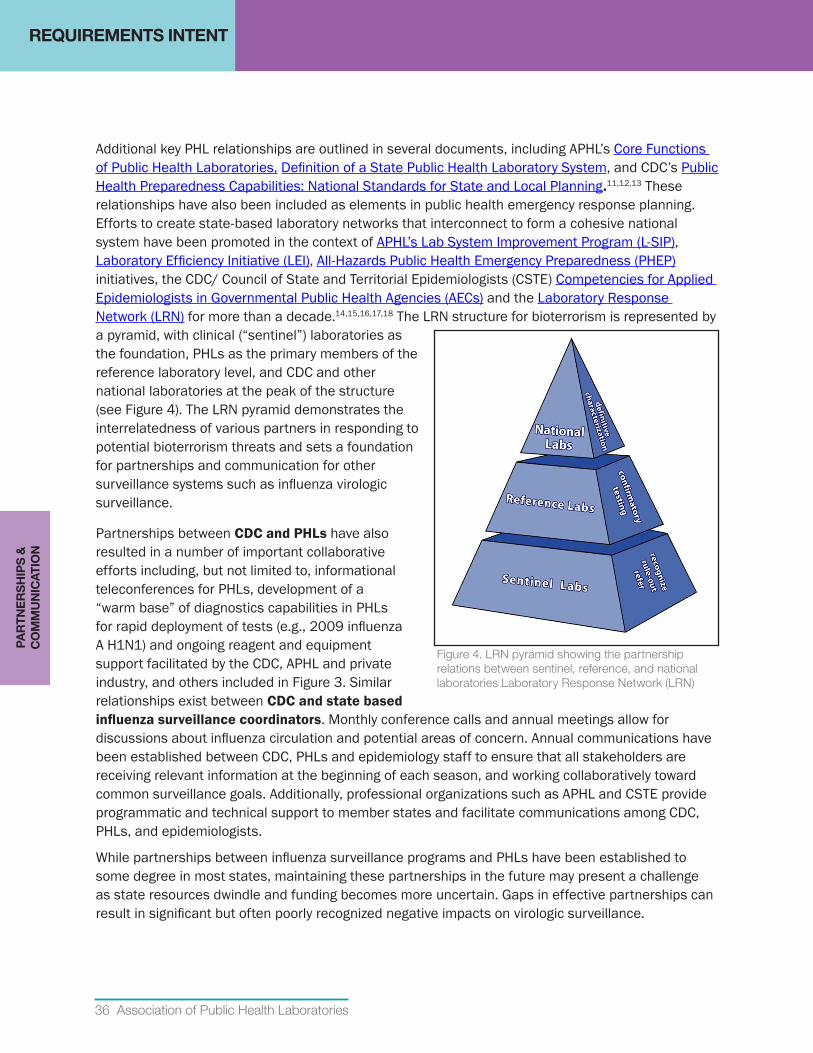
36 Association of Public Health Laboratories
REQUIREMENTS INTENT
Additional key PHL relationships are outlined in several documents, including APHL’s Core Functions of Public Health Laboratories, Definition of a State Public Health Laboratory System, and CDC’s Public Health Preparedness Capabilities: National Standards for State and Local Planning.11,12,13 These relationships have also been included as elements in public health emergency response planning. Efforts to create state-based laboratory networks that interconnect to form a cohesive national system have been promoted in the context of APHL’s Lab System Improvement Program (L-SIP), Laboratory Efficiency Initiative (LEI), All-Hazards Public Health Emergency Preparedness (PHEP) initiatives, the CDC/ Council of State and Territorial Epidemiologists (CSTE) Competencies for Applied Epidemiologists in Governmental Public Health Agencies (AECs) and the Laboratory Response Network (LRN) for more than a decade.14,15,16,17,18 The LRN structure for bioterrorism is represented by a pyramid, with clinical (“sentinel”) laboratories as the foundation, PHLs as the primary members of the reference laboratory level, and CDC and other national laboratories at the peak of the structure (see Figure 4). The LRN pyramid demonstrates the interrelatedness of various partners in responding to potential bioterrorism threats and sets a foundation for partnerships and communication for other surveillance systems such as influenza virologic surveillance.
Partnerships between CDC and PHLs have also resulted in a number of important collaborative efforts including, but not limited to, informational teleconferences for PHLs, development of a “warm base” of diagnostics capabilities in PHLs for rapid deployment of tests (e.g., 2009 influenza A H1N1) and ongoing reagent and equipment support facilitated by the CDC, APHL and private industry, and others included in Figure 3. Similar relationships exist between CDC and state based influenzasurveillancecoordinators. Monthly conference calls and annual meetings allow for discussions about influenza circulation and potential areas of concern. Annual communications have been established between CDC, PHLs and epidemiology staff to ensure that all stakeholders are receiving relevant information at the beginning of each season, and working collaboratively toward common surveillance goals. Additionally, professional organizations such as APHL and CSTE provide programmatic and technical support to member states and facilitate communications among CDC, PHLs, and epidemiologists.
While partnerships between influenza surveillance programs and PHLs have been established to some degree in most states, maintaining these partnerships in the future may present a challenge as state resources dwindle and funding becomes more uncertain. Gaps in effective partnerships can result in significant but often poorly recognized negative impacts on virologic surveillance.
Figure 4. LRN pyramid showing the partnership relations between sentinel, reference, and national laboratories Laboratory Response Network (LRN)
PA
RTN
ER
SH
IPS
&
CO
MM
UN
ICA
TIO
N
INFLUENZA VIROLOGIC SURVEILLANCE RIGHT SIZE ROADMAP
Right Size Influenza Virologic Surveillance Roadmap 37
Quality Management Systems
RequirementIntentA quality management system can be defined as a coordinated activity to monitor and control organizational processes and resources. Both national and state/local virologic surveillance systems require monitoring and management of the various components that inform surveillance. Establishing and applying performance metrics encourages continuous improvement, demonstrates return on investments and helps to justify funding. It is important that CDC and state/local jurisdictions monitor activities related roadmap requirements as well as compliance with ELC and PHEP benchmarks.
State and local influenza programs and PHLs should monitor quality and consistency of specimen submissions throughout the system, data confidence in relation to sample sizes and representativeness and laboratory testing quality assurance parameters.
CDC should monitor reporting and specimen submissions to ensure national surveillance data are representative of influenza activity, meet current national needs across the entire country and that specimens are being submitted in a timely manner throughout the year to help inform annual vaccine virus selection. Additionally, monitoring resource allocation and usage in the context of surveillance test activities allows CDC to identify areas for improvement and justify funding for national and state/local surveillance systems. National quality monitoring efforts may include timeliness and consistency of testing data reported to CDC, influenza virologic surveillance specimen submissions to CDC and CDC-designated laboratories and utilization rates of CDC provided reagents.
CDC, PHLs and state/local surveillance programs should use data gathered through quality monitoring practices to identify and implement improvements and efficiencies as appropriate.
Quality Management Systems Requirement
Establish performance metrics, monitor performance and make improvements as needed to ensure national (and state/local) surveillance requirements are being met in an effective and efficient manner.
QU
ALIT
Y M
AN
AG
EM
EN
T
SY
STE
MS
INFLUENZA VIROLOGIC SURVEILLANCE RIGHT SIZE ROADMAP
38 Association of Public Health Laboratories
Surge Capacity for Influenza Surveillance, Novel Event Investigation and Outbreak Events
RequirementsIntentVirologic surveillance is vital to support rare/novel influenza event and outbreak investigations and pandemic response. Pre-event and during an event, communication and coordination between epidemiology and laboratory leadership is essential to develop, refine and change the strategy for virologic surge sampling and testing. However, the term “surge capacity” has many different meanings which can result in unrealistic expectations of the virologic surveillance system. While seasonal surveillance provides the warm base of expertise and infrastructure necessary to provide surge capacity, the response needed for a local outbreak investigation, emergence of a novel influenza virus or a pandemic response are qualitatively and quantitatively very different. The Institute of Medicine Medical Surge Capacity Workshop report grossly defines surge capacity as the ability to rapidly accommodate a large number of patients from a defined mass-casualty incident or pandemic, and considers surge capacity on a continuum with three distinct stages: conventional capacity, contingency capacity and crisis capacity.19 These medical surge definitions are adapted here to provide standardized terminology to improve planning and response:
• Conventional capacity: routine virologic surveillance capacity to test adequate sample size to produce meaningful data with reasonable confidence levels.
• Contingency capacity: minor adaptations are made that generally have limited impact on routine operations. This “spare” capacity must be maintained to deal with fluctuations in testing that may be necessary during a bad influenza season (e.g., increased hospitalizations, rapid transmission within the community, drifted virus), a local outbreak investigation or a rare/novel influenza event investigation. Efficient use of contingency capacity may require emphasis on targeted testing based on event specific criteria.
Surge Capacity Requirements
1. Maintain a year-round virologic surveillance system that is flexible and scalable for rapid, effective response to support diagnostic needs and case counts in rare/novel influenza event investigations, and enhance surveillance for outbreak and pandemic scenarios and has criteria to determine when to scale up and ramp down.
2. Incorporate the role and resource needs of the PHL in the state pandemic plan. PHL representatives should be part of state pandemic planning processes
3. Develop and maintain a laboratory pandemic surge plan that addresses criteria for specimen triage, algorithm changes to improve throughput, and resource needs (e.g. staff, equipment, space, reagents and supplies).
SU
RG
E C
AP
AC
ITY
Right Size Influenza Virologic Surveillance Roadmap 39
REQUIREMENTS INTENTS
UR
GE
CA
PA
CIT
Y
• Crisis capacity: a fundamental, systematic change into a system in which standards of operation are significantly altered. When crisis capacity is reached, the focus will shift to expanded hours of operation utilizing staff from other programs or areas of the laboratory, changes in testing algorithms and most importantly, significantly limiting testing based on event specific governance criteria.
These definitions of capacity relate to the equipment and supplies available and even more importantly to the staff needed to provide all the tasks required for specimen accessioning, processing, testing, data management and analysis. Therefore each jurisdiction may have different triggers that will cause a shift from one stage to another.
NovelEvent/OutbreakInvestigationsFollowing identification of a potential outbreak, a rare/novel influenza virus or other rare event, populations that will be targeted for testing will be determined based on:
• Epidemiologic criteria (e.g., exposure, geographic location, event specific risk factors),
• Clinical criteria (e.g., severe or fatal illness),
• Specimen sources (e.g., ILINet or other primary care providers, clinical laboratories using high performing assays).
Although epidemiologists will serve as gate-keepers for PHL testing, collaborative epidemiology-laboratory pre-event planning and event response is needed to ensure common understanding and expectation of contingency and crisis capacity. PHL influenza testing capacity models20 and Right Size Sample Size Calculators can be used to identify system efficiencies and limitations. The APHL Infectious Disease Planning and Response Framework is another useful tool for planning.21
H1N1Response:LessonsoftheVirus
Public health labs opened their doors to let in specimens from clinical labs because they had the best test and were eager to fulfill their surveillance mission... You can’t just hire a molecular biologist off the street. The layers of quality assurance involved in validation add critical steps to the process. Specific, sophisticated instruments and expensive reagents are required. Regula-tory clearance can add time to the process. The subtleties don’t always translate to the general public or political representatives. For them, the gold-standard is an immediate yes-no answer at the point of care.10
40 Association of Public Health Laboratories
REQUIREMENTS INTENT
Pandemic SurgeIn the event a novel virus emerges that is highly transmissible, the PHL will likely be the only resource for diagnostic testing at the start of the event, particularly if the commercially available tests do not reliably detect or differentiate the virus. As demonstrated in the 2009 H1N1 pandemic response, PHL testing capacity will be stretched by testing demands, rapidly reaching unsustainable crisis capacity. Effective governance for triage of cases eligible for testing at the PHL will be necessary. Epidemiologists, in collaboration with the PHL leadership, will need to manage the demand for diagnostic testing and ensure that surveillance testing that is representative of the relevant populations is prioritized so that effective response and control measures can be effectively implemented.
Even when diagnostic testing demand can be met by the clinical laboratory sector, the PHL will be the primary resource for virologic surveillance data. Therefore, the PHL should be represented in state pandemic planning activities. The role and resource needs of the PHL should be addressed in the state pandemic plan. Expectations for state and local epidemiologists to serve as gate-keepers for specimen testing demands should be coordinated in advance and defined in the plan.
All PHLs should develop and maintain an internal pandemic surge plan that addresses criteria for specimen triage, algorithm changes to improve testing and reporting throughput and resource needs (e.g., staff, equipment, space, safety, reagents and supplies).
SU
RG
E C
AP
AC
ITY
INFLUENZA VIROLOGIC SURVEILLANCE RIGHT SIZE ROADMAP
Right Size Influenza Virologic Surveillance Roadmap 41
Financial Resources
RequirementIntentAn optimal influenza surveillance system requires adequate resources to support all essential elements defined in this roadmap document. Sustaining the national, state and local components of this system is increasingly threatened by the decline in annual and pandemic response funding. Implementation of the right size virologic surveillance guidelines will help CDC, PHLs and surveillance programs maximize available resources, redirect resources as necessary and build new capacity as needed for optimal surveillance. Accurate assessments of the cost of virologic surveillance activities are critical to justify and prioritize funding.
Federal funding provided since 2005 to support pandemic planning, and supplemental funding made available during the 2009 H1N1 response have resulted in many improvements to the US influenza surveillance system. It is important to use available resources now to optimize systems for the future. Collaborative planning, grant proposal development and funding allocation between influenza surveillance programs and PHLs is essential to ensure all involved parties have an understanding of the costs associated with all aspects of influenza surveillance and that all virologic surveillance requirements are adequately resourced.
Surveillance is supported by several different funding streams, distributed at different times depending on source. Additionally, the cost of surveillance and the availability and allocation of funds for the different components of virologic surveillance varies across jurisdictions; these challenges can impact the overall effectiveness of the surveillance system. While funding is often cited as a key limiting factor, the true costs of virologic surveillance are not well defined, likely because of the complexity of the system. Optimizing resources and justifying funding requests will require better cost accounting at the national, state and local level.
Financial Resources Requirements
1. State influenza surveillance programs and PHLs should have adequate funding to support virologic surveillance requirements.
2. State influenza surveillance programs and PHLs should coordinate planning and allocation of available funds (ELC, PHEP, EIP, state) to program and laboratory elements (staff, information technology, all supplies, reagents and equipment maintenance).
3. National, state and local programs and PHLs should have effective cost accounting practices to justify resource needs and efficiently allocate available funds.
4. CDC should have adequate funding to support CDC’s national virologic surveillance activities as well as state/local surveillance activities that rely on federal funds.
5. Programs within CDC such as ELC and PHEP that provide funding to support other state and local programs should collaborate to ensure that changes in one program do not unintentionally impact other individual programs.
FINA
NC
IAL R
ES
OU
RC
ES
42 Association of Public Health Laboratories
REQUIREMENTS INTENTFI
NA
NC
IAL
RE
SO
UR
CE
S
Federal Funding Sources•ELC Cooperative Agreement: Currently, state/local influenza virologic surveillance systems
rely heavily on CDC funding resources. In particular, the ELC cooperative agreement program has been the primary funding source for surveillance at the state level, especially for supporting programmatic and laboratory personnel. All 50 states and several large cities receive funding from CDC to support US influenza surveillance goals via the ELC cooperative agreement program. The primary goals of the influenza component of the ELC program include: establishing and supporting ILI sentinel provider networks, providing timely ILINet data to CDC and maintaining laboratory testing and reporting capability and capacity for year round virologic surveillance. CDC supports public health influenza virologic surveillance through the ELC because the work of the PHLs contributes to national and global disease prevention efforts. Specimens submitted to CDC and CDC-designated laboratories contribute the viruses used to assess antigenic changes that impact vaccine effectiveness; these viruses are also frequently selected as seed strains for the manufacture of seasonal vaccines.
While routine annual influenza surveillance principally relies on ELC and state funding, these federal funding programs also contribute to national virologic surveillance goals:
• EIP: Active population-based surveillance in ten states for laboratory confirmed influenza-related hospitalizations. EIP sites also conduct influenza vaccine effectiveness evaluations among groups for which the Advisory Committee on Immunization Practices (ACIP) recommends annual vaccination.
• PHEP Cooperative Agreements: Provides some funding for certain pandemic planning and response activities, including partner and clinical laboratory outreach, the purchase of laboratory equipment and supplies or support for specimen courier/transport systems.
• Other special projects: As resources permit, CDC supports additional studies and special projects such as the Influenza Incidence Surveillance Program (IISP). These programs help increase capacity for participants and provide valuable data for national surveillance.
Sustainable Funding is CriticalAt least once a year, the influenza virus changes slightly. It stays ahead of testing and research—and ahead of funding for testing and research. The changing virus is one side of the equation. On the other side is the changing levels of funding. Labs experience “roller-coaster” funding levels—a surge of money in response to a crisis and cuts when a crisis is behind.
“People think of a lab as a building—you build it and you walk away. But you need people who are trained, you need new equipment, you need to stay up-to-date with disease pathogens.”
Excerpted from Lessons from a Virus.10
Right Size Influenza Virologic Surveillance Roadmap 43
REQUIREMENTS INTENTFIN
AN
CIA
L RE
SO
UR
CE
S
Additional Federal ResourcesIn addition to funding, other resources are provided to states by CDC to help minimize the financial and resource burden on each jurisdiction. Listed below are some of the key non-financial resources that help CDC and state/local jurisdictions meet the surveillance requirements outlined in this roadmap document.
• InfluenzaReagentResource(IRR): Since 2009 CDC’s IRR provides rRT-PCR reagents to qualified PHLs to help sustain rapid virus detection and subtyping capacity. This is a critical resource that significantly reduces the financial burden for state/local jurisdictions and ensures the timely availability of molecular testing reagents intended for virologic surveillance. The IRR is able to bulk purchase which may be more cost effective than individual state purchases. Financial support for ancillary reagents through the IRR is assessed on an annual basis and is based on the availability of funds. The direct material cost to CDC for each IVD CDC Human Influenza Virus Real-Time RT-PCR Diagnostic Panel, including Influenza A/B typing and subtyping reagents, enzymes, extraction kits and plastics, is approximately $14,000 (i.e., $20 for each specimen tested).
• CDC-Designated National Surveillance Laboratories: CDC, in collaboration with APHL, has established enhanced capacity in several PHLs to provide antiviral susceptibility testing and influenza virus isolation that serves all PHLs. The virus culture capability supports expanded availability of viruses for antigenic and sequence-based characterization at CDC, providing data and viruses for annual vaccine virus selection.
• PHLIPandInformationTechnologySupport: Technical assistance teams provide training, on-site assistance and follow-up consultation to assist PHLs implement PHLIP. Resources to assist PHLs implement PHLIP have come through CDC Pandemic Influenza funds provided to APHL, although recently additional support to implement similar standardized messaging initiatives have been made available through the CDC LRN, LEI, and Vaccine Preventable Disease (VPD) initiatives. The broad applicability of PHLIP to other programs and to other efforts to support “shared services” models among PHLs provides a path to sustainability for PHLIP; however, this will require ongoing focus and effort to ensure sustainable funding and technical support.
• Technical Support and Training: CDC subject matter experts are readily available to PHL and program staff to address clinical, operational and technical questions. Additionally CDC provides diagnostic testing of unsubtypable and other specimens of clinical interest such as when antiviral resistance is suspected. CDC, in collaboration with APHL, has provided a variety of in-person technical training courses (i.e., PCR, pyrosequencing) for state and local jurisdictions at little or no cost to states to ensure the necessary expertise is readily available at PHLs.
44 Association of Public Health Laboratories
REQUIREMENTS INTENT
It is critical that CDC be adequately funded to continue supporting state and national activities which ensure an effective national surveillance system. In return, states should ensure that they are meeting ELC, PHEP and other federal grant benchmarks to be good stewards of these resources.
As funding is always a limiting factor, every state will need to determine how to achieve influenza surveillance goals to meet national and state needs. Federal resources (funding, reagents) distributed to states need to be directed to activities that support overall national priorities. State/local capabilities beyond those recommended as essential to meet national virologic surveillance goals will require financial support from the state.
State Funding SourcesIn addition to federal funding sources, many states also receive financial support from their state and/or local jurisdiction. These additional funds can be a critical funding stream for supporting state surveillance activities. The actual mechanisms and level of support varies across states. As data indicated in the 2011 Right Size Influenza Virologic Surveillance Landscape Survey, the amount of state funds expended in support of influenza surveillance varies greatly across states.2 As previously described, it will become increasingly important for state funds to supplement federal funds for testing not deemed essential to meet national virologic surveillance goals. It is important that each state determine which virologic surveillance testing services are essential for their jurisdiction’s needs.
FIN
AN
CIA
L R
ES
OU
RC
ES
INFLUENZA VIROLOGIC SURVEILLANCE RIGHT SIZE ROADMAP
Right Size Influenza Virologic Surveillance Roadmap 45
IMPLEMENTATION GUIDANCE
Influenza virologic surveillance is an essential function of all state health departments and requires partnership between the state PHL representatives, epidemiologists and influenza surveillance coordinators. At a minimum, virologic surveillance includes the ability to:
• Access a representative sample of clinical specimens from ILINet (ILI network) providers or other clinical primary care sources and clinical laboratories.
• Detect type and subtype influenza viruses from clinical specimens in a timely manner using standard laboratory methods.
• Report results to providers, epidemiologists, and CDC using standard electronic data systems.
• Rapidly refer unsubtypable influenza viruses to CDC to identify or rule out novel viruses.
• Routinely refer a subset of specimens (and viruses) to CDC or a CDC-designated laboratory for genetic and antigenic characterization and antiviral testing.
• Maintain the expertise, warm base (a minimum level of readiness or capacity), and surge capabilities necessary for pandemic response.
Detailed descriptions of the essential components for virologic surveillance were presented in the Requirements Intent section. In this section, suggestions and model practices are provided to assist state and local PH directors and laboratorians, epidemiologists and influenza surveillance coordinators operationalize the requirements. The model practices provided are based on experience with state virologic surveillance since the system's inception and expansion in the late 1990's, a series of right size project stakeholder meetings, a table-top exercise conducted in December 2012 testing the utility of the roadmap recommendations, and the data gathered through pilot projects conducted in four states during the 2012-2013 influenza season.
IMP
LEM
EN
TATIO
N G
UID
AN
CE
INFLUENZA VIROLOGIC SURVEILLANCE RIGHT SIZE ROADMAP
46 Association of Public Health Laboratories
Sampling
A virologic surveillance sampling strategy should be implemented that will ensure year round access to an adequate number of representative clinical specimens to meet key surveillance objectives. Specimens should be obtained from ILINet providers and/or other clinical primary care sources and clinical laboratories. Feasibility and representativeness are the most important factors to consider when choosing specimen providers.
As discussed in the Sampling Requirements Intent section, the virologic surveillance landscape can be organized into five tiers based on where sampling and testing is performed. The five tiers of influenza surveillance are outlined in the Process Model in Appendix A. Since specimens are primarily obtained in the first tier and passed to subsequent tiers for testing, a sampling process takes place at each transfer point. The variation in sampling criteria throughout this sequential process complicates extrapolating the data from one testing tier and applying it to the population of another tier. The variability in sampling can greatly challenge national surveillance efforts where the data is aggregated from multiple states. The Roadmap sampling requirements are intended to apply a more consistent, standardized collection/sampling process to improve overall data confidence and representativeness.
StateandLocalImplementationSteps1. Establish a specimen provider network
A. ILINet or other specimen providers (Tier 1)
• The primary care tier provides data and specimens for the influenza surveillance system. Specimen submitters may be ILINet sites or other primary care health care providers. The selected specimen submitters should be committed to collecting high quality specimens, and submitting the required number of samples in a timely manner and in accordance with jurisdictional criteria throughout the entire year. A number of states report that ILINet sites are generally not a reliable source of specimens, so alternate outpatient primary care sites have been recruited as specimen submitters.
• Specimen provider recruitment and submission criteria should be established so that specimens submitted for virologic surveillance are representative of the diversity of the population as a whole or of specific targeted population as needed. The collective group of selected specimen providers should cover all age groups.
• ILINet and other primary care health care providers may elect to test specimens using a point of care RIDT if one is available in their clinical setting. However, unscreened specimens are preferred for routine seasonal surveillance. If primary care submitters are using RIDT’s for diagnostic purposes, a random mix of specimens, irrespective of the test result, should be sent to the PHL for surveillance purposes. This provides a better assessment of true positivity in the community and reduces potential bias introduced by screening with tests that have variable sensitivity and may not detect novel or drifted viruses (i.e., give false negative result).8 Outside of influenza season, participating providers and clinical laboratories should submit all
SA
MP
LIN
G
IMPLEMENTATION GUIDANCE
Right Size Influenza Virologic Surveillance Roadmap 47
RIDT positives to the PHL, in addition to unscreened samples from a subset of ILI patients from ILINet or other outpatient providers. In a rare/novel influenza event investigation, oversampling screened positives may be appropriate if the tests used are high performing with demonstrated reliability for detection of the virus of interest.
RIDTdataandspecimenscontributetoInfluenzaSurveillanceThe Iowa statewide influenza surveillance program collects data on the number of RIDTs performed and the percentage positive each week using a survey monkey tool. Additionally, during times of low prevalence, laboratories submit rapid test positive specimens to the State Hygienic Laboratory (SHL) for confirmatory testing using the CDC’s real-time RT-PCR test panel. The RIDT survey data and the results of confirmatory testing are incorporated into the weekly influenza surveillance report compiled by the Iowa Department of Public Health. This report is widely distributed to public health officials, infection control practitioners, heath care providers and others to improve awareness about seasonal influenza activity and reliability of RIDT results.
• Provider compliance with specimen submission criteria may be enhanced by providing:
◦ Clear instructions and submission forms customized for their site,
◦ Cost-free specimen collection kits and shipping,
◦ Guidance for optimum specimen collection,
◦ Feedback and data to submitters, including influenza test results and/or aggregate results of testing for other respiratory pathogens if performed,
◦ No cost training,
◦ Certificates of recognition,
◦ RIDT kits to incentivize specimen submission.
B. Clinical laboratory providers (Tier 2) In addition to the ILI/primary care provider network, virologic surveillance should include specimens from hospital/clinical laboratories to ensure that a subset of specimens represent more severe illness (inpatients, mortality, unusual cases) and outbreak sources. Many clinical laboratories also serve as reference laboratories for outpatient satellite clinics, and therefore may be a good source of ILI specimens for routine surveillance. Clinical laboratories will also be essential partners when responding to large scale outbreaks or a pandemic. The influenza surveillance coordinator, in collaboration with the PHL, should develop and disseminate policies and establish mechanisms to ensure submission of a subset of positive specimens and all unsubtypable influenza positives (if subtyping assays are used) from hospital/clinical laboratories performing influenza testing. If clinical laboratories are the primary resource for surveillance specimens, the specimens sent to the PHL may be overly representative of hospitalized patients (i.e., more severe cases). This may be mitigated by selecting sites that can provide specimens from both emergency room and inpatient settings and providing clear guidance on numbers and types of specimens to be submitted. Specimens from clinical laboratories should include both influenza positive and negative samples when possible.
SA
MP
LING
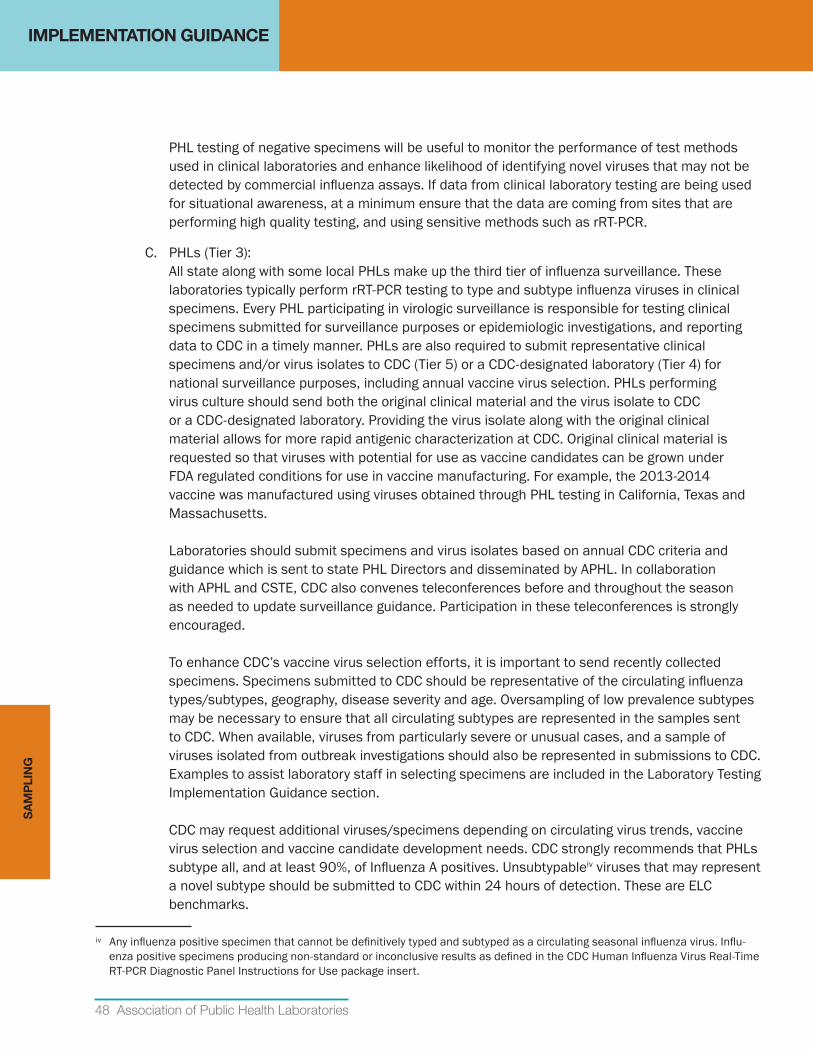
IMPLEMENTATION GUIDANCE
48 Association of Public Health Laboratories
PHL testing of negative specimens will be useful to monitor the performance of test methods used in clinical laboratories and enhance likelihood of identifying novel viruses that may not be detected by commercial influenza assays. If data from clinical laboratory testing are being used for situational awareness, at a minimum ensure that the data are coming from sites that are performing high quality testing, and using sensitive methods such as rRT-PCR.
C. PHLs (Tier 3): All state along with some local PHLs make up the third tier of influenza surveillance. These laboratories typically perform rRT-PCR testing to type and subtype influenza viruses in clinical specimens. Every PHL participating in virologic surveillance is responsible for testing clinical specimens submitted for surveillance purposes or epidemiologic investigations, and reporting data to CDC in a timely manner. PHLs are also required to submit representative clinical specimens and/or virus isolates to CDC (Tier 5) or a CDC-designated laboratory (Tier 4) for national surveillance purposes, including annual vaccine virus selection. PHLs performing virus culture should send both the original clinical material and the virus isolate to CDC or a CDC-designated laboratory. Providing the virus isolate along with the original clinical material allows for more rapid antigenic characterization at CDC. Original clinical material is requested so that viruses with potential for use as vaccine candidates can be grown under FDA regulated conditions for use in vaccine manufacturing. For example, the 2013-2014 vaccine was manufactured using viruses obtained through PHL testing in California, Texas and Massachusetts. Laboratories should submit specimens and virus isolates based on annual CDC criteria and guidance which is sent to state PHL Directors and disseminated by APHL. In collaboration with APHL and CSTE, CDC also convenes teleconferences before and throughout the season as needed to update surveillance guidance. Participation in these teleconferences is strongly encouraged. To enhance CDC’s vaccine virus selection efforts, it is important to send recently collected specimens. Specimens submitted to CDC should be representative of the circulating influenza types/subtypes, geography, disease severity and age. Oversampling of low prevalence subtypes may be necessary to ensure that all circulating subtypes are represented in the samples sent to CDC. When available, viruses from particularly severe or unusual cases, and a sample of viruses isolated from outbreak investigations should also be represented in submissions to CDC. Examples to assist laboratory staff in selecting specimens are included in the Laboratory Testing Implementation Guidance section. CDC may request additional viruses/specimens depending on circulating virus trends, vaccine virus selection and vaccine candidate development needs. CDC strongly recommends that PHLs subtype all, and at least 90%, of Influenza A positives. Unsubtypableiv viruses that may represent a novel subtype should be submitted to CDC within 24 hours of detection. These are ELC benchmarks.
iv Any influenza positive specimen that cannot be definitively typed and subtyped as a circulating seasonal influenza virus. Influ-enza positive specimens producing non-standard or inconclusive results as defined in the CDC Human Influenza Virus Real-Time RT-PCR Diagnostic Panel Instructions for Use package insert.
SA
MP
LIN
G
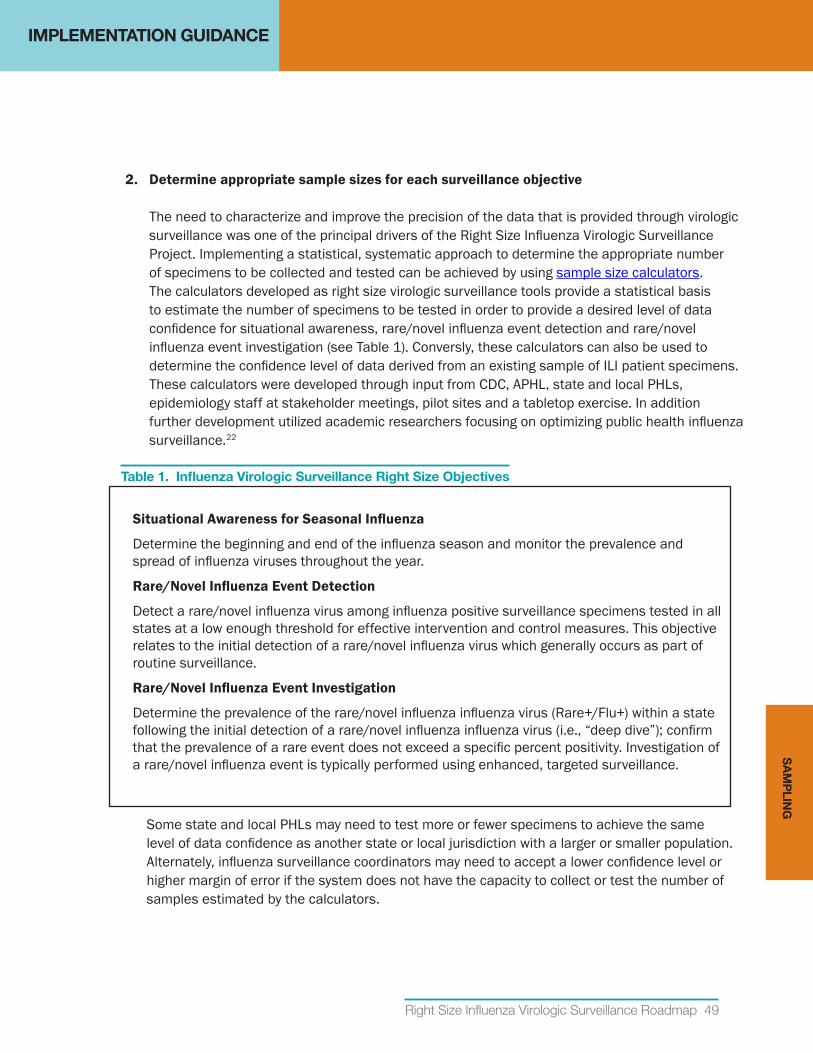
IMPLEMENTATION GUIDANCE
Right Size Influenza Virologic Surveillance Roadmap 49
2. Determineappropriatesamplesizesforeachsurveillanceobjective The need to characterize and improve the precision of the data that is provided through virologic surveillance was one of the principal drivers of the Right Size Influenza Virologic Surveillance Project. Implementing a statistical, systematic approach to determine the appropriate number of specimens to be collected and tested can be achieved by using sample size calculators. The calculators developed as right size virologic surveillance tools provide a statistical basis to estimate the number of specimens to be tested in order to provide a desired level of data confidence for situational awareness, rare/novel influenza event detection and rare/novel influenza event investigation (see Table 1). Conversly, these calculators can also be used to determine the confidence level of data derived from an existing sample of ILI patient specimens. These calculators were developed through input from CDC, APHL, state and local PHLs, epidemiology staff at stakeholder meetings, pilot sites and a tabletop exercise. In addition further development utilized academic researchers focusing on optimizing public health influenza surveillance.22
Table 1. Influenza Virologic Surveillance Right Size Objectives
SituationalAwarenessforSeasonalInfluenza
Determine the beginning and end of the influenza season and monitor the prevalence and spread of influenza viruses throughout the year.
Rare/NovelInfluenzaEventDetection
Detect a rare/novel influenza virus among influenza positive surveillance specimens tested in all states at a low enough threshold for effective intervention and control measures. This objective relates to the initial detection of a rare/novel influenza virus which generally occurs as part of routine surveillance.
Rare/NovelInfluenzaEventInvestigation
Determine the prevalence of the rare/novel influenza influenza virus (Rare+/Flu+) within a state following the initial detection of a rare/novel influenza influenza virus (i.e., “deep dive”); confirm that the prevalence of a rare event does not exceed a specific percent positivity. Investigation of a rare/novel influenza event is typically performed using enhanced, targeted surveillance.
Some state and local PHLs may need to test more or fewer specimens to achieve the same level of data confidence as another state or local jurisdiction with a larger or smaller population. Alternately, influenza surveillance coordinators may need to accept a lower confidence level or higher margin of error if the system does not have the capacity to collect or test the number of samples estimated by the calculators.
SA
MP
LING
IMPLEMENTATION GUIDANCE
50 Association of Public Health Laboratories
Efficiency can be achieved using a sampling strategy that, where possible, provides sufficient specimens to address multiple surveillance objectives. For example, situational awareness and rare/novel influenza event detection rely on samples collected and tested for routine surveillance. At CDC, routine antiviral resistance surveillance testing currently uses the same samples submitted and tested for vaccine strain selection. Where differences are important, they should be addressed by the sampling strategy. The sample size calculations are based on population size, desired level of confidence, margin of error and estimated or known prevalence or threshold for detection. More details on thresholds are provided in the Objectives: Thresholds and Representativeness section. State and local PHLs are encouraged to use sample size calculators or pre-calculated sample size tables (Appendix B) to achieve a more scientific, statistically based sample size that supports surveillance objectives. Sampling approaches should be established to prioritize collecting an adequate number of specimens for detection of rare/novel influenza events based on national thresholds, while at the same time providing sufficient number of representative specimens for overall situational awareness at the state level. For many states, the number of specimens to be tested during influenza season for each of these objectives is very similar. However, for smaller population states, the number of specimens necessary to achieve high confidence in situational awareness state level data will be much higher than the number of specimens needed to contribute to national rare/novel influenza event detection thresholds. Outside of influenza season, achieving a desired statistical confidence will not be possible in most states; therefore the focus of surveillance should shift to obtaining all specimens from clinical sites that have tested positive for influenza, or from patients with unusual respiratory illness, travel history or risk of exposure to animal-origin viruses. Targeted surveillance may be useful to answer specific questions, especially when conducting an investigation if a rare/novel influenza event or new virus is detected. Therefore the surveillance program should have the capability to establish targeted surveillance of specific populations when needed. CDC will provide guidance to state epidemiologists and PHLs on the specific risk factors and need for enhanced surveillance (e.g., highly pathogenic avian influenza H5N1 risk factors, swine exposure). However, the current version of the rare/novel influenza event investigation calculator may not be useful in these situations, future editions of the Roadmap are expected to provide more options for targeted surveillance, addressing intentional and unintentional bias.
A. Calculator Inputs and Outputs: The key variables in calculating sample size are described in Table 2. Understanding how these variables affect sample size and data confidence levels is important for generating valuable surveillance data.
SA
MP
LIN
G
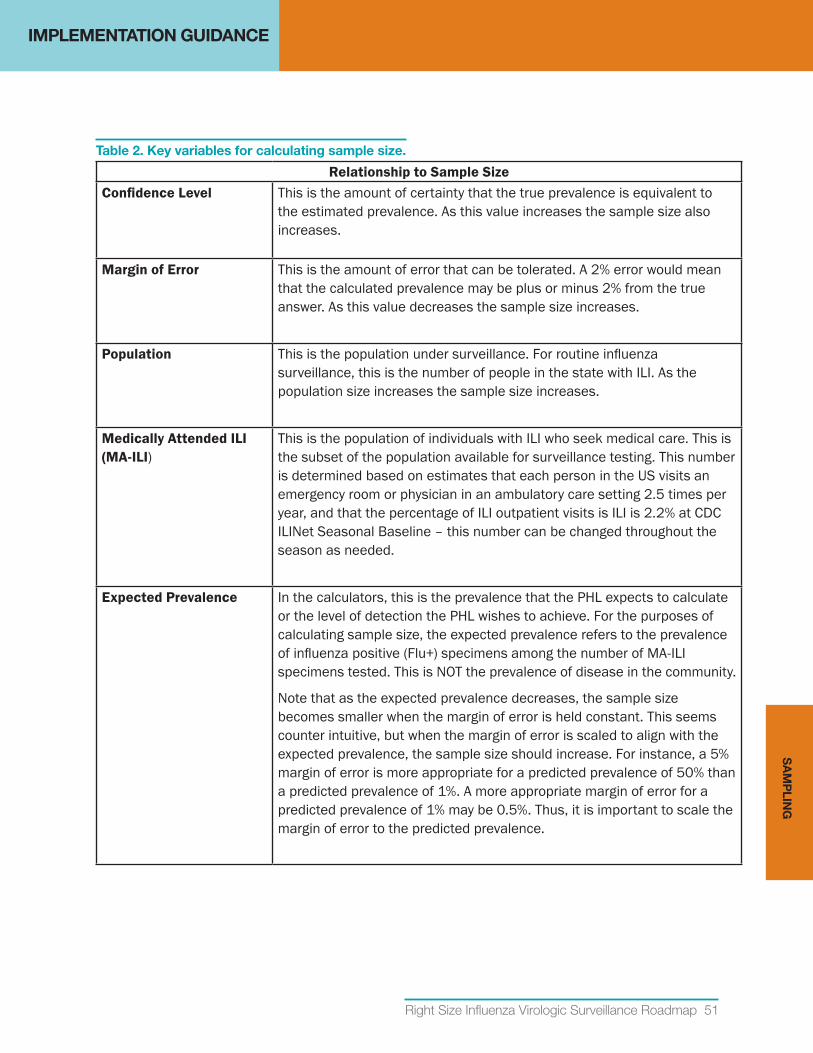
IMPLEMENTATION GUIDANCE
Right Size Influenza Virologic Surveillance Roadmap 51
Table 2. Key variables for calculating sample size.
Relationship to Sample SizeConfidenceLevel This is the amount of certainty that the true prevalence is equivalent to
the estimated prevalence. As this value increases the sample size also increases.
MarginofError This is the amount of error that can be tolerated. A 2% error would mean that the calculated prevalence may be plus or minus 2% from the true answer. As this value decreases the sample size increases.
Population This is the population under surveillance. For routine influenza surveillance, this is the number of people in the state with ILI. As the population size increases the sample size increases.
MedicallyAttendedILI(MA-ILI)
This is the population of individuals with ILI who seek medical care. This is the subset of the population available for surveillance testing. This number is determined based on estimates that each person in the US visits an emergency room or physician in an ambulatory care setting 2.5 times per year, and that the percentage of ILI outpatient visits is ILI is 2.2% at CDC ILINet Seasonal Baseline – this number can be changed throughout the season as needed.
Expected Prevalence In the calculators, this is the prevalence that the PHL expects to calculate or the level of detection the PHL wishes to achieve. For the purposes of calculating sample size, the expected prevalence refers to the prevalence of influenza positive (Flu+) specimens among the number of MA-ILI specimens tested. This is NOT the prevalence of disease in the community.
Note that as the expected prevalence decreases, the sample size becomes smaller when the margin of error is held constant. This seems counter intuitive, but when the margin of error is scaled to align with the expected prevalence, the sample size should increase. For instance, a 5% margin of error is more appropriate for a predicted prevalence of 50% than a predicted prevalence of 1%. A more appropriate margin of error for a predicted prevalence of 1% may be 0.5%. Thus, it is important to scale the margin of error to the predicted prevalence.
SA
MP
LING
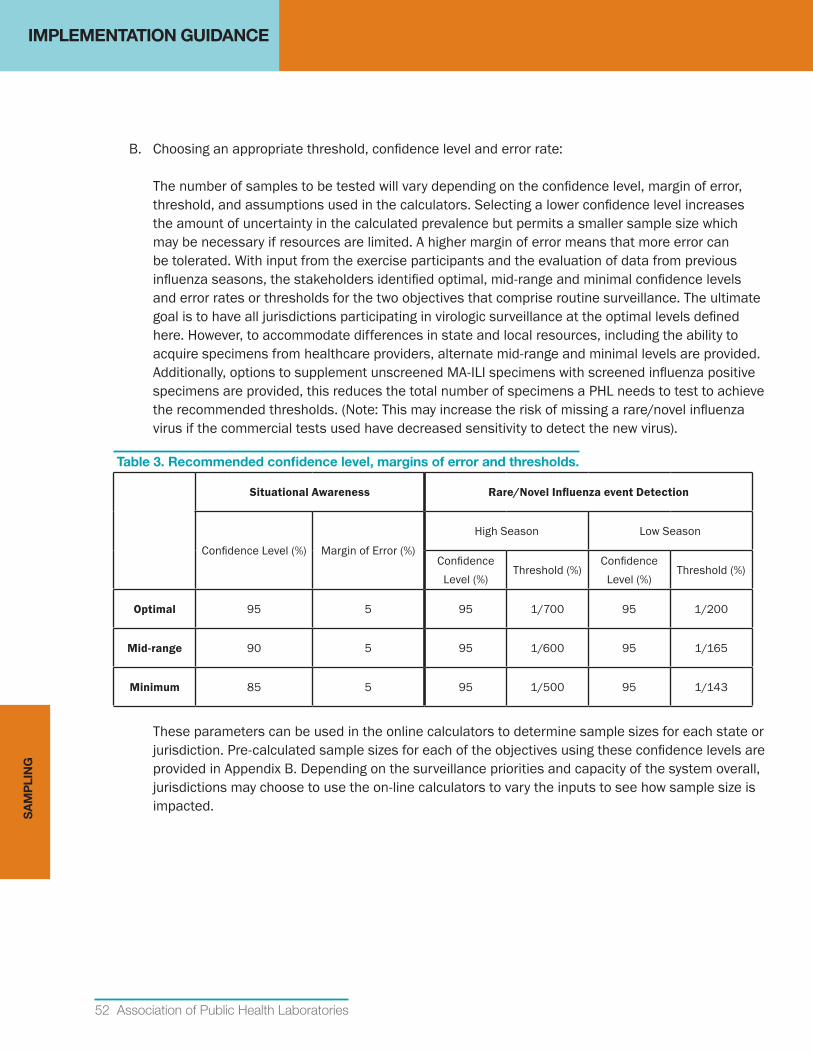
IMPLEMENTATION GUIDANCE
52 Association of Public Health Laboratories
B. Choosing an appropriate threshold, confidence level and error rate: The number of samples to be tested will vary depending on the confidence level, margin of error, threshold, and assumptions used in the calculators. Selecting a lower confidence level increases the amount of uncertainty in the calculated prevalence but permits a smaller sample size which may be necessary if resources are limited. A higher margin of error means that more error can be tolerated. With input from the exercise participants and the evaluation of data from previous influenza seasons, the stakeholders identified optimal, mid-range and minimal confidence levels and error rates or thresholds for the two objectives that comprise routine surveillance. The ultimate goal is to have all jurisdictions participating in virologic surveillance at the optimal levels defined here. However, to accommodate differences in state and local resources, including the ability to acquire specimens from healthcare providers, alternate mid-range and minimal levels are provided. Additionally, options to supplement unscreened MA-ILI specimens with screened influenza positive specimens are provided, this reduces the total number of specimens a PHL needs to test to achieve the recommended thresholds. (Note: This may increase the risk of missing a rare/novel influenza virus if the commercial tests used have decreased sensitivity to detect the new virus).
Table 3. Recommended confidence level, margins of error and thresholds.
Situational Awareness Rare/NovelInfluenzaeventDetection
Confidence Level (%) Margin of Error (%)
High Season Low Season
Confidence Level (%)
Threshold (%)Confidence
Level (%)Threshold (%)
Optimal 95 5 95 1/700 95 1/200
Mid-range 90 5 95 1/600 95 1/165
Minimum 85 5 95 1/500 95 1/143
These parameters can be used in the online calculators to determine sample sizes for each state or jurisdiction. Pre-calculated sample sizes for each of the objectives using these confidence levels are provided in Appendix B. Depending on the surveillance priorities and capacity of the system overall, jurisdictions may choose to use the on-line calculators to vary the inputs to see how sample size is impacted.
SA
MP
LIN
G
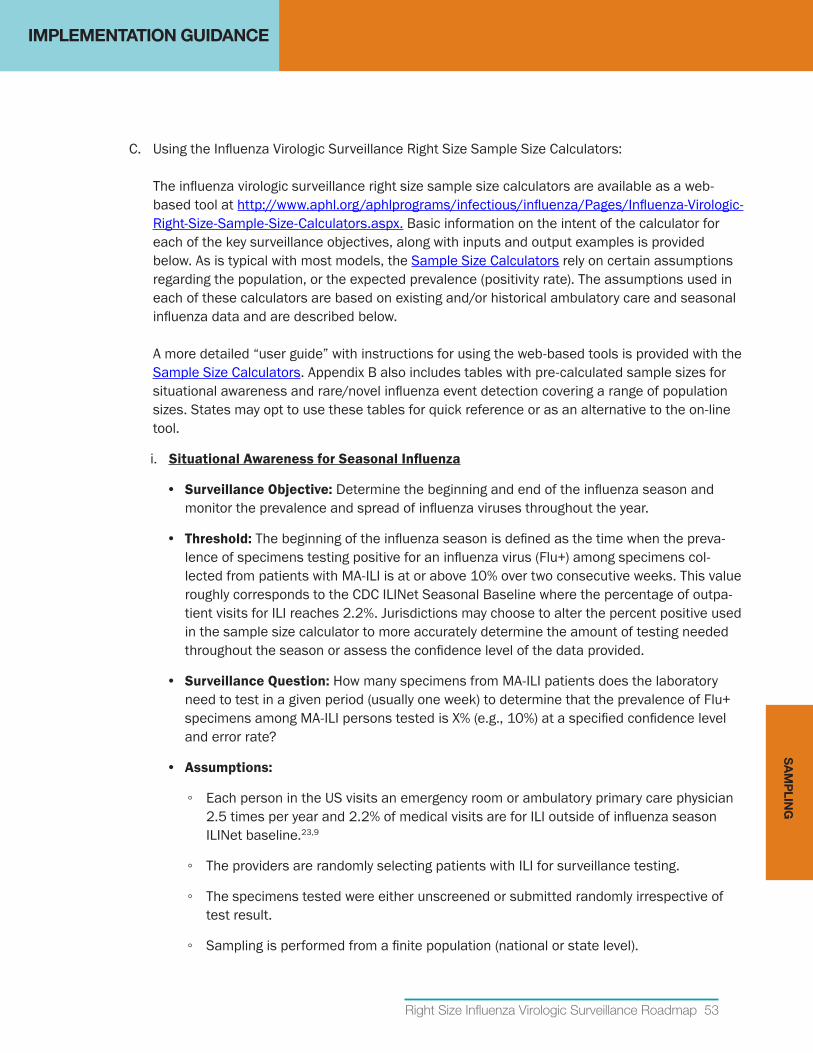
IMPLEMENTATION GUIDANCE
Right Size Influenza Virologic Surveillance Roadmap 53
C. Using the Influenza Virologic Surveillance Right Size Sample Size Calculators: The influenza virologic surveillance right size sample size calculators are available as a web-based tool at http://www.aphl.org/aphlprograms/infectious/influenza/Pages/Influenza-Virologic-Right-Size-Sample-Size-Calculators.aspx. Basic information on the intent of the calculator for each of the key surveillance objectives, along with inputs and output examples is provided below. As is typical with most models, the Sample Size Calculators rely on certain assumptions regarding the population, or the expected prevalence (positivity rate). The assumptions used in each of these calculators are based on existing and/or historical ambulatory care and seasonal influenza data and are described below. A more detailed “user guide” with instructions for using the web-based tools is provided with the Sample Size Calculators. Appendix B also includes tables with pre-calculated sample sizes for situational awareness and rare/novel influenza event detection covering a range of population sizes. States may opt to use these tables for quick reference or as an alternative to the on-line tool.
i. SituationalAwarenessforSeasonalInfluenza
• Surveillance Objective: Determine the beginning and end of the influenza season and monitor the prevalence and spread of influenza viruses throughout the year.
• Threshold: The beginning of the influenza season is defined as the time when the preva-lence of specimens testing positive for an influenza virus (Flu+) among specimens col-lected from patients with MA-ILI is at or above 10% over two consecutive weeks. This value roughly corresponds to the CDC ILINet Seasonal Baseline where the percentage of outpa-tient visits for ILI reaches 2.2%. Jurisdictions may choose to alter the percent positive used in the sample size calculator to more accurately determine the amount of testing needed throughout the season or assess the confidence level of the data provided.
• Surveillance Question: How many specimens from MA-ILI patients does the laboratory need to test in a given period (usually one week) to determine that the prevalence of Flu+ specimens among MA-ILI persons tested is X% (e.g., 10%) at a specified confidence level and error rate?
• Assumptions:
◦ Each person in the US visits an emergency room or ambulatory primary care physician 2.5 times per year and 2.2% of medical visits are for ILI outside of influenza season ILINet baseline.23,9
◦ The providers are randomly selecting patients with ILI for surveillance testing.
◦ The specimens tested were either unscreened or submitted randomly irrespective of test result.
◦ Sampling is performed from a finite population (national or state level).
SA
MP
LING
IMPLEMENTATION GUIDANCE
54 Association of Public Health Laboratories
Figure 5. Screen shot of Situational Awareness sample size calculator demonstrating user inputs.
• UserInputs(Figure5):
◦ Total population: The input is the total population under surveillance (e.g., state population). The calculator uses this number and the assumptions above to estimate the number of MA-ILI cases.
◦ EstimatedprevalenceofMA-ILI: Input based on ILINet data during the season. The default is 2.2%, which is the estimated ILINet seasonal baseline for the percentage of outpatient visits that are for ILI.
◦ ExpectedprevalenceofFlu+/MA-ILI: Input the surveillance target. The default value is 10% for the beginning and end of the influenza season. Other percent positive values may be used based on jurisdictional preferences or seasonal variability in the prevalence of ILI or influenza.
SA
MP
LIN
G
IMPLEMENTATION GUIDANCE
Right Size Influenza Virologic Surveillance Roadmap 55
◦ Confidencelevel: The optimal level of for situational awareness is 95%, the minimum should be no less than 85%.
◦ Marginoferror: An acceptable margin of error should be no greater than 5%.
• Output example: A sample size of 135 unscreened MA-ILI specimens is needed in order to be 95% confident that the true prevalence of Flu+/MA-ILI is 10% (+/- 5%).
• Alternate calculation (sample power): Determine the level of confidence and margin of error associated with the measured prevalence of influenza positives, given the sample size tested, i.e., what are the confidence and error rates associated with current sample size?
• Alternate Output example: If 100 MA-ILI specimens were tested and the estimated prevalence is 10%, the PHL can be 70 % (+/- 3%) confident that the true prevalence is 10%.
ii. DetectingaRare/NovelInfluenzaEvent
• Surveillance Objective: Detect a rare/novel influenza virus among influenza positive surveillance specimens tested in all states at a low enough threshold for effective intervention and control measures. This objective relates to the initial detection of a rare/novel influenza virus which generally occurs as part of routine surveillance. Investigation of a novel event after initial detection (the “deep-dive”) is a separate objective and is discussed in more detail below.
• National Threshold: Different thresholds have been established for the high season (influenza positivity > 20%), and low season (influenza positivity < 20%). These thresholds represent achievable levels of detection based on review of virologic surveillance data from several recent influenza seasons.
◦ High Season: 0.14% (1/700); one rare/novel influenza virus among 700 influenza virus positive specimens aggregated at the national surveillance level over a defined period. During influenza season sample sizes should be calculated based on weekly reporting to FluView. A minimum threshold of 0.2% (1/500) may be used for determining the sample size in states with limited testing capacity. Application of a less sensitive threshold for detection (e.g., below 1/500) would mean that more rare/novel influenza viruses are circulating prior to detection and would impair disease prevention and control efforts.
◦ Low season: 0.5% (1/200); one rare/novel influenzal virus among 200 influenza virus positive specimens aggregated at the national surveillance level over a defined period. This approximates the prevalence at which the H1N1pdm2009 influenza virus was detected in April 2009. A minimum threshold of 0.6% (1/143) may be used for determining the sample size in states with limited testing capacity.
SA
MP
LING
IMPLEMENTATION GUIDANCE
56 Association of Public Health Laboratories
• Surveillance Question: How many specimens does the PHL need to test to allow the national surveillance system to detect a novel virus at 0.14% prevalence with 95% confidence (aggregating testing data from all states)?
• Assumptions:
◦ Specimens are collected randomly.
◦ There is no correction for finite population size – this is a conservative assumption to prevent undersampling. Correcting for finite sample size requires accurately characterizing the surveillance population. In the case of a rare/novel influenza event, the size of the relevant population may be largely unknown. The sample size determined without correcting for a finite population size is always correct. If a sample size correction factor is improperly applied, the target population will be undersampled, resulting in an overestimate of the confidence level and underestimate of the error.
• Options: The rare/novel influenza event detection sample size calculation can be made based on a) the number of positives already identified as Flu+ by an RIDT or clinical laboratory or by the PHL, b) the number of MA-ILI specimens, or c) a combination of both. Although testing screened Flu+ specimens decreases the total number of specimens needed to meet the recommended threshold and confidence level, using only specimens that are screened Flu+ may reduce the sensitivity of the system to detect rare/novel influenza events because of the unknown sensitivity of commercial systems to detect novel or drifted viruses. Using a combination of Flu+ and MA-ILI specimens will moderate the potential loss in sensitivity, and allow PHLs with large populations to achieve statistical confidence with reasonable specimen numbers.
SA
MP
LIN
G
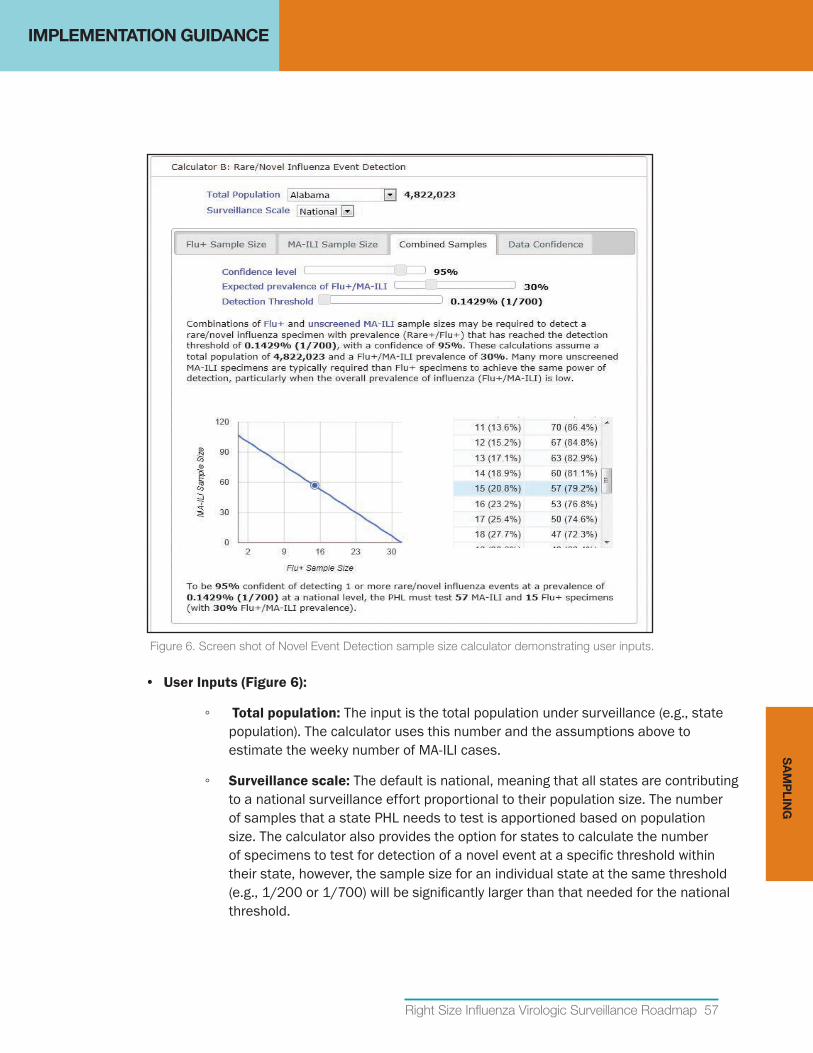
IMPLEMENTATION GUIDANCE
Right Size Influenza Virologic Surveillance Roadmap 57
Figure 6. Screen shot of Novel Event Detection sample size calculator demonstrating user inputs.
• UserInputs(Figure6):
◦ Total population: The input is the total population under surveillance (e.g., state population). The calculator uses this number and the assumptions above to estimate the weeky number of MA-ILI cases.
◦ Surveillance scale: The default is national, meaning that all states are contributing to a national surveillance effort proportional to their population size. The number of samples that a state PHL needs to test is apportioned based on population size. The calculator also provides the option for states to calculate the number of specimens to test for detection of a novel event at a specific threshold within their state, however, the sample size for an individual state at the same threshold (e.g., 1/200 or 1/700) will be significantly larger than that needed for the national threshold.
SA
MP
LING
IMPLEMENTATION GUIDANCE
58 Association of Public Health Laboratories
◦ Confidencelevel: The optimal level of confidence for rare/novel influenza event detection is 95%.
◦ ExpectedprevalenceofFlu+/MA-ILI: This is an input when calculating the number of MA-ILI specimens needed, or the number of combined MA-ILI and Flu+ specimens. Use 10% positivity for seasonal baseline, and other percent positivity as needed throughout the year to reflect low or high season, or actual percent positivity. Pre-calculated sample size tables in Appendix B use 10% for low season and 30% for high season.
◦ Detection threshold: (Applicable for Rare/Novel Influenza Event Calculator, Combined Samples tab) The input is the desired detection prevalence of a rare influenza type among all influenza positive cases.
• Output examples:
◦ NumberofFlu+specimens:To be 95% confident of detecting 1 or more rare/novel influenza events at a prevalence of 1/700 at a national level, the PHL must test 32 Flu+ specimens.
◦ NumberofMA-ILIspecimens: To be 95% confident of detecting 1 or more rare/novel influenza events at a prevalence of 1/700 at a national level, the PHL must test 107 MA-ILI specimens.
◦ CombinednumberofFlu+andMA-ILIspecimens:To be 95% confident of detecting 1 or more rare/novel influenza events at a prevalence of 1/700 at a national level, the PHL must test 57 MA-ILI and 15 Flu+ specimens (using an estimated 80% MA-ILI and 20% Flu+ specimen type combination and 30% Flu+/MA-ILI prevalence).
◦ CombinednumberofFlu+andMA-ILIspecimens(statelevel):To be 95% confident of detecting 1 or more rare/novel influenza events at a prevalence of 1/700 (within the population under surveillance), the PHL must test 3809 MA-ILI and 952 Flu+ specimens (using an estimated 80% MA-ILI and 20% Flu+ specimen type combination and 30% Flu+/MA-ILI prevalence).
• Alternate calculation (sample power): Determine the level of confidence that a rare/novel influenza event can be detected at a given threshold, given the sample size tested.
◦ User Input: the number of Flu+ specimens tested and the number of MA-ILI specimens tested.
• Alternate output: If the laboratory tested 11 Flu+ and 26 MA-ILI specimens and estimated prevalence of Flu+/MA-ILI is 30%, the PHL can be 82% confident that the rare/novel influenza virus would be detected at a prevalence of 1/700.
iii. Detecting/MonitoringAntiviralresistance
• Surveillance Objective: Detect antiviral resistance virus among influenza positive surveillance specimens tested in all states at a low enough threshold for effective intervention and control measures.
SA
MP
LIN
G
IMPLEMENTATION GUIDANCE
Right Size Influenza Virologic Surveillance Roadmap 59
• National Threshold: 5% prevalence of oseltamivir resistant viruses among positive specimens for each influenza A subtype or influenza B at the national level.
• Surveillance Question: How many of each influenza A subtype Flu+ or influenza B Flu+ specimens need to be tested for antiviral resistance to allow the national surveillance system to detect antiviral resistant viruses at or below a 5% prevalence with 95% confidence (aggregating testing data from all states)?
• Assumptions used in the calculator:
◦ Specimens are collected randomly.
◦ There is no correction for finite population size – this is a conservative assumption to prevent undersampling. Correcting for finite sample size requires accurately characterizing the surveillance population. In the case of a rare/novel influenza event, the size of the relevant population may be largely unknown. The sample size determined without correcting for a finite population size is always correct. If a sample size correction factor is improperly applied, the target population will be undersampled, resulting in an overestimate of the confidence level and underestimate of the error.
• UserInputs:The Flu+ tab of the rare/novel influenza event detection calculator can be used to determine sample size for this objective.
◦ Total population: The input is the total population under surveillance (e.g., state population).
◦ Surveillance scale: The default is national, representing the number of specimens that need to be tested by the state to detect antiviral resistance at a national aggregated threshold. The number of samples the state needs to test is apportioned based on population size. States wishing to calculate the number of specimens to test for detection of antiviral resistance at a specific threshold within their state can select their state, note that the sample size of an individual state will be significantly larger than that needed for the national threshold.
◦ Confidencelevel: The optimal level of confidence for antiviral resistance is 95%, the minimum should be no less than 85%.
• Output example:
◦ Number of Flu+ specimens: To be 95% confident of detecting antiviral resistant Influenza A H1N1pdm2009 viruses at a prevalence of 5% among influenza A H1N1pdm2009 positive specimens tested at the national level, the PHL must test or submit for antiviral resistance testing 1 Influenza A(H1N1) Flu+ specimens per week.
SA
MP
LING
IMPLEMENTATION GUIDANCE
60 Association of Public Health Laboratories
• Alternate calculation (sample power): Determine the level of confidence that antiviral resistant viruses can be detected at a given threshold, given the sample size tested.
◦ UserInput: The number of each influenza A subtype or influenza B Flu+ specimens tested, and the expected Flu+/MA-ILI specimens tested.
• Alternate output: If the CDC receives and tests 21 influenza A H1N1pdm2009 positive specimens, the national surveillance system can be 66% confident that antiviral resistant H1N1pdm2009 viruses would be detected at a prevalence of 5%.
iv. Rare/NovelInfluenzaEventInvestigation
• Surveillance Objective: Determine the prevalence of the rare/novel influenza virus (Rare+/Flu+) within a state following the initial detection of a rare/novel influenza virus (i.e., “deep dive”); confirm that the prevalence of a rare/novel influenza event does not exceed a specific percent positivity. Investigation of a rare/novel influenza event is typically performed using enhanced, targeted surveillance.
• Threshold: There are no defined thresholds for rare/novel influenza event investigation, as specific situations and jurisdictional considerations may warrant different thresholds. Generally, investigations are undertaken to determine how much more of the rare/novel influenza virus is present in the community and identify source(s) of the new virus (i.e., animal-human, human-human). In general, if the rare/novel influenza event was detected at 1/700, the investigation threshold should be between 1-5%.
• Surveillance Question: Once a rare/novel influenza virus is detected, how many ILI specimens does the PHL need to test to determine that the true prevalence does not exceed a specified percent of Flu+ within the state or in the specific jurisdiction under investigation?
• Assumptions:
◦ Specimens are collected randomly. This is an assumption used in the calculator; however, in many rare/novel influenza event investigations targeted surveillance is applied based on the situation and appropriate epidemiologic criteria. Targeted surveillance intentionally biases the sample. Future iterations of the calculator will allow users to address bias in calculating sample sizes.
SA
MP
LIN
G
IMPLEMENTATION GUIDANCE
Right Size Influenza Virologic Surveillance Roadmap 61
◦ There is no correction for finite population size – this is a conservative assumption to prevent under sampling. Correcting for finite sample size requires accurately characterizing the surveillance population. In the case of a rare/novel influenza event investigation, the size of the relevant population may be largely unknown. The sample size determined without correcting for a finite population size is always correct. If a sample size correction factor is improperly applied, the target population will be under-sampled, resulting in an overestimate of the confidence level and underestimate of the error.
◦ This calculator would be most relevant in a 2009 H1N1-like event, where the at-risk population group is unknown and a significant public health investigation for cases has been initiated. This assumption, however, results in very high sample sizes. This calculator may not be appropriate when targeted surveillance is a more efficient initial approach, such as the 2012 H3N2v summer surveillance scenario targeting visitors to state/county fairs.
◦ Asymmetrical distribution.
SA
MP
LING
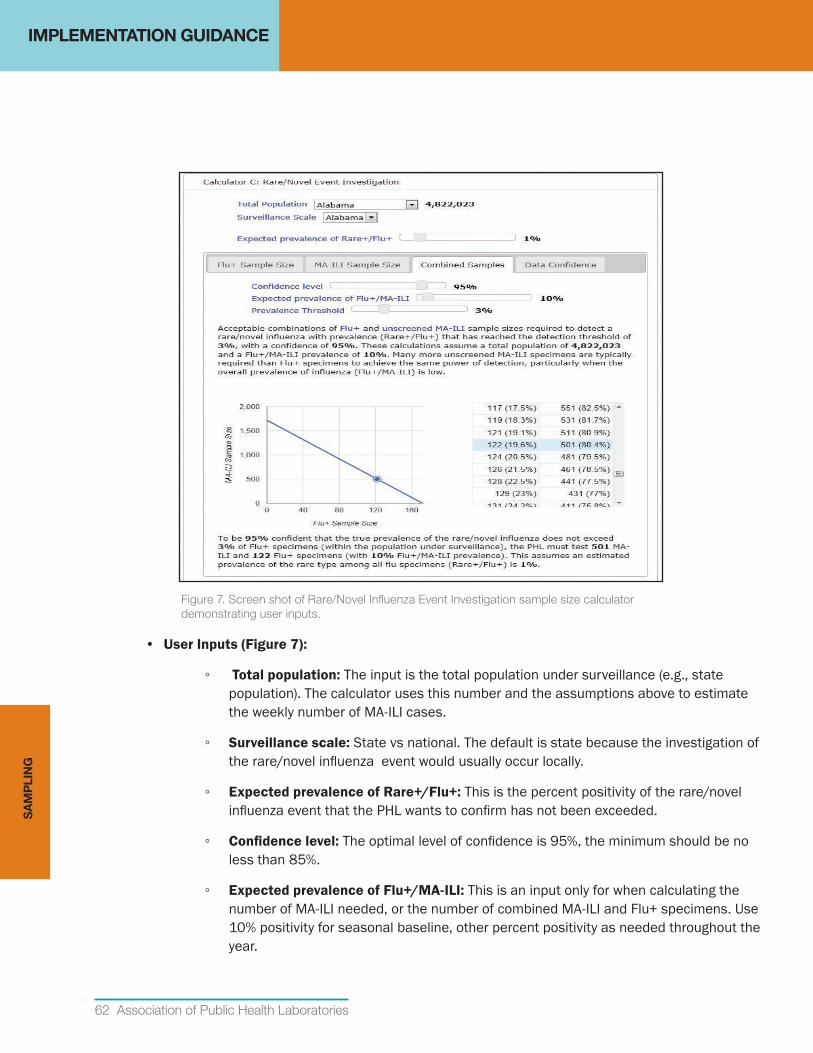
IMPLEMENTATION GUIDANCE
62 Association of Public Health Laboratories
Figure 7. Screen shot of Rare/Novel Influenza Event Investigation sample size calculator demonstrating user inputs.
• UserInputs(Figure7):
◦ Total population: The input is the total population under surveillance (e.g., state population). The calculator uses this number and the assumptions above to estimate the weekly number of MA-ILI cases.
◦ Surveillance scale: State vs national. The default is state because the investigation of the rare/novel influenza event would usually occur locally.
◦ ExpectedprevalenceofRare+/Flu+:This is the percent positivity of the rare/novel influenza event that the PHL wants to confirm has not been exceeded.
◦ Confidencelevel: The optimal level of confidence is 95%, the minimum should be no less than 85%.
◦ ExpectedprevalenceofFlu+/MA-ILI: This is an input only for when calculating the number of MA-ILI needed, or the number of combined MA-ILI and Flu+ specimens. Use 10% positivity for seasonal baseline, other percent positivity as needed throughout the year.
SA
MP
LIN
G
IMPLEMENTATION GUIDANCE
Right Size Influenza Virologic Surveillance Roadmap 63
◦ Prevalence threshold: (Applicable for Rare/Novel Influenza Event Investigation Calculator, Combined Samples tab) This is an input for the prevalence of the rare/novel influenza type which is expected to be established with a specified level of confidence.
• Output examples:
◦ NumberofFlu+specimens: To be 95% confident that the actual prevalence of the rare/novel influenza virus does not exceed 1% (+/- 2%) of Flu+ specimens, the PHL must test 173 Flu+ specimens.
◦ NumberofMA-ILIspecimens: To be 95% confident that the actual prevalence of the rare/novel influenza virus does not exceed 1% (+/- 2%) of Flu+ specimens, the PHL must test 1721 MA-ILI specimens.
◦ CombinednumberofFlu+andMA-ILIspecimens: To be 95% confident that the true prevalence of the rare/novel influenza virus does not exceed 1% (+/- 2%) of Flu+ specimens (within the population under surveillance), the PHL must test 501 MA-ILI and 122 Flu+ specimens (using an estimated 80% MA-ILI and 20% Flu+ specimen type combination and 10% Flu+/MA-ILI prevalence).
• Alternate calculation: Determine the level of confidence given the sample size tested.
• Alternate output: If a combination of 75 Flu+ specimens and 300 unscreened MA-ILI specimens were tested, and the estimated prevalence of the rare/novel influenza virus among all influenza positive specimens (Rare+/Flu+) is 1%, the PHL can be 75% confident that the true prevalence does not exceed 2.04 (+/-1%). (This assumes that 10% of MA-ILI patients are Flu+).
3. Establishpolicyforfrequencyofsubmissions
A. Primary Care and clinical laboratory specimen submissions to PHL The frequency of specimen submission for routine surveillance will vary depending on jurisdictional needs, and PHL capacity for specimen intake and processing. During influenza season it may be most convenient to ask providers to send specimens from the first few ILI patients they see each week. If the PHL prefers to receive specimens throughout the week, each provider may be asked to collect and send specimens on a different day. Specimens/viruses need to be submitted and tested in real time, not batched, in order to inform timely clinical management guidelines and ensure rapid detection of novel viruses. If specimens are being sent to the PHL for diagnostic testing (e.g., patient with high risk travel history, or unusual case presentation), these specimens should be transported promptly and not batched with surveillance specimens. Clinical laboratories that perform PCR testing with subtyping should immediately submit any specimens that produce unsubtypable test results to the PHL. Clinical laboratories should be notified of the most recent epidemiologic criteria for a potential rare/novel influenza event.
SA
MP
LING
IMPLEMENTATION GUIDANCE
64 Association of Public Health Laboratories
B. PHL Submission to CDC or a CDC-Designated Laboratory PHLS should submit specimens/viruses for routine surveillance year-round based on annual CDC criteria and guidance provided to state PHL Directors and disseminated by APHL. Routine surveillance specimens should be forwarded to CDC or a CDC-designated laboratory in a timely manner to provide real-time surveillance information. Ship routine surveillance specimens at least once every two weeks, this ensures that CDC can perform further characterization in time to guide international and domestic annual vaccine virus selection. Unsubtypable specimens, as defined in the RT-PCR package insert, require immediate action as they may reflect a novel virus with pandemic potential. These specimens are to be sent immediately to CDC for more comprehensive testing to ensure that appropriate interventions can be implemented if needed, and that CDC meets WHO international health regulationsv for novel virus reporting.24
4. Ensuresamplesareofacceptablequality Influenza surveillance coordinators and PHLs should provide instructions and training to specimen submitters to ensure that respiratory specimens are of high quality, properly collected, stored and transported.
A. Specimen collection Respiratory tract specimens required for influenza diagnosis and identification are well-defined and include nasopharyngeal swabs and throat swabs, submitted separately or combined, nasopharyngeal aspirates, nasal washes, bronchoalveolar lavages, tracheal aspirates, bronchial washes and, following autopsy, respiratory tract tissues. The most appropriate specimen to collect depends upon the diagnostic test employed. This information will be provided by the test or reagent manufacturer and the laboratory performing the test. Additional resources can be found in clinical microbiology textbooks, and at the CDC website www.cdc.gov/flu/professionals/diagnosis/index.htm. Diagnostic test results are only as good as the quality of the specimen. Specimen quality depends on proper collection technique and the amount of virus present at the source. The amount of virus shed in the upper respiratory tract declines over the course of the illness; therefore collecting specimens as close to symptom onset as possible is recommended. Optimally, specimens for virologic surveillance should be collected within 24-72 hours of symptom onset and no later than 5 days post onset of symptoms. Specimen providers need to be trained in proper collection technique. It is ultimately the responsibility of the laboratory to ensure that specimens are properly collected. Descriptions of proper methods for specimen collection can be found in clinical textbooks, in product inserts and online. The most effective method, however, is demonstration by someone skilled in the
v IHR Regulations: http://www.who.int/ihr/en/. State Parties to the IHR (2005) are required to immediately notify WHO of any laboratory confirmed case of a recent human infection caused by an influenza A virus with the potential to cause a pandemic. An influenza A virus is considered to have the potential to cause a pandemic if the virus has demonstrated the capacity to infect a human and if the hemagglutinin gene (or protein) is not a variant or mutated form of those, i.e., A/H1 or A/H3, circulating widely in the human population.
SA
MP
LIN
G
IMPLEMENTATION GUIDANCE
Right Size Influenza Virologic Surveillance Roadmap 65
collection technique, followed by practice under observation. The Joint Commission Strategies for Improving Rapid Influenza Testing in Ambulatory Settings (SIRAS) website www.jointcommission.org/siras.aspx offers two free on-line courses, one for health care providers in ambulatory settings and one for specimen collectors.
B. Specimen Handling Specimen quality also depends on proper handling of the specimen after collection. The laboratory, in coordination with the influenza surveillance coordinator, is responsible for providing information on proper specimen handling to specimen providers. Specimens should be placed immediately into an acceptable viral transport medium in accordance with standard testing protocols or kit manufacturer recommendations and held at 2-8°C until testing is performed. Testing ideally should be performed as soon as possible. If a delay of more than 72 hours until specimens are tested is anticipated, specimens can be frozen at -70ºC. However multiple freezing and thawing of specimens can adversely affect the test result and should be avoided whenever possible. Virus isolates and nucleic acid extracts also require special handling.
5. Establish and support specimen transport systems Specimen transport is another critical component of influenza virologic surveillance. Specimen integrity must be maintained during transit. An effective and efficient process for specimen submission must account for the reliable and timely transport of specimens from clinical sites (providers) and clinical laboratories to the PHL and from the PHL to CDC or CDC-designated laboratories. Specimen transport must compy with US Department of Transportation and International Air Transport Association (IATA) regulations to ensure that specimens and infectious materials are properly packaged and safely shipped.25,26 Timely and efficient transport of specimens is often quite costly, and must be adequately funded by the public health system for effective surveillance. Specimen collection and regulation compliant transport supplies, as well as courier/carrier costs, need to be covered. Providers and clinical laboratories should not be expected to assume these costs for routine surveillance testing. In-state commercial couriers, healthcare system couriers, PHL-provided couriers or national carriers can be employed to transport specimens to the PHL. Redundancy in transport options is important to cover disruption of any particular method of transport and to provide maximum daily service. An interstate carrier is most often used for transport to CDC or the CDC-designated laboratories. In special circumstances, direct shipment from the health care provider or clinical laboratory to the CDC may be warranted; however, this should be facilitated by the PHL to ensure proper handling and state epidemiologist engagement if case investigation is needed.
SA
MP
LING
IMPLEMENTATION GUIDANCE
66 Association of Public Health Laboratories
6. Recognize and Address Sampling Biases The influenza virologic surveillance system contains inherent biases due to the complexity of the sampling system and the use of different test methods in the different tiers (Appendix A). Sources of bias should be considered and addressed if possible when selecting specimen providers, selecting test methods, analyzing data and interpreting results.
A. Specimen providers: Specimen providers should represent the entire population under surveillance. Choose a mix of primary care health care providers representing all age groups (pediatrics, family practice, internal medicine and geriatrics). Specimen providers should be selected representing areas of diverse population density (urban, suburban, and rural).
B. Unscreened vs. screened specimens: Efforts should be made to limit sampling of screened (influenza positive) specimens. As previously discussed, unscreened specimens are preferred. If submitters are using RIDT’s for diagnostic purposes, a random mix of positive and negative specimens, irrespective of RIDT results, should be submitted to the PHL for surveillance purposes.7 At a minimum, data should differentiate screened from unscreened specimens. If screened specimens from clinical laboratories are the primary source of surveillance specimens, these may be overly representative of hospitalized patients (i.e., bias to severe cases). Data may not be representative of true prevalence of virus subtypes in the community. This may be mitigated by selecting sites that can provide specimens from both emergency room and inpatient settings and providing clear guidance on numbers and types of specimens to be submitted.
SA
MP
LIN
G
INFLUENZA VIROLOGIC SURVEILLANCE RIGHT SIZE ROADMAP
Right Size Influenza Virologic Surveillance Roadmap 67
Laboratory Testing
Laboratory testing requires staff with expertise in the methods performed, adequate space with appropriate biosafety controls, well-maintained equipment, appropriate testing reagents and supplies, and reliable results reporting mechanisms. Essential equipment, materials, and reagents necessary to perform influenza virologic surveillance are listed in Appendix C: Laboratory Methods.
Influenza virologic testing methods are classified in the roadmap based on a stakeholder assessment of requirements that should be maintained and available at all PHLs involved in influenza surveillance (primary testing); or as additional influenza surveillance laboratory capabilities that may be maintained based on state and/or jurisdictional needs or provided through a shared services model. The laboratory must ensure quality for all influenza testing methodologies performed.
Primary Testing MethodPHLs performing virologic surveillance are expected to utilize molecular methods, such as real-time reverse transcriptase PCR (rRT-PCR), as the primary testing method for influenza detection and subtyping. This is an ELC benchmark. During rRT-PCR test processes, viral RNA is extracted from patient specimens, transcribed into DNA and then amplified. The product of the test reaction is detected in “real time” using labeled probes. Real-time RT-PCR can rapidly identify influenza A and B, distinguish influenza A subtypes, and offers the best performance characteristics (i.e., sensitivity, specificity) of all currently available testing methods. CDC, through the Influenza Reagent Resource (IRR), manufacturers and distributes the CDC Human Influenza Virus Real-Time RT-PCR Diagnostic Panel (CDC Flu rRT-PCR Dx Panel) to all state and qualified local PHLs engaged in influenza surveillance testing to ensure widespread use of a nationally standardized protocol. The CDC also has the capability to rapidly adapt the assay to detect newly emerging viruses. The CDC Flu rRT-PCR Dx Panel is distributed under FDA special controls. The special controls require that all users of the diagnostic device be trained to perform and interpret the results by a competent instructor prior to use and that CDC limit distribution to only those users who have successfully completed a training course provided or approved by CDC.
If the PHL decides not to use the CDC Flu rRT-PCR Dx Panel for influenza surveillance testing but instead chooses an alternative molecular influenza testing methodology or platform, the PHL must ensure that the manufacturer of the assay monitors and updates assay performance as circulating viruses change over time and that the assay being utilized within the laboratory has been optimized to identify all currently circulating influenza viruses.
Influenza testing algorithms should be adopted in order to optimize testing efficiency and throughput. Laboratories should choose an algorithm that best fits their laboratory test flow, and surveillance needs as the influenza prevalence changes throughout the year, and ensures judicious use of CDC provided reagents. Algorithms should be continually reviewed by PHLs throughout the influenza season to ensure that the most efficient algorithm is being utilized. The direct material cost to CDC for each IVD CDC Human Influenza Virus Real-Time RT-PCR Diagnostic Panel, including Influenza A/B typing and subtyping reagents, enzymes, extraction kits and plastics, is approximately $14,000 (i.e., $20 for each specimen tested by the PHLs).
LA
BO
RA
TOR
Y TE
STIN
G
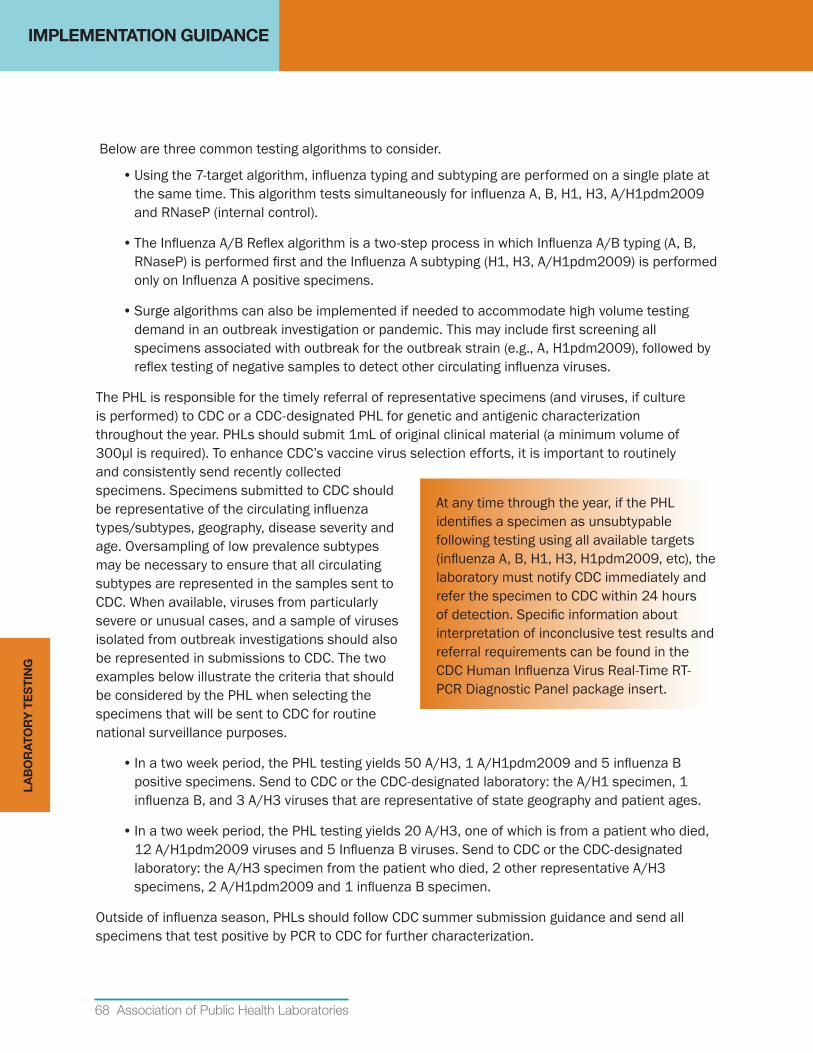
IMPLEMENTATION GUIDANCE
68 Association of Public Health Laboratories
Below are three common testing algorithms to consider.
• Using the 7-target algorithm, influenza typing and subtyping are performed on a single plate at the same time. This algorithm tests simultaneously for influenza A, B, H1, H3, A/H1pdm2009 and RNaseP (internal control).
• The Influenza A/B Reflex algorithm is a two-step process in which Influenza A/B typing (A, B, RNaseP) is performed first and the Influenza A subtyping (H1, H3, A/H1pdm2009) is performed only on Influenza A positive specimens.
• Surge algorithms can also be implemented if needed to accommodate high volume testing demand in an outbreak investigation or pandemic. This may include first screening all specimens associated with outbreak for the outbreak strain (e.g., A, H1pdm2009), followed by reflex testing of negative samples to detect other circulating influenza viruses.
The PHL is responsible for the timely referral of representative specimens (and viruses, if culture is performed) to CDC or a CDC-designated PHL for genetic and antigenic characterization throughout the year. PHLs should submit 1mL of original clinical material (a minimum volume of 300µl is required). To enhance CDC’s vaccine virus selection efforts, it is important to routinely and consistently send recently collected specimens. Specimens submitted to CDC should be representative of the circulating influenza types/subtypes, geography, disease severity and age. Oversampling of low prevalence subtypes may be necessary to ensure that all circulating subtypes are represented in the samples sent to CDC. When available, viruses from particularly severe or unusual cases, and a sample of viruses isolated from outbreak investigations should also be represented in submissions to CDC. The two examples below illustrate the criteria that should be considered by the PHL when selecting the specimens that will be sent to CDC for routine national surveillance purposes.
• In a two week period, the PHL testing yields 50 A/H3, 1 A/H1pdm2009 and 5 influenza B positive specimens. Send to CDC or the CDC-designated laboratory: the A/H1 specimen, 1 influenza B, and 3 A/H3 viruses that are representative of state geography and patient ages.
• In a two week period, the PHL testing yields 20 A/H3, one of which is from a patient who died, 12 A/H1pdm2009 viruses and 5 Influenza B viruses. Send to CDC or the CDC-designated laboratory: the A/H3 specimen from the patient who died, 2 other representative A/H3 specimens, 2 A/H1pdm2009 and 1 influenza B specimen.
Outside of influenza season, PHLs should follow CDC summer submission guidance and send all specimens that test positive by PCR to CDC for further characterization.
At any time through the year, if the PHL identifies a specimen as unsubtypable following testing using all available targets (influenza A, B, H1, H3, H1pdm2009, etc), the laboratory must notify CDC immediately and refer the specimen to CDC within 24 hours of detection. Specific information about interpretation of inconclusive test results and referral requirements can be found in the CDC Human Influenza Virus Real-Time RT-PCR Diagnostic Panel package insert.
LA
BO
RA
TOR
Y T
ES
TIN
G
IMPLEMENTATION GUIDANCE
Right Size Influenza Virologic Surveillance Roadmap 69
IMPORTANTREPORTINGANDREFERRALREQUIREMENT: At any time through the year, if the PHL identifies a specimen as unsubtypable following testing using all available targets (influenza A, B, H1, H3, H1pdm2009, etc), the laboratory must notify CDC immediately and refer the specimen to CDC within 24 hours of detection. Specific information about interpretation of inconclusive test results and referral requirements can be found in the CDC Human Influenza Virus Real-Time RT-PCR Diagnostic Panel package insert.
To ensure national and state coordination on virologic surveillance priorities, “Influenza Seasonal Kick off Teleconferences” are convened for PHLs, influenza coordinators, and state epidemiologists in the early fall each year. The main purpose of the teleconferences is to provide a situational update and surveillance guidance for the upcoming season, including expectations for submission of specimens to CDC. The guidance will identify how many specimens to submit throughout the season, where to submit the specimens, and the specimen submission form.
Additional Testing MethodsAdditional testing methods include influenza virus culture, antiviral resistance testing, influenza hemagglutination inhibition (HAI), immunofluorescence testing, and serology. The methodology recommendations presented here focus specifically on advantages and disadvantages for influenza and may not apply to other virus assays. Each testing methodology listed has many advantages and disadvantages that will factor into jurisdictional test methodology decisions. Some of the advantages or disadvantages listed here are more applicable to national surveillance needs, but are included to help inform jurisdictional decisions.
• InfluenzaVirusCulture PHLs are encouraged to perform virus culture if they can sustain the appropriate level of staff expertise and the necessary resources. When PHLs submit virus isolates along with clinical material to CDC or the CDC-designated PHL, this improves the efficiency of the antigenic characterization process at CDC, so that information regarding influenza vaccine match or virus drift can be disseminated back to PHLs more quickly. At minimum this capability must be maintained at CDC, and at a subset of state PHLs. PHLs that do not have the capability or resources to perform high quality virus culture using consensus protocols may opt to utilize a shared services model instead, relying on the CDC or state PHLs that have been designated by CDC as national surveillance laboratories to provide virus culture.
Advantages of Maintaining or Implementing Influenza Virus Culture:PHL:
◦ Provides isolates for validation and verification of new or modified assays, and troubleshooting investigations.
◦ Provides a back-up method to PCR.
◦ Detects other respiratory viruses if additional cell lines are used.
◦ Provides viruses required for phenotypic antiviral resistance testing.
LA
BO
RA
TOR
Y TE
STIN
G
IMPLEMENTATION GUIDANCE
70 Association of Public Health Laboratories
CDC:
◦ Provides isolates for validation and verification of new or modified assays, and troubleshooting investigations.
◦ Provides viruses required for phenotypic and antigenic characterization. These are critical components of surveillance for vaccine virus strain selection, and development of the annual WHO kit distributed to domestic and international laboratories.
◦ Provides viruses that can be used to develop vaccine candidates.
Disadvantages of Influenza Virus Culture: ◦ Less rapid and sensitive than rRT-PCR and is not efficient in times of surge.
◦ Requires specialized expertise and capability to maintain high quality cell lines.
◦ Variable growth characteristics and sensitivity with influenza strains in different cell lines.
Minimal Implementation Considerations: ◦ Utilize standard reference methods such as those described in the “WHO Manual for the
Laboratory Diagnosis and Virological Surveillance of Influenza”.27
◦ Ensure sustainable expertise. Each laboratory must have a training plan in place for virus isolation methods and troubleshooting.
◦ Establish a backup plan for times when commercially available cells are not available.
◦ Perform an accurate cost analysis. Identify sustainable sources of funding.
• AntiviralResistanceTesting(Pyrosequencing,NeuraminidaseInhibition) Definitive antiviral resistance testing requires both phenotypic resistance testing of the virus using a neuraminidase inhibition (NAI) assay, and detection of genetic markers of drug resistance by pyrosequencing and/or sequencing. Both of these test methods are performed at CDC. Pyrosequencing is also performed at a subset of PHLs; this provides a cost-effective and efficient approach to expand antiviral resistance surveillance, providing data that can be used to inform patient management and treatment recommendations at the regional and national level.
Advantages of Maintaining or Implementing Pyrosequencing: PHL and CDC:
◦ Detects established and potential genetic markers of resistance.
◦ Provides more rapid turn-around-time than NAI which requires propagated virus for testing.
Disadvantages of Pyrosequencing: ◦ Requires multiple assays to detect different genetic markers for each influenza subtype
(e.g., H275Y is the marker for only A/H1pdm 2009).
LA
BO
RA
TOR
Y T
ES
TIN
G
IMPLEMENTATION GUIDANCE
Right Size Influenza Virologic Surveillance Roadmap 71
◦ Requires supplemental testing by NAI for definitive confirmation of antiviral resistance.
◦ Requires specialized expertise to perform and interpret results.
◦ Requires specialized equipment and expensive reagents.
◦ Requires periodic revalidation of assays due to frequent genetic changes.
◦ Requires knowledge of molecular markers of resistance which may not be available for a novel virus and new NAIs.
Advantages of Maintaining or Implementing NAI:PHL and CDC:
◦ Detects resistance that is not caused by previously identified genetic markers of resistance.
◦ Detects resistance in novel viruses for which genetic markers of resistance are unknown.
◦ Detects resistance to a new NAI drug for which genetic markers of resistance are unknown.
Disadvantages of NAI: ◦ Requires specialized expertise to perform and interpret results.
◦ Requires specialized equipment and expensive reagents.
◦ Requires special formulations of antiviral drugs (e.g., oseltamivir carboxylate) not available outside of drug manufacturer.
Minimal Implementation Considerations: ◦ Perform an accurate cost analysis. Identify sustainable sources of funding.
◦ Laboratory must have the capability to:
□ Interpret and report test results appropriately for either virologic surveillance, or patient management.
□ Report all results to CDC in a timely manner for inclusion in national antiviral resistance surveillance data.
□ Revalidate assays when mutations occur or changes to the protocols are made.
□ Perform virus isolation if using NAI assay.
□ Submit all influenza viruses positive for any resistance marker to CDC in a timely manner for confirmatory testing.
LA
BO
RA
TOR
Y TE
STIN
G
IMPLEMENTATION GUIDANCE
72 Association of Public Health Laboratories
• Respiratory Pathogen Assays Molecular testing for other respiratory viruses, such as commercially available RVP assays or laboratory developed tests (LDTs), have become common in many clinical laboratories and are increasingly used in PHLs to provide jurisdictional and national information about other circulating respiratory pathogens. These data can aid in identifying other agents that cause influenza like community illnesses or outbreaks and provide reassurance that surveillance is not “missing” influenza during periods when influenza activity is low but other influenza like illnesses are prevalent.
Advantages of Maintaining or Implementing Molecular Respiratory Pathogen Assays:PHL:
◦ Provides data on circulating respiratory viruses that can be used for state, regional or national (NREVSS) surveillance or outbreak investigations.
◦ Provides a more rapid, sensitive and specific alternative to respiratory virus culture.
◦ Provides influenza surveillance partners with additional information about circulating viruses that may cause ILI, this may also help to incentivize partners to consistently contribute to flu surveillance.
Disadvantages of Respiratory Pathogen Assays: ◦ Cost.
◦ Variable sensitivity and specificity across pathogens and commercial assays.
◦ May lose sensitivity overtime, especially for influenza, due to changes in the viruses.
Minimal Implementation Considerations: ◦ Perform an accurate cost analysis. Identify sustainable sources of funding.
◦ Determine how respiratory pathogen data will be used to supplement influenza surveillance data and/or diagnostic testing.
• InfluenzaHemagglutinationInhibitionTest Influenza hemagglutination inhibition (HI or HAI) test performed at CDC, using strain specific ferret antisera, remains a test of choice for antigenic characterization to monitor changes in circulating influenza viruses and inform influenza vaccine virus selection. HAI testing using the WHO kit reagents that are provided by CDC to the PHLs can be used to detect and identify influenza viruses, but not for monitoring antigenic drift of influenza viruses.
Advantages for Maintaining or Implementing Influenza HAI test:PHL:
◦ Identifies influenza type, influenza A subtype, and influenza B lineage using the Influenza WHO kit reagents provided by CDC.
◦ Facilitates and helps to ensure more efficient detection of antigenic variants.
LA
BO
RA
TOR
Y T
ES
TIN
G
IMPLEMENTATION GUIDANCE
Right Size Influenza Virologic Surveillance Roadmap 73
CDC:
◦ Provides information on antigenic changes that may impact vaccine effectiveness, these data are critical to inform annual vaccine virus selection.
Disadvantages of Influenza HAI test: ◦ Requires significant expertise and specialized reagents (e.g., turkey red blood cells).
◦ Requires virus culture.
◦ Time consuming.
◦ Influenza type and subtype can more rapidly be determined in PHLs using rRT-PCR.
Minimal Implementation Considerations: ◦ Laboratory must have the capability to:
□ Interpret and report test results appropriately for virologic surveillance.
□ Perform virus isolation.
□ Obtain red blood cells from appropriate species (e.g., turkey).
◦ Perform an accurate cost analysis. Identify sustainable sources of funding.
• InfluenzaSerologictesting Serologic testing is neither a surveillance nor rapid diagnostic testing tool but is currently used primarily by CDC and academic institutions for vaccine effectiveness studies, annual vaccine strain selection, research purposes or retrospective seroprevalence studies. Serologic testing to detect influenza virus antibodies may be performed using a variety of methods, including hemagglutination inhibition, enzyme-linked immunosorbent assay and microneutralization.
Advantages of Maintaining or Implementing Influenza Serologic Testing:PHL and CDC:
◦ Provides serology data to inform virologic strain selection.
◦ Provides serological diagnosis and retrospective seroprevalence data.
Disadvantages of Influenza Serologic Testing: ◦ Requires capability to implement assay as a laboratory-developed test, there are no FDA
cleared methods for influenza serology.
◦ Requires both a high level of expertise and specialized reagents.
◦ Interpreting results is difficult and patient serologic responses may be cross-reactive.
LA
BO
RA
TOR
Y TE
STIN
G
IMPLEMENTATION GUIDANCE
74 Association of Public Health Laboratories
Minimal Implementation Considerations: ◦ Perform an accurate cost analysis. Identify sustainable sources of funding.
◦ Maintain staff with capability to interpret serologic test results in the context of surveillance.
• DirectSpecimenImmunofluorescence Direct specimen immunofluorescence using direct fluourescent antibody (DFA) testing methods involve testing clinical material taken directly from the patient. These cell preparations are tested using fluorescent-labeled antibodies, which are visible when examined using an immunofluorescence microscope. DFA is primarily a diagnostic tool.
Advantages of Maintaining and Implementing DFA:PHL:
◦ Provides the ability to produce results within an hour of specimen receipt.
Disadvantages of DFA: ◦ Requires specialized expertise and fluorescent microscopes.
◦ Results are subjective and dependent on the individual reader’s expertise.
◦ Not as accurate as rRT-PCR.
◦ Sensitivity and specificity of reagents may vary in response to current strains.
Minimal Implementation Considerations: ◦ Assess the necessity of maintaining this as a diagnostic tool.
◦ Perform an accurate cost analysis, identify sustainable sources of funding.
• RIDTs Currently available RIDTs for the detection of influenza viruses employ a variety of methods, including enzyme-linked immunosorbent assays, immunochromatographic lateral flow immunoassays, and membrane-based immunoassays. In addition to differences in methodologies, these tests also have varying requirements for specimen collection and handling.
Advantages of Maintaining and Implementing RIDTs:PHL:
◦ Produce rapid results for patient care, often within fifteen to thirty minutes.
◦ Have widespread commercial availability.
◦ Require minimal training, can be performed in non-laboratory settings.
LA
BO
RA
TOR
Y T
ES
TIN
G
IMPLEMENTATION GUIDANCE
Right Size Influenza Virologic Surveillance Roadmap 75
Disadvantages of RIDTs: ◦ Significantly less sensitive and
specific than rRT-PCR assays.
◦ Potentially less reliable when new virus strains emerge.
Minimal Implementation Considerations: ◦ Determine how RIDT data will be used
to supplement influenza surveillance data and/or diagnostic testing.
◦ Establish policies for reflex/confirmatory testing.
◦ Perform an accurate cost analysis. Identify sustainable sources of funding.
ConsiderationsforMaintainingorImplementingInfluenzaTestingMethodologies In addition to considering the advantages and disadvantages of the various test methods, below is a set of questions that can be used as a decision tool in deliberations among the laboratory director, senior infectious disease laboratory staff, epidemiologists, influenza surveillance coordinator, and clinical laboratory partners.
1. Which influenza tests are most important to maintain?
2. For what purpose is the influenza test(s) needed?
3. How will the test results contribute to in-fluenza virologic surveillance data within the state?
4. How is the influenza test methodology in question currently funded? Is this funding mecha-nism sustainable?
5. Is there an expectation, either through official policy or relations with the local clinical com-munity, that the laboratory maintain capacity to perform some or all of the “additional” influenza tests?
PerformanceAccuracyofRIDT’sRIDTs may be used to help with diagnostic and treatment decisions for patients in clini-cal settings, such as whether to prescribe antiviral medications. However, due to the limited sensitivities and predictive values of RIDTs, negative results of RIDTs do not exclude influenza virus infection and influ-enza should still be considered in a patient if clinical suspicion is high based upon history, signs, symptoms and clinical examination.31
Reported sensitivities of RIDTs range from 10-80% compared to viral culture or rRT-PCR. Specificities of RIDTs are approximately 90-95% (range 85-100%). RIDT users whould be especially aware of the potential limita-tions of these tests to detect novel influenza viruses.8,32
rRT-PCR to confirm results of an RIDT are recommended when:
• patient tests negative by RIDT when community influenza activity is high and laboratory confirmation of influenza is desired.
• patient tests positive by RIDT, the community prevalence of influenza is low and a false positive result is a consideration.
• patient has had recent close exposure to pigs or poultry or other animals and novel influenza A virus infection is possible.
LA
BO
RA
TOR
Y TE
STIN
G
IMPLEMENTATION GUIDANCE
76 Association of Public Health Laboratories
6. If yes, what are the reasons for this expectation? For example, is there a perceived need to maintain “traditional methods” in the PHL as the capability to perform culture and HAI de-clines in the clinical laboratory sector?
7. Is the necessary expertise available in the PHL and is it sustainable? Does the laboratory have an experienced microbiologist/virologist that understands the basic virology, epidemi-ology, pathogenesis of influenza and other respiratory pathogens to enable test result and surveillance data interpretation, and surveillance capability decisions?
8. Does to laboratory have access to and utilize appropriate consensus protocols and testing materials (e.g., MDCK cell lines, antiviral drugs, monoclonal fluorescent antibodies)?
9. If an influenza test method, such as culture, is eliminated, do decision makers understand that implementing testing on an as needed basis would be extremely difficult due to loss of expertise, length of time needed to acquire testing supplies, and time to perform CLIA required validation studies?
10. Is the influenza methodology that is deemed necessary available from another source, such as CDC, a PHL shared services site, or a hospital/academic laboratory? What are the con-cerns with and road blocks to accessing alternate sources of testing?
11. Do the resources (funding, staffing, supply costs) needed to maintain the additional test methods adversely impact the capacity to perform rRT-PCR and test the number of speci-mens necessary for routine surveillance, or other essential laboratory functions?
12. If the IRR was unable to continue providing either some (i.e., ancillary) or all the reagents needed for rRT-PCR, how would this affect the decision to maintain “additional” testing meth-ods?
13. Does the laboratory meet the minimal considerations listed for each test method that will be implemented or maintained?
LA
BO
RA
TOR
Y T
ES
TIN
G
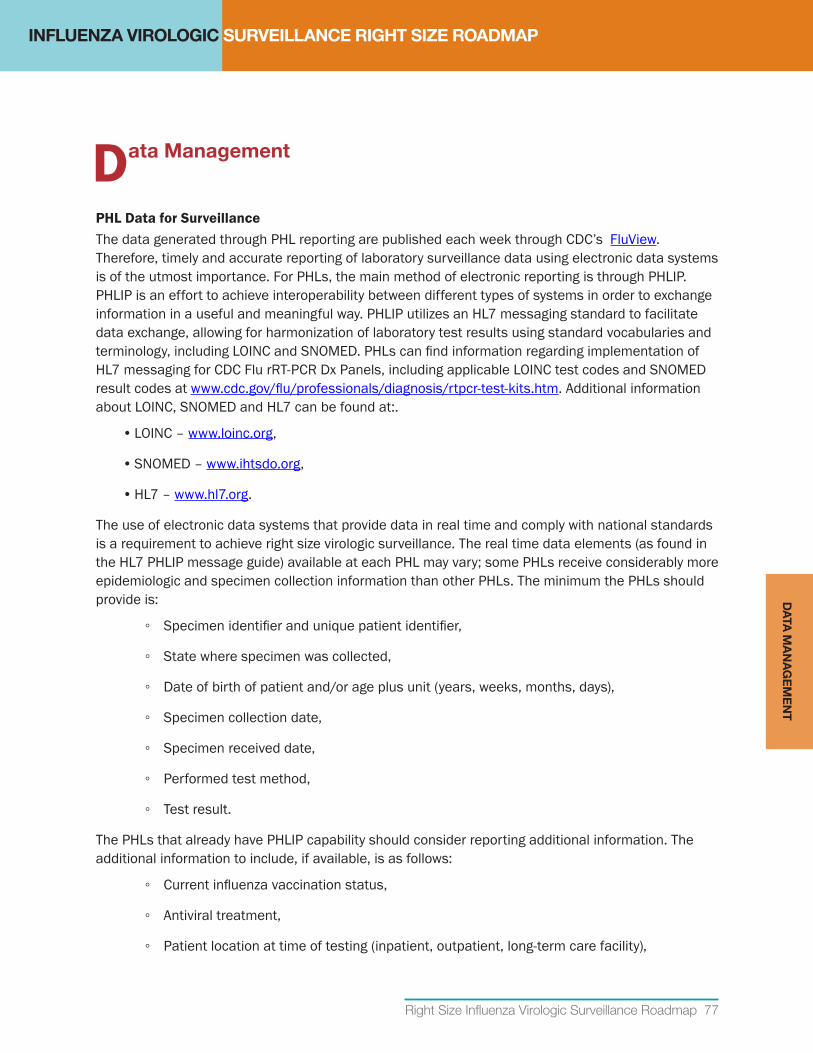
INFLUENZA VIROLOGIC SURVEILLANCE RIGHT SIZE ROADMAP
Right Size Influenza Virologic Surveillance Roadmap 77
Data Management
PHLDataforSurveillanceThe data generated through PHL reporting are published each week through CDC’s FluView. Therefore, timely and accurate reporting of laboratory surveillance data using electronic data systems is of the utmost importance. For PHLs, the main method of electronic reporting is through PHLIP. PHLIP is an effort to achieve interoperability between different types of systems in order to exchange information in a useful and meaningful way. PHLIP utilizes an HL7 messaging standard to facilitate data exchange, allowing for harmonization of laboratory test results using standard vocabularies and terminology, including LOINC and SNOMED. PHLs can find information regarding implementation of HL7 messaging for CDC Flu rRT-PCR Dx Panels, including applicable LOINC test codes and SNOMED result codes at www.cdc.gov/flu/professionals/diagnosis/rtpcr-test-kits.htm. Additional information about LOINC, SNOMED and HL7 can be found at:.
• LOINC – www.loinc.org,
• SNOMED – www.ihtsdo.org,
• HL7 – www.hl7.org.
The use of electronic data systems that provide data in real time and comply with national standards is a requirement to achieve right size virologic surveillance. The real time data elements (as found in the HL7 PHLIP message guide) available at each PHL may vary; some PHLs receive considerably more epidemiologic and specimen collection information than other PHLs. The minimum the PHLs should provide is:
◦ Specimen identifier and unique patient identifier,
◦ State where specimen was collected,
◦ Date of birth of patient and/or age plus unit (years, weeks, months, days),
◦ Specimen collection date,
◦ Specimen received date,
◦ Performed test method,
◦ Test result.
The PHLs that already have PHLIP capability should consider reporting additional information. The additional information to include, if available, is as follows:
◦ Current influenza vaccination status,
◦ Antiviral treatment,
◦ Patient location at time of testing (inpatient, outpatient, long-term care facility),
DA
TA M
AN
AG
EM
EN
T
IMPLEMENTATION GUIDANCE
78 Association of Public Health Laboratories
◦ Travel information,
◦ Patient death information,
◦ Additional geographic information (e.g.,county, city, zip),
◦ Whether specimen was related to an outbreak,
◦ Whether specimen was sent to CDC and if so, ID included with CDC specimen,
◦ Date of illness onset.
APHL’s Informatics Program has a Technical Assistance Team available to assist PHLs with PHLIP implementation. The Technical Assistance Team provides tools and human resources to assist PHLs, public health agencies, and other data exchange partners in understanding, navigating and accomplishing the task of sending electronic data using simple, effective, standards-based methods. For more information about the Technical Assistant Team, visit the APHL Informatics website and refer to frequently asked questions about technical assistance teams.
Non-PHLDataforSurveillanceAs resources for PHL testing decrease, the value of alternate data sources becomes increasingly important. State or local public health departments and laboratories are encouraged to explore options to collect and incorporate influenza testing data from non-PHL sources. The supplemental data can help increase the confidence in the surveillance data within the state. This data could include rapid influenza diagnostic testing (RIDT) data and/or data from clinical and commercial laboratories within a jurisdiction. A number of other sources of virologic surveillance data may be available to augment both state and national surveillance. Data from these sites may be transmitted electronically as specimen level records or in aggregate by a simpler method. Regardless of whether specimen level or aggregate data is received, necessary data elements include:
• Date or week of specimen collection, receipt or test
• Total number of tests performed and influenza positives by:
◦ Type,
◦ Subtype (if available),
◦ Age group.
PotentialAlternatesourcesoflocal,stateandnationalvirologicsurveillancedatainclude:• Clinical sites including RIDT sites and clinical laboratories. A number of epidemiologists and
influenza coordinators have initiated laboratory test reporting from selected facilities in their states. These data back are used by the influenza coordinators to monitor influenza activity. Providing the supplemental surveillance data to clinicians is a useful resource to guide patient management decisions.
DA
TA M
AN
AG
EM
EN
T
IMPLEMENTATION GUIDANCE
Right Size Influenza Virologic Surveillance Roadmap 79
• Commercial laboratories. A significant number of non-hospital laboratory testing is performed by a small number of commercial laboratories (e.g., Quest Diagnostics, LabCorp, ARUP Laboratories, and Mayo Medical Laboratories). Surveillance programs could obtain data from these laboratories on specimens tested from within their jurisdiction.
• Electronic Laboratory Reporting (ELR) for Meaningful Use. As part of the Affordable Care Act and related activities, inpatient and outpatient healthcare facilities have been provided monetary incentives to implement electronic health records. Along with these incentives, facilities are required to report notifiable diseases, syndromic surveillance, and vaccine registry data using automated electronic messaging standards (e.g., HL7, LOINC, SNOMED). For states that have required reporting of influenza laboratory results, health departments may be able to use these electronic messages to augment virologic surveillance.
AlternatedatasourcesforCDCtosupplementnationalsurveillancedata:• Commercial laboratories. A significant number of non-hospital laboratory tests are performed
by a small number of commercial laboratories (e.g., Quest Diagnostics, LabCorp, ARUP Laboratories, and Mayo Medical Laboratories). These laboratories provide a significant amount of influenza testing for hospitals, and physician offices around the country.
• Federally Qualified Health Centers (FQHCs). As of 2010, over 1,100 of these clinics operate under the supervision of the Health Resources and Services Administration (HRSA) to provide care to the medically underserved.28 With the Affordable Care Act (ACA), the numbers and patient volumes are anticipated to increase.
• Department of Veterans’ Affairs (VA). There are 1,766 VA facilities29, although influenza laboratory testing is only available at a subset of these.
• Department of Defense (DoD). Data available from DoD includes virologic data collected among military personnel around the globe and laboratory test information from military and non-military facilities that care for military dependents, notably through TriCare Insurance.
• Centers for Medicare and Medicaid Services (CMS). Since 2009, data on influenza testing has been made available on a more real-time basis utilizing the CMS reimbursement exchange data repository.
• Vendors of Electronic Health Records (EHR) and Laboratory Information Management Systems (LIMS). Vendors and large users of EHRs and LIMS may be a source of influenza testing information. Examples of these include GE Healthcare, Cerner, Sunquest, HCA, and others.
• Diagnostic Device Manufacturers. An increasing trend in diagnostic testing is the use of mobile communications from test devices to cloud-based web services to allow ease of access of information to patients, doctors, and insurers. This capability also allows automated messaging of de-identified results from influenza test devices to a cloud where public health entities can access the information for monitoring influenza in their jurisdictions.
DA
TA M
AN
AG
EM
EN
T
IMPLEMENTATION GUIDANCE
80 Association of Public Health Laboratories
ConsiderationsforDataManagement1. Are you currently utilizing PHLIP to report influenza virologic surveillance to CDC? If not, have
you contacted APHL or CDC to start the process?
2. If currently utilizing PHLIP, what data elements are being sent? Have you explored incorporating additional information fields listed above?
3. Have you identified the potential sources of bias in your virologic surveillance data? What changes could be made in your system to reduce the impact of bias?
4. Does your influenza surveillance system incorporate virologic data from healthcare providers utilizing RIDTs? If yes, how is this data collected from rapid test sites? Do you collect both the number positive and the total number tested (denominator data)? Is the data collected currently reflected within your jurisdictional surveillance data?
5. Does your influenza surveillance system incorporate virologic data from clinical/commericial laboratories? If yes, how is this data collected from the laboratories? Are the number positive and the total number tested collected (denominator data)?
6. How stable and reliable is the data received? How often is data from alternate sources received (e.g., clinical, commercial, physician office laboratories)?
7. If no alternate data is collected and incorporated into your surveillance data, would it be possible to collect the data in the future?
8. What are the challenges to collecting alternate data?
9. What is the plan for incorporating new data sources into your influenza surveillance data?
10. What resources are required to collect non-public health laboratory testing data?
DA
TA M
AN
AG
EM
EN
T
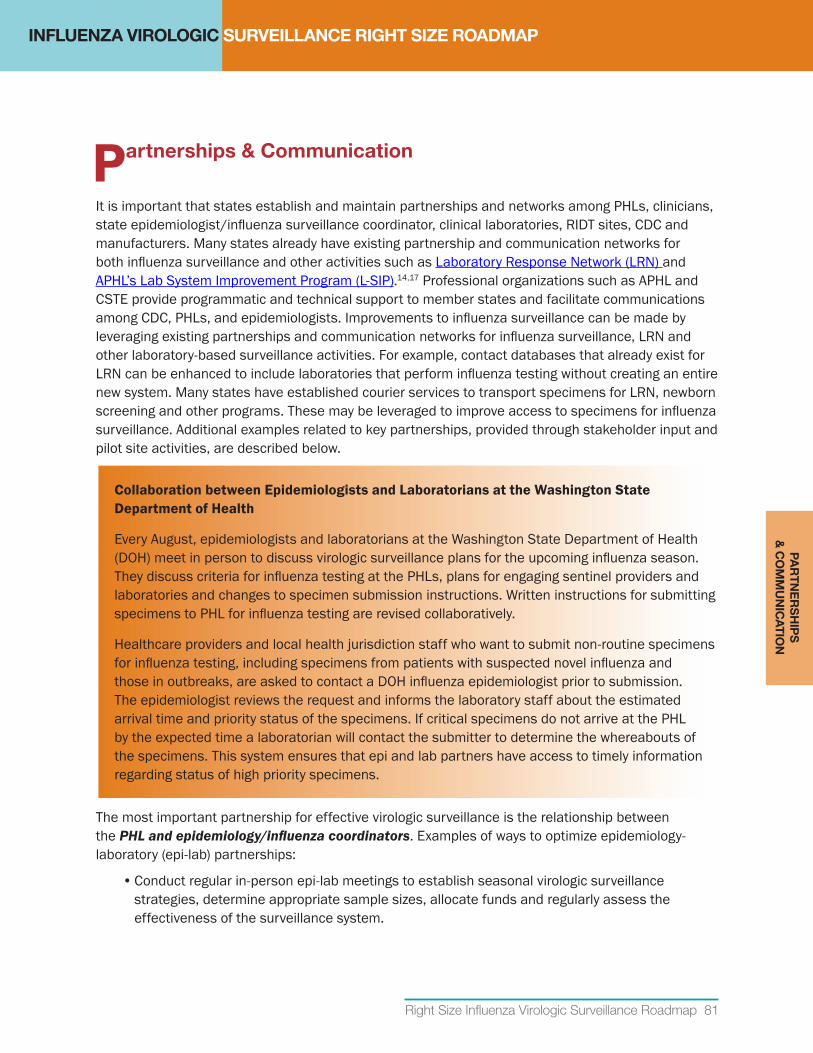
INFLUENZA VIROLOGIC SURVEILLANCE RIGHT SIZE ROADMAP
Right Size Influenza Virologic Surveillance Roadmap 81
Partnerships & Communication
It is important that states establish and maintain partnerships and networks among PHLs, clinicians, state epidemiologist/influenza surveillance coordinator, clinical laboratories, RIDT sites, CDC and manufacturers. Many states already have existing partnership and communication networks for both influenza surveillance and other activities such as Laboratory Response Network (LRN) and APHL’s Lab System Improvement Program (L-SIP).14,17 Professional organizations such as APHL and CSTE provide programmatic and technical support to member states and facilitate communications among CDC, PHLs, and epidemiologists. Improvements to influenza surveillance can be made by leveraging existing partnerships and communication networks for influenza surveillance, LRN and other laboratory-based surveillance activities. For example, contact databases that already exist for LRN can be enhanced to include laboratories that perform influenza testing without creating an entire new system. Many states have established courier services to transport specimens for LRN, newborn screening and other programs. These may be leveraged to improve access to specimens for influenza surveillance. Additional examples related to key partnerships, provided through stakeholder input and pilot site activities, are described below.
Collaboration between Epidemiologists and Laboratorians at the Washington State DepartmentofHealth
Every August, epidemiologists and laboratorians at the Washington State Department of Health (DOH) meet in person to discuss virologic surveillance plans for the upcoming influenza season. They discuss criteria for influenza testing at the PHLs, plans for engaging sentinel providers and laboratories and changes to specimen submission instructions. Written instructions for submitting specimens to PHL for influenza testing are revised collaboratively.
Healthcare providers and local health jurisdiction staff who want to submit non-routine specimens for influenza testing, including specimens from patients with suspected novel influenza and those in outbreaks, are asked to contact a DOH influenza epidemiologist prior to submission. The epidemiologist reviews the request and informs the laboratory staff about the estimated arrival time and priority status of the specimens. If critical specimens do not arrive at the PHL by the expected time a laboratorian will contact the submitter to determine the whereabouts of the specimens. This system ensures that epi and lab partners have access to timely information regarding status of high priority specimens.
The most important partnership for effective virologic surveillance is the relationship between the PHL and epidemiology/influenza coordinators. Examples of ways to optimize epidemiology-laboratory (epi-lab) partnerships:
• Conduct regular in-person epi-lab meetings to establish seasonal virologic surveillance strategies, determine appropriate sample sizes, allocate funds and regularly assess the effectiveness of the surveillance system.
PA
RTN
ER
SH
IPS
&
CO
MM
UN
ICA
TION
IMPLEMENTATION GUIDANCE
82 Association of Public Health Laboratories
• Collaborate in grant writing, monitor grant activities, identify and address problems and gaps and coordinate outbreak response.
• Establish consensus protocols for sharing influenza testing data. Examples include releasing laboratory data to a secure portal that epidemiologists can access or providing epidemiologists access to selected views in the laboratory databases.
PHL-Epidemiology-Clinician-Academic Partnerships • Provide strategic communication from state epidemiologists and PHLs to clinicians and clinical
laboratories as needed to increase awareness when targeted surveillance is needed to identify emerging viruses or characterize outbreaks.
• Provide education programs to clinicians, especially on the utility of rapid point of care tests, and provide training on specimen collection, handling and transport to ILINet and other surveillance specimen submitters. Training may be achieved through on-site presentations, teleconferences, mailings, and on-line training courses.
◦ The Joint Commission Strategies for Improving Rapid Influenza Testing in Ambulatory Set-tings (SIRAS) offers two free on-line courses one for health care providers in ambulatory settings and one for specimen collectors.
• Collaborate with clinicians and academic researchers on studies to increase understanding of influenza infection and epidemiology.
ValueofEpidemiology,PHLandClinicianPartnerships
Successful influenza virologic surveillance programs are not built overnight and cannot be sustained without proper care. Strong relationships between state epidemiology, PHL, and clinical partners are crucial to ensuring quality and consistent data and specimens for influenza virologic surveillance. Clinicians with a keen interest in public health who can help grow and foster surveillance efforts in the community and among their colleagues can be an enormous asset. Establishment of a strong network of providers who will submit timely and quality specimens requires dedicated resources to provide encouragement, feedback and guidance. When dedicated staff routinely work with submitters on appropriate reporting, specimen collection and submission, specimens are more likely to be of higher quality and improve the virus detection abilities at PHLs. Virologic surveillance efforts cannot be a one way street. Giving back to providers who participate serves as a reminder of the importance of their contributions. Providing incentives can be as simple as ensuring timely feedback of results and findings or as advanced as offering additional testing of negative samples for other respiratory pathogens.
Source: Unpublished communications with Influenza Incidence Surveillance Project (IISP) participants
PA
RTN
ER
SH
IPS
&
CO
MM
UN
ICA
TIO
N

IMPLEMENTATION GUIDANCE
Right Size Influenza Virologic Surveillance Roadmap 83
PHL-ClinicalLaboratory/TestingSite–InfluenzaSurveillanceCoordinatorPartnerships
Strong partnerships and communications with clinical laboratories and influenza testing sites are important to obtaining quality and consistent data and specimens. Listed below are some examples for enhancing the effectiveness of these relationships.
• Access alternate data sources to supplement influenza surveillance, as described in the Data Management Implementation Guidance section. Commercial, web-based survey instruments are available at little to no cost (e.g., SurveyMonkey™, SurveyGizmo) to collect testing data from partners. Some of the tools can provide participants with an identifying login and be pre-filled with participant information to ease the burden and increase participation rates. The data collected can include information on a variety of agents and test methods. Data can be downloaded to a spreadsheet for analysis. These reports provide data from thousands of tests performed by clinical laboratories and test sites throughout the influenza season. In addition, a number of clinical laboratories perform their influenza testing as part of a respiratory virus molecular panel; access to this data allows for a more complete picture of circulating respiratory pathogens.
• Establish collaborative relationships with specimen providers to ensure and/or improve the quality and consistency of specimen submissions as outlined in the Sampling Requirements Intent and Implementation Guidance sections. For more information on implementation for establishing specimen provider networks, please reference the sampling implementation guidance.
◦ In addition to the standard communication methods, some states distribute a “handbook” containing instructions, forms and summary data of laboratory surveillance needs in their jurisdiction. The Wisconsin Laboratory-Based Surveillance Plan is one such example.
• Promote the value of participating in the surveillance system, provide incentives when permissible. Incentives do not need to be monetary; they can be test kits, training, certificates of appreciation, attendance at state conferences and reference books, as well as the “added value” of improved surveillance data that can be used to improve clinical management recommendations.
• Provide specimen collection and shipping supplies and courier service to virologic surveillance participants. Most health care providers and clinical laboratories will not be able to absorb the cost of surveillance supplies or shipping.
• Provide timely updates to specimen providers via email, web or fax. Clinical laboratory partners and PHLs both benefit from exchanges of information related to current influenza activity, commercial test shortages, and emerging disease threats (e.g., 2013 novel coronavirus and H7N9).
• Provide workshops, teleconferences/webinars and educational materials related to influenza surveillance, proper specimen collection and use of RIDT.
• Provide proficiency assessment challenges or exercises related to influenza testing and specimen packaging if budget permits. These exercises may be coordinated with other state/local preparedness activities.
PA
RTN
ER
SH
IPS
&
CO
MM
UN
ICA
TION
IMPLEMENTATION GUIDANCE
84 Association of Public Health Laboratories
PHL and CDC Partnerships Collaboration between the PHLs and CDC’s Influenza Division is imperative for effective virologic surveillance. The CDC Influenza Division, especially the Virus Surveillance and Diagnosis Branch, provides vital support to the PHLs and relies on data and specimens submitted by the PHLs. Coordination between the CDC and PHLs is often facilitated by APHL.
• CDC provides didactic and hands-on training to PHLs in test methods and national teleconferences to share surveillance guidance for laboratory testing and influenza coordinator activities.
• CDC provides technical support to PHLs including assistance with assay troubleshooting and interpreting unusual results.
• CDC provides testing reagents and materials through the IRR along with updates to the assay and implementation support when novel viruses emerge (e.g., H3N2v, H7N9).
• CDC partners with PHLs to complete the necessary validation studies for regulatory approval of new assays.
• CDC provides guidance to assist states develop emergency outbreak and pandemic response plans and provides essential support in actual response situations.
ConsiderationsforBuildingEffectivePartnershipsandCommunications1. Has your influenza surveillance program and PHL identified the appropriate contacts among
public health, clinician and laboratory partners within your jurisdiction?
2. If so, do you routinely and collaboratively review the list of contacts to ensure that all key partners are included (e.g., identify new partners, update for staffing changes, etc).
3. Does your laboratory maintain a database of current contact information and influenza testing capabilities for identified laboratories within your jurisdiction?
• Some SPHLs maintain multiple separate databases – one for the LRN, one for a statewide laboratory network for surveillance, etc. while some SPHLs have added influenza testing sites and included influenza testing capability, surveillance participation, etc. to the existing LRN database.
4. Does your influenza surveillance program and PHL designate one or more staff members to coordinate outreach activities (e.g., network or surveillance coordinator/manager/advisor)?
5. Do you maintain a communication plan that identifies and links system partners?
6. Do you collaborate with other laboratories and rapid influenza testing sites to acquire virologic testing result data and specimens for further virologic testing?
7. Do you have a method to collect influenza testing data from clinical laboratories/testing sites (e.g., survey tool, fax or web portal)?
PA
RTN
ER
SH
IPS
&
CO
MM
UN
ICA
TIO
N
IMPLEMENTATION GUIDANCE
Right Size Influenza Virologic Surveillance Roadmap 85
8. Does your laboratory and/or influenza surveillance program maintain the capability to exchange information and data via email, fax or other electronic tools with laboratories within your jurisdiction?
9. Do you provide reports on the current status of circulating influenza types and subtypes, and other respiratory viruses if available, via website, newsletter or other means?
10. Do you provide an end of year summary to all stakeholders about the influenza season? Do you provide individualized reports to participating laboratories and/or providers?
11. Do you relay the importance of receiving specimens for confirmatory testing, subtyping and identification of unsubtypable specimens to your clinical partners especially when the threat of a novel virus is high (e.g., H3N2v, H7N9)?
12. Does your influenza surveillance program and/or laboratory provide teleconferences, webinars or in-person training and outreach to clinician and laboratory surveillance partners and potential partners?
13. Is there a mechanism for feedback and corrective action to providers who incorrectly or inappropriately send specimens to the PHL (e.g., improperly shipped, incorrect form, incomplete information, sent dry swab not in media)?
PA
RTN
ER
SH
IPS
&
CO
MM
UN
ICA
TION
INFLUENZA VIROLOGIC SURVEILLANCE RIGHT SIZE ROADMAP
86 Association of Public Health Laboratories
Quality Management Systems
National Surveillance System Quality MonitoringThe ultimate value of virologic surveillance data is dependent on the quality of specimens, laboratory procedures and data analysis. CDC and state/local jurisdictions should establish performance metrics and monitor essential components of the national influenza virologic surveillance system to ensure quality and make improvements as needed. Listed in this section are key components that should be routinely assessed, but it should be noted that each quality management system will vary and jurisdictions need not be limited by this list. It is likely that existing data sources can be leveraged to assess the quality of many surveillance components.
State/LocalQualityManagement ResponsibilitiesAt the state and local level, quality management systems need to monitor both internal performance and performance in meeting national surveillance requirements including those defined in this document. As discussed previously, influenza virologic surveillance systems are complex and vary across jurisdictions; quality management systems will likewise need to be tailored to each system. Regardless of the assessment mechanism(s), it is recommended that states have some method to evaluate the following elements related to influenza virologic surveillance and make adjustments and improvements as needed.
• Compliance with ELC, PHEP and other cooperative agreement and grant benchmarks for all epidemiology and laboratory components of the surveillance system.
NewHampshirePHLsInfluenzaQualityMonitoring, 2013
When it became clear that the 2012-2013 influenza season was ramping up to be the busiest since the 2009 pandemic, staff at the NH PHLs realized they needed to closely monitor influenza submissions in order to ensure resources were appropriately allocated to meet the goals of the surveillance program. This was achieved by building a simple “Daily Flu Data” report in the laboratory LIMS, which effectively extracted all data associated with influenza specimens received from the start of the season in October 2012.
The influenza report was run daily and data was dumped into an Excel spreadsheet. Once populated in the spreadsheet, the data could be manipulated in a number of ways: specimens received by date, specimens received by provider, specimens received by county, etc. This manipulation allowed the team to quickly see if submissions were increasing or decreasing and if the PHL was were obtaining representative samples from across the state. They were able to use this tool to reach out to health care providers and encourage additional submissions from providers in underrepresented areas of the state, while informing others that their submissions had exceeded surveillance needs. By storing the spreadsheet in a shared folder on the network, all staff who needed to use the information were able to access it quickly and conveniently.
QU
ALI
TY
MA
NA
GE
ME
NT
S
YS
TEM
S
IMPLEMENTATION GUIDANCE
Right Size Influenza Virologic Surveillance Roadmap 87
• Specimen submissions through the provider networks including consistency, quality and number. Timely electronic transmission of specimen-level data. The PHLIP system is the preferred method of reporting.
• Percentage of influenza test results received by CDC from the PHL within two weeks of the test date.
• Capability to provide year-round molecular testing for the detection, typing and subtyping of seasonal influenza viruses and detection of novel influenza viruses.
• Systematic submission of representative influenza positive clinical materials and/or viral isolates for national virologic in accordance with annual CDC specimen submission guidance.
• Rapid referrals of all unsubtypable influenza A viruses to CDC.
• Proficiency in PCR methods for influenza virus detection, typing, and subtyping. The laboratory must operate in compliance with the Clinical Laboratory Improvement Amendment(CLIA) 88’ Requirements, which include participating in an external/blinded proficiency test for each assay. CDC provides a quality assessment panel to PHLs at least one time per year which helps PHLs fulfill this CLIA requirement. Participation in this CDC assessment also provides data that helps CDC assess and address training needs.
• Usage of IRR-provided reagents, materials and other resources used for national surveillance in comparison to the number of specimens tested and reported to CDC. IRR reagents are provided to PHLs to support testing for national surveillance. Prior authorization from CDC is needed if IRR-provided materials are needed to support special studies.
• Staff expertise to perform each influenza test method used at the PHL. Every PHL should have a competency assurance policy that addresses initial training, assay update training and cross-training to ensure continuity of operations in a surge event such as the 2009 H1N1 pandemic.
• Staff expertise and ability to adopt influenza assay revisions, add additional testing markers or adopt assay interpretation updates. The detection of novel or variant viruses may result in new assay components or modified interpretation guidelines.
• Maintenance of an influenza specimen repository that can be utilized for assay verification and validation and competency testing as needed. Store a subset of positive and negative specimens containing a mix of influenza types and subtypes at -70ºC.
CDC Quality Management Responsibilities: • Cross-reference PHL influenza testing data reported to CDC against virologic specimen
submissions to CDC and CDC-designated laboratories.
QU
ALIT
Y M
AN
AG
EM
EN
T
SY
STE
MS
IMPLEMENTATION GUIDANCE
88 Association of Public Health Laboratories
• Monitor national surveillance data for timeliness, adequate testing and specimen submissions numbers and representativeness to ensure the system is able to effectively inform situational awareness and vaccine virus selection efforts. When needed, provide targeted communications to PHLs that are not consistently complying with specimen submission expectations or to request additional specimens as needed. Targeted communications help reduce confusion about specimen requirements and focus attention on key gaps or special needs.
• Monitor IRR reagent ordering history in relation to testing reported to CDC. Targeted follow-up to PHLs can be an effective method for addressing excessive reagent ordering which may be due to oversampling or unrecognized technical problems. When technical problems are identified, CDC and the PHL should collaborate to implement appropriate solutions as needed.
ConsiderationsforEstablishingandMaintainingQualityManagementSystems1. Does your laboratory and surveillance program have mechanisms in place to monitor
compliance with grant/cooperative agreement benchmarks and deliverables?
• Example: Leadership should meet regularly to review grant line items, identify issues and document progress. LIMS and tracking spreadsheets can be used to document and verify deliverables are being met.
2. Does your laboratory and/or surveillance program have processes for monitoring the quality, quantity, consistency, representativeness and timeliness of specimen submissions from specimen providers?
• Example: Influenza coordinator and PHL may regularly review specimen submission data for quality indicators such as number of specimens rejected for poor quality, number of inconclusive test results, etc.
• Example: Influenza coordinator and PHL may regularly review number of specimens received compared to number designated by sample size calculators. Sampling may be adjusted as appropriate.
3. Does your laboratory have mechanisms in place to ensure that representative specimens are being submitted to CDC or CDC-designated laboratories in accordance with annual specimen submission guidance and other CDC requests?
• Example: Use LIMS and tracking spreadsheets to monitor the timeliness of influenza surveillance testing and submissions to CDC or CDC-designated laboratories. Regularly check to ensure specimens submitted to CDC are representative of the influenza activity in your jurisdiction (see examples in Sampling Implementation) and current CDC guide-lines. Verify that shipment quantities and frequencies are in compliance with the CDC guidelines.
QU
ALI
TY
MA
NA
GE
ME
NT
S
YS
TEM
S
INFLUENZA VIROLOGIC SURVEILLANCE RIGHT SIZE ROADMAP
Right Size Influenza Virologic Surveillance Roadmap 89
Surge Capacity for Influenza Surveillance, Novel Event Investigation and Outbreak Events
The virologic surveillance system should be flexible and scalable for rapid, effective response to support initial diagnostic needs and case counts in rare/novel influenza event investigations and enhanced surveillance in outbreak and pandemic scenarios. Pre-event and during an event, communication and coordination between epidemiology and laboratory leadership will be essential to develop, refine and change the strategy for virologic surge sampling and testing.
Pre-event: • Ensure that PHL representatives are included in state preparedness and pandemic planning
activities. Address the role and resource needs of the PHL in state/jurisdictional pandemic plans. Pandemic Planning Information can be found at: www.cdc.gov/phpr/coopagreement.htm, www.cdc.gov/flu/pandemic-resources/tools/index.htm.
• Utilize the APHL Infectious Disease Planning and Response Framework Checklist to identify key partners and preparedness activities, including validation of new testing methodologies, biosafety, regulatory requirements, training, information dissemination, specimen collection and transport guidance.21
• Develop and maintain a laboratory pandemic surge plan that is integrated into a laboratory wide Continuity of Operations Plans (COOP). The surge plan should address:
◦ Communication/coordination with epidemiologists for specimen triage,
◦ Algorithm changes to improve efficiency and throughput or to meet specific surveillance needs,
◦ Resources (e.g., staff, cross-training, equipment, space, reagents and consumable sup-plies),
◦ Biosafety considerations for working with novel viruses,
◦ Options to mitigate the capacity gaps and bottlenecks identified in the APHL-CDC Influ-enza Laboratory Resource and Process Modeling Project report provided to participating states by APHL/CDC.20
• Establish mechanisms to determine and implement a sampling strategy for investigation following detection of a rare/novel influenza event. Consider the potential scenarios that may define sampling approaches, such as the need to identify additional cases and detect person-to-person transmission. Consider targeted surveillance options including clinical severity criteria, exposure risk, number of hospitalized cases/deaths and other event specific needs.
• Establish criteria for specimen triage and decision points for performing diagnostic testing and/
SU
RG
E C
AP
AC
ITY
IMPLEMENTATION GUIDANCE
90 Association of Public Health Laboratories
or expanding virologic surveillance testing. Draft scenario specific scale up and ramp down criteria that can be quickly applied when a rare/novel influenza event or outbreak occurs.
• Define laboratory testing algorithms that may be implemented to accommodate the influx of surveillance and diagnostic specimens.
• Periodically assess laboratory contingency and crisis surge capacity, as defined in Surge Requirements Intent section. Laboratory capacity modeling has been conducted in over 35 PHLs using a model developed by APHL and CDC.20 These models estimated baseline capacity, identified likely sources of bottlenecks in a surge event and evaluated the impact of various changes on overall throughput. Utilizing a surge algorithm with surge resources (staff, equipment, etc.) that are expected to be available to the laboratory during emergency periods of high testing demand provided a capacity increase of 127% compared to the Influenza A/B Typing Assay with reflex Influenza A Subtyping algorithm and baseline resources. The implementation of a super surge process strategy, which included changing from the Influenza A/B Typing with full Influenza A Subtyping Panel baseline to an Influenza A/B Typing only testing algorithm, along with the addition of staff and equipment, could increase national aggregate PHL daily capacity from approximately 5,000 specimens to approximately 14,250 specimens – an estimated change of 185%.
• Utilize sample size calculators to estimate the number of samples to be collected and tested for various rare/novel influenza event investigation scenarios. Compare laboratory surge capacity to likely sample size expectations so that both epidemiology and laboratory leaders understand capacity gaps, if any. Collaboratively explore strategies to reduce sample size or increase capacity.
• Identify and address expectations to support diagnostic testing needs, including potential support to assist clinical laboratories validate tests for the new virus.
Event:
• Use sample size calculators to determine the appropriate sample size for the investigation, based on the scenario, acceptable confidence level and error rate. Sustaining testing to provide daily case counts will not be possible and states should consider use of sample size calculators to adjust testing volumes as necessary to answer key surveillance objectives as the event evolves.
• Develop, refine and change state/local and/or CDC guidance based on the latest information as needed dependent on the specific event:
◦ Defined surveillance/investigation objectives,
◦ Targeted sampling approaches,
◦ Initial virus detection reporting criteria (laboratory to epidemiology),
◦ Ramp up/ Ramp down criteria.
• Revise testing algorithms to improve efficiency and throughput or meet specific surveillance needs.
SU
RG
E C
AP
AC
ITY
IMPLEMENTATION GUIDANCE
Right Size Influenza Virologic Surveillance Roadmap 91
• Communicate closely with health department leadership; participate in state health department emergency operations.
• Provide timely specimen collection, testing and biosafety guidance to clinical laboratories and clinicians.
Detailed guidance on pandemic response is beyond the scope of this document. During a large scale event, CDC, CSTE and APHL will coordinate to provide timely direction and support. It is important that information disseminated by CDC, state health officials, and APHL to PHL directors is disseminated to the laboratory staff. Management and technical staff should participate in CDC/APHL conference calls to obtain pertinent recommendations.
SU
RG
E C
AP
AC
ITY
INFLUENZA VIROLOGIC SURVEILLANCE RIGHT SIZE ROADMAP
92 Association of Public Health Laboratories
FIN
AN
CIA
L R
ES
OU
RC
ES
Financial Resources
Every state will need to determine how to achieve influenza surveillance goals to meet national and state needs. Federal resources (funding, reagents) distributed to states need to be directed principally to activities that support overall national priorities. State/local capabilities beyond those recommended as essential to meet national virologic surveillance goals will require securing sustainable state or jurisdictional funding. When optimizing services and justifying budget requests, PHLs and surveillance programs should work cooperatively to address:
• Essential elements defined in this roadmap for national surveillance.
• Options for shared services among PHLs.
• Scalability of the surveillance system based on available resources.
• State/local specific influenza surveillance expectations or operational issues.
Cost AccountingOptimizing resources and justifying funding requests will require better cost accounting at the national, state and local level. Results from the 2011 Right Size Influenza Virologic Surveillance Landscape survey showed that 35% of state PHLs (16 out of 45 SPHLS) were unable to provide accurate estimates of influenza testing costs or were only able to provide rough estimates. There are many advantages to effective cost accounting including, but not limited to:
• Identify true cost of virologic surveillance.
• Plan and allocate resources for each influenza season.
• Justify surveillance program and laboratory testing budgets.
• Assess which surveillance components are covered by various funding sources (e.g., federal vs state funds).
• Calculate the cost the PHL absorbs beyond the actual state or federal funds provided.
• Ensure PHLs and programs are good stewards of existing resources.
• Determine and justify the most efficient testing algorithm for various scenarios (see Laboratory Testing Implementation Guidance section for additional information on testing algorithms).
• Write grant proposals.
• Characterize impacts of funding reductions.
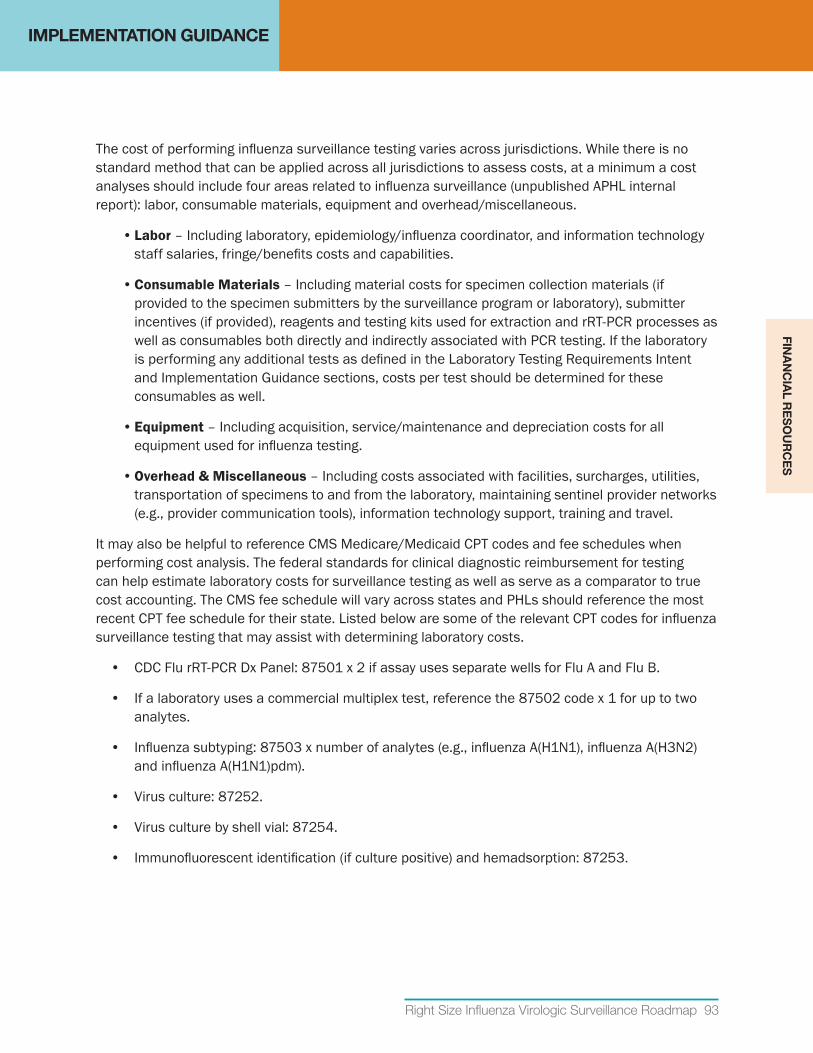
IMPLEMENTATION GUIDANCE
Right Size Influenza Virologic Surveillance Roadmap 93
FINA
NC
IAL R
ES
OU
RC
ES
The cost of performing influenza surveillance testing varies across jurisdictions. While there is no standard method that can be applied across all jurisdictions to assess costs, at a minimum a cost analyses should include four areas related to influenza surveillance (unpublished APHL internal report): labor, consumable materials, equipment and overhead/miscellaneous.
•Labor – Including laboratory, epidemiology/influenza coordinator, and information technology staff salaries, fringe/benefits costs and capabilities.
•Consumable Materials – Including material costs for specimen collection materials (if provided to the specimen submitters by the surveillance program or laboratory), submitter incentives (if provided), reagents and testing kits used for extraction and rRT-PCR processes as well as consumables both directly and indirectly associated with PCR testing. If the laboratory is performing any additional tests as defined in the Laboratory Testing Requirements Intent and Implementation Guidance sections, costs per test should be determined for these consumables as well.
•Equipment – Including acquisition, service/maintenance and depreciation costs for all equipment used for influenza testing.
•Overhead & Miscellaneous – Including costs associated with facilities, surcharges, utilities, transportation of specimens to and from the laboratory, maintaining sentinel provider networks (e.g., provider communication tools), information technology support, training and travel.
It may also be helpful to reference CMS Medicare/Medicaid CPT codes and fee schedules when performing cost analysis. The federal standards for clinical diagnostic reimbursement for testing can help estimate laboratory costs for surveillance testing as well as serve as a comparator to true cost accounting. The CMS fee schedule will vary across states and PHLs should reference the most recent CPT fee schedule for their state. Listed below are some of the relevant CPT codes for influenza surveillance testing that may assist with determining laboratory costs.
• CDC Flu rRT-PCR Dx Panel: 87501 x 2 if assay uses separate wells for Flu A and Flu B.
• If a laboratory uses a commercial multiplex test, reference the 87502 code x 1 for up to two analytes.
• Influenza subtyping: 87503 x number of analytes (e.g., influenza A(H1N1), influenza A(H3N2) and influenza A(H1N1)pdm).
• Virus culture: 87252.
• Virus culture by shell vial: 87254.
• Immunofluorescent identification (if culture positive) and hemadsorption: 87253.
IMPLEMENTATION GUIDANCE
94 Association of Public Health Laboratories
Allocating Available FundsThese questions address suggested processes for cost analysis and coordination needed to optimize funding allocation among those involved in influenza surveillance within the state.
1. Do you have a routine meeting or other process for all involved parties to discuss grant development, planning, fund allocation, and deliverable/benchmark monitoring?
2. Do you have a process to determine how much it costs your jurisdiction to perform influenza virologic surveillance?
• Example: Perform a detailed cost analysis for both surveillance program and laboratory components. See the cost accounting sub-section above for some helpful tips.
3. Do you have a method or process for equitably allocating funds across program and laboratory elements?
• Example: Appropriate representatives of the laboratory and surveillance program meet at the beginning of each season and periodically throughout season to discuss allocation of funds and monitor expenditures throughout the season.
4. Do you have a method or process to collaboratively address funding and resource reductions?
5. Are ELC, PHEP, and quality management benchmarks considered in prioritization of funding allocation?
Table 4 is provided as a tool to facilitate funding allocation discussions and to help identify potential funding gaps. Use of this table, or a similar state developed tool, can help elucidate the actual costs of influenza surveillance and provide a basis for discussion and priority setting. This table can be modified to fit a jurisdiction’s funding sources and surveillance components. Depending on the level of detail desired, this table can be completed by listing dollar amounts, percentages or simply using checkmarks to indicate which surveillance components are funded by each of these sources in the jurisdiction.
FIN
AN
CIA
L R
ES
OU
RC
ES
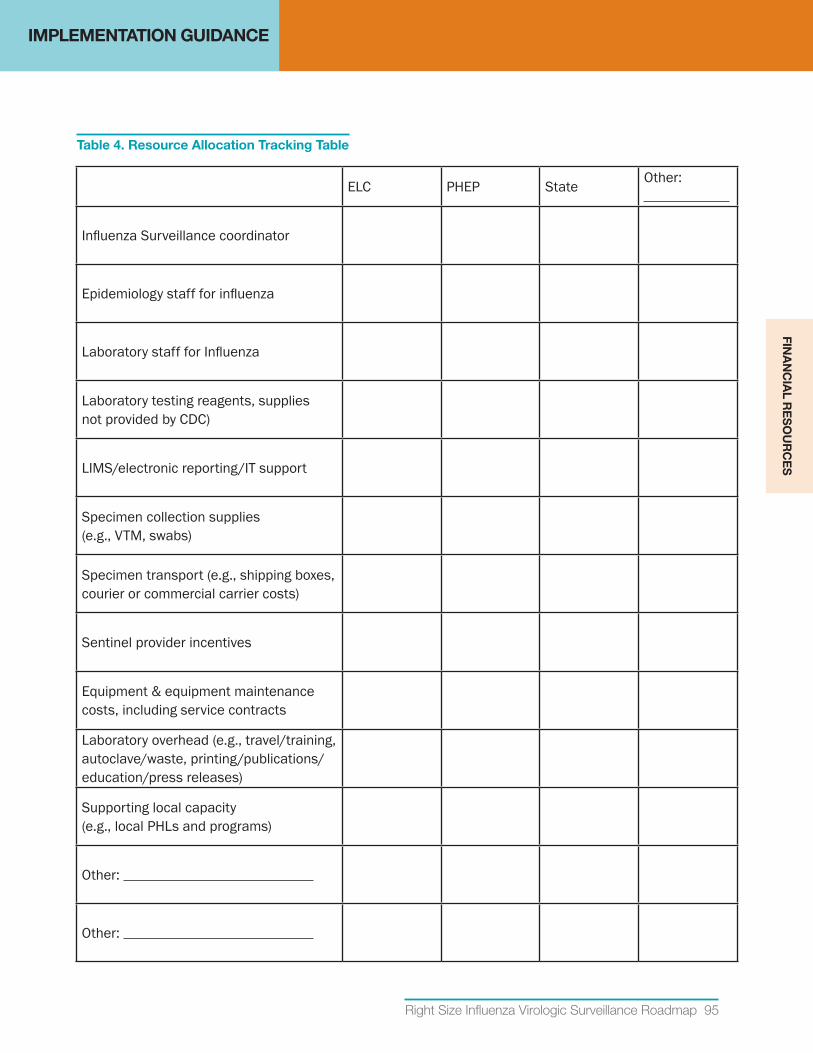
IMPLEMENTATION GUIDANCE
Right Size Influenza Virologic Surveillance Roadmap 95
ELC PHEP State Other:
Influenza Surveillance coordinator
Epidemiology staff for influenza
Laboratory staff for Influenza
Laboratory testing reagents, supplies not provided by CDC)
LIMS/electronic reporting/IT support
Specimen collection supplies (e.g., VTM, swabs)
Specimen transport (e.g., shipping boxes, courier or commercial carrier costs)
Sentinel provider incentives
Equipment & equipment maintenance costs, including service contracts
Laboratory overhead (e.g., travel/training, autoclave/waste, printing/publications/education/press releases)
Supporting local capacity (e.g., local PHLs and programs)
Other:
Other:
Table 4. Resource Allocation Tracking Table
FINA
NC
IAL R
ES
OU
RC
ES
IMPLEMENTATION GUIDANCE
96 Association of Public Health Laboratories
ResourceJustification
As previously mentioned, state/local capabilities beyond those recommended as essential to meet national virologic surveillance goals will require securing alternate, supplemental, sustainable state or local funds. As federal and state funds to support influenza surveillance decline in this post-pandemic period, it may be necessary to explore options for alternate non-traditional funding sources such as research grants or academic partnerships for special studies. Justifying resource needs requires an accurate estimate of surveillance system costs and funding needs/gaps.
FundingFactSheetToolforStatesFact sheets and success/impact stories are useful tools when requesting additional funds and resources to meet surveillance requirements. Appendix D provides a funding justification “fact sheet” template that can be modified and used as a tool by public health laboratory leaders to highlight a specific jurisdiction’s program impact and funding needs for influenza virologic surveillance. To see other example fact sheets, please visit http://www.aphl.org/policy/facts/Pages/default.aspx.
IntendedUse: Public health laboratory leaders can customize this document using the editable version of Appendix D located at http://www.aphl.org/aphlprograms/infectious/influenza/Documents/ID_2013July_Editable-Funding-Fact-Sheet.docx. This is intended to be used to highlight surveillance program successes, impact, and funding needs to non-public health audiences such as policy makers and other government officials.
InstructionsforUse: To create a jurisdiction-specific fact sheet, go to http://www.aphl.org/aphlprograms/infectious/influenza/Documents/ID_2013July_Editable-Funding-Fact-Sheet.docx for an editable version of Appendix D that users can modify to highlight their own program’s success and funding needs. For example, the current template includes a story for the 2009 H1N1 pandemic to provide an example of a captivating story structure. Users should replace this story with a jurisdiction-specific story. Finding a story that is both recent and has major impact on the specific jurisdiction will improve the reception by target readers.
Users will notice that the fact sheet uses basic, non-scientific language; the level of technical detail included should be tailored to the target audience. In the example language in Appendix D, the target audience would be a lay person that has no prior knowledge of influenza testing, surveillance, or public health laboratories. For example, the term such as “influenza” is replaced with “flu,” a widely recognized, colloquial reference.
The template also includes a box to highlight funding needs. It is recommended that this box only include the funding needs being requested of the specific target audience. In some jurisdictions this fact sheet is more useful for promoting impact and success, in which case the funding needs box can be deleted. Lastly, keep the fact sheet focused on a specific topic and/or request. The recommended maximum length is approximately 900 words or two pages to allow for printing on both sides of a single sheet.
FIN
AN
CIA
L R
ES
OU
RC
ES
INFLUENZA VIROLOGIC SURVEILLANCE RIGHT SIZE ROADMAP
Right Size Influenza Virologic Surveillance Roadmap 97
APPENDICES
A. Surveillance Sampling Process Map
B. Pre-Calculated Sample Size Tables
C. Laboratory methods
D. Funding Fact Sheet Template
E. Glossary of Terms and Acronyms
F. Additional Resources
AP
PE
ND
ICE
S
INFLUENZA VIROLOGIC SURVEILLANCE RIGHT SIZE ROADMAP
98 Association of Public Health Laboratories
Appendix A: Surveillance Sampling Process Map
Influenza testing occurs in a variety of settings, including physician office laboratories and primary care settings, hospital and commercial laboratories and local and state PHLs. The influenza test results data from all these groups contribute to the domestic US influenza virus surveillance system show below in surveillance sampling process map.
AP
PE
ND
IX A
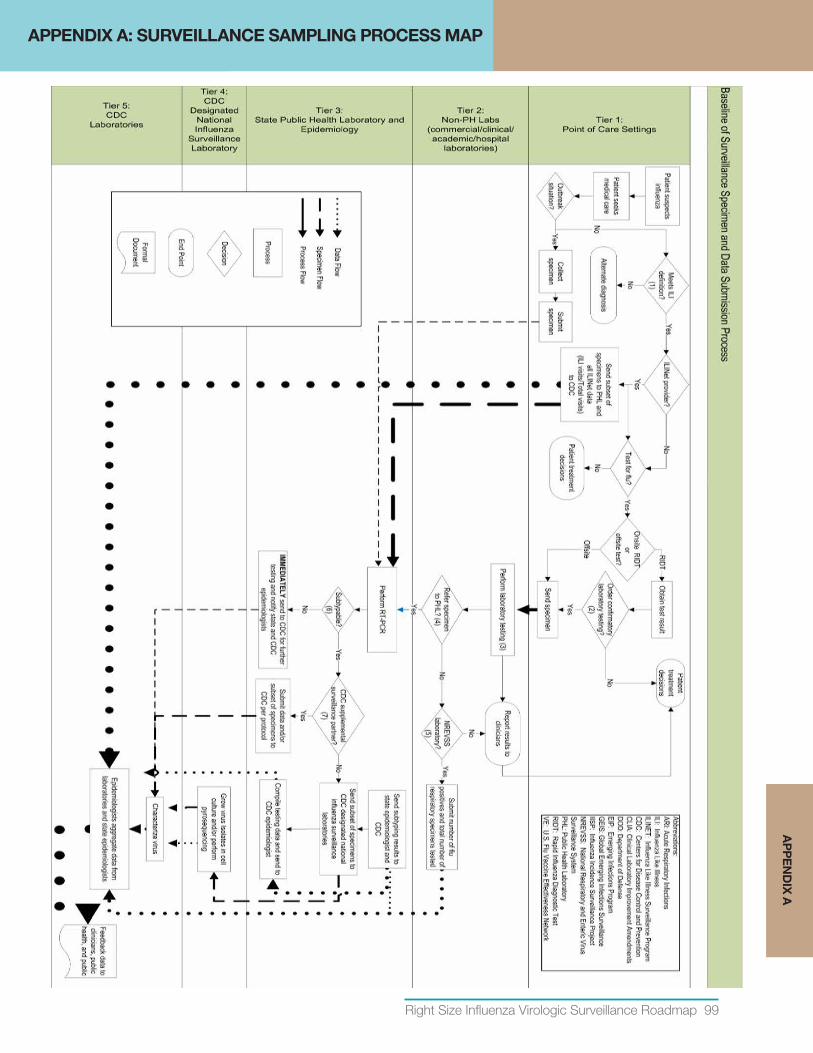
Right Size Influenza Virologic Surveillance Roadmap 99
Appendix A: Surveillance Sampling Process Map
Influenza testing occurs in a variety of settings, including physician office laboratories and primary care settings, hospital and commercial laboratories and local and state PHLs. The influenza test results data from all these groups contribute to the domestic US influenza virus surveillance system show below in surveillance sampling process map.
APPENDIX A: SURVEILLANCE SAMPLING PROCESS MAPA
PP
EN
DIX
A
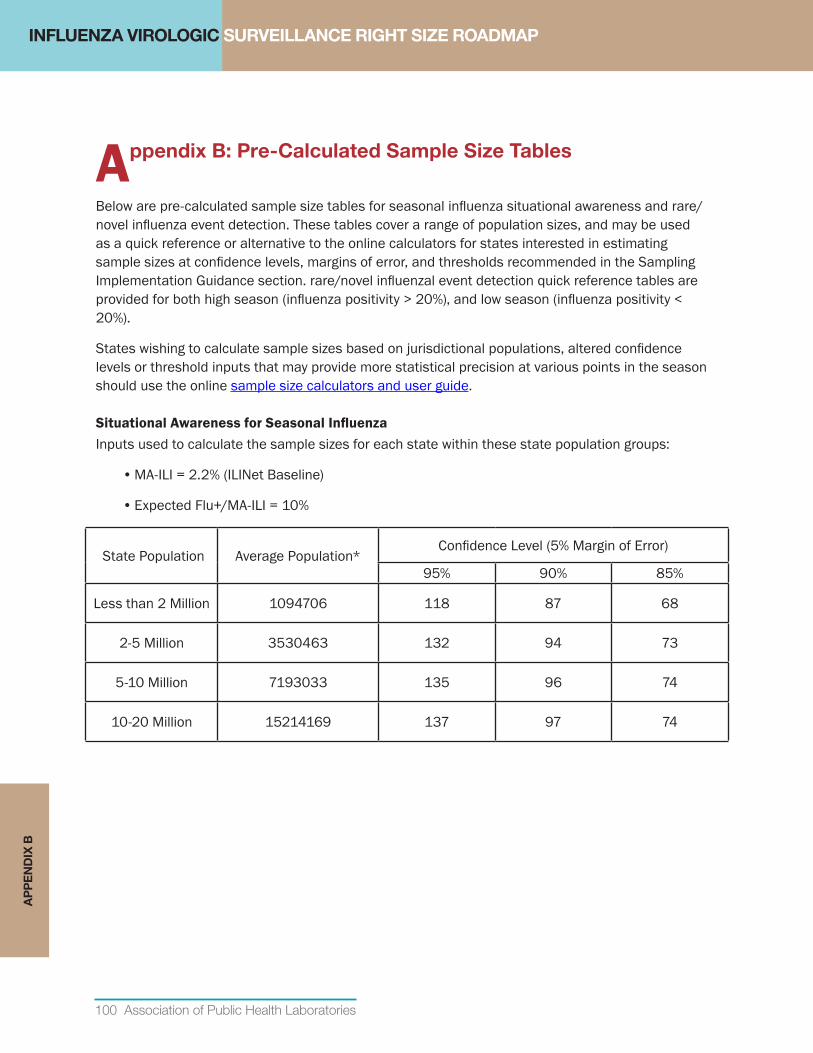
INFLUENZA VIROLOGIC SURVEILLANCE RIGHT SIZE ROADMAP
100 Association of Public Health Laboratories
Appendix B: Pre-Calculated Sample Size Tables
Below are pre-calculated sample size tables for seasonal influenza situational awareness and rare/novel influenza event detection. These tables cover a range of population sizes, and may be used as a quick reference or alternative to the online calculators for states interested in estimating sample sizes at confidence levels, margins of error, and thresholds recommended in the Sampling Implementation Guidance section. rare/novel influenzal event detection quick reference tables are provided for both high season (influenza positivity > 20%), and low season (influenza positivity < 20%).
States wishing to calculate sample sizes based on jurisdictional populations, altered confidence levels or threshold inputs that may provide more statistical precision at various points in the season should use the online sample size calculators and user guide.
SituationalAwarenessforSeasonalInfluenzaInputs used to calculate the sample sizes for each state within these state population groups:
• MA-ILI = 2.2% (ILINet Baseline)
• Expected Flu+/MA-ILI = 10%
State Population Average Population*Confidence Level (5% Margin of Error)
95% 90% 85%
Less than 2 Million 1094706 118 87 68
2-5 Million 3530463 132 94 73
5-10 Million 7193033 135 96 74
10-20 Million 15214169 137 97 74
AP
PE
ND
IX B
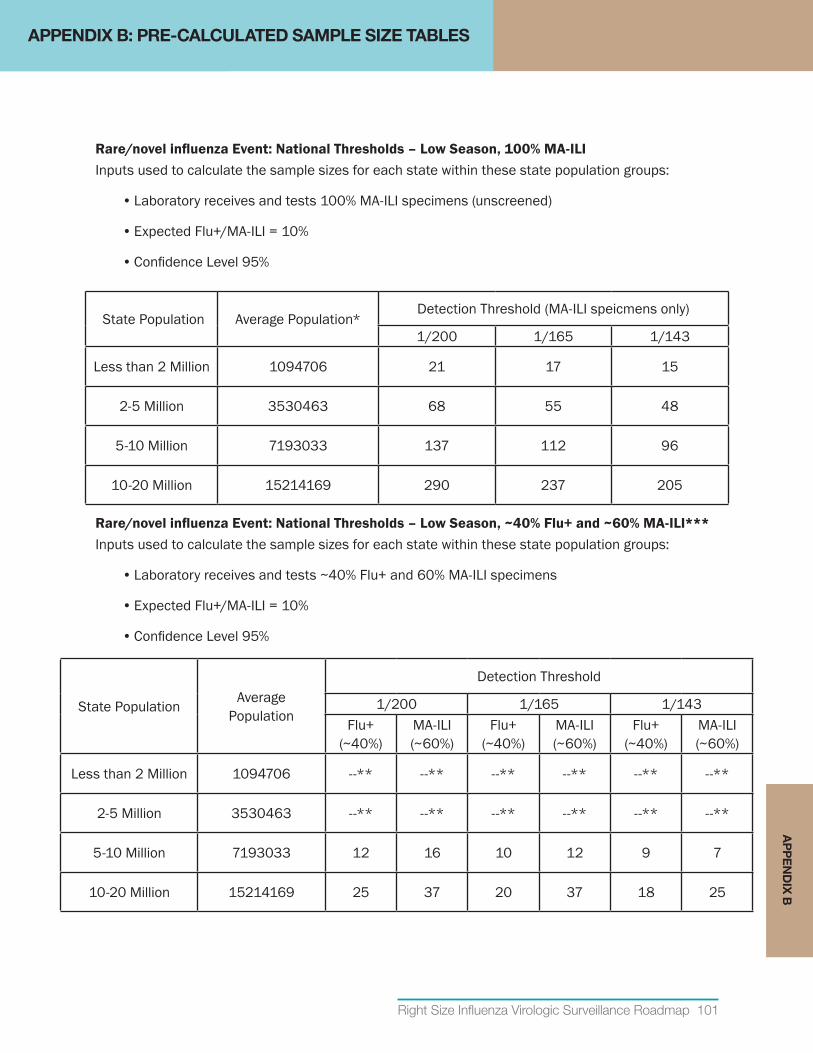
Right Size Influenza Virologic Surveillance Roadmap 101
Rare/novelinfluenzaEvent:NationalThresholds–LowSeason,100%MA-ILIInputs used to calculate the sample sizes for each state within these state population groups:
• Laboratory receives and tests 100% MA-ILI specimens (unscreened)
• Expected Flu+/MA-ILI = 10%
• Confidence Level 95%
State Population Average Population*Detection Threshold (MA-ILI speicmens only)
1/200 1/165 1/143
Less than 2 Million 1094706 21 17 15
2-5 Million 3530463 68 55 48
5-10 Million 7193033 137 112 96
10-20 Million 15214169 290 237 205
Rare/novelinfluenzaEvent:NationalThresholds–LowSeason,~40%Flu+and~60%MA-ILI***Inputs used to calculate the sample sizes for each state within these state population groups:
• Laboratory receives and tests ~40% Flu+ and 60% MA-ILI specimens
• Expected Flu+/MA-ILI = 10%
• Confidence Level 95%
State Population Average Population
Detection Threshold
1/200 1/165 1/143Flu+
(~40%)MA-ILI (~60%)
Flu+ (~40%)
MA-ILI (~60%)
Flu+ (~40%)
MA-ILI (~60%)
Less than 2 Million 1094706 --** --** --** --** --** --**
2-5 Million 3530463 --** --** --** --** --** --**
5-10 Million 7193033 12 16 10 12 9 7
10-20 Million 15214169 25 37 20 37 18 25
APPENDIX B: PRE-CALCULATED SAMPLE SIZE TABLESA
PP
EN
DIX
B
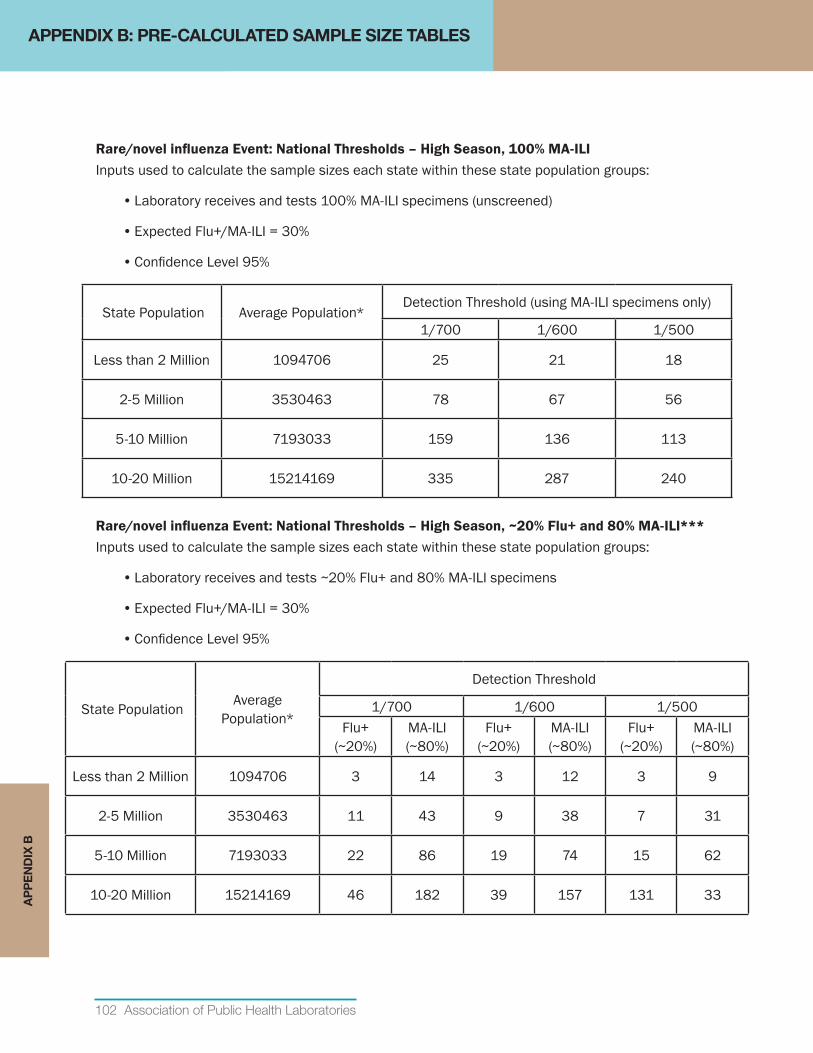
102 Association of Public Health Laboratories
Rare/novelinfluenzaEvent:NationalThresholds–HighSeason,100%MA-ILIInputs used to calculate the sample sizes each state within these state population groups:
• Laboratory receives and tests 100% MA-ILI specimens (unscreened)
• Expected Flu+/MA-ILI = 30%
• Confidence Level 95%
State Population Average Population*Detection Threshold (using MA-ILI specimens only)
1/700 1/600 1/500
Less than 2 Million 1094706 25 21 18
2-5 Million 3530463 78 67 56
5-10 Million 7193033 159 136 113
10-20 Million 15214169 335 287 240
Rare/novelinfluenzaEvent:NationalThresholds–HighSeason,~20%Flu+and80%MA-ILI***Inputs used to calculate the sample sizes each state within these state population groups:
• Laboratory receives and tests ~20% Flu+ and 80% MA-ILI specimens
• Expected Flu+/MA-ILI = 30%
• Confidence Level 95%
State Population Average Population*
Detection Threshold
1/700 1/600 1/500Flu+
(~20%)MA-ILI (~80%)
Flu+ (~20%)
MA-ILI (~80%)
Flu+ (~20%)
MA-ILI (~80%)
Less than 2 Million 1094706 3 14 3 12 3 9
2-5 Million 3530463 11 43 9 38 7 31
5-10 Million 7193033 22 86 19 74 15 62
10-20 Million 15214169 46 182 39 157 131 33
APPENDIX B: PRE-CALCULATED SAMPLE SIZE TABLESA
PP
EN
DIX
B
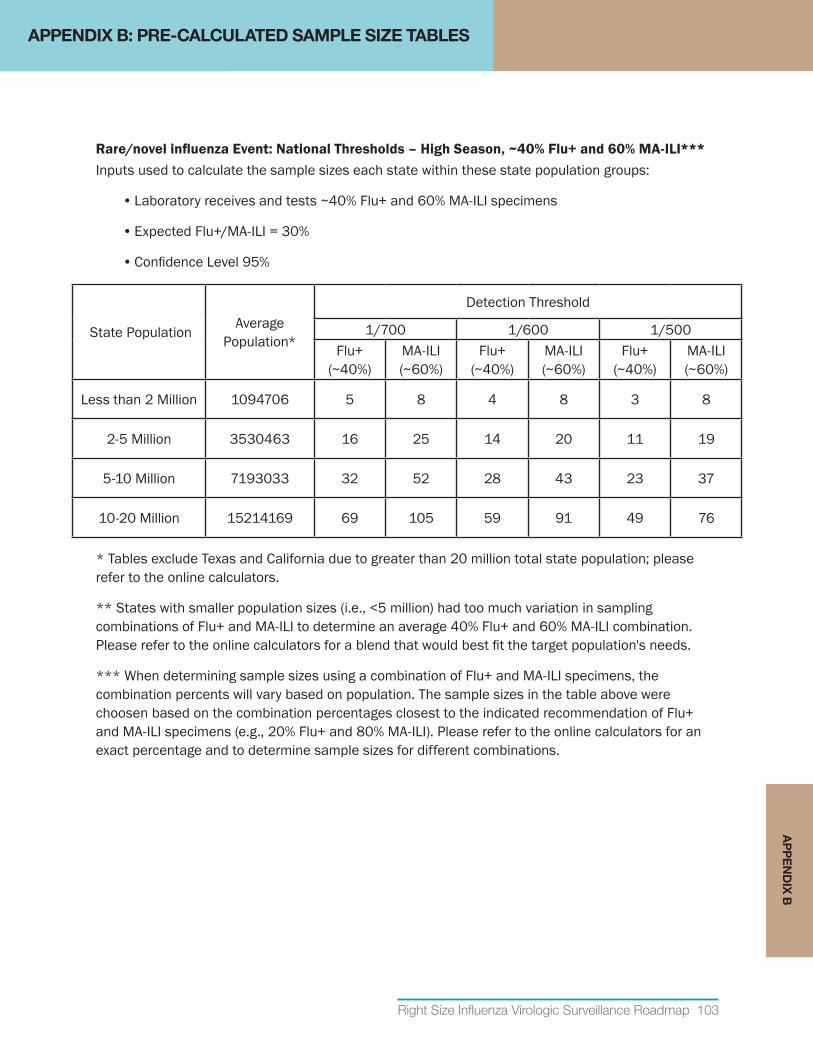
Right Size Influenza Virologic Surveillance Roadmap 103
Rare/novelinfluenzaEvent:NationalThresholds–HighSeason,~40%Flu+and60%MA-ILI***Inputs used to calculate the sample sizes each state within these state population groups:
• Laboratory receives and tests ~40% Flu+ and 60% MA-ILI specimens
• Expected Flu+/MA-ILI = 30%
• Confidence Level 95%
State Population Average Population*
Detection Threshold
1/700 1/600 1/500Flu+
(~40%)MA-ILI (~60%)
Flu+ (~40%)
MA-ILI (~60%)
Flu+ (~40%)
MA-ILI (~60%)
Less than 2 Million 1094706 5 8 4 8 3 8
2-5 Million 3530463 16 25 14 20 11 19
5-10 Million 7193033 32 52 28 43 23 37
10-20 Million 15214169 69 105 59 91 49 76
* Tables exclude Texas and California due to greater than 20 million total state population; please refer to the online calculators.
** States with smaller population sizes (i.e., <5 million) had too much variation in sampling combinations of Flu+ and MA-ILI to determine an average 40% Flu+ and 60% MA-ILI combination. Please refer to the online calculators for a blend that would best fit the target population's needs.
*** When determining sample sizes using a combination of Flu+ and MA-ILI specimens, the combination percents will vary based on population. The sample sizes in the table above were choosen based on the combination percentages closest to the indicated recommendation of Flu+ and MA-ILI specimens (e.g., 20% Flu+ and 80% MA-ILI). Please refer to the online calculators for an exact percentage and to determine sample sizes for different combinations.
APPENDIX B: PRE-CALCULATED SAMPLE SIZE TABLESA
PP
EN
DIX
B
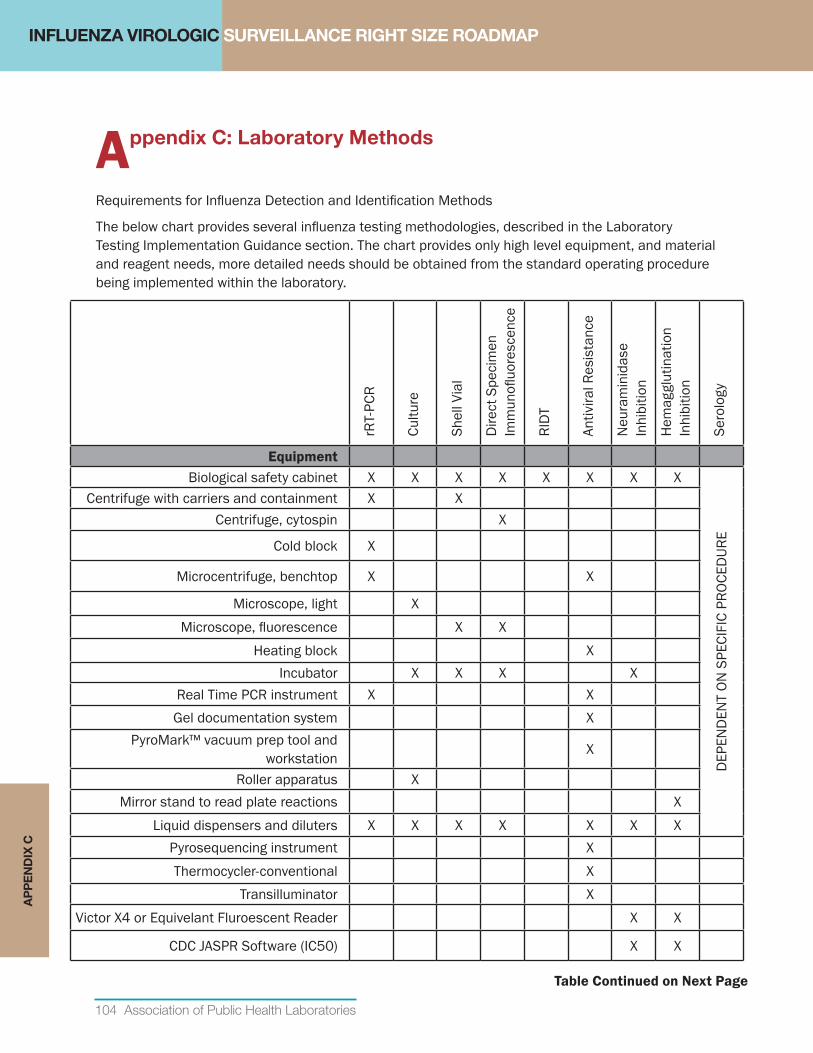
INFLUENZA VIROLOGIC SURVEILLANCE RIGHT SIZE ROADMAP
104 Association of Public Health Laboratories
Appendix C: Laboratory Methods
Requirements for Influenza Detection and Identification Methods
The below chart provides several influenza testing methodologies, described in the Laboratory Testing Implementation Guidance section. The chart provides only high level equipment, and material and reagent needs, more detailed needs should be obtained from the standard operating procedure being implemented within the laboratory.
rRT-
PCR
Cultu
re
Shel
l Via
l
Dire
ct S
peci
men
Im
mun
ofluo
resc
ence
RIDT
Antiv
iral R
esis
tanc
e
Neu
ram
inid
ase
Inhi
bitio
n
Hem
aggl
utin
atio
n In
hibi
tion
Sero
logy
Equipment Biological safety cabinet X X X X X X X X
DEP
END
ENT
ON S
PECI
FIC
PROC
EDUR
E
Centrifuge with carriers and containment X XCentrifuge, cytospin X
Cold block X
Microcentrifuge, benchtop X X
Microscope, light XMicroscope, fluorescence X X
Heating block XIncubator X X X X
Real Time PCR instrument X XGel documentation system X
PyroMark™ vacuum prep tool and workstation X
Roller apparatus XMirror stand to read plate reactions X
Liquid dispensers and diluters X X X X X X XPyrosequencing instrument X Thermocycler-conventional X
Transilluminator X Victor X4 or Equivelant Fluroescent Reader X X
CDC JASPR Software (IC50) X X
AP
PE
ND
IX C
Table Continued on Next Page
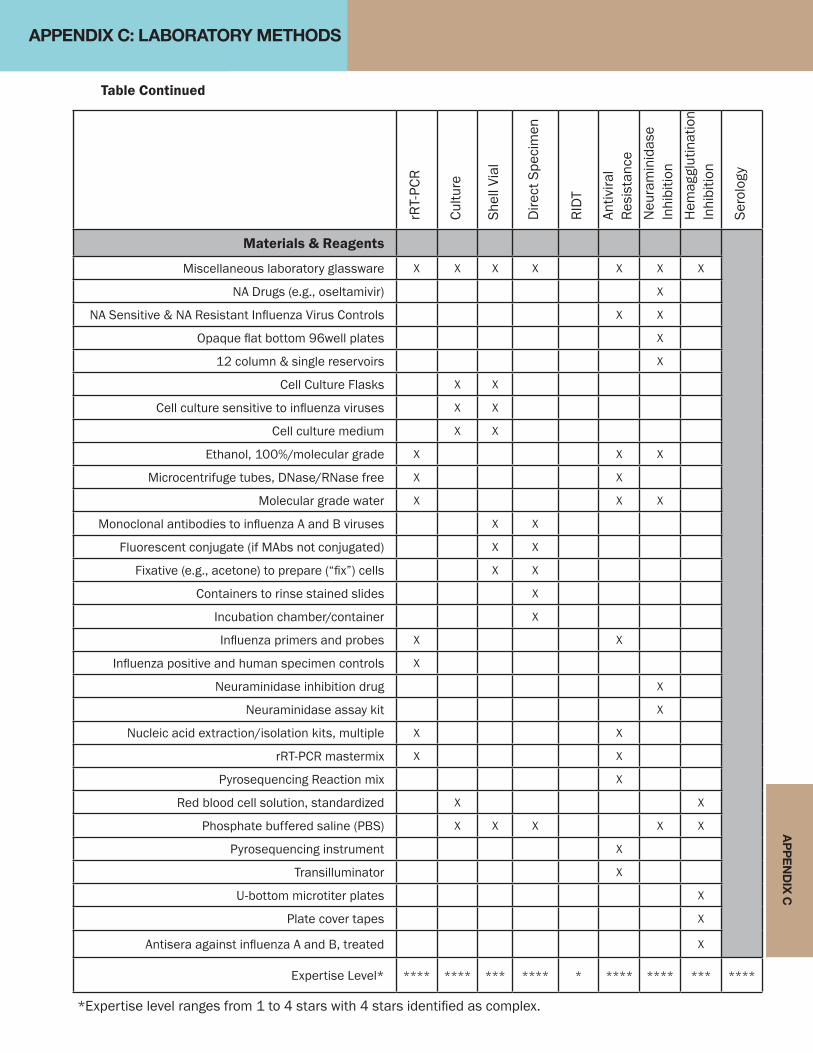
AP
PE
ND
IX C
Table Continued
rRT-
PCR
Cultu
re
Shel
l Via
l
Dire
ct S
peci
men
RIDT
Antiv
iral
Resi
stan
ceN
eura
min
idas
e In
hibi
tion
Hem
aggl
utin
atio
n In
hibi
tion
Sero
logy
Materials & Reagents
Miscellaneous laboratory glassware X X X X X X X
NA Drugs (e.g., oseltamivir) X
NA Sensitive & NA Resistant Influenza Virus Controls X X
Opaque flat bottom 96well plates X
12 column & single reservoirs X
Cell Culture Flasks X X
Cell culture sensitive to influenza viruses X X
Cell culture medium X X
Ethanol, 100%/molecular grade X X X
Microcentrifuge tubes, DNase/RNase free X X
Molecular grade water X X X
Monoclonal antibodies to influenza A and B viruses X X
Fluorescent conjugate (if MAbs not conjugated) X X
Fixative (e.g., acetone) to prepare (“fix”) cells X X
Containers to rinse stained slides X
Incubation chamber/container X
Influenza primers and probes X X
Influenza positive and human specimen controls X
Neuraminidase inhibition drug X
Neuraminidase assay kit X
Nucleic acid extraction/isolation kits, multiple X X
rRT-PCR mastermix X X
Pyrosequencing Reaction mix X
Red blood cell solution, standardized X X
Phosphate buffered saline (PBS) X X X X X
Pyrosequencing instrument X
Transilluminator X
U-bottom microtiter plates X
Plate cover tapes X
Antisera against influenza A and B, treated X
Expertise Level* **** **** *** **** * **** **** *** ****
APPENDIX C: LABORATORY METHODS
*Expertise level ranges from 1 to 4 stars with 4 stars identified as complex.
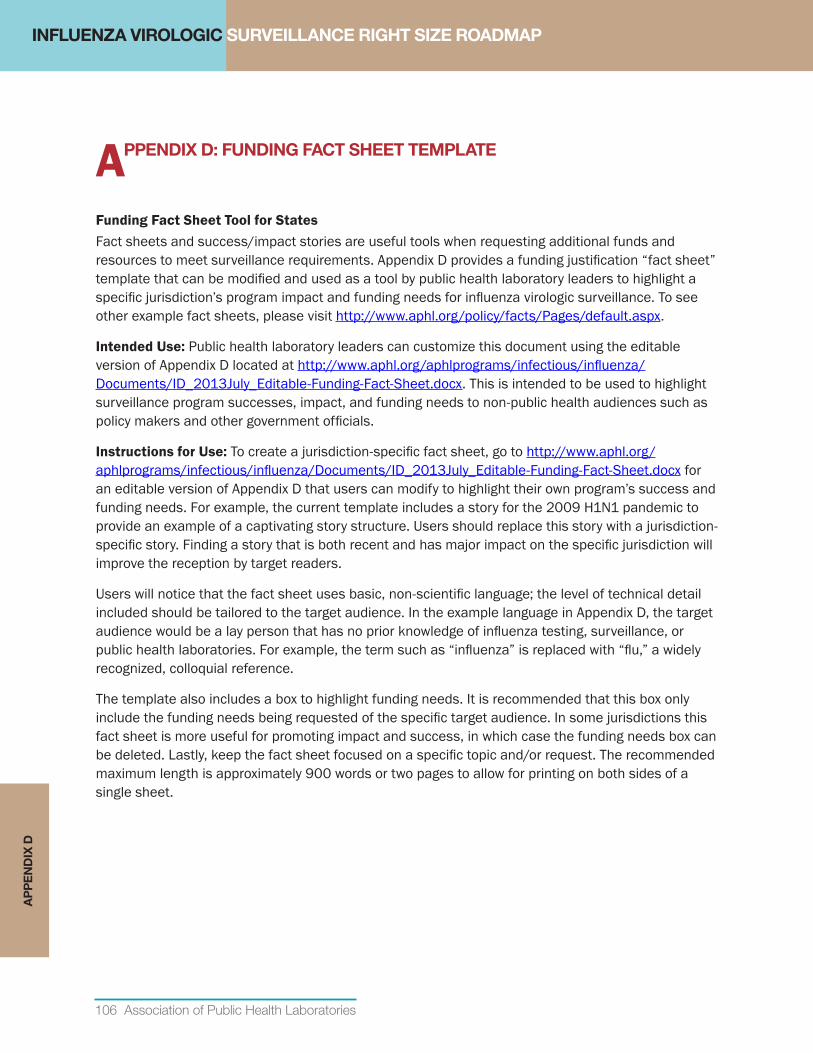
106 Association of Public Health Laboratories
AP
PE
ND
IX D
APPENDIX D: FUNDING FACT SHEET TEMPLATE
FundingFactSheetToolforStatesFact sheets and success/impact stories are useful tools when requesting additional funds and resources to meet surveillance requirements. Appendix D provides a funding justification “fact sheet” template that can be modified and used as a tool by public health laboratory leaders to highlight a specific jurisdiction’s program impact and funding needs for influenza virologic surveillance. To see other example fact sheets, please visit http://www.aphl.org/policy/facts/Pages/default.aspx.
IntendedUse: Public health laboratory leaders can customize this document using the editable version of Appendix D located at http://www.aphl.org/aphlprograms/infectious/influenza/Documents/ID_2013July_Editable-Funding-Fact-Sheet.docx. This is intended to be used to highlight surveillance program successes, impact, and funding needs to non-public health audiences such as policy makers and other government officials.
InstructionsforUse: To create a jurisdiction-specific fact sheet, go to http://www.aphl.org/aphlprograms/infectious/influenza/Documents/ID_2013July_Editable-Funding-Fact-Sheet.docx for an editable version of Appendix D that users can modify to highlight their own program’s success and funding needs. For example, the current template includes a story for the 2009 H1N1 pandemic to provide an example of a captivating story structure. Users should replace this story with a jurisdiction-specific story. Finding a story that is both recent and has major impact on the specific jurisdiction will improve the reception by target readers.
Users will notice that the fact sheet uses basic, non-scientific language; the level of technical detail included should be tailored to the target audience. In the example language in Appendix D, the target audience would be a lay person that has no prior knowledge of influenza testing, surveillance, or public health laboratories. For example, the term such as “influenza” is replaced with “flu,” a widely recognized, colloquial reference.
The template also includes a box to highlight funding needs. It is recommended that this box only include the funding needs being requested of the specific target audience. In some jurisdictions this fact sheet is more useful for promoting impact and success, in which case the funding needs box can be deleted. Lastly, keep the fact sheet focused on a specific topic and/or request. The recommended maximum length is approximately 900 words or two pages to allow for printing on both sides of a single sheet.
INFLUENZA VIROLOGIC SURVEILLANCE RIGHT SIZE ROADMAP
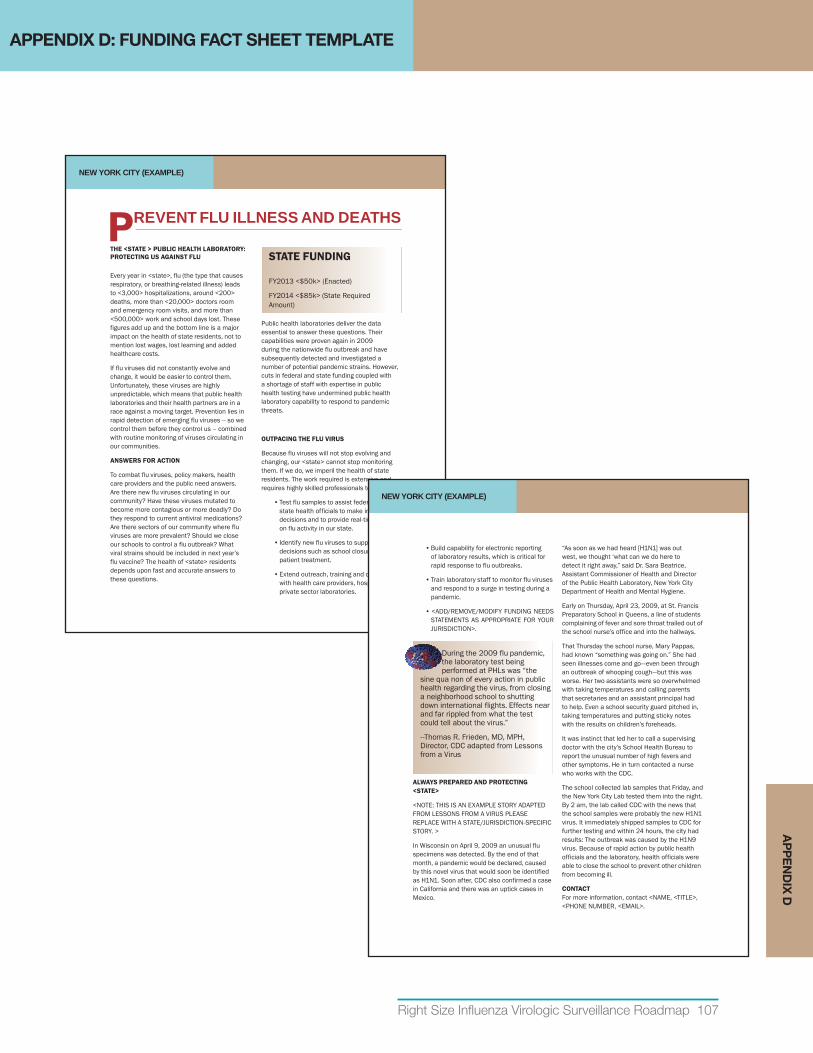
NEW YORK CITY (EXAMPLE)
P
REVENT FLU ILLNESS AND DEATHS
THE <STATE > PUBLIC HEALTH LABORATORY: PROTECTING US AGAINST FLU
Every year in <state>, flu (the type that causes respiratory, or breathing-related illness) leads to <3,000> hospitalizations, around <200> deaths, more than <20,000> doctors room and emergency room visits, and more than <500,000> work and school days lost. These figures add up and the bottom line is a major impact on the health of state residents, not to mention lost wages, lost learning and added healthcare costs.
If flu viruses did not constantly evolve and change, it would be easier to control them. Unfortunately, these viruses are highly unpredictable, which means that public health laboratories and their health partners are in a race against a moving target. Prevention lies in rapid detection of emerging flu viruses -- so we control them before they control us – combined with routine monitoring of viruses circulating in our communities.
ANSWERS FOR ACTION
To combat flu viruses, policy makers, health care providers and the public need answers. Are there new flu viruses circulating in our community? Have these viruses mutated to become more contagious or more deadly? Do they respond to current antiviral medications? Are there sectors of our community where flu viruses are more prevalent? Should we close our schools to control a flu outbreak? What viral strains should be included in next year’s flu vaccine? The health of <state> residents depends upon fast and accurate answers to these questions.
STATE FUNDING
FY2013 <$50k> (Enacted)
FY2014 <$85k> (State Required Amount)
Public health laboratories deliver the data essential to answer these questions. Their capabilities were proven again in 2009 during the nationwide flu outbreak and have subsequently detected and investigated a number of potential pandemic strains. However, cuts in federal and state funding coupled with a shortage of staff with expertise in public health testing have undermined public health laboratory capability to respond to pandemic threats. OUTPACING THE FLU VIRUS Because flu viruses will not stop evolving and changing, our <state> cannot stop monitoring them. If we do, we imperil the health of state residents. The work required is extensive and requires highly skilled professionals to:
• Test flu samples to assist federal and state health officials to make informed decisions and to provide real-time details on flu activity in our state.
• Identify new flu viruses to support policy
decisions such as school closures and patient treatment.
• Extend outreach, training and coordination
with health care providers, hospitals and private sector laboratories.
Right Size Influenza Virologic Surveillance Roadmap 107
AP
PE
ND
IX D
NEW YORK CITY (EXAMPLE)
• Build capability for electronic reporting of laboratory results, which is critical for rapid response to flu outbreaks.
• Train laboratory staff to monitor flu viruses
and respond to a surge in testing during a pandemic.
• <ADD/REMOVE/MODIFY FUNDING NEEDS
STATEMENTS AS APPROPRIATE FOR YOUR JURISDICTION>.
During the 2009 flu pandemic, the laboratory test being performed at PHLs was “the
sine qua non of every action in public health regarding the virus, from closing a neighborhood school to shutting down international flights. Effects near and far rippled from what the test could tell about the virus.”
--Thomas R. Frieden, MD, MPH, Director, CDC adapted from Lessons from a Virus
ALWAYS PREPARED AND PROTECTING <STATE>
<NOTE: THIS IS AN EXAMPLE STORY ADAPTED FROM LESSONS FROM A VIRUS PLEASE REPLACE WITH A STATE/JURISDICTION-SPECIFIC STORY. >
In Wisconsin on April 9, 2009 an unusual flu specimens was detected. By the end of that month, a pandemic would be declared, caused by this novel virus that would soon be identified as H1N1. Soon after, CDC also confirmed a case in California and there was an uptick cases in Mexico.
“As soon as we had heard [H1N1] was out west, we thought ‘what can we do here to detect it right away,” said Dr. Sara Beatrice, Assistant Commissioner of Health and Director of the Public Health Laboratory, New York City Department of Health and Mental Hygiene. Early on Thursday, April 23, 2009, at St. Francis Preparatory School in Queens, a line of students complaining of fever and sore throat trailed out of the school nurse’s office and into the hallways. That Thursday the school nurse, Mary Pappas, had known “something was going on.” She had seen illnesses come and go—even been through an outbreak of whooping cough—but this was worse. Her two assistants were so overwhelmed with taking temperatures and calling parents that secretaries and an assistant principal had to help. Even a school security guard pitched in, taking temperatures and putting sticky notes with the results on children’s foreheads. It was instinct that led her to call a supervising doctor with the city’s School Health Bureau to report the unusual number of high fevers and other symptoms. He in turn contacted a nurse who works with the CDC. The school collected lab samples that Friday, and the New York City Lab tested them into the night. By 2 am, the lab called CDC with the news that the school samples were probably the new H1N1 virus. It immediately shipped samples to CDC for further testing and within 24 hours, the city had results: The outbreak was caused by the H1N9 virus. Because of rapid action by public health officials and the laboratory, health officials were able to close the school to prevent other children from becoming ill. CONTACT For more information, contact <NAME, <TITLE>, <PHONE NUMBER, <EMAIL>.
APPENDIX D: FUNDING FACT SHEET TEMPLATE
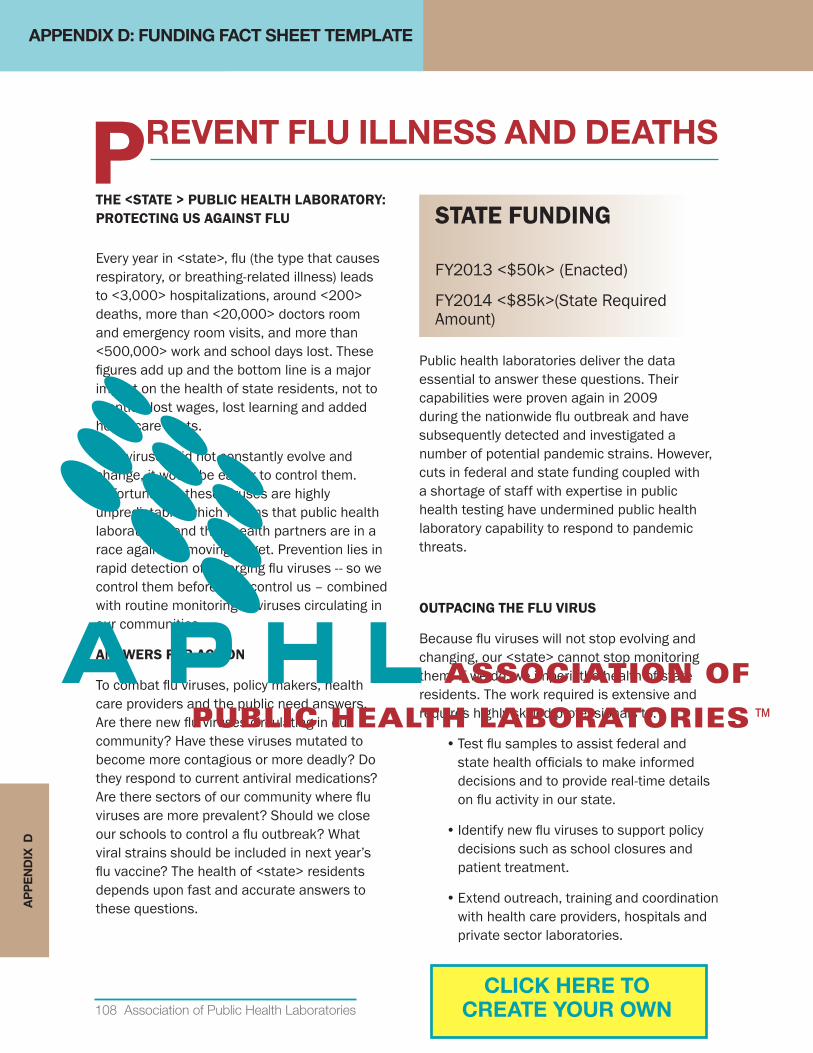
108 Association of Public Health Laboratories
THE<STATE>PUBLICHEALTHLABORATORY:PROTECTINGUSAGAINSTFLU
Every year in <state>, flu (the type that causes respiratory, or breathing-related illness) leads to <3,000> hospitalizations, around <200> deaths, more than <20,000> doctors room and emergency room visits, and more than <500,000> work and school days lost. These figures add up and the bottom line is a major impact on the health of state residents, not to mention lost wages, lost learning and added healthcare costs.
If flu viruses did not constantly evolve and change, it would be easier to control them. Unfortunately, these viruses are highly unpredictable, which means that public health laboratories and their health partners are in a race against a moving target. Prevention lies in rapid detection of emerging flu viruses -- so we control them before they control us – combined with routine monitoring of viruses circulating in our communities.
ANSWERSFORACTION
To combat flu viruses, policy makers, health care providers and the public need answers. Are there new flu viruses circulating in our community? Have these viruses mutated to become more contagious or more deadly? Do they respond to current antiviral medications? Are there sectors of our community where flu viruses are more prevalent? Should we close our schools to control a flu outbreak? What viral strains should be included in next year’s flu vaccine? The health of <state> residents depends upon fast and accurate answers to these questions.
STATEFUNDING
FY2013 <$50k> (Enacted)
FY2014 <$85k>(State Required Amount)
Public health laboratories deliver the data essential to answer these questions. Their capabilities were proven again in 2009 during the nationwide flu outbreak and have subsequently detected and investigated a number of potential pandemic strains. However, cuts in federal and state funding coupled with a shortage of staff with expertise in public health testing have undermined public health laboratory capability to respond to pandemic threats.
OUTPACINGTHEFLUVIRUS
Because flu viruses will not stop evolving and changing, our <state> cannot stop monitoring them. If we do, we imperil the health of state residents. The work required is extensive and requires highly skilled professionals to:
• Test flu samples to assist federal and state health officials to make informed decisions and to provide real-time details on flu activity in our state.
• Identify new flu viruses to support policy decisions such as school closures and patient treatment.
• Extend outreach, training and coordination with health care providers, hospitals and private sector laboratories.
PREVENT FLU ILLNESS AND DEATHS
APPENDIX D: FUNDING FACT SHEET TEMPLATEA
PP
EN
DIX
D
CLICK HERE TO CREATE YOUR OWN
Right Size Influenza Virologic Surveillance Roadmap 109
• Build capability for electronic reporting of laboratory results, which is critical for rapid response to flu outbreaks.
• Train laboratory staff to monitor flu viruses and respond to a surge in testing during a pandemic.
• <ADD/REMOVE/MODIFY FUNDING NEEDS STATEMENTS AS APPROPRIATE FOR YOUR JURISDICTION>.
ALWAYSPREPAREDANDPROTECTING<STATE>
<NOTE: THIS IS AN EXAMPLE STORY ADAPTED FROM LESSONS FROM A VIRUS PLEASE REPLACE WITH A STATE/JURISDICTION-SPECIFIC STORY. >
In Wisconsin on April 9, 2009 an unusual flu specimens was detected. By the end of that month, a pandemic would be declared, caused by this novel virus that would soon be identified as H1N1. Soon after, CDC also confirmed a case in California and there was an uptick cases in Mexico.
“As soon as we had heard [H1N1] was out west, we thought ‘what can we do here to detect it right away,” said Dr. Sara Beatrice, Assistant Commissioner of Health and Director of the Public Health Laboratory, New York City Department of Health and Mental Hygiene.
Early on Thursday, April 23, 2009, at St. Francis Preparatory School in Queens, a line of students complaining of fever and sore throat trailed out of the school nurse’s office and into the hallways.
That Thursday the school nurse, Mary Pappas, had known “something was going on.” She had seen illnesses come and go—even been through an outbreak of whooping cough—but this was worse. Her two assistants were so overwhelmed with taking temperatures and calling parents that secretaries and an assistant principal had to help. Even a school security guard pitched in, taking temperatures and putting sticky notes with the results on children’s foreheads.
It was instinct that led her to call a supervising doctor with the city’s School Health Bureau to report the unusual number of high fevers and other symptoms. He in turn contacted a nurse who works with the CDC.
The school collected lab samples that Friday, and the New York City Lab tested them into the night. By 2 a.m., the lab called CDC with the news that the school samples were probably the new H1N1 virus. It immediately shipped samples to CDC for further testing and within 24 hours, the city had results: The outbreak was caused by the H1N9 virus. Because of rapid action by public health officials and the laboratory, health officials were able to close the school to prevent other children from becoming ill.
CONTACT For more information, contact <NAME, <TITLE>, <PHONE NUMBER, <EMAIL>.
APPENDIX D: FUNDING FACT SHEET TEMPLATEA
PP
EN
DIX
D
During the 2009 flu pandemic, the laboratory test being performed at PHLs was “the
sine qua non of every action in public health regarding the virus, from closing a neighborhood school to shutting down international flights. Effects near and far rippled from what the test could tell about the virus.”
--Thomas R. Frieden, MD, MPH, Director, CDC adapted from Lessons from a Virus
CLICK HERE TO CREATE YOUR OWN
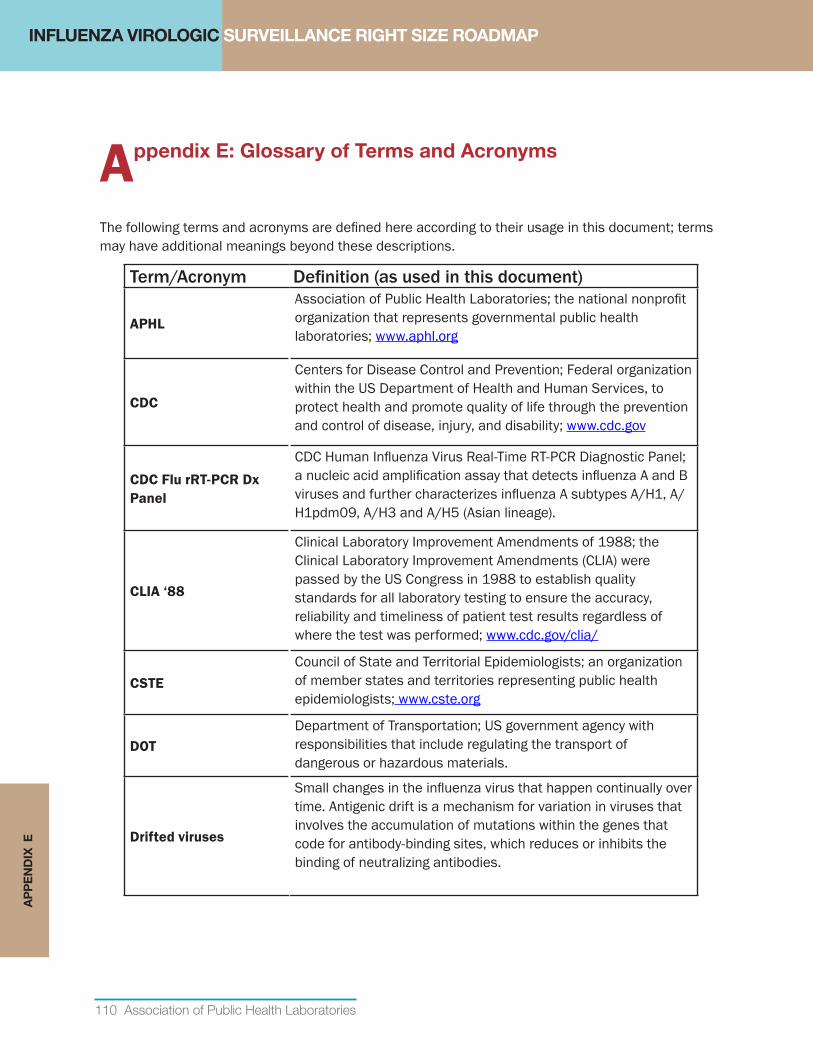
INFLUENZA VIROLOGIC SURVEILLANCE RIGHT SIZE ROADMAP
110 Association of Public Health Laboratories
AP
PE
ND
IX E
Appendix E: Glossary of Terms and Acronyms
The following terms and acronyms are defined here according to their usage in this document; terms may have additional meanings beyond these descriptions.
Term/Acronym Definition (as used in this document)
APHL
Association of Public Health Laboratories; the national nonprofit organization that represents governmental public health laboratories; www.aphl.org
CDC
Centers for Disease Control and Prevention; Federal organization within the US Department of Health and Human Services, to protect health and promote quality of life through the prevention and control of disease, injury, and disability; www.cdc.gov
CDC Flu rRT-PCR Dx Panel
CDC Human Influenza Virus Real-Time RT-PCR Diagnostic Panel; a nucleic acid amplification assay that detects influenza A and B viruses and further characterizes influenza A subtypes A/H1, A/H1pdm09, A/H3 and A/H5 (Asian lineage).
CLIA‘88
Clinical Laboratory Improvement Amendments of 1988; the Clinical Laboratory Improvement Amendments (CLIA) were passed by the US Congress in 1988 to establish quality standards for all laboratory testing to ensure the accuracy, reliability and timeliness of patient test results regardless of where the test was performed; www.cdc.gov/clia/
CSTECouncil of State and Territorial Epidemiologists; an organization of member states and territories representing public health epidemiologists; www.cste.org
DOTDepartment of Transportation; US government agency with responsibilities that include regulating the transport of dangerous or hazardous materials.
Driftedviruses
Small changes in the influenza virus that happen continually over time. Antigenic drift is a mechanism for variation in viruses that involves the accumulation of mutations within the genes that code for antibody-binding sites, which reduces or inhibits the binding of neutralizing antibodies.
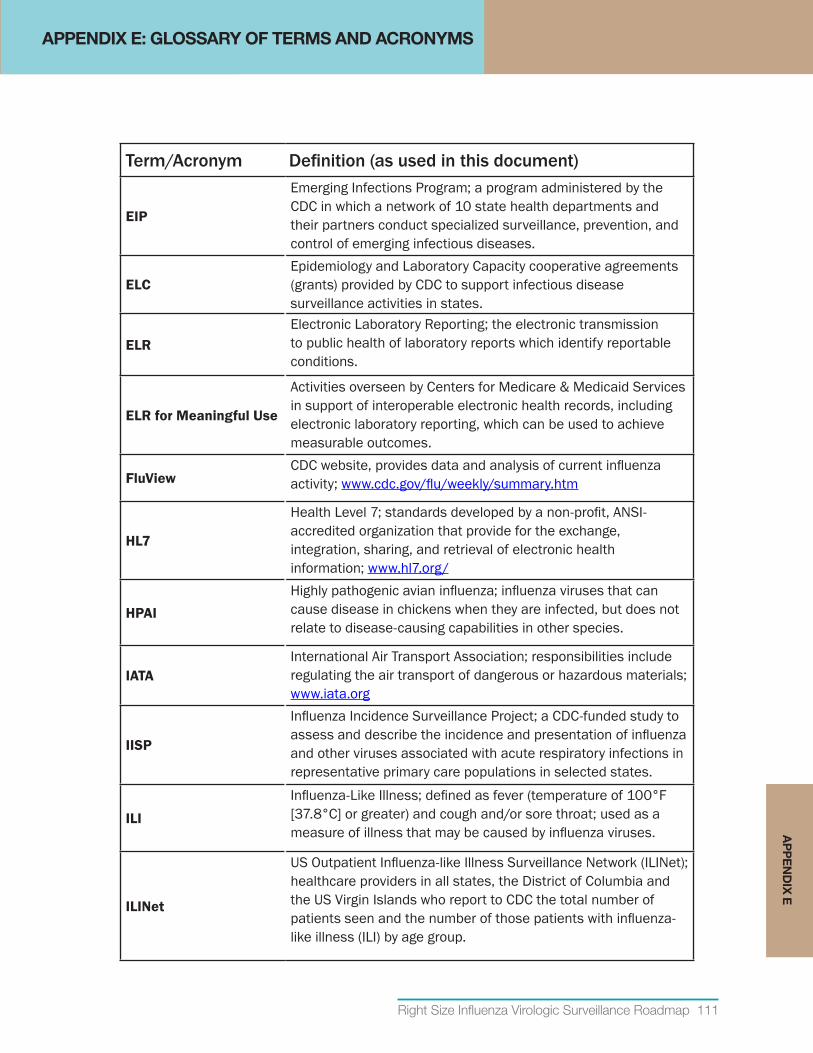
Right Size Influenza Virologic Surveillance Roadmap 111
AP
PE
ND
IX E
Term/Acronym Definition (as used in this document)
EIP
Emerging Infections Program; a program administered by the CDC in which a network of 10 state health departments and their partners conduct specialized surveillance, prevention, and control of emerging infectious diseases.
ELCEpidemiology and Laboratory Capacity cooperative agreements (grants) provided by CDC to support infectious disease surveillance activities in states.
ELRElectronic Laboratory Reporting; the electronic transmission to public health of laboratory reports which identify reportable conditions.
ELRforMeaningfulUse
Activities overseen by Centers for Medicare & Medicaid Services in support of interoperable electronic health records, including electronic laboratory reporting, which can be used to achieve measurable outcomes.
FluViewCDC website, provides data and analysis of current influenza activity; www.cdc.gov/flu/weekly/summary.htm
HL7
Health Level 7; standards developed by a non-profit, ANSI-accredited organization that provide for the exchange, integration, sharing, and retrieval of electronic health information; www.hl7.org/
HPAIHighly pathogenic avian influenza; influenza viruses that can cause disease in chickens when they are infected, but does not relate to disease-causing capabilities in other species.
IATAInternational Air Transport Association; responsibilities include regulating the air transport of dangerous or hazardous materials; www.iata.org
IISP
Influenza Incidence Surveillance Project; a CDC-funded study to assess and describe the incidence and presentation of influenza and other viruses associated with acute respiratory infections in representative primary care populations in selected states.
ILI
Influenza-Like Illness; defined as fever (temperature of 100°F [37.8°C] or greater) and cough and/or sore throat; used as a measure of illness that may be caused by influenza viruses.
ILINet
US Outpatient Influenza-like Illness Surveillance Network (ILINet); healthcare providers in all states, the District of Columbia and the US Virgin Islands who report to CDC the total number of patients seen and the number of those patients with influenza-like illness (ILI) by age group.
APPENDIX E: GLOSSARY OF TERMS AND ACRONYMS
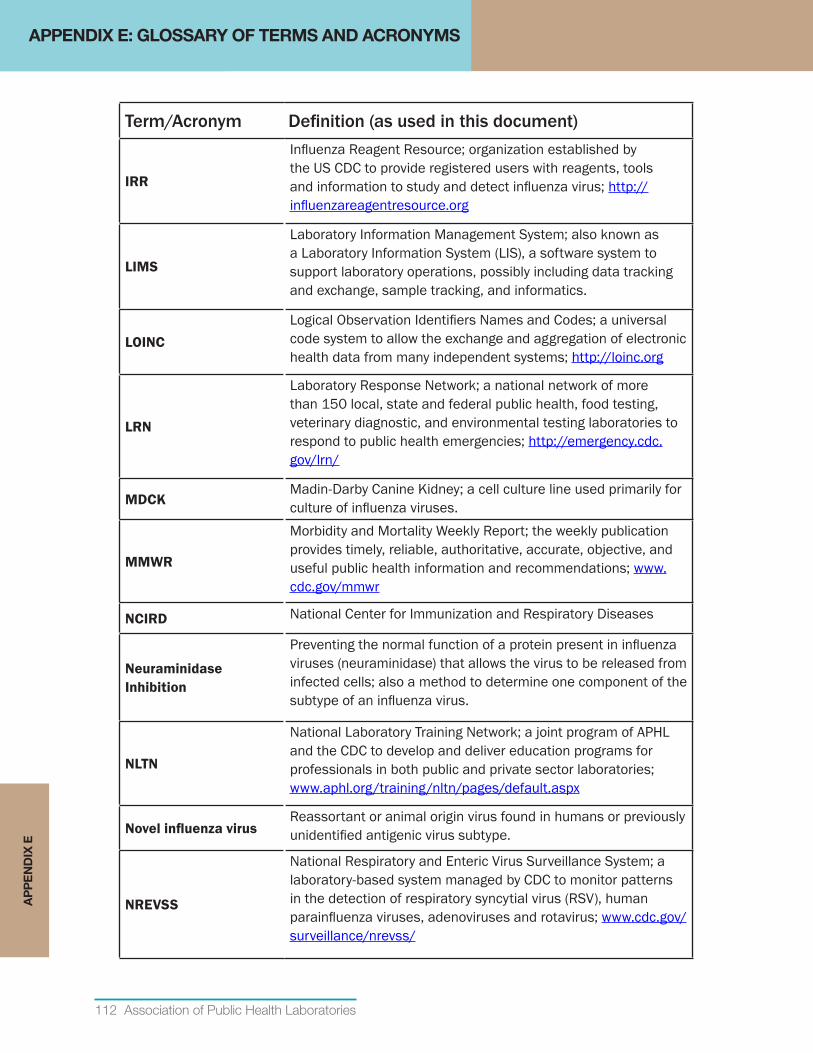
112 Association of Public Health Laboratories
APPENDIX E: GLOSSARY OF TERMS AND ACRONYMSA
PP
EN
DIX
E
Term/Acronym Definition (as used in this document)
IRR
Influenza Reagent Resource; organization established by the US CDC to provide registered users with reagents, tools and information to study and detect influenza virus; http://influenzareagentresource.org
LIMS
Laboratory Information Management System; also known as a Laboratory Information System (LIS), a software system to support laboratory operations, possibly including data tracking and exchange, sample tracking, and informatics.
LOINCLogical Observation Identifiers Names and Codes; a universal code system to allow the exchange and aggregation of electronic health data from many independent systems; http://loinc.org
LRN
Laboratory Response Network; a national network of more than 150 local, state and federal public health, food testing, veterinary diagnostic, and environmental testing laboratories to respond to public health emergencies; http://emergency.cdc.gov/lrn/
MDCKMadin-Darby Canine Kidney; a cell culture line used primarily for culture of influenza viruses.
MMWR
Morbidity and Mortality Weekly Report; the weekly publication provides timely, reliable, authoritative, accurate, objective, and useful public health information and recommendations; www.cdc.gov/mmwr
NCIRD National Center for Immunization and Respiratory Diseases
Neuraminidase Inhibition
Preventing the normal function of a protein present in influenza viruses (neuraminidase) that allows the virus to be released from infected cells; also a method to determine one component of the subtype of an influenza virus.
NLTN
National Laboratory Training Network; a joint program of APHL and the CDC to develop and deliver education programs for professionals in both public and private sector laboratories; www.aphl.org/training/nltn/pages/default.aspx
NovelinfluenzavirusReassortant or animal origin virus found in humans or previously unidentified antigenic virus subtype.
NREVSS
National Respiratory and Enteric Virus Surveillance System; a laboratory-based system managed by CDC to monitor patterns in the detection of respiratory syncytial virus (RSV), human parainfluenza viruses, adenoviruses and rotavirus; www.cdc.gov/surveillance/nrevss/
Right Size Influenza Virologic Surveillance Roadmap 113
INFLUENZA VIROLOGIC SURVEILLANCE RIGHT SIZE ROADMAP
Appendix F: Additional Resources
APHL’sInfectiousDiseasePlanningandResponseFrameworkChecklistA checklist to be used by public health laboratory leaders and scientists that outlines the various elements public health laboratories must address with each disease outbreak or emerging threat.
http://www.aphl.org/MRC/Documents/ID_2013May_Infectious-Disease-Planning-and-Response-Framework-Checklist.pdf
CDC’sFluViewFluView provides regular summary reports of influenza activity including interactive maps, viral surveillance data, antigenic characterization, antiviral resistance, novel influenza activity, and many other valuable data summaries.
www.cdc.gov/flu/weekly/fluactivitysurv.htm
CDC’sSeasonalInfluenzaWebsiteCDC’s website provides up to date information on current seasonal influenza activity as well as critical updates regarding any emerging viruses or issues.
www.cdc.gov/flu/
ClinicalDescription&LabDiagnosisofInfluenzawww.cdc.gov/flu/professionals/diagnosis/index.htm
Google Flu Trendswww.google.org/flutrends/
InfluenzaVirologicSurveillanceRightSizeSampleSizeCalculatorshttp://www.aphl.org/aphlprograms/infectious/influenza/Pages/Influenza-Virologic-Right-Size-Sample-Size-Calculators.aspx
InterimGuidanceonUseofIntervals,Triggers,andActionsforNovelInfluenzaA(H1N1)Responsewww.flu.gov/planning-preparedness/federal/operationalplans.html# (Appendix A)
JointCommission:StrategiesforImprovingRapidInfluenzaTestinginAmbulatorySettings(SIRAS) www.jointcommission.org/siras.aspx
AP
PE
ND
IX F
114 Association of Public Health Laboratories
AP
PE
ND
IX F
APPENDIX F: ADDITIONAL RESOURCES
LaboratoryEfficienciesInitiative(LEI)ResourcesandToolsThis website provides resources and tools for the LEI that have been designed to address the needs of public health laboratories. Current available resources assist with services changes, legal considerations for sharing services and third-party billing, such as “A Practical Guide to Assessing and Planning Implementation of Public Health Laboratory Service Changes.”
www.aphl.org/aphlprograms/lss/Laboratory-Efficiencies-Initiative/Pages/Resources-and-Tools.aspx
LaboratorySystemImprovementProgram(L-SIP)APHL’s Laboratory System Improvement Program (L-SIP) advances the efficacy of state and local public health laboratory systems through engaging partners in a guided process of performance evaluation, system improvements, and periodic evaluation and reassessment. Participating member laboratories receive resources and technical assistance to guide them on their way to system excellence.
www.aphl.org/aphlprograms/lss/performance/pages/default.aspx
PHEP Cooperative Agreements (PHEP)CDC’s PHEP website provides valuable resources including cooperative agreement guidance, training videos, and CDC’s “National Standards for Public Health Preparedness Capabilities” document.
www.cdc.gov/phpr/coopagreement.htm
RapidInfluenzaDiagnosticTestingGuidance for Clinicians on the Use of Rapid Influenza Diagnostic Tests
www.cdc.gov/flu/professionals/diagnosis/clinician_guidance_ridt.htm
RapidDiagnosticTestingforInfluenzawww.cdc.gov/flu/professionals/diagnosis/rapidlab.htm
WHOInterimGlobalSurveillanceStandardsforInfluenzaThis document proposes surveillance objectives and describes global standards for a minimal basic respiratory disease surveillance system for the monitoring of influenza.
www.who.int/influenza/resources/documents/INFSURVMANUAL.pdf
WHOGlobalInfluenzaSurveillanceNetwork–ManualforthelaboratorydiagnosisandvirologicalsurveillanceofinfluenzaWHO has developed this manual in order to strengthen the laboratory diagnosis and virological surveillance of influenza infection by providing standard methods for the collection, detection, isolation and characterization of viruses.
http://whqlibdoc.who.int/publications/2011/9789241548090_eng.pdf
Right Size Influenza Virologic Surveillance Roadmap 115
RE
FER
EN
CE
S
References
1. US Department of Health and Human Services. (2012). 2009 H1N1 Influenza Improvement Plan. Retrieved from Public Health Emergency: http://www.phe.gov/Preparedness/mcm/h1n1-retrospective/Documents/2009-h1n1-improvementplan.pdf
2. APHL. (2012). The Influenza Virologic Surveillance Landscape of State and Local Public Health Laboratories. Retrieved from http://www.aphl.org/AboutAPHL/publications/Documents/ID_2012June_The-Influenza-Virologic-Surveillance-Landscape-of-State-and-Local-Public-Health-Laboratories.pdf
3. Jernigan, D., Lindstrom, S., Johnson, J., Miller, J., Hoelscher, M., Humes, R.,... Shaw, M. (2011). Detecting 2009 Pandemic Influenza A(H1N1) Virus Infection: Availability of Diagnostic Testing Led to Rapid Pandemic Response. 52(S1), S36-S43.
4. US Department of Health & Human Services. (2008, August). Key Elements of Departmental Pandemic Influenza Operational Plans. Retrieved from FLU.GOV: http://www.flu.gov/planning-preparedness/federal/operationalplans.html#
5. CDC. (2008). Manual for the surveillance of vaccine-preventable diseases. Retrieved from http://www.cdc.gov/vaccines/pubs/surv-manual/index.html
6. Uyeki TM, P. R. (2009, May 1). Low sensitivity of rapid diagnostic test of influenza. Clin Infect Dis(48), e89.
7. CDC. (2009). Evaluation of rapid influenza diagnostic tests for detection of novel influenza A(H1N1)virus--United States, 2009. MMWR(58), 826-9.
8. Balish A, G. R. (2012, September 18). Analytical detection of influenza A(H3N2)v and other A viariant viruses from the USA by rapid influenza diagnostic tests. Influenza Other Respi Virsues, Epub ahead of print.
9. CDC. (2012, October 5). Overview of Influenza Surveillance in the United States. Retrieved from Seasonal Influenza (Flu): http://www.cdc.gov/flu/weekly/overview.htm
10. APHL. (2011). Lessons from a Virus.
11. APHL. (2010). The Core Functions of State Public Health Laboratories. Retrieved from http://www.aphl.org/aboutaphl/publications/documents/com_2010_corefunctionsphls.pdf
12. APHL. (2007). Definition of a State Public Health Laboratory System. Retrieved from http://www.aphl.org/AboutAPHL/publications/Documents/Definition_of_a_State_PHL_System_2007.pdf
13. CDC. (2011, March). National Standards for State and Local Planning. Retrieved from http://www.cdc.gov/phpr/capabilities/DSLR_capabilities_July.pdf
14. APHL. (2013). Laboratory System Improvement Program. Retrieved from http://www.aphl.org/aphlprograms/lss/performance/pages/default.aspx
15. APHL. (2013). Laboratory Efficiencies Initiative. Retrieved from http://www.aphl.org/aphlprograms/lss/Laboratory-Efficiencies-Initiative/Pages/default.aspx
16. CDC. (2013, April 2). Office of Public Health Preparedness and Response: Funding and Guidance for State and Local Health Departments. Retrieved from http://www.cdc.gov/phpr/coopagreement.htm
REFERENCES
INFLUENZA VIROLOGIC SURVEILLANCE RIGHT SIZE ROADMAP
116 Association of Public Health Laboratories
RE
FER
EN
CE
S 17. CDC. (2012, July 2). Emergency Preparedness and Response: The Laboratory Response Network Partners in Preparedness. Retrieved from http://www.bt.cdc.gov/lrn/
18. CDC, & CSTE. (2008, February). Competencies for Applied Epidemiologists in Governmental Public Health Agencies (AECs). Retrieved from http://www.cdc.gov/appliedepicompetencies/downloads/Applied_Epi_Comps.pdf
19. Institute of Medicine (US) Forum on Medical and Public Health Preparedness for Catastrophic Events. (2010). The Communications Challenge: Definitions, Standards, and Metrics. Medical Surge Capacity: Workshop Summary. Washington (DC): National Academies Press (US). Retrieved from http://www.ncbi.nlm.nih.gov/books/NBK32856/
20. APHL. (2012). APHL-CDC Influenza Laboratory Resource and Process Modeling Project.
21. APHL. (2013, May ). Infectious Disease Planning and Response Framework Checklist. Retrieved from http://www.aphl.org/MRC/Documents/ID_2013May_Infectious-Disease-Planning-and-Response-Framework-Checklist.pdf
22. Scarpino S, D. N. (2012, April 12). Optimizing provider recruitment for influenza surveillance networks. 8(4), e1002472.
23. CDC. (2010). National Ambulatory Medical Care Survey: 2010 Summary Tables. Retrieved from http://www.cdc.gov/nchs/data/ahcd/namcs_summary/2010_namcs_web_tables.pdf
24. World Health Organization. (2008). International Health Regulations (2005). Retrieved from World Health Organization: http://whqlibdoc.who.int/publications/2008/9789241580410_eng.pdf
25. Department of Transportation. (2013). DOT: Pipeline and Hazardous Materials Safety Administration Regulations. Retrieved from http://phmsa.dot.gov/regulations
26. IATA. (2013). IATA: Dangerous Goods Regulations. Retrieved from http://www.iata.org/publications/dgr/Pages/index.aspx
27. World Health Organization. (2011). WHO Global Influenza Surveillance Network: Manual for the laboratory diagnosis of virological surveillance of influenza. Geneva: World Health Organization. Retrieved from http://whqlibdoc.who.int/publications/2011/9789241548090_eng.pdf
28. Health Resources and Services Administration. (n.d.). Efforts to Expand and Accelerate Health Center Program. Retrieved from http://bphc.hrsa.gov/ftca/riskmanagement/healthcenterqualityimprovement.pdf
29. US Department of Veterans Affairs. (n.d.). Facility Directory. Retrieved from United State Department of Veterans Affairs: http://www2.va.gov/directory/guide/home.asp?isflash=1
30. Partnership for Public Service. (2013, March 11). Federal Faces: Lynnette Brammer. The Washington Post. Retrieved from http://www.washingtonpost.com/local/dc-politics/federal-faces-lynnette-brammer/2013/03/11/7d109f12-8a89-11e2-98d9-3012c1cd8d1e_story.html
31. CDC. (2012, November 13). Guidance for Clinicians on the Use of Rapid Influenza Diagnostic Tests. Retrieved May 2013, from Seasonal Influenza (Flu): http://www.cdc.gov/flu/professionals/diagnosis/clinician_guidance_ridt.htm
32. CDC. (2012). Evaluation of 11 Commercially Available Rapid Influenza Diagnostic Tests--United States, 2011-2012. 61(43), 873-876.