the influence of technical support, perceived self
TRANSCRIPT

112
THE INFLUENCE OF TECHNICAL SUPPORT, PERCEIVED SELF-EFFICACY, AND INSTRUCTIONAL DESIGN ON
STUDENTS’ USE OF LEARNING MANAGEMENT SYSTEMS
Dr. Sultan Hammad ALSHAMMARIORCID: 0000-0001-7294-9053
Faculty of EducationUniversity of Ha’il
Ha’il, SAUDI ARABIA
Received: 10/08/2019 Accepted: 21/02/2020
ABSTRACT Learning Management System is a software-based technology that is widely adopted by universities. While the implementation of LMS has been successful in developed countries, the utilisation of LMS in developing countries is still considered low. It is believed that there are some barriers that may influence the use of LMS which include Technical Support, Instructional Design and Self-Efficacy. The present research aims at exam-ining the influence of these factors on students’ use of LMS. Thus, a research model will be developed based on extending Technology Acceptance Model (TAM). Using the Stratified Random Sampling (SRS), 400 students were selected from three Saudi universities. The participants completed the survey questionnaire that measures their responses to the seven constructs. The data was analysed using Structural Equation Mod-elling by AMOS. The results showed that the three proposed external factors including technical support, instructional design and perceived self-efficacy had a significant influence on students’ use of LMS. These factors had significant direct effects on both perceived ease of use and perceived usefulness of LMS. The re-sults confirmed the validity of the extended TAM model in determining users’ usage of LMS. The study also addressed several significant implications for the practitioners and researchers in the field.
Keywords: Learning Management System, Technology Acceptance Model, Technical Support, Self-Efficacy, Instructional Design.
INTRODUCTIONLearning Management System (LMS) is a web-based application which implements internet services and web technologies to support the creation of online courses, delivery and maintenance, enrolment and man-agement of students, administration of educational activities, and reporting the performance of students (Dagger, O’Connor, Lawless, Walsh, & Wade, 2007). Using LMS, learners are authorised to use multiple available features such as chatrooms, threaded discussion, and other ways of communication (Ssekakubo, Suleman, & Marsden, 2013). Goh, Hong and Gunawan (2013) defined LMS as a type of course application that manages and provides learners 24/7 access to the subjects’ materials and also facilitates the reporting and monitoring students’ activities. There has been a permanent rise in the LMS market and its usage in the higher education (Kember, Mc-Naught, Chong, Lam, & Cheng, 2010). Researches have revealed that 90% of American universities offer learners with courses and programmes through the use of LMS (Arroway, Davenport, Xu, & Updegrove, 2010). LMS has been adopted and used increasingly in Asia (Bonk, Lee, & Reynolds, 2009). In the Middle East region, the same pattern is found as LMS is becoming a promising tool (Robinson & Ally, 2009). A survey regarding e-learning services involving 26 Arab universities revealed that 96% of these universities have implemented and used LMS as a learning environment to support learning activities (Abdallah, 2010).In Saudi Arabia, a remarkable development in technologies has taken place. Universities have implemented LMS along with other tools such as smart classrooms, interactive board, e-attendance, and video conference
Turkish Online Journal of Distance Education-TOJDE July 2020 ISSN 1302-6488 Volume: 21 Number: 3 Article 9

113
(Unnisa, 2014). It is the result of the unlimited support and effort provided to the universities by the Minis-try of Higher Education. The National Centre for E-learning and Distance Learning (NCeDL) was founded by the Higher Education Ministry in Saudi Arabia with the main aim of assisting in planning and providing educational tools and technologies for the local universities (Mirza, 2007). The NCeDL collaborated with a Meteor group of companies located in Malaysia and contributed to the development of e-learning services by designing its own LMS known as JASUR LMS (Al-Khalifa, 2010a). The JASUR LMS is not the only e-learning application implemented in Saudi universities. Other LMSs such as Moodle, Blackboard, and Design2learn have also been implemented in numerous Saudi universities (Alharbi & Drew, 2014).However, the utilisation of LMS in Saudi Arabia is still not holistic. Al-Judi (2011) reported that the overall utilisation of LMS in Saudi Arabia is still below the satisfactory and required level. Other studies in Saudi Arabia have revealed that the utilisation level of technology for educational uses is still far from the requisite and adequate level (Al-Kahtani, 2006; Alnujaidi, 2008; Al-Judi, 2011; Bousbahi & Alrazgan, 2015). It is believed that university students in Saudi Arabia face multiple barriers. Research have shown that the adoption and use of LMS is complex and can be influenced by different factors (Sa´nchez et al., 2013; Fathema et al., 2015; Algahtani, 2017). In Saudi Arabia which is one of the developing countries, it is believed that there are some barriers that may prevent from accepting and using LMS, which comprise of organisational, technological, and social personal barriers, namely from technical support, instructional design, and perceived self-efficacy (Asiri et al., 2012). Based on the literature review conducted in the present study, on all the studies that used TAM (whether original or extended TAM) for examining the influence of different factors on LMS usage, the influences of technical support, instructional design, and perceived self-efficacy on LMS usage have not been yet examined, not only in the context of Sau-di Arabia but even globally. Since the adoption and use of LMS is a complex phenomenon which involves a complex interplay of internal and external factors, several researches have showed the need for further developing models to examine other factors which may have a significant influence on LMS usage (Hussein et al., 2007; Fathema, 2013; Fathema et al. 2015; Aliks et al., 2017). Hence, based on extending TAM, a theoretical framework model is proposed in this paper to examine the influence of technical support, in-structional design, and perceived self-efficacy on students’ use of LMS. The proposed model will contribute to literature, specifically to TAM literature, and will provide decision makers and Saudi Arabian universities with deeper understanding and proper insight regarding which factors may influence the students’ intention towards the usage of LMS
LITERATURE REVIEWSome studies have been conducted using TAM (weather the original or extended TAM) to examine the influence of different factors on LMS usage. Al-hawari and Mouakket (2010) conducted a study for exam-ining the impact of the original TAM factors along with some extra external factors such as feature design of blackboard and enjoyment on students’ e-satisfaction and e-retention using Blackboard in United Arab Emirates. Almarashdeh et al. (2011) used the original TAM model without extending it to examine its main factors (perceived usefulness and perceived ease of use) on both students and instructors’ use and acceptance of LMS in Malaysia and tested the TAM applicability. Al-Aulamie et al. (2012) extended TAM model to include some external factors, namely computer playfulness and enjoyment, in order to examine their effects on undergraduates and postgraduates’ behavioural intention to use LMS in the UK. Sa´nchez et al. (2013) conducted an empirical study to examine the factors which are responsible for deter-mining the acceptance and use of LMS (WebCT) among students in Spain. They extended TAM to include two external factors (Technical support and computer self-efficacy along with the original TAM factors) and examined their influences on LMS use and acceptance among students. Furthermore, Cheng (2013) ex-tended TAM model to include the interactivity factors (controllability, responsiveness, and personalisation) and enjoyment and examined their influences on students’ behavioural intention for using LMS in Taiwan. The results have revealed that the interactivity factors and enjoyment indirectly affected students’ behaviour intention to use LMS via perceived usefulness and perceived ease of use. Coşkunçay and Özkan (2013) conducted a study to understand academics’ behavioural intention in higher education toward using LMS and determined the factors beyond that. They extended TAM model to include these external factors such as

114
technology complexity, self-efficacy, compatibility, and subjective norms and examined their influences on academics’ behavioural intention to use LMS. Majdalawi et al. (2014) applied TAM including its core component constructs: perceived usefulness and perceived ease of use and adding additional external factors, namely GPA, faculty, and academic year, to examine their influences on students’ behavioural intention to use LMS (Moodle). The results confirmed the findings of original TAM and showed that the academic year and GPA had no effect on perceived ease of use whereas they affected the perceived usefulness. The faculty had an effect on both perceived usefulness and perceived ease of use. Moreover, Juhary (2014) conducted an empirical study using the original TAM constructs such as perceived usefulness and perceived ease of use to examine their influence on students’ atti-tude and behavioural intention to use LMS in Malaysia. However, there are criticisms on using the original TAM without extending it as the main components of TAM, which are various external factors can influence perceived usefulness and perceived ease of use, which are needed to be examined to provide a better under-standing about how users intend to use and accept a technology. Shin and Kang (2015) extended TAM and included some external added factors, such as self-efficacy, system accessibility and subjects’ norms, to examine their influences on students’ behavioural intention to use LMS through a mobile application. Furthermore, Fathema et al. (2015) extended TAM model to include factors, such as perceived computer self-efficacy, system quality and facilitation conditions, to examine their effect on TAM belief constructs, such as perceived usefulness and perceived ease of use that have significant effect on academics’ behavioural intention to use and their actual use of LMS. Results revealed that the added external factors were significant predictors of academics’ behavioural intention towards using LMS and the results confirmed the validity of extended TAM for explaining and determining the individuals’ behaviour regarding accepting technology.Fisol et al. (2016) conducted a study to examine the influence of the main original TAM construct: perceived ease of use and perceived usefulness on educators’ behavioural intention to use LMS at the University of Teknologi Mara (UiTM) in Malays, and the results showed that both PU and PEU had a significant direct effect on educators’ behavioural intention to use LMS. In the same year, another study was conducted by Cigdem and Ozturk (2016) who extended TAM model to examine the influence of multimedia instruction, system interactivity, and self-efficacy on students’ behavioural intention to use LMS through PU and PEU and perceived satisfaction, in a secondary military school in Turkey. The results showed that multimedia in-struction had a significant direct effect on both PEU and PU, whereas system interactivity had a significant direct effect on only perceived satisfaction. Perceived self-efficacy did not take any position in their model as it did not have any influence on other constructs. Furthermore, perceived satisfaction was also influenced by both PU and PEU. Perceived Ease of use had a direct influence on perceived usefulness and perceived usefulness had a great influence on students’ behavioural intention to use LMS.Baleghi-Zadeh et al. (2017) extended TAM model to examine the influence of technical support and system interactivity on students’ behavioural intention and use of LMS through PEU and PU, in higher education in Malaysia. The results revealed that system interactivity had a direct significant effect on perceived usefulness, but not on the perceived ease of use. Technical support had a direct significant effect on perceived ease of use but not on perceived usefulness. Furthermore, another study was conducted by Essel and Wilson (2017) who applied the original TAM without extending it to examine the influence of the original constructs: Perceived ease of use and perceived usefulness on students’ behavioural intention to use LMS at University of Education in Winneba, inGhana. The findings revealed that both Perceived ease of use and perceived usefulness were the main determinants of the students’ behavioural intention toward the usage of LMS.As far as Saudi Arabia is concerned, recently TAM was used only in two studies for examining users’ be-havioural intention and their use of LMS. Alharbi and Drew (2014) extended TAM model to incorporate additional external factors, such as the usage experience of LMS and job relevance, along with the original TAM constructs to examine their influence on academics’ behavioural intention towards using LMS. The findings revealed that all mentioned factors, directly or indirectly, influenced on academics’ behavioural in-tention to use LMS. These results confirmed the applicability of TAM to explain the behavioural intention of users to use LMS and in line with the findings of original TAM. A year later, Bousbahi and Alrazgan (2015) conducted an empirical study to understand the factors that may lead to not fully use LMS among academics. They extended TAM model to include external factors, namely origination support, load anxiety

115
and motivation, and examined their influences on academics’ behavioural intention and their use of LMS. Findings revealed that these external factors played significant roles in affecting the academics’ perception toward the usage of LMS through the perceived usefulness.Based on the current review, it is clearly that the factors that believed to be barriers with LMS usage namely Technical Support, Instructional Design of LMS and Perceived Self-Efficacy have not been examined simul-taneously not only in Saudi Context, but even globally. Therefore, this study will develop TAM model to ex-amine the influence of these factors on students’ behavioural intention and their use of LMS. This is needed as many other studies in Saudi Arabia confirmed that the utilisation of LMS among students are still under the satisfying level, and increasing the use of LMS cannot be achieved without empirically understanding the factors that may influence them. According to Adzharuddin and Ling (2013), understanding the barriers (factors) that may influence students’ behavioural intention to use and accept LMS is essential and lead to at-tracting more learners to intent to use and accept LMS. Furthermore, Since the adoption and use of LMS is a complex phenomenon which involves a complex interplay of internal and external factors, several researches have showed the need for further developing models to examine other factors which may have a significant influence on LMS usage (Hussein et al., 2007; Fathema, 2013; Fathema et al. 2015; Aliks et al., 2017). Thus, this research will develop a model by extending Technology Acceptance Model to examine the factors may influence the use of LMS, namely Technical support, Perceived self-efficacy and instructional design of LMS.
Technology Acceptance ModelTAM is defined as an information system theory, which models and provides an explanation of how an individual uses and accepts the technology. TAM aims to provide an elucidation regarding the technology acceptance determinants, which is in general able to explain the behaviour of a user across a wide array of end-user computing technologies as well as user populations, while justifying simultaneously both in the economical and theoretical perspectives (Davis, 1989). Five constructs form part of the TAM model including 1) Perceived Ease of Use “PEU”, 2) Perceived Use-fulness “PU”, 3) attitude towards the use of “ATT”, 4) behavioural intention to use “BI”, and 5) actual use of “AU”. According to TAM, the PEU and PU are considered as the primary determinants for individuals with regards to the usage and acceptance of the technology.
According to TAM presented by Davis (1989), PEU influences the PU, which means that if individuals con-sider that the technology is “Easy to Use”, then they will consider the technology as “Useful”. TAM claims that both PU and PEU influence the attitude towards the use of technology for individuals. To explain this, if individuals perceive the technology as “easy to use” and “useful”, then they will formulate a positive attitude towards using a particular technology. Furthermore, Davis noticed that both PU and ATT directly influence the behavioural intention to use technology (BI). It means that if users find a technology “useful”, they will then build a positive behavioural intention to use the technology “BI”. In the same line, a positive attitude “ATT” of users towards a specific technology builds a positive intention to use it “BI”. Finally, this positive behavioural intention “BI” of individuals regarding a particular technology shapes the actual use of it “AU”, meaning that if users have a positive intention toward using a particular technology, they will then use it. Figure 1 illustrates the model of TAM.
Figure 1. The technology acceptance model (TAM) - theoretical framework(Source: Davis et al., 1989).

116
Technology Acceptance Model (TAM) has been chosen to be applied in this research for various reasons. First, there is no particular theory that is a free of limitation and could overcome all concerning issues in the previous theory. Second, the validity of extended TAM in a different context with different application has been proposed and confirmed with huge previous studies (e.g. Venkatesh & Davis, 2000; Henderson & Divett, 2003; Hussein et al., 2007; Al-hawari & Mouakket, 2010; Lai & Zainal, 2015; Lai, 2016). More-over, TAM was the most used theory to explain the IT/IS acceptance and usage (Venkatesh et al., 2003). Furthermore, based on the review carried out by the researcher, the factors that believed to be barriers from accepting and using LMS in Saudi universities, namely technical support, perceived self-efficacy and instruc-tional design of LMS have not been examined using the extended TAM whether in Saudi or even globally. Therefore, this study will develop a model based on Technology Acceptance Model (TAM) to examine the influence of Technical Support, perceived self-efficacy and instructional design of LMS on students’ usage of LMS. This developed model will contribute to TAM literature by proposing an extension of the original TAM model.
RESEARCH QUESTION1. Do the factors:
a. Technical Supportb. Perceived Self-efficacyc. nstructional Design
Influence students’ use of LMS in Saudi Universities?2. Is TAM model applicable in Saudi Universities in Saudi Arabia?
Research Model and Research HypothesesFor providing a better understanding of LMS’s acceptance and usage among students in Saudi universities, these particular factors including “Technical Support”, “Perceived Self-efficacy”, and “instructional Design” will be examined as external factors in the original TAM model. The developed model which will be exam-ined is shown in Figure 2.
Figure 2. The hypothesised proposed model of students’ intention toward the usage of LMS in Saudi universities.

117
The Influence of Original Constructs of Tam and Its HypothesisAccording to the hypothesis of the original TAM by Davis (1989), the perceived ease of use has a significant direct positive effect on perceived usefulness, whereas perceived usefulness and perceived ease of use have a direct effect on the behavioural intention to use. Moreover, behavioural intention to use has a significant positive effect on the actual use. Many recent studies have confirmed and proven this relationship empirical-ly with several technologies such as e-learning systems (Ong et al., 2004; Liu et al., 2010), and in the context of LMS (Alharbi & Drew, 2014; Fathema et al., 2015). Thus, it is hypothesised in this research that:
H1: Perceived ease of use affects positively the perceived usefulness of LMS. H2: Perceived ease of use affects positively the behavioural intention to use LMS. H3: Perceived usefulness affects positively the behavioural intention to use LMS. H4: Behavioural intention to use LMS affects positively students’ actual use of LMS.
The Influence of the External Factors and Its HypothesisThe Influence of Technical Support
Technical support is defined as knowledge people, who assist users of software products and computer hard-ware, which could include hotlines, services of online support, help desks, faxes, machine-readable support for knowledge bases, telephone system of voice responding, control remote software along with other ser-vices (Ralph, 1991). Some studies confirmed the influences of technical support on the adoption of different types of educational technology tools in different setting context. Chau (1996) asserted that the perceived ease of use of spread-sheet application is influenced by the technical support. Compeau and Higgins (1995) stated that technical support positively affects the usage of information technology. Since previous studies found out that techni-cal support influences students’ usage of technology through the perceived usefulness and perceived ease of use, it is hypothesised in this study that:
H5: Technical support affects positively the perceived ease of use of LMS among students.
The Influence of Perceived Self-efficacy
Perceived Self-Efficacy (PSE) can be defined as the judgment of users regarding his or her capability of ex-ecuting and organising the multiples of required action to achieve the designed kinds of performance. It is not associated with the skills that the individual has, however it is associated with the judgments of what individual could do, whatever the skills that individual possesses (Bandura, 1986). Previous researches have revealed that perceived self-efficacy is associated with the acceptance of technology (Brown, 2002; Miller et al., 2003; Grandon et al., 2005). It was found out that users, who feel having a sense of weakness in per-ceived self-efficacy, are more easily frustrated in performing any computer tasks as compared to those who have a strong sense of perceived self-efficacy (Compeau & Higgins, 1995). However, the effect of perceived self-efficacy on LMS use is still unclear, as very rare researches have examined it. Based on the literature, it is hypothesised in this study that:
H7: Students’ perceived self-efficacies (PSE) affects positively students’ perceived ease of use of LMS. H8: Students’ perceived self-efficacies (PSE) affects positively students’ perceived usefulness of LMS.
The Influence of Instructional Design
Instructional design is defined as the entire structure of the system-design process which includes the defini-tion of what is aimed to be learnt, producing the instructional resources and materials, showing the author-ing process, applying the use of materials in contexts and making an evaluation for both the effectiveness of the materials formatively and efficacy of the materials (Seels & Richey, 1994). Some previous studies have been undertaken to indicate the influence of instructional design as an external factor on the acceptance and usage of different technologies through the perceived ease of use and usefulness. A study conducted by

118
Hussein et al. (2007) examined the influence of instructional design among other factors on students’ usage of e-learning in the Indonesian Open University. Findings revealed that instructional design was a strong predictor of both perceived ease of use “PEOU” and perceived usefulness “PU”, which influenced on stu-dents’ use of the e-learning. Similar studies have been conducted and confirmed the influence of instruction design on the system usage through the users’ perception about the ease of use and usefulness of the system (Dickson et al., 1986). Therefore, based on the previous findings, it is hypothesised in this research that:
H9: Instructional design affects positively students’ perceived ease of use of LMS. H10: Instructional design affects positively students’ perceived usefulness of LMS.
METHODOLOGYThis section describes the research methodology used in this study. It covers all the aspects of: research design, population and respondents, the instruments, pilot study, data collection, analysis of data, and the research procedure.
Research DesignThis study is purely quantitative, employing a survey, specifically a written questionnaire for the collection of data from the target population. Creswell (2013) defined quantitative research as a type of research that explains the phenomena using the collected numerical data which is analysed using mathematical ap-proaches, in particular, statistical approaches. According to Kumar (2008) quantitative research is objective, formal, and systematic. It can help with describing and testing the relationship and exploring the causes and effects among the interactions of the different variables. This research aims to extend the Technology Acceptance Model (TAM) to examine the influence of the external factors that are believed to be barriers, namely, technical support, instructional design of LMS, and the perceived self-efficacy on students’ usage of LMS. It aims at determining the factors that influence the students’ usage of LMS as well as examining the underlying causal relationships among all factors which are known as constructs in the instruments by using the proposed extended TAM model.
Sampling and PopulationIn this study, two sampling methods are applied: a purposive sampling method is used to determine the Saudi universities that will take part in this study, and a stratified random sampling is used to determine the participants from these chosen Saudi universities. A purposive sampling technique is defined as a type of sampling method where specific settings, events, and people are deliberately chosen for seeking the important information that they have and cannot be taken from other sampling choices (Maxwell, 1997). It is also known as purposeful sampling or nonprobability sampling. As mentioned earlier, a purposive sampling method involves choosing cases or units based on a particular purpose and reason rather than at random (Teddlie & Tashakkori, 2009). In this study, and based on using a purposive sampling method, three government Saudi universities are chosen and involved in this study because of that they implement all different types of LMS such as Blackboard, Desire2Learn, and Moodle which are used by most Saudi government universities.Based on using a purposive sampling method, the University of Hail which implements Blackboard, Shaqra University which uses Desire2Learn, and the University of Tabuk that uses Moodle are involved and take part in this study. The participants involved in this study are undergraduate students using the different LMS platforms during their first year in the faculty of preparatory year at the three chosen universities: University of Hail who applies Blackboard, Shaqra University which applies Desire2Learn, and University of Tabuk which uses Moodle. The first-year students have been chosen as the participants because the faculty of preparatory year in all Saudi Government Universities is equipped with the latest technologies including LMS and is stricter with implementing and using them when compared with other faculties. The population of undergraduate

119
students in the faculty of preparatory year in the three universities is 7838: University of Hail is 3369, 1141 in Shaqra University, and 3328 in University of Tabuk. Table 1 shows the university, the type of LMS used, and the population.
Table 1. Type of LMS used and population in univerisites.
No University Name Type of LMS Population
1 University of Hail Blackboard 3369
2 Shaqra University DesiretoLearn 1141
3 University of Tabuk Moodle 3328
TOTAL 7838
Using Krejcie’s and Morgan’s (1970) table, the minimum sample size of the total population for 7838 should be 367. Therefore, the sample size of this study is 400 which is convenient and meets the requirement of Morgan and Krejcie’s.The stratified random sampling technique has been applied for determining the samples from each cho-sen university. Stratified random sampling aims at ensuring that all groups (strata) of the population are represented by the sample for increasing efficiency and consequently decreasing the estimation errors. The population of this study consists of three groups that use different LMS platforms in the three universities. Therefore, using the stratified random sampling technique is convenient and ensures that all the samples “strata” from these groups are representative of the population. Table 2 illustrates the number of samples for each university using stratified random sampling.
Table 2. Stratified Random Sampling for each university.
No University Name Type of LMS Population Sample
1 University of Hail Blackboard 3369 172
2 Shaqra University DesiretoLearn 1141 58
3 University of Tabuk Moodle 3328 170
TOTAL 7838 400
The sample for each group (strata) is chosen based on the following calculation. The population of students in the first preparation year in the three universities consists of three groups “strata” that use different LMS platforms; N = n1 + n2 + n3. For having the sample from the first group, 3369 students who are using Blackboard in University A, the total number of this group is 3369, divided by the total number of the population which is 7838, and then multiplying this by the sample size that this study is looking for, 400: Sample = n1/N * 400. Therefore, 172 undergraduate students are chosen as a sample from the first university “University A” that are using Blackboard. The same procedure is applied to obtain the sample for the other two groups.
Data Collection ProceduresQuestionnaires were used for the collection of data. The questionnaires were distributed to the students in the preparation years in the three Saudi universities during the first semester of year 2016-2017. A total of 449 questionnaires were distributed to students but only 400 of the questionnaires were valid and used for further analysis due to the incomplete responses leading to missing their validity (172 from University of Hail, 58 from Shaqra University, and 170 from University of Tabuk). The data collection was anonymous and no identifiable information from the respondents were collected. The questionnaires consisted of two parts: the first part covered the respondents’ demographic information, while the second part was question-naires for measuring the constructs in the model.

120
Instrumentation
The instruments are questionnaires adopted and modified from four previous studies: Davis (1989), Igbaria (1995), Compeau and Higgins (1995), and Hussein et al. (2007). To ensure the content validity, the ques-tionnaires used were adopted from the original study by Davis (1989) for measuring the original constructs of the TAM model, namely perceived usefulness, perceived ease of use, behavioural intention to use, and the actual use. Most recent studies adopted the questionnaires of Davis’ study for measuring TAM constructs as they have been validated by several previous studies (Lule et al., 2012; Chih-Min Ma et al., 2013; Ranta & Mehra, 2015; Sanchez-Mena et al., 2017). Questionnaires that measure the technical support construct were adopted and modified from Igbaria’s (1995) and Amoroso and Igbaria (1993). Questionnaires that measure computer self-efficacy construct were adopted and modified from the studies of Compeau and Higgins (1995) and Park (2009). Finally, the questionnaires that measure the instructional design construct were adopted and modified from the study of Hussein et al. (2007) and Liu et al. (2010). Some required word changes and modifications to the adopted questionnaires have been incorporated to make them suit-able within the context of LMS usage. For example, the question in original TAM model that measure the perceived ease of using CHART-MASTER “My interaction with CHART-MASTER would be clear and understandable” has been changed to be “I feel that my interaction with using LMS would be understand-able and clear”. All of the aforementioned questionnaires were sent to the experts in this field to assess their validity and their alignment with the constructs’ definitions. These questionnaires are used for measuring all seven constructs “variables” in this study, namely (i) technical support “TS”, (ii) perceived self-efficacy “PSE”, (iii) instructional design of LMS “ID”, (iv) perceived ease of use “PEU”, (v) perceived usefulness “PU”, (vi) behavioural intention to use LMS “BI”, and (vii) the actual use of LMS “AU”.
The Questionnaires
The questionnaires that measure constructs in the model consist of two parts: the first part includes seven items providing the demographic information of the respondents. It covers aspects such as age, current se-mester, experience period with LMS usage, previous qualification, university name, device used with LMS, and attendance of training or workshops. The second part of the questionnaires contains 66 items that mea-sure the seven latent constructs of the proposed model in this study. These questionnaires have items that contain the five-point Likert scale with ranges starting from “5 strongly agree” to “1 strongly disagree”. The adopted questionnaires are provided in the appendix.
Pilot Study
The pilot study examined the constructs’ reliability for the collected data. The questionnaires’ items were pilot tested with 200 undergraduate students at UoH. The reliability of constructs means the extent to which the construct shows consistent results and free from errors. Reliability relates to the ability of the instruments used for measurements to produce the same result when it is used in the same circumstances with the same participant (George, 1995). It can be assessed by conducting Cronbach’s Alpha which is widely applied and used for measuring the constructs’ items internal consistency in the study. The value of Cronbach’s Alpha should be higher than 0.70 to be considered reliable and adequate for measuring the internal consistency (Hair et al., 2006). The pilot data was entered into the SPSS software (Statistical Package for the Social Sci-ence) to assess the reliability and validity of the constructs’ items. Cronbach’s Alpha was run to determine the internal consistency for the items scales which are used here. According to Nunnally (1978), when the Cronbach’s score is higher than 0.70, it is considered to be reliable. The results in Table 3 show that the Cronbach’s Alpha values for all seven factors range from 0.76 to 0.92, indicating that all values are above the suggested threshold level of 0.70 and are considered to be internally consistent and reliable.

121
Table 3. Reliability statistics
Reliability Statistics
Factors Cronbach’s Alpha N of Items
Technical Support (TS) 0.804 8
Self Efficacy (SE) 0.767 8
Instructional design (ID)0.863
10Perceived Usefulness (PU) 0.923 10
Perceived Ease of Use (PEU) 0.920 10
Behavioural Intention to Use (BI) 0.888 8
Actual Use (AU) 0.861 12
Total of Items 66
The Exploratory Factor Analysis (EFA), using the method of Principle Component Analysis (PCA) with Varimax rotation, was run. With the first run of EFA using PCA, there were some items that have low loading, some have cross loading, and the communality of some items was also low. To tackle the problem of cross loading and low loading values, the following criteria were applied: all items loaded should have a value above 0.5, they should not be cross loaded, the communality should be higher than 0.4, and the factors are expected to be remained with at least five items. If any items do not follow these criteria, they will be eliminated. These chosen criteria have been set based on the literature. According to Osborne and Costello (2005), the factors that have at least five items with a load value of 0.5 or above are solid factors and desirable. The communality explains the proportion of the variance of items which are explained by the factor. The communality value that is less than 0.4 might indicate that the item in that factor is not related to the other items (Osborne & Costello, 2005). Thus, any item with a communality value less than 0.4 will be eliminated. As a result, 12 items have been removed: three items from the perceived self-efficacy construct (SE1, SE7 and SE8), four items from the instructional design construct (ID2, ID4, ID5, ID6), two items from the perceived usefulness constructs (PU1, PU6), two items from the actual use construct (AU1, AU3), and one item from technical support construct (TS5). In the final analysis, out of 66 items, only 54 items were retained and used. The finalised questionnaires with 54 questions for collecting field data are provided in Appendix A.
Procedure of Data AnalysisTwo types of statistical analysis for the collected data from the respondents, using the finalised questionnaires after conducting the pilot study, are used in this study. As the questionnaires have two parts, a descriptive statistical analysis using SPSS is applied to analyse the respondents’ demographic information, which may include the percentage, frequency, etc. To answer the research questions and determine the factors that influence the undergraduate students’ usage of LMS, as well as testing the goodness fit between the proposed structured model and obtained data, this study has followed the suggestion of Anderson and Gerbing (1988) and conducted a two-step analysis for Structural Equation Modelling (SEM) using AMOS version 18. In the first step, CFA, which is a confirma-tory factor analysis, is applied for assessing the measurement of the model. To explore the causal relation-ship among constructs, the proposed structural model has been tested using SEM. SEM is applied since it simultaneously analyses the path in the proposed model for examining the causal relationship among all constructs as well as testing the goodness of fit of the proposed structural model.

122
DATA ANALYSIS AND FINDINGS Part 1: Demographic Information of Respondents A total of 449 students responded to the surveys but only 400 questionnaires were used for further analysis because of the incomplete responses and their invalidity. Table 4 shows the name of the university that was involved, the number of distributed questionnaires, and the incomplete and valid questionnaires used for further analysis.
Table 4. Summary of questionnaires for data collection.
University name Distributed questionnaires
Incomplete questionnaires
Valid questionnaires for further analysis
University A 192 20 172
University B 70 12 58
University C 187 17 170
Total 449 49 400
Using Stratified Random Sampling (SRS), 172 (43.0%) students’ respondents were from the University of Hail, 58 (14.5%) students respondents were from Shaqra University and 170 (42.5%) students respondents were from University of Tabuk. In terms of age, the respondents were mixed. Most of the respondents (69.0%; n = 276) were aged between 19-20, while 17.8% (n = 71) and 7.8% (n = 31) were aged between 17-18 and 21-22, respectively. Only 5.5% (n = 22) of the respondents were more than 23 years of age. In terms of experience, 57.5% (n = 230) had 3-4 months of experience and 17.0% (n = 68) had 1-2 months of experience. However, those with no experience or more than 5 months of experience were reported to have the same number of respondents at 12.8% (n = 51). Their previous qualifications were mixed, with most of them (97.3%; n = 389) having a general high school qualification, while 1.8% (n = 7) had an art high school background. Only 1.0% (n = 4) had other qualifications. In terms of devices used, most of the students (39.8%; n =159) had laptops for their job, while 34.5% (n = 138) and 25.8% (n = 103) used a PC or iPhone, respectively. A majority of the respondents (85.5%; n= 342) reported to have never attended any workshops, while the rest (14.5%; n = 58) had attended some of the workshops. Table 5 summarises the demographic information of the respondents and the universities that were involved in this study.

123
Table 5. Demographic information of respondents.
Characteristics N %
Age
17-18 71 17.8
19-20 276 69.0
21-22 31 7.8
More than 23 22 5.5
Qualification
General High School 389 97.3
Art High School 7 1.8
Others 4 1.0
University Name
University A 172 43.0
University B 58 14.5
University C 170 42.5
Previous Experience
0 51 12.8
1-2 68 17.0
3-4 230 57.5
More than 5 51 12.8
Device Used
PC 138 34.5
Laptop 159 39.8
iPhone 103 25.8
Workshop Attended
No 342 85.5
Yes 58 14.5
Part 2: Confirmation Factor Analysis And Structural Equation Modelling In Structural Equation Modelling (SEM), there are two types of modelling: measurement and structural modelling. These models need to be executed when testing the research hypotheses. In the case of the mea-surement model, the Confirmatory Factor Analysis (CFA) is performed to validate or evaluate the measure-ment model by inspecting their factor loadings, fitness indices, and construct correlation. According to Hair et al. (2010), the results from the structural model would be biased if the validation of the measurement model fails. Therefore, the measurement model needs to first be satisfied by modifying the model (e.g. delete poor loadings) in order to increase the measurement fitness (Bakar et al., 2016; Kline, 2016; Byrne, 2010). In this study, individual and pooled CFA is used to assess the measurement fitness. The purpose is to produce a robust result before testing the hypothesis.The study has six exogenous constructs and one endogenous construct. All constructs have undergone the Exploratory Factor Analysis (EFA) procedure to assess their dimensionality. The model has one endogenous construct, namely actual use, and six exogenous constructs, namely behavioural intention, perceived use-fulness, perceived ease of use, self-efficacy, instructional design, and technical support. All constructs are measured in the form of the first-order construct. These constructs were assessed by several items as follows:
1. Actual use: AU1, AU2, AU3, AU4, AU5, AU6, AU7, AU8, AU9, and AU10.2. Behavioural intention: BI1, BI2, BI3, BI4, BI5, BI6, BI7, and BI8. 3. Perceived usefulness: PU1, PU2, PU3, PU4, PU5, PU6, PU7, and PU8. 4. Perceived ease: PEU1, PEU2, PEU3, PEU4, PEU5, PEU6, PEU7, PEU8, PEU9, and PEU10.

124
5. Self-efficacy: SE1, SE2, SE3, SE4, and SE5. 6. Instructional design: ID1, ID2, ID3, ID4, ID5, and ID6. 7. Technical support: TS1, TS2, TS3, TS4, TS5, TS6, and TS7.
Confirmation Factor Analysis (CFA):The global fitness index is used to assess the measurement model in order to ensure that the empirical data can be tailored with the proposed measurement model. The fitness indices achieved the required level as suggested by previous researchers. However, three out of 54 items (e.g. AU4, AU8, and SE5) showed a low factor loading (< 0.60) implying that these items are not meant to assess the actual use and self-efficacy con-struct. Hence, these items were deleted. The finalised pooled CFA is presented in Figure 3.
Figure 3. Pooled CFA.

125
The pooled CFA is known as the best approach to validate the measurement model because it can take various forms of measurement errors and construct correlations (Hair et al., 2010). This implies that a large number of constructs can be handled in the same treatment. Moreover, it can avoid the identification prob-lem due to the lack of item per construct (Awang, 2015). As a result, the use of pooled CFA is a method of choice for those interest to the structural equation modelling. This method can assess the construct cor-relations by applying the double-headed arrow between the constructs involved. At the first step, the fitness index of this model needs to be considered and followed by the factor loading, reliability, and validity.
Table 6. The fitness indices results (full model).
Name of category Name of index Index value Decision
Absolute fit RMSEA 0.015 Achieved the required level
Incremental fit
CFI 0.992 Achieved the required level
IFI 0.992 Achieved the required level
NFI 0.907 Achieved the required level
RFI 0.902 Achieved the required level
Parsimonious fit Chisq/df 1.091 Achieved the required level
The fitness indices’ results for pooled CFA are shown in Table 6. The absolute fit (RMSEA) is achieved as it is lower than the threshold value (< 0.08). Meanwhile, the incremental fit was assessed by CFI, IFI, NFI, and RFI, and all of their indices are achieved as their index values are above 0.90. Moreover, the Parsimonious fit was represented by the assessment of Chisq/df which shows that its index value is at an excellent level because it is below the threshold of 3.0. Therefore, the model was achieved and satisfied in terms of the construct validity. To assess the construct reliability and convergent validity, the composite reliability and AVE are reported in Table 7. This table shows the CR and AVE for all constructs.
Table 7. Criteria for convergent validity (all constructs).
Constructs Items CR AVE
Actual Use (AU) 8 0.919 0.586
Behavioural Intention (BI) 8 0.923 0.600
Perceived Usefulness (PU) 8 0.907 0.550
Perceived Ease of Use (PEU) 10 0.943 0.625
Self Efficacy (SE) 4 0.866 0.618
Instructional Design (ID) 6 0.904 0.612
Technical Support (TS) 7 0.904 0.574
It can be seen that the recommended value for CR which is above 0.60 and AVE which is above than 0.5 have been met. Therefore, the construct reliability and convergent validity for this model are achieved. Lastly, the discriminant validity is performed. Discriminant validity is the extent to which the measure is indeed novel and not simply a reflection of other constructs (Hair et al., 2010). This means that all the constructs involved in the empirical study should differ from each other to capture the information inde-pendently. The discriminant validity is considered satisfied when the constructs’ correlations are less than 0.85 (Kashif et al., 2016). The summary of the discriminant validity indices is presented in Table 8.

126
Table 8. Discriminant validity.
BI TS SE ID PU PEOU AU
BI 0.775
TS 0.537 0.758
SE 0.551 0.556 0.786
ID 0.613 0.615 0.624 0.783
PU 0.533 0.560 0.570 0.605 0.742
PEOU 0.519 0.601 0.518 0.559 0.577 0.791
AU 0.578 0.566 0.604 0.640 0.574 0.557 0.766
The diagonal values in Table 8 are the square root of the AVE for each respective construct, while the other values are the correlations between constructs. The expected discriminant validity is achieved when the bold value is higher than the values of their constructs’ correlations (Awang, 2015). In other words, dis-criminant validity is achieved if the value (in bold) is higher than any other value in its column and row. It should be noted that the model is not claimed satisfied if discriminant validity is failed. This is because the construct proposed in the research model should differ from each other which could capture information independently. In this case, discriminant validity is achieved as all values in bold for each construct are above than the values of its correlations with other constructs.
Structural Equation Modelling (SEM)An SEM procedure contains two types of outputs, namely unstandardised and standardised regression weights. The unstandardised regression weight could be considered as the true value yielded from SEM result. Meanwhile, standardised regression weight is the standardised value that can produce the value range from 0 to 1. It consists of a standardised beta coefficient between constructs, the factor loading of items, and R2 for both items and equation. Therefore, most researchers use the standardised regression weight when they want to find out the factor loading, R2, and the standardised beta coefficient between constructs. This can help the researcher to identify the strength of the path relationships. However, the unstandardised re-gression weight (beta estimates) is essential in statistics to compute the critical ratio for hypothesis testing. The standardised estimate model was first run and presented in Figure 4.

127
Figure 4. The standardised estimate model.

128
The results of the proportion of variance or square multiple correlations is shown in Table 9. As mentioned earlier, the endogenous construct of this study is actual use. The other constructs involved in the current study are recognised as an exogenous construct. The R2 appeared in this study is 0.36 which indicates that 36.0 % of actual use is explained by the behavioural intention construct. Among exogenous constructs, perceived usefulness is considered as the main contributor in predicting the actual use which was 50.3%.
The amount of variance explained in perceived ease is much lower than the perceived usefulness which was about 44.3%. This variance could be due to the effects contributed by three predictors of self-efficacy, in-structional design, and technical support. The contribution of perceived usefulness is higher than perceived ease in this model. Nevertheless, both perceived usefulness and perceived ease contribute 39.8% of the ex-plained variance to behavioural intentions. Table 9 provides all the information related to the results of the square multiple correlation (R2).
Table 9. Square multiple correlation (R2).
Constructs Estimate
Perceived Ease 0.443
Perceived Usefulness 0.503
Behavioural Intention 0.398
Actual Use 0.361
Structural Model (Unstandardised Estimate):The unstandardised estimate model is essential to unstandardised the regression weight (beta estimates) and to compute the critical ratio for hypothesis testing. The unstandardised estimate model is shown in Figure 5.

129
Figure 5. Unstandardised estimate model.

130
Table 10 shows the regression weigh for between constructs in the model.
Table 10. Regression weights.
Path Estimate S.E. C.R. P Result
Self Efficacy → Perceived Ease 0.167 0.059 2.835 0.005 Significant
Instructional Design → Perceived Ease 0.199 0.056 3.548 *** Significant
Technical Support → Perceived Ease 0.376 0.065 5.807 *** Significant
Self Efficacy → Perceived Usefulness 0.208 0.060 3.437 *** Significant
Instructional Design → Perceived Usefulness 0.232 0.058 4.025 *** Significant
Technical Support → Perceived Usefulness 0.160 0.066 2.435 0.015 Significant
Perceived Ease → Perceived Usefulness 0.226 0.059 3.830 *** Significant
Perceived Usefulness → Behavioural Intention 0.371 0.058 6.413 *** Significant
Perceived Ease → Behavioural Intention 0.316 0.057 5.587 *** Significant
Behavioural Intention → Actual Use 0.630 0.060 10.489 *** Significant
Results of Hypothesis Testing
Table 11. Results of hypothesis testing.
Hypothesis Results
H1: Self Efficacy has a significant impact on Perceived Ease Supported
H2: Instructional Design has a significant impact on Perceived Ease Supported
H3: Technical Support has a significant impact on Perceived Ease Supported
H4: Self Efficacy has a significant impact on Perceived Usefulness Supported
H5: Instructional Design has a significant impact on Perceived Usefulness Supported
H6: Technical Support has a significant impact on Perceived Usefulness Supported
H7: Perceived Ease has a significant impact on Perceived Usefulness Supported
H8: Perceived Usefulness has a significant impact on Behavioural Intention Supported
H9: Perceived Ease has a significant impact on Behavioural Intention Supported
H10: Behavioural Intention has a significant impact on Actual Use Supported
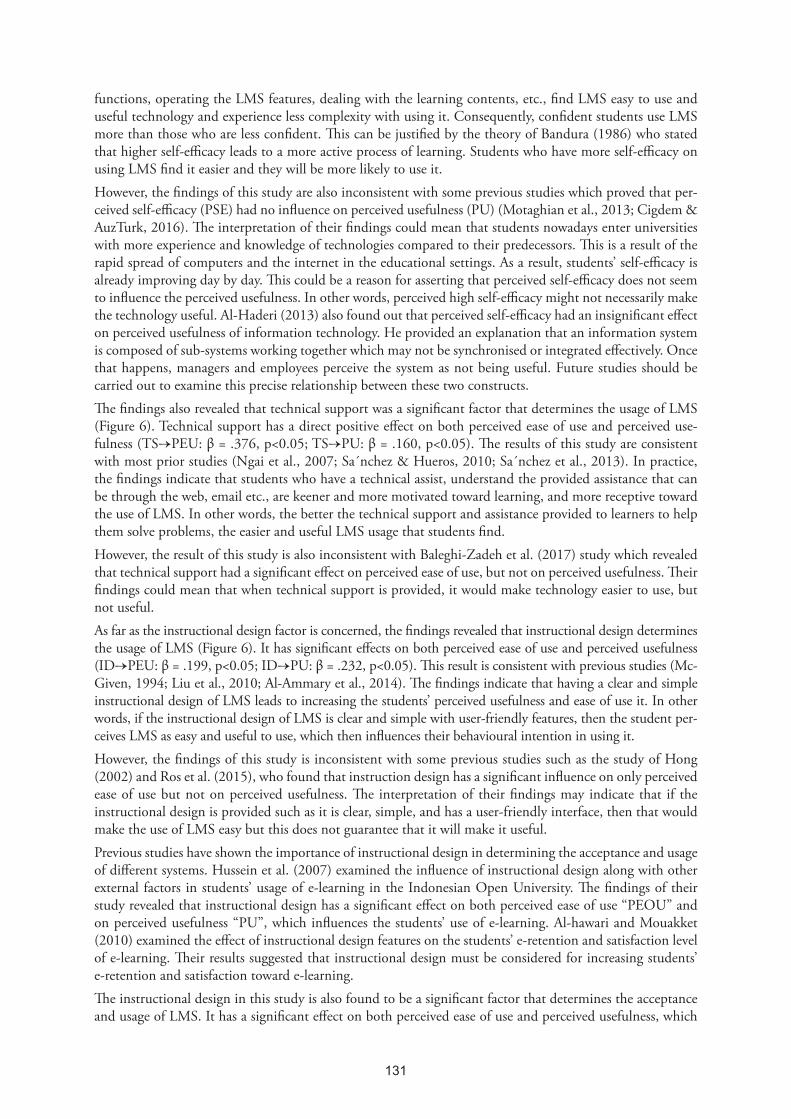
DISCUSSIONS AND CONCLUSION This study aimed to develop a model based on TAM to examine the factors, namely technical support, per-ceived self-efficacy, and instructional design that influence the students’ usage of LMS in Saudi universities. Data was collected from a sample of 400 students from three Saudi universities. The developed research model was tested and analysed using structural equation modelling. The results of the study generally sup-port the developed model and confirmed the influence of technical support (TS), perceived self-efficacy, and instructional design on the students’ use of LMS in Saudi universities.Starting with the perceived self-efficacy, the students’ perceived self-efficacy was found to be a significant factor in determining the usage of technology (as shown in Figure 6) which is consistent with the findings of previous studies (Panda & Mishra, 2007; Holden & Rada, 2011; Fathema et al., 2015). Furthermore, the results revealed that perceived self-efficacy had a significant positive effect on both perceived ease of use (PEU) and perceived usefulness (PU) (SE→PEU: β = .167, p<0.05); SE→PU: β = .208, p<0.05). The finding of this study is consistent with most prior studies (Ong, et al., 2004; Ong &Lai, 2006; Yuen & Ma, 2008; Park, 2009; Fathema et al., 2015). In practice, the findings indicate that students with a higher self-efficacy find LMS easy to use and useful when it is compared with students with lower self-efficacy. In other words, students who are confident in their skills when dealing with LMS, such as knowing the LMS
131
functions, operating the LMS features, dealing with the learning contents, etc., find LMS easy to use and useful technology and experience less complexity with using it. Consequently, confident students use LMS more than those who are less confident. This can be justified by the theory of Bandura (1986) who stated that higher self-efficacy leads to a more active process of learning. Students who have more self-efficacy on using LMS find it easier and they will be more likely to use it.However, the findings of this study are also inconsistent with some previous studies which proved that per-ceived self-efficacy (PSE) had no influence on perceived usefulness (PU) (Motaghian et al., 2013; Cigdem & AuzTurk, 2016). The interpretation of their findings could mean that students nowadays enter universities with more experience and knowledge of technologies compared to their predecessors. This is a result of the rapid spread of computers and the internet in the educational settings. As a result, students’ self-efficacy is already improving day by day. This could be a reason for asserting that perceived self-efficacy does not seem to influence the perceived usefulness. In other words, perceived high self-efficacy might not necessarily make the technology useful. Al-Haderi (2013) also found out that perceived self-efficacy had an insignificant effect on perceived usefulness of information technology. He provided an explanation that an information system is composed of sub-systems working together which may not be synchronised or integrated effectively. Once that happens, managers and employees perceive the system as not being useful. Future studies should be carried out to examine this precise relationship between these two constructs.The findings also revealed that technical support was a significant factor that determines the usage of LMS (Figure 6). Technical support has a direct positive effect on both perceived ease of use and perceived use-fulness (TS→PEU: β = .376, p<0.05; TS→PU: β = .160, p<0.05). The results of this study are consistent with most prior studies (Ngai et al., 2007; Sa´nchez & Hueros, 2010; Sa´nchez et al., 2013). In practice, the findings indicate that students who have a technical assist, understand the provided assistance that can be through the web, email etc., are keener and more motivated toward learning, and more receptive toward the use of LMS. In other words, the better the technical support and assistance provided to learners to help them solve problems, the easier and useful LMS usage that students find. However, the result of this study is also inconsistent with Baleghi-Zadeh et al. (2017) study which revealed that technical support had a significant effect on perceived ease of use, but not on perceived usefulness. Their findings could mean that when technical support is provided, it would make technology easier to use, but not useful.As far as the instructional design factor is concerned, the findings revealed that instructional design determines the usage of LMS (Figure 6). It has significant effects on both perceived ease of use and perceived usefulness (ID→PEU: β = .199, p<0.05; ID→PU: β = .232, p<0.05). This result is consistent with previous studies (Mc-Given, 1994; Liu et al., 2010; Al-Ammary et al., 2014). The findings indicate that having a clear and simple instructional design of LMS leads to increasing the students’ perceived usefulness and ease of use it. In other words, if the instructional design of LMS is clear and simple with user-friendly features, then the student per-ceives LMS as easy and useful to use, which then influences their behavioural intention in using it. However, the findings of this study is inconsistent with some previous studies such as the study of Hong (2002) and Ros et al. (2015), who found that instruction design has a significant influence on only perceived ease of use but not on perceived usefulness. The interpretation of their findings may indicate that if the instructional design is provided such as it is clear, simple, and has a user-friendly interface, then that would make the use of LMS easy but this does not guarantee that it will make it useful. Previous studies have shown the importance of instructional design in determining the acceptance and usage of different systems. Hussein et al. (2007) examined the influence of instructional design along with other external factors in students’ usage of e-learning in the Indonesian Open University. The findings of their study revealed that instructional design has a significant effect on both perceived ease of use “PEOU” and on perceived usefulness “PU”, which influences the students’ use of e-learning. Al-hawari and Mouakket (2010) examined the effect of instructional design features on the students’ e-retention and satisfaction level of e-learning. Their results suggested that instructional design must be considered for increasing students’ e-retention and satisfaction toward e-learning. The instructional design in this study is also found to be a significant factor that determines the acceptance and usage of LMS. It has a significant effect on both perceived ease of use and perceived usefulness, which
132
in turn has an increasing influence on the students’ behavioural intention toward the usage of LMS. Thus, a well instructional design in LMS attracts students and further motivates them towards its acceptance and usage. It will make them perceive LMS as easy to use and useful, which results in building a positive impres-sion toward the use of LMS. This positive behaviour leads to the use of LMS. Several studies showed the higher power of instructional design compared to other factors in determining the acceptance and usage rate of technology. Hussein et al. (2007) found that instructional design had more influence than the instructor’s characteristics and convenience in explaining and determining the use of e-learning. Grandon et al. (2005) found convenience to be a weak factor in explaining the users’ acceptance of online learning. The results of this study also confirm this fact. Instructional design, as an external factor in the model, had a higher sig-nificant influence on perceived usefulness (β = 0.232) when compared with other external involved factors, namely technical support and self-efficacy. This shows the importance of considering instructional design for determining the acceptance and usage of LMS.The findings of this study confirm the significant relationships that exist between the TAM constructs: PU, PEU, BI, and AU in the context of LMS and students’ usage (Figure 6). It was also revealed that PU of LMS was significantly determined by PEU of LMS. Furthermore, these constructs have a significant effect on students’ behavioural intention (BI), which has a significant effect on the students’ usage (AU) of LMS. These findings are in line with most previous studies (Mun & Hwang, 2003; Saade & Bahli, 2005; Lee et al., 2009; Al-ammary, 2014; Fathema et al., 2015; Alkış et al., 2017). These outcomes are in line with the claim of Davis (1989). In the LMS usage context, the claims of Davis (1989) can be illustrated as: students first evaluate how easy or difficult it is to work with LMS, then they look how useful using LMS is for them. If they find LMS as “easy to use” and “useful” technology, then they will have a positive intention toward using it. Finally, this positive intention leads to their actual use of LMS. The study’s findings illuminate the under-lying relationships between the proposed external constructs and the existing TAM’s constructs. Therefore, all of the original TAM constructs significantly explained students’ use of LMS. Furthermore, the external constructs: technical support, perceived self-efficacy, and instructional design directly or indirectly influence students’ behavioural intention and their actual use of LMS.
ImplicationThe study revealed that technical support is a significant salient factor which shapes students’ usage of LMS in Saudi universities. Therefore, policy makers and universities should focus on technical support for im-proving the usage of LMS. Several recent studies were conducted in Saudi Arabia such as a study conducted by Al-Shehri (2010), AlMegren & Yassin (2013), and Alqahtani (2017), which found out that universities might lack in providing the technical support for supporting technologies and e-learning. Therefore, pro-viding the required technical support in universities is essential and will support students toward the usage of LMS. Moreover, there is a need for identifying other barriers such as poor networks, lack of technical support, and addressing them in order to ensure and increase the usage of LMS among students. Universities should dedicate more resources, time, and strong technical support for students to motivate them toward using LMS. A failure to provide the required technical support to the students for using LMS may lead to the decrease or prevention of its usage.This study has revealed that perceived self-efficacy is a vital factor that determines the usage of LMS among students in Saudi universities. This indicates that improving students’ self-efficacy on LMS usage is an im-portant issue to focus on. Thus, university authorities are advised to focus on providing students with train-ing, regular support, online help, and communication for LMS use. An extensive and consistent training programme would provide students with the opportunity to become skillful in using LMS. These training programmes would assist beginner students to be more comfortable and familiar with using at least the basic features of LMS. These programmes will also help students who have a basic understanding of the usage of LMS features to be confident in dealing with the advanced LMS capabilities. When a new LMS is implemented, it is essential to inform students about its features and usage. This will enable the students to have a deep understanding of LMS features and feel more confident with using it. This can be achieved by providing training programmes and workshops. According to Fathema and Sutton (2013), the users reported that they would like universities to offer them an extensive training programme

133
and workshops on the features of LMS, benefits, and its usage to assist in increasing the use of LMS among them. In a recent survey, 57% of faculty members indicated that they will be more active and effective in using LMS in their courses if they were better skilled (Dahlstrom et al., 2014). Therefore, to increase the students’ self-efficacy and ensure the increased usage of LMS, Saudi universities should provide periodic training sessions and online help on LMS usage. These will help students to have more experience, improve their skills, and be more competent with using LMS, which in turn will increase their usage of LMS. This study showed that instructional design of LMS was a strong significant factor that determines the usage of LMS among students in Saudi universities. Therefore, LMS university policy makers and designers should focus and pay more attention to improving the LMS instructional design to make it much easier and usable for students. The user-friendly interface, features, contents, and easiness to use need to be periodically moni-tored and developed based on students’ needs. To develop a better instructional design of LMS, a continuous process of the instructional design improvement should be evolved, which requires collecting a feedback from LMS users about the design of LMS, problems that they may face, recommendation and suggestion for improvements, and based on that, set a plan and commit a quick action for improvement accordingly. Universities should update and improve LMS instructional design regularly so that it can assist and support students more efficiently toward the usage of LMS. As the instructional design of LMS has a strong influence on LMS usage and it influences both perceived ease of use and perceived usefulness, which was confirmed by this study, it is important to ensure that stu-dents will actually use it. To achieve this goal, more attention should be given to design user-friendly inter-faces, well-depicted icons and buttons, high-quality interface style, and easy navigation flow. Designers and developers of LMS can invest efforts in offering different customised interfaces for different students’ needs to accommodate their different background needs and knowledge. Moreover, universities should arrange training programmes for introducing the LMS instructional design features to make it easier and increase students’ knowledge about how to use it more effectively. If all of these steps are taken and the instructional design of LMS becomes clear and simple, students will then perceive LMS as easy to use and useful, which will in turn their behavioural intention and lead to the increased usage of LMS.
ContributionTheoretical Contribution
The underlying purpose of this research was to develop a model based on TAM for LMS utilisation in the sector of higher education in Saudi Arabia. To achieve this, the current study has developed a model based on TAM and confirmed the influence of three external factors on students’ usage and utilisation of LMS. Technical support, perceived self-efficacy, and instructional design, in addition to original TAM constructs: perceived ease of use, perceived usefulness, and behavioural intention are shown to be significant determi-nants of LMS usage among students in Saudi universities. This research substantially contributes to the literature, specifically to TAM literature by providing a developed model and confirming the influence of its external factors on the utilisation of LMS. The findings of this study confirmed the explanatory power of extended TAM and original TAM constructs in determining LMS usage.
Limitation Similar to any research project, this study has its own limitations. The factors that influence the usage of LMS have been investigated. Heterogeneous Purposive Sampling is used in this study to collect data from students in three Saudi government Universities who use different LMS platforms: Moodle, Desire2Learn, and Blackboard. Therefore, the results of this study might be restricted to that particular settings. The repli-cation of this study with different sample groups (such as focusing on academics or administrators) and other settings (such as different applications) could also help in understanding the implication of the extended TAM. The future researchers may consider examining the influence of the three external factors: technical support, perceived self-efficacy, and instructional design on the usage of different applications and different sampling groups.

134
Moreover, this study conducted a quantitative research. However, undertaking a qualitative study could reveal further details and deep personal opinions to explain the relationships between all constructs in the proposed developed model.Furthermore, the participants of this study were students from three Saudi universities. However, students in private Saudi universities may differ from those who are in Government universities in terms of lifestyle, educational experience, and background etc. Therefore, more studies are expected to focus on those who are enrolled in private universities.
BIODATA and CONTACT ADDRESSES of AUTHOR
Dr. Sultan Hammad ALSHAMMARI is Assistant Professor in the Department of Educational Technology at University of Ha’il, Saudi Arabia. Dr. Sultan gained his Ph.D. in Educational Technology at September, 2018 from Universiti Teknologi Malaysia (UTM). His academic research interest areas include the use of social media in education, Virtual reality, Learning Management Systems, IS theories and models, analyzing data using Structural Equation Modeling SEM, Gamification and other related fields in educational technology. He has over than 7 journal articles published in international indexes. He is a reviewer in some Educational journals.
Sultan Hammad ALSHAMMARIAddress: Department of Educational Technology, Faculty of Education, University of Ha’ilPO Box 2440, Saudi Arabia. Phone: +966555598256Email: [email protected] – [email protected]
REFERENCES
Adzharuddin, N. A., & Ling, L. H. (2013). Learning management system (LMS) among university students, does it work. International Journal of e-Education, e-Business, e-Management and e-Learning, 3(3), 248-252.
Al-Ammary, J. H., Al-Sherooqi, A. K., & Al-Sherooqi, H. K. (2014). The acceptance of social networking as a learning tools at University of Bahrain. International Journal of Information and Education Technology, 4(2), 208.
Al-Busaidi, K. A., & Al-Shihi, H. (2010). Instructors’ Acceptance of Learning Management Systems, A Theoretical Framework. Communications of the IBIMA, 2010.
Al-Haderi, S. M. S. (2013). The effect of self-efficacy in the acceptance of information technology in the public sector. International Journal of Business and Social Science, 4(9).
Alharbi, S., & Drew, S. (2014). Using the technology acceptance model in understanding academics’ behavioural intention to use learning management systems. International Journal of Advanced Computer Science and Applications (IJACSA), 5(1).
Al-hawari, M. A., & Mouakket, S. (2010). The influence of technology acceptance model (TAM) factors on students’ e-satisfaction and e-retention within the context of UAE e-learning. Education, Business and Society, Contemporary Middle Eastern Issues, 3(4), 299-314.
Alkış, N., Fındık-Coşkunçay, D., & Özkan-Yıldırım, S. (2017). A Structural Model for Students’ Adoption of Learning Management Systems: an Empirical Investigation in the Higher Education Context. Educational Technology & Society, xx (x), xx–xx.
Algahtani, M. (2017). Factors influencing the adoption of learning management systems in the Kingdom of Saudi Arabian universities by female academic staff.

135
Asiri, M. J., Bt Mahmud, R., Bakar, K. A., & Bin Mohd Ayub, A. F. (2012). Factors influencing the use of learning management system in Saudi Arabian higher education, a theoretical framework. Higher Education Studies, 2(2), 125. Retrived February 17 2020 from https://files.eric.ed.gov/fulltext/EJ1081529.pdf
Alnujaidi, S. A. (2008). Factors Influencing English Language Faculty Members’ Adoption and Integration of Web-Based Instruction (WBI) in Saudi Arabia. Unpublished doctoral dissertation, University of Kansas.
Al-Kahtani, N. K. (2006). The Internet Technology and its Potential Contribution to Research in Saudi Arabia, Possible Factors influencing its utilization. Unpublished doctoral dissertation, The George Washington University, USA.
Abdallah, S. (Ed.). (2010). ICT Acceptance, Investment and Organization, Cultural Practices and Values in the Arab World, Cultural Practices and Values in the Arab World. IGI Global.
Almarashdeh, I. A., Sahari, N., Zin, N. A. M., & Alsmadi, M. (2011). Acceptance of learning management system, a comparison between distance learners and instructors. Advances in Information Sciences and Service Sciences, 3(5).
AlMegren, A., & Yassin, S. Z. (2013). Learning object repositories in e-learning: challenges for learners in Saudi Arabia. European Journal of Open, Distance and E-learning, 16(1).
Anderson, J. C., & Gerbing, D. W. (1988). Structural equation modeling in practice, a review and recommended two-step approach. Psychological bulletin, 103(3), 411.
Al-Shehri, A. M. (2010). E-learning in Saudi Arabia: ‘To E or not to E, that is the question’. Journal of family and community medicine, 17(3), 147.
Al-Aulamie, A., Mansour, A., Daly, H., & Adjei, O. (2012). The effect of interinsic motivation on learners’ behavioural intention to use e-learning systems. International Conference on Information Technology Based Higher Education and Training (ITHET).
Arroway, P., Davenport, E., Xu, G., & Updegrove, D. (2010). EDUCAUSE core data service fiscal year 2009 summary report. EDUCAUSE White Paper.
Awang, Z. (2015). SEM made simple: a gentle approach to learning Structural Equation Modeling. MPWS Rich Publication.
Bakar, A. A., & Afthanorhan, A. (2016). Confirmatory factor analysis on family communication patterns measurement. Procedia-Social and Behavioral Sciences, 219, 33-40.
Baleghi-Zadeh, S., Ayub, A. F. M., Mahmud, R., & Daud, S. M. (2017). The influence of system interactivity and technical support on learning management system utilization. Knowledge Management & E-Learning: an International Journal (KM&EL), 9(1), 50-68
Bousbahi, F., & Alrazgan, M. S. (2015). Investigating IT faculty resistance to learning management system adoption using latent variables in an acceptance technology model. The Scientific World Journal.
Brown, I. T. (2002). Individual and technological factors affecting perceived ease of use of web-based learning technologies in a developing country. The Electronic Journal of Information Systems in Developing Countries, 9.
Butler, D. L., & Sellbom, M. (2002). Barriers to adopting technology. Educause Quarterly, 2(1), 22-28.
Bandura, A. (1986). Social foundation of thought and action: A social-cognitive view. Englewood Cliffs.
Byrne, B. M. (2010). Structural equation modeling with AMOS: Basic concepts, applications, and programming. Routledge.
Chau, P. Y. (1996). An empirical assessment of a modified technology acceptance model. Journal of management information systems, 185-204
Cheng, Y. M. (2013). Roles of interactivity and usage experience in e-learning acceptance, a longitudinal study. International Journal of Web Information Systems, 10(1), 2-23.

136
Chih-Min, Cheng-Min Chao, & Bor-Wen Cheng. (2013). Fit into blended e-learning system. Journal of Applied Sciences 13(5), 736-742.
Cigdem, H., & Ozturk, M. (2016). Factors affecting students’ behavioral intention to use LMS at a Turkish post-secondary vocational school. The International Review of Research in Open and Distributed Learning, 17(3).
Creswell, J. W. (2013). Research design, Qualitative, quantitative, and mixed methods approaches. Sage publications.
Compeau, D. R., & Higgins, C. A. (1995). Computer self-efficacy, Development of a measure and initial test. MIS quarterly, 189-211.
Coskuncay, D., & Ozkan, S. (2013). A model for instructors’ adoption of learning management systems, empirical validation in higher education context. Turkish Online Journal of Educational Technology-TOJET, 12(2), 13-25.
Davis, F. D. (1989). Perceived usefulness, perceived ease of use and user acceptance of information technology. MIS Quarterly, 13(3), 319–340.
Davis, F. D., Bagozzi, R. P., & Warshaw, P. R. (1989). User acceptance of computer technology, a comparison of two theoretical models. Management science, 35(8), 982-1003.
Davis, J. D., & Bednarz, L., Asin, K. E. (1992). Differential effects of serotonergic and catecholaminergic drugs on ingestive behavior. Psychopharmacology, 109(4), 415-421.
Dickson, Gary W, DeSanctis, Gerardine, & McBride, DOROTHY J. (1986). Understanding the effectiveness of computer graphics for decision support, a cumulative experimental approach. Communications of the ACM, 29(1), 40-47.
Dagger, D., O’Connor, A., Lawless, S., Walsh, E., & Wade, V.P. (2007), Service-oriented e-learning platforms, from monolithic systems to flexible services, IEEE Internet Computing, 11 (3), 28-35.
Dahlstrom, E., Brooks, D. C., & Bichsel, J. (2014). The current ecosystem of learning management systems in higher education: student, faculty, and IT perspectives (p. 3). Research report. Louisville, CO: ECAR, September 2014. Available from https://www.educause.edu/ecar 2014 EDUCAUSE. CC by-nc-nd.
Essel, D. D., & Wilson, O. A. (2017). Factors affecting university students’ use of Moodle: an empirical study based on TAM. International Journal of Information and Communication Technology Education (IJICTE), 13(1), 14-26.
Fathema, N., & Sutton, K. L. (2013). Factors influencing faculty members’ learning management systems adoption behavior: an analysis using the technology acceptance model. International Journal of Trends in Economics Management & Technology (IJTEMT), 2(6).
Fathema, N., Shannon, D., & Ross, M. (2015). Expanding the technology acceptance model (TAM) to examine faculty use of learning management systems (LMSs) in higher education institutions. Journal of Online Learning & Teaching, 11(2).
Fisol, N. M., Salleh, M. N., & Othman, S. N. (2016). Determinants of theory technology of acceptance model (TAM) in measuring educators’ continuance intention of learning management system (LMS). Call for papers, 36.
Grandon, E. E., Alshare, K., & Kwun, O. (2005). Factors influencing student intention to adopt online classes, a cross-cultural study. Journal of Computing Sciences in Colleges, 20(4), 46-56.
George, D. M. P. (1995). SPSS/PC+ Step by step. A simple guide and reference. Retrived from https://wps.ablongman.com/wps/media/objects/385/394732/george4answers.pdf
Goh, W. W., Hong, J. L., & Gunawan, W. (2013). Exploring Students’ Perceptions of Learning Management System, an Empirical Study Based on TAM. IEEE International Conference on Teaching, Assessment and Learning for Engineering (TALE), Bali Dynasty Resort, Kuta, Indonesia. 367-327

137
Hair, J. F., Anderson, R. E., Babin, B. J., & Black, W. C. (2010). Multivariate data analysis: a global perspective (Vol. 7). Upper Saddle River, NJ: Pearson.
Hair, J. F., Black, W. C., Babin, B. J., Anderson, R. E., & Tatham, R. L. (2006). Multivariate data analysis. Upper Saddle River, NJ, Pearson Prentice Hall.
Hofmann, D. W. (2002). Internet-based distance learning in higher education. Tech Directions, 62(1), 28–32.
Henderson, R., & Divett, M. J. (2003). Perceived usefulness, ease of use and electronic supermarket use. International Journal of Human-Computer Studies, 59(3), 383-395.
Holden, H., & Rada, R. (2011). Understanding the influence of perceived usability and technology self-efficacy on teachers’ technology acceptance. Journal of Research on Technology in Education, 43(4), 343-367.
Hong, W., Thong, J. Y., & Wai-Man Wong, K. Y. T. (2002). Determinants of user acceptance of digital libraries: an empirical examination of individual differences and system characteristics. Journal of Management Information Systems, 18(3), 97-124.
Hussein, R., Aditiawarman, U., & Mohamed, N. (2007). E-learning acceptance in a developing country, a case of the Indonesian Open University. In German e-Science Conference.
Igbaria, M., & Iivari, J. (1995). The effects of self-efficacy on computer usage. Omega, 23(6), 587-605.
Juhary, J. (2014). Perceived usefulness and ease of use of the learning management system as a learning tool. International Education Studies, 7(8), 23.
Kaiser, H. F. (1974). An index of factorial simplicity. Psychometrika, 39(1), 31-36.
Kember, D., McNaught, C., Chong, F. C., Lam, P., & Cheng, K. F. (2010). Understanding the ways in which design features of educational websites impact upon student learning outcomes in blended learning environments. Computers & Education, 55(3), 1183-1192.
Krejcie, R. V., & Morgan, D. W. (1970). Determining sample size for research activities. Educational and Psychology Measurement.
Kline, R. B. (2015). Principles and practice of structural equation modeling. Guilford publications.
Kumar, R. (2008). Research Methodology. New Delhi, APH Publishing.
Lai, P. C. (2016). Design and Security impact on consumers’ intention to use single platform E-payment. Interdisciplinary Information Sciences, 22(1), 111-122.
Lai P. C. & Zainal A.A, (2015). Perceived risk as an extension to TAM model: consumers’ intention to use a Single platform e-Payment. Australia Journal Basic and Applied Science, 9(2): 323-330.
Lee, S., & Heo, C. Y. (2009). Corporate social responsibility and customer satisfaction among US publicly traded hotels and restaurants. International Journal of Hospitality Management, 28(4), 635-637.
Liu, I. F., Chen, M. C., Sun, Y. S., Wible, D., & Kuo, C. H. (2010). Extending the TAM model to explore the factors that affect Intention to Use an Online Learning Community. Computers & education, 54(2), 600-610.
Lule, I., Omwansa T.K. & Waema, T.M. (2012). Application of Technology Acceptance Model (TAM) in M-Banking Adoption in Kenya. International Journal of Computing and ICT Research, 6(1), 31-43.
Majadlawi, Y., Almarabeh, T., & Mohammad, H. (2014). Factors affecting students’ usage of learning management system at the University of Jordan. Life Science Journal, 11(6), 666-671.
McGiven, J. (1994). Designing the learning environment to meet the needs of distant students. Journal of Technology and Learning, 27(2), 52-57.
Miller, M. D., Ranier, R. K., & Corley, J. K. (2003). Predictors of engagement and participation in an on-line course. Online Journal of Distance Learning Administration, 6(1).
138
Mirza, A. A. (2007). Is e-learning finally gaining legitimacy in Saudi Arabia. Saudi Computer Journal, 6(2).
Maxwell, J. (1997). Designing a Qualitative Study. In L. Bickman & DJ Rog (Eds.) Handbook of Applied Social Research Methods, 69-100.
Motaghian, H., Hassanzadeh, A., & Moghadam, D. K. (2013). Factors affecting university instructors’ adoption of web-based learning systems: case study of Iran. Computers & Education, 61, 158-167.
Mun, Y. Y., & Hwang, Y. (2003). Predicting the use of web-based information systems: self-efficacy, enjoyment, learning goal orientation, and the technology acceptance model. International journal of human-computer studies, 59(4), 431-449.
Nunnally, J. C. (1978). Psychometric theory. Mc Graw-Hill Publishing Co. New York.
Ngai, E. W., Poon, J. K. L., & Chan, Y. H. C. (2007). Empirical examination of the adoption of WebCT using TAM. Computers & education, 48(2), 250-267.
Ong, C. S., & Lai, J. Y. (2006). Gender differences in perceptions and relationships among dominants of e-learning acceptance. Computers in Human Behavior, 22(5), 816-829.
Ong, C. S., Lai, J. Y., & Wang, Y. S. (2004). Factors affecting engineers’ acceptance of asynchronous e-learning systems in high-tech companies. Information & management, 41(6), 795-804.
Osborne, J. W., & Costello, A. B. (2009). Best practices in exploratory factor analysis: Four recommendations for getting the most from your analysis. Pan-Pacific Management Review, 12(2), 131-146.
Panda, S., & Mishra, S. (2007). E‐Learning in a Mega Open University: Faculty attitude, barriers and motivators. Educational Media International, 44(4), 323-338.
Park, S. Y. (2009). An analysis of the technology acceptance model in understanding university students’ behavioral intention to use e-learning. Journal of Educational Technology & Society, 12(3), 150
Park, S. Y., Nam, M. W., & Cha, S. B. (2012). University students’ behavioral intention to use mobile learning, evaluating the technology acceptance model. British Journal of Educational Technology, 43(4), 592-605.
Pituch, K. A., & Lee, Y. K. (2006). The influence of system characteristics on e-learning use. Computers & Education, 47(2), 222-244.
Picciano, A. G. (2001). Distance learning, making connections across virtual space and time. Merrill Prentice Hall.
Psycharis, S., Chalatzoglidis, G., & Kalogiannakis, M. (2013). Moodle as a learning environment in promoting conceptual understanding for secondary school students. Eurasia Journal of Mathematics, Science & Technology Education, 9(1), 11-21.
Ratna, P. A., & Mehra, S. (2015). Exploring the acceptance for e–learning using technology acceptance model among university students in India. International Journal of Process Management and Benchmarking, 5(2), 194-210.
Ralph, W. (1991), Help! The Art of Computer Technical Support, Peachpit Press of Berkely.
Ros, S., Hernandez, R., Caminero, A., Robles, A., Barbero, I., Macia, A., & Holgado, F. P. (2015). On the use of extended TAM to assess students’ acceptance and intent to use third‐generation learning management systems. British Journal of Educational Technology, 46(6), 1250-1271.
Saade, R. G., & Kira, D. (2009). Computer anxiety in e-learning: The effect of computer self-efficacy. Journal of Information Technology Education: Research, 8, 177-191
Saade, R., & Bahli, B. (2005). The impact of cognitive absorption on perceived usefulness and perceived ease of use in on-line learning: an extension of the technology acceptance model. Information & management, 42(2), 317-327.
Sanchez, R., Duarte Hueros, A., & Garcia Ordaz, M. (2013). E-learning and the University of Huelva: a study of WebCT and the technological acceptance model. Campus-Wide Information Systems, 30(2), 135-160.

139
Sanchez-Mena, A., Marti-Parreno, J., & Aldas-Manzano, J. (2017). The Effect of Age on Teachers’ Intention to Use Educational Video Games: A TAM Approach. Electronic Journal of e-Learning, 15(4).
Sumner, M., & Hostetler, D. (1999). Factors influence the adoption of technology in teaching. Journal of Computer Information Systems, 40(1), 81–87
Seels, B., & Richey, R. (1994). Instructional technology, the definition and domains of the field. Association for Educational Communications and Technology.
Shin, W. S., & Kang, M. (2015). The use of a mobile learning management system at an online university and its effect on learning satisfaction and achievement. The International Review of Research in Open and Distributed Learning, 16(3).
Ssekakubo, G., Suleman, H., & Marsden, G. (2013). Designing mobile LMS interfaces, learners’ expectations and experiences. Interactive Technology and Smart Education, 10(2), 147-167.
Sumner, M., & Hostetler, D. (1999). Factors influence the adoption of technology in teaching. Journal of Computer Information Systems, 40(1), 81–87.
Szajna, B. (1996). Empirical evaluation of the revised technology acceptance model. Management Science, 42(1), 85–92.
Teddlie, C., & Tashakkori, A. (Eds.). (2009). Foundations of mixed methods research: Integrating quantitative and qualitative approaches in the social and behavioral sciences. Sage Publications Inc.
Unnisa, S. T. (2014). E learning in Saudi Arabia’s higher education. Arabian Journal of Business and Management Review, 4(2), 152.
Venkatesh, V., & Davis, F. D. (2000). A theoretical extension of the technology acceptance model, four longitudinal field studies. Management science, 46(2), 186-204.
Venkatesh, V., Morris, M. G., Davis, G. B., & Davis, F. D. (2003). User acceptance of information technology: toward a unified view. MIS quarterly, 425-478.
Venkatesh, V., & Bala, H. (2008). Technology acceptance model 3 and a research agenda on interventions. Decision sciences, 39(2), 273-315.
Williams, P. (2002). The learning Web, the development, implementation and evaluation of Internet-based.
Yuen, A. H., & Ma, W. W. (2008). Exploring teacher acceptance of e‐learning technology. Asia‐Pacific Journal of Teacher Education, 36(3), 229-243.

140
APPENDIX The QuestionnairePlease tick (√ ) at your best choice to each item below:
Technical Support (TS) (while using LMS)
1 A help desk always available
2 A hotline always available
3 Enquiries through the website can be done
4 Enquiries by e-mail can be done
5 A person or group are available for assisting me with solving the problem
6 A clear educational instruction in software is available to help me
7 A clear educational instruction in hardcopy is available to help me
Perceived Self-Efficacy (PSE) (while using LMS)
1 I can freely navigate the course contents
2 I can use LMS without getting detailed instruction on its use
3 I can overcome the obstacles that appear
4 I can use it if system manuals are not available
5 I have the necessary skills for using LMS
Instructional Design (ID) (while using LMS)
1 The information I need is easy to find
2 The learning objectives are clearly stated in each lesson
3 The content of the course is clear and simple
4 The content of course meets all my needs in the learning
5 I’m satisfied with the course quality
6 Generally, I’m satisfied with the design of course content
Perceived Usefulness (PU) (while using LMS)
1 It would improve the performance of my learning
2 It would increase my productivity in learning
3 It would enhance my effectiveness in learning
4 It would make the learning process easier
5 It would improve the quality of my learning
6 It would enable me to control my learning
7 It would support the critical aspect of my learning
8 Over all, I would find it useful in my learning

141
Perceived Ease of Use (PEU) (while using LMS)
1 I find using it easy for me
2 I feel that my interaction with it would be understandable and clear
3 I feel that it would be easy to become skilful with using it
4 I would find it to be flexible to interact with
5 Learning how to operate it would be easy for me
6 It would be easy for me to let it do what I want it to do
7 It would be easy for me to remember how to perform tasks
8 I do not find it cumbersome to use
9 It would not make the learning often frustrating
10 It would not require a lot of mental effort
Behavioral Intention to Use LMS (BU) (assuming that I have access to LMS)
1 I intend to use LMS for assisting my learning activities
2 I intend to use LMS as often as possible
3 I will use LMS in the future
4 I intend to increase my use of LMS in the future
5 I will use frequently LMS in future
6 I intend to use LMS more than any alternative applications
7 I intend to use LMS because of flexible time
8 I intend to use LMS because of the current trend in the 21st century education
Actual Use of LMS (AU)
1 The frequency that I use LMS for my learning
2 I use it for following the advertisement of my lecturer regarding my courses
3 I use it for viewing all different uploaded files such as MS, PDF and Videos
4 I use discussion forums for asking questions and sharing knowledge
5 I use it for submitting my assignments
6 I use it for doing online quizzes
7 I use it for checking my results
8 I use it for checking the comments received by my lecturer
9 I use it for communicating with my peers
10 I use it for communicating with my lecturers