the influence of perceived employee welfare programs on
TRANSCRIPT

THE INFLUENCE OF PERCEIVED EMPLOYEE WELFARE
PROGRAMS ON EMPLOYEE JOB SATISFACTION AT KENYA
RAILWAYS CORPORATION
GEOFFREY MUTAVI MUNYWOKI
A RESEARCH PROJECT SUBMITTED IN PARTIAL
FULFILMENT OF THE REQUIREMENT FOR THE AWARD OF
THE DEGREE OF MASTER OF BUSINESS ADMINISTRATION,
SCHOOL OF BUSINESS, UNIVERSITY OF NAIROBI
2019

ii
DECLARATION
This research project is my original work and has not been presented for examination in any
other institution of higher learning.
Sign: ……………………………………... Date: ……………………………………..
Geoffrey Mutavi Munywoki
D61/87129/2016
The research project has been submitted for examination with my approval as the University
Supervisor.
Sign: ……………………………………. Date: ……………….…………………….
Dr Margaret M Kariuki
Department of Business Administration
School of Business
University of Nairobi

iii
DEDICATION
To my wife and children for their valuable understanding and support.

iv
ACKNOWLEDGEMENT
I wish to acknowledge the Almighty God for the strength, good health, and ability to
undertake the study, as well my supervisor, Dr Margaret Kariuki, for willingly accepting to
supervise my work and offering valuable guidance. I sincerely appreciate my study partner,
Ms Christine Muthoni, for her valuable support and encouragement throughout the course,
and the research respondents, employees of KRC (MGR Operations), whose contribution
made this study a success.
My special gratitude and appreciation go to my family; Josephine, Bryan, Dean, and Felix
for their immeasurable support during my study, to all my lecturers and support staff who
facilitated my study, the security personnel who offered security and facilitated movement
in and out of the university premises, all my study friends and members of the various
assignment groups. God bless you all.

v
ABSTRACT
This study examined the influence of perceived employee welfare programs on employee
job satisfaction at Kenya Railways. The study had a target population of 1,214, being all the
employees of Kenya Railways, MGR Operations. A sample size of 123 employees was
established by use of a multistage stratified random sampling method. The study used a
descriptive cross-sectional survey design. Primary data was obtained using a structured self-
administered questionnaire. Analysis of data used measures of central tendency, measures of
variability, and regression analysis. The findings were organised in tables and charts. The
study determined a statistically significant connection between employee welfare programs
and employee job satisfaction at Kenya Railways. Employee health programs exhibited the
highest influence on employee job satisfaction trailed by flexible work programs. This study
has contributed to the theory of job satisfaction and supplemented existing literature in
employee welfare programs by establishing correlations between employee welfare
programs tested in the study and employee job satisfaction. The use of descriptive cross-
sectional study limited the study to one point in time observation. The use of closed-ended
questions in structured questionnaires may have inhibited collection of in-depth qualitative
data from the respondents. Based on these limitations, it was suggested that further studies
should adopt a longitudinal research design which is more accurate in measuring outcomes
and exposures. Also, future studies should be done on SGR operations and other state
corporations to help them enhance employee satisfaction and achieve efficient service
delivery. Further studies should also consider widening the focus from employee job
satisfaction to employee engagement which emphasizes on both employee satisfaction and
performance in organizations.

vi
TABLE OF CONTENTS
DECLARATION.............................................................................................................. ii
DEDICATION................................................................................................................. iii
ACKNOWLEDGEMENT .............................................................................................. iv
ABSTRACT ...................................................................................................................... v
ACRONYMS AND ABBREVIATIONS ....................................................................... xi
CHAPTER ONE: INTRODUCTION ............................................................................ 1
1.1. Background of the study ......................................................................................... 1
1.1.1. Concept of Perception ...................................................................................... 2
1.1.2. Employee Welfare Programs ........................................................................... 3
1.1.3. Job Satisfaction ................................................................................................ 4
1.1.4. Kenya Railways ............................................................................................... 5
1.1.5. Kenya Railways, MGR Operations.................................................................. 5
1.2. Research Problem .................................................................................................... 6
1.3. Objectives of the Study ........................................................................................... 9
1.4. Value of the Study ................................................................................................... 9
CHAPTER TWO: LITERATURE REVIEW ............................................................. 11
2.1. Introduction ........................................................................................................... 11
2.2. Theoretical Foundation ......................................................................................... 11
2.2.1 Equity Theory ................................................................................................ 11
2.2.2 Two-Factor Theory ........................................................................................ 12
2.3. Employee Welfare Programs ................................................................................ 14
2.4. Measures of Job Satisfaction ................................................................................. 16
2.5. Empirical Studies and Knowledge Gaps ............................................................... 19
vii
CHAPTER THREE: RESEARCH METHODOLOGY ............................................ 21
3.1 Introduction ........................................................................................................... 21
3.2 Research Design .................................................................................................... 21
3.3 Target Population .................................................................................................. 21
3.4 Sample Size and Sampling Technique .................................................................. 22
3.5 Data Collection ...................................................................................................... 23
3.6 Data Analysis ........................................................................................................ 23
CHAPTER FOUR: DATA ANALYSIS, RESULTS AND DISCUSSION ............... 25
4.1. Introduction ........................................................................................................... 25
4.2. Demographics Background ................................................................................... 25
4.2.1. Response Rate ................................................................................................ 25
4.2.2. Respondents by Gender ................................................................................. 26
4.2.3. Respondents per Region ................................................................................ 26
4.2.4. Respondents by Level of Education .............................................................. 27
4.2.5. Respondents by Cadre.................................................................................... 27
4.3. Assessment of Employee Welfare Programs ........................................................ 28
4.3.1. Allowances Payment Programs ..................................................................... 28
4.3.2. Employee Assistance Programs ..................................................................... 30
4.3.3. Employee Health Programs ........................................................................... 30
4.3.4. Retirement Programs ..................................................................................... 31
4.3.5. Flexible Work Programs ................................................................................ 32
4.3.6. Perceived Availability of Employee Welfare Programs ................................ 33
4.4. Assessment of Employee Job Satisfaction ............................................................ 34
4.4.1. Employee Job Satisfaction ............................................................................. 34
4.4.2. Rating of Employee Job Satisfaction ............................................................. 36
4.5. Regression Analysis .............................................................................................. 37

viii
4.6. Discussion of Research Findings .......................................................................... 40
CHAPTER FIVE: SUMMARY, CONCLUSION AND RECOMMENDATIONS . 42
5.1. Introduction ........................................................................................................... 42
5.2. Summary ............................................................................................................... 42
5.3. Conclusions ........................................................................................................... 43
5.4. Recommendations ................................................................................................. 44
5.5. Limitations of the Study ........................................................................................ 45
5.6. Suggestions for Further Study ............................................................................... 46
REFERENCES ............................................................................................................... 47
APPENDICES ................................................................................................................... i
Appendix I: Introduction Letter ...................................................................................... i
Appendix II: Questionnaire............................................................................................ ii

ix
LIST OF TABLES
Table 3. 1 Population and Sample Size ............................................................................... 22
Table 4. 1 Response Rate ..................................................................................................... 25
Table 4. 2 Respondents by Level of Education ................................................................... 27
Table 4. 3 Assessment of Employee Welfare Programs ...................................................... 28
Table 4. 4 Allowances Payment Programs .......................................................................... 29
Table 4. 5 Employee Assistance Programs .......................................................................... 30
Table 4. 6 Employee Health Programs ................................................................................ 31
Table 4. 7 Retirement Programs .......................................................................................... 32
Table 4. 8 Flexible Work Programs ..................................................................................... 33
Table 4. 9 Perceived Availability of Employee Welfare Programs ..................................... 34
Table 4. 10 Employee Job Satisfaction ................................................................................ 35
Table 4. 11 Rating of Employee Job Satisfaction ................................................................ 36
Table 4. 12 Regression Summary ........................................................................................ 37
Table 4. 13 Analysis of Variance ......................................................................................... 38
Table 4. 14 Regression Coefficients .................................................................................... 38

x
LIST OF FIGURES
Figure 4. 1 Respondents per Region .................................................................................... 26

xi
ACRONYMS AND ABBREVIATIONS
FMCG Fast Moving Consumer Goods
GDP Gross Domestic Product
HGV Heavy Goods Vehicles
KRC Kenya Railways Corporation
MGR Metre Gauge Railway
MoT Ministry of Transport
RTI Railway Training Institute
RVR Rift Valley Railways
PoM Port of Mombasa
SD Standard Deviation
SGR Standard Gauge Railway
1
CHAPTER ONE: INTRODUCTION
1.1. Background of the study
Employees of any organization are the most valuable assets without which machines,
materials, money, and all other assets are rendered useless (Neog & Barua, 2014).
Customer satisfaction derived from employees’ service is a feature of competitive
advantage found within the control of a business organization. It is, therefore, necessary
for any organization to invest in employee welfare programs to achieve employee job
satisfaction. Employee welfare programs include everything from excellent working
conditions, health, safety, amenities, and privileges that are availed by an employer for
employees to enjoy (Baral & Bhargava, 2011). Raziq and Maulabakhsh (2015) suggested
that employee welfare programs include career growth opportunities and development.
They continue to argue that how employees relate with their peers and supervisors greatly
influence job satisfaction and encourage sharing of innovative ideas, and team spirit
necessary for high performance.
This research was supported by two theories, namely, Equity theory, and the Two-factor
theory. Equity theory (Adams, 1965) focuses on the perception employees form on how
they are handled compared with others. The theory points that employees evaluate the
suitability of their benefits (outputs) with their work (inputs) by matching the ratio of their
input/output with that of other employees (Armstrong, 2014). Adams (1965) opined that
employees would feel equitably treated when their input/output ratio is found to be
favourable, and vice versa. The Two-factor theory (Herzberg, Mausner, & Snyderman,
1959) sought to study the satisfaction levels of employees in an organization using dual
factors: motivation factors, also referred to as "satisfiers," whose presence would make an

2
employee satisfied with his job, and the hygiene factors whose absence would cause job
dissatisfaction (Armstrong, 2014). Herzberg et al. (1959) argued that hygiene factors
compare to job context and include things like pay and working conditions while
motivation factors include the need to achieve, interest in the work, obligation, and growth
prospects.
Ministry of Transport (MoT) is one among the twenty-one ministries constituted by the
current government. Through the State Department for Transport (SDoT), the MoT is
mandated to develop and maintain effective, affordable and safe transport infrastructure in
support of economic growth (Ministry of Transport, 2019). A transport system promotes
economic development by facilitating the movement of labour and commodities, thereby
creating job opportunities (Murambi & Bwisa, 2014). Although Kenya Railways
Corporation (KRC) is mandated to provide rail transport services in Kenya (Kenya
Railways, 2019), much of this has not been achieved. Studies show that matatu minibuses
have become the preferred mode of mass public transport in Nairobi (Pirie, 2014),
passenger train services from Kisumu to Mombasa are no-longer offered, and road
transport takes 95% of the cargo handled by the Port of Mombasa (PoM) (Oxford Business
Group, 2016). Based on the above, it is worth investigating the role of employee welfare
programs or lack of them on employee job satisfaction in KRC.
1.1.1. Concept of Perception
The dictionary definition of perception is an opinion that is commonly held by the majority
of people based on the appearance of things (Cambridge University Press, 2019). Agarwal
and Dewan (2016) define perception as the process by which employees construe sensory
information for interaction with the environment. They argue that employees’ behaviour

3
is determined by their interpretation of reality and not on the reality per se. Perception may,
therefore, differ among employees depending on their level of exposure, education, and
traits.
In any organization, supervisory, communication and other management styles and
practices greatly influence employee’s perceptions about his work. Since employee’s
perception of their work greatly influences employee's job satisfaction (O'Reilly, 1991),
management can, therefore, substantially influence job satisfaction by shaping the
perceptions of the employee. In this process, the administration should always bear in
mind that perception is the perceiver's reality.
1.1.2. Employee Welfare Programs
According to Todd (1933), employee welfare comprises everything secured by an
employer for the happiness and development of employees in addition to the pay, that is
not a binding requirement of the sector. The welfare of an employee implies a state of
contentment, fulfilment, and advancement of employees (Venugopal, Bhaskar, & Usha,
2011). Organizations put in place welfare programs to enhance the motivation levels of
their employees (Tiwari, 2014), win their commitment, and increase their productivity.
Tiwari (2014) argues that employee welfare programs can either be statutory or non-
statutory. Statutory programs are those required by the law such as workman’s
compensation, maternity or paternity leave, and safety while non-statutory welfare
programs are voluntary to an employer and may include working conditions, health
services, housing loans, and recreation facilities (Venugopal et al., 2011). Non-statutory
welfare programs differ among employers and industries. Sindhu (2012) submits that
employee welfare programs tend to increase employee productivity and promote healthy
4
industrial relations. Similarly, Chaubey and Rawat (2016) argue that employee welfare
programs are crucial investments that increase the satisfaction levels among employees.
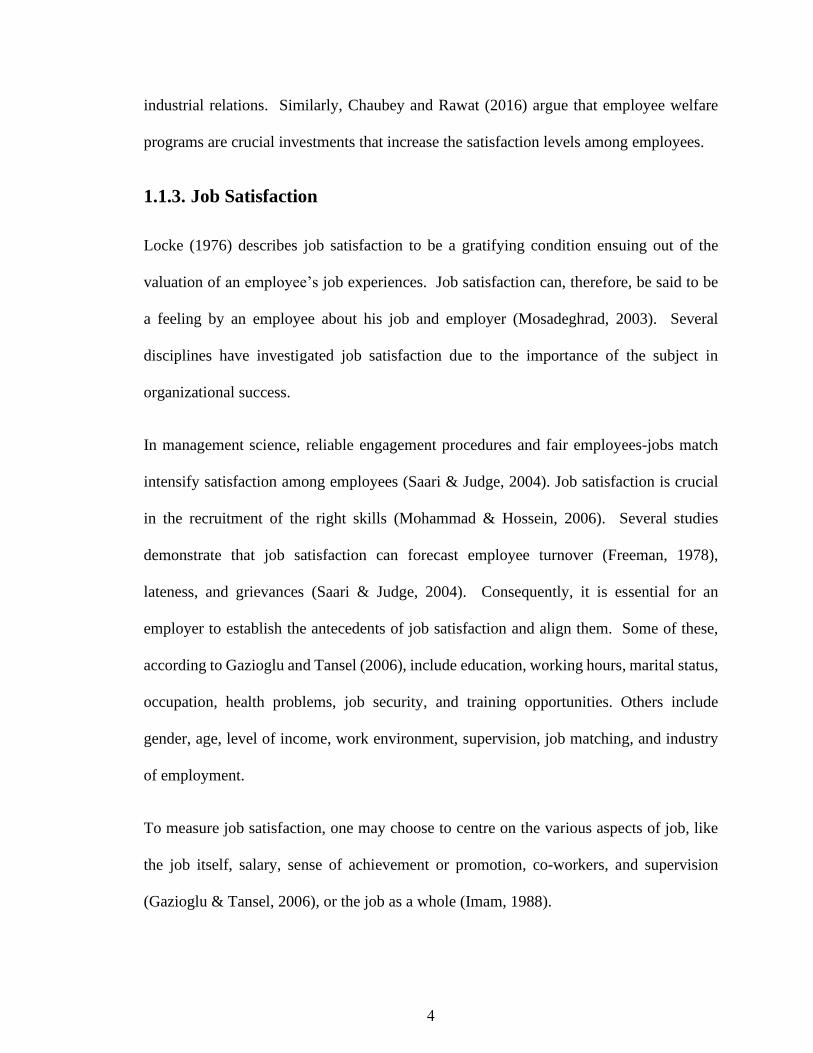
1.1.3. Job Satisfaction
Locke (1976) describes job satisfaction to be a gratifying condition ensuing out of the
valuation of an employee’s job experiences. Job satisfaction can, therefore, be said to be
a feeling by an employee about his job and employer (Mosadeghrad, 2003). Several
disciplines have investigated job satisfaction due to the importance of the subject in
organizational success.
In management science, reliable engagement procedures and fair employees-jobs match
intensify satisfaction among employees (Saari & Judge, 2004). Job satisfaction is crucial
in the recruitment of the right skills (Mohammad & Hossein, 2006). Several studies
demonstrate that job satisfaction can forecast employee turnover (Freeman, 1978),
lateness, and grievances (Saari & Judge, 2004). Consequently, it is essential for an
employer to establish the antecedents of job satisfaction and align them. Some of these,
according to Gazioglu and Tansel (2006), include education, working hours, marital status,
occupation, health problems, job security, and training opportunities. Others include
gender, age, level of income, work environment, supervision, job matching, and industry
of employment.
To measure job satisfaction, one may choose to centre on the various aspects of job, like
the job itself, salary, sense of achievement or promotion, co-workers, and supervision
(Gazioglu & Tansel, 2006), or the job as a whole (Imam, 1988).

5
1.1.4. Kenya Railways
Kenya Railways is a state corporation that was established on 20th January 1978 to take
over the operations of East African Railways Corporation in Kenya, following the collapse
of the East African Community. The corporation operates under the supervision of the
State Department of Transport in the Ministry of Transport (Ministry of Transport, 2019),
with the primary mandate of carrying out rail and inland waterways transport services.
Currently, KRC carries out operations of the old railway, Metre Gauge Railway (MGR),
following the termination of the Kenya Concession Agreement, supervises the activities of
Standard Gauge Railway (SGR) by Africa Star Railway Operations Company Limited, a
subsidiary of China Road and Bridge Company (CRBC) (Africa Star Railway Operation
Company Limited, 2018), runs Railway Training Institute (RTI) and manages Nairobi
Railways Museum (Kenya Railways, 2019). In this study, the focus was on MGR
operations which faces competition mainly from the SGR, Heavy Goods Vehicles (HGV),
and public transport service providers.
1.1.5. Kenya Railways, MGR Operations
The MGR operations reverted to Kenya Railways Corporation on 1st September 2017 after
one-month transition period following the termination of the Kenya Concession Agreement
which had given the now-defunct Rift Valley Railways (K) Limited (RVR) the rights to
carry out railway operations in Kenya, effective 1st November 2006.
After the High Court of Kenya terminated the Kenya Concession Agreement through an
order issued on 31st July 2017, all employees of RVR were to be transferred to KRC within
30 days from the date of the order. Once in KRC, the former employees of RVR continued

6
to carry out operations of the old railway under a new name coined for them, MGR staff,
meant to differentiate them from the formerly existing employees of KRC who were mainly
involved in the property renting business.
1.2. Research Problem
Job satisfaction and employee welfare relationship are the most crucial fabric in an
organization that has the most notable effect on the productivity of employees. In today's
competitive business arena, a significant number of organizations are continuously
searching for strategies to overcome the new world economic order and realise better
performance (Farooq & Hussain, 2011). Researchers such as Tiwari (2014) and Chaubey
and Rawat (2016) argue that employers use welfare programs as a strategy for enhancing
productivity through inculcating altruistic behaviour and organizational commitment in
employees. This is despite studies by Brayfield and Crockett (1955) concluding job
satisfaction to have negligible or no effect of on productivity. Upadhyay and Gupta (2012)
found that employee welfare programs do not automatically result in job satisfaction since
other factors like communication, personal traits, and environment are also critical in
determining job satisfaction among employees. The study continued to warn organizations
not to over-burden themselves to provide welfare programs in an attempt to gain a
competitive edge and endear themselves to employees.
Kenya Railways is a critical infrastructural installation that is very crucial in the
transportation of bulk consignments to and from PoM, Athi River, Nairobi, Thika, Malaba,
and Kisumu. After the termination of the Kenya Concession Agreement, KRC had to take
up MGR operations with 1,419 employees in addition to the then existing 230 employees.
Like any other state corporation, the salary structure and other terms of employment for

7
KRC are regulated by the Salaries and Remunerations Commission (SRC), and the State
Corporations Advisory Committee approves the organizational structure. An
organizational structure, being a formal system of accountability, assigns and delegates
responsibilities across an organization (Habib & Jalloh, 2016). Kenya Railways, therefore,
had the task of fitting salaries of employees from a private sector company within the pay
and grading structure of KRC which did not cater for the railway operations.
Metre Gauge Railway is a national strategic asset whose importance to the business
community in Kenya, Uganda, and Rwanda, and contribution to the national GDP cannot
be over-emphasized even in the presence of HGV and the entry of SGR. Unlike the much-
hyped SGR which currently terminates at Inland Container Depot (ICD) Nairobi, MGR
extends to the border towns of Malaba and Kisumu, Nanyuki, Thika and has sidings to
major industries in Athi River and Nairobi. However, the conditions under which
employees in MGR operate fall below the standards set by the law and for state corporation
employees. Frustrations encountered by MGR employees comprise the reduction of
salaries, without due considerations, for majority of the employees from what they used to
earn at RVR , engagement on six-month contracts for over two years, lack of personal
protective equipment (PPE), lack of health insurance, lack of work injuries insurance cover
(WIBA), lack of retirement programs or service gratuity, lack of a clear organizational
structure, and poor working relationship with counterparts at KRC . Most of these welfare
facilities are hygiene factors which need to be provided to reduce employee dissatisfaction
(Herzberg et al., 1959).
A study on banks in India proposed that employee welfare schemes elevated the level of
job satisfaction (Bajpai & Srivastava, 2004). Similar research by Kumudha and Abraham
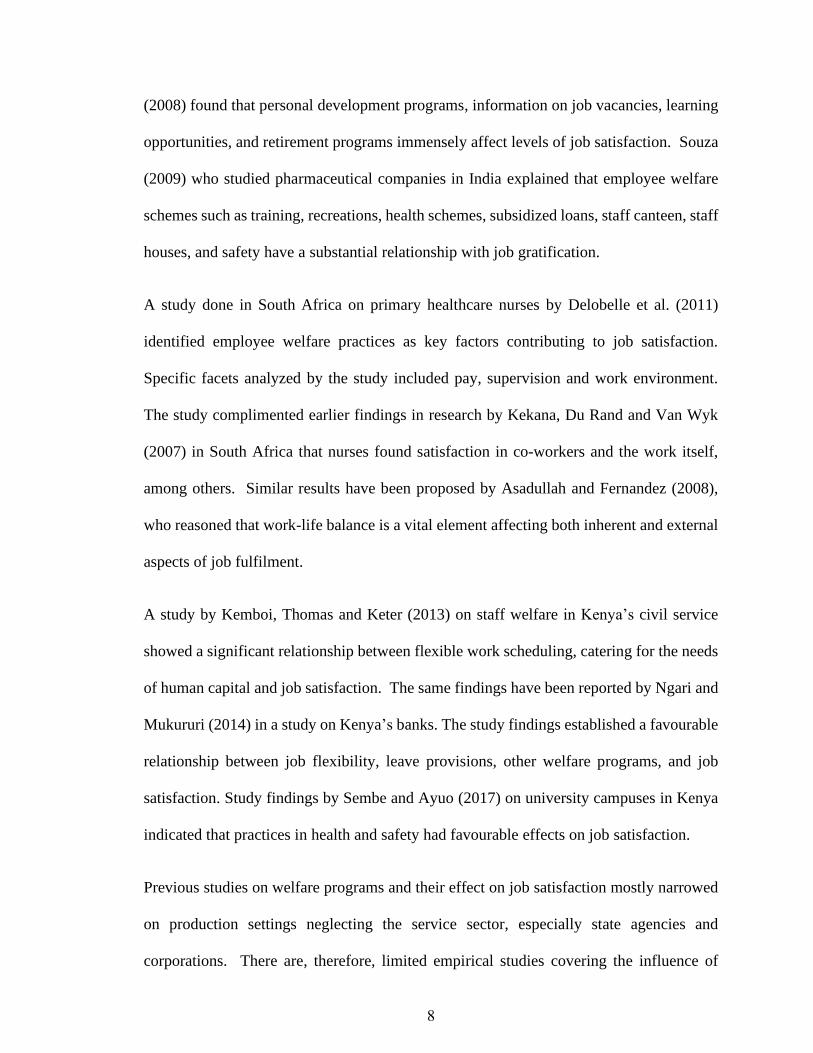
8
(2008) found that personal development programs, information on job vacancies, learning
opportunities, and retirement programs immensely affect levels of job satisfaction. Souza
(2009) who studied pharmaceutical companies in India explained that employee welfare
schemes such as training, recreations, health schemes, subsidized loans, staff canteen, staff
houses, and safety have a substantial relationship with job gratification.
A study done in South Africa on primary healthcare nurses by Delobelle et al. (2011)
identified employee welfare practices as key factors contributing to job satisfaction.
Specific facets analyzed by the study included pay, supervision and work environment.
The study complimented earlier findings in research by Kekana, Du Rand and Van Wyk
(2007) in South Africa that nurses found satisfaction in co-workers and the work itself,
among others. Similar results have been proposed by Asadullah and Fernandez (2008),
who reasoned that work-life balance is a vital element affecting both inherent and external
aspects of job fulfilment.
A study by Kemboi, Thomas and Keter (2013) on staff welfare in Kenya’s civil service
showed a significant relationship between flexible work scheduling, catering for the needs
of human capital and job satisfaction. The same findings have been reported by Ngari and
Mukururi (2014) in a study on Kenya’s banks. The study findings established a favourable
relationship between job flexibility, leave provisions, other welfare programs, and job
satisfaction. Study findings by Sembe and Ayuo (2017) on university campuses in Kenya
indicated that practices in health and safety had favourable effects on job satisfaction.
Previous studies on welfare programs and their effect on job satisfaction mostly narrowed
on production settings neglecting the service sector, especially state agencies and
corporations. There are, therefore, limited empirical studies covering the influence of

9
perceived welfare programs on employee job satisfaction in the rail transport sector.
Consequently, there is a need to survey this area to inform, educate and emphasize to
managers the effectiveness of welfare programs in attaining employee fulfilment.
Therefore, this study pursued to identify the standard employee welfare programs used in
the rail sector and pinpoint the various effects they have on employee job satisfaction at
KRC. Further, given the different findings among previous studies, it is necessary to show
the correlation between perceived employee welfare programs and job satisfaction in the
rail transport sector in Kenya. Hence, the current study targeted to answer this research
question: What is the influence of perceived employee welfare programs on employee job
satisfaction at Kenya Railways Corporation?
1.3. Objectives of the Study
The objective of the research study was to investigate the influence of perceived employee
welfare programs on employee job satisfaction at Kenya Railways Corporation.
1.4. Value of the Study
The study was relevant to the private sector and the management of Kenya Railways
Corporation where it can help managers in isolating the most appropriate employee welfare
programs that yield the highest degree of employee job satisfaction, and can, therefore, be
used to recruit skilled and talented labour for efficient business operations. Increased
productivity has a favourable effect of reducing operating costs and therefore creating a
competitive edge for an organization.
The study is significantly valuable to the government and other policymakers in the
employment sector such as labour movements, employer organizations and civil societies

10
in making strategic decisions. Some of the possibilities include legislation for better terms
and conditions of employment and conversion of some non-statutory welfare programs
such as health insurance and retirement benefit schemes into statutory welfare programs to
create a healthier workforce for increased economic development for the country.
Researchers will use the study findings to expand their perception of employee welfare
programs in Kenya. The results also contribute to the exiting theories of job satisfaction
and supplement existing literature in employee welfare programs by establishing
correlations between employee welfare programs tested in the study and employee job
satisfaction. The study laid a foundation for future studies in the field.

11
CHAPTER TWO: LITERATURE REVIEW
2.1. Introduction
The chapter examines relevant material from earlier studies in the same area. The section
fronts the theoretical foundations of the research on welfare programs and employee
satisfaction. The correlation among welfare programs and employee satisfaction has also
been reviewed. The chapter concludes by presenting an empirical review of selected studies
highlighting the knowledge gaps.
2.2. Theoretical Foundation
The study was directed by Equity Theory (Adams, 1965), and Two-Factor Theory
(Herzberg et al., 1959).
2.2.1 Equity Theory
Equity Theory (Adams, 1965) focuses on the perception employees form about their
treatment compared to others. The theory contends that employees evaluate the suitability
of their benefits received (outputs) with their work (inputs) by matching the ratio of their
input and output with that of other employees (Armstrong, 2014). Therefore, employees
feel equitably treated when their input and output ratio is construed as favourable, and vice
versa.
Equity theory is an example of process or cognitive theories whose primary concern is
‘how' relationships among dynamic variables influence employees’ perceptions and drive
their behaviour (Kiruja & Mukuru, 2018). When employees sense inequity, they act
accordingly to amend their status. This can be achieved through, changes to input - increase

12
or reduction of inputs by way of absenteeism or working free extra hours; changes to
outcome - attempted interference with pay without changing input; cognitive alteration of
inputs and outputs - distortion of facts about inputs or outputs to achieve the desired
input/output ratio; leaving the field - request for transfer or quitting employment; acting on
others - influencing others to lower their inputs or to resign; and switching the entity of
comparison - changing the comparison group (Osabiya, 2015).
According to Armstrong and Stephens (2005), an employee who is regarded equitably is
better motivated but demotivated when considered inequitably. Lease (1998) reasons that
employees’ fulfilment reduces absenteeism and makes them more industrious, and more
committed to their employer. Mullin (2005) as quoted in Osabiya (2015) submits that
equity theory can help managers enhance job satisfaction among employees by involving
them when making decisions, and appreciating that employees are likely to accept and
support organizational programs when they perceive them to be fair. This theory is,
however, anchored on the notion that employees are equally sensitive to equity even though
research suggests that several demographic, psychological and environmental variables
differently affect employees’ reactions to apparent equity or inequity (Huseman, Hatfield,
& Miles, 1987).
2.2.2 Two-Factor Theory
Two - factor theory (Herzberg et al., 1959) is a content theory which relates to employees’
desires and goals, and attempt to pinpoint ‘what’ rewards are suitable (Kiruja & Mukuru,
2018) to attain job satisfaction in organizations (Ngari & Mukururi, 2014). The theory
pursues to explain sources of job pleasure and displeasure among employees (Armstrong,
13
2014), and proposed job satisfaction to be an innate drive that steers employees to attain
self, and organizational objectives.
Herzberg et al. (1959) portrayed job satisfaction with two sets of job-related aspects that
affect employees’ degree of joy at the workplace. Also called motivation-hygiene theory,
the theory categorizes one set of elements, hygiene factors, as those that define the
employees’ interaction with their work settings and affect their level of dissatisfaction with
the job. They include salary, amenities at works, job security, relationship with colleagues,
policies and procedures (Raziq & Maulabakhsh, 2015). The other set of factors,
motivators, are related to the employees’ need to grow in their work, and they influence
job satisfaction. They include recognition, need to achieve, interest in work itself, and
opportunities for growth (Kiruja & Mukuru, 2018). The two sets of factors merge (while
hygiene factors prevent dissatisfaction, motivation factors produce satisfaction) to enhance
job fulfilment (Herzberg et al., 1959).
Herzberg’s theory is grounded in real-life settings that link employee welfare programs
with job satisfaction and presents essential lessons to managers that employees’
dissatisfiers need to be addressed first before attempts are made to motivate them and create
joy in their work. Therefore, management must first improve the working environment for
employees for them to experience any form of job satisfaction (Bakotic & Babic, 2013).
However, Guest quoted by Osabiya (2015), proposes that process theories which include
Equity Theory, provide a more relevant perspective of motivation than content or need
theories, including Herzberg’s Two-Factor Theory, which, he submits, have been
discredited by extensive research.

14
2.3. Employee Welfare Programs
Employee welfare denotes all those activities that an employer undertakes to avail
amenities and services to employees over and above the wages paid. (Sanyal & Sikidar,
2018). These programs, according to Gupta (2014), are means of uplifting the status of
employees and keeping them satisfied. These programs are numerous and vary among
employers and industrial sectors. They include allowances, working conditions, health
insurance for employee and family, and retirement schemes (Keitany, 2014).
Allowances are cash payments for exceptional circumstances (e.g. upon relocation) or
aspects of employment such as working during odd hours (Armstrong & Stephens, 2005),
over and above the basic pay. Common types of allowances include re-location allowance,
overtime, transport allowance, special duty allowance, hardship allowance, on-call
allowance, and shift allowance. Allowances, though used to reward special performance,
circumstances and commitment to organizational values, are also crucial in shaping
employees’ job satisfaction (Muguongo et al., 2015).
Employee assistance programs (EAP) include steps taken by an employer to assist
employees by way of financial planning, short term cash advances or long term negotiated
bank facilities, counselling programs, and training facilitation for personal development
(SHRM, 2019). Training is essential if an organization has to enhance employees’ job
satisfaction through capacity development (Falola, Osibanjo, & Ojo, 2014). Studies show
that employees with more considerable financial resources are unlikely to face a conflict
between job satisfaction and family as they can accomplish a lot of non-work duties (Ngari
& Mukururi, 2014).

15
Health insurance is an insurance cover paid by employers for their employees to cater for
the cost of medical services for an employee or his authorized dependant. Employee health
insurance programs are provided with the understanding that a healthy worker is an
essential requirement for improved job satisfaction and productivity in an organization
(Choudhary, 2017). Health and safety are inter-disciplinary areas focused on protecting the
health and welfare of employees (Sembe & Ayuo, 2017). Jain and Kaur (2014) maintain
that running of health and safety welfare programs advances a feeling of security, comfort,
and a sense of belonging among employees and ultimately translates into job satisfaction.
Flexible work arrangements are work practices where working hours are different from the
usual standard working hours or work arrangements (Armstrong et al., 2014). Raziq and
Maulabakhsh (2015) opine that these arrangements enable workers to fit their work times
or location around their life in terms of when one works, where one works, or how much
one works, thereby attaining work-life balance. Employees who manage both work and
family well are usually more contented with their jobs (Ngari & Mukururi, 2014).
Retirement schemes provide a source of income to employees after retirement and to their
surviving dependants upon the death of eligible employees (Armstrong & Stephens, 2005).
A pension scheme is non-contributory, and employee’s benefits are defined in advance
depending on the last salary and years of service of the employee. Contrary, occupational
schemes entail defined contributions to be made by both the employee and the employer
proportionate to the employee’s pensionable earnings to make up the retirement benefits
(RBA, 2019). In their study findings, Chen, Yang, Shiau, and Wang (2006) concluded that
the provision of retirement programs for educators enhanced job satisfaction in the
institutions.
16
Employee welfare has attained a central place in the modern commercial world, becoming
a necessity in every organization today (Sanyal & Sikidar, 2018). Therefore, measures
should be taken to put in place adequate welfare programs for all employees (Chaubey &
Rawat, 2016). Tiwari (2014) contends that welfare arrangements help to develop
employees into competent, vigorous, and contented workforce for the organization. It is
for this reason that employee welfare programs are regarded as strategic investments that
bring numerous returns to the organization by way of greater job satisfaction, efficiency
and sustainable growth (Choudhary, 2017).
2.4. Measures of Job Satisfaction
Measuring job satisfaction offers more understanding of the attitudes and the well-being of
the workforce in an organization and is useful in corporate strategic decisions. Job
satisfaction may be measured in a global construct or in various facets (Judge, Weiss,
Kammeyer-Mueller, & Hulin, 2017). Imam (1988) explains how the comprehensive job
approach looks at the job as a whole suggesting that overall satisfaction can be different
from the sum of the facets. The facet approach may use a questionnaire or an interview to
evaluate the employee’s job experiences, like the work itself, salary, career growth,
supervision, work surroundings, and co-workers (Tasios & Giannouli, 2017). This
approach yields a more accurate understanding of job satisfaction in addition to helping
managers understand which aspects of a job produce positive or negative feelings to an
employee (Lepold, Tanzer, Bregenzer, & Jiménez, 2018).
Robbins (2003) defines work as the extent to which tasks stimulate an employee, the
prospects for learning and growth, and the leeway the employee has to use initiative at
work. The Job Characteristics Model (Hackman & Oldham, 1980) submits that one is

17
more contented with work when he can comprehend the results of his work, the worthiness
of his work, skills required to do his job effectively, has the autonomy to make decisions
and gets feedback on his work. Employees’ satisfaction with work is also found to be
closely associated with how they fit in their jobs (Gabriel, Diefendorff, Chandler, Moran,
& Greguras, 2014). A study by Gara and Kim Lowman (1979) cited by Kaba (2012) found
that work itself, among all motivating factors, provided the highest level of satisfaction to
employees. However, contradictions exist regarding which factor greatly influences job
satisfaction between work and pay as different study results rank salary as the top factor
for job satisfaction (Neog & Barua, 2014; Kumar & Mini, 2013).
Studies on job satisfaction have emphasized the key role played by pay in determining how
employees are satisfied with their jobs (Salisu, Chinyio, & Suresh, 2015). Pay plays the
role of satisfying the economic needs of an employee, and it is central in any employment
contract. The behaviour and attitude of employees who are satisfied with pay are said to
be easily influenced by the administration towards the desired organizational goals
(Onukwube, 2012). Therefore, it appears conceivable that employee job satisfaction
improves with salary increases, and vice versa (Guan, Wen, Chen, Liu, & Dong, 2014).
Nonetheless, numerous studies show that salary increment may not indeed lead to more
job satisfaction due to differences in employees’ perception of justice at the workplace and
regard to monetary worth (Giannouli, 2017). Therefore, employees earning small salaries
may be satisfied with salary increments while highly-paid employees are not.
Support by supervisors is the degree of care with which managers regard their employees’
welfare and appreciate their efforts (Neog & Barua, 2014). Several studies maintain that
supportive supervisors, who encourage bonding, respect, and reciprocal trust, end up
18
increasing employee satisfaction (Salisu et al., 2015) while abusive supervisors, who
physically abuse, harass and degrade employees (Mathieu, Neumann, Hare, & Babiak,
2014), increase employee’s turnover intentions, hence the famous saying that employees
do not leave organization, but their bosses (Mathieu & Babiak, 2016). The Hawthorne
studies of 1924-32 (Roethlisberger & Dickson, 1939), asserted that supervisor support
influences worker’s attitudes and satisfaction more than any other factor. However, these
results contradict the view of Herzberg et al. (1959), who argued that relationship with
supervisor and their support is not relevant in job satisfaction.
According to Dessler (2009), promotion takes place when an employee assumes greater
responsibility higher in the hierarchy of an organization. Employees feel safe about their
future and exhibit high job satisfaction when the management displays openness, justice,
and considers their skills in carrying out promotions (Mangkunegara, 2016). If there is no
opportunity for growth or the employee has hit a glass ceiling, this could hurt the
satisfaction employees have with their jobs and positions (Kiruja & Mukuru, 2018). Rubel
and Kee (2014) deem growth opportunities as one of the essential concepts of labour
methods used to win employee loyalty and dedication to the organization and gain job
satisfaction for themselves. However, a study conducted on nurses in Kuwaiti found the
nurses were dissatisfied with opportunities for promotion but satisfied with other job
aspects such as praise, recognition, and shift arrangements (Al-Enezi, Chowdhury, Shah,
& Al-Otabi, 2009).
Kaba (2012), argues that relationship with co-workers, which involves interactions and
support by colleagues, extensively contributes to employee satisfaction. This relation
comes about because people pursue supportive relationships for both immediate sake and

19
social support in needy situations. According to social network theory, support and
empathy among co-workers increase satisfaction among employees (Raabe & Beehr,
2003). On the flip side, a troublesome co-worker may be pestering, discriminative,
excludes others based on age, gender or race, and pursues selfish interests in forming
workplace relationships (Agbozo et al., 2017), thus hindering job satisfaction. In their
study, however, Babin and Boles (1996) exhibited that co-workers’ relationships do not
have a substantial impact on job satisfaction.
2.5. Empirical Studies and Knowledge Gaps
Gazioglu and Tansel (2006), in their research in Britain, concluded that employees who are
exposed to job training and other forms of personal development programs were more
satisfied with their jobs than others. Starmer, Frintner and Freed (2016), in their study in
the US, established that several factors affected job satisfaction of early career
paediatricians, and that employee health programs, work-life balance, and support from
colleagues had the potential to ameliorate the effects.
Lee, Yang and Li (2017), in their study in China, determined that the influence of job
satisfaction on turnover among staffs in their early-career life was small and negative due
to a greater focus on future personal growth and development rather than the current job.
Choudhary (2017) demonstrated from a study in India, that employee welfare schemes
were necessary for labour relations, and that they satisfied employees more than a good
salary could.
Salisu’s (2015), findings in a study in Nigeria concluded that the compensation packages
awarded to employees by employers had a substantial positive impact on the way workers’
felt about their jobs. Another study in Kenya by Muguongo et al. (2015) established that

20
salary, allowances and work environment greatly affected teachers’ job satisfaction and
suggested formulation of welfare plans that would allow teachers to realise job
gratification.
Majority of these studies were carried out in FMCG and banking industries where
employee welfare programs immensely contribute to worker’s satisfaction. From these
studies, several factors have been indicated to affect job satisfaction more than others.
While a number of studies show existence of a correlation between age, gender, job
characteristics, salary, growth opportunities, style of supervision, co-workers, culture and
satisfaction with one’s job, others have shown employee job satisfaction to be significantly
determined by personality traits, work environment, rewards and recognition, leadership,
and job security.
Contrary, some studies have found that work itself, pay, relationship with a co-worker and
even opportunities for promotion do not have any noteworthy consequence on employee
job satisfaction. Moreover, some studies have indicated that supervision does not have
relevance in employees’ attitudes towards their jobs. This study desired to ascertain
whether job satisfaction is shaped by the perceived employee welfare programs present or
absent at KRC. Since there are few studies conducted on employee welfare programs in
the rail transport sector in Kenya, the research findings will provide an empirical study for
further research.

21
CHAPTER THREE: RESEARCH METHODOLOGY
3.1 Introduction
This chapter sets out the steps adhered to in the study from research design, target
population, sampling method, data gathering techniques, to techniques used in analysing
the data and reporting of findings established.
3.2 Research Design
Research design delivers a framework for the research data collection and analysis
(Walliman, 2017). This study used descriptive cross-sectional survey design relying on
observation to gather data from respondents in the selected sample population. This
research design systematically gathers data that describes prevailing occurrences by
querying the respondents’ experiences, views, and beliefs that cannot be directly observed
(Mugenda & Mugenda, 2003). This approach guaranteed that detailed data was gathered
on the study subject and wide-ranging conclusions achieved.
3.3 Target Population
In statistics, population is the whole collection of people or things that the researcher is
interested in and wishes to conclude on (Avedian, 2014). Mugenda and Mugenda (2003)
define the target population as the members of a set of people, occurrences or items that
are real or hypothetical and which the scholar desires to infer the research findings. The
target population for this study was all the 1,214 staffs of KRC, MGR Operations (KRC,
2019).

22
3.4 Sample Size and Sampling Technique
A sample is a representative of the population under study and is used to predict about the
population (Avedian, 2014). A multistage stratified random sampling method was used to
choose the sample statistic. This sampling technique produces accurate approximations of
the population specifications that are a more representative sample of a reasonably
heterogeneous population (Denscombe, 2007). The target population was stratified into
two; management and non-management employees then divided further into strata based
on regions of operations, i.e. Coastal, Eastern, Headquarters (HQ) and Western. A sample
size of 10% of the target population is deemed a good representation for a descriptive
survey (Mugenda & Mugenda, 2003). Hence, a sample size of 123, 10% of the population,
was determined as per Table 3.1.
Table 3. 1 Population and Sample Size
Region Population
Per
cen
tag
e
Sample Size
Management
Non-
Management Total Management
Non-
Management Total
Coastal 76 170 246 0.1 8 17 25
Eastern 140 495 635 0.1 14 50 64
HQ 77 26 103 0.1 8 3 11
Western 62 168 230 0.1 6 17 23
Total 355 859 1214 36 87 123
Source: Primary Data (2019)

23
3.5 Data Collection
The study used a structured self-administered questionnaire to gathered primary data.
Primary data was preferred because it is very close to the truth, and any error is controlled
(Cooper & Schindler, 2014). Self-administered questionnaires were appropriate because
they are easy to administer, ideal in obtaining confidential data, cost-effective, and the data
collected is comparable and easy to analyse (Belisario et al., 2015). Questionnaires also
give feedback on a timely basis and from respondents in extensive geographical coverage.
The questionnaire designed in this study had three sections. Part 1 contained questions on
the respondent’s demographic data, part 2 included questions on employee welfare
programs, and part 3 included questions on job satisfaction. Statements requiring
responses on a five-level Likert scale were used to save time and ease data collection. The
questionnaire was tested first to confirm the clarity of questions to the respondents and any
emerging concerns addressed in the final questionnaire.
3.6 Data Analysis
Data analysis means the derivation of meaningful evidence from a mass of data through
the rearrangement and separating of data into the many parts necessary to determine the
nature, relationship, functions, differences and interrelationships for reporting purpose
(Connaway & Powell, 2010). Data collected in the study was edited for glaring omissions
and inaccuracies before analysing it using Microsoft Excel 2016. The findings were
presented in Tables and Figures to enable effective interpretation.
A multiple regression analysis was done to conclusively derive the causal-effect connection
between the target and the predictor variables, and which of the predictor variables best

24
projected the dependent variable. The independent variables in the regression equation
were allowances payment programs, employee assistance programs, employee health
programs, retirement programs, and flexible work programs while the dependent variable
was employee job satisfaction.
The following regression mode was used in the study:
Y = β0 + β1X1 + β2X2 + β3X3 + β4X4 + β5X5 + ε
Whereby:
Y = employee job satisfaction
β0, β1, β2, β3, β4 and β5 = coefficients of regression
X1 = allowances payment programs
X2 = employee assistance programs
X3 = employee health programs
X4 = retirement programs
X5 =flexible work programs
ε = error

25
CHAPTER FOUR: DATA ANALYSIS, RESULTS AND DISCUSSION
4.1. Introduction
The chapter furnishes the breakdown of the data assembled, and presents the study findings
and their interpretation. Data analysis, for descriptive statistics, and regression to examine
the association amongst the study variables, were carried out using Microsoft Excel 2016
software. The study findings are presented in Tables and Figures.
4.2. Demographics Background
This section advances the respondents’ demographics describing their background
information, gender, education, level in the organization (cadre), and the geographical
region of their workstation. The results were presented in the subsections below.
4.2.1. Response Rate
The responses received were analysed as per Table 4.1.
Table 4. 1 Response Rate
Responses Frequency Percentage
Completed number of responses 117 95.1%
Not submitted 6 4.9%
Total 123 100%
Source: Primary Data (2019)
From Table 4.1, out of the targeted population sample of 123 employees who were sent
questionnaires via e-mail, 117 filled and submitted the forms, presenting an excellent
response rate of 95.1%. A total of 6 respondents did not submit their responses.

26
4.2.2. Respondents by Gender
A provision was made in the questionnaire for the respondents to indicate their gender. An
analysis of the responses indicated that 71.8% (84) of the respondents were males, 25.6%
(30) were females while 2.6 % (3) chose not to divulge their gender. Although the
respondents were majorly male, the difference in the number of males and females was not
significant. Hence, the study could not have been influenced by gender disparity.
4.2.3. Respondents per Region
Responses were received from all the 4 regions set out by KRC as shown in Figure 4.1
below.
Figure 4. 1 Respondents per Region
Source: Primary Data (2019)
Figure 4.1 above shows that Eastern region had the highest response of 53.8% (63)
followed by Coastal region with 20.5% (24) of the respondents. Headquarters (HQ) had
the lowest response of 7.7% (9) followed by the Western region with 17.9% (21). From
the findings, it is evident that responses from all the regions were captured.
Coastal, 24,
20.5%
Eastern, 63,
53.8%
HQ, 9, 7.7%
Western, 21,
17.9%

27
4.2.4. Respondents by Level of Education
The researcher pursued to determine the academic qualifications achieved by the sampled
population. The analysis yielded the outcomes advanced in Table 4.2.
Table 4. 2 Respondents by Level of Education
Education Frequency Percentage
Bachelor's Degree 26 22.2%
Diploma 27 23.1%
Master's Degree 3 2.6%
Others 17 14.5%
Post-graduate Diploma 7 6.0%
Technical 37 31.6%
Total 117 100.0%
Source: Primary Data (2019)
From Table 4.2, the biggest number of the respondents had technical credentials accounting
for 31.6% (37) of the respondents followed by those with diploma qualifications at 23.1%
(27). The lowest categories of respondents were those with a master's degree at 2.6% (3)
followed by a post-graduate diploma at 6% (7). Respondents with bachelor’s degree were
22.2% (26) while those with other credentials were 14.5% (17). Therefore, majority of the
respondents had knowledge of employee welfare programs requisite for the study.
4.2.5. Respondents by Cadre
The study collected data about the respondents' cadre in employment. Outcomes of the
analysis revealed that 76.1% (89) of the respondents were in the management cadre while
23.9% (28) were in the non-management cadre. The representation of these cadres of staff
ensured that the various employee welfare programs specific to each cadre were studied.

28
4.3. Assessment of Employee Welfare Programs
Some employee welfare programs were identified to be the independent variables of the
study. The researcher sought to establish the influence of these independent variables on
the dependent variable of the study, employee job satisfaction.
Responses were obtained from the respondents to establish the extent to which the
employee welfare programs had been implemented at KRC, on a 5-point Likert Scale as
per Table 4.3.
Table 4. 3 Assessment of Employee Welfare Programs
Responses Points
Very Great Extent Excellent 5
Great Extent Above Average 4
Undecided Average 3
Very Little Extent Below Average 2
Not at All Very Poor 1
Source: Primary Data (2019)
From Table 4.3, points for the Likert Scale answers were allocated ranging from 1 to 5,
analyses were undertaken and the results reported in the subsections that follow.
4.3.1. Allowances Payment Programs
Allowances are used by employers to reward exceptional performance, circumstances and
commitment to organizational values. Allowances that are commonly paid in the railways
operations sector in Kenya include subsistence allowance, re-location allowance, overtime,
leave allowance, transport allowance, special duty allowance, acting allowance, hardship
allowance, on-call allowance, and shift allowance.

29
The researcher sampled some allowances and advanced several statements on the
allowances payment programs to the respondents for them to express their degree of
agreement with the application of the statements as far as KRC was concerned. The
responses received were analysed and the results exhibited in Table 4.4.
Table 4. 4 Allowances Payment Programs
Allowances payment programs Mean SD
I am paid subsistence allowance as per policy. 4.30 0.561
I am paid relocation allowance as per policy. 4.32 0.554
I am paid all the allowances as per the corporation’s pay structure. 2.65 1.109
I am paid the correct allowances for my cadre as per policy. 2.62 1.074
Average score 3.47 0.825
Source: Primary Data (2019)
From Table 4.4, the findings show an average means score for allowances payment
programs was 3.47 and SD of 0.825. This demonstrated that the respondents were united
in agreeing, to a great extent, that allowances payment programs were made available to
them. While the respondents agreed to a very great extent that they were paid subsistence
allowance and relocation allowances, realizing a mean of 4.30 and 4.32 separately, they
were not sure whether they were receiving all the allowances as per pay structure and
whether they were being paid allowances at the correct rate, thus scoring a mean of 2.65
and 2.62 respectively.
Lack of proper information may have caused respondents to be undecided on the
allowances available and the correct rate to be used. This could have been addressed
through effective dissemination of information to all employees by way of policy or
circulars.

30
4.3.2. Employee Assistance Programs
Employee assistance programs cover all measures taken by employers to help their
employees to resolve pressing personal problems. The respondents were asked to indicate
the degree that listed statements on employee assistance programs were applicable in KRC.
Data analysis yielded the results in Table 4.5.
Table 4. 5 Employee Assistance Programs
Employee assistance programs Mean SD
I am entitled to support for professional development. 1.50 0.761
I usually receive counselling services on work-life balance. 1.03 0.183
I am entitled to financial assistance from the corporation. 1.87 0.361
I am entitled to negotiated bank loan facilities for my needs. 1.03 0.159
Average score 1.36 0.366
Source: Primary Data (2019
From Table 4.5, the average means score for employee assistance programs is 1.36 and SD
of 0.366 indicating that the respondents unitedly did not perceive employee assistance
programs to be available at KRC. The respondents indicated absence of support for
professional development through a mean of 1.50. The absence of counselling services on
work-life issues was exposed by a mean of 1.03. The same applied to financial assistance
from the corporation and negotiated bank loan facilities which returned a mean of 1.87 and
1.03, disjointedly
4.3.3. Employee Health Programs
Employers put in place health programs to cater for the cost of medical services for an
employee and his authorized dependants, if included in the medical program. Health
programs help to improve employees’ wellbeing, reduce their healthcare expenses, and

31
increase job satisfaction. A list of statements was drawn for respondents to specify the
level of agreement with each regarding the provision of employee health programs by
KRC. Data collected was scrutinized and the findings expressed in Table 4.6.
Table 4. 6 Employee Health Programs
Employee health programs Mean SD
I have a medical insurance cover secured for me and family. 1.95 0.318
The employer has an insurance cover for work injuries. 1.28 0.452
The corporation organizes wellness programs for all staff. 1.11 0.316
The company supports sports activities for personal fitness. 1.08 0.268
Average score 1.35 0.338
Source: Primary Data (2019)
Table 4.6 discloses an average means score for employee health programs of 1.35 and SD
of 0.338. The respondents consistently indicated that they did not perceive employee
health programs to be available in KRC. The respondents indicated that there was no
medical cover in place for them and their families by returning a mean of 1.95. The
perceived absence of insurance cover for work injuries was indicated by the respondents
via a mean of 1.28. The perceived absence of wellness programs and also sports activities
were indicated by means of 1.11 and 1.08, accordingly.
4.3.4. Retirement Programs
Retirement programs, which may be fully or partly funded by the employer, serve to
encourage long-term savings and investments among employees as a source of income
after retirement or to their surviving dependants upon the death of a qualifying employee.
Retirement programs may also be used by employers to encourage continuous service by
an employee where the benefits are determined by period of employment. Statements

32
were fronted to the respondent for them to choose the level of agreement with the
availability of retirement programs in KRC. Analysis findings were as per Table 4.7.
Table 4. 7 Retirement Programs
Retirement programs Mean SD
I am a member of the employer's pension scheme. 1.04 0.242
I am entitled to gratuity upon retirement or end of my contract. 1.08 0.439
I am entitled to financial programs that prepare me for retirement. 1.08 0.439
I am employed on terms that allow time for retirement planning. 1.07 0.286
Average score 1.07 0.351
Source: Primary Data (2019)
Table 4.7 shows an average means score for retirement programs of 1.07 and SD of 0.351.
The findings clearly indicate that the employees did not perceive retirement programs to
be available in KRC. The respondents indicated that they were not members of the
employer’s pension scheme, at a mean of 1.04. There was an indication from the
respondents that there was no gratuity payment upon retirement or expiry of their
employment contracts at a mean of 1.08. The respondents also laid bare the absence of
financial programs to prepare them for retirement at a mean of 1.08 while the view that
their contracts did not allow time for retirement planning had a mean of 1.07.
4.3.5. Flexible Work Programs
Flexible work programs allow employees to adjust their work times or location around
their life for them to pursue other interests such as pursuing further studies, attend to
personal or family responsibilities such as taking a sick child to hospital, or fit in life
challenges such as beating traffic congestions. Several statements on flexible work

33
programs were presented to the respondent for them to specify the level of agreement with
their application in KRC. The results are shown in Table 4.8.
Table 4. 8 Flexible Work Programs
Flexible work programs Mean SD
I can cover a week's job in fewer days and rest for the remaining days
in the week.
1.03 0.183
I can report to work early and leave early to attend to personal needs. 1.04 0.203
I can work away from the office on an approved schedule. 1.05 0.258
I am entitled to adequate leave to prepare and sit for examinations. 1.14 0.434
Average score 1.03 0.183
Source: Primary Data (2019)
The findings in Table 4.8 portray an average means score for flexible work programs of
1.07 and SD of 0.269. This is an indication that the respondents did not perceive flexible
work programs to be present at KRC. The respondent's mean for the ability to compress
their work into fewer days of the week and take rest in the remaining days was 1.03. The
mean for the ability to report to work early and leave early was at 1.04. The ability to work
away from office had a mean of 1.05 while that of adequate leave to prepare and sit for
examination was 1.14.
4.3.6. Perceived Availability of Employee Welfare Programs
The researcher required the respondents to rate the availability of employee welfare
programs at KRC and also to list any other employee welfare programs that were not listed
for rating. The additional welfare programs listed were burial assistance upon the death
of an employee, and reimbursement of medical bills for employees only. Analysis of
responses on the availability of employee welfare programs was as per Table 4.9.
34
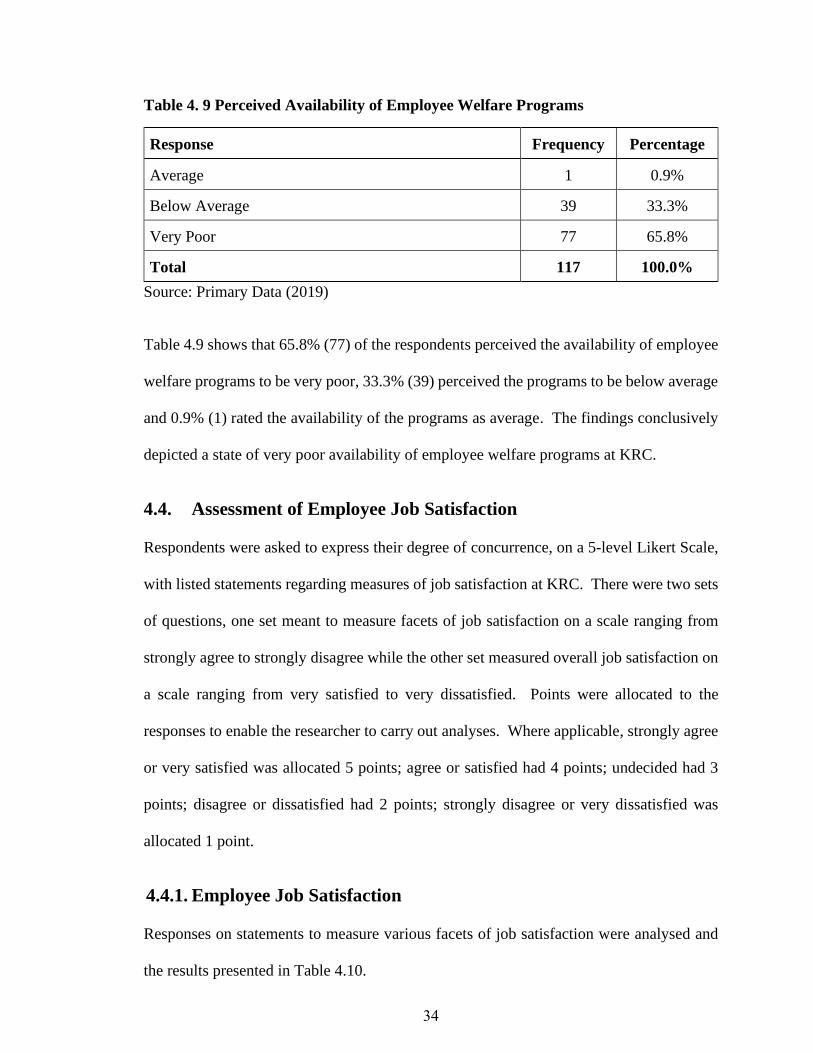
Table 4. 9 Perceived Availability of Employee Welfare Programs
Response Frequency Percentage
Average 1 0.9%
Below Average 39 33.3%
Very Poor 77 65.8%
Total 117 100.0%
Source: Primary Data (2019)
Table 4.9 shows that 65.8% (77) of the respondents perceived the availability of employee
welfare programs to be very poor, 33.3% (39) perceived the programs to be below average
and 0.9% (1) rated the availability of the programs as average. The findings conclusively
depicted a state of very poor availability of employee welfare programs at KRC.
4.4. Assessment of Employee Job Satisfaction
Respondents were asked to express their degree of concurrence, on a 5-level Likert Scale,
with listed statements regarding measures of job satisfaction at KRC. There were two sets
of questions, one set meant to measure facets of job satisfaction on a scale ranging from
strongly agree to strongly disagree while the other set measured overall job satisfaction on
a scale ranging from very satisfied to very dissatisfied. Points were allocated to the
responses to enable the researcher to carry out analyses. Where applicable, strongly agree
or very satisfied was allocated 5 points; agree or satisfied had 4 points; undecided had 3
points; disagree or dissatisfied had 2 points; strongly disagree or very dissatisfied was
allocated 1 point.
4.4.1. Employee Job Satisfaction
Responses on statements to measure various facets of job satisfaction were analysed and
the results presented in Table 4.10.

35
Table 4. 10 Employee Job Satisfaction
Measure of job satisfaction Mean SD
Pay
I am satisfied with my pay structure. 1.90 0.443
I am always paid my salary in good time. 2.67 0.947
I always receive annual cost of living salary adjustment. 1.03 0.183
The pay I get reflects my knowledge, skills, and years of service. 1.06 0.238
Average score 1.66 0.453
Supervision
My supervisor is friendly and approachable. 3.62 0.889
My supervisor is supportive of my work. 3.62 0.917
I openly discuss problems with my supervisor. 3.56 0.875
My supervisor shares relevant information from top management. 3.41 0.892
Average score 3.55 0.893
Promotion
There are chances for promotion within the corporation. 1.57 0.661
There is equity and openness in promotions. 1.54 0.595
Employees are given priority in filling vacant positions. 1.58 0.710
There is a clear organizational structure and career paths for all. 1.62 0.753
Average score 1.58 0.680
Working conditions
The management tries to understand and address my needs. 1.97 0.636
I am provided with the right tools and equipment for my duties. 2.15 0.466
My work area is easily accessible and has emergency exits. 2.14 0.600
I am provided with clean drinking water and office tea. 2.10 0.607
Average score 2.09 0.578
Source: Primary Data (2019)

36
From Table 4.10, the aspect of supervision had an average means score of 3.55 and SD of
0.893 indicating that the respondents agreed with statements expressing satisfaction with
supervision, with a small degree of variability. Following in the hierarchy of satisfaction
based on responses received was the working conditions which had an average means score
of 2.09 and SD of 0.578 indicating that the respondents disagreed with statements of
satisfaction with their working conditions. Measures of promotion ranked the least in the
hierarchy, at an average means of 1.58 and SD of 0.680, followed by pay which had a
means score of 1.66 and SD of .453.
4.4.2. Rating of Employee Job Satisfaction
Respondents were required to rate the level of employee satisfaction at KRC. The results
are in Table 4.11.
Table 4. 11 Rating of Employee Job Satisfaction
Employee job satisfaction Frequency Percentage
Satisfied 2 1.7%
Undecided 3 2.6%
Dissatisfied 37 31.6%
Very dissatisfied 75 64.1%
Total 117 100.0%
Source: Primary Data (2019)
The outcomes in Table 4.11 show that 64.1% (75) of the respondents were very dissatisfied,
31.6% (37) were dissatisfied, 2.6% (3) were undecided, and 1.7% (2) were satisfied.
Overall, a greater part of the respondents was very dissatisfied.

37
4.5. Regression Analysis
The study purposed to derive the relationship between the dependent variable, employee
job satisfaction, and the predictor variables, allowances payment programs, employee
assistance programs, employee health programs, retirement programs, and flexible work
programs, using multiple linear regression analysis, at 95% confidence level (α = 0.05).
The study used Microsoft Excel 2016 for the regression analysis and the outcomes are
shown in Table 4.12.
Table 4. 12 Regression Summary
Multiple R R Square Adjusted R Square Standard Error
0.6204 0.3849 0.3572 0.2799
Predictors: Employee Welfare Programs
Dependent Variable: Employee Job Satisfaction
Source: Primary Data (2019)
From Table 4.12, the coefficient of determination is 0.3572 denoting the extent to which
the regression line from the model derived fits the data collected. Therefore, the
independent variables in the model of the study could collectively predict 35.7% of the
variability in employee job satisfaction, while 64.3% could be predicted by variables that
were not considered in the model; random error term, subject to a standard error of 30%.
This level of outcome is found to be acceptable for studies in humanities. There was a
strong positive linear correlation between the independent variables of the study and the
dependent variable, employee job satisfaction, of 62%.
The analysis of variance (ANOVA) was done using Microsoft Excel 2016 and the results
shown in Table 4.13.
38
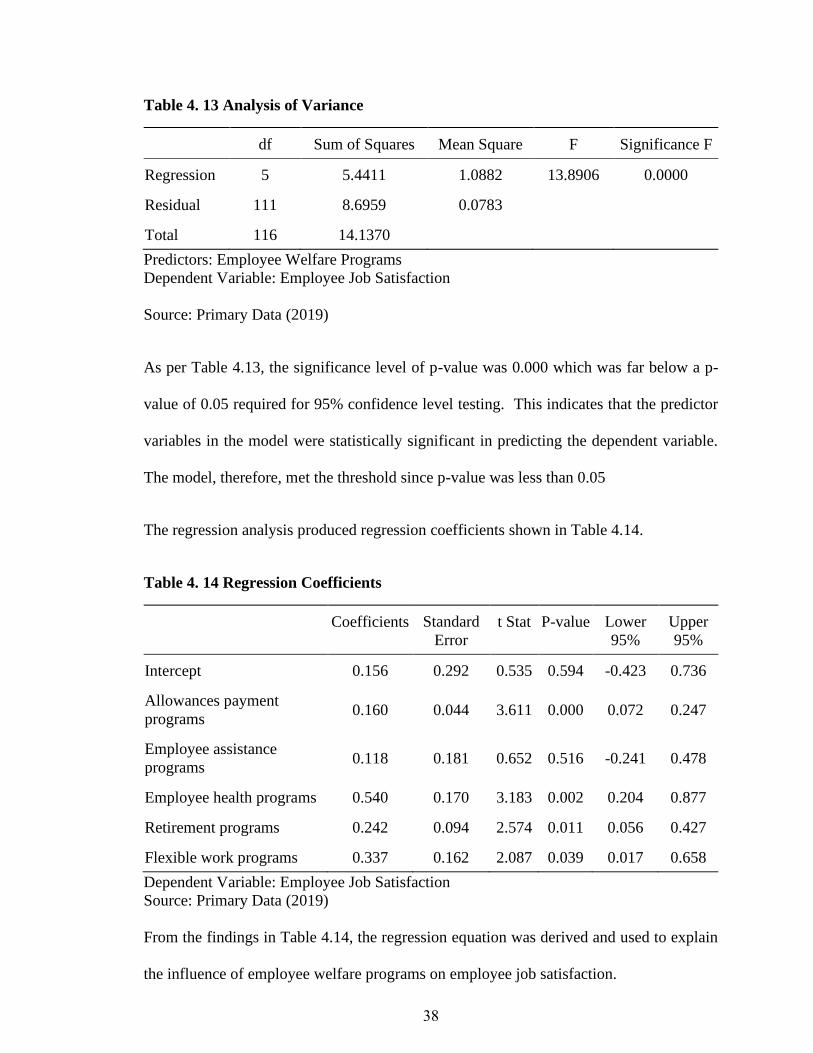
Table 4. 13 Analysis of Variance
df Sum of Squares Mean Square F Significance F
Regression 5 5.4411 1.0882 13.8906 0.0000
Residual 111 8.6959 0.0783
Total 116 14.1370
Predictors: Employee Welfare Programs
Dependent Variable: Employee Job Satisfaction
Source: Primary Data (2019)
As per Table 4.13, the significance level of p-value was 0.000 which was far below a p-
value of 0.05 required for 95% confidence level testing. This indicates that the predictor
variables in the model were statistically significant in predicting the dependent variable.
The model, therefore, met the threshold since p-value was less than 0.05
The regression analysis produced regression coefficients shown in Table 4.14.
Table 4. 14 Regression Coefficients
Coefficients Standard
Error
t Stat P-value Lower
95%
Upper
95%
Intercept 0.156 0.292 0.535 0.594 -0.423 0.736
Allowances payment
programs 0.160 0.044 3.611 0.000 0.072 0.247
Employee assistance
programs 0.118 0.181 0.652 0.516 -0.241 0.478
Employee health programs 0.540 0.170 3.183 0.002 0.204 0.877
Retirement programs 0.242 0.094 2.574 0.011 0.056 0.427
Flexible work programs 0.337 0.162 2.087 0.039 0.017 0.658
Dependent Variable: Employee Job Satisfaction
Source: Primary Data (2019)
From the findings in Table 4.14, the regression equation was derived and used to explain
the influence of employee welfare programs on employee job satisfaction.

39
The regression equation was derived as follows:
Y = 0.156+ 0.160X1 + 0.118X2 + 0.540X3 + 0.241X4 + 0.337X5
Where:
Y = Employee job satisfaction
X1 = Allowances payment programs
X2 = Employee assistance programs
X3 = Employee health programs
X4 = Retirement programs
X5 =Flexible work programs
From the regression equation, Y-intercept (β0) is 0.156 denoting a constant, that is, the
level of job satisfaction that can be achieved without all the welfare programs in the study.
A β1 of 0.160 meant that every unit change in payment of allowances, employee job
satisfaction is expected to change by 0.160 on average, holding other variables constant.
Likewise, a β2 of 0.118 meant that every unit change in employee assistance programs
leads to a change in employee job satisfaction of 0.118 on average, holding other variables
constant. A unit change in employee health programs, holding other variables constant,
would, therefore, cause employee job satisfaction to change by 0.540 as denoted by β3. A
β 4 of 0.240 meant that every unit change in retirement programs is expected to cause
employee job satisfaction to change by 0.240 on average, other variables remaining
constant. Finally, a unit change in flexible work programs, all other variables constant, is
expected to cause employee job satisfaction to change by 0.337 as shown by β5.
An assessment of the predictor variables revealed that employee health programs had the
greatest influence on employee job satisfaction at KRC trailed by flexible work programs,

40
retirement programs, advance payment programs and the least was employee assistance
programs. The most effective predictors of employee job satisfaction were advance
payments programs followed by employee health programs, and retirement programs.
Employee assistance programs and flexible work programs emerged the least significant
predictors of employee job satisfaction at KRC, with the least t-statistic of 0.652 and 2.087
respectively, but highest probability of their coefficients occurring due to random chance.
4.6. Discussion of Research Findings
The researcher analysed data collected using Microsoft Excel 2016 and presented the
outcomes as Tables and, where possible, Figures. A regression analysis was performed to
establish the correlation between employee welfare programs and job satisfaction.
Responses collected indicated the highest number of respondents had technical credentials
at 31.6% followed by diploma at 23.1%. This was the case because railway operations,
which are labour intensive, employ a lot of technical skills usually drawn from technical
training institutions such as RTI.
The study findings pointed to serious concerns about the lack of employee welfare
programs for MGR Operations employees at KRC. There was evidence from the study
findings that employees were not getting support for professional development despite
Falola, Osibanjo and Ojo (2014) proposing that training and capacity development
increases worker’s job satisfaction. There was also, no evidence of the availability of
health insurance cover for employees and their families or even insurance cover for work
injuries though they were essential requirements for improved job satisfaction and
productivity in an organization (Choudhary, 2017). The respondents also indicated they
were not members of a pension scheme contrary to recommendations by Chen, Yang,

41
Shiau, and Wang (2006), and were also not due for gratuity at the end of their employment
contracts which were not long enough for retirement planning. However, the respondents
indicated they were satisfied to a great extent, with allowances payment programs.
Accordingly, 65.8% of respondents rated the availability of employee welfare programs as
very poor while 64.1% of the respondents indicated they were very dissatisfied.
The study supports empirical studies done by Neog and Barua (2014) on the factors
influencing levels of job satisfaction. The study findings confirm that employee welfare
programs greatly influence employee job satisfaction.
42
CHAPTER FIVE: SUMMARY, CONCLUSION AND
RECOMMENDATIONS
5.1. Introduction
This chapter summarizes the whole study, the resulting interpretations, and gives
propositions to the stakeholders who could find the study findings useful to them while
pointing out the limitations and suggesting extents for further study. The study covered all
employees of KRC, MGR Operations.
5.2. Summary
The intention of the study was to investigate the influence of perceived employee welfare
programs on employee job satisfaction at Kenya Railways Corporation. The population
was all the 1,214 employees of KRC, MGR Operations, spread in towns along MGR line
and clustered into 4 regions: Coastal, Eastern, Headquarters (HQ), and Western. The
sample size was 123 respondents, approximately 10% of the population. The study used
descriptive cross-sectional survey design. Use of multistage stratified random sampling
method was applied to obtain a sample from management and non-management cadres in
the 4 regions designated by KRC. Self-administered questionnaires were used to collect
primary data which was analyzed using Microsoft Excel 2016 to establish frequencies,
mean and standard deviations. Microsoft Excel 2016 was also used for regression and
analysis of variances to established the correlation between the predictor and target
variables. The data was presented in Tables and Figures.
The study established that the relationship between employee welfare programs and
employee job satisfaction is statistically significant. Majority of the respondents had high

43
levels of education, and were therefore able to comprehend and correctly fill the
questionnaire. The study findings pointed to serious concerns about the lack of employee
welfare programs for MGR Operations employees at KRC. The findings revealed that the
employees were satisfied with allowance payments programs to a very great extent but they
were not satisfied at all with employee assistance programs, employee health programs,
retirement programs, and flexible work programs. Overall, the respondents rated the
availability of welfare programs as very poor, and job satisfaction as very dissatisfied.
5.3. Conclusions
The study examined the correlation between perceived employee welfare programs and
employee job satisfaction at Kenya Railways Corporation. The positive correlation
between employee welfare programs and employee job satisfaction established in the study
supports the conclusion that employee welfare programs greatly influence one’s job
satisfaction. The study outcomes determined that employee welfare programs were largely
unavailable to KRC, MGR Operations employees. Whereas allowances payment programs
were greatly available to employees, the responses revealed that employee assistance
programs, employee health programs, retirement programs, and flexible work programs,
were not available to them at all.
The study also concluded that worker’s health programs had the greatest positive influence
on job satisfaction. Medical insurance cover, work injuries cover, wellness, and fitness
programs are all necessary components of employee health programs. Flexible work
programs had the second-highest positive impact on job satisfaction trailed by retirement
programs. Employee assistance programs returned the least positive influence on job
satisfaction followed by allowances payment program.

44
5.4. Recommendations
The study recommends that employers should roll out as many employee welfare programs
as possible because they greatly influence job satisfaction among employees. All
allowances payable should be communicated and applied in a fair, transparent, and
equitable manner for employees to derive satisfaction. The study also recommends that
organizations should embrace employee assistance programs to support employees in
coping with individual difficulties and achieve job satisfaction. Support for professional
development through training and development, coaching and mentorship equip the
workers with the right skills and talents essential for their work, thus increasing their
competences, productivity, and job gratification.
The study recommends employers to provide health programs to their employees, and
where possible their families. These programs may include medical insurance cover for
employees and their families, work injuries benefits, wellness, and fitness activities. These
programs help to keep employees healthy, reduce financial strain, and absenteeism,
therefore increasing employee’s fulfilment and output. The study also recommends
organizations to adopt flexible work programs, where possible, especially in this era of
internet technology to help employees pursue personal interests like attending evening
classes. This helps employees to attain work and life balance and satisfaction.
The study further recommends the implementation of retirement programs by
organizations to assist employees to prepare for a decent life after retirement. Where
employees are engaged on contract, the study recommends long-term contracts, minimum
of 5 years, and payment of service gratuity at the expiry of the contract where the
employees are not members of a pension scheme.
45
5.5. Limitations of the Study
Several challenges were faced by with the study beginning with the use of a cross-sectional
research design since it was a one-time study. This research design was limiting as data
was collected from the respondents in a snapshot and not at several points in time which
could have been more accurate in measuring outcomes and exposures. The study also
faced response limitations whereby a response rate of 95% was attained with 6 respondents
not submitting their questionnaires, and 3 respondents not indicating their gender thus
affecting the analysis of findings.
Time constraint was another limitation of the study which led to the use of closed-ended
questions in the questionnaire for ease of data analysis instead of open-ended questions or
an interview guide for an in-depth collection of qualitative data. Another constraint in the
study was not obtaining the age groups of the respondents. The researcher had not foreseen
the need to associate some variables to age group such as flexible work programs and
retirement programs which are likely to be affected by age.
Another restriction to the study was relying on self-reported data that could not be
independently verified and therefore prone to exaggeration, telescoping, and selective
memory. The researcher had no option in this case but to take the responses at face value.
The shortage of existing research studies on the subject was another limitation of the study
as a great number of available studies were occupied with the connection between welfare
programs and performance. The researcher, therefore, had limited empirical studies within
the scope of the study to build on and therefore encourages researchers to carry out surveys
on railways operations in Kenya and help KRC improve service delivery.

46
5.6. Suggestions for Further Study
The study concentrated on employee welfare programs and employee job satisfaction at
Kenya Railways Corporation, MGR Operations. Future studies should endeavour to
address the shortcomings encountered in this study especially by using longitudinal study
which is more accurate in measuring outcomes and exposures, and if possible, shift focus
from employee satisfaction to employee engagement which is said to achieve both
employee satisfaction and performance in organizations.
Future studies should also be done on SGR Operations, and other state corporations, to
reveal more employee welfare programs that the organizations should embrace for
enhanced employee job satisfaction and efficient service delivery.

47
REFERENCES
Adams, J. S. (1965). Injustice in social exchange. Advances in Experimental Psychology.
New York: Academic Press.
Africa Star Railway Operation Company Limited. (2018). About us - Introduction.
Retrieved from http://www.mn-sgr.com/aboutus/introduction/
Agarwal, R. N., & Dewan, P. (2016). A study on the relationship of employee satisfaction
VIZ-A-VIZ attitude and perception of the employees towards the organization.
International Journal of Information, Business and Management, 8(1), 67-87.
Agbozo, G. K., Owusu, I. S., Hoedoafia, M. A., & Atakorah, Y. B. (2017). The effect of
work environment on job satisfaction: Evidence from the banking sector in Ghana.
Journal of Human Resource Management, 5(1), 12-18.
Al-Enezi, N., Chowdhury, R. I., Shah, M. A., & Al-Otabi, M. (2009). Job satisfaction of
nurses with multicultural backgrounds: A questionnaire survey in Kuwait. Applied
Nursing Research, 22(2), 94–100.
Armstrong. (2014). A Handbook of human resource management practice. New York:
Kogan Page Publishers.
Armstrong, M., & Stephens, T. (2005). A handbook of employee reward management and
practice. London and Philadelphia: Kogan Page Publishers.
Asadullah, M. N., & Fernandez, R. M. (2008). Work-life balance practices and the gender
gap in job satisfaction in the UK: Evidence from matched employer-employee data.
Retrieved from http://hdl.handle.net/10419/34882
Avedian, A. (2014). Survey design. Havard Law School, [email protected].
Babin, J. B., & Boles, J. S. (1996). The Effects of Perceived Co-Worker Involvement and
Supervisor Support on Service Provider Role Stress. Performance and job
Satisfaction. Journal of Retailing, , 72(1), 57-75.

48
Bajpai, N., & Srivastava, D. (2004). Sectorial comparison of factors influencing job
satisfaction in Indian banking sector. Singapore Management Review, 26(2), 89–
99.
Bakotic, D., & Babic, T. B. (2013). Relationship between Working Conditions and Job
Satisfaction: The Case of Croatian Shipbuilding Company. International Journal
of Business and Social Science, 4(2), 206-213.
Baral, R., & Bhargava, S. (2011). HR interventions for work-life balance: Evidences from
organisations in India. International Journal of Business, Management and Social
Sciences, 2(1), 33-42.
Belisario, J. M., Jamsek, J., Huckvale, K., O'Donoghue, J., Morrison, C. P., & Car, J.
(2015). Comparison of self‐administered survey questionnaire responses collected
using mobile apps versus other methods. Cochrane Database of Systematic
Reviews, (7).
Brayfield, A. H., & Crockett, W. H. (1955). Employee attitudes and employee
performance. Psychological Bulletin, 52, 396-424.
Cambridge University Press. (2019). Cambridge English Dictionary. Retrieved from
https://dictionary.cambridge.org/dictionary/english/perception
Chaubey, D. S., & Rawat, B. (2016). Analysis of Labour Welfare Schemes and Its Impact
on Job Satisfaction: An Empirical Study. Management Convergence, 7(2), 45-53.
Chen, S. H., Yang, C. C., Shiau, J. Y., & Wang, H. H. (2006). The Development of an
Employee Satisfaction. The TQM Magazine, 18(5), 484-500.
Choudhary, S. (2017). Employee welfare: A scheme of wise investment. International
Journal of Advanced Education and Research, 2(1), 01-06.
Connaway, L. S., & Powell, R. R. (2010). Basic research methods for librarians. Santa
Barbara, CA: ABC-CLIO.

49
Cooper, D. R., & Schindler, P. S. (2014). Business Research Methods. New York:
McGraw-Hill/Irwin.
Delobelle, P., Rawlinson, J. L., Ntuli, S., Malatsi, I., Decock, R., & Depoorter, A. M.
(2011). Job satisfaction and turnover intent of primary healthcare nurses in rural
South Africa: a questionnaire survey. Journal of advanced nursing, 67(2), 371-383.
Denscombe, M. (2007). The Good Research Guide: For Small-Scale Social Research
Projects. England; New York: Open University Press.
Dessler, G. (2009). A Framework for Human Resource Management. New Jersey: Pearson
Education .
Falola, H. O., Osibanjo, A. O., & Ojo, I. S. (2014). Effectiveness of training and
development on employees' performance and organisation competitiveness in the
nigerian banking industry. Bulletin of the Transilvania University of Braşov, 7(1),
161.
Farooq, A., & Hussain, Z. (2011). Balanced scorecard perspective on change and
performance: A study of selected Indian companies. Procedia-Social and
Behavioral Sciences, 24, 754-768.
Freeman, R. (1978). Job satisfaction as an economic variable. American Economic Review,
68, 135–41.
Gabriel, A. S., Diefendorff, J. M., Chandler, M. M., Moran, C. M., & Greguras, G. J.
(2014). The dynamic relationships of work affect and job satisfaction with
perceptions of fit. Personnel Psychology, 67(2), 389-420.
Gazioglu, S., & Tansel, A. (2006). Job satisfaction in Britain: Individual and job related
factors. Applied economics, 38(10), 1163-1171.
Giannouli, V. (2017). Emotional aspects of leadership in the modern workplace. In
B.Christiansen & H. Chandran (Eds.), Handbook of Research on Human Factors
in Contemporary Workforce Development. Hershey, PA: IGI Global.

50
Guan, Y., Wen, Y., Chen, S. X., Liu, H., & Dong, Z. (2014). When do salary and job level
predict career satisfaction and turnover intention among Chinese managers? The
role of perceived organizational career management and career anchor. European
Journal of Work and Organizational Psychology, 23(4), 596-607.
Gupta, S. (2014). Impact of Welfare Facilities on Satisfaction and Productivity of Workers:
A Study of Indian PSU. Research and Sustainable Business, 313-318.
Habib, M. A., & Jalloh, A. A. (2016). Internal control in tertiary institutions: Ensuring a
continuous improvement in the educational system in Nigeria. International
Journal of Information, Business and Management, 8(1), 223-241.
Hackman, J. R., & Oldham, G. R. (1980). Work redesign. Reading, MA: Addison-Wesley
Publishing Company.
Herzberg, F., Mausner, B., & Snyderman, B. (1959). The Motivation to Work. New York:
Wiley.
Huseman, R. C., Hatfield, J. D., & Miles, E. W. (1987). A new perspective on equity
theory: The equity sensitivity construct. Academy of management Review, 12(2),
222-234.
Imam, S. (1988). A study of factors relating to job satisfaction among university teachers
in the Punjab,. Unpublished doctoral dissertation. Pakistan: University of Punjab.
Jain, R., & Kaur, S. (2014). Impact of work environment on job satisfaction. International
Journal of Scientific and Research Publications, 4(1), 547-554.
Judge, T. A., Weiss, H. M., Kammeyer-Mueller, J. D., & Hulin, C. L. (2017). Job attitudes,
job satisfaction, and job affect: A century of continuity and of change. Journal of
Applied Psychology, 102(3), 356.
Kaba, A. (2012). Occupational stress and job satisfaction: A case study of expartriate
lectures of IIUM. International Journal of Arts & Sciences, 5(5), 273-303.

51
Keitany, B. J. (2014). Perceived relationship between Employee Welfare Programs and
Employee Performance at Kenya Pipeline Company. Unpublished Masters of
Business Administration Thesis. Nairobi University Press.
Kemboi, A., Thomas, T. K., & Keter, C. J. (2013). Staff welfare as an antecedent to service
delivery among civil servants in Kenya: A case study of Nandi county. European
Journal of Business and Management, 5(22), 146-153.
Kenya Railways. (2019). Vision, Mission And Mandate. Retrieved from
http://krc.co.ke/?page_id=218
Kiruja, E. K., & Mukuru, E. (2018). Effect of motivation on employee performance in
public middle level Technical Training Institutions in Kenya. International Journal
of Advances in Management and Economics (IJAME).
Kumar, S. J., & Mini, J. (2013). A Study of Employees’ Job Satisfaction and its Impact on
their Performance. Journal of Indian Research, 1(4), 105-111.
Kumudha A., & Abraham, S. (2008). Organisation career management and its impact on
career satisfaction: A study in the banking sector. ICFAI University Journal of Bank
Management, 7(3), 71–84.
Lease, S. (1998). Annual review, 1993-1997: Work attitudes and outcomes. Journal of
Vocational Behaviour, 53(2), 154-183.
Lee, X., Yang, B., & Li, W. (2017). (2017). The influence factors of job satisfaction and
its relationship with turnover intention: Taking early-career employees as an
example. Anales de Psicología/Annals of Psychology, 33(3), 697-707.
Lepold, A., Tanzer, N., Bregenzer, A., & Jiménez, P. (2018). The efficient measurement
of job satisfaction: Facet-items versus facet scales. International journal of
environmental research and public health, 15(7), 1362.
Locke, E. A. (1976). The nature and causes of job satisfaction. Handbook of industrial and
organizational psychology. Chicago: Rand McNally.

52
Mangkunegara, A. P. (2016). The Effect of Transformational Leadership and Job
Satisfaction on Employee Performance. Universal Journal of Management, 4(4),
189-195.
Mathieu, C., & Babiak, P. (2016). Corporate psychopathy and abusive supervision: Their
influence on employees' job satisfaction and turnover intentions. Personality and
Individual Differences, 91, 102-106.
Mathieu, C., Neumann, C. S., Hare, R. D., & Babiak, P. (2014). A dark side of leadership:
Corporate psychopathy and its influence on employee well-being and job
satisfaction. Personality and Individual Differences, 59, 83-88.
Ministry of Transport. (2019). State Department of Transport. Retrieved from
http://www.transport.go.ke/department/index.php?option=com_content&view=art
icle&id=395&Itemid=538
Mohammad, M. A., & Hossein, Y. M. (2006). A study of relationship between managers'
leadership style and employees' job satisfaction. Leadership in Health Services,
19(2), 11-28.
Mokaya, S. O., Musau, J. L., Wagoki, J., & Karanja, K. (2013). Effects of Working
Conditions on Employee Satisfaction in Hotel Industry in Kenya. International
journal of Arts and Commerce, 2(2), 79-80.
Mosadeghrad, A. (2003). Principles of Health Care Administration. Tehran: Dibagran
Tehran.
Mugenda, O. M., & Mugenda, A. G. (2003). Research Methods: Qualitative and
quantitative approaches. Nairobi: Africa Center for Technology Studies (ACTS)
Press.
Muguongo, M. M., Muguna, A. T., & Muriithi, D. K. (2015). Effects of compensation on
job satisfaction among secondary school teachers in Maara Sub-County of Tharaka
Nithi County, Kenya. Journal of Human Resource Management, 3(6), 47-59.

53
Murambi, D. N., & Bwisa, H. M. (2014). Service quality and customer satisfaction in
public transport sector of Kenya: A survey of shuttle travellers in Kitale Terminus.
International Journal of Academic Research in Business and Social Sciences, 4(9),
402.
Neog, B. B., & Barua, M. (2014). Factors influencing employee’s job satisfaction: An
empirical study among employees of automobile service workshops in Assam. The
SIJ Transactions on Industrial, Financial & Business Management (IFBM), 2(7),
305-316.
Ngari, J. M., & Mukururi, J. N. (2014). Influence of work Life balance policies on
employee job satisfaction in Kenya’s banking sector; A case of commercial banks
in Nairobi central business district. IOSR Journal Of Humanities And Social
Science (IOSR-JHSS),19(3), 102-112.
Onukwube, H. N. (2012). Correlates of job satisfaction amongst quantity surveyors in
consulting. Australasian Journal of Construction Economics and Building, 12 (2),
43-54.
O'Reilly, C. A. (1991). Organizational behavior: Where we've been, where we're going.
Annual review of psychology, 42(1), 427-458.
Osabiya, B. J. (2015). The effect of employees motivation on organizational performance.
Journal of public administration and policy research, 7(4), 62-75.
Oxford Business Group. (2016). Atanas Maina, Managing Director, Kenya Railways:
Interview. Retrieved from https://oxfordbusinessgroup.com/interview/getting-
onboard-obg-talks-atanas-maina-managing-director-kenya-railways
Pirie, G. (2014). Transport pressures in urban Africa: Practices, policies, perspectives.
Africa's Urban revolution, 133-147.
Raabe, B., & Beehr, T. (2003). Formal mentoring versus supervisor and coworker
relationships differences in perceptions and impact. Journal of Organizational
Behaviour, 24.

54
Raziq, A., & Maulabakhsh, R. (2015). Impact of Working Environment on Job
Satisfaction. Procedia Economics and Finance, 23, 717–725.
RBA. (2019). Types of Schemes. Retrieved from RBA: http://www.rba.go.ke/types-of-
schemes/
Robbins, S. P. (2003). Organizational behavior. Upper Saddle River: Prentice-Hall.
Roethlisberger, F., & Dickson, W. (1939). Management and the Worker. Cambridge, MA:
Harvard University Press.
Rubel, M. B., & Kee, D. H. (2014). Quality of work life and employee performance:
Antecedent and outcome of job satisfaction in Partial Least Square (PLS). World
Applied Sciences Journal, 31(4), 456-467.
Saari, L. M., & Judge, T. A. (2004). Employee attitudes and job satisfaction. Human
Resource Management. Published in Cooperation with the School of Business
Administration, The University of Michigan and in alliance with the Society of
Human Resources Management, 43(4), 395-407.
Salisu, J. B., Chinyio, E., & Suresh, S. (2015). The impact of compensation on the job
satisfaction of public sector construction workers of jigawa state of Nigeria. The
Business & Management Review, 6(4), 282.
Sanyal, J., & Sikidar, S. (2018). An Appraisal of Employees Welfare and Social Security
Measures in Central Public Sector Enterprises. International Journal of Research -
Granthaalayah, 6(7), 234-247.
Sembe, F., & Ayuo, A. (2017). Effect of selected occupational health and safety
management practices on job satisfaction of employees in university campuses in
Nakuru Town, Kenya. Journal of Human Resource Management, 5(5), 70-77.
SHRM. (2019). General: What is an employee assistance program (EAP)? Retrieved from
SHRM: https://www.shrm.org/resourcesandtools/tools-and-samples/hr-
qa/pages/whatisaneap.aspx
55
Sindhu, S. (2012). Role of organization in welfare measures for employees. International
Journal of Research in IT & Management, 2(9), 36-40.
Souza, C. A. (2009). Labour welfare and job satisfaction: A comparative study of Indian
pharmaceutical. Retrieved from Department of Economics, Goa:
https://shodhganga.inflibnet.ac.in/handle/10603/12615?mode=full
Starmer, A. J., Frintner, M. P., & Freed, G. L. (2016). Work–life balance, burnout, and
satisfaction of early career pediatricians. Pediatrics, 137(4), e20153183.
Tasios, T., & Giannouli, V. (2017). Job descriptive index (JDI): Reliability and validity
study in Greece. Archives of Assessment Psychology, 7(1), 31-61.
Tiwari, U. (2014). A study on employee welfare facilities and its impact on employees’
efficiency at VindhaTelelinks ltd. Rewa India. Abhinav International Monthly
Refereed Journal of Research in Management & Technology, 3(11), 1-7.
Todd, A. J. (1933). Industry and Society - A Sociological Appraisal of Modern
Industrialisation. New York: H. Holt & Company.
Upadhyay, D., & Gupta, A. (2012). Morale, welfare measure, job satisfaction : The key
mantras for gaining competitive edge. International Jour. of Physical and Social
Sciences, 2(7), 80-94.
Venugopal, P., Bhaskar, T., & Usha, P. (2011). Employee welfare activities with respective
measures in industrial sector-A study on industrial cluster at Chittor district.
International Journal of Research in Commerce, IT and Management,1(6), 78-84.
Walliman, N. (2017). Research methods: The basics. London & New York: Routledge.

i
APPENDICES
Appendix I: Introduction Letter

ii
Appendix II: Questionnaire
Introduction
Please fill out, with honesty, all the required information in the spaces provided or
mark only one correct answer using (√) or (x).
1. Background Data
1.1. Select your gender.
Female [ ] Male [ ]
1.2. Select the region where your workstation is located.
Coastal [ ] Eastern [ ] Western [ ] Headquarters (HQ) [ ]
1.3. State your highest level of education.
Master’s Degree [ ] Post-graduate Diploma [ ]
Bachelor’s Degree [ ] Diploma [ ]
Technical [ ] Others [ ]
1.4. Which cadre best describes your job level?
Management (Grade M3 – S2) [ ]
Non-management (Grade S3 – S4) [ ]
2. Employee welfare programs
2.1 As an employee of Kenya Railways, kindly indicate the extent to which you
agree with below statements regarding how Kenya Railways has offered the
listed employee welfare programs to you. Mark the correct box using (√) or (x).
Employee welfare programs
Very G
rea
t E
xte
nt
Great
Ex
ten
t
Un
decid
ed
Very L
ittl
e E
xte
nt
Not
at
All
Allowances payment programs
I am paid subsistence allowance as per policy.
I am paid relocation allowance as per policy.
I am paid all the allowances as per the corporation’s pay structure.
I am paid the correct allowances for my cadre as per policy.

iii
Employee welfare programs (cont….)
Very
Grea
t E
xte
nt
Great
Ex
ten
t
Un
decid
ed
Very
Lit
tle E
xte
nt
No
t a
t A
ll
Employee assistance programs
I am entitled to support for professional development.
I usually receive counselling services on work-life balance.
I am entitled to financial assistance from the corporation.
I am entitled to negotiated bank loan facilities for my needs.
Employee health programs
I have a medical insurance cover secured for me and family.
The employer has an insurance cover for work injuries.
The corporation organizes wellness programs for all staff.
The company supports sports activities for personal fitness.
Retirement programs
I am a member of the employer's pension scheme.
I am entitled to gratuity upon retirement or end of my contract.
I am entitled to financial programs that prepare me for
retirement.
I am employed on terms that allow time for retirement planning.
Flexible work programs
I can cover a week's job in fewer days and rest for the remaining
days in the week.
I can report to work early and leave early to attend to personal
needs.
I can work away from the office on an approved schedule.
I am entitled to adequate leave to prepare and sit for
examinations.
2.2 List other employee welfare programs available at Kenya Railways.
.……………………..………………………………………………………
2.3 How do you rate the availability of employee welfare programs at Kenya
Railways?
Excellent [ ] Above Average [ ] Average [ ]
Below Average [ ] Very Poor [ ]

iv
3. Employee job satisfaction
3.1. As an employee of Kenya Railways, to what degree are you in agreement with
the following statements regarding the listed measures of employee job
satisfaction at Kenya Railways? Mark the correct box using (√) or (x).
Employee job satisfaction
Str
on
gly
Ag
ree
Ag
ree
Un
decid
ed
Dis
ag
ree
Str
on
gly
Dis
ag
ree
Pay
I am satisfied with my pay structure.
I am always paid my salary in good time.
I always receive annual cost of living salary adjustment.
The pay I get reflects my knowledge, skills, and years of service.
Supervision
My supervisor is friendly and approachable.
My supervisor is supportive of my work.
I openly discuss problems with my supervisor.
My supervisor shares relevant information from top management.
Promotion
There are chances for promotion within the corporation.
There is equity and openness in promotions.
Employees are given priority in filling vacant positions.
There is a clear organizational structure and career paths for all.
Working conditions
The management tries to understand and address my needs.
I am provided with the right tools and equipment for my duties.
My work area is easily accessible and has emergency exits.
I am provided with clean drinking water and office tea.
3.2. How do you rate employee job satisfaction at Kenya Railways?
Very satisfied [ ] Satisfied [ ] Undecided [ ]
Dissatisfied [ ] Very dissatisfied [ ]
Thank you