the influence of maximum indicated slope and · pdf filethe quality of conveyor idler roll...
TRANSCRIPT
B16-02 page 1
THE INFLUENCE OF ‛MAXIMUM INDICATED SLOPE’ AND ‘TOTAL INDICATED RUN-OUT' ON THE NOISE CAUSED BY THE INTERACTION
OF CONVEYOR IDLER ROLLS AND CONVEYOR BELTS
Paul Munzenberger1 and Craig Wheeler
2
1TUNRA Bulk Solids Research Associates
2The University of Newcastle, Australia
ABSTRACT
This paper aims to assess the noise level produced by the interaction of a conveyor belt and a set of specially machined conveyor idler rolls and then compare it to the standard conveyor idler roll measurements ‘maximum indicated slope’ (MIS), and ’total indicated run-out’ (TIR). The findings indicated that a conveyor idler roll’s MIS is the primary influence of the noise produced by the conveyor idler roll and conveyor belt contact.
1. INTRODUCTION
The noise produced by conveyors is becoming an increasingly important consideration to their designers and operators, especially when the conveyor or conveyor system is located in a populated area, as is the case with many ship loading terminals. When designing and operating a conveyor it is important to know in advance what the likely noise performance of its components will be so that the design specifications set for the system are not too low – leading to the purchase of unacceptable components, or too high – leading to components that are overly expensive.
One of the key noise producers of a conveyor system is its conveyor idler rolls. The noise produced by conveyor idler rolls can fall into two distinct categories. The first – commonly known as ’self-noise’ – is the noise produced by the conveyor idler roll’s bearings and seals, and has been shown to be an insignificant contributor to conveyor noise production [1]. The second noise category includes the sounds generated by the conveyor idler roll’s interaction with the rubber conveyor belt that rolls upon it. It is the second noise category that is the subject of this paper.
The noise produced by the conveyor idler roll’s interaction with the conveyor belt is caused either by defects in the conveyor belt’s surface or defects on the surface of the conveyor idler roll’s shell. Previous testing at The University of Newcastle has shown that of these two noise causes, noises caused by conveyor idler roll shell defects are usually the greater contributor to the overall noise production. The two main measurements used by industry to determine the quality of conveyor idler roll shells are ’total indicated run-out’ (TIR) and ‘maximum indicated slope’ (MIS), but it is not known if there is a correlation between these two measurements and the noise produced by the conveyor belt and conveyor idler roll interaction. Throughout this paper the terms ‘total indicated run-out’ and ‘maximum indicated slope’ will be used frequently, and will be referred to as TIR and MIS respectively.
To determine the extent of noise produced by conveyor idler roll shell defects, two sets of purposely machined conveyor idler rolls were used. The first group of conveyor idler rolls were machined with progressively more eccentric shells which provide a group of conveyor idler rolls with a large TIR, but a small MIS. For this report, these conveyor idler rolls are known as ’TIR’ conveyor idler rolls. The second group of conveyor idler rolls were machined true but have a progressively deepening flat machined on their surface which provides a set of conveyor idler rolls that have a large MIS, but a small TIR. For this report, these conveyor idler rolls will be known as ’MIS’ conveyor idler rolls. These two groups of conveyor idler rolls are used to determine if there is a correlation between TIR or MIS and noise output.
It is hoped that this research will aid conveyor system designers with defining appropriate specifications for conveyor idler rolls so that they will be suitable for the environment in which they are to operate and are better able to meet budgetary constraints.
B16-02 page 2
2. MEASUREMENTS
2.1 TIR and MIS
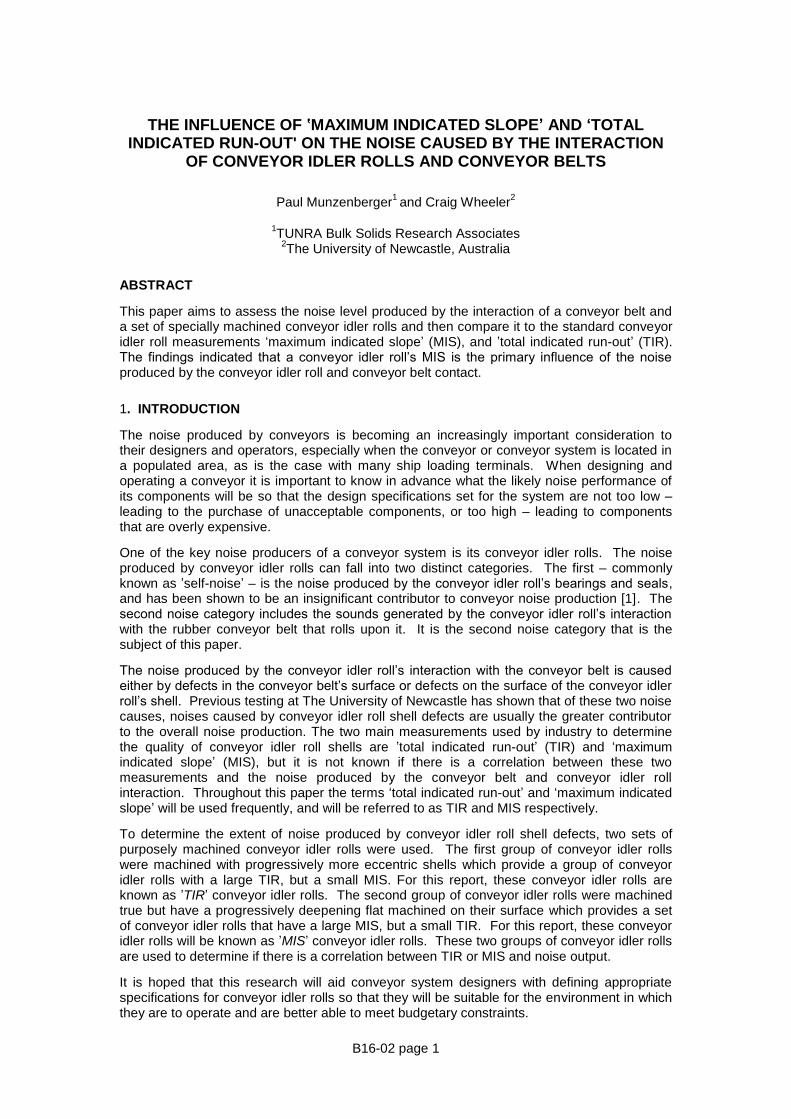
TIR is effectively the difference between the largest and smallest radii measured on a single annular path on the surface of a cylindrical object like a conveyor idler roll. The TIR of a conveyor idler roll is measured by rotating its shell while its shaft is held stationary, and reading measurements from a dial indicator or some type of displacement transducer that is resting on the revolving shell; Figure 1 shows a typical setup. Measurements are taken from near each end and from the centre of each conveyor idler roll that is tested. Since conveyor idler rolls are generally round, the largest and smallest radii are usually opposite each other, however, some surface defects can influence their relative position. It should be noted that the eccentricity of a conveyor idler roll is not the same as the TIR. In general, the TIR of a given conveyor idler will be approximately double its eccentricity.
Figure 1. MIS and TIR measurements with a linear transducer
The MIS measurement was first proposed by Brown [1]. MIS is measured in the same manner as the TIR, with the same equipment, and the two are measured together. But unlike TIR – which is the difference between the largest and smallest radii around a conveyor idler roll – the MIS is the change in radius for every six degrees around the conveyor idler roll circumference for a total of 60 separate measurements from which the largest is chosen and reported as the MIS for that section of conveyor idler roll (hence the word ’maximum’ in MIS). Since the MIS measurements require a large amount of data, they are always done with a displacement transducer or laser sensor that measures the conveyor idler roll while it is being rotated at a constant velocity, and a data acquisition system.
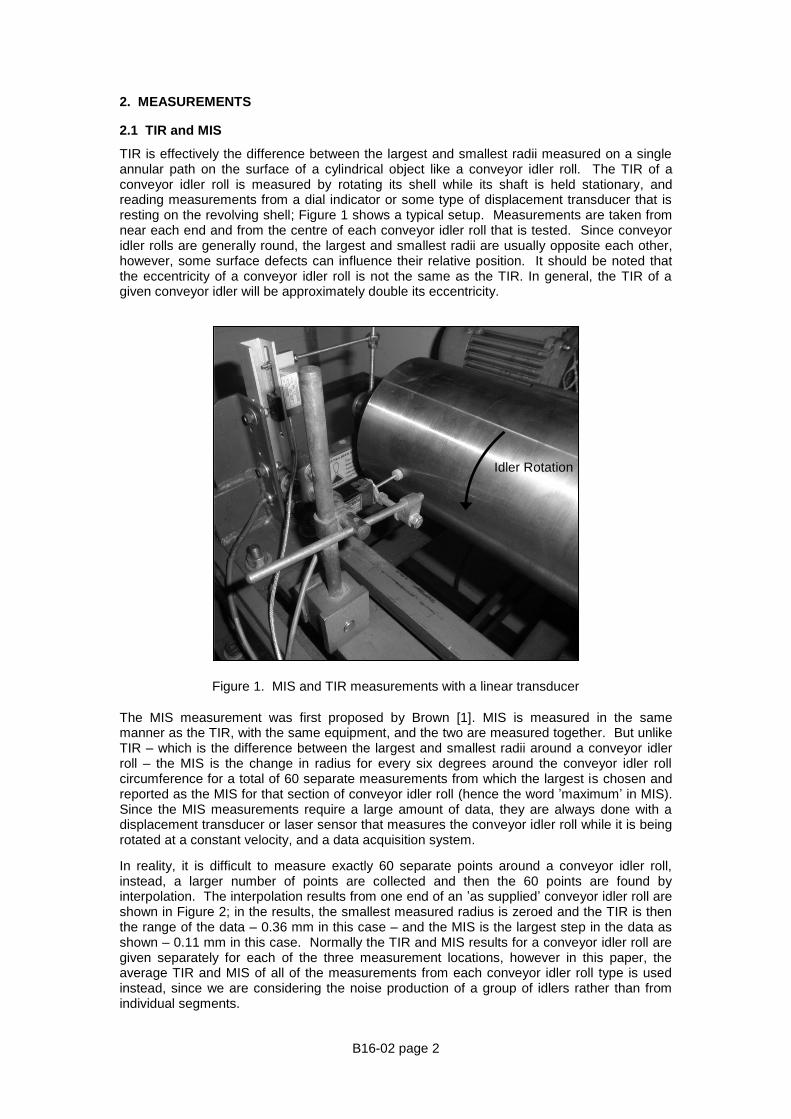
In reality, it is difficult to measure exactly 60 separate points around a conveyor idler roll, instead, a larger number of points are collected and then the 60 points are found by interpolation. The interpolation results from one end of an ’as supplied’ conveyor idler roll are shown in Figure 2; in the results, the smallest measured radius is zeroed and the TIR is then the range of the data – 0.36 mm in this case – and the MIS is the largest step in the data as shown – 0.11 mm in this case. Normally the TIR and MIS results for a conveyor idler roll are given separately for each of the three measurement locations, however in this paper, the average TIR and MIS of all of the measurements from each conveyor idler roll type is used instead, since we are considering the noise production of a group of idlers rather than from individual segments.
Idler Rotation
B16-02 page 3
Figure 2. TIR and MIS data from an ‘as supplied’ conveyor idler roll
2.2 Noise
Sound or noise levels can be measured in three ways: sound pressure, sound intensity, and sound power. The instrument used to gather the sound data shown in this report measures sound pressure. However, even though sound pressure is being measured, the results are not given in linear pascals since the ear responds approximately logarithmically to energy input, which is proportional to the square of the sound pressure [2]. This means that when the sound pressure is say, doubled, the listener will not think that they are hearing double the sound but will hear a much smaller increase. In order to convert the linear pressure measurements to something that matches what people experience, Equation 1 is used and the results are reported as decibels rather than pascals.
(
)
(1)
In the equation is the reported sound level in decibels, is the measured pressure in
pascals, and is the reference pressure which has a value of 20 µPa. The reference
pressure is the lowest pressure that the average undamaged human ear is able to detect [2]. Finding the logarithm of a pressure ratio means that the quietest sound that can be heard by the average person gives a value of 0 decibels; however, quieter sounds can be measured. The square of the pressure ratio and the log of the square of the pressure ratio are the result of the quote from the last paragraph. Multiplying everything by ten spreads the data over a more readable range and also gives rise to the deci in decibels. It is worth noting that when
for the difference in sound pressures of and is investigated, it will be found that
dB, thus the sound pressure doubles every dB. All the graphs in this
paper that depict decibels will have a y-axis divided into multiples of six to approximate the doubling of the sound level.
Sound measurements are rarely reported without some type of filtering. The aim of the filtering is to apply more weighting to frequency levels that humans are more sensitive to, while suppressing other frequencies to which humans have less sensitivity. In Australia most sound level monitoring is done using the A-weighting noise filter and sound is reported in dBA. The A-weighting curve for the various frequency bands is given in Figure 3. The filtering is done by the sound level meter in real time while the sound levels are being measured.
0
0.05
0.1
0.15
0.2
0.25
0.3
0.35
0.4
0 60 120 180 240 300 360
Δ R
adiu
s (m
m)
Angle (°)
MIS
TIR

B16-02 page 4
Figure 3. Various standard frequency weightings that can be applied to sound measurements [2]
Post processing of the results primarily involves determining the Leq for sound level data obtained for each test. The Leq is the equivalent continuous sound pressure level [2] or steady sound that is equivalent to an extended period of time-varying sound level measurements on a time averaged basis. All of the sound level results presented here are Leq values determined from sound level measurements of between 30 and 50 seconds duration.
Finally, while measuring the noise level of the test conveyor idler rolls, the background noise - which includes the ambient noise and the noise of the conveyor itself - was also measured. Since the noise of the conveyor and the conveyor idler rolls are incoherent noise, the background noise can be subtracted from the conveyor idler roll noise with Equation 2.
( ⁄ ⁄ ) (2)
Where is the noise of the conveyor idlers by themselves, and and are the combined
noise and the background noise respectively. This equation subtracts incoherent sounds on a linear energy (pressure squared) basis [2] and cannot be used if the difference between the total noise and the background noise is less than 3 dB.
3. TEST INSTRUMENTS
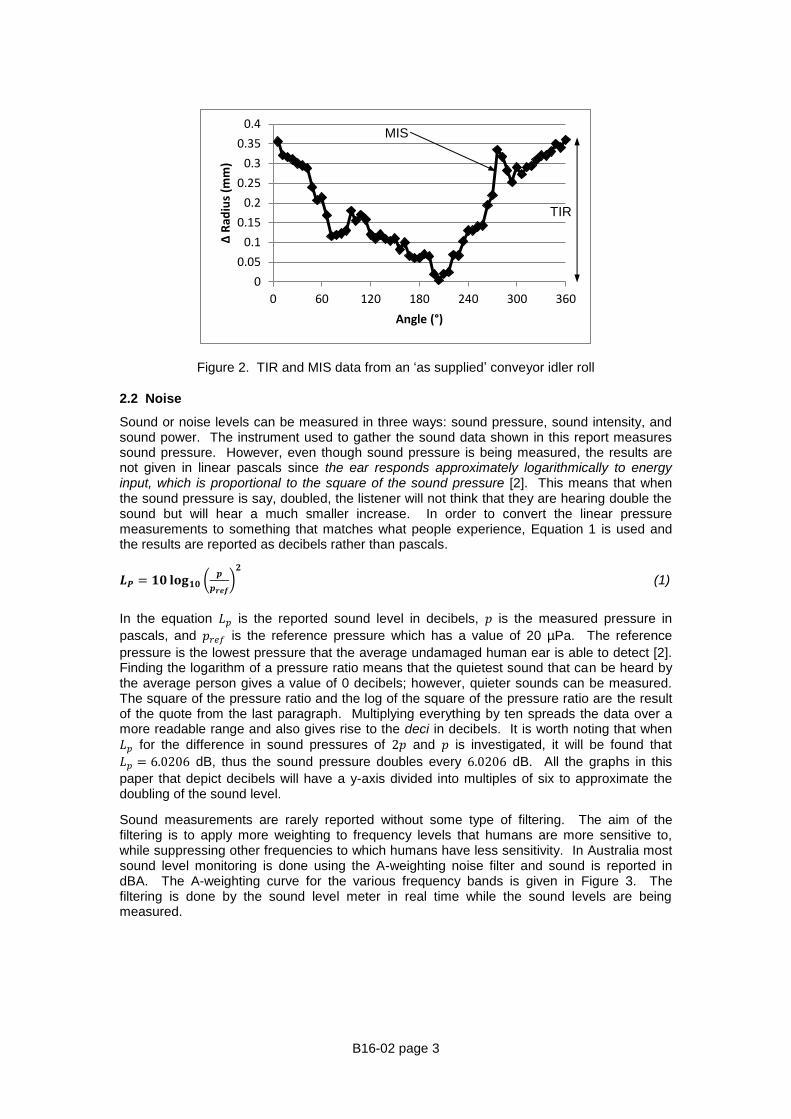
The two principle instruments that were used during the testing were the sound level meter shown in Figure 4 and the weather meter shown in Figure 6. Details of each instrument can be found in Error! Reference source not found. and Error! Reference source not found..

B16-02 page 5
Figure 4. Sound level meter
Figure 5. 94 dB reference for the sound level meter
Instrument Type Sound Level Meter (SLM)
Make 01dB
Model SLS95S
Serial Number 30520
Class 2
Table 1. Sound level meter data
B16-02 page 6
Figure 6. Weather meter
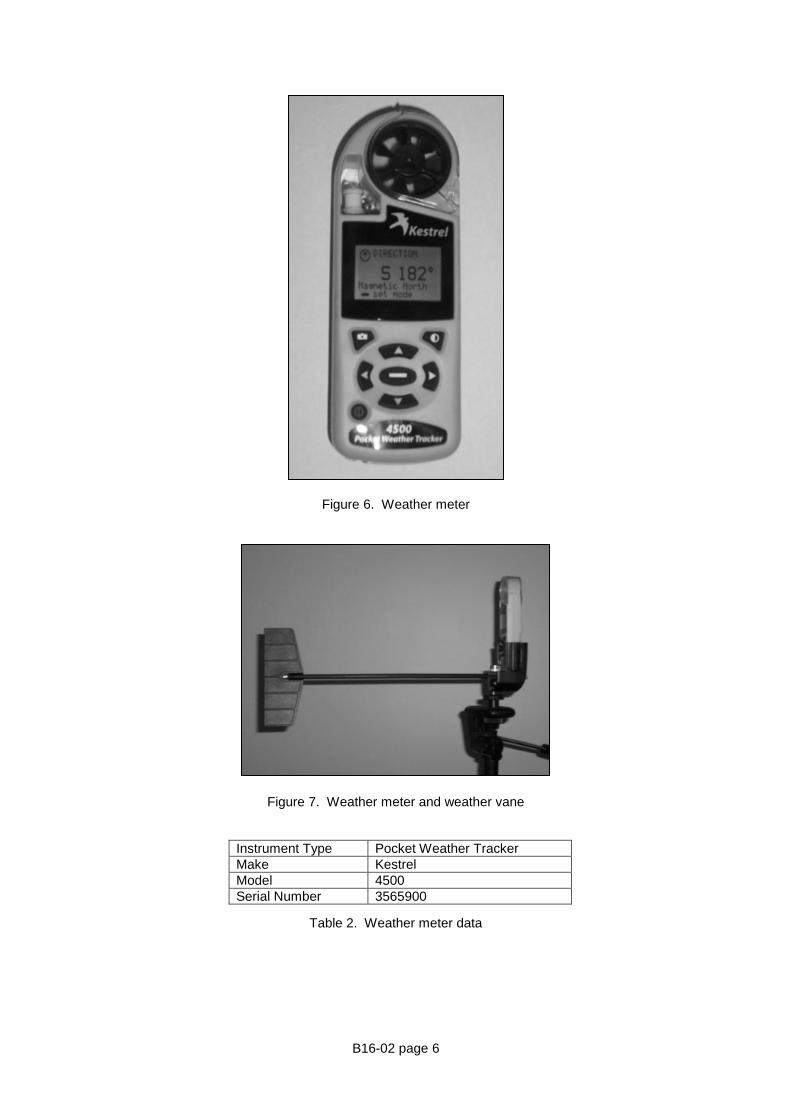
Figure 7. Weather meter and weather vane
Instrument Type Pocket Weather Tracker
Make Kestrel
Model 4500
Serial Number 3565900
Table 2. Weather meter data

B16-02 page 7
4. CONVEYOR IDLER ROLL NOISE TEST RIG
The test rig used for the sound pressure level testing is shown in
Figure 8 and Figure 9. It was designed to be mounted on the flat return side of a conveyor with a 600 mm wide conveyor belt. It consists of five equally spaced mounting points for the test conveyor idler rolls, with three mounts located above the belt, and the remainder on a separate frame below the belt (Figure 9). The distance between the upper and lower conveyor idler rolls can be varied to alter the wrap angle (the contact angle between the belt and the conveyor idler roll). The zigzag path is designed to apply a load to the test idler rolls without the use of bulk material. The test rig is also mounted on its own heavy mounting structure which does not contact the test conveyor structure. The only modification made to the host conveyor was the removal of the trough and return conveyor idler rolls and their frames in the vicinity of the test rig in order to reduce the background noise.
Figure 8. Conveyor idler roll noise test rig
The belt used on the conveyor is a 2-ply polyester nylon (PN) fabric reinforced belt that has a nominal thickness of 6 mm. The use of such a light belt for this type of noise testing is thought to be advantageous since its light weight enables it to be accelerated quickly by conveyor idler roll defects – thereby increasing the noise output; and the light weight belt is freer to vibrate – enabling it to transmit more noise with less damping.
Figure 9. Zigzag path of conveyor belt through test rig

B16-02 page 8
5. TEST CONVEYOR IDLER ROLLS
All the testing was conducted with a set of 20 plain conveyor idler rolls specifically purchased for the testing. The conveyor idler rolls featured standard steel shells with a nominal overall diameter of 152 mm, a shell length of 650 mm, and were of the Garland type.
Initially five idlers were randomly selected to test in the ’as supplied’ condition; after testing, these were then turned in the lathe along with the other 15 idlers in four groups of five idlers with each group of idlers given a different offset. The turning operation is shown in Figure 10. The turning was done between centres with special adaptors to provide the desired offset. During the turning operation the shell is fixed to the shaft by the piece of angle (welded to the shell) and threaded rod on the left hand end so that there cannot be any relative motion between the two. The turning operation produced four sets of conveyor idler rolls with a varying TIR and a small MIS. These conveyor idler rolls are known as TIR conveyor idler rolls. All of the conveyor idler rolls have finished shell diameters of between 150 and 150.5 mm.
Figure 10. Turning a conveyor idler roll between centres
Once the four sets of offset conveyor idler rolls were tested, the set of five conveyor idler rolls labelled as concentric were returned to the workshop to have a small flat machined on each one as shown in Figure 11. The modified set of conveyor idler rolls were tested again then returned to the workshop to have their flats made larger. In all, three flat depths were tested on these conveyor idler rolls. Additionally, the set of five conveyor idler rolls labelled as 0.50 mm TIR were also tested again after they had had a 0.05 mm deep flat machined on their shells. The milling operation produced four sets of conveyor idler rolls with a varying MIS and a small TIR. These conveyor idler rolls are known as MIS conveyor idler rolls.
Figure 11. Milling a flat on a conveyor idler roll
The desired TIR and flat depths for the conveyor idler rolls are shown in Table 3. How the dimensions are measured is shown in Figure 12. Note that the dimension ’A’ is not the TIR

B16-02 page 9
measurement, and should be doubled to be equivalent to the TIR. Alongside the desired dimensions for the offsets and flats in Table 3 are the actual average measured dimensions. Unfortunately there is some difference between the desired and actual measurements but this did not affect the final results.
Figure 12. Diagrams showing A - shell offset, and B - flat depth
TIR Conveyor Idler Rolls MIS Conveyor Idler Rolls
Desired TIR - 2A (mm)
Actual TIR - 2A (mm)
Desired Flat Depth B (mm)
Actual Flat Depth B (mm)
0.00 0.24 0.05 0.088
0.50 0.51 0.10 0.152
0.75 0.80 0.15 0.220
1.00 1.00 0.20 0.288
Table 3. Actual offset and flat measurements
6. TEST AREA
A diagram of the area in which the sound testing was conducted is shown in Figure 13. The location of the sound level meter is shown in Figure 14, and the ground conditions during the testing can be seen in
Figure 8. The sound level meter was placed on a tripod as near as possible to the conveyor idler rolls whose noise output was being tested.

B16-02 page 10
Figure 13. Sound testing area
Figure 14. Sound level meter location.
7. TEST PROCEDURE
For each noise level test, five conveyor idler rolls were installed in the test frame and the test frame was adjusted so that the wrap angle was 10°. The weather meter was set up nearby and set to record air temperature, air pressure, humidity, wind speed, and wind direction, and the sound level meter was set up in the position shown and set to record. The sound level meter was set to measure dBA with a ‘fast’ time constant and a sample rate of 32 times per second. The noise level was recorded for each conveyor speed from 0 m/s to 6 m/s then immediately from 6 m/s to 0 m/s in steps of 1 m/s for a period of one minute per step. The weather and sound level data were then downloaded to a computer for analysis.
In all, ten separate noise level tests were conducted. Four sound level tests on four sets of five TIR conveyor idler rolls, four noise level tests on four sets of five MIS conveyor idler rolls, one noise level test on a set of ’as supplied’ conveyor idler rolls, and a noise level test for which the test frame had no conveyor idler rolls in it at all in order to determine the background noise of the conveyor system. The background noise of the conveyor was only tested on two occasions early in the testing as it is known that the noise output of the conveyor system does not change significantly, especially at higher speeds. All testing was conducted at night time when the background noise was at a minimum.
From each group of machined conveyor idler rolls, two were selected to have their TIR and MIS measured. From the group of ’as supplied’ conveyor idler rolls, three were selected. When a group of idlers was re-machined, the same two conveyor idler rolls that were measured before they were modified were used to find the TIR and the MIS of the new set. All reported TIR and MIS measurements are the average of the six or nine measurements taken for each set of conveyor idler rolls.
B16-02 page 11
8. RESULTS
8.1 Raw Noise and Weather Data
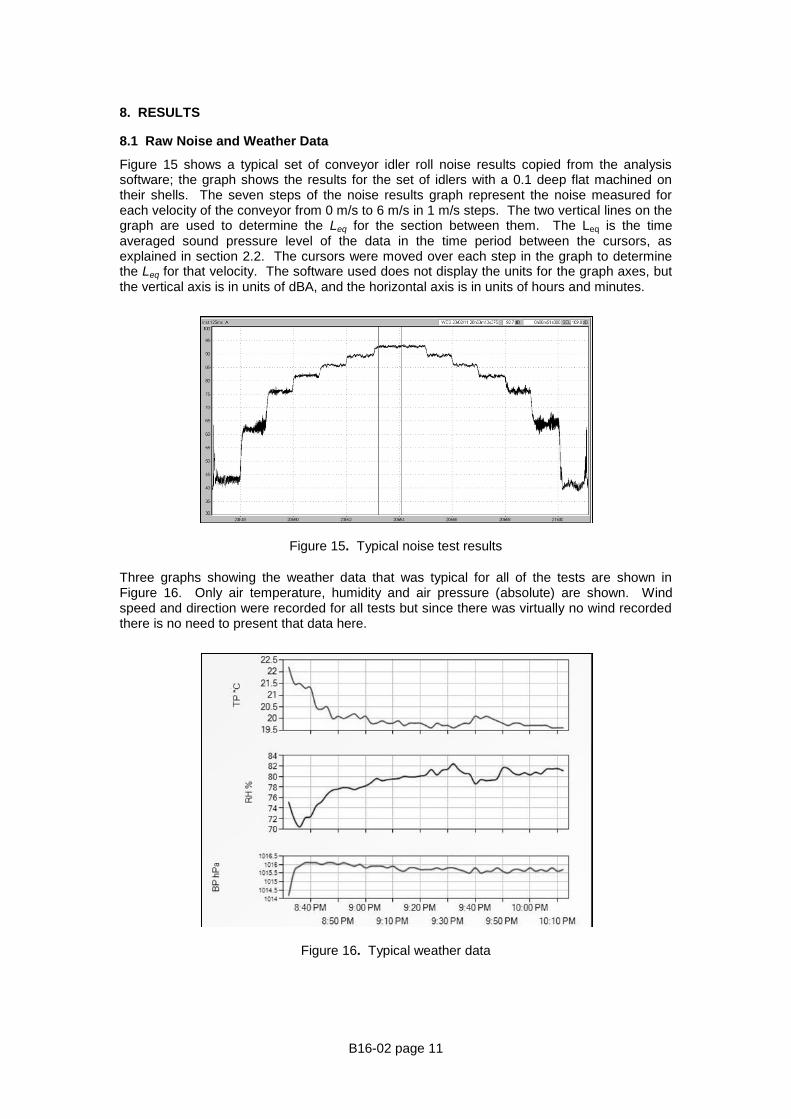
Figure 15 shows a typical set of conveyor idler roll noise results copied from the analysis software; the graph shows the results for the set of idlers with a 0.1 deep flat machined on their shells. The seven steps of the noise results graph represent the noise measured for each velocity of the conveyor from 0 m/s to 6 m/s in 1 m/s steps. The two vertical lines on the graph are used to determine the Leq for the section between them. The Leq is the time averaged sound pressure level of the data in the time period between the cursors, as explained in section 2.2. The cursors were moved over each step in the graph to determine the Leq for that velocity. The software used does not display the units for the graph axes, but the vertical axis is in units of dBA, and the horizontal axis is in units of hours and minutes.
Figure 15. Typical noise test results
Three graphs showing the weather data that was typical for all of the tests are shown in Figure 16. Only air temperature, humidity and air pressure (absolute) are shown. Wind speed and direction were recorded for all tests but since there was virtually no wind recorded there is no need to present that data here.
Figure 16. Typical weather data
B16-02 page 12
8.2 TIR and MIS Data
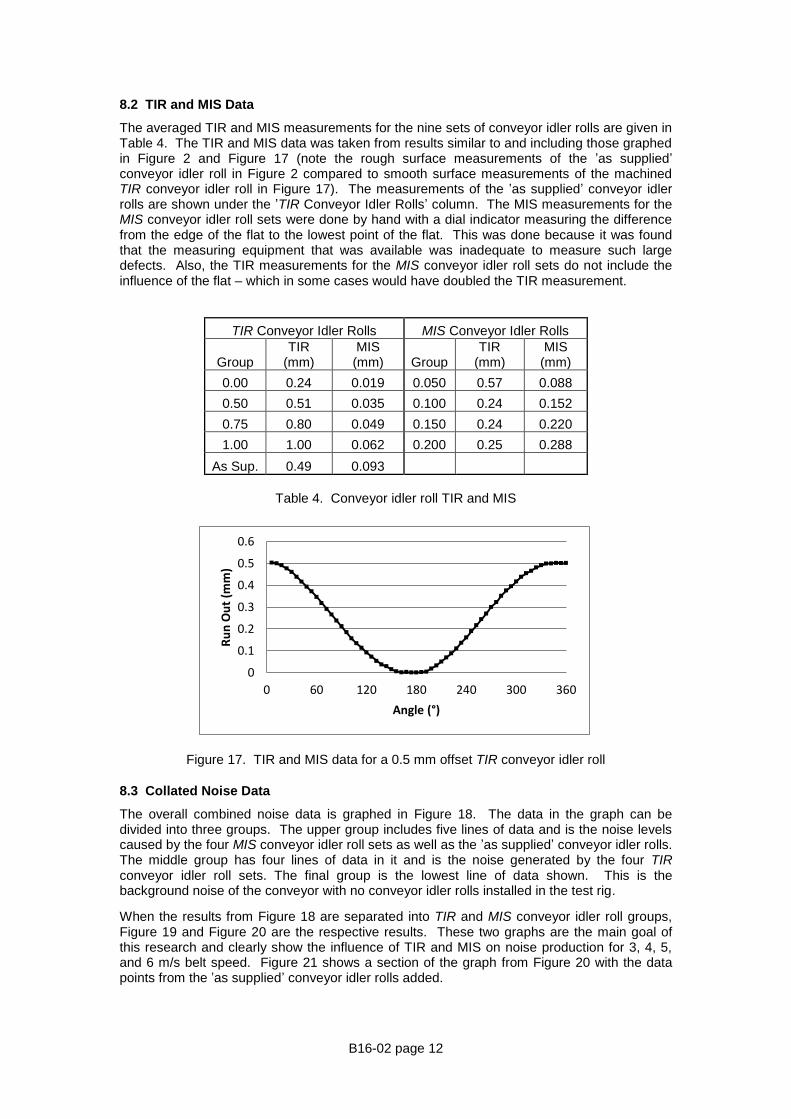
The averaged TIR and MIS measurements for the nine sets of conveyor idler rolls are given in Table 4. The TIR and MIS data was taken from results similar to and including those graphed in Figure 2 and Figure 17 (note the rough surface measurements of the ’as supplied’ conveyor idler roll in Figure 2 compared to smooth surface measurements of the machined TIR conveyor idler roll in Figure 17). The measurements of the ’as supplied’ conveyor idler rolls are shown under the ’TIR Conveyor Idler Rolls’ column. The MIS measurements for the MIS conveyor idler roll sets were done by hand with a dial indicator measuring the difference from the edge of the flat to the lowest point of the flat. This was done because it was found that the measuring equipment that was available was inadequate to measure such large defects. Also, the TIR measurements for the MIS conveyor idler roll sets do not include the influence of the flat – which in some cases would have doubled the TIR measurement.
TIR Conveyor Idler Rolls MIS Conveyor Idler Rolls
Group TIR
(mm) MIS (mm) Group
TIR (mm)
MIS (mm)
0.00 0.24 0.019 0.050 0.57 0.088
0.50 0.51 0.035 0.100 0.24 0.152
0.75 0.80 0.049 0.150 0.24 0.220
1.00 1.00 0.062 0.200 0.25 0.288
As Sup. 0.49 0.093
Table 4. Conveyor idler roll TIR and MIS
Figure 17. TIR and MIS data for a 0.5 mm offset TIR conveyor idler roll
8.3 Collated Noise Data
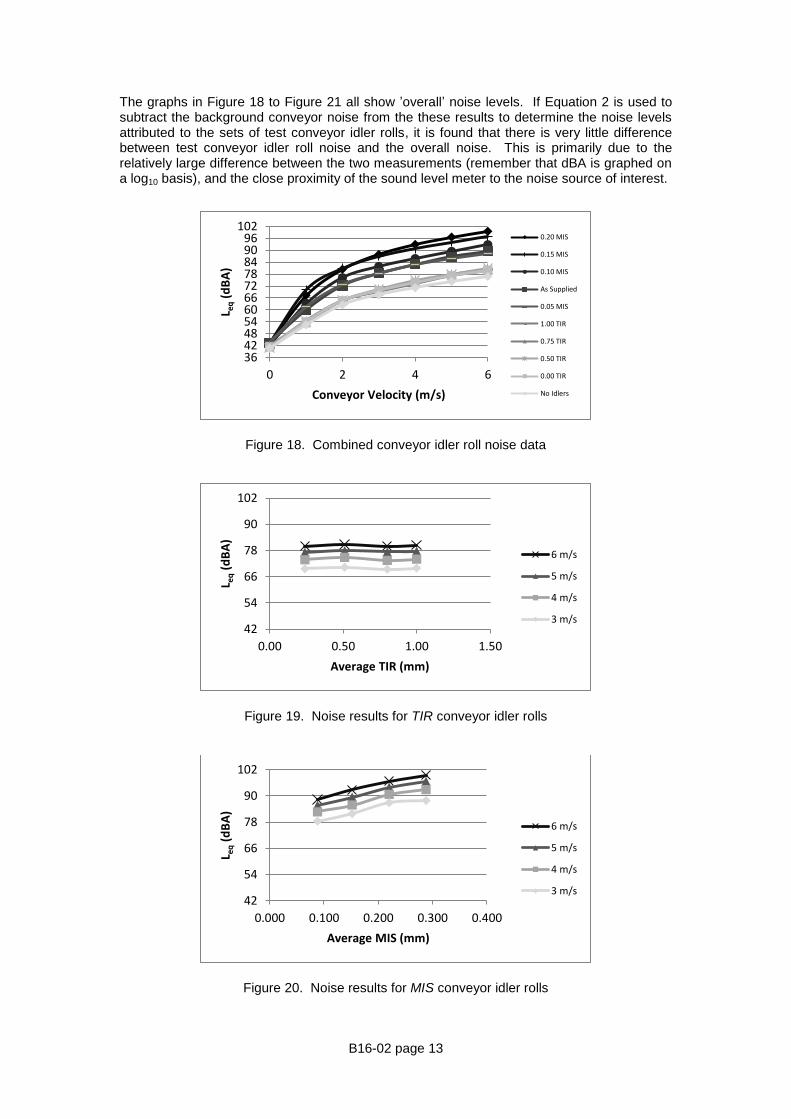
The overall combined noise data is graphed in Figure 18. The data in the graph can be divided into three groups. The upper group includes five lines of data and is the noise levels caused by the four MIS conveyor idler roll sets as well as the ’as supplied’ conveyor idler rolls. The middle group has four lines of data in it and is the noise generated by the four TIR conveyor idler roll sets. The final group is the lowest line of data shown. This is the background noise of the conveyor with no conveyor idler rolls installed in the test rig.
When the results from Figure 18 are separated into TIR and MIS conveyor idler roll groups, Figure 19 and Figure 20 are the respective results. These two graphs are the main goal of this research and clearly show the influence of TIR and MIS on noise production for 3, 4, 5, and 6 m/s belt speed. Figure 21 shows a section of the graph from Figure 20 with the data points from the ’as supplied’ conveyor idler rolls added.
0
0.1
0.2
0.3
0.4
0.5
0.6
0 60 120 180 240 300 360
Ru
n O
ut
(mm
)
Angle (°)
B16-02 page 13
The graphs in Figure 18 to Figure 21 all show ’overall’ noise levels. If Equation 2 is used to subtract the background conveyor noise from the these results to determine the noise levels attributed to the sets of test conveyor idler rolls, it is found that there is very little difference between test conveyor idler roll noise and the overall noise. This is primarily due to the relatively large difference between the two measurements (remember that dBA is graphed on a log10 basis), and the close proximity of the sound level meter to the noise source of interest.
Figure 18. Combined conveyor idler roll noise data
Figure 19. Noise results for TIR conveyor idler rolls
Figure 20. Noise results for MIS conveyor idler rolls
3642485460667278849096
102
0 2 4 6
L eq (
dB
A)
Conveyor Velocity (m/s)
0.20 MIS
0.15 MIS
0.10 MIS
As Supplied
0.05 MIS
1.00 TIR
0.75 TIR
0.50 TIR
0.00 TIR
No Idlers
42
54
66
78
90
102
0.00 0.50 1.00 1.50
L eq (
dB
A)
Average TIR (mm)
6 m/s
5 m/s
4 m/s
3 m/s
42
54
66
78
90
102
0.000 0.100 0.200 0.300 0.400
L eq (
dB
A)
Average MIS (mm)
6 m/s
5 m/s
4 m/s
3 m/s
B16-02 page 14
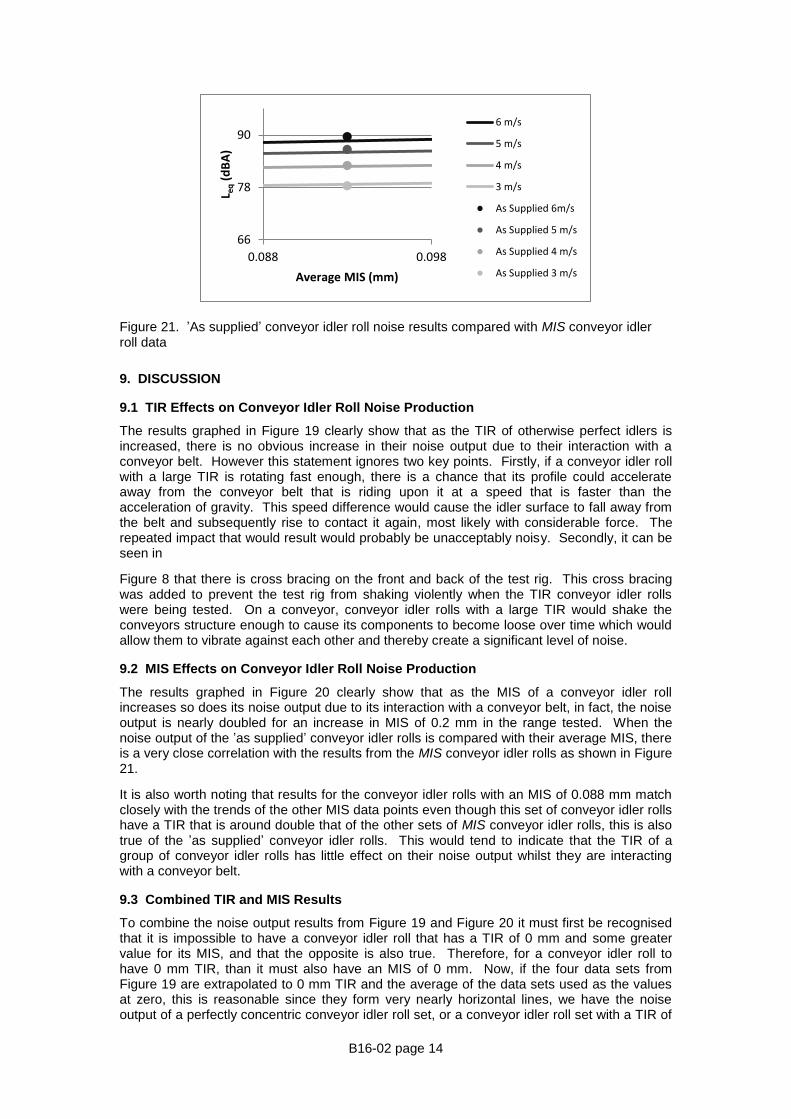
Figure 21. ’As supplied’ conveyor idler roll noise results compared with MIS conveyor idler roll data
9. DISCUSSION
9.1 TIR Effects on Conveyor Idler Roll Noise Production
The results graphed in Figure 19 clearly show that as the TIR of otherwise perfect idlers is increased, there is no obvious increase in their noise output due to their interaction with a conveyor belt. However this statement ignores two key points. Firstly, if a conveyor idler roll with a large TIR is rotating fast enough, there is a chance that its profile could accelerate away from the conveyor belt that is riding upon it at a speed that is faster than the acceleration of gravity. This speed difference would cause the idler surface to fall away from the belt and subsequently rise to contact it again, most likely with considerable force. The repeated impact that would result would probably be unacceptably noisy. Secondly, it can be seen in
Figure 8 that there is cross bracing on the front and back of the test rig. This cross bracing was added to prevent the test rig from shaking violently when the TIR conveyor idler rolls were being tested. On a conveyor, conveyor idler rolls with a large TIR would shake the conveyors structure enough to cause its components to become loose over time which would allow them to vibrate against each other and thereby create a significant level of noise.
9.2 MIS Effects on Conveyor Idler Roll Noise Production
The results graphed in Figure 20 clearly show that as the MIS of a conveyor idler roll increases so does its noise output due to its interaction with a conveyor belt, in fact, the noise output is nearly doubled for an increase in MIS of 0.2 mm in the range tested. When the noise output of the ’as supplied’ conveyor idler rolls is compared with their average MIS, there is a very close correlation with the results from the MIS conveyor idler rolls as shown in Figure 21.
It is also worth noting that results for the conveyor idler rolls with an MIS of 0.088 mm match closely with the trends of the other MIS data points even though this set of conveyor idler rolls have a TIR that is around double that of the other sets of MIS conveyor idler rolls, this is also true of the ’as supplied’ conveyor idler rolls. This would tend to indicate that the TIR of a group of conveyor idler rolls has little effect on their noise output whilst they are interacting with a conveyor belt.
9.3 Combined TIR and MIS Results
To combine the noise output results from Figure 19 and Figure 20 it must first be recognised that it is impossible to have a conveyor idler roll that has a TIR of 0 mm and some greater value for its MIS, and that the opposite is also true. Therefore, for a conveyor idler roll to have 0 mm TIR, than it must also have an MIS of 0 mm. Now, if the four data sets from Figure 19 are extrapolated to 0 mm TIR and the average of the data sets used as the values at zero, this is reasonable since they form very nearly horizontal lines, we have the noise output of a perfectly concentric conveyor idler roll set, or a conveyor idler roll set with a TIR of
66
78
90
0.088 0.098
L eq (
dB
A)
Average MIS (mm)
6 m/s
5 m/s
4 m/s
3 m/s
As Supplied 6m/s
As Supplied 5 m/s
As Supplied 4 m/s
As Supplied 3 m/s

B16-02 page 15
0 mm. This perfect conveyor idler roll set must, as we have pointed out, have an MIS of 0 mm as well, and when these new data points are added to Figure 20, the result in Figure 22 shows that there is reasonable agreement with the new data points at 0 mm MIS and the rest of the graph.
9.4 Belt Noise
The topic of belt noise production is outside the scope of this paper, but it is very closely related and there were some interesting points found during testing that are well worth noting here. It was found during the testing that when the TIR conveyor idler rolls were tested the noise level would periodically fluctuate as in Figure 23, which shows the noise measurements for an offset conveyor idler roll running at 6 m/s. As in Figure 15, the vertical axis is in units of dBA and the horizontal axis is in units of minutes and seconds. These fluctuations are in contrast to the steady noise level that was recorded for a flat conveyor idler roll as shown in Figure 15. The two cursors in Figure 23 are aligned over the fluctuations to show their period which turns out to be 22.875 seconds as indicated. The belt length is 136.5 m and at a speed of 6 m/s it cycles through the system in 22.75 seconds; which, given some error in the measurements, is comparable to the period recorded by the sound level meter. The similarity of these two results indicates that the noise level fluctuations are caused by the belt and its surface imperfections.
Figure 22. 0 mm MIS data added to Figure 20
Figure 23. Noise fluctuations due the conveyor belt
It is likely that the periodical spikes in the noise level are caused by belt surface defects like a splice or the marks shown in Figure 24 which is a photograph of a defect on the surface of the test conveyor’s belt. Each set of TIR conveyor idler roll noise level data showed the same pattern. It is thought that since the TIR conveyor idler rolls all had smooth, round machined
42
54
66
78
90
102
0 0.1 0.2 0.3 0.4
L eq (
dB
A)
Average MIS (mm)
6 m/s
5 m/s
4 m/s
3 m/s
Time – 22.875s

B16-02 page 16
shells, they were unable to generate any noise and that the noise levels measured for the TIR conveyor idler rolls are entirely due to the belt, since the measured noise levels are roughly constant for each speed regardless of the TIR.
The conditions required to get a noise pattern like that shown in Figure 23 are fairly specific and are easily disrupted by a defect such as the flats machined on the MIS conveyor idler rolls or the surface of the ’as supplied’ conveyor idler rolls. It is likely then that the noise level attributed to the belt is the lower limit that can be expected when testing for conveyor idler roll noise. It is recommended that any comprehensive noise testing of conveyor idler rolls be conducted so that it may be determined if the conveyor belt is the primary influence on the overall noise production. This may prevent resources from being wasted on an effort to produce the impossibility of quieter conveyor idler rolls.
Figure 24. One cause of the noise fluctuations
10. CONCLUSION
The results shown indicate that the MIS of a conveyor idler roll is the dominant cause of the noise produced by the interaction of a conveyor idler roll and the conveyor belt that is in contact with it. They also show that the TIR of a conveyor idler roll has very little to do with the same noise production. This does not mean however, that the TIR is a redundant measurement. The TIR measurement will give an indication of the balancing of a conveyor idler roll which, if poor, can lead to the severe vibrations that were witnessed for the TIR conveyor idler rolls during the testing.
The testing also found that it was possible to measure the noise caused by the conveyor belt due to its interaction with conveyor idler rolls, and that if this pattern was found during testing for conveyor idler roll noise, then the conveyor idler rolls will be operating as quietly as is possible. It is recommended that further research be conducted into this area of conveyor system noise production.

B16-02 page 17
REFERENCES
[1] Brown S. C., Conveyor Noise Specification and Control, Acoustics 2004. [2] Bies and Hansen, Engineering Noise Control: Theory and Practice, Taylor & Francis
2009 (Electronic Edition).
ABOUT THE AUTHORS
MR PAUL MUNZENBERGER
Paul Munzenberger completed an apprenticeship as a Fitter Machinist in early 2001, and spent several years afterwards as a tradesman principally involved with maintenance and repair of ’Cable Belt’ and conventional trough conveyors, as well as a variety of other equipment associated with coal handling and preparation. He completed his Bachelor’s Degree in Mechanical Engineering at the University of Newcastle in 2007 with first class honours. He is currently studying part-time for a PhD in Mechanical Engineering in the field of belt conveying technology, while working as a Research Engineer for TUNRA Bulk Solids.
Mr Paul Munzenberger
TUNRA Bulk Solids Research Associates The University of Newcastle University Drive Callaghan NSW 2308 AUSTRALIA Telephone: (+61 2) 403 39012 Email: [email protected]
DR CRAIG WHEELER
Craig Wheeler is a Senior Lecturer in the School of Engineering at The University of Newcastle, Australia and Associate Director of TUNRA Bulk Solids. He worked as a Mechanical Engineer for BHP Billiton for eleven years and then as a Research Fellow at the Centre for Bulk Solids and Particulate Technologies for four years. He was appointed as a Lecturer in Mechanical Engineering in 2002, as a Senior Lecturer in 2008 and more recently as Associate Director of TUNRA Bulk Solids.
Dr Craig Wheeler
Discipline of Mechanical Engineering School of Engineering The University of Newcastle University Drive Callaghan NSW 2308 AUSTRALIA Telephone: (+61 2) 403 39037 Email: [email protected]