the influence of industries on smes’
TRANSCRIPT

1
The influence of industries on SMEs’
engagement in eco-design practices
An empirical analysis of the service sector in Europe
Author: Micha Rots
Supervisor: Dr. Brigitte Hoogendoorn
Student number: 362598
Master Thesis
Entrepreneurship and Strategy Economics
Erasmus School of Economics
Erasmus University Rotterdam
26th
of August, 2014
2
Abstract
This thesis contributes by analyzing eco-design practices of SMEs in the service sector and its
industries across Europe. Two types of eco-design practices are distinguished: offering of eco-
design products and services and investments in eco-design processes (resource efficiency).
The service sector is identified as less likely to adopt eco-design practices, due to relatively
low resource intensities, marginal financial incentives and a low visibility. However, the
service sector represents a high potential in decreasing environmental degradation due to an
increased use of natural resources. Also, the service sector is the largest sector in Europe in
terms of GDP. Furthermore, the focus on SMEs is important. Previous research mainly
examines eco-design practices performed by MNCs. However, SMEs produce 60 to 70% of
total pollution in the EU. It is important to get insights in the way SMEs behave in the field of
eco-design practices in order to decrease environmental degradation. Also, stimulating the
adoption of eco-design practices by implementing focused regulation and policies is
important. Regulation nowadays has to be approved by the EU. To provide recommendations
for focused regulation and policies, it is important to perform cross-country analyses.
By using data for over 5,600 SMEs across 12 sectors in Europe, this study tests hypotheses
regarding the service sector and the following industries within the service sector:
Accommodation, Transport and Financial. The results indicate that SMEs active in the service
sector are indeed less likely to engage in eco-design practices compared to other sectors.
Industry-specific analyses show no significant differences between the industries of interest
regarding eco-design processes. It could be that resource intensities differences within the
service sector are not large enough in order to provide additional financial incentives. The
results are consistent to the expectations regarding eco-design products and service offerings.
SMEs active in the Accommodation industry are most likely to engage in eco-design products
and services, followed by SMEs active in the Transport industry. The Financial industry is
least likely to engage in eco-design products and services, as hypothesized.
3
Table of Contents 1. Introduction ....................................................................................................... 4
2. Literature background ....................................................................................... 8
2.1 Introduction environmental practices and SMEs .............................................................. 8
2.2 Eco-design practices ....................................................................................................... 10
2.3 Sectors, industries and firm characteristics ..................................................................... 12
2.3.1. Sector and industries ........................................................................................................................... 12
2.3.1. Firm characteristics ............................................................................................................................. 12
2.4 Sectors and eco-design practices..................................................................................... 13
3. Hypotheses ....................................................................................................... 15
3.1 Service sector and eco-design processes ......................................................................... 16
3.2 Service sector industries and eco-design processes ........................................................ 16
3.2.1 Transport industry ................................................................................................................................ 20
3.2.2 Accommodation industry ..................................................................................................................... 17
3.2.3. Financial industry ................................................................................................................................ 18
3.3 Service sector industries and eco-design products and services ..................................... 19
3.3.1 Accommodation industry ..................................................................................................................... 19
3.3.3 Transport industry ................................................................................................................................ 20
3.3.2 Financial industry ................................................................................................................................. 21
4. Data and Methodology ..................................................................................... 22
4.1 Dataset ............................................................................................................................. 22
4.2 Dependent variables ........................................................................................................ 22
4.3 Independent variables ..................................................................................................... 24
4.4 Control variables ............................................................................................................. 25
4.5 Methodology ................................................................................................................... 27
5. Results .............................................................................................................. 28
6. Conclusion and Discussion .............................................................................. 31
Tables ............................................................................................................... 4831
Table 3: Ordered logit estimation results with eco-design processes as dependent variable. Full sample ........ 42
Table 4: Ordered logit estimation results with eco-design processes as dependent variable. Full sample ........ 42
Table 5: Ordered logit estimation results with eco-design products and services as dependent variable.
Service sector sample, other sectors excluded .............................................................................................. 442
Table 6: Ordered logit estimation results with eco-design products and services as dependent variable.
Service sector sample, other sectors excluded. ................................................................................................. 46
Appendices ........................................................................................................... 48
Appendix 1: Definitions dependent variables and control variables for all sectors .......................................... 48
Appendix 2: Definitions dependent variables and control variables for the service sector. .............................. 49

4
1. Introduction
The consumer and capital market for green products, services and firms has expanded rapidly
in the last decade. Green products and services are defined as sustainable, environmental-
friendly, easily recycled and tend to avoid excessive inputs of energy for production (Centre
for Retail Research [CRR], 2012). Sales in green products throughout Europe already
increased from €10.3 billion in 2000 to €56 billion in 2009 and sales are expected to more
than double to €114 billion in 2015 (CRR, 2012). Around 26% of EU citizens often buy
environmentally-friendly products, 54% of them sometimes do (Eurobarometer 367, 2013).
Besides offering green products and services, firms invest in “greening” their
processes as well. Firms can perform various activities to become more resource efficient,
such as using renewable energy and minimizing waste. Firms have several incentives for
becoming more resource efficient, for instance: regulatory pressure, competitiveness
improvement, cost reductions and the corporate image (Rademaekers et al. 2011; Simpson et
al., 2004). Governments, institutions and stakeholders are stimulating (and subsidizing)
sustainable and environmental-friendly projects. An example of regulatory pressure: the EU
set ambitious climate and energy targets for 2020, also known as “20-20-20” targets.1
Firms notice that consumers and governments’ demands are shifting towards environmental-
friendly products and services. In response, many firms engage in reactive and proactive
environmental practices. Reactive environmental practices focus at complying with
governmental regulations and nothing more (Sarkis et al., 2012). Proactive environmental
practices go beyond compliance, by interpreting environmental issues as opportunities
(Sharma, 2000). This research focuses on a part of proactive environmental practices: eco-
design practices. Eco-design practices consist of both the offering of eco-design (green)
products and services and investments in eco-design processes (resource efficiency).
Previous literature mainly examines eco-design practices performed by multinational
corporations (MNCs), resource-intensive industries and individual countries. This research
makes the following contributions by analyzing eco-design practices of SMEs in the service
1 20-20-20 targets
- 20% reduction in EU Greenhouse Gas Emissions from 1990
- 20% increase in share of EU energy consumption produced from renewable sources
- 20% improvement in the EU’s energy efficiency
5
sector and its industries across Europe.
First, much research has been done on MNCs adopting eco-design practices, due to
higher public pressure (Christmann, 2004; Rondinelli, 2004; Perinni, 2006). As a result, the
drivers of eco-design practices for small and medium-sized enterprises (SMEs) remain
underexposed (Williamson et al., 2006). There are over 23 million SMEs in the EU and only
41,000 large companies. The EU defines SMEs as firms employing 1 to 250 people and
representing a turn-over less than €50 million (Gagliardi et al., 2013).2 This research defines
SMEs in number of employees. SMEs are the driving force behind the European economy,
accounting for approximately 70% of EU jobs and GDP (European Commission, 2008).
However, SMEs also produce 60 to 70% of total pollution in the EU (Labonne, 2006; Aragon-
Correa et al., 2008). Therefore, it is important to get insights in the way SMEs behave in the
field of eco-design practices to decrease environmental degradation.
Second, besides the focus on MNCs, previous literature mainly analyzed resource-
intensive sectors and its efforts to engage in eco-design practices. Resource-intensive sectors
are interesting since they have a substantial impact on the environment and find strong
financial and regulatory incentives to adopt environmental practices (Rademaekers et al.,
2011; Schleich and Gruber, 2008; Orsato, 2006; Williamson, 1991). However, resource-
intensive sectors already made substantial improvements in adopting environmental practices
(Rademaekers et al., 2011). As a result, other sectors, where there may be more room for
improvement, remain underexposed. The service sector is identified as one of those sectors
falling behind on engagement in eco-design practices (Grove et al., 1996; Simpson et al.,
2004), whilst environmental impact enlarges due to the increased use of natural resources
(Constantinos et al., 2010; Grove et al., 1996; Mairet and Decellas, 2009). The trend showing
an increased impact on the environment, together with a low visibility regarding the impact of
operations on the environment (Grove et al., 1996), classify the service sector as a high
potential to decrease environmental degradation. In addition, the service sector is regarded as
the largest sector within the EU, accounting for over 70% of total gross value (Eurostat,
2012). Gross value added accounts for more than 90% of GDP. Furthermore, Groove et al.
(1996) find severe differences between industries within the service sector regarding the
adoption of environmental practices. This finding addresses the need for an industry-specific
analysis within the service industry.
2 SME definition:
- Micro firms: <10 employees and < €2 million turn-over.
- Small firms: <50 employees and < €10 million turn-over.
- Medium-sized firms: <250 employees and < €50 million turn-over.

6
Third, previous research mainly examines environmental performance within
individual countries (Revell and Blackburn, 2007; Zhu et al., 2007; Lawrence et al., 2006). It
is important to get insights in the way SMEs behave throughout the EU, in order to provide
recommendations for focused regulation, which nowadays have to be approved by the EU.
Fourth, this research focuses on two main aspects of environmental performance by
SMEs: offering of eco-design products and services and investments in eco-design processes
(resource efficiency). By analyzing two types of eco-design practices, this research
investigates whether SMEs’ engagement differs across types of eco-design practices.
The objective of this thesis will be to examine the influence of industries within the service
sector on SMEs’ engagement in eco-design practices. Since little is known about the
engagement of SMEs in eco-design practices, the nature of this research will be mainly
exploratory. Analyzing the service sector and its industries is a broad first step into
determining what characteristics are influencing SMEs to engage in eco-design practices. This
research will be a first step towards advice for policy makers by identifying which SMEs
active in the service sector are less likely to engage in eco-design practices. Furthermore,
governments can also adopt strict legislation to force certain SMEs into engagement in eco-
design practices. It is mainly interesting to compare industries within the service sector and to
provide recommendations to properly address industries which are less likely to engage in
eco-design practices.
This research forms hypotheses for the following industries within the service sector:
Financial industry, Transport industry and Accommodation industry. Hypotheses for eco-
design processes are based on resource intensity. Hypotheses for eco-design products and
service offering are based on previous research. By analyzing over 5600 SMEs across 12
sectors in Europe, it is possible to test the hypotheses regarding the service sector. Over 1400
SMEs active in the service sector across Europe represent the sample to test the hypothesis
regarding the individual industries within the service sector. The data is retrieved from the
Flash Eurobarometer Survey (no. 342) on “SMEs, resource efficiency and green markets”.
The findings under scribed the importance of the service sector to decrease environmental
degradation. The service sector is indeed less likely to engage in eco-design practices
compared to other sectors. There seems to be no difference between industries within the
service sector regarding eco-design processes in order to become more resource efficient.

7
However, the Financial industry is less likely to engage in eco-design products and services
compared to other industries. This finding addresses the need to stimulate SMEs in the
Financial industry to engage in eco-design products and services.
The remainder of this thesis is organized as follows: the second section of the thesis provides
the literature background. Afterwards, hypotheses are formed in the third section. The data
and methodology are elucidated in the fourth section. The fifth section shows the results.
Lastly, the discussion is held in the sixth section.

8
2. Literature background
An introduction into environmental practices and SMEs is presented in the first section. In the
second section, eco-design practices will be explained. In the third section, the importance of
sectors and industries and firm characteristics will be elucidated. Finally, resource-intensive
sectors will be discussed in the fourth section.
2.1 Introduction environmental practices and SMEs
Environmental practices are actions undertaken by a firm to reduce the environmental impact
of their operations (Gadenne et al., 2009). Although this definition is widely interpretable,
several studies use this definition to describe these practices (Hoogendoorn et al., 2014,
Uhlaner et al., 2012). Sarkis et al. (2010) categorize environmental practices in different
dimensions, ranging from reactive to proactive practices.
Reactive environmental practices
Reactive environmental practices focus at meeting governmental regulations regarding
environmental performance (Sarkis et al., 2010; Schot and Fischer, 1993). Firms do not go
beyond this scope of minimum requirements, and many would not even address
environmental issues in the absence of regulation (Buysse and Verbeke, 2003). Firms with
reactive environmental practices are committing limited resources to solving environmental
problems (Hart, 1995). Buysse and Verbeke (2003) state that limited resources are made
available, since stakeholder actions in response to poor environmental performance are not
perceived as a threat to the (financial) performance of the firm.
Proactive environmental practices
Proactive environmental practices go beyond compliance with governmental regulations, by
interpreting environmental issues as opportunities (Sharma, 2000; Andersson and Bateman,
2000). Proactive environmental practices consist of eco-design, source reduction and overall
managerial process management (Table 1). Eco-design practices focus on developing
products and processes that have minimal impact on the environment. Source reduction
practices are mainly aimed at preventing pollution of operational processes on the short-term.
Overall managerial process management practices are considered as the broader
environmental perspective a firm pursues. Those practices are closely related to the
implementation of an Environmental Management System (EMS) within an organization.

9
EMS is the documentation of environmental performance, primarily focused on design,
pollution control, waste minimization and setting goals (Melnyk et al., 2013).
Early research states that larger firms are more likely to engage in proactive environmental
practices (Aragón-Correa, 1998: Russo and Fouts, 1997; Sharma, 2000). Many scholars
believe that the need for complex coordination of skills and extensive resources are the main
reasons that SMEs are less likely to adopt proactive environmental practices (Russo and
Fouts, 1997; Ramus and Steger, 2000; Shrivastava, 1995; Greening and Gray, 1994).
Although the arguments intuitively make sense, empirical evidence is not found (Aragón-
Correa et al., 2008). Based on this intuitive assumption, further research regarding SMEs and
environmental practices mainly focuses on reactive environmental practices (Rutherfoord et
al., 2000; Schaper, 2002; Williamson and Lynch-Wood, 2001). However, in the late 2000s,
Aragón-Correa et al. (2008) introduce new evidence, proving that SMEs are able to behave
proactive regarding environmental practices.
Proactive environmental practices and SMEs
Aragón-Correa et al. (2008) show, contrary to previous research, that SMEs can adopt
proactive environmental practices. Extensive resource capacity is not necessarily a condition
for the development of proactive environmental practices. Furthermore, a complex
coordination of skills from an organizational point of view is neither influenced by firm size,
as another research by Flannery and May (2002) confirms. Traditional arguments that SMEs
only focus on engagement in reactive environmental practices have to be revised. Earlier
research followed up on the assumption that SMEs do not engage in proactive environmental
practices (Rutherfoord et al., 2000; Schaper, 2002; Williamson and Lynch-Wood, 2001),
while not being proven (Aragón-Correa et al., 2008). This resulted in a lack of literature
concerning SMEs and its engagement in proactive environmental practices (Aragón-Correa et
al., 2008; Williamson et al., 2006). Only a few descriptive studies have shown that SMEs can
successfully implement proactive environmental practices (Bianchi and Noci, 1998; Carlson-
Skalak, 2000; Hillary, 2000). Aragón-Correa et al. (2008) build on their work and find SMEs
engaging in proactive environmental practices to show better financial performance. Their
findings are confirmed by several other studies stating that proactive environmental practices
are associated with cost savings, improved reputation and new organizational capabilities, all
leading to competiveness improvement (Christmann, 2000; Hart, 1995; Sharma and
Vredenburg, 1998). Building on the work of Aragón-Correa et al. (2008) this research will
focus on proactive environmental practices of SMEs. This topic is highly relevant, due to a

10
lack of existing literature. Early research mainly focused on reactive environmental practices.
Furthermore, proactive environmental practices reduce the impact on the environment more
than reactive environmental practices (Tukker et al., 2001; Jeswiet and Hauschield, 2005).
Thus, it is important for policy makers to stimulate SMEs into engagement in proactive
environmental practices. Furthermore, governments can adopt strict legislation forcing SMEs
to engage in proactive environmental practices. SMEs also have a financial incentive to
engage in proactive environmental practices, this may be an important argument for policy
makers to convince SMEs. More specifically, eco-design practices will be analyzed. Eco-
design practices are part of proactive environmental practices, as can be seen in Table 1. In
the next subsection, the choice for eco-design practices will be explained.
Environmental practices
Proactive environmental practices Reactive environmental practices
Eco-design
practices
Source
reduction
practices
Overall managerial
process
management
Minimum regulatory requirements
Table 1: Eco-design practices
2.2 Eco-design practices
Eco-design has been defined as “the systematic integration of environmental considerations
into product and process design” (National Resource Council, Canada, 2003). Eco-design
practices focus on developing products and processes that have minimal impact on the
environment (Sarkis et al., 2010). Literature is conclusive about the fact that eco-design
practices have the largest environmental impact in relation to other proactive environmental
practices. Tukker et al. (2001) state that eco-design is currently seen as the most important
part of environmental policy. Jeswiet and Hauschild (2005) confirm their findings by stating
that eco-design is the most important phase in the life of a product or service, where decisions
will have the largest environmental impact. Furthermore, improving the design of products
bears the promise of reaching environmental targets set by EU (Tukker et al., 2001).
Therefore, this research will focus on eco-design practices. Eco-design practices consist of
eco-design products and eco-design processes.

11
Eco-design products
The focus on products, besides process innovation, provides major opportunities for
substantial increases in eco-efficiency (Tukker et al., 2001). In terms of product design, the
environmental impact helps to define the direction of decisions (Brezet, 1997). Bauman et al.
(2002) state that eco-design is forced into firms’ strategies by consumers expressing an
environmental concern since the beginning of the 1990s. As a result, eco-design products are
developed with the expectation to be environmentally superior to traditional products but also
competitive in terms of price and technical performance (Porter and van der Linde, 1995;
Elkington 1994). Furthermore, competitive advantage through product or service
differentiation, better service of niche markets and the improved image and loyalty of
stakeholders are important additional benefits for the development of eco-design products and
services (Shrivastava, 1995; Goodman, 2000; Rondinelli and Vastag, 1996). Uhlaner et al.
(2012) take the process of producing, selling and searching for environmentally friendly
products for a firm into account as measures for environmental practices. Hoogendoorn et al.
(2014) also find offering of eco-design products to be a key element of environmental
practices.
Eco-design processes
In the definition by National Resource Council Canada (2003), the integration of
environmental considerations into process design for firms plays a crucial role. Eco-design
considers environmental aspects at all stages of the product development process and
throughout the product life cycle (Brezet, 1997; van Hemel and Brezet, 1997). Eco-efficiency,
or resource efficiency, is seen as one of the key indicators of eco-design during this life cycle
(Aoe, 2006). To identify various eco-design processes, van Hemel and Brezet (1997)
developed the eco-design strategy wheel. Eco-design processes are categorized as follows:
selection of low impacts materials, reduction of materials usage, optimization of production
techniques, optimization of distribution system, reduction of impact during use, optimization
of initial lifetime and optimization of end-of-life system. Eco-design processes taken into
account throughout this research comply with the eco-design strategy wheel. Resource
efficiency is the key indicator for eco-design processes. Such eco-design practices include for
instance the use of recycled materials, renewable energy and the minimization of waste.
Russo and Fouts (1997) examine for example waste reduction, while Stanwick and Stanwick
(1998) focus on pollution reduction with renewable energy sources. Hoogendoorn et al.
(2014) take into account to which extent a firm invests in resource efficiency.

12
2.3 Sectors, industries and firm characteristics
The first subsection will discuss the importance of sectors and industries. The second
subsection will elucidate firm characteristics.
2.3.1. Sectors and industries
This thesis examines the influence of industries within the service sector on SMEs’
engagement in eco-design practices. This research identifies sectors and industries based on
the NACE classification code. Group characteristics and behavior in a sector or industry
might be important in determining whether a firm will engage in eco-design practices. So far,
previous research mainly focused on the engagement of eco-design practices for MNCs
(Christmann, 2004; Rondinelli et al. 2004; Perinni, 2006), in single resource-intensive sectors
(Rademaekers et al., 2011; Schleich and Gruber, 2008; Orsato, 2006; Williamson, 1991) and
in individual countries (Revell and Blackburn, 2007; Zhu et al., 2007; Lawrence et al., 2006).
This thesis compares the extent to which SMEs engage in eco-design practices for three
industries within the service sector: Financial and insurance activities, Accommodation and
food service activities and Transportation and storage.
The most common way to identify a sector is based on its industries. An industry is defined as
a group of firms that operate in the same segment of the economy (Langager, 2009). This
research will use NACE coding to identify sectors and industries, a statistical classification of
economic activities in the European Community. To illustrate, the manufacturing sector
(NACE C) consists of various industries, such as manufacture of food products (NACE C10),
manufacture of textiles (NACE C13) and manufacture of chemicals (NACE C20). By using
NACE coding, firms get assigned to a certain sector and a certain industry, based on its
economic activities. More information on NACE coding will be elaborated in chapter four.
2.3.2. Firm characteristics
Besides grouping firms by sector and industry, it is also possible to distinguish between firms
on several other characteristics. Firm characteristics taken into account throughout this
research are as follows: level of compliance, the implementation of EMS, firm size and firm
age. Firms pursue eco-design practices in different levels of commitment. Montiel (2008)
finds firms that are socially responsible to have a higher probability to implement pollution
prevention techniques and recycling programs. Therefore, this research takes the level of
compliance for a firm into consideration. The level of compliance is closely related to the

13
level of Corporate Social Responsibility (CSR). CSR is defined as “the responsibilities that
embody those standards, norms or expectations that reflect a concern for what consumers,
employees, shareholders and the community regard as fair, just, or in keeping with the respect
of protection of stakeholders’ moral rights” (Carroll, 1999; Driffield et al., 2013). The CSR
theory claims that the firm’s purpose of existence is to offer appreciated services to society
(Preuss, 2010). Previous literature states that a firm pursues CSR when it goes beyond
compliance (Rodriguez et al. 2006; McWilliams & Siegel, 2001). Earlier this chapter,
proactive environmental practices are defined as ‘going beyond compliance’ (Sharma, 2000;
Andersson and Bateman, 2000). Many researchers confirm the finding that environmental
practices are a subset of social practices (Graves and Waddock, 1994; Turban and Greening,
1997). CSR seems to induce proactive eco-design practices for a given firm. More
information on firm size and firm age will be elaborated in chapter four.
2.4 Sectors and eco-design practices
Hoogendoorn et al. (2014) take the first step into analyzing SMEs’ performance regarding
eco-design practices on cross-sector level. This paper finds that firms operating in a sector
characterized by tangible products show the highest probability of engagement in eco-design
processes. Hoogendoorn et al. (2014) combine the following sectors into the tangible products
sector: Manufacturing, construction, mining and quarrying, electricity, gas, steam and air
conditioning and water supply, sewerage and waste management. However, since
Hoogendoorn et al. (2014) combined many sectors into a tangible products sector, there might
exist severe differences within this overarching sector. The tangible products sector, used by
Hoogendoorn et al. (2014) consists of many resource-intensive sectors. The next paragraph
will elucidate why resource-intensive sectors are more likely to engage in eco-design
processes.
Resource-intensive sectors
Much research has been done examining the influence of resource-intensive sectors on the
environment (UNEP, 2010; Rademaekers et al., 2011). A report from UNEP (2010) finds
resource-intensive sectors to have a considerable impact on resources and environment.
However, the literature is conclusive about the fact that resource-intensive sectors already
made substantial improvements by implementing eco-design practices, for regulative reasons
(Rademaekers et al., 2011) as well as financial reasons (Schleich and Gruber, 2008; Orsato,
2006; Williamson, 1991).

14
The following sectors are identified as resource-intensive: building & construction,
agriculture & food and metal & manufacturing (Rademaekers et al., 2011). For example, the
agriculture sector alone makes up for 70% of the world’s freshwater consumption and 14% of
greenhouse gas emissions. The Shift Project Data Portal confirms the considerable impact on
environment by resource-intensive sectors. For example, the manufacturing and construction
sector account for 17% of total GHG emissions in the EU during 2010. Also, agriculture
(11%) and electricity (37%) play a large role in environmental degradation.
Resource-intensive sectors clearly have a large impact on the environment. In response, the
EU focuses environmental policies and regulations on improving resource efficiency within
those sectors (Rademaekers et al., 2011). Rademaekers et al. (2011) analyze nine resource-
intensive sectors, including manufacturing (food and drinks) and construction (cement, steel).
Cement, steel, glass and non-ferrous metals are all major input materials used in the
construction sector. These sectors drive on the demand in the construction sector (Building
Materials, 2014). Rademaekers et al. (2011) find all sectors to have made substantial
improvements in the implementation of resource efficiency measures. Reaching goals set by
EU and complying with existing regulation are the main reasons why SMEs adopt eco-design
practices (Rademaekers et al., 2011). Besides regulatory pressure, Schleich and Gruber (2008)
state that resource-intensive sectors have strong internal incentives to improve resource
efficiency. When resources are extensively used, investments in resource efficiency become
interesting in an economic sense. Cost leadership strategies become more attractive, since cost
savings can be realized on large scale (Porter, 1980). Orsato (2006) and Williamson (1991)
also state that, in resource-intensive sectors like construction and manufacturing, resource-
efficient strategies fits business logic due to financial benefits.
The finding that resource-intensive sectors already made substantial improvements in
resource efficiency addresses the need to identify other sectors (and its industries) that may
not be that far in adopting eco-design practices, due to for instance less regulatory and public
pressure as well as marginal financial benefits. Further elaboration on the influence of sector
and industry on SMEs’ engagement in eco-design practices is presented in the next chapter,
where hypotheses will be formed.

15
3. Hypotheses
This thesis examines the service sector (and its industries) and its engagement in eco-design
practices. In the first section, the service sector will be introduced. In the second section, eco-
design processes in industries within the service sector will be analyzed. In the third section,
eco-design products and services in industries within the service sector will be analyzed.
3.1 Service sector and eco-design practices
The service sector is identified as less likely to adopt eco-design practices, due to marginal
financial incentives (Simpson et al., 2004) and low visibility (Grove et al., 1996). Together
with the trend showing an increased use of natural resources (Constantinos et al., 2010), the
service sector represents a high potential in decreasing environmental degradation.
Services are mainly intangible and consumed as they are produced (Shostack, 1987; Berry
1980). These characteristics lead to the assumption that services are less threatening to the
environment (Grove et al., 1996). Production of physical goods requires materials, processes
and outputs that have a direct impact on the environment. As a result, environmental abuses,
as well as efforts to behave environmentally friendly, are more visible in, for instance, the
manufacturing sector. However, services might not comprise physical elements (intangibility)
but they do rely on those elements and natural resources (Grove et al., 1996). To illustrate, the
financial services sector extensively uses office space leading to an extreme electricity usage
by for instance air-conditioning and computers. The low visibility of environmental efforts in
the service industry makes firms less likely to adopt eco-design practices (Grove et al., 1996).
Simpson et al. (2004) also find SMEs active in the service sector less likely to make
environmental improvements compared to other sectors. The main reason for
underperformance is ascribed to the fact that firms active in the service sector do not benefit
from a cost leadership strategy (Porter, 1980) in order to realize cost savings. The service
sector less extensively uses natural resources compared to other sectors; as a result
investments in resource efficiency become less attractive. Based on Grove et al. (1996) and
Simpson et al. (2004) the following can be hypothesized:
Hypothesis 1: SMEs active in the service sector are less likely to engage in eco-design
practices compared to other sectors

16
Moreover, the service sector shows an increase in the use of natural resources over the years.
Mairet and Decellas (2009) research reliance on natural resources for the French service
sector. They find an increase in energy consumption in the service sector by 18% over the
period 1995-2006. Constantinos et al. (2010) confirm this increase for the EU as a whole
(22% over the period 1990-2005). The service sector is the fastest growing sector compared to
other sectors regarding energy consumption. Furthermore, Grove et al. (1996) find service
industries to represent a major potential source of environmental preservation. The trend of
increased use of natural resources, together with the potential to decrease environmental
degradation, further addresses the need to engage in eco-design processes for the service
sector.
The service sector comprises very diverse industries. Grove et al. (1996) state that there exist
severe differences between industries within the service sector regarding the adoption of eco-
design practices. Not all industries are equally capable of contributing to environmental
preservation. This research posits several industries within the service sector, based on the
NACE classification: Transportation and storage, Accommodation and food service activities,
Information and communication, Financial and insurance activities, Real estate activities and
Professional, scientific and technical activities. Further elaboration on the NACE
classification is provided in the next chapter. The industries of interest discussed in this
chapter are as follows: Financial and insurance activities industry (from now on: Financial
industry), Transport and storage industry (from now on: Transport industry) and
Accommodation and food service activities (from now on: Accommodation industry). In the
next section, hypotheses are formed regarding those industries.
3.2 Service sector industries and eco-design processes
As discussed in chapter two, industries characterized by high resource-intensity have financial
incentives to invest in eco-design processes (resource efficiency). Based on this assumption,
more resource-intensive industries are more likely to invest in eco-design processes. The
industries of interest clearly differ in resource-intensity.
3.2.1 Transport industry
The transport industry is identified with the highest resource-intensity compared to other
industries within the service sector. The EEA (2013) finds the transport industry to have the
largest total final energy consumption within the service sector. Van Veen-Groot and Nijkamp
(1999) state that the transport industry is a significant contributor to global environmental
17
degradation, by for instance air pollution. Air pollution in the transport industry is difficult to
control, since volumes are steadily increasing and fuel efficiency breakthroughs are not yet in
sight (Cole et al., 1997). Transport is the fastest growing industry regarding energy
consumption, due to heavily increased volumes in goods and passenger transport
(Constantinos et al., 2010). The transport industry appears to face difficulties in reaching
environmental targets on resource efficiency set by the EU (European Environment Agency
(EEA) Report, 2013). The EEA Report (2013) evaluates industries’ performance over the
years and checks performance with targets set by the EU. Green and Wegener (1997) state
that current trends in transport are not yet sustainable. It will demand fundamental changes in
technology, design and operation of transport systems to decrease environmental degradation.
However, there are many signs that the transport industry has already started investing in eco-
design processes. The Federal Aviation Administration (FFA) introduced the Commercial
Aviation Alternative Fuels Initiative (CAAI) back in 2009. This initiative is promoting the
development of alternative fuel options as well as creating new flight patterns to reduce
current fuel consumption (Price, 2009). The industry is also developing ways to recycle
planes and improve the manufacturing processes to be more eco-friendly. Based on the
assumption that more resource-intensive industries have stronger financial incentives to
engage in eco-design processes, the following can be hypothesized:
Hypothesis 2: SMEs active in transport industry are most likely to engage in eco-design
processes compared to other industries within the service sector
3.2.2 Accommodation industry
The accommodation division consists of short-stay accommodations for visitors and other
travelers, also defined as the hospitality industry. Besides accommodation, the industry takes
food service activities into account, defined as complete meals and drinks fit for immediate
consumption (United Nations Statistics Division, 2014). Bohdanowicz (2005) identify the
hospitality industry as second greatest polluters and resource consumers within the service
sector. This industry exerts a significant impact on global resources (Kirk, 1995; Gossling et
al., 2005). Furthermore, a large proportion (50 to 60%) of the waste materials in a hotel can be
recycled or reused. Cespedes-Lorente et al. (2003) confirm this high resource intensity by
stating that medium-sized hotels consume 507 liters of water per person per day. As the hotel
industry is resource intensive, the opportunities for improving eco-design processes are
substantial. Stipanuk (2002) and Rosenblum et al. (2000) confirm this finding by stating that

18
hotels extensively use various sources of energy, such as electricity (lightings, air
conditioning) and water (laundry and bathrooms). This fact labels the hospitality industry with
a high potential for contributing to environmental preservation. Since the hospitality industry
is widely seen as part of the service industry, and thus having a less visible impact on the
environment, few regulations have emerged regarding environmental issues (Sloan et al.
2009; Knowles et al., 1999; Font, 2002). Due to the lack of regulation, the researchers state
that eco-design processes are at a very early stage of its development and many opportunities,
especially proactive ones, are not yet integrated. Several other studies show other important
factors preventing the adoption of eco-design processes in the hospitality industry, such as
institutional factors (lack of support by governments), operational factors (reduction in the
quality of products/service offerings) and financial factors (extra costs involved when
engaging in eco-design practices) (Chan and Wong, 2006; Kasim, 2007; Tzschentke et al.,
2008). The accommodation industry is labeled with a far higher emission intensity compared
to the financial industry (Bohdanowicz, 2005; Stipanuk, 2002; Rosenblum et al., 2000). Based
on the assumption that more resource-intensive industries have stronger financial incentives to
engage in eco-design processes, the following can be hypothesized:
Hypothesis 3: SMEs active in accommodation industry are less likely to engage in eco-design
processes compared to transport industry, but more likely to engage in eco-design processes
compared to the financial industry
3.2.3. Financial industry
The financial industry is involved with eco-design practices as investors, developers,
stakeholders and polluters (Jeucken, 2001). When analyzing eco-design processes, attention is
aimed at the industries’ role as polluters. Graafland et al. (2003) find firms active in the
financial service industry to make less actively use of ISO certification, social reporting,
social handbooks and ethics committees compared to other industries in the service sector.
These are all other measures of environmental practices (Graafland et al., 2003). Azzone et al.
(2000) confirm the finding that the financial sector is relatively slow in applying
environmental criteria to investment decisions. Ittner et al. (2003) find environmental
performance to be relatively unimportant in the financial services industry compared to other
drivers such as customer relations and product and service quality. Furthermore, the European
financial industry has not been exposed to environmental liabilities as significantly as the
North American sector, leaving eco-design processes in their infancy (Jeucken, 2001). The

19
literature is conclusive about the financial industry to be lax in adopting eco-design processes.
In addition, the financial industry less extensively makes use of resources compared to other
industries within the service sector. Based on previous research the following can be
hypothesized:
Hypothesis 4: SMEs active in financial industry are less likely to engage in eco-design
processes compared to other industries within the service sector
3.3 Service sector industries and eco-design products and services
The development of eco-design products and services varies widely within the service sector
industries of interest: Accommodation industry, Transport industry and Financial industry.
3.3.1 Accommodation industry
Maloni and Brown (2006) state that the food service industry has many impacts on the
environment, for instance water pollution (Fox, 1997) and waste (Boehlje, 1993). Energy use
and food purchases have the largest environmental impact. The industry addresses consumers’
concerns by offering organic food products, which are characterized by sustainable farming
practices and limited use of chemicals (US Department of Agriculture, 2005). The offering of
organic food products increases rapidly, but still remains a small segment of the overall food
service market (Butler et al., 2004). It seems that a shift towards offering of eco-design
products is already visible, although still being in its infancy.
In the accommodation industry, eco-design products and services are slowly beginning to gain
ground. A green conference program branded ‘Eco-meet’ is being developed, having the
following key components: eco-service, eco-accommodation and eco-cuisine (Graci and
Dodds, 2008). Eco-service enhances disposable-free food services, as well as for instance
recycled note pads and bio-degradable pens in meeting rooms. Eco-accommodation focuses at
offering products such as recycling bins, bio-degradable soap and water-saving shower heads.
Eco-cuisine is focused at menus in hotel restaurants characterized by organic food products.
Although only some hotels invest in eco-design products and services, there has been
enormous progress so far (Graci and Dodds, 2008). Literature is conclusive about the fact that
in the food service industry as well as the accommodation indsutry, eco-design products and
services are coming out of its infancy. However, the efforts in becoming more sustainable are
still minimal. Though, compared to the other industries of interest, the accommodation

20
industry seems to have gained the most ground regarding eco-design products and services.
Therefore, the following can be hypothesized:
Hypothesis 5: SMEs active in accommodation industry are most likely to engage in eco-
design practices compared to other industries within the service sector
3.3.3 Transport industry
Previous literature identifies the transport industry with a clear potential to engage in eco-
design products and services. Cole et al. (1997) stated that efficiency breakthroughs are not
yet in sight. However, the CAAFI is constantly working on a new generation of more efficient
airplanes and fuel mixes. In 2009, a new fuel specification is approved using synthetic
hydrocarbons, clearly reducing the impact on the environment (Price, 2009). Rail transport is
already seen as one the world’s greenest sources of transportation. Still, trains are becoming
lighter, faster and 100% electric. However, road transport is still lacking the development of
eco-design products compared to air and rail transport (Price, 2009). Electric cars are very
slowly beginning to gain ground and efficiency improvements like biodiesel and biogas are
still minimally used (Price, 2009). Green and Wegener (1997) also state that current trends in
transport are not yet sustainable. Few logistics service providers, under which UPS, have
started using route-planning software and internet matching systems to reduce GHG
emissions and save fuel consumption (Lin and Ho, 2008). Other providers, for instance in
Taiwan, fuel their transportation with bio-diesel. Furthermore, logistics and transport
providers can legally emit as many CO2-emissions as they want, since there is no strict
regulation limiting those firms (Wolf and Seuring, 2010). Logistics are regarded as the
‘missing link’ for the provision of eco-design products and services to consumers (Wu and
Dunn, 1995). It will demand fundamental changes in technology, design and operation of
transport systems to decrease environmental degradation (Green and Wegener, 1997).
Literature is inconclusive about the transport industry and its efforts to invest in eco-design
products and services. Although some improvements are beginning to gain ground, most
firms do not yet engage in eco-design products. Based on previous research the following can
be hypothesized:
Hypothesis 6: SMEs active in the transport industry are less likely to engage in eco-design
products and services compared to the accommodation industry, but more likely to engage in
eco-design products and services compared to the financial industry

21
3.3.2 Financial industry
The financial industry is involved with eco-design practices as investors, developers,
stakeholders and polluters (Jeucken, 2001). Firms provide businesses with capital for
investment, develop financial products that can strengthen sustainable development, prevent
businesses from running environmental risks and act as polluters with their own operations.
The financial industry plays a large role in tackling environmental degradation (Jeucken,
2001). Firms within the industry created specialized ‘green’ credit products, mortgages and
insurance policies as well as ‘green’ funds, which all invest in environmentally friendly firms
(Jeucken, 2001; Schaltegger and Figge, 2001). However, investment managers are worried
about financial performance regarding those ‘green’ funds (Birkensleigh et al., 2013). Also,
only a small number of insurance companies in Europe are reporting on their environmental
performance (Birkensleigh et al., 2013). The government stimulates ‘green funds’ by adopting
a law (in the Netherlands) which states that firms do not have to pay capital income tax for
green credit funds if at least 70% of the money is invested in green projects (van Bellegem,
2001).
However, the offering of products and services in the field of sustainable banking business is
still minimal (Weber, 2005). In Weber’s (2005) research, only 20 out of 119 banks and
financial institutions integrated sustainability into their business strategies and practices.
Peeters (2003) confirms that the financing of sustainable development is at this moment
highly insufficient. He states that there is a critical need for a more integrated and sustainable
financial system. Although the EU leads the world in voluntary public environmental and
social reporting (Birkensleigh et al., 2013), the offering of eco-design products and services
remains a small percentage of the high potential identified by Jeucken (2001).
Based on previous research the following can be hypothesized:
Hypothesis 7: SMEs active in the financial industry are least likely to engage in eco-design
products and services compared to other industries within the service sector

22
4. Data and Methodology
An introduction into the data is presented in the first section. The second section describes the
dependent variables used throughout this research, followed by the independent variables and
control variables in section three and four. Finally, in the fifth section the methodology is
elucidated.
4.1 Dataset
This research uses data from the Flash Eurobarometer survey no. 342 on “SMEs towards
resource efficiency and green markets”. This telephonic survey was carried out between the
24th
of January and the 10th
of February 2012. The survey has been requested by the European
Commission, intending to raise SMEs’ awareness of environmental issues. The database
contains information on 10,855 firms in the 27 Member States of the EU as well as 2,312
firms in other parts of Europe and the USA. The sample for this research contains a total of
11,986 firms which are defined as SMEs. Representatives of targeted SMEs were asked to
answer 32 questions regarding resource efficiency, green markets and green jobs. The survey
covers SMEs employing at least 1 person in several sectors: Manufacturing, Retail, Services
and Industry. The sectors are further specified, based on NACE coding. The samples of firms
are selected from an international business database.
4.2 Dependent variables
This research uses two main dependent variables capturing eco-design practices. The first
dependent variable is labeled “eco-design products”. This variable is constructed by analyzing
the question: “How much do green products or services represent in your turnover?” The
second dependent variable is labeled “eco-design processes”. This variable is constructed by
analyzing the question: “Over the past two years, how much have you invested on average per
year to be more resource-efficient?” The first subsection describes the construction of both
dependent variables. The second subsection discusses the level of compliance taken into
account in order to construct the dependent variables. The full question survey is provided in
Appendix 1 for all sectors and Appendix 2 for the service sector.
Eco-design products
Eco-design products are closely related to green products and play a large role in improving
eco-efficiency (Tukker et al., 2001; Bauman et al. 2002). This variable captures the extent to

23
which SMEs offers eco-design products or services in their portfolio. SMEs are asked
whether they offer green products or services in their portfolio. If so, SMEs indicate which
percentage of their turn-over represents green products and services. Throughout this
research, the following answer options are taken into account: does not offer eco-design
products and services (0%), minor (1-10%), substantial (11-50%) and large (51% or more)
involvement. Thus, the variable “eco-design products” is a categorical variable. The answer
option “does not offer eco-design products and services (0%)” will be used as reference
category.
Eco-design processes
Resource efficiency is the key indicator for eco-design processes (Section 2.2). This variable
captures the extent to which SMEs engage in eco-design processes. Firms can undertake
several actions to be more resource efficient, such as saving water, saving energy, using
renewable energy, saving materials, minimizing waste, selling scrap material, recycling and
more. SMEs indicate which percentage of their turn-over is invested in eco-design processes.
Throughout this research, the following answer options are taken into account: does not
engage in eco-design processes (0%), minor (1-10%), substantial (11-50%) and large (51% or
more) investment. Thus, the variable “eco-design processes” is a categorical variable. The
answer option “does not engage in eco-design processes (0%)” will be used as reference
category.
Criteria for sample selection: Compliance level
Eco-design practices are part of proactive environmental practices (Jeswiet and Hauschild,
2005; Tukker et al., 2001; Sarkis et al., 2010). It is important to divide the sample by only
taking into account proactive eco-design practices, which are defined as ‘going beyond
compliance’ (Sharma, 2000; Andersson and Bateman, 2000). In order to observe eco-design
practices, this is a crucial step. The dependent variables only take into account SMEs pursuing
proactive environmental practices.
In the first question of the Flash Eurobarometer 342, SMEs are asked to which extent they
comply with environmental legislation. It is important to know whether firms comply with
existing regulation and doing more effort to address environmental concerns. The first answer
option ‘complying with environmental legislation but does not wish to go beyond these
requirements’ defines reactive environmental practices (Sarkis et al., 2010; Schot and Fischer,
1993). The last answer option ‘having difficulties in complying with environmental

24
legislation’ lacks the use of proactive environmental practices for firms. SMEs answering this
question with other possible answer options are taken into account for the construction of the
dependent variables. Other possible answer options are: complying with environmental
legislation and contemplating doing more, going beyond the requirements of the
environmental legislation but it is not one of its priorities, going beyond compliance and
environmental concerns being among the firm’s priority objectives.
4.3 Independent variables
Previous literature indicates that resource-intensive industries show a higher adoption rate
compared to industries not being that resource-intensive (Rademaekers et al., 2011; Schleich
and Gruber, 2008; Orsato, 2006; Williamson, 1991). Sectors and its industries seem to differ
regarding adoption in eco-design practices. This research uses NACE coding to identify in
which sectors and industries firms operate. NACE is a European industry standard
classification. The independent variables used throughout this research relate to the service
sector and its industries.
Service sector
To examine the first hypothesis, a dummy variable is created taking the value 1 when a firm is
active in the service sector and 0 otherwise. This research’ first step is to examine whether the
service sector is less likely to engage in eco-design practices compared to other sectors.
Industries within the service sector
The second step focuses on several industries within the service sector. In subsequent
analyses, the sample will only exist of firms operating in the service sector. A categorical
variable is created, taking into account each industry within the service sector. Dummy
variables are created for each industry of interest. The “Accommodation and food services
activities” industry will be used as reference category. The industries of interest are as
follows: “Financial and insurance activities”, “Transport and Storage” and “Accommodation
and food service activities”. Table 2 provides an overview of the service sector and its
industries, including statistics on the number of SMEs in the sample. Furthermore, almost
82% of the SMEs operate in the EU. Over 45% of SMEs employ up to 9 people, while
relatively larger SMEs (49-250 employees) represent 20% of the sample.
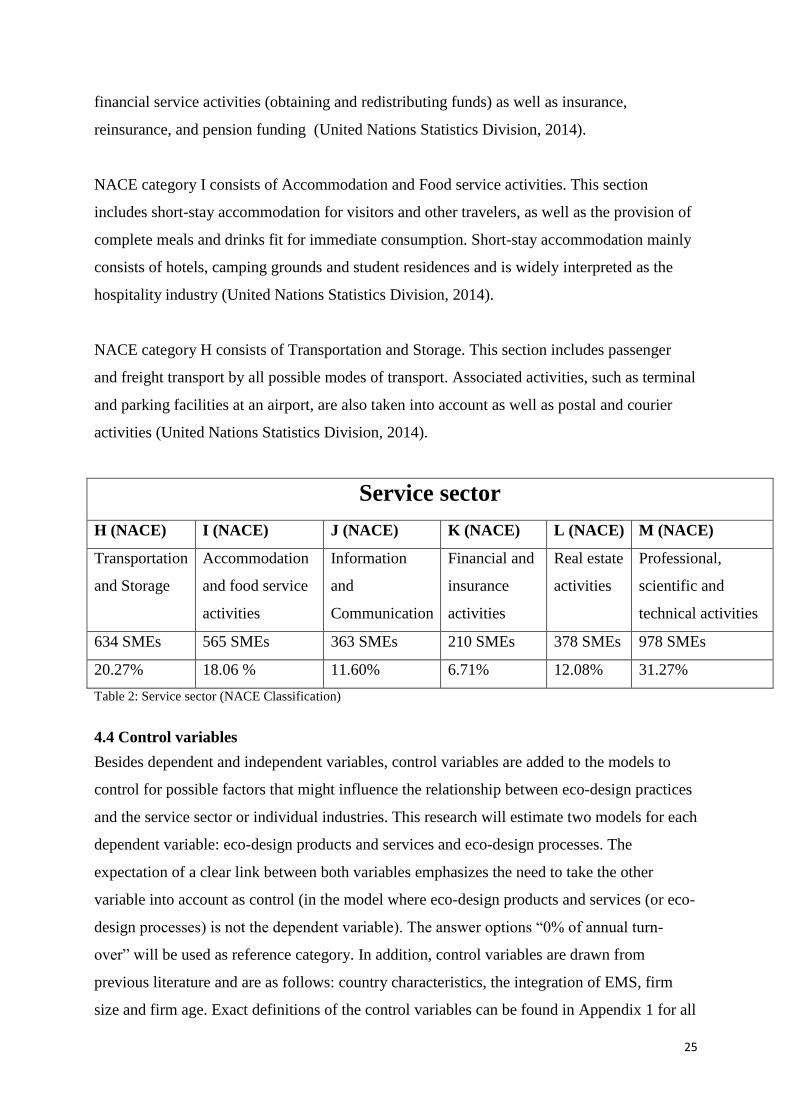
NACE Category K consists of Financial and Insurance activities. This section includes
25
financial service activities (obtaining and redistributing funds) as well as insurance,
reinsurance, and pension funding (United Nations Statistics Division, 2014).
NACE category I consists of Accommodation and Food service activities. This section
includes short-stay accommodation for visitors and other travelers, as well as the provision of
complete meals and drinks fit for immediate consumption. Short-stay accommodation mainly
consists of hotels, camping grounds and student residences and is widely interpreted as the
hospitality industry (United Nations Statistics Division, 2014).
NACE category H consists of Transportation and Storage. This section includes passenger
and freight transport by all possible modes of transport. Associated activities, such as terminal
and parking facilities at an airport, are also taken into account as well as postal and courier
activities (United Nations Statistics Division, 2014).
Service sector
H (NACE) I (NACE) J (NACE) K (NACE) L (NACE) M (NACE)
Transportation
and Storage
Accommodation
and food service
activities
Information
and
Communication
Financial and
insurance
activities
Real estate
activities
Professional,
scientific and
technical activities
634 SMEs 565 SMEs 363 SMEs 210 SMEs 378 SMEs 978 SMEs
20.27% 18.06 % 11.60% 6.71% 12.08% 31.27%
Table 2: Service sector (NACE Classification)
4.4 Control variables
Besides dependent and independent variables, control variables are added to the models to
control for possible factors that might influence the relationship between eco-design practices
and the service sector or individual industries. This research will estimate two models for each
dependent variable: eco-design products and services and eco-design processes. The
expectation of a clear link between both variables emphasizes the need to take the other
variable into account as control (in the model where eco-design products and services (or eco-
design processes) is not the dependent variable). The answer options “0% of annual turn-
over” will be used as reference category. In addition, control variables are drawn from
previous literature and are as follows: country characteristics, the integration of EMS, firm
size and firm age. Exact definitions of the control variables can be found in Appendix 1 for all

26
sectors and Appendix 2 for the service sector.
Country characteristics
Delmas and Toffel (2004) finds strong regulatory, normative and cognitive differences
between countries which affect the costs and potential benefits of adopting eco-design
practices. Buysse and Verbeke (2003) confirm her finding by stating that smaller open
economies face different configuration of environmental stakeholders compared to larger
economies. Liefferink and Andersen (1998) find large differences in eco-design strategies
between countries within the EU. The literature is conclusive about the fact that countries
show large differences regarding the adoption of eco-design practices. To control for
heterogeneity between countries regarding the adoption of eco-design practices, country
dummies are included in the models.
EMS
Environmental management systems (EMS) can be implemented by firms in order to achieve
sustainable development. EMS is the documentation of environmental performance, primarily
focused on design, pollution control, waste minimization and setting goals (Melnyk et al.,
2013). Gonzaléz et al. (2008) find firms that implemented EMS to have a higher probability
of developing eco-design practices. Hoogendoorn et al. (2014) also take into account the
implementation of EMS as a control variable. Therefore, EMS is taken into account as control
variable, since the implementation of EMS might influence the relationship between
industries and the adoption of eco-design practices. A dummy variable is created taking the
value 1 if SMEs implemented EMS and 0 otherwise.
Firm size
Darnall et al. (2010) find eco-design practices to be positively associated with firm size.
Hoogendoorn et al. (2014) find larger SMEs to show a higher engagement in eco-design
processes. Smaller firms are less likely to adopt eco-design practices compared to larger
firms, for internal (financial) reasons and regulatory pressure by stakeholders (Darnall et al.,
2010). Aragon-Corréa et al. (2008) also find firm size to be a relevant condition for
developing eco-design practices. Firm size can be measured in many ways, such as market
value (based on turn-over) and the number of employees. This research will measure firm size
by the number of employees. This variable consists of micro firms (1-9 employees), small
firms (10-49 employees) and medium sized firms (50-249 employees). This categorical

27
variable with three categories will allow controlling for heterogeneity between firms
regarding size. Micro firms (1-9) employees will be used as reference category.
Firm age
Firm age is positively related to eco-design processes. Eltayeb and Zailani (2009) find that
older firms are more likely to reduce environmental impact by investments in eco-design
processes. In addition, Neubaum et al. (2004) suggest that young firms can be negatively
influenced by their need to survive regarding ethical behavior. It is more important to survive
than to invest in eco-design practices for many young firms. This categorical variable with
four categories will allow controlling for heterogeneity between firms regarding age. Firm age
distinguishes between firms that exist for 1-5 years, 6-9 years, 10-19 years and over 19 years.
Firms that exist for 1-5 years will be used as reference category.
4.5 Methodology
In order to test the relationship between individual industries and the extent to which those
industries engage in eco-design practices, a model that suits this research is needed. This
research uses two dependent variables. Therefore, four tables containing several models will
be constructed to analyze the service sectors and its industries. The model estimating eco-
design products, as well as eco-design processes, provides four different answer options,
ranging from does not engage (0% of turn-over) to minor (1-10%), substantial (11-50%) and
large (51% or more) investment. This model uses ordered logit regressions in order to test the
relationship mentioned in the hypotheses. Ordered logit regression models are used when the
dependent variable is ordered and categorical, which is the case concerning eco-design
products and eco-design processes.
The following expression is used for ordered logit regression models:
Basically, P stands for the probability. Y equals the four different answer possibilities. X1 and
X2 represent the independent variables. The independent variables are the service sector and
its industries. If the coefficient of an independent variable turns out to be negative and
significant, is it is possible to interpret the sign to make an assumption about the marginal
effect of the independent variable.

28
5. Results
In this section, the results of the empirical models created to analyze the hypotheses are
discussed. Ordered logit models are constructed to examine the effect of the service sector and
its industries on the probability of engagement in eco-design practices. The results are
displayed in four tables. Table 3 (Table 4) presents the results of SMEs’ engagement in eco-
design processes (products and services) for the service sector compared to other sectors.
Table 5 (Table 6) presents the results of SMEs’ engagement in eco-design processes (products
and services) for the individual industries within the service sector. Each table includes
country dummies to control for heterogeneity regarding the adoption of eco-design practices
between countries. Furthermore, each table consists of two model specifications. Model 1 is
the baseline model and only includes control variables. Model 2 is the full model and includes
independent variables of interest as well as control variables.
Model 2 of Table 3 shows the effect of the service sector on SMEs’ engagement in eco-design
processes. SMEs active in the service sector have a lower probability of engagement in eco-
design processes compared to other sectors. This finding is consistent with hypothesis 1:
“SMEs active in the service sector are less likely to engage in eco-design practices compared
to other sectors”.
Model 1 of Table 3 shows the effect of control variables on SMEs’ engagement in eco-design
processes. First, if SMEs’ engage in eco-design products and services, compared to no
engagement, they have a higher probability of engaging in eco-design processes as well. The
more SMEs engage in eco-design products and services, the higher the probability of
engaging in eco-design processes. Second, SMEs employing 10-49 or 50-249 people have a
higher probability of engaging in eco-design processes compared to SMEs employing 1-9
people. Third, SMEs with a firm age of over 19 years have a higher probability of engaging in
eco-design processes compared to SMEs with a firm age of 1-5 years. This result is
significant at a 10% level. Fourth, SMEs implementing EMS have a higher probability of
engagement in eco-design processes. The findings for control variables remain the same in
model 2.
Model 2 of Table 4 shows the effect of the service sector on SMEs’ engagement in eco-design
products and services. SMEs active in the service sector have a lower probability of
engagement in eco-design products and services compared to other sectors. This finding is
29
consistent with hypothesis 1.
Model 1 of Table 4 shows the effect of control variables on SMEs’ engagement in eco-design
products and services. First, if SMEs engage in eco-design processes, compared to no
engagement, they have a higher probability of engagement in eco-design products and
services as well. The more SMEs engage in eco-design processes, the higher the probability
of engaging in eco-design products and services. Second, firm size measured by the number
of employees is not significant. Third, firm age is not significant. Fourth, SMEs implementing
EMS have a higher probability of engagement in eco-design processes. The findings for
control variables remain the same in model 2.
In subsequent analyses, the sample will only exist of firms operating in the service sector.
Therefore, the results presented below are only applicable to SMEs in the service sector.
Model 2 of Table 5 shows the effect of the individual industries within the service sector on
SMEs’ engagement in eco-design processes. SMEs active in industry ‘Professional, scientific
and technical activities’ have a lower probability of engagement in eco-design processes
compared to the Accommodation industry. Other service sector industry dummies turn out to
be insignificant, meaning that the Transport industry and the Financial industry do not
statistically differ from the Accommodation industry regarding engagement in eco-design
processes. Therefore, this thesis cannot draw conclusions on the engagement in eco-design
processes for the industries of interest as hypothesized in hypothesis 2, 3 and 4. However, the
engagement in eco-design products and services for the industries of interest will be discussed
in the next subsection.
Model 1 of Table 5 shows the effect of control variables on SMEs’ engagement in eco-design
processes. First, if SMEs’ engage in eco-design products and services, compared to no
engagement, they have a higher probability of engagement in eco-design processes. Second,
SMEs employing 10-49 or 50-249 people have a higher probability of engagement in eco-
design processes compared to SMEs employing 1-9 people. Third, firm age is not significant.
Fourth, SMEs implementing EMS have a higher probability of engagement in eco-design
processes. The findings for control variables remain the same in model 2.
Model 2 of Table 6 shows the effect of the individual industries within the service sector on
SMEs’ engagement in eco-design products and services. SMEs active in the Transport
industry as well as the Financial industry have a lower probability of engagement in eco-

30
design products and services compared to the Accommodation industry. It turns out that the
Accommodation industry is more likely to engage in eco-design products and services
compared to the Transport and Financial industries. This finding is consistent with hypothesis
5. Furthermore, SMEs active in the Transport industry have a higher probability of
engagement in eco-design products and services compared to the Financial industry. This
finding is consistent with hypothesis 6. SMEs active in the Financial industry have the lowest
probability of engagement in eco-design products and services compared to other industries
within the service sector. This finding is consistent with hypothesis 7, which states that SMEs
active in the Financial industry are least likely to engage in eco-design products and services.
Other service sector industry dummies turn out to be insignificant, meaning that those
industries do not significantly differ from the Accommodation industry regarding engagement
in eco-design products and services.
Model 1 of Table 6 shows the effect of control variables on SMEs’ engagement in eco-design
products and services. First, if SMEs’ engage in eco-design processes, compared to no
engagement, they have a higher probability of engagement in eco-design products and
services. Second, firm size measured by the number of employees is not significant. Third, the
effect of firm age on eco-design products and services is not significant. Fourth, SMEs
implementing EMS have a higher probability of engagement in eco-design products and
services. The findings for control variables remain the same in model 2.

31
6. Conclusion and Discussion
This thesis examines the influence of industries within the service sector on SMEs’
engagement in eco-design practices. Two types of eco-design practices are distinguished: eco-
design products and services and eco-design processes. The results indicate that SMEs active
in the service sector are less likely to engage in eco-design practices. Consistent with the
expectations, this result corresponds with earlier studies showing that the service sector has
marginal financial incentives (Simpson et al., 2004) and a low visibility (Grove et al., 1996).
Contrary to the expectations, the results show insignificant outcomes for the industries of
interest within the service sector regarding eco-design processes. The Transport industry, the
Accommodation industry as well as the Financial industry are equal likely to engage in eco-
design processes. Hypotheses based on resource intensity do not hold for individual industries
within the service sector. The finding that resource-intensive sectors are more likely to engage
in eco-design processes (Rademaekers et al., 2011; Schleich and Gruber, 2008) does not seem
to be translatable to industries within the service sector. It might be that differences in
resource intensity are smaller for those industries. Resource-intensive sectors like
manufacturing show larger differences between industries regarding resource intensity in
relation to other sectors (Rademaekers et al., 2011).
Consistent to the expectations, the results show that SMEs active in the Accommodation
industry are most likely to engage in eco-design products and services. This result
corresponds with earlier studies showing that this industry has gained the most ground
regarding eco-design products and services due to the offering of organic food products
(Butler et al., 2004) and eco-products in hotels (Graci and Dodds, 2008). The Transport
industry is more likely to engage in eco-design products and services compared to the other
industries. The Transport industry is very competitive, which makes it attractive for firms to
distinguish from competitors by introducing more efficient transport modes. This finding is
supported by Price (2009) stating that fuel mixes are being developed in order to become
more efficient. Also, the Transport industry is highly visible compared to other industries
within the service sector regarding sustainability issues (Price, 2009). Consistent to the
expectations, this thesis finds support for the argument that the Financial industry is least
likely to engage in eco-design products and services compared to the other industries. This
result corresponds with earlier research stating that the Financial industry is investing in

32
‘green’ credit products and funds on a very small scale (Jeucken, 2001; Schaltegger and
Figge, 2001).
This thesis intended to examine the influence of industries within the service sector on SMEs’
engagement in eco-design practices. Since SMEs in the service sector are identified as less
likely to engage in eco-design practices, this sector has to be addressed properly by policy
makers and governments. First, industries do not seem to differ regarding the adoption of eco-
design processes. Therefore, policies and regulations regarding resource efficiency should be
aimed at the service sector as a whole. Second, The Financial industry turns out to be least
likely to engage in eco-design products and services. This finding under scribes the need to
develop strict environmental regulation focused on a limited maximum emissions intensity
(Jeucken, 2001) and further subsidization of ‘green’ credit products and funds (Schaltegger
and Figge, 2001). The uncertain financial performance of ‘green’ credit products and funds,
as identified by Birkensleigh et al. (2013), further addresses the need for subsidization.
Moreover, the high potential of the Financial industry to tackle environmental degradation, as
identified by Jeucken (2001), calls for an industry-specific approach to stimulate the
development of eco-design products and services. Policy makers could stimulate
environmental transparency throughout the Financial industry in order to raise competitive
sustainable behavior. Further research is needed to examine why the Financial industry is not
yet investing in developing eco-design products and services.
Since this thesis focuses on the service sector and its industries, it is hard to draw conclusions
on individual firms. The NACE classification offers a more detailed subdivision of industries.
For instance, the Financial industry consists of very diverse firms: banks, insurance firms and
pension funds. Further research could focus on the subdivision within the Financial industry,
in order to provide policy makers and governments with a more detailed recommendation on
which firms are underperforming regarding eco-design products and services. Moreover, this
thesis only analyzed European firms. The Financial industry in North America has been more
exposed to environmental legislation compared to Europe (Jeucken, 2001). This finding
addresses the need to compare the success of environmental legislation in order for firms to
adopt eco-design. Policy makers and governments can find the optimal degree of
environmental legislation when analyzing more environmental-friendly developed countries
or continents, such as North America (Jeucken, 2001). To conclude, this thesis provides
several contributions to existing literature. This is the first research focusing on SMEs within

33
the service sector in a cross-country setting. The findings under scribed the importance of the
service sector to decrease environmental degradation. By analyzing firms throughout Europe,
recommendations for policies and regulations are interesting for the EU as well. Furthermore,
domestic regulation has to be approved by the EU and strengthens the need for focused cross-
country regulation. Second, SMEs active in the Financial industry are underperforming
regarding the adoption of eco-design products and services compared to other industries
within the service sector. This finding addresses the need to stimulate SMEs active in the
Financial industry into engaging in eco-design products and services.

34
Reference list
Andersson, L. M. & Bateman, T. S. (2000): Individual environmental initiative: Championing natural
environmental issues in U.S. business organizations. Academy of Management Journal, 43: 548-570.
Aoe, T. (2007). Eco-efficiency and ecodesign in electrical and electronic products. Journal of Cleaner
Production, 15(15), 1406-1414.
Aragon-Correa, J.A. (1998): Strategic proactivity and firm approach to the natural environment. Academy of
Management Journal 41, 556–567.
Aragon-Correa, J. A., Hurtado-Torres, N., Sharma, S., & García-Morales, V. J. (2008): Environmental strategy
and performance in small firms: A resource-based perspective. Journal of environmental management, 86(1),
88-103.
Azzone, G., Brophy, M., Noci, G., Welford, R., & Young, W. (1997): A stakeholders' view of environmental
reporting. Long Range Planning, 30(5), 699-709.
Bauman, A., Sallis, J. F. & Owen, N. (2002): Environmental and policy measurement in physical activity
research. Physical Activity Assessments for Health-Related Research. pp. 241-251.
Bellegem van T. (2001): The green fund system in the Netherlands. In Sustainable Banking. The Greening of
Finance, Greenleaf: Sheffield; 234–244.
Berry, L.L. (1980): Services marketing is different. Business, Vol. 30, May-June, pp. 24-9.
Bianchi, R. & Noci, G. (1998): Greening SMEs’ competitiveness. Small Business Economics 11, 269–281
Birkensleigh, S., Proske, C., Kazakoff, E. & Kendrick, J. (2013): The role of Australia’s financial sector in
sustainability. For Environment Australia, prepared by PriceWaterHouse Coopers.
Boehlje, M. (1993): Environmental Regulation and Corporate Policy. Agribusiness 9(5), 495-508.
Bohdanowicz, P., (2005): European hoteliers’ environmental attitudes. Cornell Hotel and Restaurant
Administration Quarterly 46 (2), 188–204.
Brezet H. (1997): Dynamics in ecodesign practice. Industry and Environment (UNEP IE); 20(1-2):21–4.
Butler, G, H. Newton, Bourlakis, M. & Leifert, C. (2004): Factors Influencing Supply and Demand for Organic
Foods. Food Supply Chain Management, pp. 199-210.

35
Buysse, K. & Verbeke, A. (2003): Proactive environmental strategies: a stakeholder management
perspective. Strategic Management Journal, 24(5), 453-470.
Carlson-Skalak, S. (2000): E-Media’s Global zero: design for environment in a small firm. Interfaces 30, 66–83.
Carroll, A. B. (1999): Corporate social responsibility evolution of a definitional construct. Business &
Society, 38(3), 268-295.
Centre for Retail Research (2012). Report: Retail Ethics and Green Retailing 2012.
Céspedes-Lorente, J., Burgos-Jiménez, J. D., & Álvarez-Gil, M. J. (2003): Stakeholders’ environmental
influence. An empirical analysis in the Spanish hotel industry. Scandinavian Journal of Management, 19(3),
333-358.
Chan, E. S. W., & Wong, S. C. K. (2006): Motivations for ISO 14001 in the hotel industry. Tourism
Management, 27(3), 481-492.
Christmann, P. (2004): Multinational companies and the natural environment: Determinants of global
environmental policy. Academy of Management Journal,47(5), 747-760.
Cole, M. A., Rayner, A. J., & Bates, J. M. (1997): The environmental Kuznets curve: an empirical
analysis. Environment and development economics, 2(4), 401-416.
Constantinos, C., Sørensen, S.Y., Larsen, P. B. & Alexopoulou, S. (2010): SMEs and the environment in the
European Union. European Commission
Darnall, N., Henriques, I., & Sadorsky, P. (2010). Adopting proactive environmental strategy: the influence of
stakeholders and firm size. Journal of Management Studies, 47(6), 1072-1094.
Delmas, M., & Toffel, M. W. (2004). Stakeholders and environmental management practices: an institutional
framework. Business Strategy and the Environment, 13(4), 209-222.
Driffield, N., Jones, C., Crotty, J. (2013): International business research and risky investments, an analysis of
FDI in conflict zones, International Business Review, Vol.22., pp. 140-155.
European Environment Agency (EEA) (2013): Trend and Projections in Europe 2013: Tracking Progress
Towards Europe’s Climate and energy targets until 2020. Executive summary. No 10/2013
Elkington J. (1994): Toward the sustainable corporation: win-win-win business strategies for sustainable
development. Calif Manage Rev; 36(2):90–100.
Eltayeb, T. K., & Zailani, S. (2009): Going green through green supply chain initiatives towards environmental
sustainability. Operations and Supply Chain Management, 2(2), 93-110.

36
Eurobarometer Flash 367 (2013): Attitudes of Europeans towards building the single market for green products.
European Commission
European Commission (2008): A ‘Small Business Act’ for Europe. Office for Official Publications of the
European Communities
European Environment Agency (2013), ‘Final Energy Consumption by sector in the EU-27’, assessment
published February 2013
Eurostat (2012). National Accounts – main GDP aggregates and related indicators in the EU. Data from October
2012.
Font, X. (2002): Environmental certification in tourism and hospitality: progress, process, and prospects.
Tourism Management, 23(3), 197-205.
Fox, M. W. (1997): Eating with Conscience: The Bioethics for Food. New Sage Press, Troutdale, OR
Flannery, B. L. & May, D. R. (2000): Environmental ethical decision making in the U.S. metal-finishing
industry. Academy of Management Journal 43, 642–662.
Gadenne, D. L., Kennedy, J., & McKeiver, C. (2009): An empirical study of environmental awareness and
practices in SMEs. Journal of Business Ethics, 84(1), 45-63.
Gagliardi, D., Muller P. & Glossop, E. (2013): Annual Report on European SMEs 2012/2013: A recovery on the
horizon? European Commission
Goodman, A. (2000): Implementing Sustainability in Service Operations in Scandic Hotels. Interfaces, 30, 3,
202–214.
Gossling, S., Peeters, P., Ceron, J.P., Dubois, G., Patterson, T. & Richardson, R. B. (2004): The
Eco-efficiency of Tourism, Ecological Economics, 54(15): 417-434.
Graafland, J., Van de Ven, B., & Stoffele, N. (2003): Strategies and instruments for organising CSR by small
and large businesses in the Netherlands. Journal of Business Ethics, 47(1), 45-60.
Graci, S., & Dodds, R. (2008): Why go green? The business case for environmental commitment in the Canadian
hotel industry. Anatolia, 19(2), 251-270.
Graves, S. B. & Waddock, S. A. (1994): Institutional owners and corporate social performance. Academy of
Management Journal, 37(4), 1034-1046.
Greene, D. L. & Wegener, M. (1997): Sustainable transport. Journal of Transport Geography, 5(3), 177-190.
Greening, D.W. & Gray, B. (1994): Testing a model of organizational response to social and political issues.
Academy of Management Journal 37, 467–498.

37
Grove, S. J., Fisk, R. P., Pickett, G. M., & Kangun, N. (1996): Going green in the service sector: Social
responsibility issues, implications and implementation. European journal of marketing, 30(5), 56-66.
Hart S. (1995): Natural-resource-based view of the firm. Academy of Management Review 20(4): 986-1014.
Hillary, R. (2000): Small and Medium-Sized Enterprises and the Environment. Greenleaf, Sheffield
Hoogendoorn, B., Guerra, D. & Zwan, van der P. (2014): What drives environmental practices of SMEs?
Unpublished. Eramus School of Economics, Rotterdam. Panteia/EIM, Zoetermeer.
Ittner, C. D., Larcker, D. F., & Randall, T. (2003): Performance implications of strategic performance
measurement in financial services firms. Accounting, Organizations and Society, 28(7), 715-741.
Jeswiet, J., & Hauschild, M. (2005): EcoDesign and future environmental impacts. Materials & Design,
Elsevier. 26(7), 629-634.
Jeucken, M. (2010): Sustainable finance and banking: the financial sector and the future of the planet.
Routledge.
Kasim, A. (2007): Towards a wider adoption of environmental responsibility in the hotel sector. International
Journal of Hospitality and Tourism, 8(2), 25-49.
King, A. & Michael J. (2001): "Does it really pay to be green? An empirical study of firm environmental and
financial performance: An empirical study of firm environmental and financial performance." Journal of
Industrial Ecology 5.1: 105-116.
Kirk, D. (1995): Environmental Management in Hotels, International Journal of Contemporary Hospitality
Management, 7(6): 3-8.
Knight, P. & Jenkins, J.O. (2009): Adopting and applying eco-design techniques: a practitioners perspective.
Journal of Cleaner Production, 17: 549-558
Knowles, T., Macmillan, S., Palmer, J., Grabowski, P., & Hashimoto, A. (1999): The development of
environmental initiatives in tourism: responses from the London hotel sector. International Journal of Tourism
Research, 1(4), 255e265
Labonne,, J. (2006): A comparative analysis of the environmental management, performance and innovation of
SMEs and larger firms. European Commission
Langager, C. (2009): Definition industries. http://www.investopedia.com/ask/answers/05/industrysector.asp
Lawrence, S. R., Collins, E., Pavlovich, K., & Arunachalam, M. (2006): Sustainability practices of SMEs: the
case of NZ. Business strategy and the environment, 15(4), 242-257.
Liefferink, D., & Andersen, M. S. (1998). Strategies of the'green'member states in EU environmental policy-
making. Journal of European Public Policy, 5(2), 254-270.

38
Lin, C. Y., & Ho, Y. H. (2008):. An empirical study on logistics service providers’ intention to adopt green
innovations. Journal of Technology Management & Innovation, 3(1), 17-26.
Mairet, N., & Decellas, F. (2009): Determinants of energy demand in the French service sector: A decomposition
analysis. Energy Policy, 37(7), 2734-2744.
Maloni, M. J., & Brown, M. E. (2006): Corporate social responsibility in the supply chain: an application in the
food industry. Journal of business ethics,68(1), 35-52.
McWilliams, A., & Siegel, D. (2001): Corporate social responsibility: A theory of the firm perspective. Academy
of management review, 26(1), 117-127.
Melnyk, S.A., Sroufe, R.P. & Calantone, R.L. (2003): Assessing the impact of environmental management
systems on corporate and environmental performance. Journal of Operations Management 21, 329–351.
Montiel, I. (2008): Corporate social responsibility and corporate sustainability separate pasts, common
futures. Organization & Environment, 21(3), 245-269.
Neubaum, D., Mitchell, M., & Schminke, M. (2004). Firm newness, entrepreneurial orientation, and ethical
climate. Journal of Business Ethics, 52(4), 335-347.
National Research Council (2003): Design for environment guide. Industrial Research Assistance Program,
Canada.
Orsato, R. J. (2006): When does it pay to be green? California Management Review, 48(2), 128
Perrini, F. (2006): SMEs and CSR theory: evidence and implications from an Italian perspective. Journal of
Business Ethics, 67(3), 305-316.
Porter, M. E., Linde, van der C. (1995): Toward a new conception of the environment—competitiveness
relationship. Econ Perspect; 9(4):97–118.
Porter, M.E. (1980): Competitive Strategy: Techniques for Analysing Industries and Competitors. Free Press:
New York.
Preuss, L. (2010): Tax avoidance and corporate social responsibility: you can’t do both, or can you? Corporate
Governance, Vol. 10., No. 10, pp. 365-374.
Price, H. (2009): Supporting Solutions for Secure and Sustainable Aviation. Commercial Aviation Alternative
Fuels Initiative (CAAFI), Federal Aviation Administration (FAA. Accessed August 2th, 2014
Rademaekers, K., Asaad, S.S.Z. & Berg, J (2011): Study of the Competitiveness of the European Companies
and Resource Efficiency. European Commission

39
Ramus, C.A. & Steger, U. (2000): The roles of supervisory support behaviors and environmental policy in
employee ‘eco-initiatives’ at leading-edge European companies. Academy of Management Journal 43, 605–626.
Revell, A. & Blackburn, R. (2007): The business case for sustainability? An examination of small firms in the
UK's construction and restaurant sectors. Business strategy and the environment, 16(6), 404-420.
Rodriguez, P., Siegel, D. S., Hillman, A., & Eden, L. (2006): Three lenses on the multinational enterprise:
politics, corruption, and corporate social responsibility. Journal of International Business Studies, 37(6), 733-
746.
Rondinelli, D. A. (2004): Creating a vision for environmental responsibility in multinational corporations:
Executive leadership and organizational change. Journal of International Business Education, 1(1), 5-22.
Rondinelli, D. A., & Berry, M. A. (2000). Environmental citizenship in multinational corporations: social
responsibility and sustainable development.European Management Journal, 18(1), 70-84.
Rondinelli, D. A. & Vastag, G. (1996): International Environmental Standards and Corporate Policies: An
Integrative Framework. California Management Review, 39, 1, 106–122.
Rosenblum, J., Horvath, A., & Hendrickson, C. (2000): Environmental implications of service
industries. Environmental Science & Technology, 34(22), 4669-4676.
Russo, M.V. & Fouts, P.A. (1997): A resource-based perspective on corporate environmental performance and
profitability. Academy of Management Journal 40, 534–559
Rutherfoord, R., Blackburn, R.A. & Spence, L.J. (2000): Environmental management and the small firm: an
international comparison.International Journal of Entrepreneurial Behaviour and Research 6, 310–325.
Sarkis, J., Gonzalez-Torre, P. & Adenso-Diaz, B. (2010): Stakeholder pressure and the adoption of
environmental practices: The mediating effect of training. Journal of Operations Management, 28(2), 163-176.
Sarkis, J., Zhu, Q., & Lai, K. H. (2012): Green supply chain management innovation diffusion and its
relationship to organizational improvement: An ecological modernization perspective. Journal of Engineering
and Technology Management, 29(1), 168-185.
Schaper, M. (2002): Small firms and environmental management: predictors of green purchasing in Western
Australian pharmacies. International Small Business Journal 20, 235–251.
Schaltegger S., Figge F. (2001): Sustainable development funds: progress since the 1970s. In Sustainable
Banking. The Greening of Finance, Greenleaf. Sheffield; 203–210
Schleich, J. & Gruber, E. (2008): Beyond case studies: Barriers to energy efficiency in commerce and the
services sector. Energy Economics, 30(2), 449-464.

40
Schot, J. & Fischer, K. (1993): Introduction: the greening of the industrial firm. Environmental strategies for
industry, 3-36.
Sharma, S., (2000): Managerial interpretations and organizational context as predictors of corporate choice of
environmental strategy. Academy of Management Journal 43, 681–697.
Sharma, S. & Vredenburg, H. (1998): Proactive corporate environmental strategy and the development of
competitively valuable organizational capabilities. Strategic Management Journal 19, 729–753.
Shostack, G.L. (1987): Service positioning through structural change. Journal of Marketing,
Vol. 51, January, pp. 34-43.
Shrivastava, P. (1995): The Role of Corporations in Achieving Ecological Sustainability. Academy of
Management Review, 20, 4, 936–960.
Shrivastava, P., (1995): Environmental technologies and competitive advantage. Strategic Management Journal
16, 183–200.
Simpson, M., Taylor, N., & Barker, K. (2004): Environmental responsibility in SMEs: does it deliver
competitive advantage? Business Strategy and the Environment, 13(3), 156-171.
Sloan, P., Legrand, W., Tooman, H., & Fendt, J. (2009): Best practices in sustainability: German and Estonian
hotels. Advances in hospitality and leisure,5, 89-107.
Stanwick, P. A. & Stanwick, S. D. (1998): The relationship between corporate social performance, and
organizational size, financial performance, and environmental performance: An empirical examination. Journal
of business ethics, 17(2), 195-204.
Stipanuk, D. M. (2002): Hospitality facilities management and design. Educational Institute of the American
Hotel & Lodging Association.
Turban, D. B., & Greening, D. W. (1997): Corporate social performance and organizational attractiveness to
prospective employees. Academy of management journal, 40(3), 658-672.
Tukker, A., Eder, P., Charter, M., Haag, E., Vercalsteren, A., & Wiedmann, T. (2001): Eco-design: the state of
implementation in Europe–conclusions of a state of the art study for IPTS. The Journal of Sustainable Product
Design, 1(3), 147-161.
Tzschentke, N., Kirk, D., & Lynch, P. A. (2008): Going green: decisional factors in small hospitality operations.
International Journal of Hospitality Management, 27(1), 126-133.
Uhlaner, L. M., Berent-Braun, M. M., Jeurissen, R. J. & de Wit, G. (2012): Beyond size: Predicting engagement
in environmental management practices of Dutch SMEs. Journal of Business Ethics, 109(4), 411-429.

41
UNEP: United Nations Environmental Program (2010): Annual Report 2010. UNEP Division of
Communications and Public Information
United Nation Statistics Division (2014): Accessed June 22th, 2014 on
https://unstats.un.org/unsd/cr/registry/regcs.asp?Cl=27&Lg=1&Co=55
US Department of Agriculture (2005): National Organic Program, http://www.ams.usda.gov/. Accessed 7th
of
July 2014
Veen-Groot, van D. B., & Nijkamp, P. (1999): Globalisation, transport and the environment: new perspectives
for ecological economics. Ecological Economics, 31(3), 331-346.
Williamson D., Lynch-Wood G. & Ramsay J. (2006): Drivers of environmental behavior in manufacturing
SMEs and the implications for CSR. Journal of Business Ethics 67: 317–330.
Weber, O. (2005): Sustainability benchmarking of European banks and financial service organizations.
Corporate Social Responsibility and Environmental Management, 12(2), 73-87.
Williamson, D., Lynch-Wood, G., (2001): A new paradigm for SME environmental practice. TQM Magazine 13,
424–432.
Williamson, O. E. (1991): Strategizing, economizing, and economic organization. Strategic Management
Journal, 12(S2), 75-94.
Wolf, C., & Seuring, S. (2010): Environmental impacts as buying criteria for third party logistical services.
International Journal of Physical Distribution & Logistics Management, 40(1/2), 84-102.
Wu, H. J. & Dunn, S. C. (1995): Environmentally responsible logistics systems. International
Journal of Physical Distribution & Logistics Management, Vol. 25 No. 2, pp. 20-38.
Van Hemel, C. G. & Brezet, J.C. (1997): Ecodesign: a promising approach to sustainable production and
consumption. United Nations Environmental Program (UNEP)
Zhu, Q., Sarkis, J. & Lai, K. H. (2007): Green supply chain management: pressures, practices and performance
within the Chinese automobile industry. Journal of Cleaner Production, 15(11), 1041-1052.

42
Table 3: Ordered logit estimation results with eco-design processes as dependent
variable. Full sample
a) Standard errors in parentheses b) Ordered dependent variable eco-design processes: 1) 0% of annual turnover; 2) 1%-10% of annual
turnover; 3) 11%-50% of annual turnover; 4) >50% of annual turnover. c)
Other sectors include Manufacturing, Retail and Industry * p < 0.05,
** p < 0.01,
*** p < 0.001
(1) (2)
Baseline model Full model
Service sector dummy
-0.224**
(0.08)
Control variables
Eco-design products/services
(0% of annual turnover) (ref.)
1-10% of annual turnover
0.873***
0.864***
(0.10) (0.10)
11-50% of annual turnover 1.128
*** 1.122***
(0.14) (0.14)
>50% of annual turnover 1.472
*** 1.445***
(0.13) (0.13)
Firm size: 0-9 employees
(ref.)
10-49 employees
0.361***
0.366***
(0.08) (0.08)
50-249 employees 0.381*** 0.389
***
Firm age: 1-5 years
(ref.)
6-9 years
10-19 years
19+ years
(0.09)
0.092
(0.13)
0.179
(0.11)
0.232*
(0.11)
(0.09)
0.096
(0.13)
0.180
(0.11)
0.216*
(0.11)
Dummy Environmental
Management System 1.357
***
(0.08) 1.343
***
(0.09)
Country Dummies
YES
YES
Observations 5630 5630 Pseudo R
2 0.1414 0.1425

43
Table 4: Ordered logit estimation results with eco-design products and services as
dependent variable. Full sample
(1) (2)
Baseline model Full model
Service sector dummy
Control variables
Eco-design processes
(0% of annual turnover) (ref.)
1-10% of annual turnover
2.440***
(0.08)
-0.378***
(0.07)
2.432***
(0.08)
11-50% of annual turnover 3.061
*** 3.062***
(0.13) (0.13)
>50% of annual turnover 3.883
*** 3.847***
(0.30) (0.30)
Firm size: 0-9 employees
(ref.)
10-49 employees -0.022 -0.011 (0.07) (0.07)
50-249 employees 0.069 0.094
Firm age: 1-5 years
(ref.)
6-9 years
10-19 years
19+ years
(0.08)
-0.042
(0.12)
-0.004
(0.9)
-0.085
(0.9)
(0.08)
-0.037
(0.12)
-0.004
(0.9)
-0.113
(0.9)
Dummy Environmental
Management System 0.336
***
(0.06) 0.317
***
(0.06)
Country Dummies YES YES Observations 9911 9911 Pseudo R
2 0.1541 0.1564 Standard errors in parentheses
a) Standard errors in parentheses b) Ordered dependent variable eco-design products and services: 1) 0% of annual turnover; 2) 1%-10% of annual
turnover; 3) 11%-50% of annual turnover; 4) >50% of annual turnover. c)
Other sectors include Manufacturing, Retail and Industry
* p < 0.05,
** p < 0.01,
*** p < 0.001

44
Table 5: Ordered logit estimation results with eco-design processes as dependent
variable. Service sector sample, other sectors excluded.
(1) (2)
Baseline
model
Full model
Accommodation industry dummy (ref.)
Transportation industry dummy
Financial industry dummy
Information industry dummy
Real Estate industry dummy
Professional industry dummy
Control variables
Eco-design products and services
(0% of annual turnover) (ref.)
-0.243
(0.22)
-0.271
(0.32)
-0.276
(0.26)
-0.069
(0.26)
-0.436*
(0.20)
1-10% of annual turnover 0.875***
(0.22)
0.844***
(0.22)
11-50% of annual turnover 1.459***
1.466***
(0.28) (0.28)
>50% of annual turnover 1.774***
1.801***
(0.32) (0.32)
Firm size: 0-9 employees
(ref.)
10-49 employees 0.287 0.258
(0.15) (0.15)
50-249 employees 0.466**
0.433*
Firm age: 1-5 years
(ref.)
6-9 years
10-19 years
19+ years
(0.19)
0.056
(0.23)
0.213
(0.20)
0.230
(0.9)
(0.19)
0.050
(0.23)
0.206
(0.20)
0.215
(0.9)
Dummy Environmental Management
System
1.627***
(0.18)
1.619***
(0.18)
Country Dummies YES YES

45
Observations 1435 1435
Pseudo R2 0.1794 0.1819
a) Standard errors in parentheses b) Ordered dependent variable eco-design processes: 1) 0% of annual turnover; 2) 1%-10% of annual
turnover; 3) 11%-50% of annual turnover; 4) >50% of annual turnover.
* p < 0.05,
** p < 0.01,
*** p < 0.001
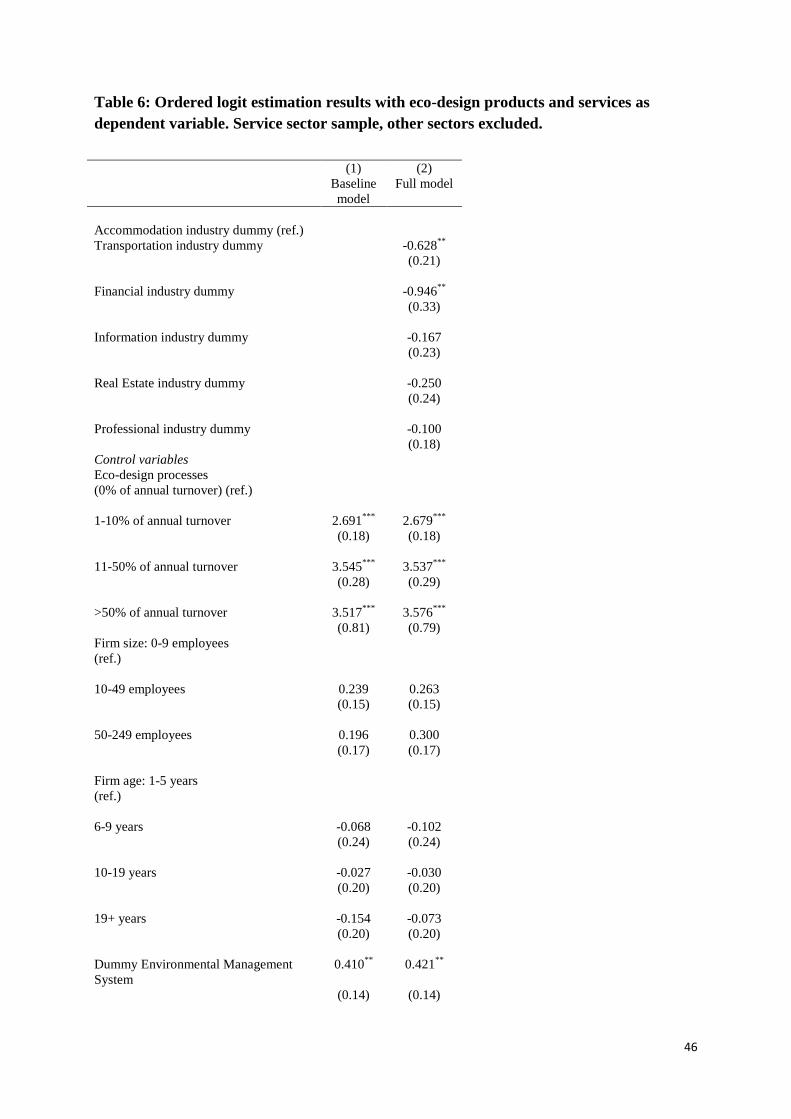
46
Table 6: Ordered logit estimation results with eco-design products and services as
dependent variable. Service sector sample, other sectors excluded.
(1) (2)
Baseline
model
Full model
Accommodation industry dummy (ref.)
Transportation industry dummy
Financial industry dummy
Information industry dummy
Real Estate industry dummy
Professional industry dummy
Control variables
Eco-design processes
(0% of annual turnover) (ref.)
-0.628**
(0.21)
-0.946**
(0.33)
-0.167
(0.23)
-0.250
(0.24)
-0.100
(0.18)
1-10% of annual turnover 2.691***
2.679***
(0.18) (0.18)
11-50% of annual turnover 3.545***
3.537***
(0.28) (0.29)
>50% of annual turnover 3.517***
3.576***
(0.81) (0.79)
Firm size: 0-9 employees
(ref.)
10-49 employees 0.239 0.263
(0.15) (0.15)
50-249 employees 0.196 0.300
Firm age: 1-5 years
(ref.)
6-9 years
10-19 years
19+ years
(0.17)
-0.068
(0.24)
-0.027
(0.20)
-0.154
(0.20)
(0.17)
-0.102
(0.24)
-0.030
(0.20)
-0.073
(0.20)
Dummy Environmental Management
System
0.410**
0.421**
(0.14)
(0.14)

47
Country Dummies YES YES
Observations 2615 2615
Pseudo R2 0.1904 0.1963
a) Standard errors in parentheses b) Ordered dependent variable eco-design products and services: 1) 0% of annual turnover; 2) 1%-10% of annual
turnover; 3) 11%-50% of annual turnover; 4) >50% of annual turnover.
* p < 0.05,
** p < 0.01,
*** p < 0.001

48
Appendices
Appendix 1: Definitions and descriptives of dependent variables and control variables
for all sectors. Numbers represent % of SMEs belonging to a specific category.
Variable Categories / Answer options %
Dependent variables
Eco-design processes
Over the past two years, how much have
you invested on average per year to be more
resource efficient?
Does not engage in eco-design processes (ref.)
1-10% of annual turn-over
11-50% of annual turn-over
More than 50% of annual turn-over
14
78
7
1
Eco-design products and services
How much do green products or services
represent in your turn-over (latest available
fiscal year)?
Does not offer eco-design products and services (ref.)
1-10% of annual turn-over
11-50% of annual turn-over
More than 50% of annual turn-over
82
9
4
5
Control variables
EMS
Does your company use one or more of
these environmental management systems?
No
Yes
65
35
Firm size
Measured by number of employees 0-9 employees (ref.)
10-49 employees
50-249 employees
45
34
21
Firm age
Measured by number of years 1-5 years
6-9 years
10-19 years
More than 19 years
14
12
31
43
Source: Flash Eurobarometer survey on “SMEs, resource efficiency, and green markets” (no. 342), 2012.

49
Appendix 2: Definitions and descriptives of dependent variables and control variables
for the service sector. Numbers represent % of SMEs belonging to a specific category.
Variable Answer options %
Dependent variables
Eco-design processes
Over the past two years, how much have
you invested on average per year to be more
resource efficient?
Does not engage in eco-design processes (ref.)
1-10% of annual turn-over
11-50% of annual turn-over
More than 50% of annual turn-over
19
74
6
1
Eco-design products and services
How much do green products or services
represent in your turn-over (latest available
fiscal year)?
Does not offer eco-design products and services (ref.)
1-10% of annual turn-over
11-50% of annual turn-over
More than 50% of annual turn-over
86
7
4
3
Control variables
EMS
Does your company use one or more of
these environmental management systems?
No
Yes
69
31
Firm size
Measured by number of employees 0-9 employees (ref.)
10-49 employees
50-249 employees
45
35
20
Firm age
Measured by number of years 1-5 years
6-9 years
10-19 years
More than 19 years
17
14
32
37
Source: Flash Eurobarometer survey on “SMEs, resource efficiency, and green markets” (no. 342), 2012.