the use of leasing amongst european smes...industrial equipment dominated smes’ total equipment...
TRANSCRIPT

1

The Use of Leasing Amongst European SMEs
July 2015

The Use of Leasing Amongst European SMEs
July 2015
Acknowledgments
Leaseurope wishes to recognise the support received from Netsol, a global provider of enterprise IT
solutions, with core focus on asset finance, wholesale finance and leasing software.
Benefactors
As shown throughout this report, leasing is a crucial form of finance for SMEs. Leaseurope is grateful for the
contribution of the following European leasing companies who have subscribed to the report’s benefactors
programme:
ABN AMRO Lease
ALD Automotive
Alphabet International
Banco Santander
BCC Lease
Belfius Lease
BNP Paribas Leasing Solutions
Deutsche Leasing
DnB Finans
GE Capital
ING Group Leasing & Factoring
Investec Asset Finance
LBBW Leasing
LeasePlan Corporation
Raiffeisen Leasing
Societe Generale Equipment Finance
Toyota Material Handling Europe

The Use of Leasing Amongst European SMEs
July 2015
Disclaimer
This report has been prepared by Oxford Economics for Leaseurope AISBL, the European Federation of
Leasing Company Associations.
All information in this report is copyright © Leaseurope AISBL. Any use of information must acknowledge the
source as follows “Oxford Economics, The Use of Leasing Amongst European SMEs, 2015. A report
prepared for Leaseurope.”
Because of the uncertainty of future events and circumstances and because the contents are based on data
and information provided by third parties upon which Oxford Economics has relied in producing this report in
good faith, Oxford Economics does not warrant that its advice, recommendations or the contents of this
report are accurate or achievable and neither Oxford Economics nor Leaseurope AISBL will be liable for the
contents of any of the foregoing or reliance thereon.

The Use of Leasing Amongst European SMEs
July 2015
Contents
Executive summary ...................................................................................................................... 1
Glossary of key terms and abbreviations ................................................................................... 7
1. Introduction and background .................................................................................................. 9
1.1 What is leasing? ...................................................................................................................................... 9
1.2 Evidence on the use of leasing ............................................................................................................. 10
1.2.1 Annual Statistical Enquiry (ASE) ................................................................................................. 10
1.2.2 Survey on the access to finance of enterprises (SAFE) ............................................................. 11
1.3 Objectives of the study .......................................................................................................................... 13
1.4 Methodology .......................................................................................................................................... 14
1.4.1 Approach ..................................................................................................................................... 14
1.4.2 Financial decision-makers within surveyed firms ........................................................................ 16
1.4.3 Expert Group consultation ........................................................................................................... 16
2. The market for leasing to European SMEs ........................................................................... 17
2.1 How many SMEs use leasing? .............................................................................................................. 17
2.1.1 Proportions using leasing by firm size ........................................................................................ 17
2.1.2 Proportions using leasing compared to other forms of finance ................................................... 18
2.1.3 Proportions using leasing across different countries .................................................................. 19
2.1.4 Proportions using leasing across sectors ................................................................................... 20
2.2 Leasing penetration ............................................................................................................................... 21
2.2.1 Penetration rates by country ....................................................................................................... 21
2.2.2 Leasing penetration by sector ..................................................................................................... 22
2.2.3 Leasing penetration by firm size ................................................................................................. 23
2.2.4 Leasing’s role compared to other forms of finance – penetration rates ...................................... 24
2.3 Have non-users used leasing in the past? ............................................................................................ 28
2.4 The size of the market for leasing by SMEs .......................................................................................... 29
3. What do SMEs lease, why and through which channels? ................................................... 32
3.1 What assets do SMEs lease? ............................................................................................................... 32
3.2 How do SMEs access leasing products? .............................................................................................. 36
3.3 Why do SMEs choose leasing? ............................................................................................................. 38
3.4 Why don’t SMEs use more leasing? ..................................................................................................... 43
4. The importance of leasing for exporting and growth firms ................................................. 46
4.1 Exporting SMEs ..................................................................................................................................... 46
4.1.1 Proportion of exporting SMEs ..................................................................................................... 46
4.1.2 Proportion of exporting lessees and non-users .......................................................................... 48
4.1.3 Leasing penetration rates for exporting SMEs ............................................................................ 49
4.2 Growth SMEs ........................................................................................................................................ 50

The Use of Leasing Amongst European SMEs
July 2015
4.2.1 Proportion of growth SMEs ......................................................................................................... 50
4.2.2 Proportion of growth lessees and non-users .............................................................................. 51
4.2.3 Leasing penetration rates for growth SMEs ................................................................................ 52
5. Leasing’s role in driving investment and growth ................................................................. 54
5.1 Do lessees invest more than non-users of leasing? ............................................................................. 54
5.1.1 Investment by firm size and sector.............................................................................................. 54
5.1.2 Investment by exporting and growth SMEs ................................................................................ 56
5.1.3 Leasing compared to other forms of finance ............................................................................... 57
5.2 SME life cycle and access to finance .................................................................................................... 57
5.3 Investment and leasing by European SMEs in 2014 ............................................................................ 58
6. Leasing’s contribution to future European economic growth ............................................ 62
6.1 Macro-economic impact of greater use of leasing by SMEs ................................................................. 62
6.1.1 Methodology for estimating the impact of more leasing by SMEs .............................................. 62
6.1.2 The macroeconomic impact of greater use of leasing by European SMEs ................................ 63
6.2 Leasing’s contribution to economic growth ........................................................................................... 67
Appendix 1: Survey sample ....................................................................................................... 68
Appendix 2: Interview questionnaire ......................................................................................... 69
Appendix 3: Detailed breakdown of survey results .................................................................. 73
Penetration rates by country and firm size ...................................................................................................... 73
Average investment by country, sector and lessee/non-user.......................................................................... 76
Penetration rates by age of firm and sector..................................................................................................... 77
Penetration rates by age of firm and country .................................................................................................. 79
Reasons why firms use leasing by sector ....................................................................................................... 80
Reasons why firms use leasing by country ..................................................................................................... 82
Reasons why firms don’t use more leasing ..................................................................................................... 83
Exporting and growth SMEs ............................................................................................................................ 85
Appendix 4: Leaseurope business investment penetration rate ............................................. 87
Appendix 5: Summary of production function methodology .................................................. 88
Appendix 6: Estimating SME investment spending ................................................................. 90
Bibliography and data sources .................................................................................................. 91

The Use of Leasing Amongst European SMEs July 2015
1
Executive summary
This report, written by Oxford Economics for Leaseurope, the federation representing the European leasing
industry, examines to what extent, how and why Europe’s small and medium sized enterprises (SMEs) use
leasing. This research provides an updated and extended analysis by building on the original pioneering
study conducted in November 2011. For the purpose of the report, SMEs are defined by number of
employees as is consistent with the European Commission definition1.
Leasing is a contractual agreement where a leasing company (lessor) makes an asset it owns available for
use by another party (a lessee), for a certain period of time and in exchange for payment.
Our report aims to quantify SMEs’ use of the various forms of leasing that exist in Europe over time and, as
such, builds on existing evidence with the goal of assisting policymakers and stakeholders in the SME
finance sphere in understanding the important role leasing plays in financing European SME investment.
The report is based on a survey of the use of leasing amongst European SMEs in 2013, with estimates for
2014, which was conducted throughout August-September 2014. Our survey partners, EFG Worldwide,
interviewed just under 3,000 SMEs across 9 industrial sectors and 8 countries (Germany, France, UK, Italy,
Spain, Netherlands, Poland and Sweden) – which together account for 82% of total EU economic output and
72% of the European leasing market.
European SMEs’ use of leasing
Leasing is clearly an increasingly vital source of SME finance. Of the SMEs surveyed, 42.5% used leasing in
2013, up from 40.3% in 2010. In 2014, the proportion is estimated to have risen further to 50.7%.
Broken down by SME size, 31.4% of micro firms used leasing compared to 45.7% of small firms and 52.5%
of medium sized firms in 2013. This is in line with other evidence that micro firms make less use of external
sources of finance than small and medium firms. Micro and small firms in particular rely on leasing, where
the proportion using this form of finance has risen since 2010.
1 Micro enterprises: 1-9 employees, small enterprises: 10-49, medium enterprises: 50-250 and large enterprises: over
250 employees.
2010
40.3%
2013
42.5%
0%
10%
20%
30%
40%
50%
60%
Micro Small Medium SMEs
2010
2013
Proportion of SMEs using leasing by firm size, 2010 and 2013
Source : Oxford Economics/EFG
2010
40.3%
2013
42.5%
0%
10%
20%
30%
40%
50%
Fa
cto
ring
Pri
va
te e
qu
ity/
ven
ture
ca
pital
Tra
de c
redit
Pe
rson
al fu
nd
s
Re
tain
ed
earn
ings
Lea
sin
g
Sh
ort
-te
rm c
red
it
Loa
n 1
-3 y
rs
Loa
n >
3 y
rs2010
2013
Proportion of SMEs using financing type, 2010 and 2013
Source : Oxford Economics/EFG

The Use of Leasing Amongst European SMEs July 2015
2
SMEs reported an increase in the use of all forms of finance in 2013 compared to 2010, except for personal
funds. After significant constraints during the difficult economic crisis period in 2010, access to bank lending
such as loans and short-term credit improved in 2013. Leasing has, however remained a reliable source of
finance over that time.
Our survey evidence also allows us to assess the share of SME investment financed by leasing and other
sources of funds (known as penetration rates). SMEs in the eight countries captured in our sample financed
18.9% of their total investment via leasing in 2013, more than any individual form of bank lending – up from
16.7% in 2010. This compares to a leasing penetration rate of 11.7% for businesses of all sizes in the same
countries (12.9% in 2010). SMEs therefore use leasing to finance a greater portion of their investment than
larger businesses, to an even greater extent in 2013 than previously.
The share of investment financed by leasing increases with the size of the SME. Penetration rates grew
between 2010 and 2013 across all SME size classes, particularly for micro firms. In 2013, micro firms
financed 15.4% of their total investment through leasing, a significant increase from 10.0% in 2010. The
proportion has also risen for small (from 16.4% to 17.2%) and medium sized firms (from 17.6% to 20.8%)
over the same period.
The share of SME investment financed by leasing is estimated to have grown from 18.9% in 2013 to 21.2%
in 2014. Meanwhile the share of all bank lending categories are estimated to have fallen in 2014, to 15.0%
for loans greater than 3 years, 9.4% for loans between 1-3 years and 6.7% for short-term credit. This
suggests that SMEs are increasingly seeking alternative forms of finance, such as leasing.
Of those SMEs that did not lease in 2013, 25.8% have done so in the past. Of those former lessees, 17.2%
intended to use leasing in 2014, indicating that SMEs that previously put their investments on hold are again
returning to leasing.
Our estimate of the total value of leasing by SMEs in the 8 countries surveyed is €73.6 billion for 2013. It is
estimated that micro and small firms account for over 60% of this leasing activity. Scaling up to the EU level
implies that the overall size of the market for leasing to SMEs in Europe is just over €103.6 billion in 2013.
Therefore, SME leasing accounted for 50% of total leasing to businesses in 2013. Combining the estimated
2014 penetration rates with forecasts for SME investment suggests the European SME leasing market will
be worth around €120.9 billion in new leasing volumes in 2014.
2010
16.7%
2013
18.9%
0%
5%
10%
15%
20%
25%
Micro Small Medium SMEs
2010
2013
Leasing penetration rates for SMEs by firm size, 2010 and 2013
Percentage of investment financed by leasing
Source : Oxford Economics/EFG

The Use of Leasing Amongst European SMEs July 2015
3
What assets do SMEs lease?
SMEs lease a wide range of assets, demonstrating that the leasing industry is able to finance almost all of
the different types of assets SMEs need to run their businesses. In 2013, vehicles remained the most
frequently leased asset type across all countries and economic sectors, and together with machinery and
industrial equipment dominated SMEs’ total equipment leasing expenditure.
Capital intensive industries such as agriculture, manufacturing, mining & utilities and construction, financed
larger sums of their machinery and industrial equipment through leasing, while firms in service sectors such
as professional services and real estate financed relatively higher amounts on ICT and office equipment.
Through which channels do SMEs lease?
European SMEs access their leasing through a range of distribution channels and our results show that, in
most cases, an SME is likely to use more than one channel. The vendor channel, where a customer obtains
a lease via the manufacturer or dealer of an asset, remains the most popular distribution channel, with its
use by SMEs increasing over time from 67.4% in 2010 to 78.6% in 2013. While use of the vendor channel
increased for all firm sizes, the likelihood of a micro size lessee accessing a lease via this channel has risen
substantially, emphasising the growing importance of the vendor channel for micro firms. In comparison, use
of the banking channel by SMEs, where leases are distributed from a leasing company through a banking
branch network, remained broadly stable at around 58%. The proportion of SMEs accessing leasing directly
from a leasing company also grew, from 35.9% in 2010 to 40.4% in 2013.
Why do SMEs lease?
Leasing’s intrinsic value lies in the fact that it is often a more readily accessible form of finance, particularly
for SMEs, as the lessor retains ownership of the asset and thus does not require any additional collateral,
although there are multiple additional benefits valued by smaller firms. SMEs taking part in our survey were
asked why they use leasing above other forms of finance, as well as why they do not use leasing more. All
reasons identified by respondents for using leasing score highly in 2013 and most have increased in
importance since 2010, particularly for micro firms. This indicates a growing appeal for leasing amongst
SMEs in many different circumstances with diverse business needs. While no single reason stands out
particularly, the price of financing an asset via leasing relative to other forms of finance remains the most
16.7% 18.6%
36.7%39.4%
31.2%28.3%
15.5% 13.8%
0%
10%
20%
30%
40%
50%
60%
70%
80%
90%
100%
2010 2011 (estimate)
Leasing Cash/Equity
Bank loans Other debt
Investment finance in 2010 and 2011, all SMEs
Percentage of investment
financed by:
Source : Oxford Economics/EFG
18.9% 21.2%
30.5% 29.1%
7.3% 6.7%
10.0% 9.4%
15.5% 15.0%
17.8% 18.6%
0%
10%
20%
30%
40%
50%
60%
70%
80%
90%
100%
2013 2014 (estimate)
Leasing Cash/Equity
Short-term credit Loan 1-3 yrs
Loan >3 yrs Other debt
Investment finance in 2013 and 2014, all SMEs
Percentage of investment financed by:
Source : Oxford Economics/EFG

The Use of Leasing Amongst European SMEs July 2015
4
popular reason to lease in 2013. Better cash flow management, ability to adapt the length of the contract and
transparency of lease payments also rank as important benefits.
Overall the results of our survey suggest that the most valued leasing benefits are similar across industrial
sectors, however at the national level attitudes appear somewhat different. This could be a factor of cultural
norms, the approach of leasing firms in the local market or of the regulatory and tax environment in individual
countries.
For both lessees and non-users, the preference to own assets outright remains a key reason for not using
leasing more, although this rationale has decreased in importance for lessees since 2010. A divergence in
perceptions between lessees and non-users is apparent. Overall, lessees placed less importance on the
reasons not to lease more, while non-users found these motives increasingly relevant. This highlights that
there is an opportunity to raise awareness of leasing’s benefits amongst non-users.
Importance of leasing for exporting and growth firms
To gain further insight into how leasing assists SMEs, our latest report analyses export and growth firms, i.e.
SMEs with particularly high investment needs. A larger proportion of lessees are exporting firms in 2013,
38.8% compared to 23.7% of non-users. This finding holds true across all firm sizes. Not only do exporting
SMEs use leasing more, but they use it more intensively than non-exporting firms, financing 20.4% of their
investment activity via leasing as opposed to 17.6% for non-exporters.
A lessee is also more likely to be a growth firm, with 14.5% of lessees identified as growth SMEs in 2013
compared to 12.3% of non-users. Moreover, growth SMEs financed almost a quarter of their investment
(23.9%) via leasing in 2013 – substantially more than non-growth SMEs at 17.7%. A relatively similar
outcome is observed across firm size, with a more pronounced difference for micro growth firms. They
financed a greater amount of total investment via leasing than any other firm size at 25.7%, compared to
non-growth micro firms at 13.2%. This evidence highlights that exporting and growth SMEs rely on leasing to
a much greater extent to fund their investment.
Leasing’s role in driving investment and growth
On average, SMEs that use leasing invest more than non-users of leasing, with this divergence widening
substantially in 2013 relative to 2010. In 2013, lessees invested an average of €689,000 versus €498,000 in
2010. Non-users’ investment remained fairly stable at €309,000 in 2013. In other words lessees invest
approximately 123% more than non-users of leasing, up from 57% in 2010. The divergence between
lessees and non-users was particularly pronounced for micro and medium firms. Moreover, micro lessees
exhibited the greatest increase in investment spending in 2013 relative to any other firm size, €369,000 as
opposed to €88,000 in 2010.
In the case of exporting firms, lessees invest more than twice as much as non-users (€1 million versus
€442,000). This difference is even more marked for growth SMEs, where lessees invested €1.1 million in
2013 compared to €338,000 by non-users. This evidence indicates that SMEs with greater investment needs
(i.e. exporting and growth SMEs) turned to leasing to help finance more of this investment due to the many
benefits already identified.

The Use of Leasing Amongst European SMEs July 2015
5
Leasing continues to be the most important source of investment finance for those SMEs that use it. Leasing
accounted for 30.5% of their investment compared to 28.9% for all forms of bank lending together and 29.7%
for cash/equity financing in 2013. SME lessees estimated that leasing grew in importance as a form of
investment finance in 2014, while bank loans saw a decline. Therefore, raising awareness of the benefits of
leasing can improve access to finance for the remaining 57.5% of SMEs not currently leasing and, by doing
so, enable higher investment levels by European SMEs overall.
The need for finance varies across the life span of an SME and as such, so does the form of finance chosen.
Leasing has become an increasingly important finance source for young firms (under 2 years of age) and
remains a key form of finance across all other stages of an SME’s life cycle. As young firms often start out
small, this could explain why micro lessees in particular can invest more than non-users – they are taking
advantage of one of the few financing options available to them.
SME investment levels and use of leasing in 2014 and beyond
Despite continued economic headwinds within Europe, SMEs appear relatively confident about their future
prospects, particularly firms that already use leasing. More than a third of lessees (35.8%) estimated a rise in
0.0
0.2
0.4
0.6
0.8
1.0
1.2
Micro Small Medium SMEs
Non-users
Lessees
Average SME investment spending by firm size, 2010
€ mn
Source : Oxford Economics/EFG
0.0
0.2
0.4
0.6
0.8
1.0
1.2
Micro Small Medium SMEs
Non-users
Lessees
Average SME investment spending by firm size, 2013
€ mn
Source : Oxford Economics/EFG
0.0
0.2
0.4
0.6
0.8
1.0
1.2
Expo
rtin
g
No
n-
exp
ort
ing
Lessees Non-users
Average SME investment spending by exporting and non-exporting firms, 2013
€ mn
Source : Oxford Economics/EFG
0.0
0.2
0.4
0.6
0.8
1.0
1.2
Gro
wth
No
n-g
row
th
Lessees Non-users
Average SME investment spending by growth and non-growth firms, 2013
€ mn
Source : Oxford Economics/EFG

The Use of Leasing Amongst European SMEs July 2015
6
fixed asset investment in 2014 as opposed to 30.3% of non-users. Lessees therefore appear to be in a
position to invest more as a result of their increased access to finance through leasing.
The share of SME investment financed by leasing is estimated to have increased from 18.9% in 2013 to
21.2% in 2014. Combining this penetration rate with forecasts for SME investment, the estimated size of the
EU SME leasing market in 2014 is €120.9 billion.
In our report we model how a greater uptake of leasing by European SMEs would boost economic growth
under three scenarios. For each scenario we calculate the impact on the annual potential growth rate and
the level of potential GDP by 2020 relative to a baseline where the SME leasing penetration rate remains at
actual 2013 levels until 2020.
The scenarios are:
Scenario 1: Permanently increasing SME leasing penetration rates from 2013 to 2014 (estimated)
levels across Europe-8 countries, holding the level of other investment fixed;
Scenario 2: Increasing micro firms’ leasing penetration rates to one consistent with that of medium
firms, holding the level of other investment fixed; and
Scenario 3: Increasing SME leasing penetration rates from 2014 levels by an amount equal to the
fall that occurred in leasing penetration rates for the whole economy between 2008 and 2013.
Scenario 2 in our previous study estimated the impact of micro firm leasing penetration rates reaching those
of small firms. Interestingly, this scenario was realised in 2013.
Depending on the scenario, the macroeconomic gain stemming from increased leasing penetration rates is
estimated to add an additional 0.3% to 0.7% to the level of GDP by 2020. This equates to between €34
billion to €100 billion in additional European GDP. A greater uptake of leasing amongst Europe’s micro, small
and medium sized firms can therefore help generate faster economic growth in Europe by stimulating
investment in the productive assets that European SMEs need to enhance their competitiveness.
Conclusion
Around Europe, policymakers and other stakeholders continue to stress the importance of supporting SMEs
as a means of generating economic growth and jobs. SMEs account for 67% of total employment in the EU-
28 and are a fundamental source of growth for European economies. As such, it is critical to ensure that
SMEs, the drivers of the EU economy, are able to finance productive investment that in turn will create
further growth and employment opportunities. This report demonstrates that leasing is a vital source of
finance for SMEs. Given this fact, European and national initiatives that raise SMEs’ awareness of leasing
would help in ensuring that European SMEs can invest and expand in the future.

The Use of Leasing Amongst European SMEs July 2015
7
Glossary of key terms and abbreviations
Lease: A lease is a contract that provides a customer (lessee) with the right to use an asset for a period of
time in exchange for a series of payments2. The lessor remains the legal owner of the asset throughout the
contract. Ownership of the asset may or may not pass to the customer at the end of the contract.
Contracts where legal ownership of the asset passes directly to the customer at the start of the agreement
are not considered leases for the purposes of this study.
This definition of a lease covers both finance leases (including hire purchase where appropriate) and
operating leases (also known as rental). Compared to finance leases, operating leases are typically for a
shorter duration than the useful economic life of the asset. There is either no possibility to purchase the asset
at the end of the lease or, if there is, it is for a higher amount than under a finance lease. Operating leases
more frequently include services related to the use of the asset e.g. insurance, maintenance, replacement
etc. than finance leases.
SME: “Small or Medium Sized enterprise”. According to the European Commission definition, this term
covers any firm with between 1-250 employees, incorporating micro sized firms as well as small and
medium, but excluding sole proprietors.
Micro firm: A firm with between 1 and 9 employees.
Small firm: A firm with between 10 and 49 employees.
Medium firm: A firm with between 50 and 250 employees.
Growth SME: A firm with average annual turnover growth exceeding 20% for the last three years.
Penetration rate: The proportion of a firm’s investment that is financed by leasing or another form of
finance. This concept is also applied to the proportion of total investment in an industry or country financed
by leasing and other forms of finance.
Europe-8: In this report we use “Europe-8” to denote the eight countries in our sample: France, Germany,
Italy, Netherlands, Poland, Spain, Sweden and the UK.
Leaseurope-28: We use “Leaseurope-28” to denote the 28 Leaseurope member countries taking part in the
Federation’s 2013 Annual Statistical Enquiry (ASE). Compared to the 28 member countries of the EU, the
ASE does not include Croatia, Cyprus, Hungary, Ireland, Luxembourg and Malta, but covers Serbia,
Switzerland, Norway, Russia, Ukraine and Turkey.
EU-28: We use “EU-28” to denote the 28 member states of the European Union.
Asset types:
Machinery and industrial equipment = agricultural and construction equipment; mechanical handling
equipment e.g. forklift; production equipment; and other machinery and industrial equipment.
ICT and office equipment = IT and communications equipment; office printers and photocopiers; and other
equipment and furniture.
Other equipment = medical equipment; and renewable energy equipment e.g. solar panels / wind turbines.
2 The definition of a lease used in this report is based on that given in IAS 17, the International Financial Reporting
Standard for Leases.

The Use of Leasing Amongst European SMEs July 2015
8
Passenger cars and light commercial vehicles = passenger cars and light commercial vehicles e.g. vans;
and other vehicles (up to and including 3.5 tonnes).
Medium and heavy commercial vehicles = trucks; and other vehicles (over 3.5 tonnes).
Real estate = commercial property only.

The Use of Leasing Amongst European SMEs July 2015
9
1. Introduction and background
SMEs are the motor of the EU-28 economy, with a particularly significant contribution made by micro firms.
In 2013, SMEs accounted for 99.8% of all enterprises, 66.8% of total employment and 57.9% of value added
in the non-financial business sector3. The majority of these enterprises were micro firms (92.4%), which
accounted for 43% of SME employment – significantly more than any other firm size – and 37% of SME
value added. Clearly SMEs are at the forefront of driving economic growth, as well as being a key source of
innovation, research and development. In order for SMEs to grow, access to affordable sources of finance is
critical. The tough economic climate in recent years continues to make access to finance a key obstacle
faced by many SMEs. Given these conditions, SMEs are also less able to rely on internal sources of capital
(e.g. reserves of past profits) to finance their investment. Therefore as an alternative they turn to external
sources of funding such as leasing, which proved to be a reliable and attractive form of investment finance.
This report, written by Oxford Economics on behalf of Leaseurope, the Federation representing the leasing
industry at European level, provides an update and extension on the report published in November 20114. As
such, it establishes an evidence base to help policymakers and other stakeholders in the SME finance
sphere better understand the role of leasing in financing investment and demonstrates how leasing can
support investment and economic growth5. The report also explores how and why Europe’s SMEs use
leasing, as well as providing insight into the European SME leasing industry over time since 2010.
This introductory chapter sets the context for the main body of the report. We discuss the existing evidence
on the use of leasing around Europe, both at the whole economy level and amongst SMEs, and explore how
important leasing is compared to other forms of financing. We then clarify any gaps in the data, the
objectives of this study and the methodology used during the fieldwork.
1.1 What is leasing?
The simple term “lease” covers a range of different contracts, the common feature of which is that the
finance provider (lessor) retains ownership of the leased asset but makes it available for use to a customer
(lessee) for a period of time.
With a multitude of definitions of leasing existing in local accounting standards, fiscal legislations and in
some cases within specific local legislative frameworks for leasing, the only common definition of a lease that
can be given on the European level is that provided by IAS 17, the international accounting standard for
leases, where a lease is defined as “an agreement whereby the lessor conveys to the lessee in return for a
payment or series of payments the right to use an asset for an agreed period of time”. IAS 17 currently
differentiates between finance leases, whereby the lease contract transfers substantially all of the risks and
rewards related to the leased asset to the lessee, and all other leases, which are known as operating leases.
Given the diversity of terminology at national level, this report refers to leasing in a broad sense and aims to
cover the types of contracts that meet the IAS 17 definition. For further details on the types of contracts that
are included in this report, please see the glossary.
3 European Commission’s Annual Report on European SMEs 2013/2014, A partial and fragile recovery.
4 Oxford Economics, The Use of Leasing Amongst European SMEs, November 2011.
5 Unless specified, we use the term “leasing” to denote the sum of all types of leasing activity. See the glossary for
further information.
The Use of Leasing Amongst European SMEs July 2015
10
1.2 Evidence on the use of leasing
1.2.1 Annual Statistical Enquiry (ASE)
Leaseurope produces its ASE, which gathers data on the value of new leasing contracts written by firms
affiliated to the Federation’s member associations, with additional detail available for different asset types
and industrial sectors6.
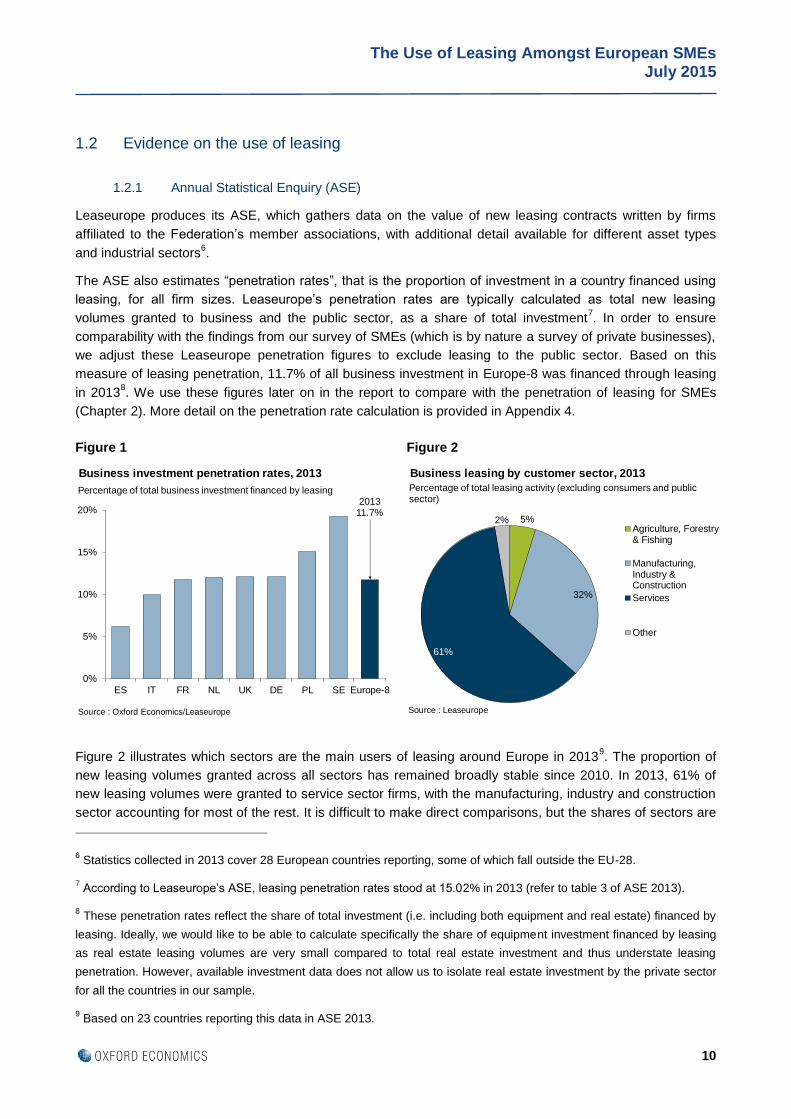
The ASE also estimates “penetration rates”, that is the proportion of investment in a country financed using
leasing, for all firm sizes. Leaseurope’s penetration rates are typically calculated as total new leasing
volumes granted to business and the public sector, as a share of total investment7. In order to ensure
comparability with the findings from our survey of SMEs (which is by nature a survey of private businesses),
we adjust these Leaseurope penetration figures to exclude leasing to the public sector. Based on this
measure of leasing penetration, 11.7% of all business investment in Europe-8 was financed through leasing
in 20138. We use these figures later on in the report to compare with the penetration of leasing for SMEs
(Chapter 2). More detail on the penetration rate calculation is provided in Appendix 4.
Figure 2 illustrates which sectors are the main users of leasing around Europe in 20139. The proportion of
new leasing volumes granted across all sectors has remained broadly stable since 2010. In 2013, 61% of
new leasing volumes were granted to service sector firms, with the manufacturing, industry and construction
sector accounting for most of the rest. It is difficult to make direct comparisons, but the shares of sectors are
6 Statistics collected in 2013 cover 28 European countries reporting, some of which fall outside the EU-28.
7 According to Leaseurope’s ASE, leasing penetration rates stood at 15.02% in 2013 (refer to table 3 of ASE 2013).
8 These penetration rates reflect the share of total investment (i.e. including both equipment and real estate) financed by
leasing. Ideally, we would like to be able to calculate specifically the share of equipment investment financed by leasing
as real estate leasing volumes are very small compared to total real estate investment and thus understate leasing
penetration. However, available investment data does not allow us to isolate real estate investment by the private sector
for all the countries in our sample.
9 Based on 23 countries reporting this data in ASE 2013.
Figure 1 Figure 2
201311.7%
0%
5%
10%
15%
20%
ES IT FR NL UK DE PL SE Europe-8
Business investment penetration rates, 2013
Percentage of total business investment financed by leasing
Source : Oxford Economics/Leaseurope
5%
32%
61%
2%Agriculture, Forestry& Fishing
Manufacturing,Industry &Construction
Services
Other
Business leasing by customer sector, 2013
Percentage of total leasing activity (excluding consumers and public sector)
Source : LeaseuropeSource : Leaseurope

The Use of Leasing Amongst European SMEs July 2015
11
very broadly in line with their respective shares of the EU’s Gross Value Added: services output accounted
for around 74%, construction around 5%, manufacturing 16% and agriculture around 2% in 2013.
1.2.2 Survey on the access to finance of enterprises (SAFE)
Although the ASE provides a comprehensive overview of the European leasing market, it does not yet
present granular data by firm size across all countries.
The European Commission describes SMEs as the “backbone of a country’s economy”10
underlining the
importance of understanding and tackling the challenges faced by SMEs following the economic downturn,
one of them being access to finance. The SAFE survey11
, a collaborative initiative by the European
Commission and the European Central Bank, provides insight into access to finance by firm size across
Europe. The November 2014 issue of the SAFE survey details the difficulties faced by 17,075 enterprises
across the EU-2812
, varying in size from micro to large firms13
.
The survey reveals that 20% of SMEs surveyed cited finding customers as their main concern, followed by
sourcing skilled labour, regulation and competition. Access to finance features prominently, with micro
enterprises viewing it as the most problematic area while large enterprises find it least pressing (see Figure
3). Larger firms are better able to tap equity and debt markets, are more likely to have built up a long run
relationship with their bank and are more likely to be considered less risky debtors, increasing their financial
options.
Figure 3
The November 2014 issue of the SAFE survey also contains information on the use of leasing by SMEs as a
separate category for the first time – previously leasing and factoring were grouped together14
. While the
10 European Commission’s Annual Report on European SMEs 2013/2014, A partial and fragile recovery.
11 Since 2013 this report is published annually for EU-28 countries and every six months for Eurozone only.
12 EU-28 Member States, in addition to Iceland and Montenegro.
13 Of which 15,417 (90%) were SMEs i.e. had fewer than 250 employees.
14 Leasing is based on physical assets while factoring is based on receivables.
0%
5%
10%
15%
20%
25%
Fin
din
g c
usto
mers
Co
mp
etition
Access to fin
ance
Costs
of pro
duction/
labour
Availa
bili
ty o
f skill
ed
sta
ff/e
xperienced
managers
Regula
tion
Oth
er
Micro Small
Medium Large
What is the main problem facing your business?
Percentage of respondents answering:
Source : European Commission SAFE survey, November 2014
The Use of Leasing Amongst European SMEs July 2015
12
results cannot be directly compared with previous waves of the survey yet, in the future this will allow
analysis on the importance of leasing over time.
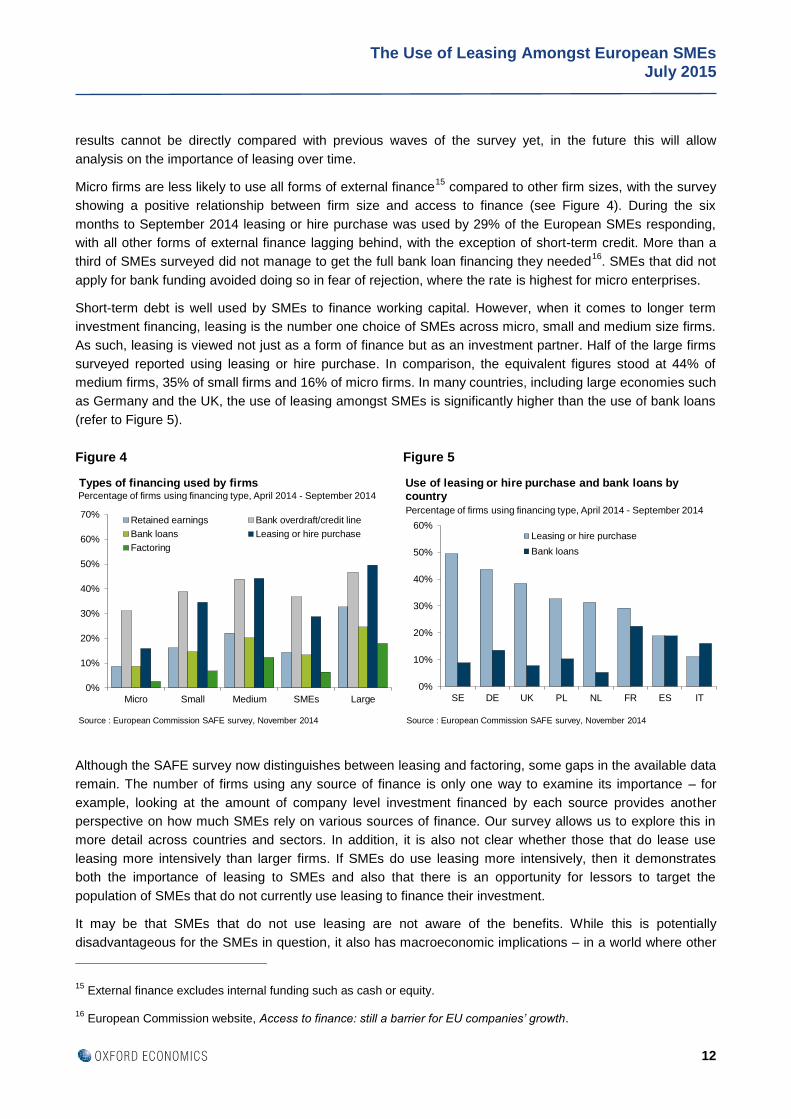
Micro firms are less likely to use all forms of external finance15
compared to other firm sizes, with the survey
showing a positive relationship between firm size and access to finance (see Figure 4). During the six
months to September 2014 leasing or hire purchase was used by 29% of the European SMEs responding,
with all other forms of external finance lagging behind, with the exception of short-term credit. More than a
third of SMEs surveyed did not manage to get the full bank loan financing they needed16
. SMEs that did not
apply for bank funding avoided doing so in fear of rejection, where the rate is highest for micro enterprises.
Short-term debt is well used by SMEs to finance working capital. However, when it comes to longer term
investment financing, leasing is the number one choice of SMEs across micro, small and medium size firms.
As such, leasing is viewed not just as a form of finance but as an investment partner. Half of the large firms
surveyed reported using leasing or hire purchase. In comparison, the equivalent figures stood at 44% of
medium firms, 35% of small firms and 16% of micro firms. In many countries, including large economies such
as Germany and the UK, the use of leasing amongst SMEs is significantly higher than the use of bank loans
(refer to Figure 5).
Figure 4 Figure 5
Although the SAFE survey now distinguishes between leasing and factoring, some gaps in the available data
remain. The number of firms using any source of finance is only one way to examine its importance – for
example, looking at the amount of company level investment financed by each source provides another
perspective on how much SMEs rely on various sources of finance. Our survey allows us to explore this in
more detail across countries and sectors. In addition, it is also not clear whether those that do lease use
leasing more intensively than larger firms. If SMEs do use leasing more intensively, then it demonstrates
both the importance of leasing to SMEs and also that there is an opportunity for lessors to target the
population of SMEs that do not currently use leasing to finance their investment.
It may be that SMEs that do not use leasing are not aware of the benefits. While this is potentially
disadvantageous for the SMEs in question, it also has macroeconomic implications – in a world where other
15 External finance excludes internal funding such as cash or equity.
16 European Commission website, Access to finance: still a barrier for EU companies’ growth.
0%
10%
20%
30%
40%
50%
60%
70%
Micro Small Medium SMEs Large
Retained earnings Bank overdraft/credit line
Bank loans Leasing or hire purchase
Factoring
Types of financing used by firmsPercentage of firms using financing type, April 2014 - September 2014
Source : European Commission SAFE survey, November 2014
0%
10%
20%
30%
40%
50%
60%
SE DE UK PL NL FR ES IT
Leasing or hire purchase
Bank loans
Use of leasing or hire purchase and bank loans by country
Percentage of firms using financing type, April 2014 - September 2014
Source : European Commission SAFE survey, November 2014

The Use of Leasing Amongst European SMEs July 2015
13
sources of financing remain constrained, greater uptake of leasing could provide a powerful boost to growth
around Europe as investigated later in the report.
This message prompts policymakers to develop tools that will encourage use of leasing as an alternative
source of external finance amongst SMEs. EU measures such as the Competiveness and Innovation
Programme (CIP) were designed to address key challenges faced by European SMEs, particularly access to
finance. With €3.6 billion injected by the programme between the 2007-13 period, CIPs supported start-up
companies and created a more favourable environment that promoted growth in SMEs by improving access
to finance, as well as offering business support services. The success of this programme has warranted the
introduction of the Competiveness of Enterprises and SMEs (COSME) initiative, which is set to further
support SMEs over the 2014-20 period.
A more nuanced picture of the financing options for European SMEs is important in order for policymakers to
understand the role of leasing in supporting investment and for the leasing industry to understand more
completely the drivers of activity in a key client segment.
1.3 Objectives of the study
The original report on The Use of Leasing Amongst European SMEs, published in 2011, was a successful
exercise in filling an information gap on SME leasing in Europe. To build on this study, a new comprehensive
research project was established aimed at updating and extending the available data.
The overarching objective of this study is to better understand the pattern of leasing and how it has evolved
over time amongst European SMEs. We build on a number of key strands developed in the previous report:
A measure of the contribution of leasing to SME investment spending, split by country, economic
sector and company size and how this compares with other forms of financing;
An understanding of how leasing enables investment by SMEs;
An assessment of what types of assets SMEs use leasing for, as well as which channels they use to
source leasing products;
An understanding of why firms use leasing in some instances and not in others; and
The potential impact of a greater uptake of leasing on future economic growth.
The 2015 study also included a range of new elements:
Who the financial decision-makers are within the surveyed companies;
A more detailed distinction between bank loans of various durations;
Whether non-users of leasing in the current survey have used leasing in the past; and
An indication of leasing’s role in funding investment by exporting and growth SMEs.
The following sub-section explains our methodology for gathering data on these broad objectives, before we
discuss our findings in detail in the following chapters.
Chapter 2 discusses our findings on the market for leasing to European SMEs and how this is changed over
time. Specifically, what proportion of SMEs are engaged in leasing, how intensively do SME lessees use
leasing and how does leasing’s role compare to other forms of financing? We look at these questions across
different countries, sectors and firm sizes. Additionally, we quantify whether current non-users of leasing

The Use of Leasing Amongst European SMEs July 2015
14
have used this form of finance in the past. We conclude this chapter by quantifying the overall size of the
market for leasing to European SMEs.
Chapter 3 looks at what type of assets SMEs access via leasing and which channels they use. We also look
at the reasons why firms value leasing, the advantages it brings to their business and also the reasons why
they don’t use more leasing.
In Chapter 4 we investigate the importance of leasing for exporting and growth SMEs and compare to non-
exporting and non-growth firms. We look at their use of leasing and the amount of investment financed
through it.
Chapter 5 looks at the role of leasing in driving investment and growth amongst the SME sector. Observing
trends over time, we interpret whether lessees invest more than non-users. In this context we also bring
focus back to exporting and growth SMEs. Moreover, we present estimates for SME investment and use of
financing sources in 2014.
Chapter 6 assesses leasing’s potential contribution to future European economic growth. Scenario analysis
is used to quantify the macro-economic impact of greater use of leasing by European SMEs in various
countries and the effect that would have on the European economy.
1.4 Methodology
1.4.1 Approach
In order to get a better understanding of how European SMEs use leasing we engaged a market research
firm, EFG Worldwide, to undertake an in-depth survey of European SMEs. EFG conducted telephone
interviews of 2,950 firms in eight European countries (France, Germany, Italy, Netherlands, Poland, Sweden,
Spain and the UK) across a range of 9 sectors and including micro, small and medium sized firms. Together
these eight economies account for 81.9% of EU GDP and 72% of new leasing volumes granted to EU
businesses in 2013. As such, we feel the survey gives a representative picture, not only at the individual
country level but also for different industry sectors, as well as Europe as a whole.
We split our sample according to size/sector/country classification using data from Eurostat on the shares of
each industry’s output generated by micro, small and medium sized firms in each country. The dataset,
which forms the basis for this research, was compiled by telephone interviews of decision-makers in each
SME in August-September 2014 (see Appendix 1 for a breakdown of the sample). These respondents were
asked for information on their 2013 business and investment activities, as well as estimates for 2014.
Bearing in mind local specificities in terms of leasing products and definitions, we have tried to capture the
whole range of leases as defined in the glossary. Our questionnaire for each country was tailored in order to
obtain comparable results for the survey sample as a whole (refer to Appendix 2 for the questionnaire). The
survey consisted of six principle sections.
The first section, common to all interviewees, initially asked a few questions to ascertain the sector
which the firm represented and the age of company. The respondents then were invited to quantify
the size of the firm’s turnover, its growth over the last three years and the size of firm’s balance
sheet. It also asked whether the firm exported or not, and to what markets (inside or outside the
EU);
The second section, again addressed to all interviewees, asked the firms what their total investment
in fixed assets was and how they financed the investment they undertook in 2013. A range of

The Use of Leasing Amongst European SMEs July 2015
15
different possible sources were given including personal cash injection, retained assets, bank loans,
leasing, factoring, trade credit etc. with a yes/no/don’t know response option each. Additionally, we
aimed at obtaining the actual proportions of total investment financed specifically by leasing,
cash/equity, bank loans or other debt finance in 2013. For firms that said they used bank loans in
some portion, a next question asked to detail the proportions of such loans by duration (less than 1
year, 1-3 years and over 3 years);
The third section, designed only to those firms that said they had used leasing in 2013, enquired
about the types of assets they had financed using leasing and the value of these assets. Instead of a
detailed breakdown of sub-categories that were included in the 2011 survey questionnaire, only six
broad categories were outlined for the purpose of this survey. These broad categories remained
largely the same except for motor vehicles that were given their own distinct categories;
The fourth section, addressed only to those firms that said they did not use leasing in 2013, asked
whether they used leasing in the past;
The fifth section asked firms that had used leasing in any year to tell us more about why they used it,
rating a number of commonly cited advantages on a scale of 0 (not important) to 0.5 (quite
important) to 1 (very important). The information on the specific channel that leasing was accessed
through was also obtained; and
The last (sixth) section, common to all interviewees, asked about their investment intentions in 2014
and the use of same forms of finance as detailed in the second section based on proportions.
Finally, the respondents were asked to tell us about why they hadn’t used any/more leasing in 2013,
again using a scale of 0 to 0.5 to 1.
Many of the charts that we present display estimated penetration rates for leasing by country, industry, firm
size, or some combination thereof. In Leaseurope’s ASE, penetration rates are calculated by comparing the
total value of assets leased as reported by the respective national associations to investment in the relevant
country. In this report we use the same conceptual approach but use firm-level data from our survey of SMEs
- we calculate penetration rates by multiplying the percentage of investment financed using leasing by the
firm’s amount of total investment as reported by each SME, then sum across firms and divide by total
investment across the relevant group. This gives us a penetration rate17
.
Conceptually the two approaches are the same – Leaseurope’s approach operates at the whole economy
level using national level data, while our approach assumes that the sample of SMEs surveyed is
representative of the entire population of SMEs. By matching the structure of the sample of SMEs surveyed
to the structure of the economies in question18
and sampling between 200 and 450 firms per country, we
have achieved a sufficiently high sample size to permit examination of the penetration rate at two levels of
detail – i.e. at the industry and the country level. However, there is the possibility that some sampling error
remains for countries where the sample sizes are smaller.
17 E.g. if we had two firms in our sample, one using leasing for 100% of its €100k investment and another using leasing
for 5% of its €1m, the estimated penetration rate is (€100k + €50k)/( €1m + €100k) = 13.6%.
18 See Appendix 1 for more information on the survey sample.

The Use of Leasing Amongst European SMEs July 2015
16
1.4.2 Financial decision-makers within surveyed firms
Our survey also asks interviewees what their position within the company is and whether they are involved in
the financial decision-making process for investment in new assets. The results by firm size are presented in
Figure 6.
A significant proportion of financial decision-makers were general managers across all firm sizes. Of all
respondents, 35.5% held this position in micro firms compared to 31.3% in small and 27.6% in medium sized
firms. A large proportion of respondents involved in asset investment decisions in micro firms were also Chief
Executive Officers - CEOs (32.9%), while the equivalent figures were much lower for small and medium
sized firms. The proportion of purchase managers and financial directors involved in the investment decision-
making process increases with the size of the firm.
Figure 6
1.4.3 Expert Group consultation
As part of this study, a consultation exercise was undertaken with senior management leasing industry
experts from various countries, sectors and organisations (i.e. the SME Expert Group). Feedback from this
group provided additional background information and reasoning behind the survey results. Their input was
used to build on and explain certain trends revealed in the survey, drawing upon their own professional
experience, market expertise and relevant survey results.
0%
20%
40%
60%
80%
100%
Micro Small Medium
Purchase manager
Other involved in the decision process
General Manager
Financial director
Company owner/Chief Executive
Financial decision-makers by firm size
Source : Oxford Economics/EFG
Percentage of all respondents

The Use of Leasing Amongst European SMEs July 2015
17
2. The market for leasing to European SMEs
Key points
Of the SMEs surveyed, 42.5% used leasing in 2013 compared to 40.3% in 2010. This is estimated to
have increased significantly to 50.7% in 2014.
In 2013, the share of micro and small firms using leasing grew to 31.4% and 45.7% respectively, with
medium size firm use remaining broadly stable at 52.5% compared to 2010.
After significant constraints during the difficult economic crisis period in 2010, access to bank lending
such as loans and short-term credit improved in 2013. In comparison, leasing remained a reliable
source of finance over that time.
SMEs financed 18.9% of their total investment via leasing in 2013, more than any individual form of
bank lending. Bank loans of more than three years accounted for the next largest share of SME
investment finance at 15.5% in 2013, with the proportion falling as the bank loan duration shortens.
SMEs use leasing to finance a greater proportion of their investment than businesses of all sizes
(11.7%). This difference widened in 2013 compared to 2010.
The share of investment financed by leasing grew between 2010 and 2013 across all SME size
classes, particularly for micro firms. In 2013, micro firms financed 15.4% of their total investment
through leasing, a significant increase from 10.0% in 2010, compared to small firms (to 17.2% from
16.4%) and medium sized firms (to 20.8% from 17.6%).
The share of SME investment financed by leasing is estimated to have grown to 21.2% in 2014. By
contrast, the shares of all bank lending categories are estimated to have decreased.
Of those SMEs that do not lease in 2013, 25.8% did so in the past. Of those former lessees, 17.2%
intended to use leasing in 2014, indicating that SMEs that previously put their investments on hold
are again returning to leasing.
The total European SME leasing market is estimated to be worth €103.6 billion in 2013, or half of
total leasing to European businesses. This translates to roughly 9.2 million European SMEs
benefitting from leasing.
2.1 How many SMEs use leasing?
The first section of this chapter looks at the proportions of SMEs using leasing, by size of firm, compared to
other types of finance and by country and sectoral divisions.
2.1.1 Proportions using leasing by firm size
Our examination of the survey evidence begins by looking at the proportions of SME firms that reported
using leasing in any form in 2013. Overall, 42.5% of SMEs surveyed used leasing in 2013 (compared to
40.3% in 2010), demonstrating that leasing is an increasingly vital source of finance for many European
SMEs. In 2014, the proportion is estimated to have increased to 50.7% largely due to a recovery in domestic
demand in Europe.

The Use of Leasing Amongst European SMEs July 2015
18
While the overall proportion of SMEs using leasing has expanded since 2010, the picture varies by firm size.
In line with the evidence presented in Chapter 1, micro firms generally use less external finance than other
firms. However, we do find that micro firms’ use of leasing is growing, to 31.4% in 2013 compared to 28.1%
in 2010. The share of small firms that leased also increased (to 45.7% from 41.5%), while medium sized firm
use remained broadly stable over the same period at 52.5% in 2013. Leasing is therefore becoming an
increasingly important form of finance for micro and small firms.
Figure 7
2.1.2 Proportions using leasing compared to other forms of finance
In order to build a more complete picture of SME investment, we also asked firms to tell us what other types
of financing they used. Overall, our results demonstrate an increased use of all types of external finance in
2013.
Leasing was the most frequently used source of external finance in 2010, during the midst of the financial
crisis, only exceeded by retained earnings and personal funds. While banks have begun to start lending
again, access to finance through this channel for SMEs was very much constrained during the difficult
economic crisis period. Only 26.4% of SMEs used bank loans with a 1-3 year duration in 2010 and only
37.6% used loans longer than 3 years. With increased bank liquidity and lower interest rates, access to these
two categories of lending rose substantially in 2013, to 45.2% and 46.4% respectively. This is supported by
the ECB’s Bank Lending Survey, which shows an improvement in lending conditions for enterprises during
most of 201319
. Leasing on the other hand has remained a reliable form of SME finance over this time
period, being viewed more as an investment partner for SMEs rather than simply a finance provider.
In addition, many national and European level initiatives have sought to increase bank lending to SMEs,
such as the Funding for Lending Scheme in the UK and guarantees provided by the Kreditanstalt fur
Wiederaufbau (KfW) in Germany. Projects like these often benefit bank lending without offering a similar
level of support for leasing to SMEs. If leasing was able to fully capitalise on these types of lending support
schemes as banks do, this would ultimately be beneficial to European SMEs.
19 European Central Bank’s Bank Lending Survey (BLS) defines enterprises based on annual turnover. Given that our
research defines SMEs by number of employees rather than turnover, the results from the BLS should be used for
context purposes only.
201040.3%
201342.5%
0%
10%
20%
30%
40%
50%
60%
Micro Small Medium SMEs
2010
2013
Proportion of SMEs using leasing by firm size, 2010 and 2013
Source : Oxford Economics/EFG

The Use of Leasing Amongst European SMEs July 2015
19
Similar to our previous report, the latest survey shows the proportion of firms using all forms of finance
(including leasing) rising with firm size, with the exception of personal funds. Micro firms continue to rely
more on personal funds, although the use of this declined in 2013 relative to 2010. We already showed that
the use of leasing by micro and small firms increased between 2010 and 2013. Over the same period, the
use of all forms of bank lending rose across all firm sizes, particularly loans between 1-3 years.
Figure 8 Figure 9
Figure 10 Figure 11
2.1.3 Proportions using leasing across different countries
When focusing on the use of leasing at country level, there are substantial national variations. Given the
recent economic climate it is not surprising to see a significant decline in the proportion of Italian and
Spanish SMEs using leasing between 2010 and 2013. In contrast, Europe’s economic powerhouse,
Germany, experienced a vast increase from 35.8% in 2010 to 67.1% in 2013, while the large increase in the
Netherlands coincides with a significant rise in entrepreneurship. Countries like France, Sweden and the UK
all reached usage levels over 50%.
28.8%31.4%
0%
10%
20%
30%
40%
50%
60%
70%
Facto
ring
Private
equity/
ventu
re c
apital
Tra
de c
redit
Leasin
g
Loan >
3 y
rs
Reta
ined
earn
ings
Loan 1
-3 y
rs
Short
-term
cre
dit
Pers
onal fu
nds
2010
2013
Proportion of micro firms using financing type, 2010 and 2013
Source : Oxford Economics/EFG
41.5%45.7%
0%
10%
20%
30%
40%
50%
60%
Facto
ring
Private
equity/
ventu
re c
apital
Tra
de c
red
it
Pers
onal fu
nds
Short
-term
cre
dit
Reta
ined
earn
ings
Leasin
g
Loan 1
-3 y
rs
Loan >
3 y
rs
2010
2013
Proportion of small firms using financing type, 2010 and 2013
Source : Oxford Economics/EFG
40.3%42.5%
0%
10%
20%
30%
40%
50%
Facto
ring
Private
eq
uity/
ve
ntu
re c
apita
l
Tra
de c
redit
Pers
onal fu
nds
Reta
ined
earn
ings
Leasin
g
Sh
ort
-term
cre
dit
Loan 1
-3 y
rs
Loan >
3 y
rs
2010
2013
Proportion of SMEs using financing type, 2010 and 2013
Source : Oxford Economics/EFG
53.3% 52.5%
0%
10%
20%
30%
40%
50%
60%
Fa
cto
ring
Pri
va
te e
qu
ity/
ven
ture
ca
pital
Pe
rson
al fu
nd
s
Tra
de c
redit
Sh
ort
-te
rm c
red
it
Re
tain
ed
earn
ings
Loa
n 1
-3 y
rs
Lea
sin
g
Loa
n >
3 y
rs
2010
2013
Proportion of medium firms using financing type, 2010 and 2013
Source : Oxford Economics/EFG

The Use of Leasing Amongst European SMEs July 2015
20
The share of SMEs using leasing is estimated to have risen across all countries in 2014 albeit by varying
degrees, with Italy posting the smallest rise and the UK the largest.
Figure 12
2.1.4 Proportions using leasing across sectors
At the sectoral level, the use of leasing is in a slightly narrower range. Agriculture and hospitality (hotels &
restaurants) SMEs are less likely to use leasing than firms in other sectors, though it should be noted that
agriculture has experienced a notable rise of almost 10 percentage points in their use of leasing since 2010.
For the remaining sectors, with the exception of manufacturing and transport & storage where usage is
higher, the proportion of firms accessing leasing in 2013 is tightly clustered around 39-43%.
It would appear that national differences in the way the leasing industry operates, and/or the policy and
economic environment, may be key to explaining variations in leasing use around the continent, rather than
differences across sectors. We explore this more in Chapter 3 where we look at the reasons for why firms
choose leasing.
Figure 13
40.3%
42.5%
50.7%
0%
10%
20%
30%
40%
50%
60%
70%
80%
ES IT NL PL SE FR UK DE Europe-8
2010
2013
2014
Proportion of SMEs using leasing by country, 2010, 2013 and 2014 (estimate)
Source : Oxford Economics/EFG
201040.3% 2013
42.5%
0%
10%
20%
30%
40%
50%
60%
Ho
tels
&re
sta
ura
nts
Agriculture
Pro
fessio
nal
serv
ices
Min
ing &
utilit
ies
Con
str
uction
Dis
trib
utive
trades
Real esta
te
Manufa
ctu
ring
Tra
nsport
&sto
rage
All
secto
rs
2010
2013
Proportion of SMEs using leasing by sector, 2010 and 2013
Source : Oxford Economics/EFG

The Use of Leasing Amongst European SMEs July 2015
21
2.2 Leasing penetration
As explained in Chapter 1, penetration rates show the percentage of total investment financed through
leasing. Our survey enables us to estimate the leasing penetration rate for SMEs in different countries and
sectors, by firm size, as well as comparing leasing to other forms of finance, thus complementing the
evidence in section 2.1 on the proportion of SMEs using leasing.
2.2.1 Penetration rates by country
The latest survey shows that the leasing penetration rate for SME investment is significantly higher than at
the whole economy level (i.e. including SMEs and larger companies) across our sample countries. According
to Leaseurope’s ASE, penetration rates across the eight countries stood at 11.7% in 2013 for all firms sizes
compared to 18.9% for SMEs in our survey sample20
. While the whole economy leasing penetration rate
declined by 1.2 percentage points in 2013 compared to 2010, the figure for SME leasing increased by 2.2
percentage points.
Looking at SME leasing penetration rates across countries unveils notable variations (see Figure 14).
Penetration rates for SMEs in France, Germany, Poland and the UK are relatively high at between 20-30% in
2013. The UK and Germany, having large well performing leasing markets, and Poland, with a relatively
young but high growth leasing sector, have seen substantial increases in SME penetration rates since 2010.
On the other hand countries with weaker economies such as Italy and Spain saw large declines during this
time period.
Five of the eight countries surveyed including Poland, Germany, France, Spain and the UK are estimated to
have seen penetration rates rise in 2014, which will be discussed in more detail in Chapter 5.
Figure 14
We now look at the share of investment financed by leasing, limited to firms who used leasing. Comparing
the proportion of SMEs using leasing with the extent to which these lessees use leasing provides further
valuable insights by country. For example, 16% of Italian SMEs used leasing in 2013 while the percentage of
20 For more information on total leasing penetration rates at the whole economy level by country in Europe-8, please
refer to Appendix 4.
16.7%
18.9%
0%
5%
10%
15%
20%
25%
30%
ES NL IT SE FR UK DE PL Europe-8
2010
2013
Leasing penetration rates for SMEs by country, 2010 and 2013
Source : Oxford Economics/EFG
Percentage of investment financed by leasing

The Use of Leasing Amongst European SMEs July 2015
22
their investment financed from leasing was much higher at 54%. By comparison, German firms have a higher
proportion of SMEs using leasing but a lower share of their investment attributed to leasing. A similar pattern
exists in Sweden, the UK and to a lesser extent, the Netherlands and France. The prevalent distribution
channel in the country in question is likely to play a large role in explaining these differences. Countries with
a higher incidence of vendor21
leasing, mostly exhibiting a high number of contracts with smaller values such
as passenger cars, would experience higher usage and lower penetration figures. In countries such as Italy,
the leased asset can be an important factor, as relatively high numbers of real estate transactions result in
lower numbers of contracts at higher values.
The two graphs below show the comparison of these two metrics in 2010 and 2013, where there have been
some developments at the country level.
Figure 15 Figure 16
2.2.2 Leasing penetration by sector
Earlier in this chapter we found that most sectors have a reasonably large proportion of SMEs that use
leasing, with rates resting between 38.8% and 55.1% in all but two sectors. We also find a narrow distribution
in penetration rates (across all SMEs, i.e. lessees and non-users) in 2013, between 16.4% and 20.2% across
most sectors. In both usage and penetration rates, hospitality and agriculture seem to be exceptions to the
general trend.
The agriculture sector underwent a dramatic transition, growing from the sector with the lowest penetration
rate in 2010 of 4.9% to the highest in 2013 at 25.3%. Given that the use of leasing in agriculture has also
risen during this time frame, leasing appears to be an increasingly important form of finance for these firms.
The other two sectors that saw large changes over time were real estate, with an increase, and hospitality,
with a decrease. Penetration rates for other sectors have remained broadly stable since 2010. Industries that
are traditionally associated with being capital intensive, such as the construction and distribution sectors,
used a high percentage of leasing to fund their investment activities.
21 Refer to Chapter 3 for definitions and further details on the vendor distribution channel.
40.3%
32.4%
0%
10%
20%
30%
40%
50%
60%
70%
SE UK NL ES FR DE PL IT Europe-8
Proportion using leasing
Penetration rate (lessees only)
Users and usage, 2010
% of firms using leasing, and average % of investment financed by leasing (lessees only)
Source : Oxford Economics/EFG
42.5%
35.7%
0%
10%
20%
30%
40%
50%
60%
70%
ES NL SE UK DE FR PL IT Europe-8
Proportion using leasing
Penetration rate (lesseesonly)
Users and usage, 2013
% of firms using leasing, and average % of investment financed by leasing (lessees only)
Source : Oxford Economics/EFG

The Use of Leasing Amongst European SMEs July 2015
23
Figure 17
The average investment financed by leasing across firms in our sample reached almost €82,000 out of a
total SME average investment of nearly €431,000 (the ratio between these two figures being equivalent to
the penetration rate)22
. This average lease investment increased by 36.7% compared to the figure of
€60,000 estimated in 2010 (see Figure 18).
Figure 18
2.2.3 Leasing penetration by firm size
In Chapter 1, we discussed survey evidence collected by the European Commission suggesting that small
and medium enterprises used leasing or hire purchase more than micro enterprises, which we also find to be
22 In estimating these figures, we assumed firms invested on average halfway between the two bounds of the value band
they reported. For example, firms reporting investment of €50,000-€100,000 were assumed to have invested €75,000.
Average SME investment financed by leasing is then calculated as the percentage of this investment financed through
leasing divided by the number of firms in the sample.
201016.7%
201318.9%
0%
5%
10%
15%
20%
25%
30%
Ho
tels
&re
sta
ura
nts
Min
ing
&utilit
ies
Manu
factu
ring
Pro
fessio
na
lserv
ices
Tra
nsport
&sto
rage
All
se
cto
rs
Dis
trib
utive
tra
des
Real e
sta
te
Co
nstr
uction
Ag
ricu
ltu
re
2010
2013
Leasing penetration rate for SMEs by sector, 2010 and 2013Percentage of investment financed by leasing
Source : Oxford Economics/EFG
0
20
40
60
80
100
120
140
160
Ho
tels
&re
sta
ura
nts
Dis
trib
utive
trades
Con
str
uction
Pro
fessio
nal
serv
ices
Tra
nsport
&sto
rage
All
secto
rs
Min
ing &
utilit
ies
Real esta
te
Manufa
ctu
ring
Agricultu
re
2010 2013
Average SME investment financed by leasing by sector, 2010 and 2013
€ thousand
Source : Oxford Economics/EFG

The Use of Leasing Amongst European SMEs July 2015
24
true in our survey results (see Figure 7). The same trends are observed in this section, where penetration
rates increase with the size of the firm.
The share of investment financed by leasing grew for all firm sizes over the time frame analysed (see Figure
19). Micro firms saw the largest increase, financing 15.4% of their investment via leasing in 2013 compared
to 10.0% in 2010. Penetration rates for small and medium firms also expanded, from 16.4% to 17.2% and
17.6% to 20.8% respectively over the same period. This evidence reiterates the growing importance of
leasing as a source of funding for business activities and investments, particularly for micro firms.
Micro firms form the bulk of businesses and undoubtedly play a crucial role in European economies, with
92.4% of all enterprises in the EU-28 being of this size23. As such, the availability of investment funding for
micro firms is particularly vital for economic growth. Our previous report undertook a scenario analysis under
three alternative assumptions, one of which assessed the impact on growth when micro firm penetration
rates mirrored those of small firms. Interestingly, our latest results show this assumption almost materialised
in 2013, which we will discuss further in Chapter 6.
Figure 19
2.2.4 Leasing’s role compared to other forms of finance – penetration rates
In this section, we examine how leasing penetration rates compare to other types of funding for SME
investment. A more detailed survey questionnaire compared to the 2011 edition allows us to analyse lending
in 2013 split by loan term, i.e. short-term bank loans (less than three years), long-term bank loans (greater
than three years), and bank overdrafts.24
This provides further insight into the relative importance of leasing
(with a typical term of 2-5 years25
) as a source of medium-term investment funding for SMEs.
In 2013, leasing accounted for the highest share of SME investment at 18.9%, aside from cash/equity. Of the
various bank loans, those of more than three years accounted for the next largest share at 15.5% in 2013,
with the proportion falling as the bank loan duration shortens. As we see from Figures 20 and 21, the
percentage of leasing used to finance SME investment increased from 2010 to 2013 and is estimated to
23 European Commission’s Annual Report on European SMEs 2013/2014, A partial and fragile recovery.
24 Chart values relating to 2011 reflect SME estimates as captured at the time of the survey conducted in 2011.
25 According to the ASE in 2013, about 72% of equipment leasing contracts (incl. vehicles) are of a duration between 2-5
years.
201016.7%
201318.9%
0%
5%
10%
15%
20%
25%
Micro Small Medium SMEs
2010
2013
Leasing penetration rates for SMEs by firm size, 2010 and 2013
Percentage of investment financed by leasing
Source : Oxford Economics/EFG

The Use of Leasing Amongst European SMEs July 2015
25
have grown further in 2014 to reach 21.2%. The use of internal sources of capital appears to be declining
over the period analysed. While bank lending as a whole increased slightly in 2013, all categories of bank
lending are estimated to have declined in 2014. As the ability of SMEs to finance their investment through
bank loans was constrained during the economic downturn, they increasingly appear to see value in
diversifying their financing sources.
Figure 20 Figure 21
We have already established that leasing as a percentage of investment finance grew quite strongly for
micro firms to 15.4% in 2013. Bank loans of more than three years follow closely behind at 15.1%, with the
penetration rate falling as loan duration shortens. While the proportion of micro firms using leasing is lower
than for individual forms of bank lending (see Figure 9), they clearly use leasing to fund a larger share of
their business investment activities than bank loans.
Small and medium sized firms also experienced a rise in leasing penetration rate between 2010 and 2013, to
17.2% and 20.8% respectively. Compared to these 2013 figures, bank loans of various durations were at
lower levels. Leasing penetration rates rise with the size of the firm, in comparison the share of individual
forms of bank lending do not vary in a similar manner by SME size.
Penetration rates for leasing are estimated to have increased in 2014 across all firm sizes, attaining 19.6%,
19.2% and 22.6% for micro, small and medium size firms respectively. On the other hand, total bank
lending’s share in investment is set to decrease across all firm sizes.
16.7% 18.6%
36.7%39.4%
31.2%28.3%
15.5% 13.8%
0%
10%
20%
30%
40%
50%
60%
70%
80%
90%
100%
2010 2011 (estimate)
Leasing Cash/Equity
Bank loans Other debt
Investment finance in 2010 and 2011, all SMEs
Percentage of investment financed by:
Source : Oxford Economics/EFG
18.9% 21.2%
30.5% 29.1%
7.3% 6.7%
10.0% 9.4%
15.5% 15.0%
17.8% 18.6%
0%
10%
20%
30%
40%
50%
60%
70%
80%
90%
100%
2013 2014 (estimate)
Leasing Cash/Equity
Short-term credit Loan 1-3 yrs
Loan >3 yrs Other debt
Investment finance in 2013 and 2014, all SMEs
Percentage of investment financed by:
Source : Oxford Economics/EFG

The Use of Leasing Amongst European SMEs July 2015
26
Figure 22 Figure 23
Figure 24 Figure 25
10.0% 10.0%
50.8% 51.4%
19.7% 20.2%
19.6% 18.4%
0%
10%
20%
30%
40%
50%
60%
70%
80%
90%
100%
2010 2011 (estimate)
Leasing Cash/Equity
Bank loans Other debt
Investment finance in 2010 and 2011, micro firms
Percentage of investment financed by:
Source : Oxford Economics/EFG
15.4% 19.6%
34.8%33.9%
7.3%7.0%
9.0% 8.7%
15.1% 14.8%
18.4% 16.0%
0%
10%
20%
30%
40%
50%
60%
70%
80%
90%
100%
2013 2014 (estimate)
Leasing Cash/Equity
Short-term credit Loan 1-3 yrs
Loan >3 yrs Other debt
Investment finance in 2013 and 2014, micro firms
Percentage of investment financed by:
Source : Oxford Economics/EFG
16.4% 17.2%
32.0% 33.9%
34.9% 32.0%
16.8% 16.9%
0%
10%
20%
30%
40%
50%
60%
70%
80%
90%
100%
2010 2011 (estimate)
Leasing Cash/Equity
Bank loans Other debt
Investment finance in 2010 and 2011, small firms
Percentage of investment financed by:
Source : Oxford Economics/EFG
17.2% 19.2%
33.5% 31.9%
7.4% 6.9%
11.4% 10.9%
15.8% 15.8%
14.7% 15.2%
0%
10%
20%
30%
40%
50%
60%
70%
80%
90%
100%
2013 2014 (estimate)
Leasing Cash/Equity
Short-term credit Loan 1-3 yrs
Loan >3 yrs Other debt
Investment finance in 2013 and 2014, small firms
Percentage of investment financed by:
Source : Oxford Economics/EFG

The Use of Leasing Amongst European SMEs July 2015
27
Figure 26 Figure 27
Looking at geographical breakdowns, in most countries cash/equity remains the dominant form of investment
finance for SMEs. British, French, German and Polish SMEs saw the greatest contribution from leasing
towards their investment in 2013. A similar picture is presented when considering the sectoral level whereby
cash/equity accounts for the largest share of SME investment.
These findings highlight the fact that SMEs are still largely reliant on internal sources of capital, although to a
lesser extent than previously. Increasing SMEs’ use of external financing such as leasing would enable them
to fund their activities without drawing scarce resources out of the business itself.
Figure 28
20.8% 22.6%
27.9% 26.5%
7.2% 6.4%
9.8% 9.0%
15.4% 14.7%
18.9% 20.8%
0%
10%
20%
30%
40%
50%
60%
70%
80%
90%
100%
2013 2014 (estimate)
Leasing Cash/Equity
Short-term credit Loan 1-3 yrs
Loan >3 yrs Other debt
Investment finance in 2013 and 2014, medium firms
Percentage of investment financed by:
Source : Oxford Economics/EFG
17.6% 20.0%
36.3%39.4%
31.6%28.2%
14.6% 12.3%
0%
10%
20%
30%
40%
50%
60%
70%
80%
90%
100%
2010 2011 (estimate)
Leasing Cash/Equity
Bank loans Other debt
Investment finance in 2010 and 2011, medium firms
Percentage of investment financed by:
Source : Oxford Economics/EFG
0%
20%
40%
60%
80%
100%
FR
DE IT NL
PL
ES
SE
UK
Eu
rop
e-8
Leasing Cash/EquityShort-term credit Loan 1-3 yrsLoan >3 yrs Other debt
Investment finance in 2013 by country, all SMEs
Percentage of investment financed by:
Source : Oxford Economics/EFG

The Use of Leasing Amongst European SMEs July 2015
28
Figure 29
2.3 Have non-users used leasing in the past?
Our survey asks SMEs that do not currently lease whether they used leasing in the past. Overall, 25.8% of
firms that currently do not lease did so in the past, with this proportion falling as the size of the firm
increases. More precisely, over 30% of micro firms that did not lease in 2013 have used leasing at some
point in the past compared to 24.4% of small firms and 21.2% of medium sized firms. Of those SMEs that
formerly used leasing and did not do so in 2013, 17.2% intended to use leasing in 2014, indicating that
SMEs that previously put their investments on hold are again turning to leasing.
A breakdown by country shows large divergences, with a significant proportion of former Italian and Spanish
lessees having reported no leasing activity in 2013. This evidence reinforces our earlier analysis, which
shows a lower proportion of Italian and Spanish SMEs using leasing in 2013 compared to 2010 (see Figure
12). Given the challenges of the financial and economic crisis, these economies have suffered more than
many others, particularly SME businesses. Looking at other countries such as the UK, Sweden, Germany
and France, the proportion of former lessees not using leasing in 2013 is much lower, below 15%. Analysis
across sectors reveals far less variation compared to countries, with around 20-30% of former lessees
across all sectors, excluding agriculture and hospitality, not using leasing in 2013.
Former lessees not currently using leasing utilised a range of other finance types instead. The most popular
of these was loans of 1-3 years, which 43% of former lessees cited as a current source of finance. This was
closely followed by personal funds (42%), trade credit (36%) and loans exceeding 3 years (36%). Factoring
and private equity were the least utilised finance forms, accounting for just 13% and 18% respectively.
0%
20%
40%
60%
80%
100%
Ag
ricultu
re
Co
nstr
uctio
n
Dis
trib
utive
tra
de
s
Ho
tels
&re
sta
ura
nts
Man
ufa
ctu
rin
g
Min
ing &
utilit
ies
Pro
fessio
nal
serv
ice
s
Re
al esta
te
Tra
nsp
ort
&sto
rag
e
All
se
cto
rs
Leasing Cash/Equity
Short-term credit Loan 1-3 yrs
Loan >3 yrs Other debt
Investment finance in 2013 by sector, all SMEs
Percentage of investment financed by:
Source : Oxford Economics/EFG

The Use of Leasing Amongst European SMEs July 2015
29
Figure 30 Figure 31
Figure 32
2.4 The size of the market for leasing by SMEs
In this section, we estimate the overall size of the market for leasing by European SMEs in 2013 with the aim
of comparing the SME leasing market to the overall European market as identified by Leaseurope through its
Annual Statistical Enquiry (ASE). The ASE gathers information on the scale of leasing activities from national
leasing associations to generate a comprehensive overview of total leasing activity around the continent.
Our approach is by necessity slightly different – we have estimates of penetration rates from our sample of
firms and we multiply this by our estimates of investment (Gross Fixed Capital Formation) by SMEs in 2013.
Data on investment by non-financial sector SMEs is available until 2011 for most countries; we have updated
these using our own forecasts of SME investment in subsequent years. These forecasts are based on the
relationship between investment by micro, small and medium firms in each country and relevant economic
variables, including GDP growth, lending rates, credit supply, manufacturing output and the relevant lagged
value of investment.
25.8%
0%
5%
10%
15%
20%
25%
30%
35%
Micro Small Medium SMEs
Proportion of former lessees not using leasing in 2013, by firm size
Source : Oxford Economics/EFG
25.8%
0%
10%
20%
30%
40%
50%
60%
70%
UK SE DE FR PL Europe-8 NL IT ES
Proportion of former lessees not using leasing in 2013, by country
Source : Oxford Economics/EFG
25.8%
0%
5%
10%
15%
20%
25%
30%
35%
40%
45%
Real esta
te
Dis
trib
utive
trades
Tra
nsport
&sto
rage
Manufa
ctu
ring
Pro
fessio
nal
serv
ices
All
secto
rs
Constr
uction
Min
ing &
utilit
ies
Agriculture
Hote
ls &
resta
ura
nts
Proportion of former lessees not using leasing in 2013, by sector
Source : Oxford Economics/EFG

The Use of Leasing Amongst European SMEs July 2015
30
These estimates show a steady level of European investment by SMEs across most countries between 2011
and 2013 (see Figure 33). Some increases in investment over these years can be seen in Italy and the UK,
while Spain experienced a slight decrease. Various national programmes aimed at helping SMEs grow, such
as those offered by the British Business Bank (BBB) in the UK, obviously have an impact. A total of £782
million in new lending reached smaller UK businesses in the financial year 2013/14 as a result of the BBBs
activities – more than twice the amount generated in 2012/13.
Across the Europe-8 a large proportion of overall investment was accounted for by micro and small sized
firms, with over 60% of investment being attributable to these firm sizes in most countries. This highlights the
relative importance of these smaller firms, especially micro firms, which are significant contributors to
European output and employment.
Figure 33 Figure 34
Applying these estimates for SME investment to our penetration rate as derived in the survey allows us to
estimate the total value of leasing to SMEs in 2013. Our estimate in the 8 countries surveyed is €73.6 billion
(or 6.6 million SMEs), with a large proportion accounted for by micro firms’ leasing activity. Scaling this up to
the EU level and assuming the penetration rate for Europe-8 is applicable to the remaining 29% of
investment from other countries around the continent, implies that the overall size of the market for leasing to
SMEs in Europe is just over €103.6 billion in 2013.26
This translates to roughly 9.2 million SMEs benefitting
from leasing.
By comparison, the total value of new leasing volumes reported in Leaseurope’s ASE was €252 billion in
2013, slightly up from 2012. As such, SME leasing accounted for 41% of total leasing in Europe in 2013, or
50% when adjusted to exclude leasing to consumers and the public sector.
26 According to Eurostat, the 8 countries covered by our survey account for 71% of investment in the EU.
0
10
20
30
40
50
60
70
80
90
FR DE IT NL PL ES SE UK
2011 2012 2013
Investment by European SMEs€ bn
Source : Oxford Economics/EurostatNote : 2011 data from Eurostat, 2012-13 OE estimates (except UK 2012 from Eurostat)
0%
10%
20%
30%
40%
50%
60%
70%
80%
90%
100%
FR DE IT NL PL ES SE UK Europe-8
Micro Small Medium
Proportion of SME investment by firm size and country, 2013
Source : Oxford Economics/Eurostat
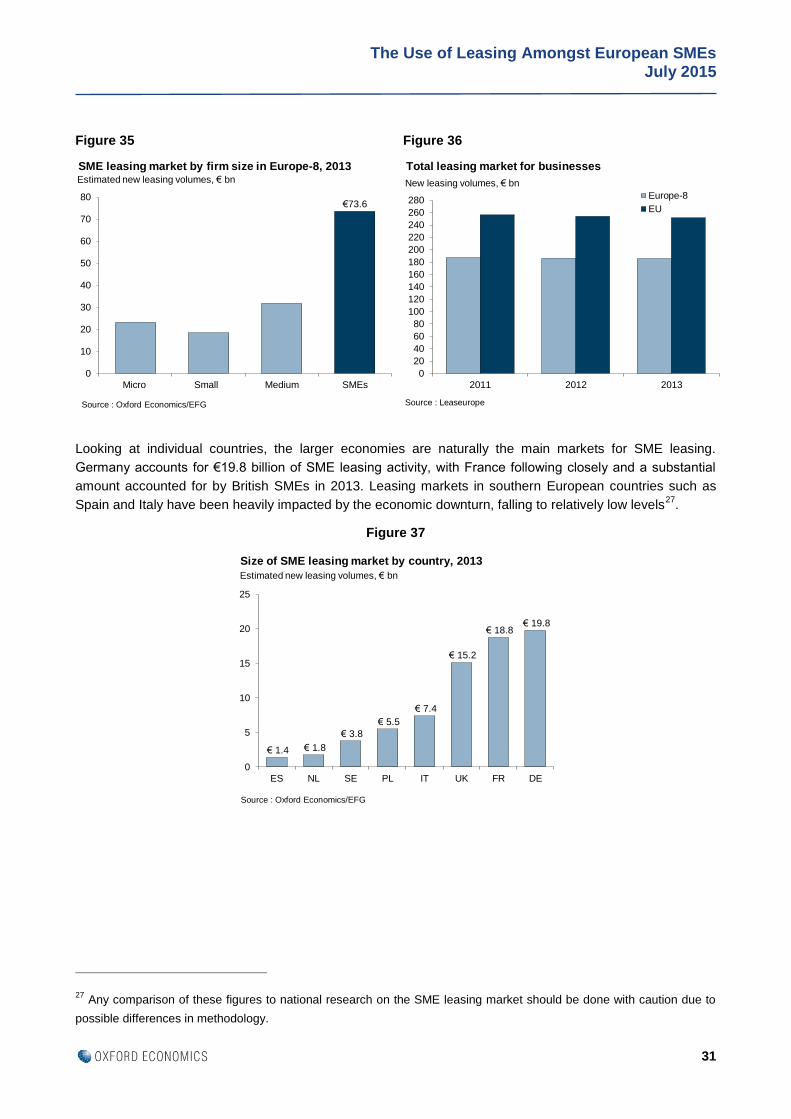
The Use of Leasing Amongst European SMEs July 2015
31
Figure 35 Figure 36
Looking at individual countries, the larger economies are naturally the main markets for SME leasing.
Germany accounts for €19.8 billion of SME leasing activity, with France following closely and a substantial
amount accounted for by British SMEs in 2013. Leasing markets in southern European countries such as
Spain and Italy have been heavily impacted by the economic downturn, falling to relatively low levels27
.
Figure 37
27 Any comparison of these figures to national research on the SME leasing market should be done with caution due to
possible differences in methodology.
€73.6
0
10
20
30
40
50
60
70
80
Micro Small Medium SMEs
SME leasing market by firm size in Europe-8, 2013Estimated new leasing volumes, € bn
Source : Oxford Economics/EFG
0
20
40
60
80
100
120
140
160
180
200
220
240
260
280
2011 2012 2013
Europe-8
EU
Total leasing market for businesses
New leasing volumes, € bn
Source : Leaseurope
€ 1.4 € 1.8
€ 3.8
€ 5.5
€ 7.4
€ 15.2
€ 18.8 € 19.8
0
5
10
15
20
25
ES NL SE PL IT UK FR DE
Size of SME leasing market by country, 2013
Estimated new leasing volumes, € bn
Source : Oxford Economics/EFG

The Use of Leasing Amongst European SMEs July 2015
32
3. What do SMEs lease, why and through which channels?
Key points
SMEs lease a wide range of assets, indicating that the leasing industry is able to finance almost all
types of goods. In 2013, vehicles remained the most frequently leased asset type across all
countries and economic sectors.
Vehicles and machinery & industrial equipment dominated SME’s total equipment leasing
expenditure.
Capital intensive industries (e.g. agriculture, manufacturing, mining & utilities and construction)
financed larger sums of their machinery & industrial equipment through leasing than other sectors.
Firms in service sectors financed relatively higher amounts on ICT & office equipment.
The vendor channel remains the most popular distribution channel, with its use by SMEs growing
from 67.4% in 2010 to 78.6% in 2013. This channel is particularly important for micro firms, where
the use of vendor leasing rose substantially in 2013. Access to leasing directly from the lessor
increased slightly to 40.4% while use of the banking channel by SMEs remained stable at 58.6%.
SMEs ranked all the benefits of leasing highly in 2013 and most have increased in importance since
2010, particularly for micro firms. This indicates a growing appeal for leasing amongst SMEs in many
different circumstances as it provides a range of benefits that meet the needs of diverse businesses.
While no single reason stands out particularly, the price of financing an asset via leasing relative to
other forms of finance remains the most popular reason to use leasing in 2013. Better cash flow
management, ability to adapt the length of the contract and transparency of lease payments also
rank as important benefits.
For both lessees and non-users, the preference to own assets outright remains a key reason for not
using leasing more, although this has decreased in importance for lessees since 2010. Overall,
lessees placed less importance on all reasons not to lease, while non-users found these motives
increasingly relevant.
3.1 What assets do SMEs lease?
In our survey, SMEs reported leasing a wide range of assets. We analyse six general categories, of which,
the top three asset categories reported are machinery & industrial equipment, passenger cars & light
commercial vehicles; and ICT & office equipment, with these accounting for 65% of total SME leasing. This
section focuses on equipment assets (including vehicles) that SMEs leased28
.
The top three asset categories leased remained the most popular in 2013. Growth was seen in ‘other
equipment’29
and ‘medium & heavy commercial vehicles’ categories over this period, which were previously
28 We disregard leasing of real estate as leasing is used much less frequently to finance property.
29 ‘Other equipment’ could include assets such as medical equipment and renewable energy equipment.

The Use of Leasing Amongst European SMEs July 2015
33
relatively small categories30
. The average investment financed by leasing gives a more complete picture
when looking at these assets31
. In 2013, the average lessee invested €128,512 through leasing across all
equipment assets (excluding real estate). Out of this total investment figure, average investment in motor
vehicles32
was higher than any other asset at €63,000, increasing substantially from €41,000 in 2010. This
suggests that leasing is particularly suited to motor vehicles and that the advantages of vehicle leasing are
universal to SMEs. Machinery & industrial equipment was the second most financed asset type at an
average of €33,800 in 2013 – almost half the value spent on motor vehicles in the same period.
Figure 38 Figure 39
30 The notable increase in the use of ‘other equipment’, which includes items relating to renewable energy, could be
partially explained by energy and climate targets set by the European Union. For example, the ‘Horizon 2020
Programme’, backed by the European Commission, supports highly innovative SMEs within areas including low carbon
energy systems; greener and more integrated transport; eco-innovation and sustainable raw material supply and
biotechnology-based industrial processes.
31 The average investment financed by leasing is calculated by taking the total amount each lessee spent on leasing a
particular asset type and calculating an average value across all lessees. Because the denominator is all lessees, this
average will potentially include firms who spent zero on that particular asset.
32 Motor vehicles include passenger cars & light commercial vehicles and medium & heavy commercial vehicles.
0%
5%
10%
15%
20%
25%
30%
Machin
ery
&in
dustr
ial equip
ment
Passenger
cars
& lig
ht
com
merc
ial vehic
les
ICT
& o
ffic
eequip
ment
Oth
er
equip
ment
Mediu
m &
heavy
com
merc
ial vehic
les
Real esta
te2010
2013
Leasing by type of asset, 2010 and 2013Percentage of SMEs reporting they had leased asset
Source : Oxford Economics/EFG
FR DE IT NL PL ES SE UK Europe-8
Machinery & industrial equipment 32.0% 32.4% 10.4% 19.5% 27.7% 7.3% 17.0% 31.6% 22.6%
ICT & office equipment 25.8% 36.0% 1.1% 10.5% 26.7% 2.2% 28.0% 37.3% 20.9%
Other equipment 17.3% 40.9% 1.6% 20.5% 5.3% 4.0% 22.0% 20.9% 16.3%
Passenger cars & light commercial vehicles 37.8% 31.3% 9.1% 8.5% 21.7% 5.8% 27.0% 26.0% 21.4%
Medium & heavy commercial vehicles 21.3% 27.1% 3.6% 10.0% 12.0% 3.6% 26.0% 16.4% 14.6%
Real estate 24.9% 10.0% 0.7% 2.0% 5.3% 2.7% 12.5% 7.3% 8.5%
Source : Oxford Economics/EFG
Table 1 - Proportion of firms in each country reporting they leased the following asset types, 2013
0
20
40
60
80
Machin
ery
&in
dustr
ial equip
ment
ICT
& o
ffic
eequip
ment
Oth
er
equip
ment
Moto
r vehic
les
Real esta
te
€ thousand
2010
2013
Average investment financed by leasing per asset type, 2010 and 2013
Source : Oxford Economics/EFG

The Use of Leasing Amongst European SMEs July 2015
34
A similar pattern in both use of asset types and average investment financed by leasing can be seen across
all firm sizes. The use of leasing across all asset types grows as firm size increases. To illustrate, 12.9% of
micro firms reported leasing machinery & industrial equipment in 2013 with an average investment financed
by leasing of €19,684, versus 24.0% and €29,094 for small firms and 32.8% and €47,611 for medium firms.
Figure 40 Figure 41
Figures 42-43 state the average amounts spent by lessees on various leased assets across different sectors.
As seen in our previous study, “capital intensive” industries, such as agriculture, manufacturing, mining &
utilities and construction, financed larger sums of their machinery & industrial equipment through leasing,
between €57,000 and €68,000. Meanwhile firms in service sectors such as professional services and real
estate financed relatively higher amounts on ICT & office equipment through leasing, over €18,000 and
€15,000 respectively. Interestingly, the mining & utilities sector invested the second largest amount through
leasing on ICT & office equipment, only slightly below professional services. All sectors spend a relatively
large amount on vehicles, particularly transport & storage and real estate firms. A slightly larger amount of
average investment is for passenger cars & light commercial vehicles (€35,030) compared to medium &
heavy commercial vehicles (€27,901).
0
10
20
30
40
50
Machin
ery
&in
dustr
ial equip
ment
ICT
& o
ffic
eequip
ment
Oth
er
equip
ment
Real esta
te
Passenger
cars
& lig
ht
com
merc
ial vehic
les
Mediu
m &
heavy
com
merc
ial vehic
les
€ thousandMicro Small Medium
Average investment financed by leasing per asset type, by firm size, 2013
Source : Oxford Economics/EFG
0%
10%
20%
30%
40%
Machin
ery
&in
dustr
ial equip
ment
Passenger
cars
& lig
ht
com
merc
ial vehic
les
ICT
& o
ffic
eequip
ment
Oth
er
equip
ment
Mediu
m &
heavy
com
merc
ial vehic
les
Real esta
te
Micro Small Medium
Leasing by type of asset by firm size, 2013
Source : Oxford Economics/EFG
Percentage of firms reporting they had leased asset

The Use of Leasing Amongst European SMEs July 2015
35
Figure 42 Figure 43
Significant variations across the Europe-8 average exist when looking at individual countries. French lessees
financed significantly higher amounts through leasing in 2013 across all asset categories compared to other
countries. Within this total investment, both vehicle categories and machinery & industrial equipment
increased significantly on 2010 results for French lessees, with an average of €80,000 for passenger cars &
light commercial vehicles, €55,000 for medium & heavy commercial vehicles and €70,000 for machinery &
industrial equipment in 2013. In contrast, German lessees financed almost €28,000 in machinery & industrial
equipment this way and British firms almost €30,000. When it comes to ICT & office equipment, British and
Polish firms financed a higher proportion through leasing than lessees in other countries.
Figure 44 Figure 45
0
40
80
120
160
200
Ag
ricu
ltu
re
Constr
uctio
n
Min
ing
&u
tilit
ies
Ma
nufa
ctu
rin
g
Tra
nspo
rt &
sto
rage
All
se
cto
rs
Medium & heavy commercial vehiclesPassenger cars & light commercial vehiclesOther equipmentICT & office equipmentMachinery & industrial equipment
Average investment financed by leasing per asset type, capital intensive sectors, 2013
€ thousand
Source : Oxford Economics/EFGSource : Oxford Economics/EFG
0
40
80
120
160
200
Pro
fessio
nal
se
rvic
es
Rea
l esta
te
Dis
trib
utive
tra
de
s
Ho
tels
&re
sta
ura
nts
All
se
cto
rs
Medium & heavy commercial vehicles
Passenger cars & light commercial vehicles
Other equipment
ICT & office equipment
Machinery & industrial equipment
Average investment financed by leasing per asset type, non-capital intensive sectors, 2013
€ thousand
Source : Oxford Economics/EFG
0
50
100
150
200
250
300
FR SE DE UK Europe-8
Medium & heavy commercial vehicles
Passenger cars & light commercial vehicles
Other equipment
ICT & office equipment
Machinery & industrial equipment
Average investment financed by leasing per asset type, by country, 2013
€ thousand
Source : Oxford Economics/EFG
0
50
100
150
200
250
300
ES NL IT PL Europe-8
Medium & heavy commercial vehicles
Passenger cars & light commercial vehicles
Other equipment
ICT & office equipment
Machinery & industrial equipment
Average investment financed by leasing per asset type, by country, 2013
€ thousand
Source : Oxford Economics/EFG

The Use of Leasing Amongst European SMEs July 2015
36
3.2 How do SMEs access leasing products?
The various channels through which customers access leasing can be grouped into two broad groups of
channels: the vendor channel and the customer channel.
In the vendor channel a potential lessee approaches the manufacturer or dealer of an asset and
accesses the lease through the manufacturer/dealer. The manufacturer/dealer may have an
arrangement with a third party lessor that allows the customer to lease the asset, or it may simply
provide the finance directly itself33
. In other words, when making use of the vendor channel, the
lessee accesses the lease at the point of sale of the asset.
The customer channel involves initiating contact between the lessee and the provider of the lease
in a number of ways, e.g. through the bank branch of the customer, directly through the sales
network of a lessor or through a broker that may provide a range of financial services, including
leasing.
European SMEs access their leasing from a range of sources, with a substantial degree of variation across
countries and sectors. Figures 46-49 look at the proportions of lessees who reported using the different
channels. These proportions are not however, proportions of actual leasing, so care is required in
interpreting them – it could be that a high proportion of firms use a particular channel for a very small part of
leasing. In most cases the typical SME used more than one channels to access leasing in 2013.
The importance of the vendor channel, which plays a significant role in supporting large volumes of small
ticket contracts such as cars and office equipment, remains evident and has increased over time. Across
Europe-8, 78.6% of lessees used the vendor channel in 2013 compared to 67.4% in 2010. The direct sales
network of finance companies (lessors) also grew, from 35.9% in 2010 compared to 40.4% in 2013.
Meanwhile the second most frequently used channel for accessing leasing, i.e. the banking channel,
remained broadly stable over the period (from 57.8% in 2010 to 58.6% in 2013). Over this period
manufacturers had a competitive advantage over banks as they were relatively cash rich, enabling captive
lessors to access relatively cheap funding.
SMEs’ use of different channels varies substantially across countries, with well-structured and healthy
economies tending to sustain larger and more established leasing channels. Only 43.1% of Spanish lessees
accessed leasing through vendors compared to around 90% in Germany and the Netherlands. Although the
proportion of Spanish lessees using this channel remained broadly unchanged since 2010, use of the vendor
channel in Germany and the Netherlands, among other countries, has increased, thereby widening the
degree of divergence since the previous report. When looking at access to leasing via bank networks, British,
French and Spanish firms’ use of this channel remains more pronounced than other countries, with 82.7% of
British lessees using it to access leases.
Figures 48 and 49 show lower degrees of variation in the use of all distribution channels at the sector level
compared to the country breakdowns. For example, the proportion of lessees using the vendor channel rests
between 60.5% (hotels & restaurants) and 89.7% (agriculture) across sectors compared with 43.1% and
90.2% across countries. While all industrial sectors turned to the vendor channel the most, the manufacturing
sector had the highest proportion of firms accessing leasing through the banking channel relative to the other
sectors and real estate firms made the most use of lessors and brokers. This suggests that the structure of
the economy, the type of asset being commonly leased and the maturity of the various sales networks in
each country influence how firms access the leasing market.
33 Manufacturer/dealer owned leasing companies are known as captive lessors.

The Use of Leasing Amongst European SMEs July 2015
37
Since small and medium sized enterprises use leasing more intensively than micro enterprises it is no
surprise that the frequency of a given lessee using a particular channel also rises as we move up the
spectrum of firm size. If a firm is using leasing for a larger proportion of its capital expenditure it is more likely
to access leasing through more than one channel at any given time. The likelihood of a lessee accessing a
lease through a banking channel or directly from a lessor increases in line with firm size. While use of the
vendor channel increased for all firm sizes between 2010 and 2013, the likelihood of a micro size lessee
accessing a lease via this channel rose substantially. This highlights the growing importance of the vendor
channel for micro firms that often require financing on smaller contracts and do not necessarily have
established relationships with financial institutions.
Figure 46 Figure 47
Figure 48 Figure 49
0%
10%
20%
30%
40%
50%
60%
70%
80%
90%
100%
FR DE IT NL Europe-8
Vendor Bank
Lessor Brokers
Proportion of lessees using each channel by country, 2013
Source : Oxford Economics/EFG
0%
10%
20%
30%
40%
50%
60%
70%
80%
90%
100%
PL ES SE UK Europe-8
Vendor Bank
Lessor Brokers
Proportion of lessees using each channel by country, 2013
Source : Oxford Economics/EFG
0%
10%
20%
30%
40%
50%
60%
70%
80%
90%
100%
Ag
ricu
ltu
re
Constr
uction
Min
ing &
utilit
ies
Manufa
ctu
ring
Tra
nsport
&sto
rage
Vendor Bank
Lessor Brokers
Proportion of lessees using each channel by sector, 2013
Source : Oxford Economics/EFG
0%
10%
20%
30%
40%
50%
60%
70%
80%
90%
100%
Pro
fessio
nal
serv
ices
Real esta
te
Dis
trib
utive
trades
Hote
ls &
resta
ura
nts
All
secto
rsVendor Bank
Lessor Brokers
Proportion of lessees using each channel by sector, 2013
Source : Oxford Economics/EFG

The Use of Leasing Amongst European SMEs July 2015
38
Figure 50
3.3 Why do SMEs choose leasing?
There are many reasons why leasing is attractive to SMEs, particularly those with scarce financial resources.
Some potential reasons include:
As the lessor remains the legal owner of the asset throughout the lease, it can finance up to 100% of
the purchase price of an asset without requiring any supplementary guarantees or collateral. This
also means that lessors can provide funding to businesses when other types of lenders cannot e.g.
for a start-up with no financial history or relationship with a finance provider.
Lessees can better manage their working capital by spreading payments over the life of the asset.
Leasing enables the use of equipment without having to worry about considerations linked to
ownership such as second hand asset values or the disposal of the asset when it is no longer
required.
SMEs can opt for leases that cover all of their asset-related needs, for example services such as
insurance and maintenance of the asset can be included in a package together with the lease.
Leasing also offers businesses the ability to return their leased equipment at the end of the lease
term and upgrade to the latest and most energy efficient technology.
Lessees can adapt the length of the contract to suit their specific needs, for example a builder can
lease a piece of construction equipment for a term that matches the duration of a building contract.
In this section we look at the responses given by lessees as to why they used leasing. Our results show a
fairly narrow dispersion across most reasons, which indicates that leasing is attractive to SMEs in many
diverse circumstances for various reasons. The leasing industry provides a suite of benefits that meet the
needs of a wide range of SMEs.
0%
10%
20%
30%
40%
50%
60%
70%
80%
90%
100%
Micro Small Medium SMEs
Vendor BankLessor Brokers
Proportion of lessees using each channel by firm size, 2013
Source : Oxford Economics/EFG

The Use of Leasing Amongst European SMEs July 2015
39
Table 2 shows the reasons why firms use leasing using a scoring system of 0 if the firm said the reason was
not at all important, 0.5 if it was quite important and 1 if it was very important. For this section of the survey
only firms that did use leasing were asked this question. We set out some of the main highlights and points
of interest in this analysis, with more detailed results for each country and sector in Appendix 3.
The average scores across SMEs generally increased in 2013 compared to 2010 for most of the 11 reasons
we offer respondents as to why they use leasing. In line with the results reported in 2010, the price of
financing the asset via leasing relative to other forms of financing remains the most popular reason, although
all reasons were ranked as quite important with scores over 0.5. Other popular reasons include better cash
flow management, ability to adapt the contract term to the company’s needs and predictability and
transparency of lease payments. The most notable change since the previous report was that SMEs valued
the ability to finance up to 100% of the purchase price without having to provide additional
collateral/guarantees significantly less, which could be a function of the improving economic situation. The
perceived benefits of leasing are also likely to vary depending on the assets leased and the nature of the
SMEs business.
Analysis at the firm size level reveals that scores for micro firms, which were previously much lower than for
small and medium firms, increased markedly in 2013, bringing many micro firm scores higher than the other
firm sizes. We already showed in Chapter 2 that leasing use and penetration rates have increased markedly
for micro firms, which appears to have simultaneously improved their awareness and understanding of the
benefits of leasing (see Figure 51). The price of leasing the asset relative to other forms of finance remained
the most popular reason to use leasing across all firm sizes, followed closely by cash flow management
benefits. As SMEs usually experience tighter profit margins compared to larger firms, their prioritisation of
price and cash flow concerns is warranted.
(0 = not at all important, 0.5 = quite important, 1 = very important)
Rank (2013) Rank (2010) Reason Score (2013) Score (2010)
1 1 Better price than other forms of finance 0.73 0.68
2 4 Enables better cash flow management 0.70 0.66
3 5Ability to adapt the length of the contract according to your
company’s needs0.68 0.65
4 7Predictability & transparency of rental payments and
transparency of rental payments 0.68 0.62
5 6 Accounting benefits 0.64 0.64
6 2 Tax benefits 0.63 0.67
7 9Ability to upgrade and renew assets more frequently than
purchasing would allow0.62 0.60
8 8
Ability to use assets without bearing the risks of
ownership e.g. risks on second hand asset values or the
disposal of the asset
0.62 0.60
9 10
Ability to bundle finance with optional services e.g.
installation, insurance, maintenance repair of the leased
asset
0.61 0.59
10 3Ability to finance up to 100% of the purchase price without
having to provide guarantees or collateral0.59 0.66
11 11It is easier / faster to obtain leasing than other forms of
finance0.52 0.57
Source : Oxford Economics/EFG
Table 2 - Reasons to use leasing
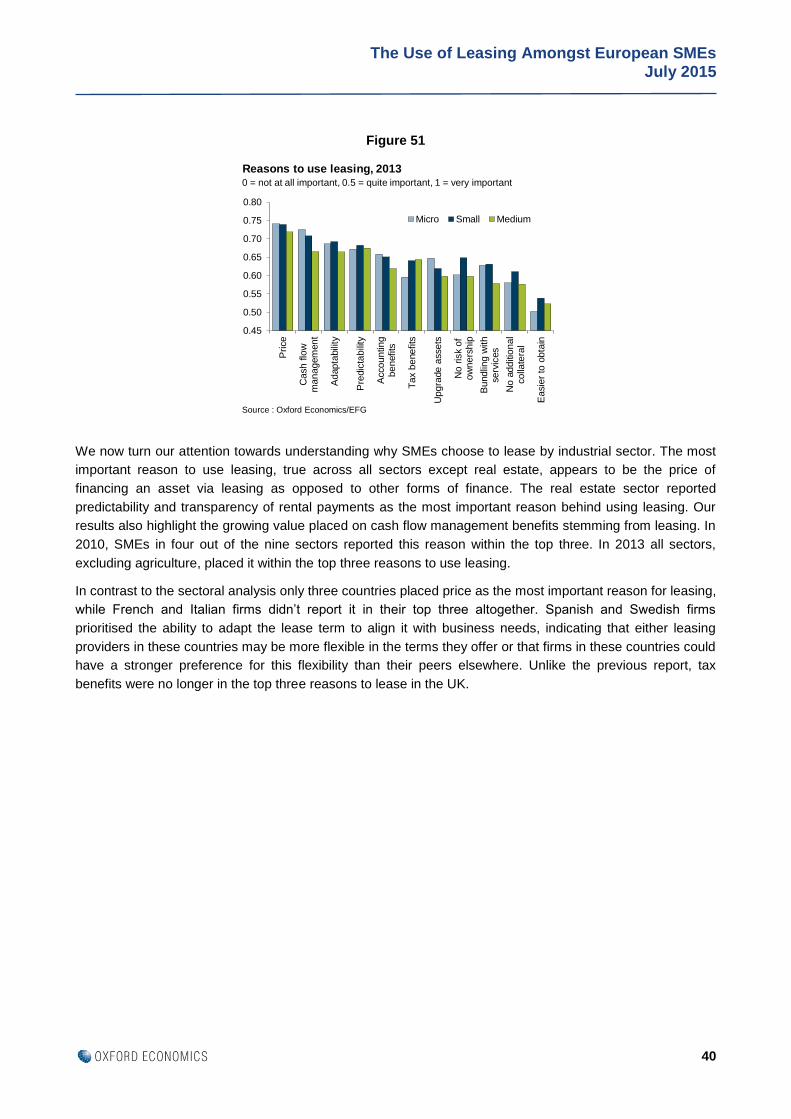
The Use of Leasing Amongst European SMEs July 2015
40
Figure 51
We now turn our attention towards understanding why SMEs choose to lease by industrial sector. The most
important reason to use leasing, true across all sectors except real estate, appears to be the price of
financing an asset via leasing as opposed to other forms of finance. The real estate sector reported
predictability and transparency of rental payments as the most important reason behind using leasing. Our
results also highlight the growing value placed on cash flow management benefits stemming from leasing. In
2010, SMEs in four out of the nine sectors reported this reason within the top three. In 2013 all sectors,
excluding agriculture, placed it within the top three reasons to use leasing.
In contrast to the sectoral analysis only three countries placed price as the most important reason for leasing,
while French and Italian firms didn’t report it in their top three altogether. Spanish and Swedish firms
prioritised the ability to adapt the lease term to align it with business needs, indicating that either leasing
providers in these countries may be more flexible in the terms they offer or that firms in these countries could
have a stronger preference for this flexibility than their peers elsewhere. Unlike the previous report, tax
benefits were no longer in the top three reasons to lease in the UK.
0.45
0.50
0.55
0.60
0.65
0.70
0.75
0.80
Price
Cash flo
wm
anagem
ent
Adapta
bili
ty
Pre
dic
tabili
ty
Accounting
benefits
Tax b
enefits
Upgra
de a
ssets
No r
isk o
fow
ners
hip
Bundlin
g w
ith
serv
ices
No a
dditio
nal
colla
tera
l
Easie
r to
obta
in
Micro Small Medium
Reasons to use leasing, 20130 = not at all important, 0.5 = quite important, 1 = very important
Source : Oxford Economics/EFG

The Use of Leasing Amongst European SMEs July 2015
41
Sector Rank Reason Score
Agriculture 1 Better price than other forms of finance 0.81
2Predictability & transparency of rental payments and transparency of rental
payments 0.74
3Ability to use assets without bearing the risks of ownership e.g. risks on
second hand asset values or the disposal of the asset 0.72
Construction 1 Better price than other forms of finance 0.79
2 Ability to adapt the length of the contract according to your company’s needs 0.74
3 Enables better cash flow management 0.71
Distributive trades 1 Better price than other forms of finance 0.72
2 Ability to adapt the length of the contract according to your company’s needs 0.72
3 Enables better cash flow management 0.71
Hotels & restaurants 1 Better price than other forms of finance 0.80
2 Enables better cash flow management 0.75
3Ability to use assets without bearing the risks of ownership e.g. risks on
second hand asset values or the disposal of the asset 0.75
Manufacturing 1 Better price than other forms of finance 0.74
2 Enables better cash flow management 0.69
3 Ability to adapt the length of the contract according to your company’s needs 0.67
Mining & utilities 1 Better price than other forms of finance 0.79
2 Enables better cash flow management 0.74
3 Tax benefits 0.74
Professional services 1 Better price than other forms of finance 0.69
2Predictability & transparency of rental payments and transparency of rental
payments 0.67
3 Enables better cash flow management 0.66
Real estate 1Predictability & transparency of rental payments and transparency of rental
payments 0.69
2 Enables better cash flow management 0.67
3 Better price than other forms of finance 0.65
Transport & storage 1 Better price than other forms of finance 0.77
2 Enables better cash flow management 0.76
3Predictability & transparency of rental payments and transparency of rental
payments 0.74
Table 3 - Most important reasons to use leasing by sector, 2013
Source : Oxford Economics/EFG
(0 = not at all important, 0.5 = quite important, 1 = very important)

The Use of Leasing Amongst European SMEs July 2015
42
Overall the results of our survey suggest that some of the benefits of leasing are valued across all industrial
sectors, in particular price competiveness and, to a large extent, cash flow management benefits, but at the
national level attitudes appear somewhat different. This indicates that SMEs in the same industry but in
different countries could have different attitudes towards leasing. This could be a factor of the firm owners’
preferences, the approach of leasing firms in the local market or the regulatory and tax environment in
Country Rank Reason Score
FR 1 Predictability and transparency of rental payments 0.81
2 Enables better cash flow management 0.79
3Ability to adapt the length of the contract according to your
company’s needs 0.77
DE 1 Better price than other forms of finance 0.72
2 Predictability and transparency of rental payments 0.72
3Ability to adapt the length of the contract according to your
company’s needs 0.69
IT1
Ability to finance up to 100% of the purchase price without having to
provide guarantees or collateral 0.74
2Ability to use assets without bearing the risks of ownership e.g. risks
on second hand asset values or the disposal of the asset 0.66
3 Accounting benefits 0.66
NL 1 Better price than other forms of finance 0.87
2 Enables better cash flow management 0.82
3Ability to upgrade and renew assets more frequently than purchasing
would allow 0.79
PL 1 Better price than other forms of finance 0.86
2 Enables better cash flow management 0.68
3 Tax benefits 0.68
ES1
Ability to adapt the length of the contract according to your
company’s needs 0.72
2 Predictability and transparency of rental payments 0.72
3 Better price than other forms of finance 0.68
SE1
Ability to adapt the length of the contract according to your
company’s needs 0.76
2 Better price than other forms of finance 0.74
3 Predictability and transparency of rental payments 0.73
UK 1 Enables better cash flow management 0.68
2 Better price than other forms of finance 0.68
3Ability to use assets without bearing the risks of ownership e.g. risks
on second hand asset values or the disposal of the asset 0.67
Table 4 - Most important reasons to use leasing by country, 2013
Source : Oxford Economics/EFG
(0 = not at all important, 0.5 = quite important, 1 = very important)

The Use of Leasing Amongst European SMEs July 2015
43
individual countries. However, to examine this issue in more detail based on the current dataset would run
the risk of disaggregating the data down to a level at which the results are not as robust as we desire.
Clearly lessees in different countries and sectors derive different benefits from using leasing. In the near
term, with Europe’s economic recovery still fairly weak, firms value the price competitiveness of leasing and
the ability to adapt the length of a lease contract according to individual company needs. In the longer term
though, as economic recovery hopefully gathers momentum, some of the other benefits of leasing may
become even more compelling. The ability to upgrade or access new assets easily and the benefit of
bundling services with the lease rather than arranging these separately would both probably have more sway
if domestic demand started to grow more rapidly.
3.4 Why don’t SMEs use more leasing?
Table 5 shows the average scores reported by lessees and non-users as to why they didn’t use leasing for a
greater proportion of their investment in 2013. In this section we cover some of these reasons, again charting
firms’ answers against a scale where 0 = not at all important, 0.5 = quite important and 1 = very important.
Price considerations and a preference for ownership remained the most common reasons for not using
leasing for a greater portion of investment in 2013. Scores given by SMEs for these reasons stood at 0.58 –
the only rationales having scored above 0.5, and thus being considered quite important. On the face of it, it
may appear counterintuitive that price was cited as the primary objection to leasing more when it was also a
common reason for firms to use leasing. It could be that leasing is a more competitive form of financing for
some types of assets, in some markets, but less so for others.
Both reasons were also important across countries as a key disincentive to lease more, appearing in the top
three for all countries, with the exception of Sweden. Preferring to own the asset was ranked as the main
reason to not lease more in five of the eight countries. French, Swedish and British SMEs believed a better
price was attainable when purchasing the asset, ranking this as their main barrier. Additionally, the level of
perceived benefit of a tax advantage can depend on the specific tax situation of an individual SME. Looking
at the top three reasons for why Spanish, Swedish and Italian firms do not use leasing more, tax
considerations are either a particular disincentive to leasing or an incentive towards other forms of finance.
(0 = not at all important, 0.5 = quite important, 1 = very important)
Rank (2013) Rank (2010) Reason Score (2013) Score (2010)
1 2 Better price is available by purchasing assets 0.58 0.56
2 1 I prefer to own the asset outright 0.58 0.61
3 3 Tax treatment is better for asset purchases 0.49 0.51
4 5 Lack of choice in the range of assets available to be leased 0.48 0.44
5 4 I do not think leasing is an option for the asset I need 0.43 0.46
6 6 It is easier to obtain other forms of finance 0.42 0.42
7 7 I was not aware of the benefits of leasing compared to other forms of finance 0.36 0.36
Table 5 - Reasons not to use more leasing
Source : Oxford Economics/EFG

The Use of Leasing Amongst European SMEs July 2015
44
For further analysis we focus on a couple of reasons where there was a more substantial degree of variation
between users and non-users of leasing (see Table 7). For both lessees and non-users, the preference to
own assets outright remains a key reason for not using leasing more, although this reason has decreased in
importance for lessees since 2010. Overall lessees’ scores on the reasons they didn’t use leasing more
dropped in 2013 compared to 2010 for all indicators, showing that lessees’ understanding of the benefits of
leasing is improving. On the other hand, those firms not currently using leasing have seen their scores rise.
We present the full responses for this part of our survey in detail in Appendix 1 but we examine some of the
more interesting aspects here. Our latest findings reveal notable differences between users and non-users
across countries in the scores given to the preference to own assets outright and the perception that leasing
was not an option for the asset they needed. For both these reasons non-users generally reported higher
scores than lessees, though there are some exceptions (see Figures 52 and 53), with the differences far
more pronounced than in 2010. These findings highlight the fact that there is an opportunity to raise
awareness amongst non-users of leasing on the availability of leasing across a broad range of products and
its associated benefits.
Country Rank Reason Score
FR 1 Better price is available by purchasing assets 0.71
2 I prefer to own the asset outright 0.66
3 I do not think leasing products are an option for the asset I need 0.53
DE 1 I prefer to own the asset outright 0.49
2 Better price is available by purchasing assets 0.49
3 Lack of choice in the range of assets available to be leased 0.48
IT 1 I prefer to own the asset outright 0.58
2 Better price is available by purchasing assets 0.49
3 Tax treatment is better for purchases 0.47
NL 1 I prefer to own the asset outright 0.59
2 Lack of choice in the range of assets available to be leased 0.54
3 Better price is available by purchasing assets 0.53
PL 1 I prefer to own the asset outright 0.66
2 Better price is available by purchasing assets 0.63
3 Lack of choice in the range of assets available to be leased 0.61
ES 1 I prefer to own the asset outright 0.60
2 Better price is available by purchasing assets 0.59
3 Tax treatment is better for purchases 0.58
SE 1 Better price is available by purchasing assets 0.54
2 Tax treatment is better for purchases 0.52
3 Lack of choice in the range of assets available to be leased 0.50
UK 1 Better price is available by purchasing assets 0.64
2 Lack of choice in the range of assets available to be leased 0.62
3 I prefer to own the asset outright 0.58
Table 6 - Reasons not to lease more by country, 2013
Source : Oxford Economics/EFG
(0 = not at all important, 0.5 = quite important, 1 = very important)

The Use of Leasing Amongst European SMEs July 2015
45
Figure 52 Figure 53
0.0
0.1
0.2
0.3
0.4
0.5
0.6
0.7
0.8
SE FR ES DE IT PL UK NL Europe-8
Non-users Lessees
Reasons not to use more leasing: prefer to own assets outright, 2013
0 = not at all important, 0.5 = quite important, 1=very important
Source : Oxford Economics/EFG
0.0
0.1
0.2
0.3
0.4
0.5
0.6
0.7
0.8
IT PL ES UK FR SE DE NL Europe-8
Non-users Lessees
0 = not at all important, 0.5 = quite important, 1 = very important
Source : Oxford Economics/EFG
Reasons not to use more leasing: leasing products not an option for the assets needed, 2013
ReasonNon-users
(2013)
Non-users
(2010)
Lessees
(2013)
Lessees
(2010)
I prefer to own the asset outright 0.64 0.64 0.50 0.56
Better price is available by purchasing assets 0.61 0.54 0.54 0.59
Tax treatment is better for asset purchases 0.55 0.50 0.42 0.54
I do not think leasing is an option for the asset I need 0.50 0.45 0.35 0.47
Lack of choice in the range of assets available to be leased 0.47 0.41 0.48 0.49
It is easier to obtain other forms of finance 0.47 0.40 0.34 0.44
I was not aware of the benefits of leasing compared to other forms of finance 0.40 0.32 0.29 0.41
Source : Oxford Economics/EFG
Table 7 - Reasons not to use more leasing
(0 = not at all important, 0.5 = quite important, 1 = very important)

The Use of Leasing Amongst European SMEs July 2015
46
4. The importance of leasing for exporting and growth firms
Key points
Clearly exporting and growth SMEs, whose investment needs are generally higher, rely on leasing to
a much greater extent than other firms.
Looking at SME lessees, 38.8% are exporting firms compared to 23.7% of those not using leasing in
2013. This finding holds true across all firm sizes.
Not only do exporting SMEs use leasing more, but they use it more intensively than non-exporting
firms, financing 20.4% of their investment activity via leasing as opposed to 17.6% for non-exporters.
Growth SMEs require relatively high levels of funding to boost their expansion, with leasing ideally
placed to address the demands of these dynamic businesses. A lessee is more likely to be a growth
firm than a non-user, with 14.5% of lessees defined as growth SMEs compared to 12.3% of non-
users.
Growth SMEs financed almost a quarter of their investment (23.9%) via leasing in 2013 –
substantially more than non-growth SMEs at 17.7%.
A relatively similar outcome is observed across firm size, with the most pronounced difference for
micro firms. They financed a greater amount of total investment via leasing than any other firm size
at 25.7%, compared to non-growth micro firms at 13.2%.
4.1 Exporting SMEs
To gain further insight into the profile of SMEs and their use of leasing, our latest survey asked whether they
traded with other economies (within the EU and/or internationally). The economic recovery in Europe has
thus far been driven largely by export led growth, while domestic demand has been slower to regain its
footing. By tapping into foreign markets, firms that export raise their growth potential but in order to compete
internationally these firms must produce goods and services more efficiently. Leasing is a key financer of
investment in productive assets, and therefore deserves further analysis with regards to its role in supporting
exporting SMEs. This chapter will analyse the extent to which SMEs export and the importance of leasing to
those that engage in international trade activities.
4.1.1 Proportion of exporting SMEs
The evidence shows that 30.1% of all the SMEs surveyed exported, highlighting the presence they have in
foreign markets. While the overall proportion of exporting SMEs is significant, the picture varies by firm size.
We find a larger proportion of small and medium firms traded internationally in 2013, with 39.2% of medium
firms exporting versus 32.9% of small firms and 20.2% of micro firms.
The EU market is an important one for those SMEs that do export. Our results show 46.6% of exporting
SMEs traded solely within the EU, while 50.9% exported to both within and outside the EU. By contrast, only
2.6% traded exclusively outside the EU. For more detailed breakdowns on which markets SMEs are
exporting to by country and sector, please refer to Appendix 3.

The Use of Leasing Amongst European SMEs July 2015
47
A breakdown by country confirms the significant proportion of SMEs having exported, with most countries
resting closely around the Europe-8 average of 30.1% - although there are some exceptions. Only 19.8% of
Italian SMEs exported compared to 43.6% of French SMEs, with other countries falling between 25-35%.
Sectoral analysis exhibits a greater degree of variation compared to the country analysis. SMEs in
manufacturing, the largest sector, exported the most in 2013, with 49.7% of firms trading outside their
country. This is not surprising as this sector produces more tradable goods than those in other sectors such
as hospitality. In fact we find a direct link between tradability of goods produced and level of exporting
activity. Low exporting sectors, i.e. hospitality and real estate, mainly focus on European markets in the
instances when they do export.
Figure 54 Figure 55
Figure 56 Figure 57
30.1%
0%
5%
10%
15%
20%
25%
30%
35%
40%
45%
Micro Small Medium SMEs
Proportion of SMEs that export by firm size, 2013
Source : Oxford Economics/EFG
47%
3%
51%
Only EU
Only non-EU
Both
Proportion of SMEs that export by market, 2013
Source : Oxford Economics/EFG
30.1%
0%
5%
10%
15%
20%
25%
30%
35%
40%
45%
50%
IT UK ES PL Europe-8 NL DE SE FR
Proportion of SMEs that export by country, 2013
Source : Oxford Economics/EFG
30.1%
0%
10%
20%
30%
40%
50%
60%
Hote
ls &
resta
ura
nts
Real esta
te
Pro
fessio
nal
serv
ices
Constr
uction
Min
ing &
utilit
ies
All
secto
rs
Dis
trib
utive
trades
Agriculture
Tra
nsport
&sto
rage
Manufa
ctu
ring
Proportion of SMEs that export by sector, 2013
Source : Oxford Economics/EFG

The Use of Leasing Amongst European SMEs July 2015
48
4.1.2 Proportion of exporting lessees and non-users
We find that a higher proportion of lessees are exporting firms in 2013, at 38.8% compared to 23.7% of non-
users. This result holds true across all firm sizes, with the largest divergences between lessees and non-
users seen in micro and medium sized firms. As exporting firms generally invest more in order to finance
their cross-border activities than non-exporters (around €800,000 vs €300,000 respectively on average),
leasing is an important way for these SMEs to finance their investment. For example, leasing can help
exporting firms in managing working capital efficiently and diversifying their funding options, thereby
increasing their competitiveness.
Our findings also show a greater proportion of exporting firms amongst lessees relative to non-users across
all countries, albeit by varying degrees. A significant proportion of French lessees (56.1%) were exporters in
2013, while for Dutch, Spanish and Swedish lessees the level stood at over 40% - all ranking above the
Europe-8 average of 38.8%. On the lower end of the scale, around 30% of British, Italian, Polish and
German lessees reported exporting in 2013 - all of which have a relatively low proportion of exporting firms
amongst their SMEs with the exception of Germany.
The degree to which lessees are exporters is much higher than non-users across most sectors. In the real
estate, construction and mining sectors, lessees are more than twice as likely to be exporting as non-users.
The only sector where non-users have a higher proportion of exporters is hotels and restaurants.
Figure 58 Figure 59
38.8%
23.7%
0%
10%
20%
30%
40%
50%
60%
Micro Small Medium SMEs
Lessees Non-users
Proportion of lessees and non-users that export by firm size, 2013
Source : Oxford Economics/EFG
38.8%
23.7%
0%
10%
20%
30%
40%
50%
60%
UK IT PL DE Europe-8 NL SE ES FR
Lessees Non-users
Proportion of lessees and non-users that export by country, 2013
Source : Oxford Economics/EFG

The Use of Leasing Amongst European SMEs July 2015
49
Figure 60
4.1.3 Leasing penetration rates for exporting SMEs
This section builds on the previous analysis of penetration rates presented in Chapter 2, by considering
exporting and non-exporting SMEs. Evidence shows that not only do exporting SMEs use leasing more34
, but
they use it more intensively than non-exporting firms, as demonstrated by the penetration rates.
On average, exporting SMEs financed 20.4% of their investment activity via leasing compared to 17.6% for
those that do not export (as a reminder, the average for all SMEs is 18.9%). A breakdown by firm size shows
leasing to have contributed greater amounts to overall investment for micro and medium sized exporting
firms compared to non-exporting firms, while small sized firms reported fairly similar penetration rates (see
Figure 61).
Leasing penetration rates exhibit wide divergences between countries. Exporting SMEs use leasing much
more intensively than non-exporters in France and Poland, with differences of around fifteen percentage
points. Conversely, the UK and Germany, while also experiencing relatively high penetration rates, report
little difference between exporters and non-exporters. Sweden, in contrast to all the other countries, has a
much higher leasing penetration rate for non-exporters than for exporters.
Sectoral analysis tends to show fairly similar penetration rates between SMEs that export and those that do
not, with some exceptions. The hospitality sector shows a striking difference between exporters and non-
exporters, with the former having a relatively high penetration rate for leasing. On the other end of the scale,
agriculture was the only sector with a significant difference in favour of non-exporters.
34 Exporting SMEs use leasing far more than non-exporting firms, 54.7% compared to 37.1%, with this pattern holding
across all firm sizes (see Appendix 3).
38.8%
23.7%
0%
10%
20%
30%
40%
50%
60%
70%
Hote
ls &
resta
ura
nts
Re
al e
sta
te
Pro
fessio
na
lserv
ices
Co
nstr
uction
All
se
cto
rs
Dis
trib
utive
trad
es
Min
ing &
utilit
ies
Tra
nsport
&sto
rage
Ag
ricu
lture
Ma
nufa
ctu
ring
Lessees Non-users
Proportion of lessees and non-users that export by sector, 2013
Source : Oxford Economics/EFG
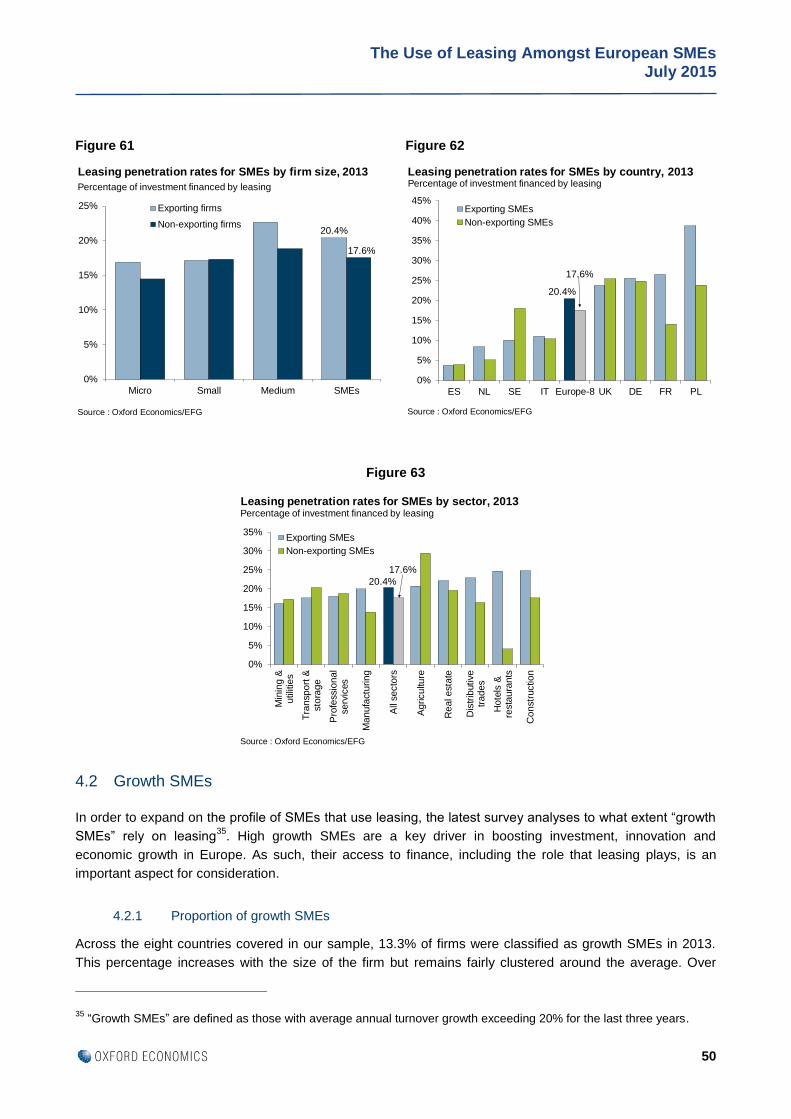
The Use of Leasing Amongst European SMEs July 2015
50
Figure 63
4.2 Growth SMEs
In order to expand on the profile of SMEs that use leasing, the latest survey analyses to what extent “growth
SMEs” rely on leasing35
. High growth SMEs are a key driver in boosting investment, innovation and
economic growth in Europe. As such, their access to finance, including the role that leasing plays, is an
important aspect for consideration.
4.2.1 Proportion of growth SMEs
Across the eight countries covered in our sample, 13.3% of firms were classified as growth SMEs in 2013.
This percentage increases with the size of the firm but remains fairly clustered around the average. Over
35 “Growth SMEs” are defined as those with average annual turnover growth exceeding 20% for the last three years.
Figure 61 Figure 62
20.4%
17.6%
0%
5%
10%
15%
20%
25%
30%
35%
Min
ing &
utilit
ies
Tra
nsport
&sto
rage
Pro
fessio
nal
serv
ices
Manufa
ctu
ring
All
secto
rs
Agriculture
Real esta
te
Dis
trib
utive
trades
Hote
ls &
resta
ura
nts
Constr
uction
Exporting SMEs
Non-exporting SMEs
Leasing penetration rates for SMEs by sector, 2013
Source : Oxford Economics/EFG
Percentage of investment financed by leasing
20.4%
17.6%
0%
5%
10%
15%
20%
25%
Micro Small Medium SMEs
Exporting firms
Non-exporting firms
Leasing penetration rates for SMEs by firm size, 2013
Source : Oxford Economics/EFG
Percentage of investment financed by leasing
20.4%
17.6%
0%
5%
10%
15%
20%
25%
30%
35%
40%
45%
ES NL SE IT Europe-8 UK DE FR PL
Exporting SMEs
Non-exporting SMEs
Leasing penetration rates for SMEs by country, 2013
Source : Oxford Economics/EFG
Percentage of investment financed by leasing

The Use of Leasing Amongst European SMEs July 2015
51
11% of micro firms stated an annual increase in turnover of at least 20% over the past three years compared
to 12.6% of small firms and 16.2% of medium sized firms. Variations across sectors are lower relative to
variations across countries, where the prevalence of growth SMEs can vary from around 5% to 25%.
Figure 64 Figure 65
Figure 66
4.2.2 Proportion of growth lessees and non-users
A lessee is more likely to be a growth firm, with 14.5% of lessees being growth SMEs in 2013 compared to
12.3% of non-users. This result is true for all firm sizes, with a more pronounced difference for micro firms.
As growth SMEs are generally more dynamic and have higher investment needs, leasing is ideally placed to
address these demands. As an illustration, in 2013 growth SMEs invested €700,000 on average while non-
growth SMEs had substantially lower average investment levels at €400,000.
This divergence between lessees and non-users is not however, consistent across all countries and sectors.
In Sweden, Poland and particularly Italy, a higher proportion of lessees are growth SMEs than non-users. On
the contrary, in Spain, Netherlands, France and Germany non-users of leasing are more likely to be growth
SMEs than lessees. These countries, with the exception of Germany, also have a relatively low proportion of
13.3%
0%
2%
4%
6%
8%
10%
12%
14%
16%
18%
20%
Constr
uction
Hote
ls &
resta
ura
nts
Tra
nsport
&sto
rage
Dis
trib
utive
trades
All
secto
rs
Manufa
ctu
ring
Pro
fessio
nal
serv
ices
Real esta
te
Agriculture
Min
ing &
utilit
ies
Proportion of SMEs that are growth firms by sector, 2013
Source : Oxford Economics/EFG
13.3%
0%
2%
4%
6%
8%
10%
12%
14%
16%
18%
Micro Small Medium SMEs
Proportion of SMEs that are growth firms by firm size, 2013
Source : Oxford Economics/EFG
13.3%
0%
5%
10%
15%
20%
25%
30%
FR ES NL IT SE Europe-8 DE PL UK
Proportion of SMEs that are growth firms by country, 2013
Source : Oxford Economics/EFG

The Use of Leasing Amongst European SMEs July 2015
52
growth firms amongst their SMEs. Sectors that show a higher proportion of growth firms amongst non-users
of leasing are hotels & restaurants, agriculture, real estate and transport & storage. In conclusion, the
likelihood of a lessee being a growth firm appears to depend to a large degree on the country and sector in
which the SME operates.
Figure 67 Figure 68
Figure 69
4.2.3 Leasing penetration rates for growth SMEs
Growth SMEs used leasing more36
, as well as financing almost a quarter of their investment (23.9%) via
leasing in 2013 – more than non-growth SMEs at 17.7%. As firm size increases, the difference in leasing
penetration rate between growth and non-growth firms is less pronounced. Micro growth firms financed a
greater amount of total investment via leasing than any other firm size at 25.7%, while non-growth micros
financed 13.2% of their investment through leasing. Leasing’s contribution to small sized growth firms’ overall
36 Growth SMEs use leasing more than non-growth firms, 46.5% compared to 41.3%, with this pattern holding across all
firm sizes (see Appendix 3).
14.5% 12.3%
0%
5%
10%
15%
20%
25%
Hote
ls &
resta
ura
nts
Pro
fessio
nal
serv
ices
Tra
nsport
&sto
rage
Constr
uction
Real esta
te
All
secto
rs
Manufa
ctu
ring
Dis
trib
utive
trades
Agriculture
Min
ing &
utilit
ies
Lessees Non-users
Proportion of lessees and non-users that are growth firms by sector, 2013
Source : Oxford Economics/EFG
14.5%
12.3%
0%
2%
4%
6%
8%
10%
12%
14%
16%
18%
Micro Small Medium SMEs
Lessees Non-users
Proportion of lessees and non-users that are growth firms by firm size, 2013
Source : Oxford Economics/EFG
14.5%12.3%
0%
5%
10%
15%
20%
25%
30%
ES FR NL SE DE Europe-8 IT UK PL
Lessees Non-users
Proportion of lessees and non-users that are growth firms by country, 2013
Source : Oxford Economics/EFG

The Use of Leasing Amongst European SMEs July 2015
53
investment activity amounted to 21.7% in 2013 and 24.1% for medium sized growth firms. This evidence
reiterates further the importance of leasing for micro firms.
Variations are much lower across sectors relative to countries, where leasing penetration rates for growth
SMEs differ from around 3% to 33%. Spanish growth SMEs financed the lowest proportion of investment via
leasing by far in 2013 at 2.7%. Meanwhile Polish growth SMEs financed over a third (33.2%) of their
investment through leasing.
Figure 70 Figure 71
Figure 72
23.9%
17.7%
0%
5%
10%
15%
20%
25%
30%
Micro Small Medium SMEs
Growth firms
Non-growth firms
Leasing penetration rates for SMEs by firm size, 2013
Source : Oxford Economics/EFG
Percentage of investment financed by leasing
23.9%17.7%
0%
5%
10%
15%
20%
25%
30%
35%
ES IT NL SE Europe-8 UK FR DE PL
Growth SMEs
Non-growth SMEs
Leasing penetration rates for SMEs by country, 2013
Source : Oxford Economics/EFG
Percentage of investment financed by leasing
23.9%
17.7%
0%
5%
10%
15%
20%
25%
30%
35%
40%
Hote
ls &
resta
ura
nts
Agriculture
Pro
fessio
nal
serv
ices
Tra
nsport
&sto
rage
Manufa
ctu
ring
All
secto
rs
Constr
uction
Dis
trib
utive
trades
Real esta
te
Min
ing &
utilit
ies
Growth SMEs
Non-growth SMEs
Leasing penetration rates for SMEs by sector, 2013
Source : Oxford Economics/EFG
Percentage of investment financed by leasing

The Use of Leasing Amongst European SMEs July 2015
54
5. Leasing’s role in driving investment and growth
Key points
SME lessees invest substantially more than non-users of leasing. In 2013, lessees invested
approximately 123% more than non-users, up from 57% in 2010. This equates to an average lessee
investment of €689,000 compared to €309,000 for non-users.
This finding remains true across all firm sizes, with the differences in investment between lessees
and non-users much more pronounced in 2013 compared to 2010. Micro lessees exhibited the
greatest increase in investment spending in 2013 relative to any other firm size, €369,000 versus
€88,000 in 2010.
Exporting lessees invest more than twice as much as non-users while the difference for growth
lessees is even more striking at over three times that of non-users.
Leasing continues to be the most important source of investment finance for those SMEs that use it,
accounting for 30.5% of their investment compared to 28.9% for all forms of bank lending together.
Leasing has become an increasingly important form of finance for young firms (under 2 years of age)
and remains a key source of finance across all other stages of an SME’s life cycle.
More lessees estimated an increase in total investment spending (35.8%) compared to non-users of
leasing (30.3%) in 2014.
The share of SME investment financed by leasing is estimated to have increased from 18.9% in
2013 to 21.2% in 2014. Combining these penetration rates with forecasts for SME investment, the
estimated size of the European SME leasing market in 2014 is €120.9 billion.
5.1 Do lessees invest more than non-users of leasing?
As seen in Chapter 3, leasing provides multiple benefits valued by SMEs. One of the key advantages of
leasing is that the firm can access asset finance in situations where traditional lending may not be available.
Additionally, SMEs value being able to manage their capital more effectively by spreading payments for the
use of the asset over the contract period. They can also adapt the contract length to suit specific business
needs and upgrade their leased equipment to take advantage of the latest technology. These benefits
enhance lessees’ flexibility and responsiveness to changing demand, particularly relevant in times of
economic growth. This would suggest that lessees invest more than non-users, especially as the economic
recovery strengthens.
5.1.1 Investment by firm size and sector
Our findings further support the evidence presented in our 2011 report for this hypothesis. Average lessee
investment increased significantly between 2010 and 2013. Lessees invested €689,000 on average in 2013
compared to €498,000 in 201037
, while the level of investment among non-users remained lower and fairly
37 It should be noted that the “SMEs” bars for lessees and non-users shown in Figures 73 and 74 are not simple
averages of the three size classes. As shown in Chapter 2, a greater proportion of medium firms (that generally invest
more) are lessees than micro or small firms.

The Use of Leasing Amongst European SMEs July 2015
55
stable over the years (€309,000 in 2013 compared to €316,000 in 2010). Therefore lessees invest
approximately 123% more than non-users of leasing, up from 57% in 2010.
A breakdown by firm size shows a similar pattern. The average amount invested by lessees outstripped that
of non-users across all firm sizes, with the differences much more pronounced in 2013 compared to 2010.
Micro lessees exhibited the greatest increase in investment spending in 2013 relative to any other firm size,
€369,000 as opposed to €88,000 in 2010, which was not reflected by those micro firms not using leasing.
This resulted in a marked divergence between micro firms that lease and those that do not in 2013,
reiterating the increasing importance of leasing as a financer of investment for micro firms. Medium sized
lessees reported the largest average investment of €1.1 million in 2013 compared to €604,000 by non-users.
Lessees invest more heavily than non-users across all sectors excluding hotels and restaurants, even in
those industries with a relatively low leasing uptake. This difference between lessee and non-user
investment is more pronounced in 2013 compared to 2010 across most sectors, especially in mining &
utilities, agriculture and real estate. Agriculture in particular has exhibited a real turnaround; in 2010 it was
the only sector where non-users invested more, whereas in 2013 agricultural lessees invested more than
firms in any other sector. While our survey results do not allow us to isolate which variable determines
causality, it seems clear that the leasing industry plays a key role in enabling European SMEs to increase
their investment.
Figure 73 Figure 74
0.0
0.2
0.4
0.6
0.8
1.0
1.2
Micro Small Medium SMEs
Non-users
Lessees
Average SME investment spending by firm size, 2010
€ mn
Source : Oxford Economics/EFG
0.0
0.2
0.4
0.6
0.8
1.0
1.2
Micro Small Medium SMEs
Non-users
Lessees
Average SME investment spending by firm size, 2013
€ mn
Source : Oxford Economics/EFG

The Use of Leasing Amongst European SMEs July 2015
56
Figure 75 Figure 76
5.1.2 Investment by exporting and growth SMEs
We have already established that lessees invest more on average than non-users. Given that lessees are
more likely to be exporting and growth SMEs, this analysis looks at whether the same is true for each of
these categories. In the case of exporting firms, lessees invest more than twice as much as non-users (€1
million versus €442,000). The divergence is even more marked for growth SMEs, where lessees invested
€1.1 million in 2013 compared to €338,000 by non-users, over three times more. This evidence indicates that
SMEs with greater investment needs (i.e. exporting and growth SMEs) turned to leasing to help finance more
of this investment.
For both non-exporting and non-growth firms, lessees again invest more than non-users of leasing, though
the difference is less pronounced. Whereas exporting firms may turn to leasing to improve their
competitiveness and growth firms can use it to help finance their expansion, the ability to upgrade assets to
the latest technologies while managing their working capital is also of benefit to non-growth and non-
exporting firms.
Figure 77 Figure 78
0.0
0.2
0.4
0.6
0.8
1.0
1.2
Export
ing
Non-
export
ing
Lessees Non-users
Average SME investment spending by exporting and non-exporting firms, 2013
€ mn
Source : Oxford Economics/EFG
0.0
0.2
0.4
0.6
0.8
1.0
1.2
Gro
wth
Non-g
row
th
Lessees Non-users
Average SME investment spending by growth and non-growth firms, 2013
€ mn
Source : Oxford Economics/EFG
0.0
0.2
0.4
0.6
0.8
1.0
1.2
1.4
1.6
Hote
ls &
resta
ura
nts
Tra
nsp
ort
&sto
rag
e
Dis
trib
utive
trad
es
Co
nstr
uctio
n
Pro
fessio
na
lserv
ices
All
secto
rs
Ma
nufa
ctu
rin
g
Re
al e
sta
te
Min
ing &
utilit
ies
Ag
riculture
Non-users Lessees
Average SME investment spending by sector, 2010
€ mn
Source : Oxford Economics/EFG
0.0
0.2
0.4
0.6
0.8
1.0
1.2
1.4
1.6
Hote
ls &
resta
ura
nts
Tra
nsp
ort
&sto
rag
e
Dis
trib
utive
trad
es
Co
nstr
uctio
n
Pro
fessio
na
lserv
ices
All
secto
rs
Ma
nufa
ctu
rin
g
Re
al e
sta
te
Min
ing &
utilit
ies
Ag
riculture
Non-users Lessees
Average SME investment spending by sector, 2013
€ mn
Source : Oxford Economics/EFG

The Use of Leasing Amongst European SMEs July 2015
57
5.1.3 Leasing compared to other forms of finance
When focusing only on SMEs that used leasing in 2013, our survey shows that leasing contributed the most
towards their investment, accounting for 30.5% compared to 28.9% for all forms of bank loans and 29.7% for
cash/equity financing. SME lessees estimated that leasing grew in importance as a form of investment
finance in 2014, while bank loans saw a decline. Lessees relied more on cash/equity finance in 2013 and
2014 compared to 2010, which was not the case for all SMEs (see Figures 20 and 21).
These findings shed light on the potential gains that could arise if lessors are able to reach the remaining
57.5% of SMEs that currently do not use leasing. SME lessees clearly value leasing as one of their main
sources of investment finance. Therefore there is potential for SMEs not yet using leasing to expand their
investment options through increasing awareness of the benefits of leasing.
Figure 79 Figure 80
5.2 SME life cycle and access to finance
The need for finance varies across the life cycle of an SME and as such, so does the form of finance chosen.
As we explored earlier in this report, access to various sources of external finance improves as firms grow
larger. One of the earliest forms of external financing a firm can access is leasing. As young firms often start
out small, this could explain why micro lessees in particular can invest more than non-users – they are taking
advantage of one of the few financing options available to them.
A large proportion of young firms continued to rely on personal funds in 2013, with the level of dependency
falling as the firm becomes more established over time. Leasing has become an increasingly important form
of finance for firms under 2 years of age and remains a key source of finance across all other stages of an
SME’s life cycle. Our survey shows that 40.3% of firms operating for less than two years used leasing in
2013, which is up from 25.6% in 2010. The proportion using leasing rises to 42.4% for more established
firms over 10 years of age. As firms evolve over time, they are generally able to diversify their financing
options to a greater extent. SMEs in the 2-5 year age group saw a drop in leasing use in 2013 compared to
the 2010 figures. This is largely a result of the number of professional services and mining firms present in
this category, for whom the use of leasing fell in 2013.
32.4% 30.6%
25.2% 27.1%
30.1% 30.7%
12.3% 11.6%
0%
10%
20%
30%
40%
50%
60%
70%
80%
90%
100%
2010 2011 (estimate)
Leasing Cash/Equity
Bank loans Other debt
Investment finance in 2010 and 2011, SME lessees
Proportion of investment financed by:
Source : Oxford Economics/EFG
30.5% 31.1%
29.7% 29.7%
6.5% 6.2%8.2% 8.3%
14.2% 13.3%
10.9% 11.3%
0%
10%
20%
30%
40%
50%
60%
70%
80%
90%
100%
2013 2014 (estimate)
Leasing Cash/Equity
Short-term credit Loan 1-3 yrs
Loan >3 yrs Other debt
Investment finance in 2013 and 2014, SME lessees
Proportion of investment financed by:
Source : Oxford Economics/EFG

The Use of Leasing Amongst European SMEs July 2015
58
Figure 81 Figure 82
5.3 Investment and leasing by European SMEs in 2014
Despite continued economic headwinds within Europe, SMEs appear relatively confident about their future
prospects. Of the SMEs surveyed, 32.7% estimated that their investment spending expanded in 2014. The
largest share (47.1%) anticipated no change in their investment spending in 2014 while only 12.4% projected
a decline. The proportion of SMEs estimating a rise in investment spending in 2014 increases with firm size.
Around 38% of medium sized firms see an expansion of investment in fixed assets, compared to 33.4% of
small and 27.5% of micro sized firms.
These results vary substantially across countries. Almost 50% of Polish SMEs and over 40% of French and
Dutch SMEs anticipated an increase in 2014 investment, with Italian, Spanish and Swedish firms trailing
behind at around 20%. Further variation exists when considering the proportion of SMEs estimating a
contraction in investment, with 21% of Swedish firms seeing a decline as opposed to 5% of Polish SMEs. On
the other hand, investment estimates across sectors are largely similar.
It is worth noting that lessees appear more optimistic about investing than non-users. More than a third of
lessees (35.8%) estimated a rise in fixed asset investment in 2014 as opposed to 30.3% of non-users.
Additionally, a lower proportion of lessees estimated a decrease in investment, only 8.4% compared to
15.4% of non-users. Lessees therefore appear to be in a position to invest more as a result of their access to
lease finance.
0%
10%
20%
30%
40%
50%
60%
70%
80%
< 2 years 2-5 years 5-10 years >10 years
Personal funds Short-term credit
Leasing Loans >3 years
Factoring Trade credit
Loans 1-3 years
SMEs using financing type by age, 2010
Source : Oxford Economics/EFG
0%
10%
20%
30%
40%
50%
60%
70%
80%
< 2 years 2-5 years 5-10 years >10 years
Personal funds Short-term credit
Leasing Loans >3 years
Factoring Trade credit
Loans 1-3 years
SMEs using financing type by age, 2013
Source : Oxford Economics/EFG
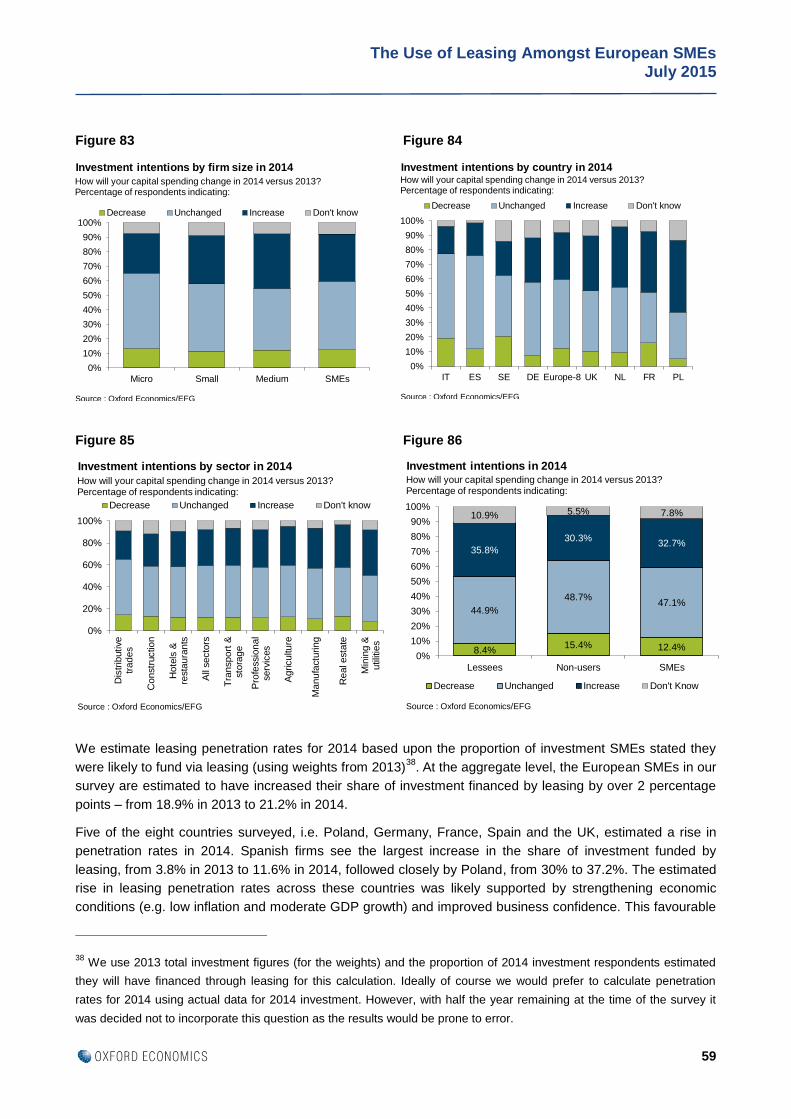
The Use of Leasing Amongst European SMEs July 2015
59
Figure 83 Figure 84
Figure 85 Figure 86
We estimate leasing penetration rates for 2014 based upon the proportion of investment SMEs stated they
were likely to fund via leasing (using weights from 2013)38
. At the aggregate level, the European SMEs in our
survey are estimated to have increased their share of investment financed by leasing by over 2 percentage
points – from 18.9% in 2013 to 21.2% in 2014.
Five of the eight countries surveyed, i.e. Poland, Germany, France, Spain and the UK, estimated a rise in
penetration rates in 2014. Spanish firms see the largest increase in the share of investment funded by
leasing, from 3.8% in 2013 to 11.6% in 2014, followed closely by Poland, from 30% to 37.2%. The estimated
rise in leasing penetration rates across these countries was likely supported by strengthening economic
conditions (e.g. low inflation and moderate GDP growth) and improved business confidence. This favourable
38 We use 2013 total investment figures (for the weights) and the proportion of 2014 investment respondents estimated
they will have financed through leasing for this calculation. Ideally of course we would prefer to calculate penetration
rates for 2014 using actual data for 2014 investment. However, with half the year remaining at the time of the survey it
was decided not to incorporate this question as the results would be prone to error.
0%
10%
20%
30%
40%
50%
60%
70%
80%
90%
100%
Micro Small Medium SMEs
Decrease Unchanged Increase Don't know
Investment intentions by firm size in 2014
Source : Oxford Economics/EFG
How will your capital spending change in 2014 versus 2013?Percentage of respondents indicating:
0%
10%
20%
30%
40%
50%
60%
70%
80%
90%
100%
IT ES SE DE Europe-8 UK NL FR PL
Decrease Unchanged Increase Don't know
Investment intentions by country in 2014
Source : Oxford Economics/EFG
How will your capital spending change in 2014 versus 2013?Percentage of respondents indicating:
0%
20%
40%
60%
80%
100%
Dis
trib
utive
trades
Constr
uction
Hote
ls &
resta
ura
nts
All
se
cto
rs
Tra
nsport
&sto
rage
Pro
fessio
nal
serv
ices
Agriculture
Manufa
ctu
ring
Real esta
te
Min
ing &
utilit
ies
Decrease Unchanged Increase Don't know
Investment intentions by sector in 2014
Source : Oxford Economics/EFGSource : Oxford Economics/EFG
How will your capital spending change in 2014 versus 2013?Percentage of respondents indicating:
8.4%15.4% 12.4%
44.9%
48.7%47.1%
35.8%
30.3%32.7%
10.9% 5.5% 7.8%
0%
10%
20%
30%
40%
50%
60%
70%
80%
90%
100%
Lessees Non-users SMEs
Decrease Unchanged Increase Don't Know
Investment intentions in 2014How will your capital spending change in 2014 versus 2013?Percentage of respondents indicating:
Source : Oxford Economics/EFG

The Use of Leasing Amongst European SMEs July 2015
60
economic backdrop helps sustain business activity and therefore investment in fixed assets. Penetration
rates in Sweden, Italy and the Netherlands are estimated to remain broadly stable in 2014. All sectors, with
the exception of agriculture, are estimated to have seen increased penetration rates in 2014, particularly
transport & storage and mining & utilities.
Figure 87 Figure 88
In Chapter 2 we estimate the size of total SME investment spending by country, and subsequently the size of
SME leasing, up until 2013. Here we extend these estimates to 2014 (see Figure 89). Increased SME
investment spending in 2014 has largely been driven by increases in Italy, the UK and to a lesser extent
Germany. With many SMEs delaying their investment decisions during the peak crisis years, it appears that,
in some countries, these SMEs are starting to invest again. More favourable economic conditions for SME
investment in the UK, supported by low interest rates and various government initiatives, help explain the
2014 increase. France, with the largest level of SME investment, appears to be contracting slightly as its
economy remains relatively subdued.
Figure 89
0
10
20
30
40
50
60
70
80
90
FR DE IT NL PL ES SE UK
2013 2014
SME investment by country€ bn, OE estimates for 2013, 2014
Source : Oxford Economics/Eurostat
18.9%
21.2%
0%
5%
10%
15%
20%
25%
30%
35%
40%
ES NL IT SE FR UK DE PL Europe-8
2013
2014
Leasing penetration rates for SMEs by country
Percentage of investment financed by leasing
Source : Oxford Economics/EFG
18.9%
21.2%
0%
5%
10%
15%
20%
25%
30%
Ho
tels
&re
sta
ura
nts
Min
ing
&u
tilit
ies
Manufa
ctu
ring
Pro
fessio
na
lserv
ices
Tra
nsport
&sto
rage
Dis
trib
utive
trades
Real esta
te
Constr
uction
Agriculture
All
secto
rs
2013 2014
Leasing penetration rates for SMEs by sector
Percentage of investment financed by leasing
Source : Oxford Economics/EFG

The Use of Leasing Amongst European SMEs July 2015
61
Combining our forecasts for penetration rates and investment by SMEs gives us an estimate of the size of
the European SME leasing market in 2014 of €85.3 billion for the eight countries in our sample, a marked
increase from €73.6 billion in 2013. This increase is driven by the notable rise in leasing penetration rates in
four of the eight countries, i.e. Germany, Poland, Spain and the UK, which account for almost two thirds of
the total Europe-8 SME leasing market in 2014. The leasing markets in other countries are estimated to
remain broadly stable in 2014 relative to 2013 – underpinned by steady SME investment and leasing
penetration rates in these economies39
. Scaling this figure up to the whole of Europe gives an estimate of the
total European SME leasing market in 2014 of €120.9 billion, a substantial increase from €103.6 billion in
2013.
When we compare this with the size of the total leasing market in Europe of €276 billion in 201440
, SMEs
accounted for 44% of total leasing in Europe in 2014 (up from 41% in 2013), 48% when adjusted to exclude
leasing to consumers and the public sector.
Figure 90
39 Any comparison of these figures to national research on the SME leasing market should be done with caution due to
possible differences in methodology.
40 In 2014, 29 countries were covered in the Leaseurope ASE.
0
5
10
15
20
25
NL PL SE ES UK IT DE FR
2013 2014
Size of SME leasing market by country, 2013 and 2014
Estimated new leasing volumes € bn
Source : Oxford Economics/EFG

The Use of Leasing Amongst European SMEs July 2015
62
6. Leasing’s contribution to future European economic growth
Key points
A greater uptake of leasing amongst micro, small and medium sized firms can help generate faster
economic growth around Europe. We consider three scenarios and, depending on the assumptions,
the impact of higher leasing penetration rates on GDP growth is from 0.03 to 0.1 percentage points
per annum for the 8 European countries in our sample.
Compared to the Eurozone’s trend growth rate of 1.6% per annum this is a significant increase and
would add an extra 0.3% - 0.7% to the level of GDP by 2020. These potential growth rates equate to
an additional €34 billion - €100 billion in European GDP.
Scenario 2 in our previous study estimated the impact of micro firm leasing penetration rates
reaching those of small firms. Interestingly, this scenario was realised in 2013 – micro firms’
penetration rate increased to a level similar to small firms.
European and national initiatives that raise SMEs’ awareness of leasing would be worthwhile given
the potential to boost investment and accelerate European economic growth.
6.1 Macro-economic impact of greater use of leasing by SMEs
The purpose of this section is to set the survey’s findings on the use of leasing by SMEs in a wider
macroeconomic context. In particular we look at how greater use of leasing amongst Europe’s micro, small
and medium sized firms can help generate higher economic growth around the continent.
6.1.1 Methodology for estimating the impact of more leasing by SMEs
In this section we simulate how greater use of leasing around Europe would boost potential output. It is
important to note the distinction between actual output (the actual volume of goods and services produced in
an economy in a given time period) and potential output (the level of output consistent with normal capacity
usage and only modest upward pressure on wages and prices).
When actual output in an economy is above potential output due to a temporary demand shock, workers
have to work over time to meet demand, wage costs per unit of output rise, the price of the goods or services
they produce do likewise and eventually demand cools off again. When actual output is below potential
output (thanks to a negative demand shock such as a crunch in credit supply) capacity usage falls and
workers are laid off or their wages cut. This causes the prices of goods produced to fall (or rise slower than
goods produced elsewhere) and eventually demand picks up again.
Economists often forecast the short-term evolution of an economy as the path back to trend, while in the long
run the drivers of potential output are more important. We consider the possible impact on potential output
here, since increasing the amount of leasing in the European economy will not necessarily have an impact
on short-term demand but will clearly impact on potential output in the longer run.
To estimate potential output we use a production function. The method is derived formally in Appendix 5 but
is set out in simplified terms here. The production function calculates potential output as a function of labour,
capital and “total factor productivity” – an unobserved component that accounts for accumulated knowledge

The Use of Leasing Amongst European SMEs July 2015
63
and experience. The only variable we will change in the production function is the capital input by firms and
we will do this by varying the amount of leasing used.
The calculations assume that there is no spillover to employment from the extra investment, although of
course this is possible. We also assume that the increase in fixed investment is not matched by an increase
in training and skills spending to enable firms to get the most out of the new capital goods. Both would
increase the growth impact of extra leasing. As such, our estimates probably reflect the lower end of the
range of impacts under the three scenarios.
We have estimated three scenarios, to represent different possible paths for SME leasing:
1. A permanent shift in SME leasing penetration rates from 2013 to 2014 levels for the Europe-8
countries, holding the level of other investment constant i.e. the leasing penetration rate for
the Europe-8 increases from 18.9% to 21.2%. For example, assume German SMEs told us their
penetration rate was going to rise from 25.4% to 27.3%. So if firm A currently invests €100 per year,
with €25.40 of this financed by leasing and €74.60 by other means, this gives a current penetration
rate of 25.4%. We assume that the €74.60 remains the same but lease investment rises to the
extent that leasing penetration rate reaches 27.3%, i.e. total investment rises to €103. In some
countries the impact on total investment will be negative if their penetration rates are estimated to
have fallen in 2014.
2. An increase in the leasing penetration rate amongst micro firms from the current rate (15.4%)
to one consistent with medium firms (20.8%) at the Europe-8 level, holding the level of other
investment constant. In those countries where micro firms already lease with a greater intensity than
medium firms, we assume no change.
3. SMEs increase leasing penetration rates from 2014 levels by an amount equal to the fall in
whole economy penetration rates between 2008 and 2013. Before the recession hit, Leaseurope
recorded a penetration rate of 15.3% for all firm sizes, however the equivalent figure in 2013 stood
at 11.7%. This scenario assumes that the Europe-8 SME penetration rate increases from 2014
levels by an amount similar to the fall in whole economy penetration rates between 2008 and 2013
(as reported by Leaseurope). It is important to note that this scenario assumes that the fall in SME
penetration rates between 2008 and 2013 was in line with that seen at the whole economy level.
6.1.2 The macroeconomic impact of greater use of leasing by European SMEs
For each of the three scenarios, we calculate the impact on the annual potential growth rate and also the
level of potential GDP by 2020 relative to a baseline that assumes the SME leasing penetration rate remains
at actual 2013 levels up to 2020.
Scenario 1
Our first scenario, a relatively conservative one, looks at the impact of a long-term permanent shift in
penetration rates from those seen in 2013 to those firms have reported in our survey for 2014. We hold the
rest of SME investment (i.e. financed by sources other than leasing) constant.
At the aggregate level this scenario produces an increase in the potential growth rate of 0.03 percentage
points per annum at the Europe-8 level, equivalent to an extra 0.3% on the level of GDP by 2020 compared

The Use of Leasing Amongst European SMEs July 2015
64
to the baseline. This equates to just over €34 billion in cash terms. In the context of a Eurozone trend growth
rate of around 1.6% per annum over the next five years41
, the increase under scenario 1 is significant.
Figure 91 Figure 92
The distribution of this gain varies between countries, with most seeing positive impacts on growth relative to
the baseline while holding other non-leasing investment constant. This is most evident when looking at
results for Polish, Spanish and British firms, where leasing’s increased contribution to overall investment had
a relatively high impact on projected growth. Polish SMEs are set to gain the most as we estimate that their
higher leasing penetration rate will boost their growth rate by 0.19 percentage points per annum, equivalent
to an extra 1.4% in Polish GDP by 2020 relative to the baseline (while holding other investment constant).
The Netherlands and Sweden saw a marginal fall in investment and growth, since they reported lower
leasing penetration rates in 2014 compared to 2013.
Scenario 2
As mentioned earlier in Chapter 2, scenario 2 in our 2011 study estimated the impact on output growth if
micro firm leasing penetration rates reached those of small firms. Based on our latest survey this scenario
appears to have almost materialised in 2013 – micro firms’ penetration rate increased from 10.0% in 2010 to
15.4% in 2013, which is more comparable to the 17.2% for small firms. In light of this positive development
the assumptions behind scenario 2 have been amended.
This scenario considers an increase in micro sized firms’ leasing penetration rates to match that of medium
sized firms, resulting in an estimated increase to potential output growth of 0.05 percentage points per
annum at the Europe-8 level. This is a notable impact, particularly given that it only requires a moderate
increase in leasing in the micro firm population (from 15.4% to 20.8% on average). In terms of levels, we
estimate that if this increase in leasing penetration rate was achieved, Europe-8 GDP would be 0.4% higher
by 2020 relative to the baseline (where leasing penetration rates remain at 2013 levels). This is a larger
impact (equating to €51 billion) than that seen in scenario 1, highlighting the importance of micro firm growth
for the European economy.
41 Oxford Economics’ Global Economic model is used to forecast average annual growth over the next five years to
2020.
18.9%
21.2%
0%
5%
10%
15%
20%
25%
30%
35%
40%
FR DE IT NL PL ES SE UK Europe-8
2013 2014
Scenario 1: SME leasing penetration rates
Percentage of investment financed by leasing
Source : Oxford Economics/EFG
-0.4%
0.0%
0.4%
0.8%
1.2%
1.6%
-0.05pp
0.00pp
0.05pp
0.10pp
0.15pp
0.20pp
FR DE IT NL PL ES SE UK Europe-8
Impact on growth rate(LHS)Levels impact by 2020(RHS)
Scenario 1: Growth impactsImpact on potential growth rate from 2014 (LHS) and level of potential output by 2020 (RHS)
Source : Oxford Economics/Haver Analytics

The Use of Leasing Amongst European SMEs July 2015
65
Again the distribution of this gain depends on where the increases in leasing penetration rates are achieved.
Countries where the micro firm leasing rate is already comparable to or higher than medium firms (in this
case we assume the micro penetration rate remains unchanged) will gain less than economies where micro
firms currently make less use of leasing. Proportionately the greatest gains are made in Poland again, where
the annual growth rate of potential output stands to rise by over 0.2 percentage points, equivalent to an extra
1.7% in Polish GDP in 2020 compared to the baseline. France, Italy and the UK also see relatively high
potential growth increases of around 0.05 percentage points.
Figure 93 Figure 94
Scenario 3
Scenario 3 is the most ambitious – a ‘high leasing’ scenario that assumes SMEs increase leasing penetration
rates from 2014 levels by an amount equal to the fall in penetration rates between 2008 and 2013.
Leaseurope’s penetration rate for business investment amongst all firm sizes fell from 15.3% in 2008 to
11.7% in 2013. Assuming the SME rate has fallen by a similar amount we estimate the impact of an
equivalent “bounce back” in 2014 for each of our 8 countries. As such, this scenario builds on the gains from
scenario 1 and assumes further growth in the penetration of leasing.
Focusing on the eight countries collectively, the leasing penetration rate would rise to 24.8% (holding other
investment constant) thereby supporting potential GDP growth of 0.1 percentage points per annum and an
impact on GDP levels of 0.7% in 2020 relative to the baseline. This gain is equivalent to an increase in GDP
of €100 billion. Similarly to the previous scenarios, Poland is expected to gain the most under scenario 3 due
to a boost in their estimated 2014 leasing uptake, which was also the case for UK firms. Other major gains
are made by countries where leasing fell most significantly between 2008 and 2013 – notably Italy and
Spain, where potential growth stands to increase by around 0.15 percentage points.
15.4%
20.8%
0%
5%
10%
15%
20%
25%
30%
35%
40%
FR DE IT NL PL ES SE UK Europe-8
Actual micro PR
Target micro PR
Scenario 2: Micro firm leasing penetration ratesPercentage of investment financed by leasing
Source : Oxford Economics/EFG
0.0%
0.5%
1.0%
1.5%
2.0%
0.00pp
0.05pp
0.10pp
0.15pp
0.20pp
0.25pp
FR DE IT NL PL ES SE UK Europe-8
Impact on growth rate(LHS)
Levels impact by2020 (RHS)
Scenario 2: Growth impactsImpact on potential growth rate from 2014 (LHS) and level of potential output by 2020 (RHS)
Source : Oxford Economics/Haver Analytics

The Use of Leasing Amongst European SMEs July 2015
66
Figure 95 Figure 96
Although this is an ambitious scenario requiring a substantial increase in the use of leasing (to 24.8%), we
already see penetration rates far surpassing this in some economies in 2014. For example Poland, Germany
and the UK had estimated 2014 penetration rates between 29% - 37%. Therefore it is clear that such an
increase is not unfeasible given the right economic and regulatory environments.
Figure 97 compares total potential output in the Europe-8 countries in 2020 (using 2013 constant prices)
under the three scenarios. Scenario 1 generates an extra €34 billon in real GDP (2013 prices) in 2020
compared to €51 billion in scenario 2 – equivalent to 0.3% and 0.4% increases on the level of GDP,
respectively. Results from the second scenario highlight the potential boost to economic growth that could
arise by improving access to finance across micro sized firms in particular. The impact of the third scenario is
by far the largest of the three at just over €100 billion, or a 0.7% boost to the level of GDP. This
macroeconomic gain stemming from a greater use of leasing amongst European SMEs is substantial.
Figure 97
18.9%
24.8%
0%
5%
10%
15%
20%
25%
30%
35%
40%
45%
FR DE IT NL PL ES SE UK Europe-8
Actual 2013 PR
"High leasing" target PR
Scenario 3: SME leasing penetration ratesPercentage of investment financed by leasing
Source : Oxford Economics/EFG
0.0%
0.5%
1.0%
1.5%
2.0%
0.00pp
0.05pp
0.10pp
0.15pp
0.20pp
0.25pp
FR DE IT NL PL ES SE UK Europe-8
Impact on growth rate(LHS)Levels impact by2020 (RHS)
Scenario 3: Growth impacts
Impact on potential growth rate from 2014 (LHS) and level of potential output by 2020 (RHS)
Source : Oxford Economics/Haver Analytics
12.50
12.60
12.70
12.80
Baseline - 2013Penetration
rates
Scenario 1 -2014
penetrationrates
Scenario 2 -higher micro
leasing
Scenario 3 -high leasing
Potential output under leasing scenarios in 2020
€ tn, 2013 prices, total for Europe-8
Source : Oxford Economics/Haver Analytics
+ 0.3% to 0.4% on level of GDP
or
+ €34 bn to €51 bn respectively
+0.7% on level
of GDP
Or
+ €100 bn

The Use of Leasing Amongst European SMEs July 2015
67
6.2 Leasing’s contribution to economic growth
SMEs form the foundation of the European economy, accounting for 99.8% of all non-financial business
sector enterprises and over two-thirds of EU-28 employment in 2013. As such, SMEs are a key determinant
of economic prosperity, as well as an important source of innovation, research and development. Since
SMEs play a vital role in current and future economic growth, affordable and flexible access to finance for
SMEs is crucial.
Our survey demonstrates the increasing importance of leasing as a source of SME finance, particularly for
micro, growth and exporting SMEs. Moreover, our analysis highlights the potential growth benefits derived
from a greater uptake of leasing by SMEs. This report provides an evidence base that will help policymakers
and other stakeholders in the SME finance sphere better understand the role of leasing in financing
investment and boosting European economic growth. European and national initiatives that raise SMEs’
awareness of leasing would undoubtedly help in ensuring that European SMEs can invest and expand in the
future.

The Use of Leasing Amongst European SMEs July 2015
68
Appendix 1: Survey sample
The survey for this study was conducted on behalf of Oxford Economics by EFG Worldwide, one of Europe’s
leading market research firms. EFG conducted a telephone survey of 2,950 firms across nine industrial
sectors in eight countries. The split of firms across countries, sectors and class sizes is set out in the table
below and is intended to correspond to the industrial structure of the SME sector in each relevant country
based on data from Eurostat.
The survey took place during August and September 2014 and was conducted by native language speakers
for each of the relevant countries over the phone, with answers coded by the operator during the course of
the interview.
Micro Agriculture ManufacturingMining &
utilitiesConstruction
Distributive
trades
Hotels &
restaurants
Transport &
storageReal estate
Professional
servicesTOTAL
Germany 0 11 0 12 26 5 7 25 39 125
Spain 8 16 8 28 48 15 15 14 35 187
France 3 20 3 37 47 15 6 16 60 207
Italy 4 23 4 29 53 13 7 16 46 195
Netherlands 1 5 1 8 18 3 3 4 21 64
Poland 1 12 1 20 24 2 8 3 22 93
Sweden 2 5 2 10 13 3 4 15 18 72
United Kingdom 4 11 4 27 30 6 6 12 66 166
Small Agriculture ManufacturingMining &
utilitiesConstruction
Distributive
trades
Hotels &
restaurants
Transport &
storageReal estate
Professional
servicesTOTAL
Germany 1 33 1 20 43 8 11 5 36 158
Spain 5 35 5 19 32 9 10 2 22 139
France 2 24 2 15 29 8 7 4 36 127
Italy 6 51 6 15 30 7 8 1 17 141
Netherlands 1 10 1 6 18 2 5 3 13 59
Poland 3 17 3 11 24 2 5 4 11 80
Sweden 2 11 2 8 15 3 4 4 14 63
United Kingdom 3 22 3 16 28 6 8 4 43 133
Medium Agriculture ManufacturingMining &
utilitiesConstruction
Distributive
trades
Hotels &
restaurants
Transport &
storageReal estate
Professional
servicesTOTAL
Germany 0 62 0 9 39 4 12 5 36 167
Spain 6 37 6 12 20 6 11 1 25 124
France 3 35 3 7 23 2 8 7 28 116
Italy 6 55 6 6 15 2 8 1 15 114
Netherlands 6 17 6 6 17 1 5 4 15 77
Poland 9 43 9 12 24 2 7 5 16 127
Sweden 4 17 4 4 13 1 4 4 14 65
United Kingdom 7 36 7 12 25 5 7 4 48 151
Total Agriculture ManufacturingMining &
utilitiesConstruction
Distributive
trades
Hotels &
restaurants
Transport &
storageReal estate
Professional
servicesTOTAL
Germany 1 106 1 41 108 17 30 35 111 450
Spain 19 88 19 59 100 30 36 17 82 450
France 8 79 8 59 99 25 21 27 124 450
Italy 16 129 16 50 98 22 23 18 78 450
Netherlands 8 32 8 20 53 6 13 11 49 200
Poland 13 72 13 43 72 6 20 12 49 300
Sweden 8 33 8 22 41 7 12 23 46 200
United Kingdom 14 69 14 55 83 17 21 20 157 450
Total 87 608 87 349 654 130 176 163 696 2,950

The Use of Leasing Amongst European SMEs July 2015
69
Appendix 2: Interview questionnaire
The questions from the interview script (excluding those concerned with making sure the interviewee was the
correct person to discuss these issues) are set out below.
SECTION A: (all respondents)
Q1 – Can you confirm which sector best describes your business?
Single answer
1. Agriculture 2. Manufacturing 3. Mining and utilities 4. Construction 5. Distributive trades 6. Hotels and restaurants 7. Transport and storage 8. Real estate 9. Professional, technical and other business services
Q2 – How old, in years, is your company?
Single answer
1. Less than 2 years 2. 2 years or more but less than 5 years 3. 5 years or more but less than 10 years 4. 10 years or more
Q3 – What was your turnover in the 2013 calendar year?
Single answer
1. Less than 200 000 Euros 2. 200 000 Euros – 499 999 Euros 3. 500 000 – 1.999m Euros 4. 2m Euros – 4.999m Euros 5. 5m Euros – 19.999m Euros 6. 20m Euros or more 7. Don’t know
Q4 – Over the last three years (2011-2013), how much did your firm’s turnover grow on average per year?
Single answer
1. At least 20% per year 2. Less than 20% per year 3. No growth 4. Got smaller 5. Not applicable as the firm is too recent and has only been open for less than three years 6. Don’t know
Q5 – What was the size of your balance sheet at the end of 2013?
Single answer
1. Less than 200 000 Euros 2. 200 000 Euros – 499 999 Euros 3. 500 000 – 1.999m Euros 4. 2m Euros – 4.999m Euros 5. 5m Euros – 19.999m Euros 6. 20m Euros or more 7. Don’t know

The Use of Leasing Amongst European SMEs July 2015
70
Q6(A) – Does your company export?
Single answer
1. Yes -> Go to Q6(B) 2. No -> Go to Section B, Q7 3. Don’t know -> Go to Section B, Q7
Q6(B) – Which market does your company export to?
Yes/No/Don’t know for each option
1. Within the EU 2. Outside the EU
SECTION B: (all respondents)
Q7 – What was your total investment in fixed assets in 2013?
Single answer
1. Less than 50 000 Euros 2. 50 000 Euros – 99 999 Euros 3. 100 000 – 499 999 Euros 4. 500 000 – 0.999m Euros 5. 1m – 4.999m Euros 6. 5m Euros or more
Q8 – In 2013, did you use the following forms of finance?
Yes/No/Don’t know for each option
1. Personal finance from founder/family/friends 2. Retained earnings/sale of assets 3. Short-term credit including bank overdrafts and credit cards (i.e. less than 1 year) 4. Factoring 5. Trade credit 6. Loan of between 1 and 3 years provided by a bank or other financial institution 7. Loan of more than 3 years provided by a bank or other financial institution 8. Private equity/venture capital 9. Leasing
Q9(A) – In 2013, what percentage of your investment in fixed assets was financed by each of the following categories of finance?
Total of 1-4 should equal 100%
1. Leasing % 2. Cash / equity % 3. Loans from a bank or other financial institution % 4. Other debt finance %
Only go on to Q9(B) if the respondent had any percentage value for option 3 in Q9(A) Q9(B) – In 2013, what percentage of your loans from a bank or other financial institution were from the following categories?
Total of these 3 sub-sections should equal 100%
1. Short-term credit including bank overdrafts and credit cards (i.e. less than 1 year) % 2. Loan of between 1 and 3 years provided by a bank or other financial institution % 3. Loan of more than 3 years provided by a bank or other financial institution %
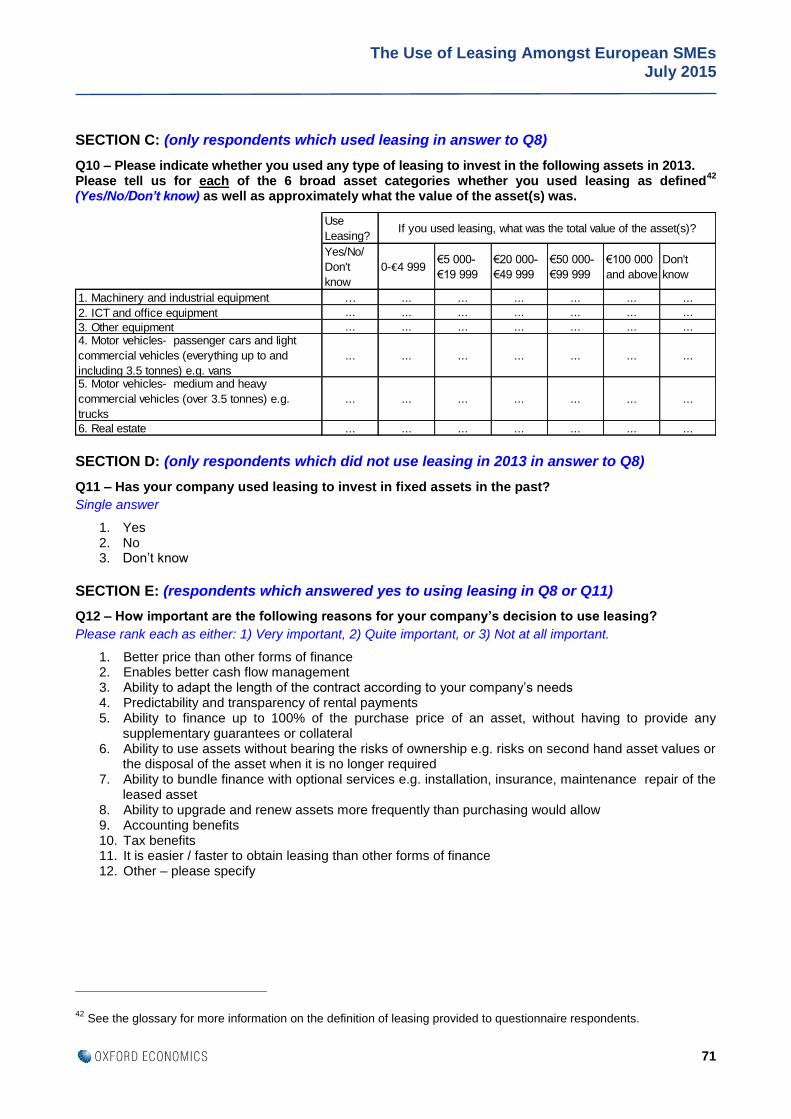
The Use of Leasing Amongst European SMEs July 2015
71
SECTION C: (only respondents which used leasing in answer to Q8)
Q10 – Please indicate whether you used any type of leasing to invest in the following assets in 2013. Please tell us for each of the 6 broad asset categories whether you used leasing as defined
42
(Yes/No/Don’t know) as well as approximately what the value of the asset(s) was.
SECTION D: (only respondents which did not use leasing in 2013 in answer to Q8)
Q11 – Has your company used leasing to invest in fixed assets in the past?
Single answer
1. Yes 2. No 3. Don’t know
SECTION E: (respondents which answered yes to using leasing in Q8 or Q11)
Q12 – How important are the following reasons for your company’s decision to use leasing?
Please rank each as either: 1) Very important, 2) Quite important, or 3) Not at all important.
1. Better price than other forms of finance 2. Enables better cash flow management 3. Ability to adapt the length of the contract according to your company’s needs 4. Predictability and transparency of rental payments 5. Ability to finance up to 100% of the purchase price of an asset, without having to provide any
supplementary guarantees or collateral 6. Ability to use assets without bearing the risks of ownership e.g. risks on second hand asset values or
the disposal of the asset when it is no longer required 7. Ability to bundle finance with optional services e.g. installation, insurance, maintenance repair of the
leased asset 8. Ability to upgrade and renew assets more frequently than purchasing would allow 9. Accounting benefits 10. Tax benefits 11. It is easier / faster to obtain leasing than other forms of finance 12. Other – please specify
42 See the glossary for more information on the definition of leasing provided to questionnaire respondents.
Use
Leasing?
Yes/No/
Don't
know
0-€4 999€5 000-
€19 999
€20 000-
€49 999
€50 000-
€99 999
€100 000
and above
Don't
know
1. Machinery and industrial equipment … ... ... ... ... ... ...
2. ICT and office equipment ... ... ... ... ... ... ...
3. Other equipment ... ... ... ... ... ... ...
4. Motor vehicles- passenger cars and light
commercial vehicles (everything up to and
including 3.5 tonnes) e.g. vans
... ... ... ... ... ... ...
5. Motor vehicles- medium and heavy
commercial vehicles (over 3.5 tonnes) e.g.
trucks
... ... ... ... ... ... ...
6. Real estate ... ... ... ... ... ... ...
If you used leasing, what was the total value of the asset(s)?

The Use of Leasing Amongst European SMEs July 2015
72
Q13 – Which channel(s) did you access leasing through?
Yes/No/Don’t know for each option
1. Direct from equipment manufacturer 2. Bank 3. Finance company 4. Dealer/distributor 5. Intermediaries e.g. brokers/agents 6. Other (please specify)
SECTION F: (all respondents)
Q14 – Do you expect your level of investment in fixed assets to increase, decrease or remain the same in 2014 compared to 2013?
Single answer
1. Increase 2. Decrease 3. Remain the same 4. Don’t know
Q15(A) – What percentage of your investment in fixed assets do you expect to be financed by the following in 2014?
Total of 1-4 should equal 100%
1. Leasing % 2. Cash / equity % 3. Loans from a bank or other financial institution % 4. Other debt finance %
Only go on to Q15(B) if the respondent had any percentage value for option 3 in Q15(A) Q15(B) – In 2014, what percentage of your loans from a bank or other financial institution do you expect to be from the following categories?
Total of these 3 sub-sections should equal 100%
1. Short-term credit including bank overdrafts and credit cards (i.e. less than 1 year) % 2. Loan of between 1 and 3 years provided by a bank or other financial institution % 3. Loan of more than 3 years provided by a bank or other financial institution %
Q16 – What are the reasons for why you do not use leasing for a greater proportion of your investment in fixed assets?
Please rank each as either: 1) Very important, 2) Quite important, or 3) Not at all important.
1. Lack of choice in the range of assets available to be leased 2. Better price is available by purchasing assets 3. Tax treatment is better for purchases 4. I prefer to own the asset outright 5. I do not think leasing products are an option for the asset I need 6. I was not aware of the benefits of using leasing products compared to other forms of finance 7. It is easier to obtain other forms of financing

The Use of Leasing Amongst European SMEs July 2015
73
Appendix 3: Detailed breakdown of survey results
This section sets out more detailed breakdown of the results, to complement the charts in the main report.
Penetration rates by country and firm size
0%
5%
10%
15%
20%
25%
30%
35%
Micro Small Medium
Fig A1 - Leasing penetration rate by firm size, 2013: France
Source : Oxford Economics/EFG
0%
5%
10%
15%
20%
25%
30%
Micro Small Medium
Fig A2 - Leasing penetration rate by firm size, 2013: Germany
Source : Oxford Economics/EFG
0%
2%
4%
6%
8%
10%
12%
14%
Micro Small Medium
Fig A3 - Leasing penetration rate by firm size, 2013: Italy
Source : Oxford Economics/EFG
0%
1%
2%
3%
4%
5%
6%
7%
8%
Micro Small Medium
Fig A4 - Leasing penetration rate by firm size, 2013: Netherlands
Source : Oxford Economics/EFG
0%
5%
10%
15%
20%
25%
30%
35%
40%
Micro Small Medium
Fig A5 - Leasing penetration rate by firm size, 2013: Poland
Source : Oxford Economics/EFG
0%
1%
2%
3%
4%
5%
6%
7%
Micro Small Medium
Fig A6 - Leasing penetration rate by firm size, 2013: Spain
Source : Oxford Economics/EFG

The Use of Leasing Amongst European SMEs July 2015
74
Penetration rates by sector and firm size43
43 Agricultural firms only accounted for 87/2,950 firms in our sample and within this, only 13 were micro sized. As such,
the zero penetration rates amongst this group of respondents need to be interpreted with caution.
0%
2%
4%
6%
8%
10%
12%
14%
16%
18%
Micro Small Medium
Fig A7 - Leasing penetration rate by firm size, 2013: Sweden
Source : Oxford Economics/EFG
0%
5%
10%
15%
20%
25%
30%
Micro Small Medium
Fig A8 - Leasing penetration rate by firm size, 2013: UK
Source : Oxford Economics/EFG
0%
5%
10%
15%
20%
25%
30%
35%
40%
45%
50%
Micro Small Medium
Fig A9 - Leasing penetration rate by firm size, 2013: Agriculture
Source : Oxford Economics/EFG
17%
18%
19%
20%
21%
22%
Micro Small Medium
Fig A10 - Leasing penetration rate by firm size, 2013: Construction
Source : Oxford Economics/EFG
0%
5%
10%
15%
20%
25%
Micro Small Medium
Fig A11 - Leasing penetration rate by firm size, 2013: Distributive trades
Source : Oxford Economics/EFG
0%
1%
2%
3%
4%
5%
6%
7%
Micro Small Medium
Fig A12 - Leasing penetration rate by firm size, 2013: Hotels & restaurants
Source : Oxford Economics/EFG

The Use of Leasing Amongst European SMEs July 2015
75
0%
5%
10%
15%
20%
25%
Micro Small Medium
Fig A13 - Leasing penetration rate by firm size, 2013: Manufacturing
Source : Oxford Economics/EFG
0%
5%
10%
15%
20%
25%
Micro Small Medium
Fig A14 - Leasing penetration rate by firm size, 2013: Mining & utilities
Source : Oxford Economics/EFG
0%
5%
10%
15%
20%
25%
Micro Small Medium
Fig A15 - Leasing penetration rate by firm size, 2013: Professional services
Source : Oxford Economics/EFG
0%
5%
10%
15%
20%
25%
30%
Micro Small Medium
Fig A16 - Leasing penetration rate by firm size, 2013: Real estate
Source : Oxford Economics/EFG
0%
5%
10%
15%
20%
25%
Micro Small Medium
Fig A17 - Leasing penetration rate by firm size, 2013: Transport & storage
Source : Oxford Economics/EFG

The Use of Leasing Amongst European SMEs July 2015
76
Average investment by country, sector and lessee/non-user
0.0
0.5
1.0
1.5
2.0
2.5
3.0
Min
ing &
utilit
ies
Re
al esta
te
Ag
ricultu
re
Man
ufa
ctu
rin
g
Pro
fessio
nal
serv
ice
s
All
se
cto
rs
Dis
trib
utive
tra
de
s
Co
nstr
uctio
n
Tra
nsp
ort
&sto
rag
e
Ho
tels
&re
sta
ura
nts
Lessees
Non-users
Fig A18 - Average SME investment spending by sector, 2013: France
€ mn
Source : Oxford Economics/EFG
0.0
0.1
0.2
0.3
0.4
0.5
0.6
0.7
0.8
Man
ufa
ctu
rin
g
Tra
nsp
ort
&sto
rag
e
Co
nstr
uctio
n
Re
al esta
te
All
se
cto
rs
Dis
trib
utive
tra
de
s
Ho
tels
&re
sta
ura
nts
Pro
fessio
nal
serv
ice
s
Min
ing &
utilit
ies
Ag
ricultu
re
Lessees
Non-users
Fig A19 - Average SME investment spending by sector, 2013: Germany
€ mn
Source : Oxford Economics/EFG
0.0
0.5
1.0
1.5
2.0
2.5
3.0
3.5
Re
al esta
te
Ag
ricultu
re
Man
ufa
ctu
rin
g
All
se
cto
rs
Pro
fessio
nal
serv
ice
s
Dis
trib
utive
tra
de
s
Tra
nsp
ort
&sto
rag
e
Ho
tels
&re
sta
ura
nts
Min
ing &
utilit
ies
Co
nstr
uctio
n
Lessees
Non-users
Fig A20 - Average SME investment spending by sector, 2013: Italy
€ mn
Source : Oxford Economics/EFG
0.0
0.1
0.2
0.3
0.4
0.5
0.6
0.7
0.8
0.9
1.0
Min
ing &
utilit
ies
Re
al esta
te
Ag
ricultu
re
All
se
cto
rs
Man
ufa
ctu
rin
g
Co
nstr
uctio
n
Pro
fessio
nal
serv
ice
s
Tra
nsp
ort
&sto
rag
e
Dis
trib
utive
tra
de
s
Ho
tels
&re
sta
ura
nts
Lessees
Non-users
Fig A21 - Average SME investment spending by sector, 2013: Netherlands€ mn
Source : Oxford Economics/EFG
0.0
0.1
0.2
0.3
0.4
0.5
0.6
Pro
fessio
nal
serv
ice
s
Re
al esta
te
Man
ufa
ctu
rin
g
Tra
nsp
ort
&sto
rag
e
Min
ing &
utilit
ies
All
se
cto
rs
Dis
trib
utive
tra
de
s
Ag
ricultu
re
Co
nstr
uctio
n
Ho
tels
&re
sta
ura
nts
Lessees
Non-users
Fig A22 - Average SME investment spending by sector, 2013: Poland
€ mn
Source : Oxford Economics/EFG
0.0
0.2
0.4
0.6
0.8
1.0
1.2
1.4
1.6
Man
ufa
ctu
rin
g
Ag
ricultu
re
Co
nstr
uctio
n
All
se
cto
rs
Min
ing &
utilit
ies
Pro
fessio
nal
serv
ice
s
Tra
nsp
ort
&sto
rag
e
Ho
tels
&re
sta
ura
nts
Dis
trib
utive
tra
de
s
Re
al esta
te
Lessees
Non-users
Fig A23 - Average SME investment spending by sector, 2013: Spain
€ mn
Source : Oxford Economics/EFG

The Use of Leasing Amongst European SMEs July 2015
77
Penetration rates by age of firm and sector
0.0
0.5
1.0
1.5
2.0
2.5
3.0
3.5
4.0
4.5
Ag
ricultu
re
Min
ing &
utilit
ies
Re
al esta
te
Tra
nsp
ort
&sto
rag
e
All
se
cto
rs
Man
ufa
ctu
rin
g
Dis
trib
utive
tra
de
s
Co
nstr
uctio
n
Pro
fessio
nal
serv
ice
s
Ho
tels
&re
sta
ura
nts
Lessees
Non-users
Fig A24 - Average SME investment spending by sector, 2013: Sweden
€ mn
Source : Oxford Economics/EFG
0.0
0.2
0.4
0.6
0.8
1.0
1.2
1.4
1.6
1.8
Man
ufa
ctu
rin
g
Dis
trib
utive
tra
de
s
Re
al esta
te
All
se
cto
rs
Pro
fessio
nal
serv
ice
s
Co
nstr
uctio
n
Ag
ricultu
re
Min
ing &
utilit
ies
Tra
nsp
ort
&sto
rag
e
Ho
tels
&re
sta
ura
nts
Lessees
Non-users
Fig A25 - Average SME investment spending by sector, 2013: UK
€ mn
Source : Oxford Economics/EFG
0%
5%
10%
15%
20%
25%
30%
< 2
ye
ars
2 -
5 y
ea
rs
5 -
10 y
ears
> 1
0 y
ea
rs
Fig A26 - Penetration rates by age of firm and sector, 2013: Agriculture
Source : Oxford Economics/EFG
0%
5%
10%
15%
20%
25%
30%
< 2
ye
ars
2 -
5 y
ea
rs
5 -
10 y
ears
> 1
0 y
ea
rs
Fig A27 - Penetration rates by age of firm and sector, 2013: Construction
Source : Oxford Economics/EFG
0%
5%
10%
15%
20%
25%
< 2
ye
ars
2 -
5 y
ea
rs
5 -
10 y
ears
> 1
0 y
ea
rs
Fig A28 - Penetration rates by age of firm and sector, 2013: Distributive trades
Source : Oxford Economics/EFG
0%
2%
4%
6%
8%
10%
12%
14%
16%
18%
< 2
ye
ars
2 -
5 y
ea
rs
5 -
10 y
ears
> 1
0 y
ea
rs
Fig A29 - Penetration rates by age of firm and sector, 2013: Hotels & restaurants
Source : Oxford Economics/EFG

The Use of Leasing Amongst European SMEs July 2015
78
0%
5%
10%
15%
20%
25%
< 2
ye
ars
2 -
5 y
ea
rs
5 -
10 y
ears
> 1
0 y
ea
rs
Fig A30 - Penetration rates by age of firm and sector, 2013: Manufacturing
Source : Oxford Economics/EFG
0%
5%
10%
15%
20%
25%
< 2
ye
ars
2 -
5 y
ea
rs
5 -
10 y
ears
> 1
0 y
ea
rs
Fig A31 - Penetration rates by age of firm and sector, 2013: Mining & utilities
Source : Oxford Economics/EFG
0%
5%
10%
15%
20%
25%
30%
< 2
ye
ars
2 -
5 y
ea
rs
5 -
10 y
ears
> 1
0 y
ea
rs
Fig A32 - Penetration rates by age of firm and sector, 2013: Professional services
Source : Oxford Economics/EFG
0%
5%
10%
15%
20%
25%
30%
35%
< 2
ye
ars
2 -
5 y
ea
rs
5 -
10 y
ears
> 1
0 y
ea
rs
Fig A33 - Penetration rates by age of firm and sector, 2013: Real estate
Source : Oxford Economics/EFG
0%
5%
10%
15%
20%
25%
30%
35%
40%
45%
< 2
ye
ars
2 -
5 y
ea
rs
5 -
10 y
ears
> 1
0 y
ea
rs
Fig A34 - Penetration rates by age of firm and sector, 2013: Transport & storage
Source : Oxford Economics/EFG

The Use of Leasing Amongst European SMEs July 2015
79
Penetration rates by age of firm and country
0%
5%
10%
15%
20%
25%
30%
< 2
ye
ars
2 -
5 y
ea
rs
5 -
10 y
ears
> 1
0 y
ea
rs
Fig A35 - Leasing penetration rate by firm age, 2013: France
Source : Oxford Economics/EFG
0%
5%
10%
15%
20%
25%
30%
< 2
ye
ars
2 -
5 y
ea
rs
5 -
10 y
ears
> 1
0 y
ea
rs
Fig A36 - Leasing penetration rate by firm age, 2013: Germany
Source : Oxford Economics/EFG
0%
2%
4%
6%
8%
10%
12%
< 2
ye
ars
2 -
5 y
ea
rs
5 -
10 y
ears
> 1
0 y
ea
rs
Fig A37 - Leasing penetration rate by firm age, 2013: Italy
Source : Oxford Economics/EFG
0%
2%
4%
6%
8%
10%
12%
14%
16%
< 2
ye
ars
2 -
5 y
ea
rs
5 -
10 y
ears
> 1
0 y
ea
rs
Fig A38 - Leasing penetration rate by firm age, 2013: Netherlands
Source : Oxford Economics/EFG
0%
5%
10%
15%
20%
25%
30%
35%
40%
< 2
ye
ars
2 -
5 y
ea
rs
5 -
10 y
ears
> 1
0 y
ea
rs
Fig A39 - Leasing penetration rate by firm age, 2013: Poland
Source : Oxford Economics/EFG
0%
1%
2%
3%
4%
5%
< 2
ye
ars
2 -
5 y
ea
rs
5 -
10 y
ears
> 1
0 y
ea
rs
Fig A40 - Leasing penetration rate by firm age, 2013: Spain
Source : Oxford Economics/EFG

The Use of Leasing Amongst European SMEs July 2015
80
Reasons why firms use leasing by sector
0%
5%
10%
15%
20%
25%
< 2
ye
ars
2 -
5 y
ea
rs
5 -
10 y
ears
> 1
0 y
ea
rs
Fig A41 - Leasing penetration rate by firm age, 2013: Sweden
Source : Oxford Economics/EFG
21%
22%
23%
24%
25%
26%
27%
< 2
ye
ars
2 -
5 y
ea
rs
5 -
10 y
ears
> 1
0 y
ea
rs
Fig A42 - Leasing penetration rate by firm age, 2013: UK
Source : Oxford Economics/EFG
0.50
0.55
0.60
0.65
0.70
0.75
0.80
0.85
0.90
Pri
ce
Pre
dic
tab
ility
No
ris
k o
f o
wne
rship
Ca
sh
flo
w m
ana
gem
en
t
Ad
ap
tabili
ty
Bu
nd
ling
with s
erv
ices
No
ad
ditio
nal colla
tera
l
Up
gra
de
asse
ts
Accou
nting
ben
efits
Ea
sie
r to
ob
tain
Ta
x b
ene
fits
Fig A43 - Reasons firms use leasing, 2013: Agriculture
Source : Oxford Economics/EFG
0.50
0.55
0.60
0.65
0.70
0.75
0.80
0.85
Pri
ce
Ad
ap
tabili
ty
Ca
sh
flo
w m
ana
gem
en
t
Pre
dic
tab
ility
Up
gra
de
asse
ts
Accou
nting
ben
efits
Ta
x b
ene
fits
No
ris
k o
f o
wne
rship
Bu
nd
ling
with s
erv
ices
No
ad
ditio
nal colla
tera
l
Ea
sie
r to
ob
tain
Fig A44 - Reasons firms use leasing, 2013: Construction
Source : Oxford Economics/EFG
0.50
0.55
0.60
0.65
0.70
0.75
0.80
Pri
ce
Ad
ap
tabili
ty
Ca
sh
flo
wm
an
ag
em
ent
Pre
dic
tab
ility
Accou
nting
ben
efits
Bu
nd
ling
with s
erv
ices
No
ad
ditio
nal colla
tera
l
Up
gra
de
asse
ts
No
ris
k o
f o
wne
rship
Ta
x b
ene
fits
Ea
sie
r to
ob
tain
Fig A45 - Reasons firms use leasing, 2013: Distributive trades
Source : Oxford Economics/EFG
0.45
0.50
0.55
0.60
0.65
0.70
0.75
0.80
0.85
Pri
ce
Ca
sh
flo
w m
ana
gem
en
t
No
ris
k o
f o
wne
rship
Up
gra
de
asse
ts
Ad
ap
tabili
ty
Accou
nting
ben
efits
Ta
x b
ene
fits
No
ad
ditio
nal colla
tera
l
Pre
dic
tab
ility
Bu
nd
ling
with s
erv
ices
Ea
sie
r to
ob
tain
Fig A46 - Reasons firms use leasing, 2013: Hotels & restaurants
Source : Oxford Economics/EFG

The Use of Leasing Amongst European SMEs July 2015
81
0.45
0.50
0.55
0.60
0.65
0.70
0.75
0.80
Pri
ce
Ca
sh
flo
w m
ana
gem
en
t
Ad
ap
tabili
ty
Accou
nting
ben
efits
Pre
dic
tab
ility
Up
gra
de
asse
ts
No
ris
k o
f o
wne
rship
Ta
x b
ene
fits
Bu
nd
ling
with s
erv
ices
No
ad
ditio
nal colla
tera
l
Ea
sie
r to
ob
tain
Fig A47 - Reasons firms use leasing, 2013: Manufacturing
Source : Oxford Economics/EFG
0.4
0.5
0.6
0.7
0.8
0.9
Pri
ce
Ca
sh
flo
w m
ana
gem
en
t
Ta
x b
ene
fits
Up
gra
de
asse
ts
Accou
nting
ben
efits
Ad
ap
tabili
ty
Pre
dic
tab
ility
No
ris
k o
f o
wne
rship
Bu
nd
ling
with s
erv
ices
No
ad
ditio
nal colla
tera
l
Ea
sie
r to
ob
tain
Fig A48 - Reasons firms use leasing, 2013: Mining & utilities
Source : Oxford Economics/EFG
0.45
0.50
0.55
0.60
0.65
0.70
0.75
Pri
ce
Pre
dic
tab
ility
Ca
sh
flo
w m
ana
gem
en
t
Accou
nting
ben
efits
Ta
x b
ene
fits
Ad
ap
tabili
ty
No
ris
k o
f o
wne
rship
Up
gra
de
asse
ts
Bu
nd
ling
with s
erv
ices
No
ad
ditio
nal colla
tera
l
Ea
sie
r to
ob
tain
Fig A49 - Reasons firms use leasing, 2013: Professional services
Source : Oxford Economics/EFG
0.40
0.45
0.50
0.55
0.60
0.65
0.70
0.75
Pre
dic
tab
ility
Ca
sh
flo
w m
ana
gem
en
t
Pri
ce
Ad
ap
tabili
ty
No
ad
ditio
nal colla
tera
l
Bu
nd
ling
with s
erv
ices
Ta
x b
ene
fits
Ea
sie
r to
ob
tain
Accou
nting
ben
efits
No
ris
k o
f o
wne
rship
Up
gra
de
asse
ts
Fig A50 - Reasons firms use leasing, 2013: Real estate
Source : Oxford Economics/EFG
0.55
0.60
0.65
0.70
0.75
0.80
Pri
ce
Ca
sh
flo
w m
ana
gem
en
t
Ad
ap
tabili
ty
No
ad
ditio
nal colla
tera
l
Up
gra
de
asse
ts
Bu
nd
ling
with s
erv
ices
Ta
x b
ene
fits
Pre
dic
tab
ility
Accou
nting
ben
efits
No
ris
k o
f o
wne
rship
Ea
sie
r to
ob
tain
Fig A51 - Reasons firms use leasing, 2013: Transport & storage
Source : Oxford Economics/EFG

The Use of Leasing Amongst European SMEs July 2015
82
Reasons why firms use leasing by country
0.4
0.5
0.6
0.7
0.8
0.9
Pre
dic
tab
ility
Ca
sh
flo
w m
ana
gem
en
t
Ad
ap
tabili
ty
Accou
nting
ben
efits
Pri
ce
Up
gra
de
asse
ts
No
ad
ditio
nal colla
tera
l
Bu
nd
ling
with s
erv
ices
No
ris
k o
f o
wne
rship
Ta
x b
ene
fits
Ea
sie
r to
ob
tain
Fig A52 - Reasons firms use leasing, 2013: France
Source : Oxford Economics/EFG
0.4
0.5
0.6
0.7
0.8
Pri
ce
Pre
dic
tab
ility
Ad
ap
tabili
ty
Ca
sh
flo
w m
ana
gem
en
t
Ta
x b
ene
fits
Accou
nting
ben
efits
Bu
nd
ling
with s
erv
ices
No
ad
ditio
nal colla
tera
l
No
ris
k o
f o
wne
rship
Up
gra
de
asse
ts
Ea
sie
r to
ob
tain
Fig A53 - Reasons firms use leasing, 2013: Germany
Source : Oxford Economics/EFG
0.56
0.60
0.64
0.68
0.72
0.76
No
ad
ditio
nal colla
tera
l
No
ris
k o
f o
wne
rship
Accou
nting
ben
efits
Ea
sie
r to
ob
tain
Pre
dic
tab
ility
Up
gra
de
asse
ts
Ca
sh
flo
w m
ana
gem
en
t
Ta
x b
ene
fits
Ad
ap
tabili
ty
Bu
nd
ling
with s
erv
ices
Pri
ce
Fig A54 - Reasons firms use leasing, 2013: Italy
Source : Oxford Economics/EFG
0.4
0.5
0.6
0.7
0.8
0.9
Pri
ce
Ca
sh
flo
w m
ana
gem
en
t
Up
gra
de
asse
ts
Accou
nting
ben
efits
Ta
x b
ene
fits
Bu
nd
ling
with s
erv
ices
Ad
ap
tabili
ty
No
ris
k o
f o
wne
rship
Pre
dic
tab
ility
Ea
sie
r to
ob
tain
No
ad
ditio
nal colla
tera
l
Fig A55 - Reasons firms use leasing, 2013: Netherlands
Source : Oxford Economics/EFG
0.5
0.6
0.7
0.8
0.9
Pri
ce
Ca
sh
flo
w m
ana
gem
en
t
Ta
x b
ene
fits
Pre
dic
tab
ility
No
ad
ditio
nal colla
tera
l
Bu
nd
ling
with s
erv
ices
Up
gra
de
asse
ts
Ad
ap
tabili
ty
No
ris
k o
f o
wne
rship
Ea
sie
r to
ob
tain
Accou
nting
ben
efits
Fig A56 - Reasons firms use leasing, 2013: Poland
Source : Oxford Economics/EFG
0.4
0.5
0.6
0.7
0.8
Ad
ap
tabili
ty
Pre
dic
tab
ility
Pri
ce
No
ad
ditio
nal colla
tera
l
Ca
sh
flo
w m
ana
gem
en
t
Accou
nting
ben
efits
Ta
x b
ene
fits
No
ris
k o
f o
wne
rship
Up
gra
de
asse
ts
Ea
sie
r to
ob
tain
Bu
nd
ling
with s
erv
ices
Fig A57 - Reasons firms use leasing, 2013: Spain
Source : Oxford Economics/EFG

The Use of Leasing Amongst European SMEs July 2015
83
Reasons why firms don’t use more leasing
0.4
0.5
0.6
0.7
0.8
Ad
ap
tabili
ty
Pri
ce
Pre
dic
tab
ility
Ca
sh
flo
w m
ana
gem
en
t
No
ris
k o
f o
wne
rship
No
ad
ditio
nal colla
tera
l
Up
gra
de
asse
ts
Bu
nd
ling
with s
erv
ices
Accou
nting
ben
efits
Ta
x b
ene
fits
Ea
sie
r to
ob
tain
Fig A58 - Reasons firms use leasing, 2013: Sweden
Source : Oxford Economics/EFG
0.50
0.55
0.60
0.65
0.70
Pri
ce
Ca
sh
flo
w m
ana
gem
en
t
No
ris
k o
f o
wne
rship
Ta
x b
ene
fits
Accou
nting
ben
efits
Ad
ap
tabili
ty
Bu
nd
ling
with s
erv
ices
Up
gra
de
asse
ts
Pre
dic
tab
ility
Ea
sie
r to
ob
tain
No
ad
ditio
nal colla
tera
l
Fig A59 - Reasons firms use leasing, 2013: UK
Source : Oxford Economics/EFG
0.2
0.3
0.4
0.5
0.6
0.7
0.8
Be
tte
r p
rice p
urc
ha
sin
g
Pre
fer
to o
wn
No
t a
n o
ptio
n f
or
asset
In
ee
d
Be
tte
r ta
x tre
atm
ent
purc
ha
sin
g
Ea
sie
r to
ob
tain
Lack o
f ch
oic
e in a
sse
ts
No
t a
ware
of b
en
efits
Lessees
Non-users
Fig A60 - Reasons firms don't use more leasing, 2013: France
Source : Oxford Economics/EFG
0.1
0.2
0.3
0.4
0.5
0.6
0.7
Lack o
f ch
oic
e in a
sse
ts
Be
tte
r p
rice p
urc
ha
sin
g
Pre
fer
to o
wn
Be
tte
r ta
x tre
atm
ent
purc
ha
sin
g
Ea
sie
r to
ob
tain
No
t a
ware
of b
en
efits
No
t a
n o
ptio
n f
or
asset
In
ee
d
Lessees
Non-users
Fig A61 - Reasons firms don't use more leasing, 2013: Germany
Source : Oxford Economics/EFG
0.0
0.1
0.2
0.3
0.4
0.5
0.6
0.7
Pre
fer
to o
wn
Be
tte
r p
rice p
urc
ha
sin
g
Be
tte
r ta
x tre
atm
ent
purc
ha
sin
g
Lack o
f ch
oic
e in a
sse
ts
No
t a
n o
ptio
n f
or
asset
In
ee
d
Ea
sie
r to
ob
tain
No
t a
ware
of b
en
efits
Lessees
Non-users
Fig A62 - Reasons firms don't use more leasing, 2013: Italy
Source : Oxford Economics/EFG
0.00.10.20.30.40.50.60.70.80.9
Pre
fer
to o
wn
Be
tte
r p
rice p
urc
ha
sin
g
Lack o
f ch
oic
e in a
sse
ts
No
t a
n o
ptio
n f
or
asset
In
ee
d
Be
tte
r ta
x tre
atm
ent
purc
ha
sin
g
No
t a
ware
of b
en
efits
Ea
sie
r to
ob
tain
Lessees
Non-users
Fig A63 - Reasons firms don't use more leasing, 2013: Netherlands
Source : Oxford Economics/EFG

The Use of Leasing Amongst European SMEs July 2015
84
0.3
0.4
0.5
0.6
0.7
0.8
Lack o
f ch
oic
e in a
sse
ts
Be
tte
r p
rice p
urc
ha
sin
g
Pre
fer
to o
wn
Be
tte
r ta
x tre
atm
ent
purc
ha
sin
g
No
t a
n o
ptio
n f
or
asset
In
ee
d
No
t a
ware
of b
en
efits
Ea
sie
r to
ob
tain
Lessees
Non-users
Fig A64 - Reasons firms don't use more leasing 2013: Poland
Source : Oxford Economics/EFG
0.2
0.3
0.4
0.5
0.6
0.7
Be
tte
r ta
x tre
atm
ent
purc
ha
sin
g
Be
tte
r p
rice p
urc
ha
sin
g
Pre
fer
to o
wn
Lack o
f ch
oic
e in a
sse
ts
Ea
sie
r to
ob
tain
No
t a
ware
of b
en
efits
No
t a
n o
ptio
n f
or
asset
In
ee
d
Lessees
Non-users
Fig A65 - Reasons firms don't use more leasing, 2013: Spain
Source : Oxford Economics/EFG
0.1
0.2
0.3
0.4
0.5
0.6
0.7
Be
tte
r p
rice p
urc
ha
sin
g
Be
tte
r ta
x tre
atm
ent
purc
ha
sin
g
Lack o
f ch
oic
e in a
sse
ts
Ea
sie
r to
ob
tain
Pre
fer
to o
wn
No
t a
ware
of b
en
efits
No
t a
n o
ptio
n f
or
asset
In
ee
d
Lessees
Non-users
Fig A66 - Reasons firms don't use more leasing, 2013: Sweden
Source : Oxford Economics/EFG
0.3
0.4
0.5
0.6
0.7
0.8
Lack o
f ch
oic
e in a
sse
ts
Be
tte
r p
rice p
urc
ha
sin
g
No
t a
n o
ptio
n f
or
asset
In
ee
d
Pre
fer
to o
wn
Ea
sie
r to
ob
tain
Be
tte
r ta
x tre
atm
ent
purc
ha
sin
g
No
t a
ware
of b
en
efits
Lessees
Non-users
Fig A67 - Reasons firms don't use more leasing, 2013: UK
Source : Oxford Economics/EFG
0.0
0.1
0.2
0.3
0.4
0.5
0.6
0.7
0.8
FR IT UK DE ES PL SE NL Europe-8
Non-users Lessees
Fig A68 - Reasons firms don't use more leasing: better tax treatment for purchases, 2010
Source : Oxford Economics/EFG
0.0
0.1
0.2
0.3
0.4
0.5
0.6
0.7
0.8
FR IT UK DE ES PL SE NL Europe-8
Non-users Lessees
Fig A69 - Reasons firms don't use more leasing: better tax treatment for purchases, 2013
Source : Oxford Economics/EFG

The Use of Leasing Amongst European SMEs July 2015
85
Exporting and growth SMEs
54.7%
37.1%
0%
10%
20%
30%
40%
50%
60%
70%
Micro Small Medium SMEs
Exporting firms
Non-exporting firms
Fig A70 - Proportion of exporting and non-exporting firms which use leasing, 2013
Source : Oxford Economics/EFG
0%
10%
20%
30%
40%
50%
60%
70%
80%
90%
100%
FR DE IT NL PL ES SE UK Europe-8
Only EU Only non-EU Both
Fig A71 - Proportion of SMEs which export broken down by market, 2013
Source : Oxford Economics/EFG
0%
10%
20%
30%
40%
50%
60%
70%
80%
90%
100%
Ag
ricultu
re
Co
nstr
uctio
n
Dis
trib
utive
tra
de
s
Ho
tels
&re
sta
ura
nts
Man
ufa
ctu
rin
g
Min
ing &
utilit
ies
Pro
fessio
nal
serv
ice
s
Re
al esta
te
Tra
nsp
ort
&sto
rag
e
All
se
cto
rs
Only EU Only non-EU Both
Fig A72 - Proportion of SMEs which export broken down by market, 2013
Source : Oxford Economics/EFG
54.7%
37.1%
0%
10%
20%
30%
40%
50%
60%
70%
80%
ES IT PL NL Europe-8 SE UK DE FR
Exporting SMEs
Non-exporting SMEs
Fig A73 - Proportion of exporting and non-exporting SMEs which use leasing, 2013
Source : Oxford Economics/EFG
54.7% 37.1%
0%
10%
20%
30%
40%
50%
60%
70%
Ho
tels
&re
sta
ura
nts
Pro
fessio
nal
serv
ice
s
Ag
ricultu
re
Dis
trib
utive
tra
de
s
All
se
cto
rs
Min
ing &
utilit
ies
Man
ufa
ctu
rin
g
Co
nstr
uctio
n
Re
al esta
te
Tra
nsp
ort
&sto
rag
e
Exporting SMEs
Non-exporting SMEs
Fig A74 - Proportion of exporting and non-exporting SMEs which use leasing, 2013
Source : Oxford Economics/EFG
46.5%
41.3%
0%
10%
20%
30%
40%
50%
60%
Micro Small Medium SMEs
Growth firms
Non-growth firms
Fig A75 - Proportion of growth and non-growth firms which use leasing, 2013
Source : Oxford Economics/EFG

The Use of Leasing Amongst European SMEs July 2015
86
46.5%
41.3%
0%
10%
20%
30%
40%
50%
60%
70%
80%
ES NL IT PL FR Europe-8 SE UK DE
Growth SMEs
Non-growth SMEs
Fig A76 - Proportion of growth and non-growth SMEs which use leasing, 2013
Source : Oxford Economics/EFG
46.5%41.3%
0%
10%
20%
30%
40%
50%
60%
70%
Ho
tels
&re
sta
ura
nts
Pro
fessio
nal
serv
ice
s
Ag
ricultu
re
Re
al esta
te
All
se
cto
rs
Min
ing &
utilit
ies
Tra
nsp
ort
&sto
rag
e
Dis
trib
utive
tra
de
s
Co
nstr
uctio
n
Man
ufa
ctu
rin
g
Growth SMEs
Non-growth SMEs
Fig A77 - Proportion of growth and non-growth SMEs which use leasing, 2013
Source : Oxford Economics/EFG

The Use of Leasing Amongst European SMEs July 2015
87
Appendix 4: Leaseurope business investment penetration rate
In chapter 1 we display penetration rates for leasing as a proportion of total business investment in the eight
countries in our sample. The table below sets out the exact numbers and sources used in these calculations.
Table A1 - Europe-8 penetration rates in 2013
New leasing volumes
granted to business *, €mBusiness investment **, €m Penetration rate
DE 40,380 333,635 12.1%
ES 6,893 111,327 6.2%
FR 32,460 275,486 11.8%
IT 15,823 158,751 10.0%
NL 8,607 71,430 12.0%
PL 8,410 55,637 15.1%
SE 12,113 62,759 19.3%
UK 24,617 203,479 12.1%
Europe-8 149,302 1,272,505 11.7%
Source: Leaseurope Annual Statistical Survey 2013.
* Excludes new leasing volumes granted to consumers and the public sector. Real estate and equipment leases are
considered together.
Source: Haver Analytics.
** Business investment excluding investment in dwellings, except for Poland, where investment in dwellings is included
due to data constraints.
12.9%
11.7%
0%
5%
10%
15%
20%
25%
ES NL IT SE FR UK DE PL Europe-8
2010
2013
Fig A1 - Leasing penetration rates for whole economy (SMEs and corporates) by country, 2010 and 2013
Source : Leaseurope
Percentage of investment financed by leasing

The Use of Leasing Amongst European SMEs July 2015
88
Appendix 5: Summary of production function methodology
This appendix sets out in more detail the methodology used to calculate how more leasing activity would
help boost the potential output of SMEs around Europe. We use a production function method where
production is a function of factor inputs and an unobservable “total factor productivity” component. This
method is commonly used amongst economists to estimate the potential output of economies or industrial
sectors. Specifically we have:
Y=ALK(1-)
In the equation above:
Y = output (measured for example by Gross Value Added)
K = capital inputs (i.e. the capital stock of a firm/sector/economy)
L = labour inputs (for example total employment in the firm/sector/economy)
= the elasticity of output with respect to labour input, that is the proportion that output increases
for a 1% increase in labour input. The elasticity of output with respect to labour and capital are
generally assumed to sum to 144
.
A = the total factor productivity element. This is unobserved and calculated as the residual from the
equation.
The growth path of these variables is determined by a range of factors. Specifically:
L is determined by labour force growth, for example a growing working age population, people
working until later in life, or an increase in female labour force participation.
K is determined by investment in capital goods by firms.
A is determined by spending on training by firms, advances in education, “learning by doing” and
other less observable improvements in worker productivity.
Additionally, we assume that is equal to the labour share of income - that is the share of total wage and
salary payments in Gross Value Added45
. The growth rate of an economy/sector is then given by:
Y = A + L + (1-)K
And the impact of higher leasing on the potential output of the economy/sector is
Y Higher Leasing Rate - Y Current Leasing Rate
Or
[A Higher Leasing Rate + L Higher Leasing Rate + (1-)K Higher Leasing Rate] – [A Current Leasing Rate + L Current Leasing
Rate + (1-)K Current Leasing Rate]
Since leasing is focused on the provision of physical goods, as opposed to firms investing in training and
other non-tangible capital, we assume leasing only impacts upon K. In addition, we assume that increased
leasing will not necessarily increase employment (although of course this is a possibility). Further, we
44 This is not demonstrated here but this is a widely used convention.
45 Again, this is a widely used convention amongst economists using production functions.

The Use of Leasing Amongst European SMEs July 2015
89
assume there is no spillover impact from higher capital investment under a high leasing scenario to total
factor productivity. As such, the difference between growth under a high leasing rate and the current leasing
rate is given by
(1-)K Higher Leasing Rate - (1-) K Current Leasing Rate
Or
(1-)*[(K Higher Leasing Rate) - (K Current Leasing Rate)]
We take most of the data for the above equations from Eurostat’s Structural Business Statistics, which has
data on output, employment and investment for a range of industries across European economies at the
micro, small, medium and large firm levels. We take leasing rates in different industry/country pairs from the
SME survey for “current leasing rate” and compare to the relevant “higher leasing rate” as appropriate. Then
the impact of higher leasing on economy/sector output =
(1-)*[(K Current Leasing Rate)*(1- leasing proportion current smes)
(1- higher leasing rate)
And the impact on the growth rate =
(1-)*[(K Current Leasing Rate)*(1- leasing proportion current smes) X 1_________
(1- higher leasing rate) Current output

The Use of Leasing Amongst European SMEs July 2015
90
Appendix 6: Estimating SME investment spending
Leaseurope gathers information on the scale of leasing activity from national leasing associations to provide
a comprehensive overview of the total leasing activity at European level. This data is collected and published
in the Federation’s Annual Statistical Enquiry.
Our approach to estimating SME investment spending uses published investment (Gross Fixed Investment
in tangible goods) data by firm size from the European Commission. Investment data for non-financial sector
SMEs are available to 2011 for most countries. This data provides a historical time series for the eight
countries covered in our study. These trends are examined and a process, known as a regression, is
undertaken. Regressions are statistical methods used to quantify the relationship between one variable and
other variables that are believed to explain it. In other words, we investigate country-specific relationships
between micro, small and medium firms’ investment and relevant explanatory variables, including GDP
growth, lending rates, credit supply, manufacturing output and relevant lagged values of investment. The
specific econometric model used is the Fixed Effects model. This model has the advantage of aggregating
the data from the countries into a panel/pool dataset which increases the number of observations.
Consequently it leads to a higher degree of accuracy in the modelling approach. The model is based on the
assumption that the explanatory variables have the same effect on investment throughout the countries, with
the country specific effects being captured through the varying intercept for each country’s regression. The
regression results are then used to derive country-specific SME investment forecasts in subsequent years.
The regression model is based on the following function:
Log(Investment) = log(GDP) + log(Total investment) + Lending rate + log(Investment(-1)) +
log(Manufacturing GVA)
In turn we are able to estimate the SME leasing market for individual countries using the SME investment
forecasts and leasing penetration assumptions from the survey.

The Use of Leasing Amongst European SMEs July 2015
91
Bibliography and data sources
In this report we have made extensive use of data and information from sources other than our own survey
of SMEs. This is particularly the case in Chapter 1 of the report. This bibliography sets out more details of the
data and references we used. We cover each reference or data source in the order in which it is first used in
the report.
Bibliography
Oxford Economics, The Use of Leasing Amongst European SMEs, November 2011.
Leaseurope, Annual Statistical Enquiry 2014, June 2015.
Leaseurope, Annual Statistical Enquiry 2013, June 2014.
Leaseurope, Annual Statistical Enquiry 2012, June 2013.
Leaseurope, Annual Statistical Enquiry 2011, June 2012.
European Commission, Annual Report on European SMEs 2013/2014 – A partial and fragile
recovery, July 2014.
European Commission, Survey on the access to finance of enterprises (SAFE), Analytic Report
2014, November 2014.
European Commission, Access to finance: still a barrier for EU companies’ growth, November 2014.
British Business Bank, Strategic Plan June 2014, June 2014.
European Central Bank, Euro area bank lending survey, 1st quarter of 2013, April 2013.
European Central Bank, Euro area bank lending survey, 2nd
quarter of 2013, July 2013.
European Central Bank, Euro area bank lending survey, 3rd
quarter of 2013, October 2013.
European Central Bank, Euro area bank lending survey, 4th quarter of 2013, January 2014.
Data sources
Oxford Economics, The Use of Leasing Amongst European SMEs, November 2011. Key findings
available at: http://www.leaseurope.org
Leaseurope, Annual Statistical Enquiries (ASE). These reports provide a comprehensive overview of
the European leasing market for Leaseurope’s members. Extracts of reports are available at:
http://www.leaseurope.org
European Commission, Annual Report on European SMEs 2013/2014 – A partial and fragile
recovery, July 2014. This publication provides background information on the importance of SMEs to
European employment, value added and number of firms. It also shows SME investment estimates
by country, firm size and industrial sector. This publication is available at:
http://ec.europa.eu/growth/smes/business-friendly-environment/performance-review/index_en.htm
European Commission, Survey on the access to finance of enterprises (SAFE), Analytic Report
2014, November 2014. This publication provides evidence on the changes in financial conditions,
financing needs and access to external forms of finance of SMEs. Available at:
http://ec.europa.eu/growth/access-to-finance/data-surveys/safe/index_en.htm

The Use of Leasing Amongst European SMEs July 2015
92
European Commission, Access to finance: still a barrier for EU companies’ growth, November 2014.
Available at:
http://ec.europa.eu/enterprise/newsroom/cf/itemdetail.cfm?item_id=7893&lang=en&tpa_id=127&title
=Access-to-finance%3A-still-a-barrier-for-EU-companies%E2%80%99-growth
European Commission backed programmes to support European SMEs include:
o Horizon 2020 - details available at: http://ec.europa.eu/programmes/horizon2020/en
o COSME/CIPS - details available at: http://ec.europa.eu/growth/smes/cosme/index_en.htm
European Central Bank, Euro area bank lending surveys:
Available at: https://www.ecb.europa.eu/stats/money/surveys/lend/html/index.en.html
British Business Bank, Strategic Plan, June 2014, June 2014. Details on British Business Bank’s
initiatives with regards to improving access to new funding for smaller businesses. Available at:
http://british-business-bank.co.uk/wp-content/uploads/2014/06/British-Business-Bank-Strategic-
Plan.pdf
Reference made to investment data sourced from Eurostat. Available at:
http://ec.europa.eu/eurostat/data/database
When calculating business investment penetration rates we use data from the Leaseurope ASE for
the numerator and data on business investment from our own databases for the denominator.
Oxford Economics’ data for business investment comes from Haver Analytics and national statistical
authorities. For more information about Oxford Economics please visit www.oxfordeconomics.com
and for Haver Analytics please see www.haver.com
Oxford Economics Global Macro-Economic Model. More information available at:
http://www.oxfordeconomics.com/forecasts-and-models/countries/scenario-analysis-and-
modeling/global-economic-model/overview


, UK
REGIONAL HEADQUARTERS
NEW YORK
Oxford Economics USA
5 Hanover Square
19th
Floor
New York
NY 10004
USA
Tel: +1 646 786 1879
REGIONAL OFFICES
LONDON
Oxford Economics Ltd
Broadwall House
21 Broadwall
London
SE1 9PL
UK
Tel: +44 207 803 1400
PHILADELPHIA
Oxford Economics USA
303 West Lancaster Avenue
Suite 2E
Wayne
PA 19087
USA
Tel: +1 610 995 9600
AUSTRALIA
Oxford Economics
Level 4, 95 Pitt Street
Sydney, 2000
Australia
Tel: +612 8249 8286
SINGAPORE
Oxford Economics Singapore
Singapore Land Tower
37th
Floor
50 Raffles Place
Singapore 048623
Tel: +65 6829 7068
BELFAST
Lagan House
Sackville Street
Lisburn
County Down
BT27 4AB
UK
Tel: +44 28 92635 400
CHICAGO
Oxford Economics USA
980 N. Michigan Avenue, Suite 1412
Chicago
Illinois
IL 60611
USA
Tel: +1 312 214 3545
PARIS
Oxford Economics Ltd
9 rue Huysmans
75006 Paris
France
Tel: + 33 6 79 900 846
GLOBAL HEADQUARTERS
OXFORD
Oxford Economics Ltd
Abbey House, 121 St Aldates
Oxford OX1 1HB
UK
Tel: +44 1865 268900
email: [email protected]