the influence of fish on the mooring loads of a floating ... he.pdf · the influence of fish on the...
TRANSCRIPT
1
Zhao HeSupervisor: Odd M. Faltinsen
The influence of fish on the mooring loads of a floating fish farm
CeSOS Highlights

2
• Dead fish experiment
• Simulations related to the dead fish experiment
• Real fish experiment
• Simulations related to the real fish experiment
• Conclusions
ExperimentsAnd
Simulations
• Realistic background
• Theoretical assumptionsBackground
Outline
CeSOS Highlights
3
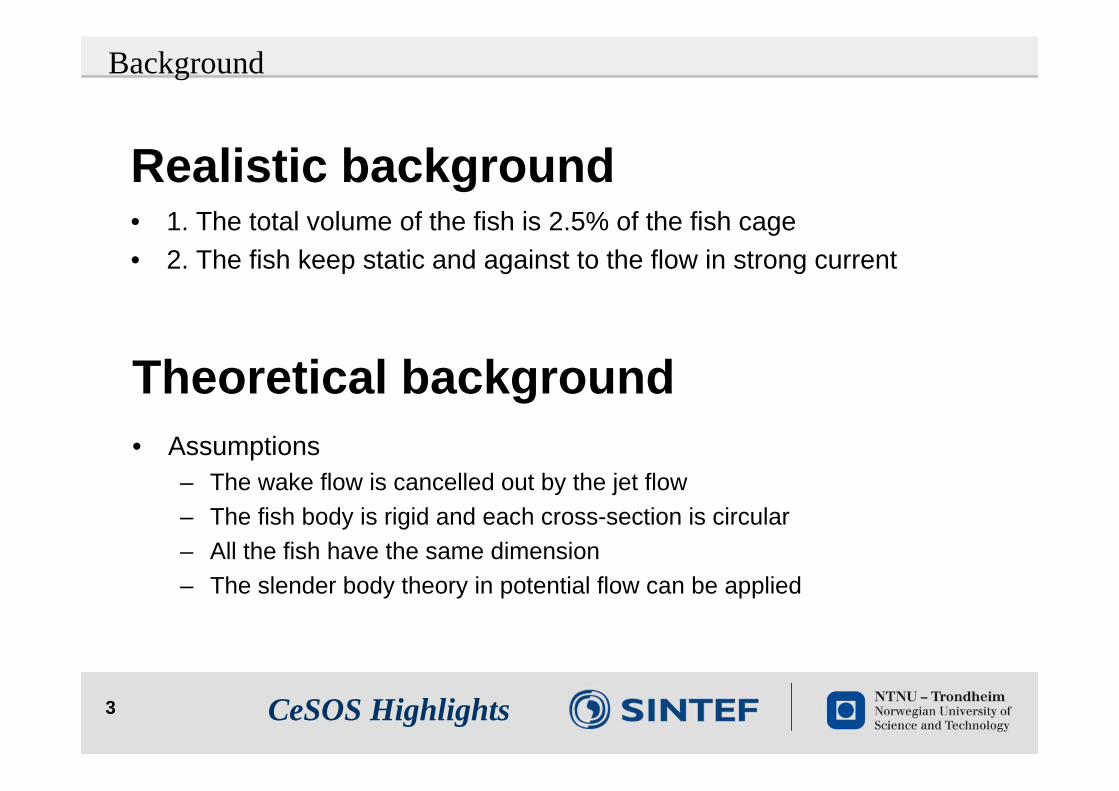
Realistic background• 1. The total volume of the fish is 2.5% of the fish cage• 2. The fish keep static and against to the flow in strong current
Background
Theoretical background• Assumptions
– The wake flow is cancelled out by the jet flow– The fish body is rigid and each cross-section is circular– All the fish have the same dimension– The slender body theory in potential flow can be applied
CeSOS Highlights
4
The dead fish experiment
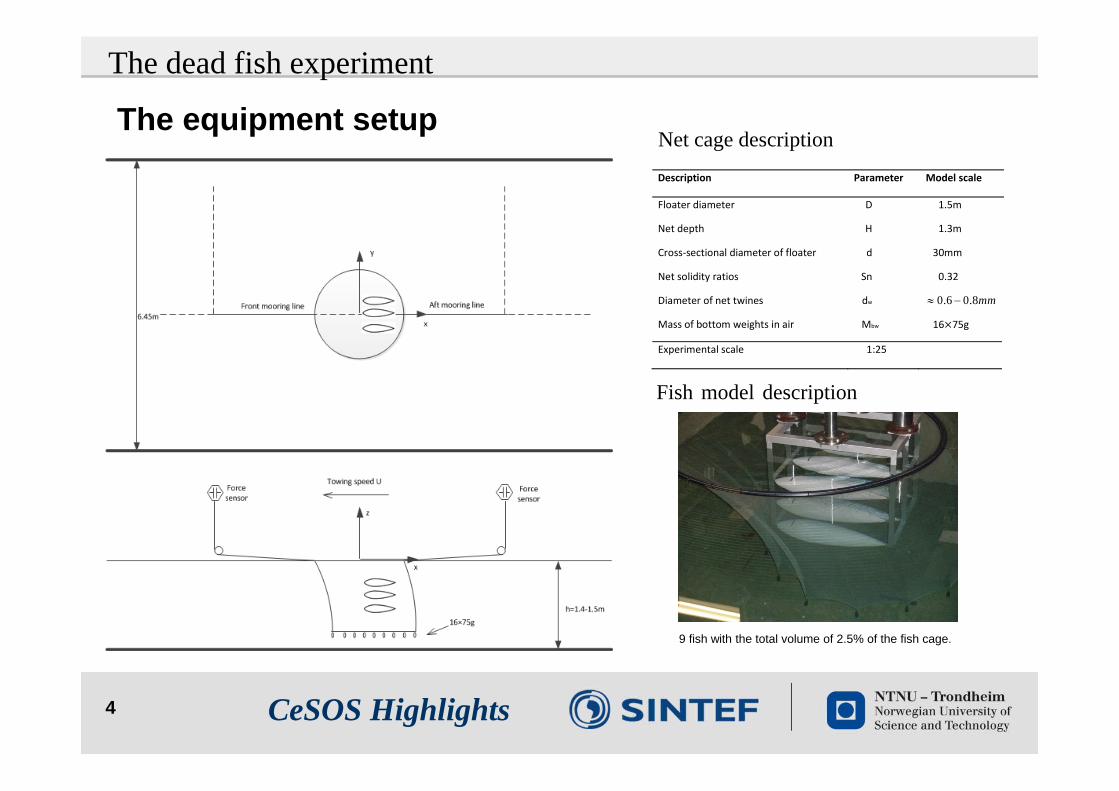
The equipment setupDescription Parameter Model scale
Floater diameter D 1.5m
Net depth H 1.3m
Cross‐sectional diameter of floater
Net solidity ratios
Diameter of net twines
Mass of bottom weights in air
d
Sn
dw
Mbw
30mm
0.32
0.6 0.8mm
16 75g
Experimental scale 1:25
9 fish with the total volume of 2.5% of the fish cage.
Net cage description
Fish model description
CeSOS Highlights
5
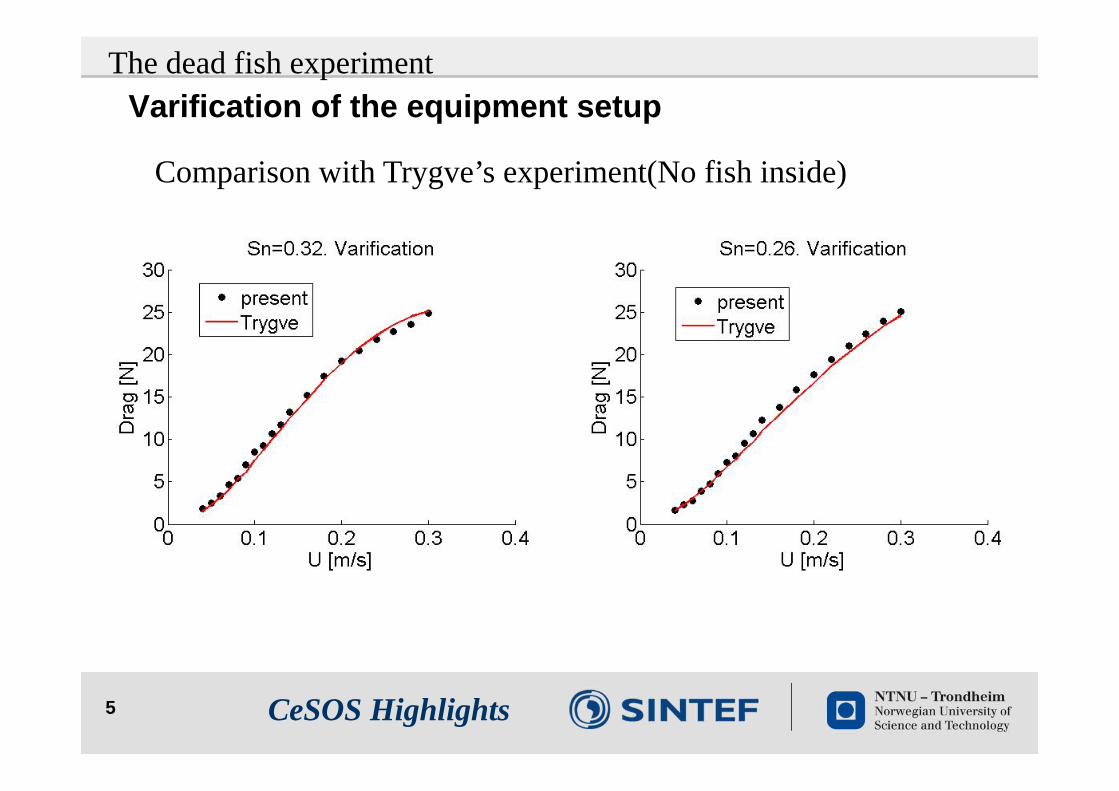
Varification of the equipment setupThe dead fish experiment
Comparison with Trygve’s experiment(No fish inside)
CeSOS Highlights
6
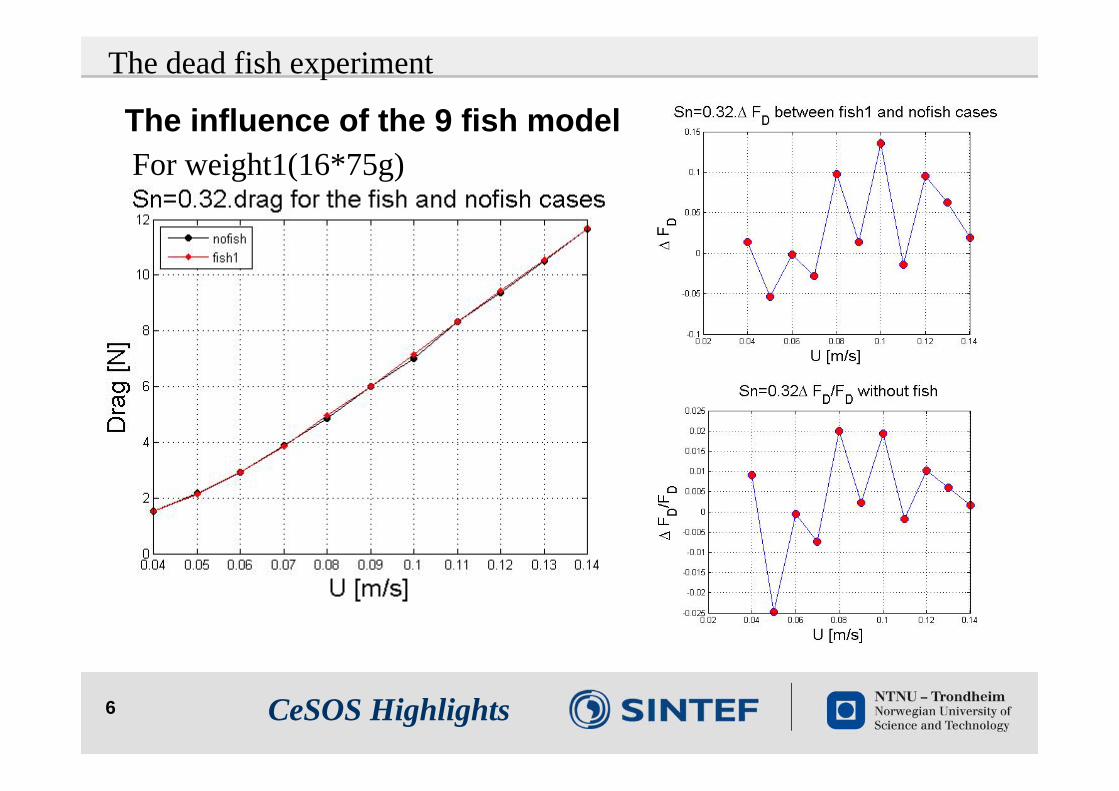
The influence of the 9 fish model
The dead fish experiment
For weight1(16*75g)
CeSOS Highlights
7
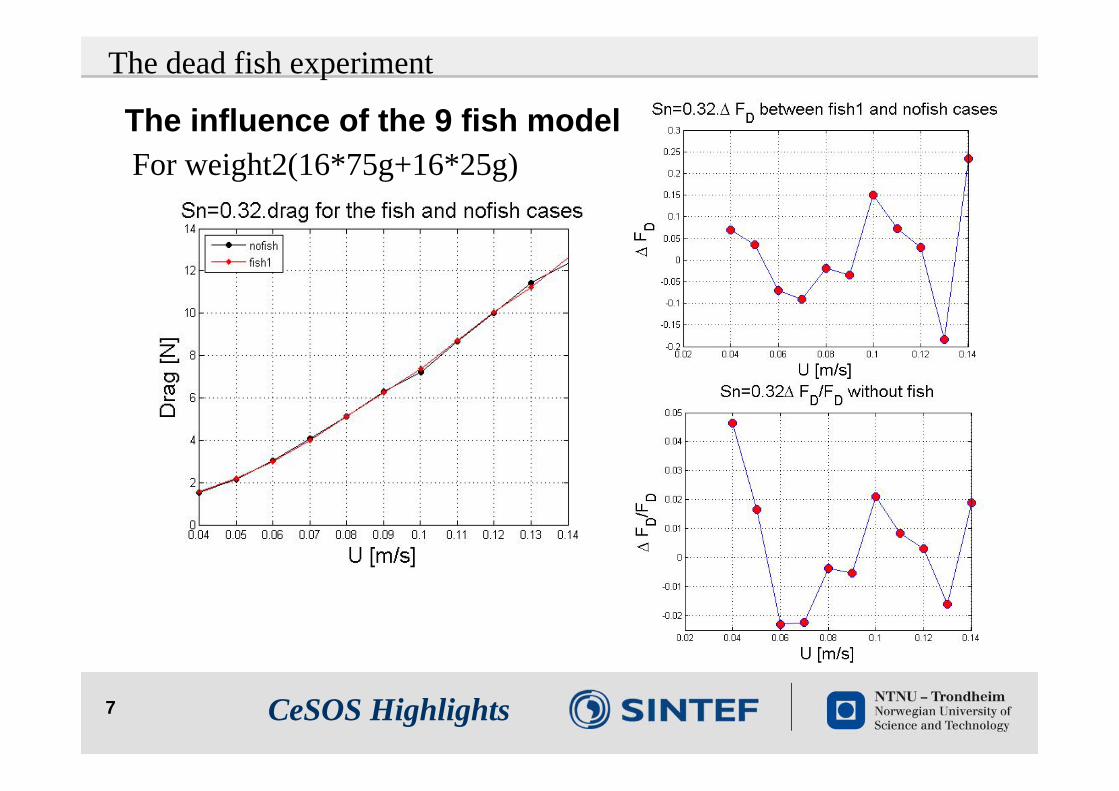
The influence of the 9 fish model
The dead fish experiment
For weight2(16*75g+16*25g)
CeSOS Highlights

8
The numerical model
Simulations related to the dead fish experiment
Figure1. Coupled model from net to fish Figure2. Coupled model from fish to net
Figure3. Strips for the fish model
CeSOS Highlights

9
Simulations related to the dead fish experiment
CeSOS Highlights
10
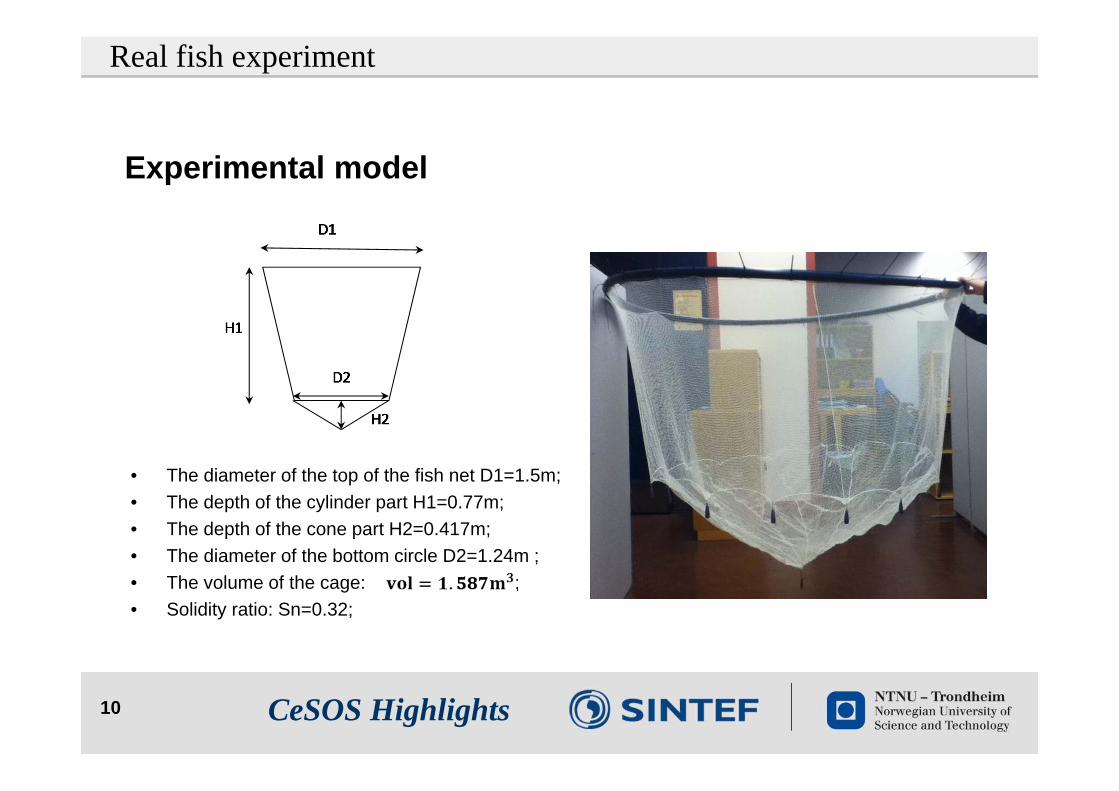
Experimental model
• The diameter of the top of the fish net D1=1.5m; • The depth of the cylinder part H1=0.77m; • The depth of the cone part H2=0.417m;• The diameter of the bottom circle D2=1.24m ;• The volume of the cage: ;• Solidity ratio: Sn=0.32;
Real fish experiment
CeSOS Highlights
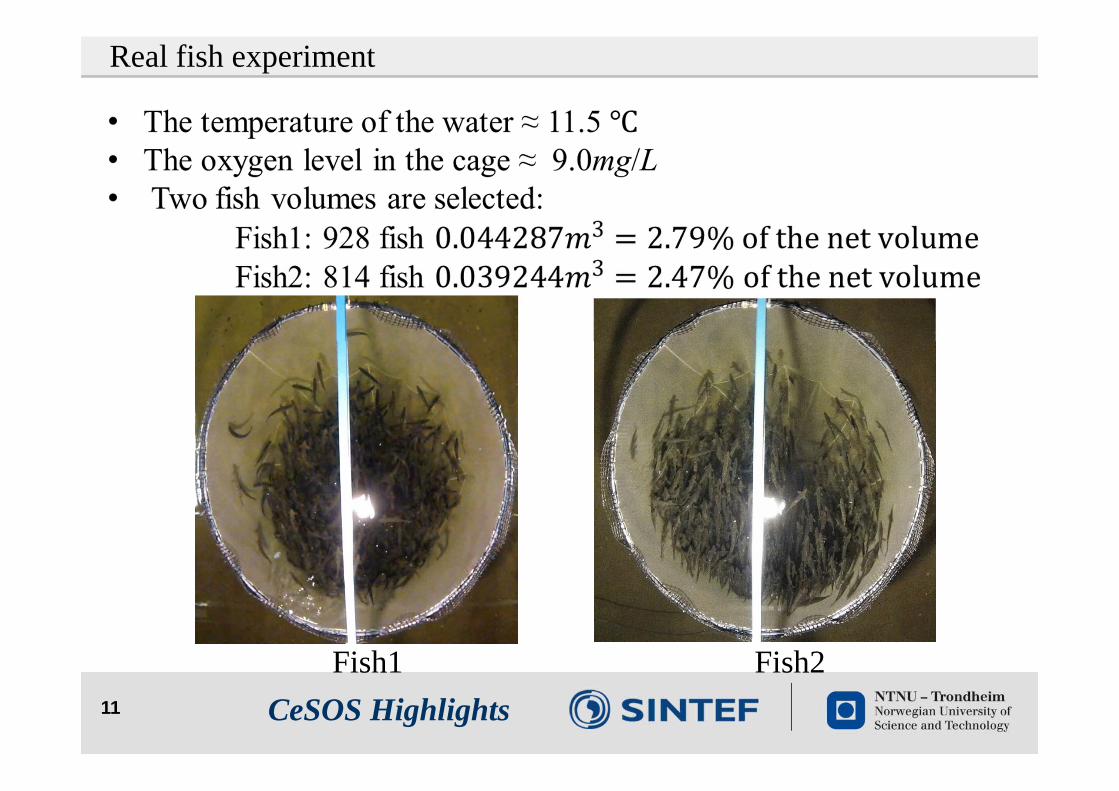
11
Fish1 Fish2
Real fish experiment
CeSOS Highlights
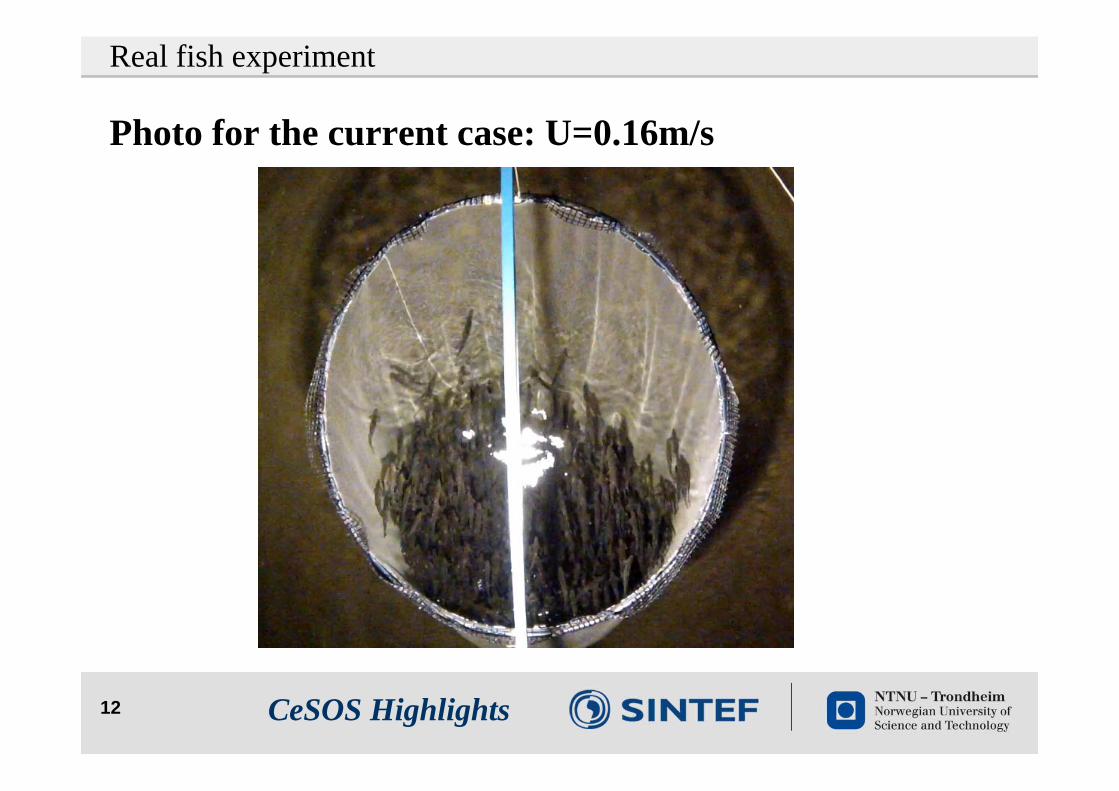
12
Photo for the current case: U=0.16m/s
Real fish experiment
CeSOS Highlights
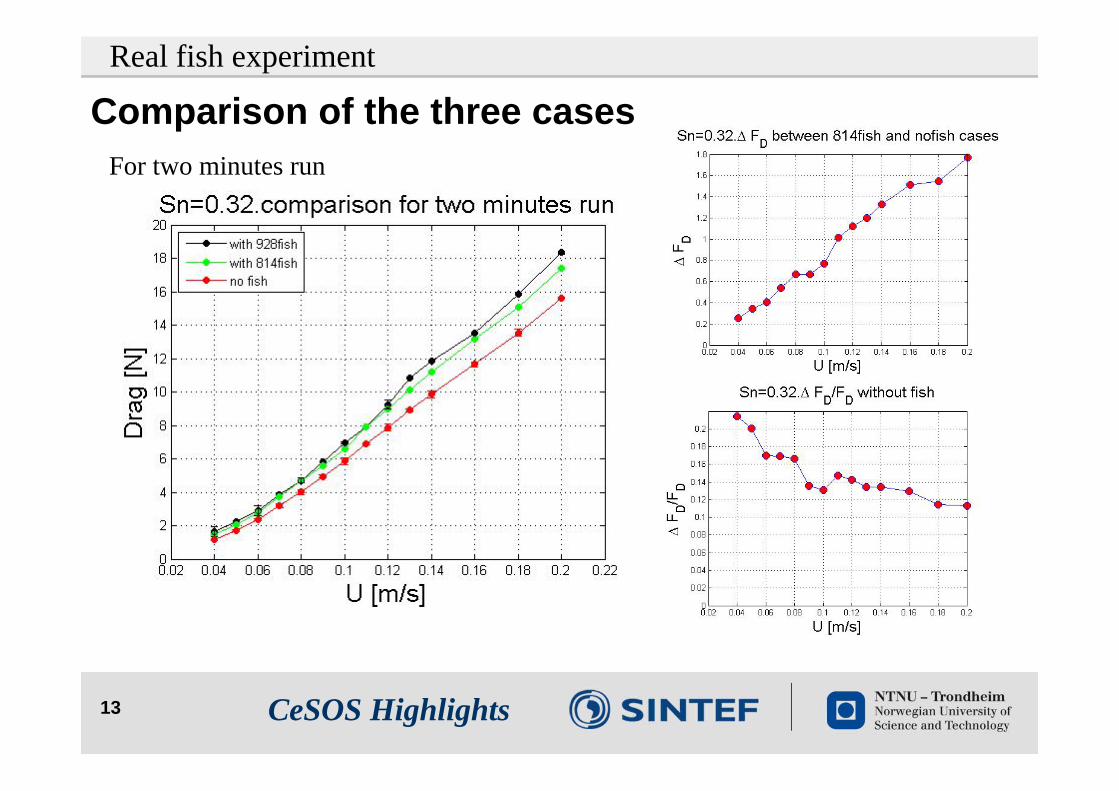
13
Comparison of the three casesFor two minutes run
Real fish experiment
CeSOS Highlights
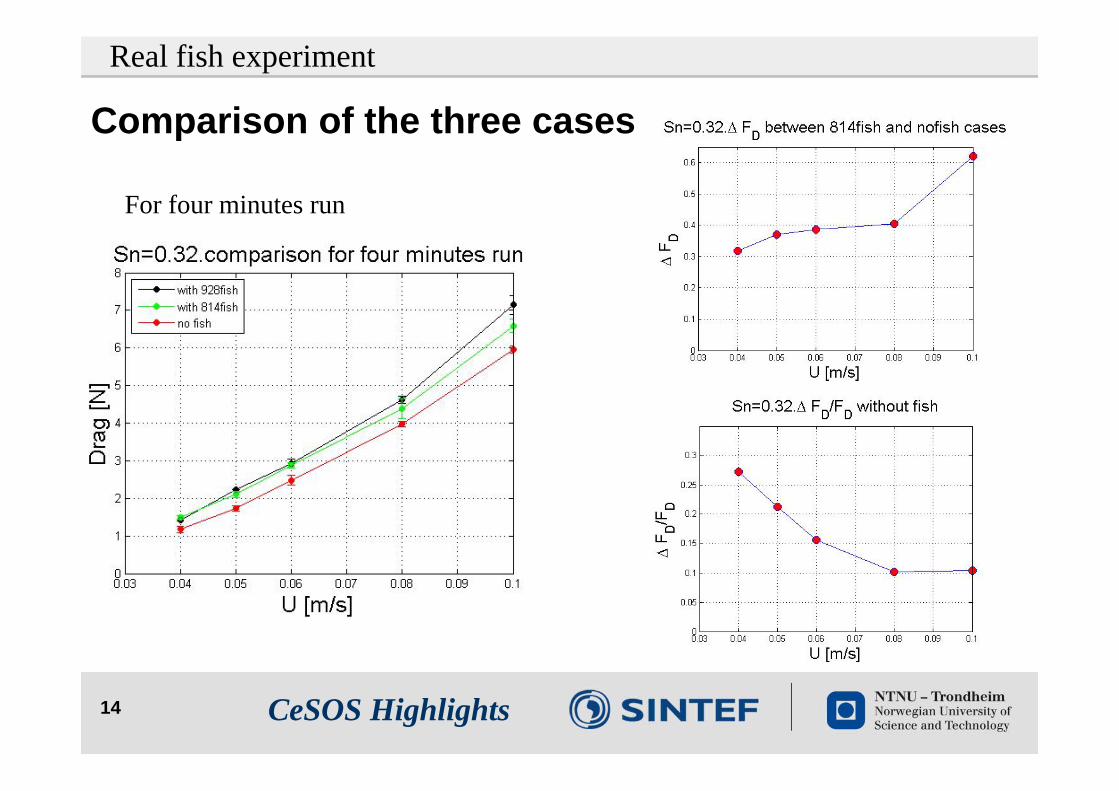
14
Comparison of the three cases
For four minutes run
Real fish experiment
CeSOS Highlights

15
Further discussion about the difference
The fish touched the bottom net
Real fish experiment
CeSOS Highlights
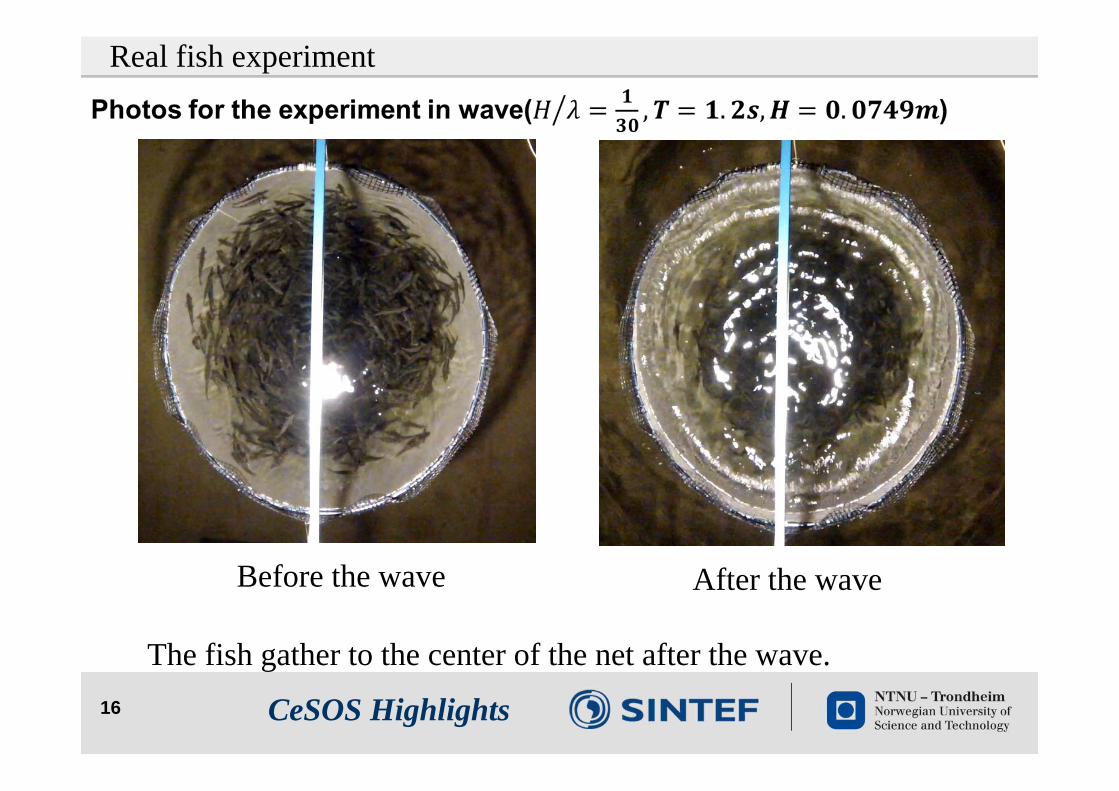
16
Before the wave After the wave
The fish gather to the center of the net after the wave.
Real fish experiment
CeSOS Highlights
17
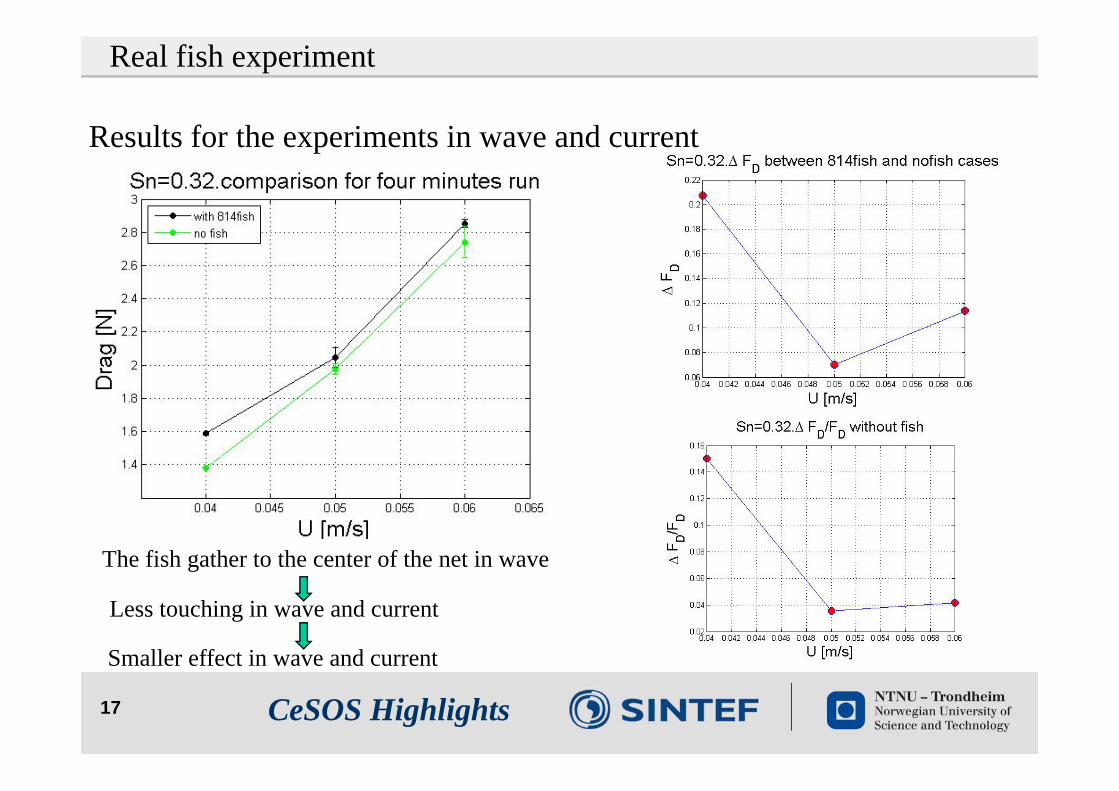
Results for the experiments in wave and current
The fish gather to the center of the net in wave
Less touching in wave and current
Smaller effect in wave and current
Real fish experiment
CeSOS Highlights
18
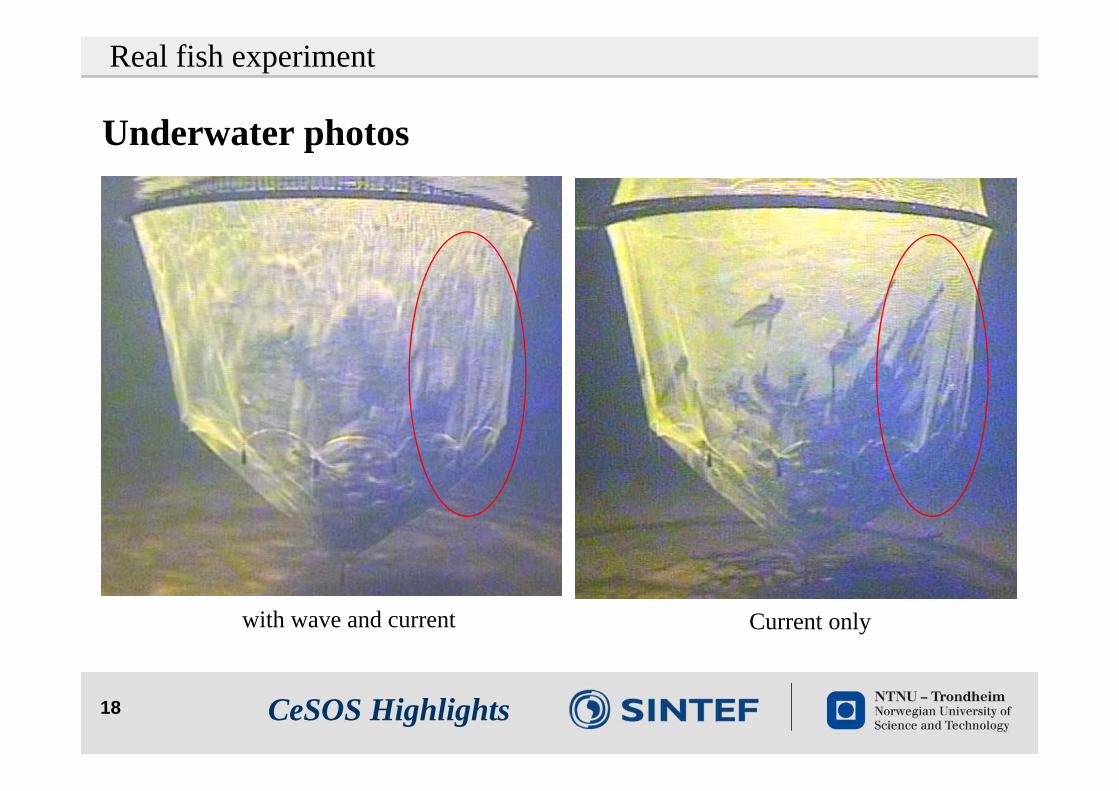
Underwater photos
with wave and current Current only
Real fish experiment
CeSOS Highlights

19
Comparison with Pål Lader’s experiment(no fish in side)
Simulations related to the real fish experiment
Numerical simulation of closed bottom net
CeSOS Highlights
20
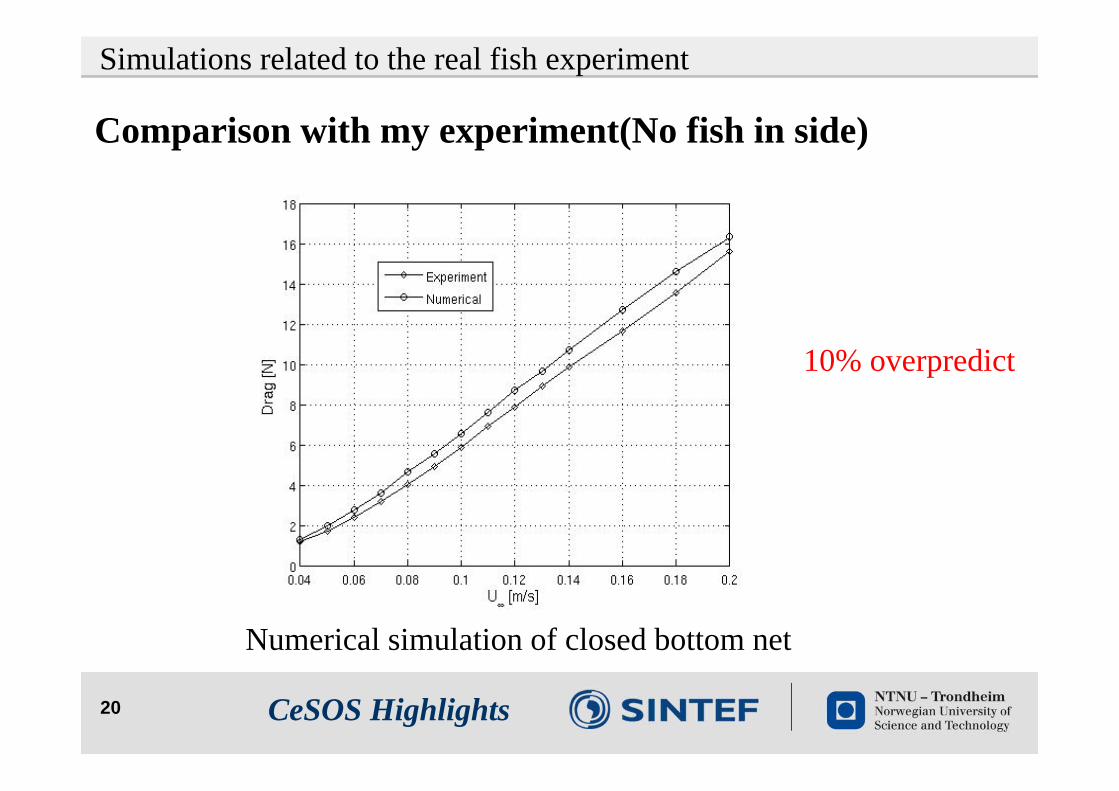
Comparison with my experiment(No fish in side)
Numerical simulation of closed bottom net
Simulations related to the real fish experiment
10% overpredict
CeSOS Highlights

21
Sensitivity study
Simulations related to the real fish experiment
CeSOS Highlights
22
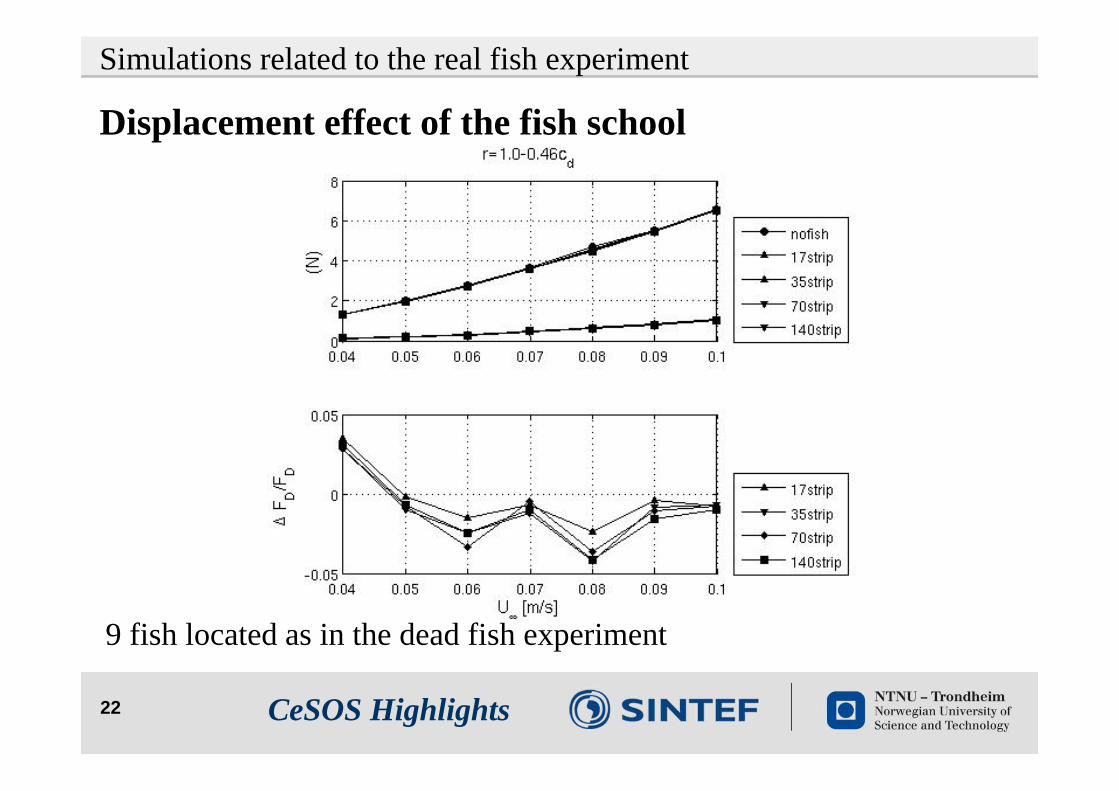
Displacement effect of the fish school
9 fish located as in the dead fish experiment
Simulations related to the real fish experiment
CeSOS Highlights
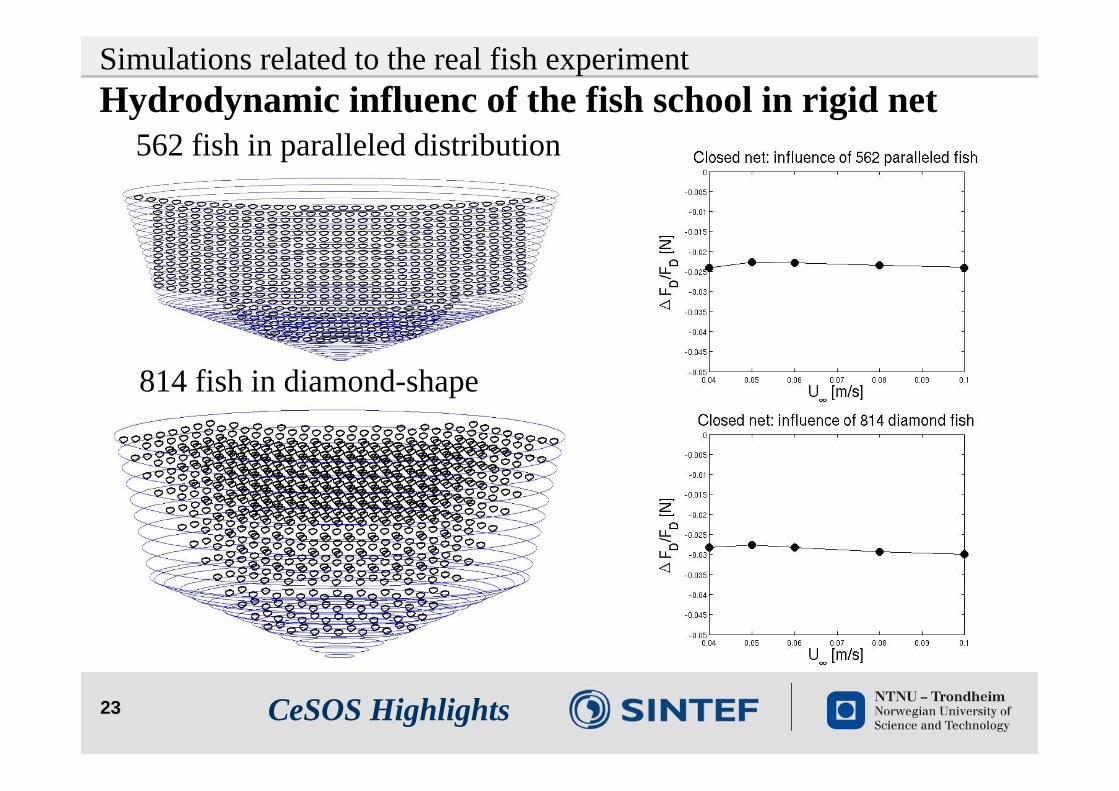
23
Hydrodynamic influenc of the fish school in rigid net562 fish in paralleled distribution
814 fish in diamond-shape
Simulations related to the real fish experiment
CeSOS Highlights
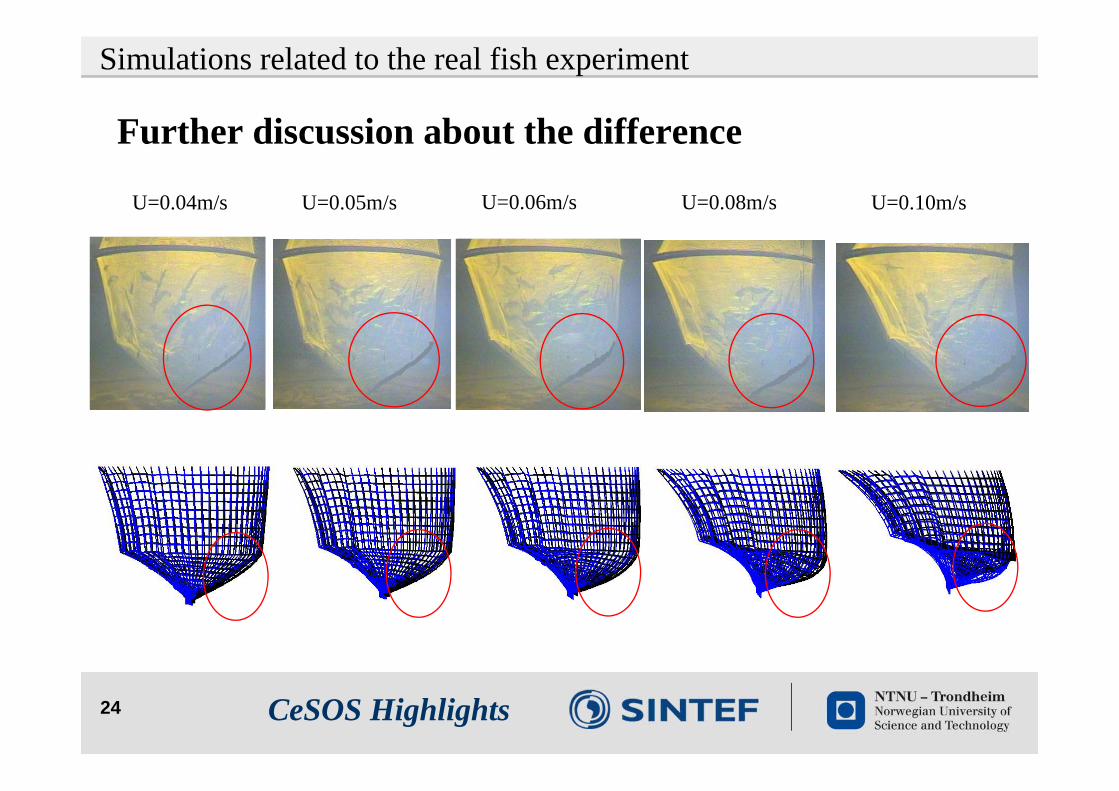
24
Further discussion about the difference
U=0.04m/s U=0.05m/s U=0.06m/s U=0.08m/s U=0.10m/s
Simulations related to the real fish experiment
CeSOS Highlights
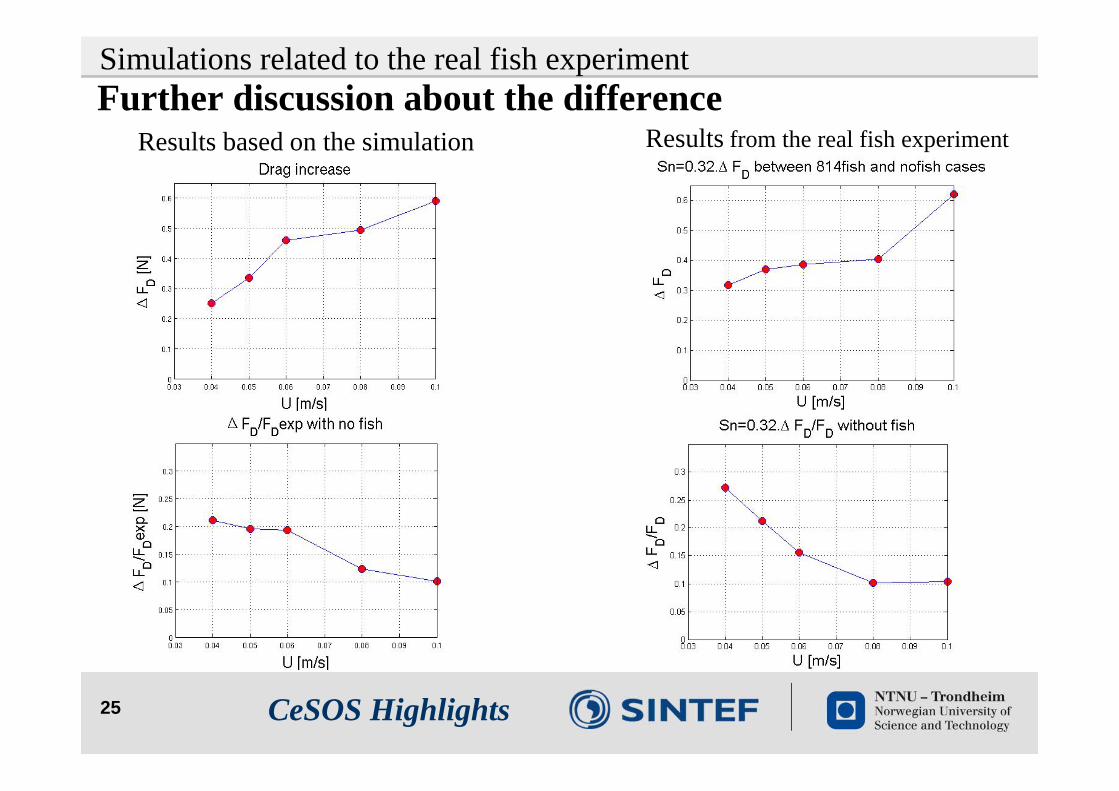
25
Simulations related to the real fish experimentFurther discussion about the difference
Results based on the simulation Results from the real fish experiment
CeSOS Highlights
26
Conclusion
• The hydrodynamic influence of the fish school to the fish cage in strong current is small(around 3%).
Conclusion
CeSOS Highlights

27
Reference1. Kristiansen, T. and Faltinsen, O. M., 2012. Modelling of current loads on aquaculture net cages. Journal of
Fluids and Structures.2. Kristiansen, T. and Faltinsen, O. M., 2012. Mooring loads of a circular net cage with elastic floater in waves
and current. 6th International conference on Hydroelasticity in Marine Technology.3. Lader, P., Moe, H., Jensen, Ø., Lien, E., 2009. Nøter med høy soliditet - modellforsøk. Technical Report.
SINTEF Fisheries and Aquaculture (In Norwegian).4. Newman, J. N. and Wu, T. Y., 1973. A generalized slender-body theory for fish-like forms. Journal of Fluid
Mechanics.5. Newman, J. N., 1973. The force on a slender fish-like body. Journal of Fluid Mechanics.6. Tuck, E.O. and Newman, J.N., 1974. Hydrodynamic interaction between ships. In Proceedings of the 10th
Symposium on Naval Hydrodynamics, Cambridge, MA, USA, pp. 35–70.7. Blevins, R. D., 2003. Applied fluid dynamics handbook. Krieger publishing company, Malabar, Florida.8. Ersdal, S., 2004. An experimental study of hydrodynamic forces on cylinders and cable in near axial flow. Ph.D
thesis in NTNU.
CeSOS Highlights

28
Thanks!
CeSOS Highlights